

Determining Low-Flow Conditions at Select Streams to Barnegat Bay-Little Egg Harbor as the First Step Towards the Development of Ecological-Flow Targets
Links
- Document: Report (7.40 MB pdf) , HTML , XML
- NGMDB Index Page: National Geologic Map Database Index Page (html)
- Download citation as: RIS | Dublin Core
Acknowledgments
This research was funded by the Barnegat Bay Partnership and the U.S. Geological Survey.
The authors gratefully acknowledge several U.S. Geological Survey colleagues who assisted in the completion of the project. Samantha Sullivan assisted with code development related to statistical comparison tests and annual output iterations. Evan Lechner (former employee) assisted with code development for graphical output. Lucas Pick (former employee) assisted with data processing and summarization.
Abstract
Maintaining streamflow to support human water needs and ecosystem services requires a fundamental understanding of the relations between changes in streamflow processes and ecosystem responses. Changes in the natural patterns in flow, geology, and topography alter the habitats that aquatic organisms rely on for food, shelter, and reproduction. The U.S. Geological Survey (USGS) implemented an ecological-flow framework that encapsulates the basic principles of the Ecological Limits of Hydrologic Alteration (ELOHA) to compare the relations between hydrologic metrics and stream conditions and estimate ecological flow needs in the Barnegat Bay-Little Egg Harbor watershed. As a first step in the ELOHA process, streamflow from two historical time periods (occurring between 1933 and 1988) was compared to streamflow for a recent time period (from 2004–2020) for four major streams in the Barnegat Bay-Little Egg Harbor watershed (North Branch Metedeconk River, Toms River, Cedar Creek, and Westecunk Creek), to evaluate if there were statistically significant differences in streamflow metrics. Analysis of monthly, seasonal, and annual low-flow metrics; patterns in the streamflow record; and general land-use changes were used to develop a better understanding of flow conditions in the watershed.
The comparative streamflow analysis indicated that notable changes in flow processes for the study streams occurred between the three periods of record (PORs) evaluated in this study: period of record 1 (POR1, from water years 1933–1958), period of record 2 (POR2, from water years 1974–1988), and period of record 3 (POR3, from water years 2004–2020). For example, the mean of the daily streamflow decreased between the historical POR to the current POR in Cedar Creek but increased in North Branch Metedeconk and Toms Rivers. Larger and more significant changes (p-value <0.10) occurred during specific months or were related to the variability or seasonality of flow. North Branch Metedeconk River and Toms River, the two northern and most developed sites, exhibited changes in low-flow metrics and decreases in minimum n-day moving averages. Decreases in the normalized 75th-percentile exceedance flows were evident at three of the four study sub-basins during POR2 and POR3. In comparison, there was little to no evidence of negative changes to low-flow metrics at Westecunk Creek, the southernmost and least developed site, where all low-flow duration metrics increased as well as seasonal minimum consecutive 7-day average flows. Significant increases in monthly minimums (p-value <0.05) at Cedar Creek for spring months (April, May, and June) also were observed.
Anthropogenic processes can alter the landscape resulting in concomitant changes in the streamflow regime. There is a need to assess these changes and synthesize the results into a scientifically defensible set of goals and standards that help support the management of environmental flows. This study represents the initial steps in building the hydrologic foundation to inform management and develop future ecological flow targets that balance water availability for human and ecosystem needs in the Barnegat Bay-Little Egg Harbor watershed.
Introduction
Human population growth and anthropogenic activities place increased pressure on freshwater resources, leading to overburdening, competition, and water scarcity. This can lead to altered hydrology and a downward trend in aquatic biodiversity (Arthington and others, 2018). Hydrologic alterations have resulted in varying degrees of long-term biotic impairment to aquatic ecosystems in New Jersey by changing the availability and persistence of stream habitats, the composition and quality of channel substrates, the rate of nutrient flux and uptake, and the connectivity between streams and biologically productive riparian zones in adjacent flood plains (Kennen and others, 2008; Kennen and others, 2010; Kennen and others, 2014). Quantifying the effects of streamflow alteration is essential to understanding the role humans play in shaping the aquatic environment, as stream hydrology is strongly intertwined with natural and anthropogenic factors. A better understanding of these linkages could help inform what management strategies to implement to improve stream conditions (Kennen and Cuffney, 2023).
The effects of streamflow alteration on aquatic ecosystems has been identified as a critical area of research in the United States (Carlisle and others, 2010; Novak and others, 2016; Arthington and others, 2018) and as a result many State, Federal, and Tribal agencies have established environmental-flow criteria for the protection of biological resources (Kennen and others, 2007; Hoffman and Rancan, 2009; Zorn and others, 2012; Novak and others, 2016; Mazor and others, 2018; Bower and others, 2022; Peek and others, 2022; Ziegeweid and others, 2022). Balancing human and ecological needs for water while minimizing damage to the services provided by river ecosystems requires an understanding of the relations between the natural and anthropogenic factors that alter streamflow characteristics and drive changes in biological assemblages. Such an understanding can support resource management decisions to help determine where, when, and how much water can be extracted from a resource. This understanding can also help identify critical periods (for example, low flow or droughts) when water extraction may be detrimental to the resource. These efforts promote informed-management decisions that can reduce damage to the biological resource while still providing support for human water use. Therefore, providing a framework for managing water in the Barnegat Bay-Little Egg Harbor ecosystem requires developing an understanding of the relations among natural environmental drivers (for example, precipitation, geology, and channel slope), anthropogenic drivers (for example, land-use change), streamflow characteristics, and ecological response.
A first step to address management concerns and support “Ecological Flow” guidance1 indicated by the Barnegat Bay Partnership (BBP; Barnegat Bay Partnership, 2021), is to develop a flow framework that incorporates the scientific and socioeconomic steps of the Ecological Limits of Hydrologic Alteration (ELOHA; Poff and others, 2010). This approach requires identifying the environmental factors that drive changes in streamflow metrics and, along with flow, drive changes in ecological communities. The ELOHA was developed to help inform decision-makers and stakeholders about the ecological consequences of flow alteration and to provide a set of interconnected steps that can result in the development of flow alteration–ecological response relations and regional environmental-flow standards. The first steps in the ELOHA approach rely on area-specific combinations of streamgage analysis and statistical evaluations (Phase 1), and later ELOHA steps incorporate hydrologic modeling and the development of flow-ecology-response relations. In Phase 1 (this study), existing streamflow records for a selected period are separated into periods of record (PORs) that represent historical streamflow conditions and PORs that represent current conditions (current being defined as 2004–2020). Differences between historical streamflow and current conditions are characterized by statistical departures in ecologically relevant components of the two flow periods.
Ecological Flow guidance is defined as maintaining flows of at least 30 percent over minimum-ecological flow for gaged waterways.
Ecological flows are one of eight ecosystem-based targets identified in the BBP’s Comprehensive Conservation and Management Plan (CCMP) and relate to each of the four priority areas listed in the CCMP—water quality, water supply, living resources, and land use (Barnegat Bay Partnership, 2021). The goal of the water-supply component of the CCMP is to ensure that there are “adequate water supplies and flow in the [Barnegat Bay-Little Egg Harbor] watershed for ecological and human communities now and in the future” (Barnegat Bay Partnership, 2021, p. 10). Ecological flows are specifically highlighted under the CCMP’s Action Item Water Supply 1-2, which is a priority action item that supports the water-supply component and aims to “determine minimum ecological flow requirements for priority streams, rivers, and wetlands within the watershed” (Barnegat Bay Partnership, 2021, p. 130). Before minimum ecological flows can be established, current and historical baseline streamflow conditions need to be investigated and better understood. This project, which is identified as Phase 1 of a multiphase effort, provides the basic hydrologic building blocks of the ecological-flow targets identified in the CCMP for the Barnegat Bay-Little Egg Harbor watershed.
Purpose and Scope
This report describes the results of a study comparing current and historical streamflow conditions for four major streams within the Barnegat Bay-Little Egg Harbor watershed—North Branch (NB) Metedeconk River, Toms River, Cedar Creek, and Westecunk Creek. It presents a set of ecologically relevant streamflow metrics for these streams that discharge to the Barnegat Bay-Little Egg Harbor estuary. Land-use percentages for each of the four study sub-basins are also presented.
This study was designed as a first step in determining ecological-flow targets for major streams within the Barnegat Bay-Little Egg Harbor watershed. The first step of the study was to better understand the flow conditions for each of the study streams based on a subset of streamflow metrics, how they may have changed over time, and how they differed among streams. Given that flow targets in the CCMP reference minimum flows and give a proposed ecosystem-based target of maintaining flow levels of at least 30 percent over minimum ecological-flow values for gauged waterways within the watershed to protect sensitive living resources (Barnegat Bay Partnership, 2021), the streamflow metrics presented in this report specifically focus on a subset of monthly, seasonal, and annual low-flow metrics in support of CCMP criteria. These low-flow metrics have consistently been found to relate to several key ecologically relevant components of streamflow, notably magnitude, duration, frequency, and timing of flow (Poff and others, 2010).
This report also presents the results of comparisons between historical and current time periods to determine if there are statistically significant differences in streamflow metrics. This analysis of monthly, seasonal, and annual low-flow metrics, patterns in the streamflow record, and general land-use changes can be used to better understand changes in flow conditions in major streams of the watershed, and to build the hydrologic foundation to inform the development of ecological-flow targets.
Description of Study Area
The study area is located within the New Jersey Atlantic Coastal Plain region and includes the drainage basins of four streams that discharge to the Barnegat Bay-Little Egg Harbor estuary—North Branch (NB) Metedeconk River (referred to as NB Metedeconk River), Toms River, Cedar Creek, and Westecunk Creek. The Barnegat Bay-Little Egg Harbor watershed encompasses more than 600 square miles (Kennish, 2001). The combined drainage area of the four study sub-basins is about 224 square miles (table 1; fig. 1) (U.S. Geological Survey, 2024).
Predominant land uses within the Barnegat Bay-Little Egg Harbor watershed vary regionally (fig. 2). The northeastern part of the watershed is mostly urban with both residential and nonresidential development and includes several major population centers. The southeasternmost part of the watershed contains several protected wildlife refuges and wildlife management areas and is less developed; however, the areas peripheral to this and proximal to Barnegat Bay and Little Egg Harbor (fig. 2) have undergone a substantial increase in development from 1986–2015. The complex of barrier islands on the eastern shore of the estuary is mostly urban, with the exception of Island Beach State Park. Much of the western portion of the watershed lies within the Pinelands Area (Hunchak-Kariouk and Nicholson, 2001; Kennish, 2001). This area is protected under the Pinelands Comprehensive Management Plan and is characterized by large tracts of forested land, wetlands, and some low-density development. The headwaters of the Toms River, Cedar Creek, and Westecunk Creek sub-basins originate in the Pinelands Area (fig. 1).
The percentage of land in each land-use category was computed for the four sub-basins using digital land-use/land-cover (LU/LC) datasets obtained from the New Jersey Department of Environmental Protection Bureau of Geographic Information Systems for years 1986, 1995, 2002, 2007, 2012, and 2015 (New Jersey Department of Environmental Protection Bureau of GIS, 1998, 2000a, 2010a, 2010b, 2015b, and 2019) and the U.S. Environmental Protection Agency Geographic Information Retrieval and Analysis System (GIRAS) for 1973 (U.S. Environmental Protection Agency, 2019). GIRAS percentages are included in table 2 as they represent the best available data for the period; however, GIRAS percentages were computed at a lower resolution than any of the other land-use datasets, so some differences in percent LU/LC were expected.
The four sub-basins differ in size and extent of development, and a summary of the LU/LC distributions in the four sub-basins are provided in table 2. The NB Metedeconk River sub-basin is the northernmost of the four study sub-basins and is the most heavily developed (fig. 2). Between 1986 and 2015, the percentage of urban land in this sub-basin increased from approximately 31.7 percent to 43.3 percent. During the same period, forested land cover decreased from 27.2 to 20.0 percent, and agriculture and wetland cover decreased by 1.5 and 2.9 percent, respectively (table 2).
The Toms River sub-basin is the largest of the four study sub-basins. More than 50 percent of the sub-basin lies within the Pinelands Area (fig. 1). Between 1986 and 2015, the percentage of urban land in this sub-basin increased from approximately 14.2 percent to 26.7 percent. During the same period, forested land cover decreased from 51.6 percent to 43.5 percent; and agriculture, barren land, and wetlands cover decreased by 2.0, 2.3, and 0.7 percent, respectively (table 2).
The Cedar Creek sub-basin is primarily undeveloped. Nearly 90 percent of the sub-basin lies within the Pinelands Area, and more than 70 percent of the sub-basin is forested. Between 1986 and 2015, there was little change in LU/LC distributions, with urban land cover increasing by 1.6 percent and barren and forested land decreasing by negligible amounts (table 2).
The southernmost sub-basin, Westecunk Creek, is the smallest of the four sub-basins and is the least developed. As of 2015, approximately 80 percent of the sub-basin was forested, and 0.3 percent was comprised of urban land cover. Between 1986 and 2015, there was little change in LU/LC distributions (table 2).
The shallow, unconfined Kirkwood-Cohansey aquifer system underlies most of the the Barnegat Bay-Little Egg Harbor watershed. The Cohansey Formation is composed primarily of medium- to coarse-grained sands, with localized occurrences of silt and clay lenses and gravel. The Kirkwood Formation is composed of fine- to medium-grained sands with clay and, to a lesser extent, coarse to fine gravelly sand (Canace and Sugarman, 2009). The sands and gravels of this aquifer system make it an important source of water for communities within the watershed. Groundwater discharges from the Kirkwood-Cohansey aquifer system to major streams in the watershed, including the Toms and Metedeconk Rivers, and to other smaller streams and tributaries, which eventually discharge to the Barnegat Bay-Little Egg Harbor estuary. Streams, wetlands, and other surface-water bodies are hydraulically connected with the Kirkwood-Cohansey aquifer system, as groundwater discharge from the aquifer system accounts for a high percentage (71–94 percent) of surface-water flow in the watershed (Watt and others, 1994; Nicholson and Watt, 1997; Gordon, 2003; Baker and others, 2014).
Table 1.
U.S. Geological Survey station information for selected continuous-record streamgages located within the Barnegat Bay-Little Egg Harbor watershed.[USGS, U.S. Geological Survey; mi2, square miles; N.J., New Jersey; Blvd, Boulevard]
Drainage area values are found at U.S. Geological Survey, 2024.
Table 2.
Land-use percentages for the four study sub-basins in the Barnegat Bay-Little Egg Harbor watershed for select years from 1973–2015.[USGS, U.S. Geological Survey; —, no data]
Land use percentages derived from the New Jersey Department of Environmental Protection Bureau of GIS, 1998, 2000a, 2010a, 2010b, 2015b, 20193537384041 and U.S. Environmental Protection Agency, 2019.
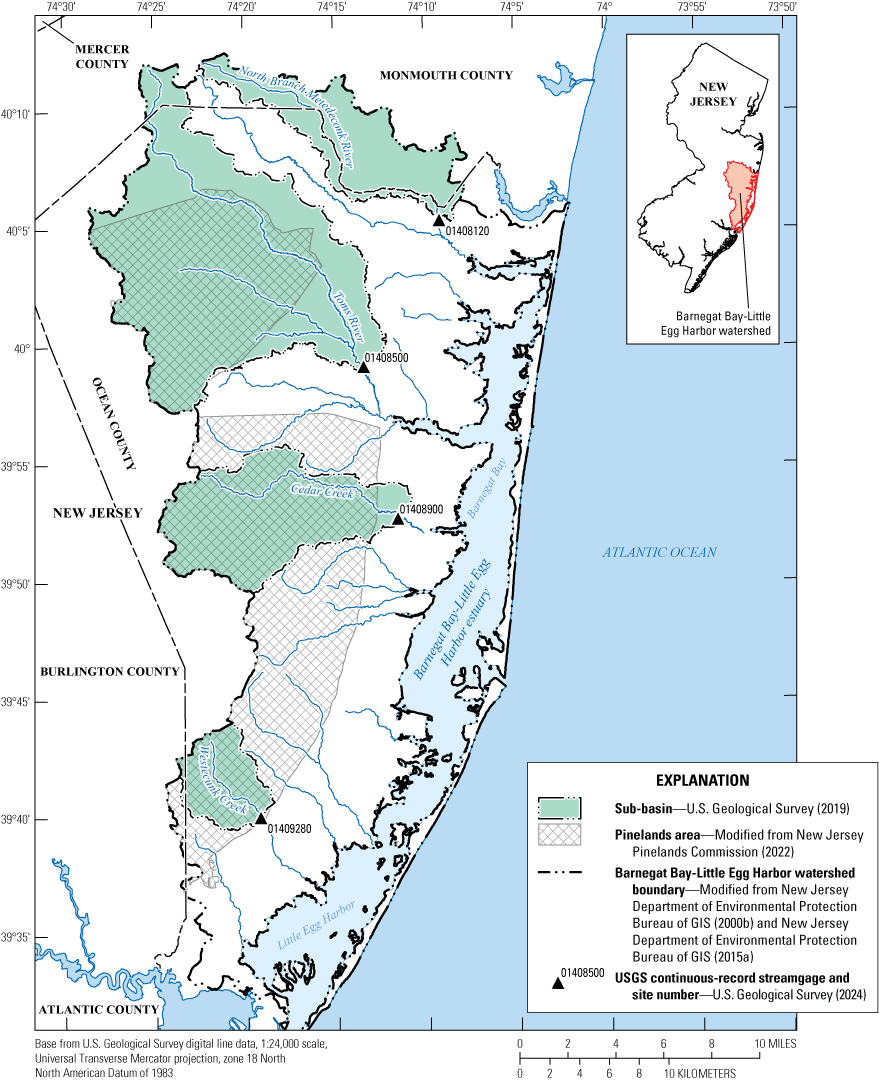
Map showing a north-to-south distribution of the North Branch Metedeconk River, Toms River, Cedar Creek, and Westecunk Creek in the Barnegat Bay-Little Egg Harbor watershed.
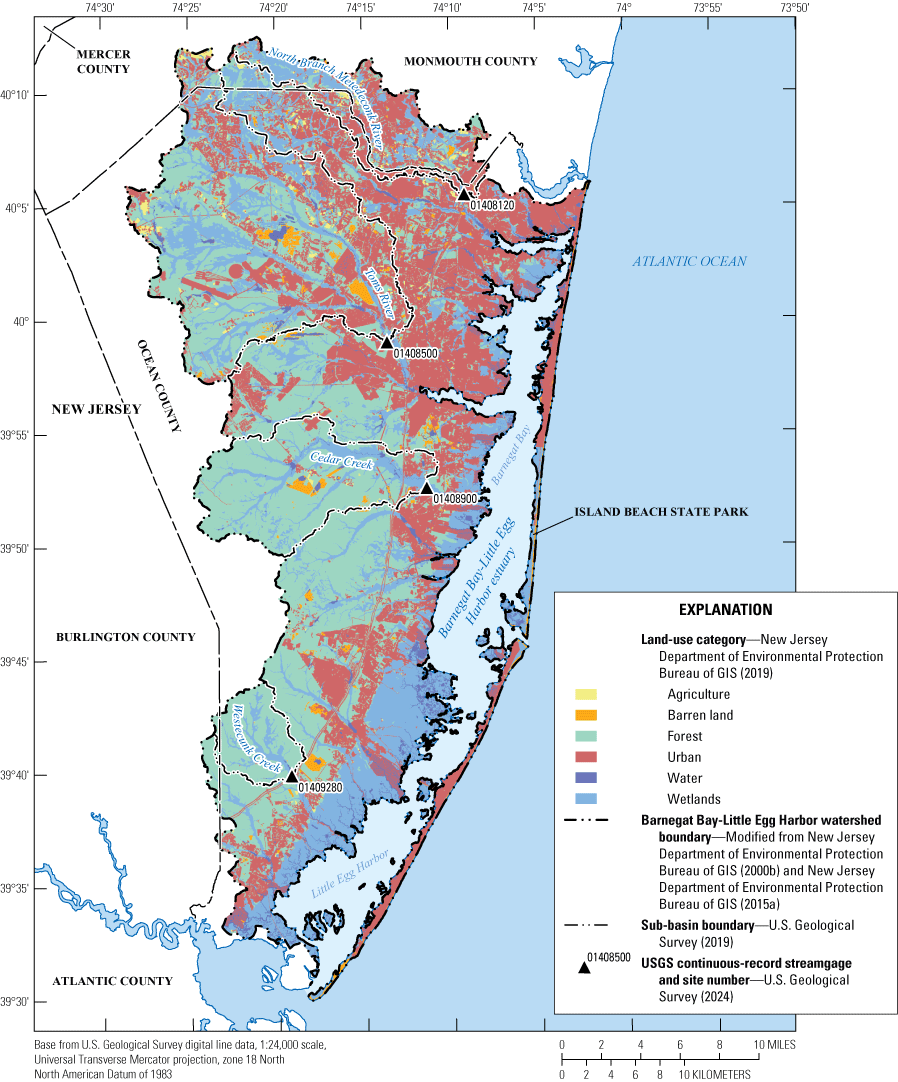
Map showing land use by category in the Barnegat Bay-Little Egg Harbor watershed, 2015.
Previous Studies
In 2007, the USGS developed the Hydroecological Integrity Assessment Process (HIP) and associated tools in cooperation with the New Jersey Department of Environmental Protection (Kennen and others, 2007). The HIP is based on a large body of research that links hydrologic variability and aquatic-ecosystem integrity. This innovative work supports the idea that the full range of natural intra- and inter-annual variation of hydrological regimes and associated characteristics of magnitude, frequency, duration, timing, and rate of change are critical in sustaining the diversity and integrity of aquatic ecosystems (Poff and others, 1997). Furthermore, streamflow is strongly related to many physiochemical components of rivers, such as dissolved-oxygen concentration, channel geomorphology, and water temperature. Modifications in those attributes as a function of changes in the streamflow regime can limit the distribution, abundance, and diversity of many aquatic plant and animal species (Resh and others, 1988; Poff and others, 1997). The HIP was designed to assist decision makers (water-resource managers, planners, and regulatory agencies) with integrating ecological-flow assessments into broader management platforms.
Many components of HIP were directly incorporated into the ELOHA process (Poff and others, 2010) and this approach has been used as a guide for expanding the understanding of ecological-flow regimes and developing improved approaches for balancing human-water needs with ecosystem functions across the globe (Arthington and others, 2018). Additional studies in New Jersey using these methodologies included evaluating the effects of potential changes in streamflow regime on fish and aquatic-invertebrate assemblages in the New Jersey Pinelands Area (Kennen and Riskin, 2010), developing a method to support total maximum daily loads assessment using hydrologic alteration as a surrogate to address aquatic-life impairment in New Jersey streams (Kennen and others, 2013) and a study in the New Jersey Pinelands Area linking groundwater withdrawals to changes in aquatic assemblage response (Kennen and others, 2014). This science has expanded greatly over the past decade and a recent 2018 special issue in “Freshwater Biology” highlights many examples of the applications and case studies to illustrate the implementation of hydroecological approaches and provide a measure of efficacy from these approaches (Kennen and others, 2018).
As part of a recent update of state-wide surface-water metrics, McHugh and others (2024) computed high- and low-streamflow metrics for 97 continuous-record streamgages, and low-flow metrics for 719 partial-record gages. These gages were located throughout New Jersey. Continuous streamgages with a minimum of 20 years of record through 2017 were included in the study. In addition to high- and low-flow frequency and duration metrics computed using the entire period of record (POR) available for each continuous streamgage, trend tests on high and low n-day series (for example, the 7-day moving average of flow), baseflow and runoff, peak to 3-day mean-flow ratio, and annual skewness and kurtosis were also conducted to evaluate trends and variability in streamflow at each of the continuous streamgages.
Additionally, the U.S. Geological Survey (USGS) New Jersey Water Science Center has an ongoing study to compute a small subset of low-flow metrics for 31 continuous-record streamgages and 57 partial-record stations located throughout New Jersey for both a historical (1950–1979) and a more recent (1990–2019) 30-year period. The streamflow metrics being computed by this study will help identify changes in low-flow metrics over time and present a synopsis of streamflow conditions using this more recent data. The project will also present some land-use, precipitation, and water use changes in the associated watersheds to help users evaluate if changes to these characteristics can be connected to changes in streamflow metrics. Although the stations are located across New Jersey, the analysis does not include the four stations presented in this report.
Methods
The following section describes the methods used to aggregate streamflow data and describes the approaches used to analyze a focused subset of streamflow metrics for each of the four study sub-basins in the Barnegat Bay-Little Egg Harbor watershed.
Evaluation of Streamflow Record for the Selected Streamgages
The Barnegat Bay-Little Egg Harbor watershed has several active and discontinued streamgages within its boundaries (fig. 1). The four streamgages selected for this study are:
-
North Branch Metedeconk River near Lakewood, New Jersey (01408120);
-
Toms River near Toms River, New Jersey (01408500);
-
Cedar Creek at Western Boulevard near Lanoka Harbor, New Jersey (01408900); and
-
Westecunk Creek at Stafford Forge, New Jersey (01409280).
The numbers in parentheses following the name of the USGS streamgage are the USGS site numbers (table 1). For the remainder of the report, these streamgages will be referred to by their stream name. These four streamgages were selected for analysis because they have the longest period of streamflow record within the Barnegat Bay-Little Egg Harbor watershed, and they are all active streamgages with approved data available through the 2020 or the 2021 water year (table 1). Streamflow data for these stations were collected at 15-minute intervals using an electronic data logger and are available online from the USGS National Water Information System (U.S. Geological Survey, 2024). The daily streamflow data used in this study were collected, analyzed, and approved in accordance with standard operating procedures described in Rantz and others (1982), Mueller and others (2013), and Turnipseed and Sauer (2010) and can be accessed via the USGS National Water Information System (U.S. Geological Survey, 2024). The record lengths of the four streamgages are not all coincident as two of the four study streams (Cedar Creek and Westecunk Creek streamgages) have gaps within the span of the period of data availability. Given the varying periods of streamflow data available for each of the four streamgages and the gaps in record, these data were divided into three time periods, referred to in this report as periods of record (PORs). Historical period-of-record 1 (POR1) was defined as the period covering water years 1933–1958, historical period-of-record 2 (POR2) was defined as water years 1974–1988, and the most recent period-of-record 3 (POR3) was defined as water years 2004–2020. Using these time periods allows for a minimum of two streamgages’ records for comparison for each historical POR and all four streamgages for the most recent POR (table 3). Selection of these time periods also allows for streamflow metrics at the largest and most varied land-use sub-basin, Toms River, to be computed and compared for all three PORs. The streamflow record at Toms River is beneficial in offering a continuous look at streamflow conditions over time so higher-flow and lower-flow periods can be determined. The years selected for each POR represent the longest common time span for which data are available among the four study sites.
Table 3.
Current and historical periods of record (PORs) analyzed for each site.[USGS, U.S. Geological Survey; NB, North Branch, Blvd, Boulevard; POR, period of record; —, not applicable; N.J., New Jersey]
Selecting Streamflow Metrics to Help Describe Streamflow Conditions in the Barnegat Bay-Little Egg Harbor Watershed
This section provides an overview of the various methods used to calculate the streamflow metrics for the four study streams and highlights the subset of streamflow metrics that were selected to evaluate differences in streamflow between two different PORs.
Frequency Analysis
The USGS software application Surface-Water Toolbox (SWToolbox) was used to compute frequency metrics for the four streamgages (Kiang and others, 2018). Flow-frequency metrics compare the magnitude of streamflow to its frequency of occurrence using probability-distribution functions (England and others, 2019) and are typically presented as minimum or maximum n-day yearly or seasonal-average flows. The frequency metrics computed in this report were fitted to a log-Pearson type III distribution (Riggs, 1972). Flow-frequency metrics are often used to analyze a stream’s capacity to provide enough flow for water-supply needs or maintain acceptable water-quality metrics for a healthy ecosystem or overall environmental health. Although many streamflow metrics are used to evaluate streamflow conditions, one of the most widely used low-flow frequency metrics in the United States is the minimum consecutive 7-day average flow with a 10-year recurrence interval, or 7Q10 (Tasker, 1987). Recurrence intervals refer to the number of years in which an event is likely to occur. A recurrence interval is an alternate representation of the probability of occurrence and is computed using the reciprocal of the reported probability. For example, a flow with a 100-year recurrence interval has a 1 in 100, or 1-percent probability of occurring in any given year. Therefore, the 7Q10 has a 1 in 10 or 10-percent chance of occurring in any given year. For this study, the 7Q10 was computed on a seasonal time scale. The seasonal periods were defined as Spring (April 1 to June 30), Summer (July 1 to September 30), Fall (October 1 to December 31), and Winter (January 1 to March 31).
Magnitude, Duration, and Timing of Low Flows
Streamflow metrics related to flow magnitude, duration, and timing were computed using the EflowStats package version 5.0.0, an R version of the National Hydrologic Assessment Tool (Henriksen and others, 2006) developed by the USGS Center for Integrated Data Analytics (Mills and others, 2017). This package in R (R Core Team, 2019) was developed to assist water-resource professionals with characterizing the five major components of the flow regime (magnitude, frequency, duration, timing, and rate of change) that are considered to be important in shaping ecological processes in streams (Poff and others, 1997; Olden and Poff, 2003; Kennen and others, 2007). Of the 178 streamflow metrics that can be calculated using EflowStats, a subset of metrics were selected for analysis in addition to the frequency metrics previously described. Several metrics were computed for each year of record, which created a data series for which trend tests were run and summary statistics were calculated. These metrics included:
-
• monthly minimum flow, (ML1–12; where ML1 equals the monthly minimum flows for January and ML12 equals the monthly minimum flows for December),
-
• annual mean daily flow (MA1),
-
• annual minimum daily flow (DL1),
-
• annual minimum of the 7-day moving average flow (DL3),
-
• annual minimum of the 90-day moving average flow (DL5), and
-
• timing of the annual minimum flow, reported as Julian date (TL1).
Monthly minimum flows provide a simple evaluation of variability in the magnitude of minimum flows between months and sustained changes between time periods. Minimum flows (ML1–12) were calculated for each month for each water year, and the median of the monthly minimums within each POR were used to represent the POR values for a site. The annual minimum daily flow and the 7- and 90-day minimum moving average flows (DL1, DL3, and DL5, respectively) are low-flow duration metrics. N-day minimum moving averages are beneficial in smoothing some of the daily variability that is naturally found in streamflow and provide a way to detect potential trends between time periods in the averaged streamflow. Differences in the minimum 7-day (weekly) and 90-day (seasonal) moving average of flows provide insight into the portions of the hydrograph that reflect low-water extremes and are often used as a measure of environmental stress and disturbance during the year. Such measures are critical in determining the ability of streams to support the habitat necessary to sustain instream fauna within their natural range of abundance and may determine whether a particular faunal life-cycle phase can be completed successfully (Richter and others, 1996). The n-day moving averages were computed for each water year and the median of the moving averages within each POR were then used to represent the POR values. For DL1, both the mean and the median values for each POR were computed and compared. A centralized statistic, such as the median, is resistant to change; therefore, investigating statistics that attempt to describe the tails of the flow-distribution curve may be more helpful in identifying changes in lower streamflow conditions. A timing metric was also evaluated to determine if there has been any shift in the timing of the annual low flows. The Julian day of the annual minimum flow (TL1) was calculated for each water year, and the median for each POR was used to represent the Julian day of the minimum flow for each POR. Additional metrics were calculated for each POR, which include2 :
Trend tests were not conducted on these metrics because of the small sample size when computing by POR.
-
• POR mean of the annual minimum 7-day moving average flow divided by the POR median streamflow (DL12),
-
• POR 75th and 90th percentile flows divided by the POR median streamflow (DL14 and DL15), and
-
• skewness and kurtosis.
To help identify if minimum flows were changing compared to the median3 streamflow, the mean of the 7-day minimum moving average flow for each POR was divided by the median streamflow for the same period (DL12). A similar approach was taken for the 75- and 90-percent non-exceedance streamflows. These streamflow metrics were computed for each POR and normalized by median streamflow for the same period (DL14 and DL15, respectively). Metrics normalized by mean or median flow, such as DL14 and DL15, help to identify potential changes in the streamflow patterns and do not highlight periods of higher or lower flow.
The median is less sensitive than the mean to changes at the extreme ends of the distribution.
Finally, computing and reviewing changes in skewness and kurtosis (shape of the flow-distribution curve) can determine if the range of minimum streamflow is changing along the tail of the flow-distribution curve and can help identify potential changes in extreme low-flow events between PORs. Archfield and others (2014) determined skewness and kurtosis to be two of seven primary-flow indices that can be used to classify streams according to hydroecological response, so skewness and kurtosis were computed for each POR. Generally, skewness and kurtosis values of a streamflow time series are computed to determine if the empirical distribution of the data follows a normal distribution. For example, skewness values less than (<) 1 indicate a negative skew and skewness values greater than (>) 1 indicate a positive skew. These values provide unbiased information on the distributional properties of daily streamflow (such as peak flow or extreme low flow). Skewness provides information about whether the distribution is skewed to the right or left (in other words, symmetry). Kurtosis can provide information about how far extreme values are from the central values, or, in other words, a measure of “peakedness.” Large kurtosis values may indicate short periods of large fluctuations in flow. Streams with high skewness and high kurtosis tend to be high gradient, run-off dominated streams that generate rapid runoff whereas streams with low skewness and low kurtosis are characterized as having a close connection to aquifers, low-channel gradients, and wetlands that have a stabilizing effect on the range of daily flows (Armstrong and others, 2008).
Statistical Comparison Tests
The Wilcoxon rank-sum test (Helsel and others, 2020), a non-parametric statistical hypothesis test, was used to evaluate differences in streamflow metrics between two PORs. Distributions of the streamflow data were checked for normality prior to applying the statistical test. The streamflow record for each of the streamgages is not normally distributed; therefore, a non-parametric test was used to test whether there was a significant difference between two population4 medians (and distributions). Differences in streamflow metrics between two PORs were considered statistically significant when the p-value was <0.10, indicating that there is sufficient evidence that the medians (and distributions) between the two PORs differ at the 90-percent confidence level. For Toms River, only the medians between POR3 and POR1 were compared using the Wilcoxon rank-sum test because the test is designed to apply to only two populations.
In this case, each POR represents a population.
Evaluating Differences in Streamflow Metrics for Selected Sub-basins
Streamflow metrics were computed and evaluated to help determine how streamflow characteristics may have changed over time. If a balanced aquatic ecosystem existed along the tributaries to the Barnegat Bay-Little Egg Harbor estuary in POR1, then it can be implied that the inherent flow and associated variability that existed during POR1 helped to shape and sustain that balance. Evaluating how streamflow metrics may have changed between the earlier periods of record and the current period of record may help show how the current system can be influenced by anthropogenic change and provide a way for the BBP to implement ecological-flow measures that provide adequate water supplies and flow in the Barnegat Bay-Little Egg Harbor watershed for ecological and human communities now and in the future (Barnegat Bay Partnership, 2021, p. 10).
In the following sections, differences in streamflow metrics between PORs are described for the four study sites. Several streamflow metrics (ML1–12, MA1, DL5, and seasonal 7Q10) are first discussed in detail, and then a comparison of historical and current streamflow conditions is presented by site. This comparison includes additional flow indices (DL1, DL3, DL12, DL14, DL15, and TL1). Combined, these streamflow metrics provide insight into how flow conditions in the four study streams may have changed over time. Boxplots which include the results of the Wilcoxon rank-sum test for several streamflow metrics are provided to help visualize differences between PORs, and the distribution of individual values are shown in corresponding scatterplots in appendix 1.
Monthly Minimums
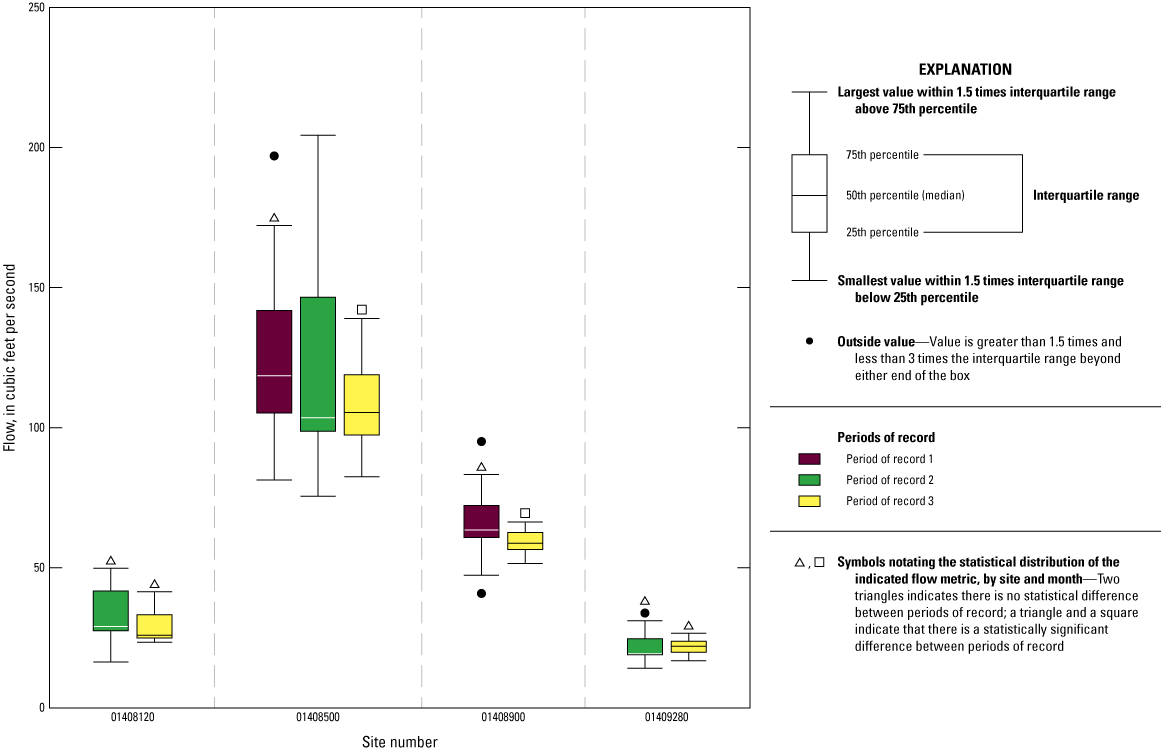
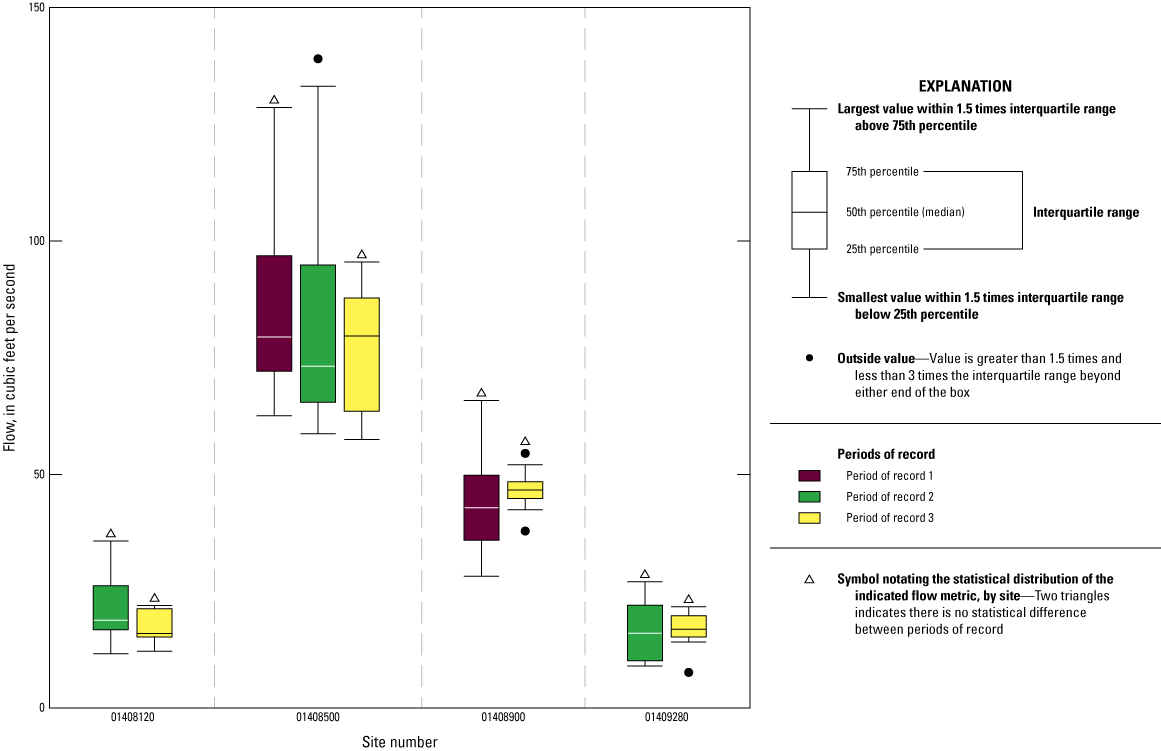
Monthly minimum flows were summarized by site and POR to help evaluate patterns and changes in low-flow conditions for each of the four streams (table 4). Monthly minimum values offer basic information, such as the historical magnitude of low flow and how minimum flow values vary by month. The NB Metedeconk River and Toms River exhibit a similar pattern where minimum flows are lowest during the summer months, notably July–September, and are greatest during the winter and early spring months, notably February–April (fig. 3). For the NB Metedeconk River, monthly minimum flows ranged from medians of 19.0 to 47.0 cubic feet per second (ft³/s) in POR2 and 17.5 to 46.3 ft³/s in POR3. For the Toms River, monthly minimum flows ranged from medians of 81.5 to 199 ft³/s in POR1 and 88.7 to 188 ft³/s in POR3 (table 4).
When comparing median monthly minimum flows between PORs for NB Metedeconk and Toms Rivers, results of the Wilcoxon rank-sum test indicate that the month of May’s minimum flows are significantly lower in the Toms River for POR3 (median of 146 ft³/s) than for POR1 (median of 169 ft³/s), with a p-value of >0.05. There are other notable differences in monthly minimum flows between POR1 and POR3 for the Toms River. For example, June and April flows are noticeably lower in POR3 than in POR1, with minimum flows about 16 ft³/s (13.1 percent) and 22 ft³/s (11.1 percent) lower in POR3 than in POR1, respectively (table 4); however, none of these differences are statistically significant. NB Metedeconk River exhibited a mix of increases and decreases in monthly minimum flows between POR2 and POR3; the greatest percent changes (>10 percent) were decreases and these decreases occurred during the months of February, August, and October.
Patterns in monthly minimum flows for Cedar Creek differ between POR1 and POR3 (fig. 3) and more significant differences in monthly minimum flows occurred in Cedar Creek than any other study site (table 4). For POR1, the lowest median monthly flow occurred in October (27.0 ft³/s; table 4), with the lowest flows for this site (<40 ft³/s) occurring in almost all months of the year (fig. 3), including the winter months (December: 37.5 ft³/s). Patterns of monthly low flows follow a more traditional pattern for POR3, with the lowest flows occurring during the months of August and September. Monthly minimum flows at this site ranged from a median of 27.0 ft³/s to 75.4 ft³/s in POR1 and 49.5 ft³/s to 80.9 ft³/s in POR3.
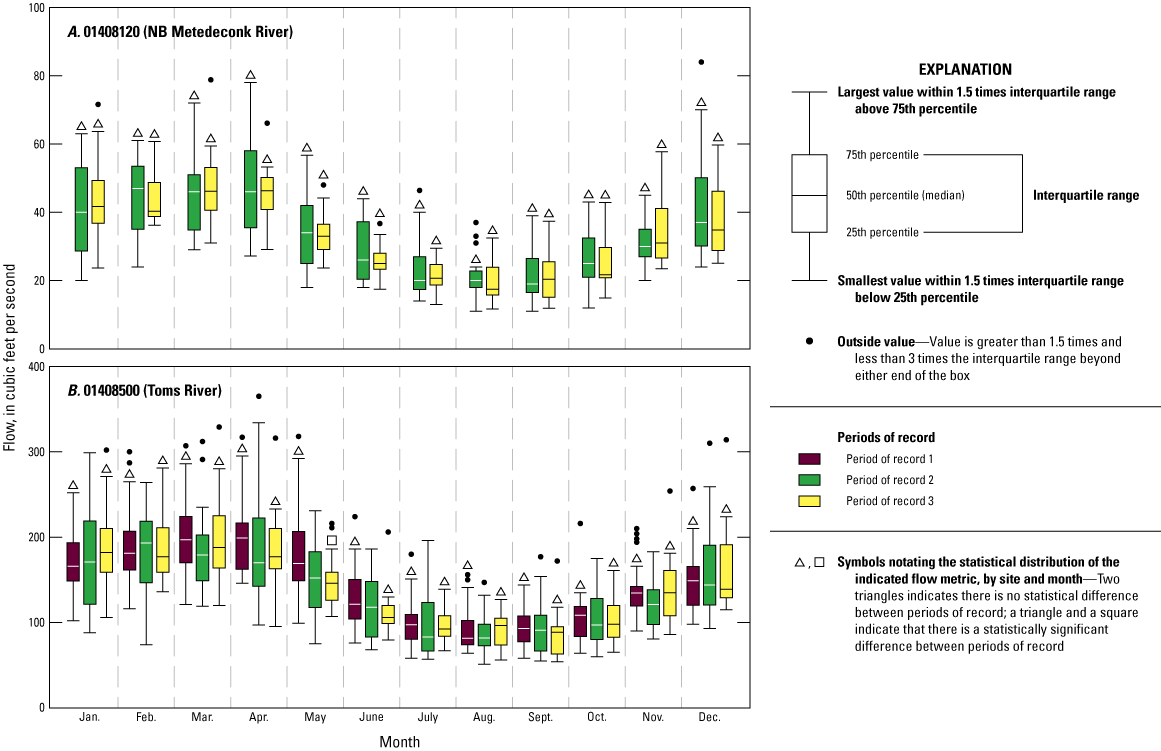
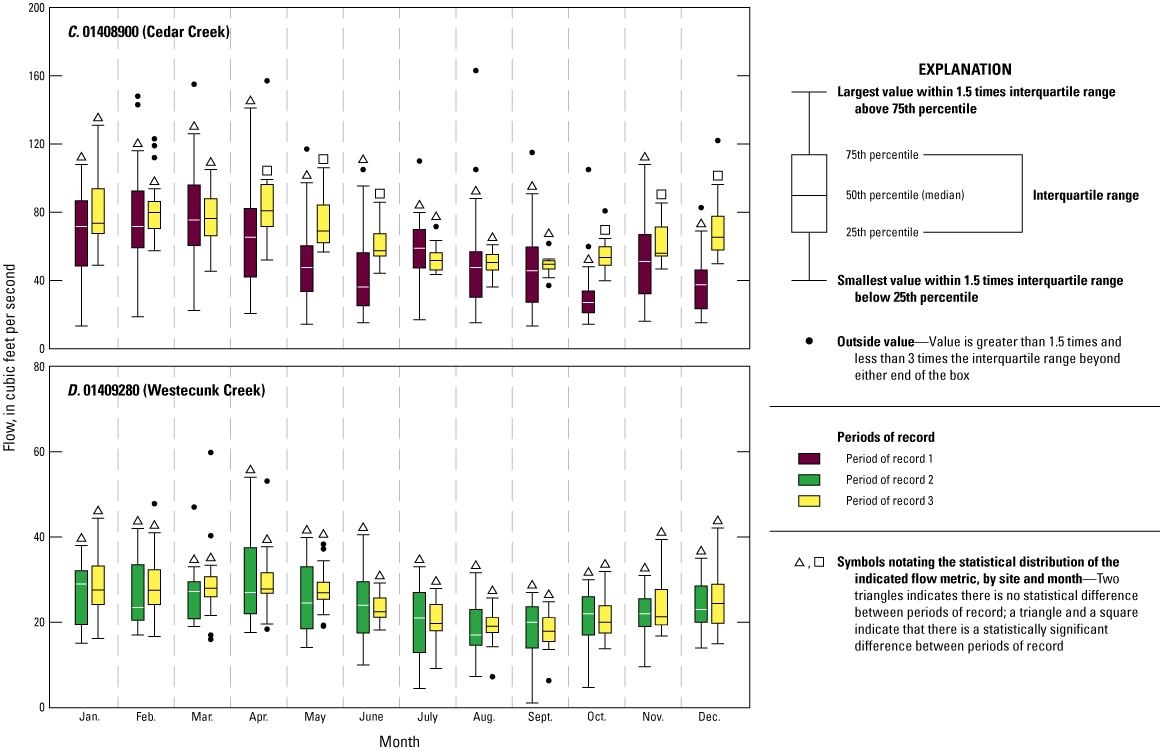
Boxplots showing the distribution of monthly minimum flow values by period of record and site. A, North Branch Metedeconk River near Lakewood, N.J.; B, Toms River near Toms River, N.J.; C, Cedar Creek at Western Blvd near Lanoka Harbor, N.J.; and D, Westecunk Creek at Stafford Forge, N.J. The number of samples, represented by years, in POR1, POR2, and POR3 is 26, 15, and 17, respectively. [POR, period of record]
The monthly minimum flows in POR3 are greater than in POR1 for Cedar Creek, except for the month of July (table 4). Statistically significant differences were identified in the months of April, May, June, October, November, and December. Prior to May 1, 2012, the Cedar Creek gage was located 2.2 miles further downstream than its current location and had a drainage area of 53.3 square miles. Daily mean streamflows prior to May 2012 were adjusted based on regression using concurrent streamflow measurements at the former and current sites. Potential reasons for lower flows in POR1 could be because the former gage location was subject to tidal backwater during lower flow conditions, which may have resulted in periods of reduced flow past the streamgage. Additionally, flow is periodically regulated by gate operations at lakes and cranberry bogs upstream.
For Westecunk Creek, monthly minimum flows ranged from a median of 17.0 ft³/s to 29.0 ft³/s in POR2 and 17.9 ft³/s to 28.0 ft³/s in POR3 (table 4). Minimum flows are lowest during the summer months and greatest during the months of January–April. No statistically significant differences were identified in the distribution of monthly minimum flows between POR2 and POR3 for Westecunk Creek (table 4; fig. 3).
Table 4.
Median monthly minimum flow by period of record in cubic feet per second (ft³/s).[POR1 for NB Metedeconk River, POR2 for Cedar Creek, and POR1 for Westecunk Creek have not been included in this table because no data exist for those periods of record. POR; period of record; NB, North Branch]
Flow Duration
The duration of flow represents the period of time associated with a specific flow condition (Poff and others, 1997). For this study, the annual minimum of the 90-day moving average flow (DL5) was evaluated as an indicator of potential changes in low-flow duration at the four study sites. This is a commonly used streamflow metric with ecological relevance (Kennen and Riskin, 2010; Archfield and others, 2014, Kennen and Cuffney, 2023). The DL5 was calculated for each year within each POR, and then the median of the minimum values was used to represent the minimum of the DL5 for the POR (fig. 4; tables 5, 6, 7, and 8).
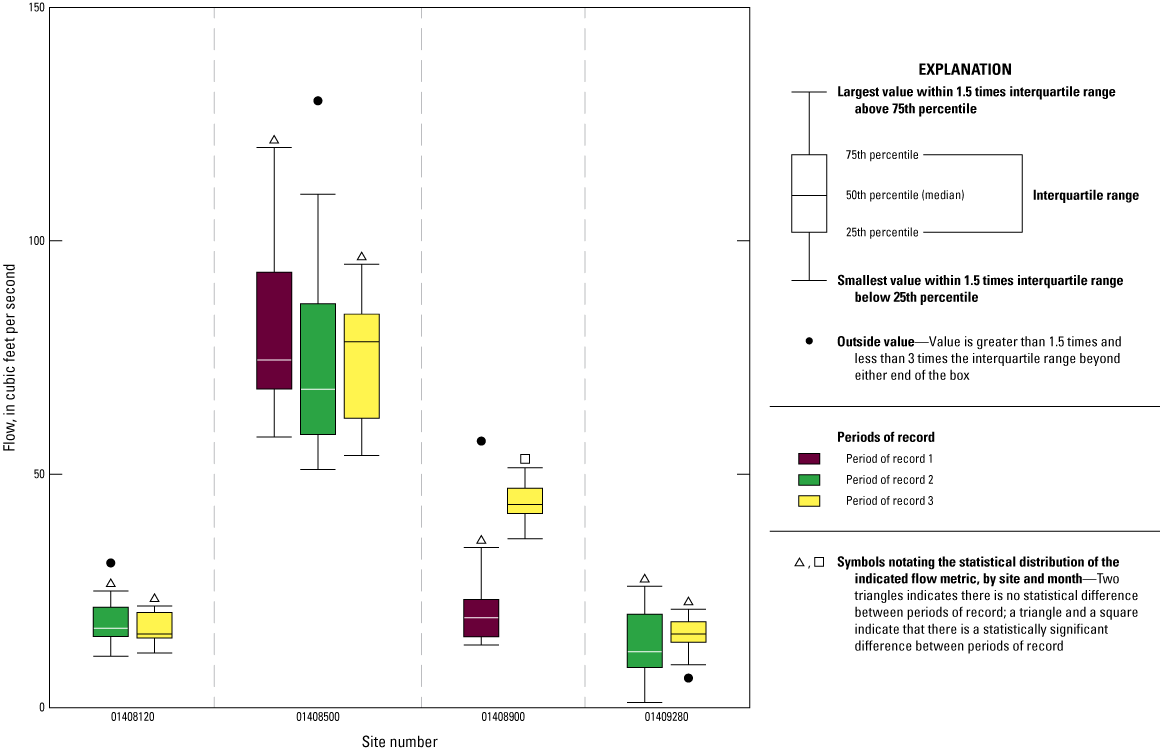
For the NB Metedeconk River, Toms River, and Cedar Creek, the minimum 90-day moving average was greater during POR1 and POR2 than during POR3. For Westecunk Creek, the median DL5 value was greater during POR3. Results of the Wilcoxon rank-sum test indicate that DL5 values were significantly lower in Toms River for POR3 (median of 105 ft³/s) than for POR1 (119 ft³/s), with a p-value of >0.05 but <0.1 (table 6). This also occurred in Cedar Creek for POR3 (58.8 ft³/s) compared to POR1 (63.5 ft³/s), with a p-value of <0.05 (table 7; fig. 4).
At all four sites, the range in DL5 values decreased between the earlier PORs and POR3 (tables 9, 10; fig. 4). For example, NB Metedeconk River DL5 values ranged from 16.4–49.8 ft³/s in POR2 depending on the year and 23.5–41.4 ft³/s in POR3. At Toms River, the range in DL5 values for POR1 was 81.3–197 ft³/s, and for POR3, the range was 82.5–139 ft³/s. Cedar Creek DL5 values ranged from 40.8–95.1 ft³/s in POR1 and 51.5–66.3 ft³/s in POR3, and at Westecunk Creek, the range in DL5 values was 14.2–33.8 ft³/s in POR2 and 16.8–26.6 ft³/s in POR3 (tables 9, 10).
Boxplots showing the distribution of the minimum 90-day moving average flow (DL5) values by period of record and site. The shapes above the boxplot represent the results of the Wilcoxon rank-sum test comparing periods of record. The number of samples, represented by years, in POR1, POR2, and POR3 is 24, 13, and 15, respectively. [POR, period of record]
Table 5.
Summary of selected flow metrics and periods of record at North Branch Metedeconk River.[Flow values in this table were rounded as follows: values less than (<) 1.0 are reported to the hundredths decimal place, values between 1.0 and 100 are reported to the tenth decimal place, and values greater than (>) 100 are reported to three significant figures. POR1 for NB Metedeconk River has not been included in this table because no data exist for this period of record. POR, period of record; NB, North Branch; ft3/s, cubic feet per second; 7Q10, minimum consecutive 7-day average flow with a 10-year recurrence interval]
Table 6.
Summary of selected flow metrics and periods of record at Toms River.[Flow values in this table were rounded as follows: values less than (<) 1.0 are reported to the hundredths decimal place, values between 1.0 and 100 are reported to the tenth decimal place, and values greater than (>) 100 are reported to three significant figures. POR, period of record; ft3/s, cubic feet per second; 7Q10, minimum consecutive 7-day average flow with a 10-year recurrence interval]
Table 7.
Summary of selected flow metrics and periods of record at Cedar Creek.[Flow values in this table were rounded as follows: values less than (<) 1.0 are reported to the hundredths decimal place, values between 1.0 and 100 are reported to the tenth decimal place, and values greater than (>) 100 are reported to three significant figures. POR2 for Cedar Creek has not been included in this table because no data exists for this period of record. POR, period of record; ft3/s, cubic feet per second; 7Q10, minimum consecutive 7-day average flow with a 10-year recurrence interval]
Table 8.
Summary of selected flow metrics and periods of record at Westecunk Creek.[Flow values in this table were rounded as follows: values less than (<) 1.0 are reported to the hundredths decimal place, values between 1.0 and 100 are reported to the tenth decimal place, and values greater than (>) 100 are reported to three significant figures. POR1 for Westecunk Creek has not been included in this table because no data exists for this period of record. POR, period of record; ft3/s, cubic feet per second; 7Q10, minimum consecutive 7-day average flow with a 10-year recurrence interval]
Table 9.
Range of the 90-day moving average flow (DL5) values by period of record and site for NB Metedeconk River and Toms River.[POR1 for NB Metedeconk River has not been included in this table because no data exist for these periods of record. Min, minimum; max, maximum; POR, period of record; ft3/yr, cubic feet per year; NB, North Branch]
Table 10.
Range of the 90-day moving average flow (DL5) values by period of record and site for Cedar Creek and Westecunk Creek.[POR2 for Cedar Creek and POR1 for Westecunk Creek have not been included in this table because no data exist for these periods of record. Min, minimum; max, maximum; POR, period of record; ft3/yr, cubic feet per year]
Mean Streamflow
The mean of the daily mean flow values (MA1) for each water year serves as a metric of average streamflow conditions at each of the sites. MA1 values for each site and PORs are presented in tables 5, 6, 7, and 8. Hydrographs also are presented for each of the sites and PORs to show fluctuations in daily mean streamflow over time (fig. 5). For the most recent period, POR3, overall mean streamflow was about 65 ft³/s at NB Metedeconk River (table 5), 220 ft³/s at Toms River (table 6), 91 ft³/s at Cedar Creek (table 7), and 32 ft³/s at Westecunk Creek (table 8). The mean of the daily streamflows indicated an overall increase of about 2.8 percent at the Toms River streamgage from POR1 to POR3 (table 6). The daily mean streamflow from POR2 to POR3 also indicated an increase of 3.8 percent and 6.6 percent at Toms River (table 6) and NB Metedeconk River (table 5), respectively. The Cedar Creek and Westecunk Creek streamgages showed slightly different patterns with a decrease in the daily mean streamflow of 8.4 percent from POR1 to POR3 for Cedar Creek and essentially no change in daily mean streamflow between POR2 and POR3 at Westecunk Creek. When comparing the distribution of annual MA1 values between PORs (fig. 6), no statistically significant differences in the distribution were indicated by results of the Wilcoxon rank-sum test for any of the sites.
When attempting to establish minimum-flow guidance for the protection of the local ecosystem, it may be necessary to investigate more complex statistics, but using daily streamflows is a good first step in understanding the variability of streamflow. Although statistically significant changes in the annual streamflow were not identified, utilizing a statistic like the 90-percent exceedance streamflow or the median of the August minimum flow (ML8) as an experimental threshold can highlight what percentage of the POR was below the 30-percent target for each streamgage indicated by the BBP. For example, if the median of the August minimum flow (ML8) was selected as the ecological-flow limit for the Toms River streamgage, then a proposed buffer of 30 percent above this limit would be the targeted zone where flow alterations would be reduced or paused to protect the aquatic ecosystem. The ML8 value for POR1 at Toms River was 81.5 ft³/s (table 4); adding a 30-percent buffer increases the threshold to 106 ft³/s (table 11). Applying this buffer to the approved daily streamflow record for POR1 at the Toms River streamgage results in daily streamflows below the 30-percent buffer 11.4 percent of the time (table 11). Figure 5 shows daily streamflow data, the ML8 flow as an example flow limit, as well as a 30-percent buffer line for each station and POR to illustrate the variability and extremes in the historical-streamflow record.
Table 11.
Percentage of days that mean daily flow values were below an example threshold for each site and period of record.[USGS, U.S. Geological Survey; ID, identifier; POR, period of record; ML8, August minimum flow; %, percent; ft³/s, cubic feet per second, N.J., New Jersey]
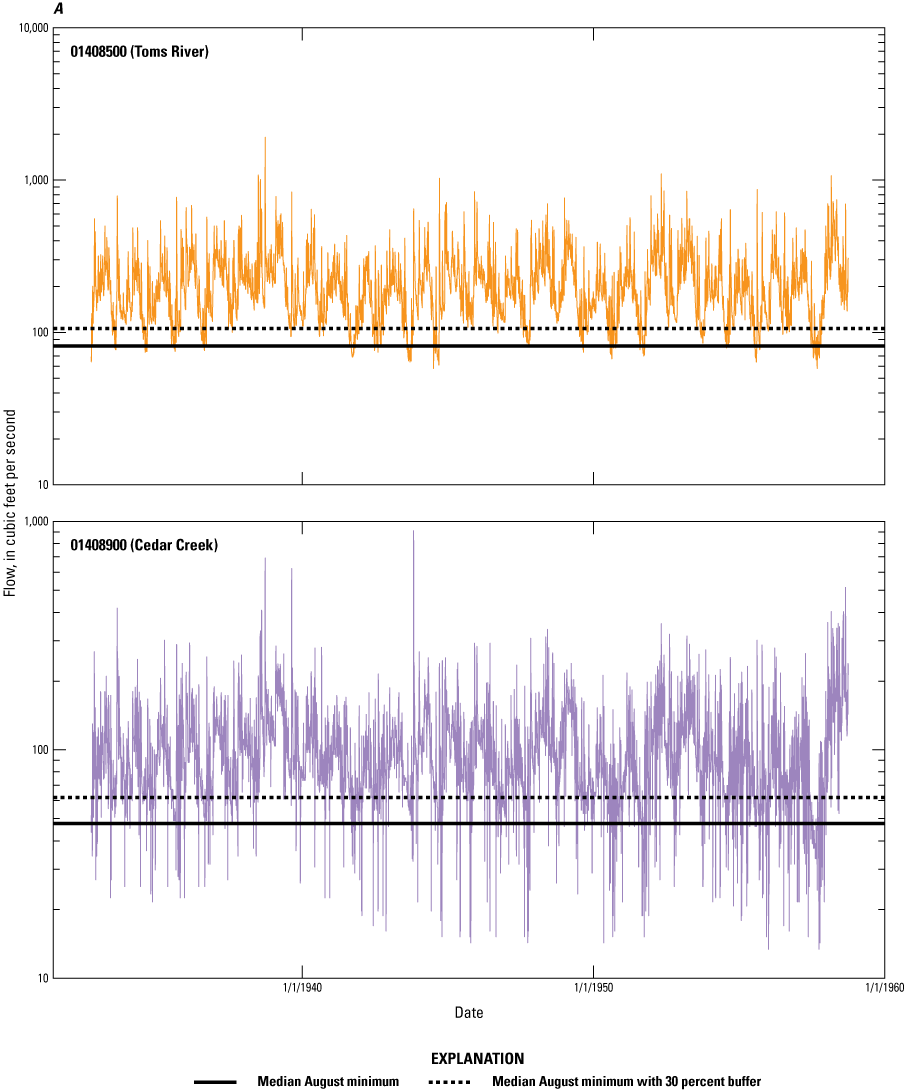
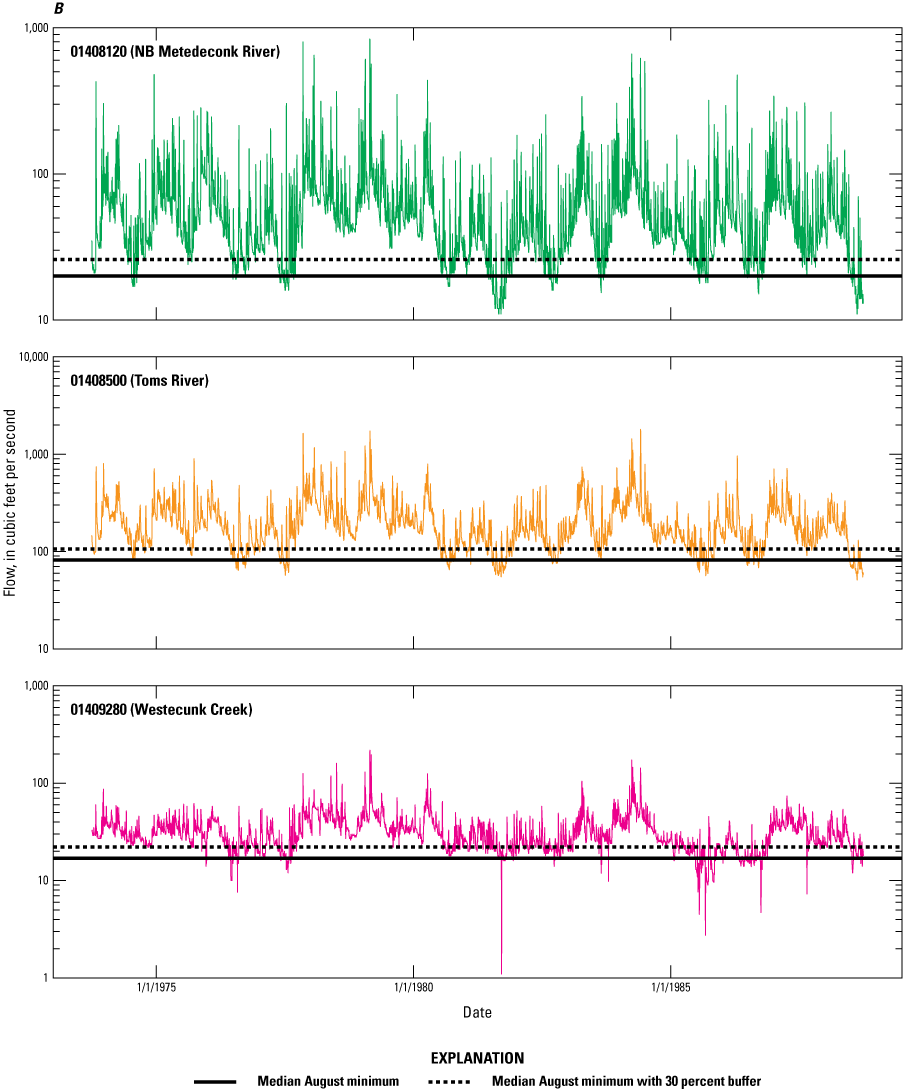
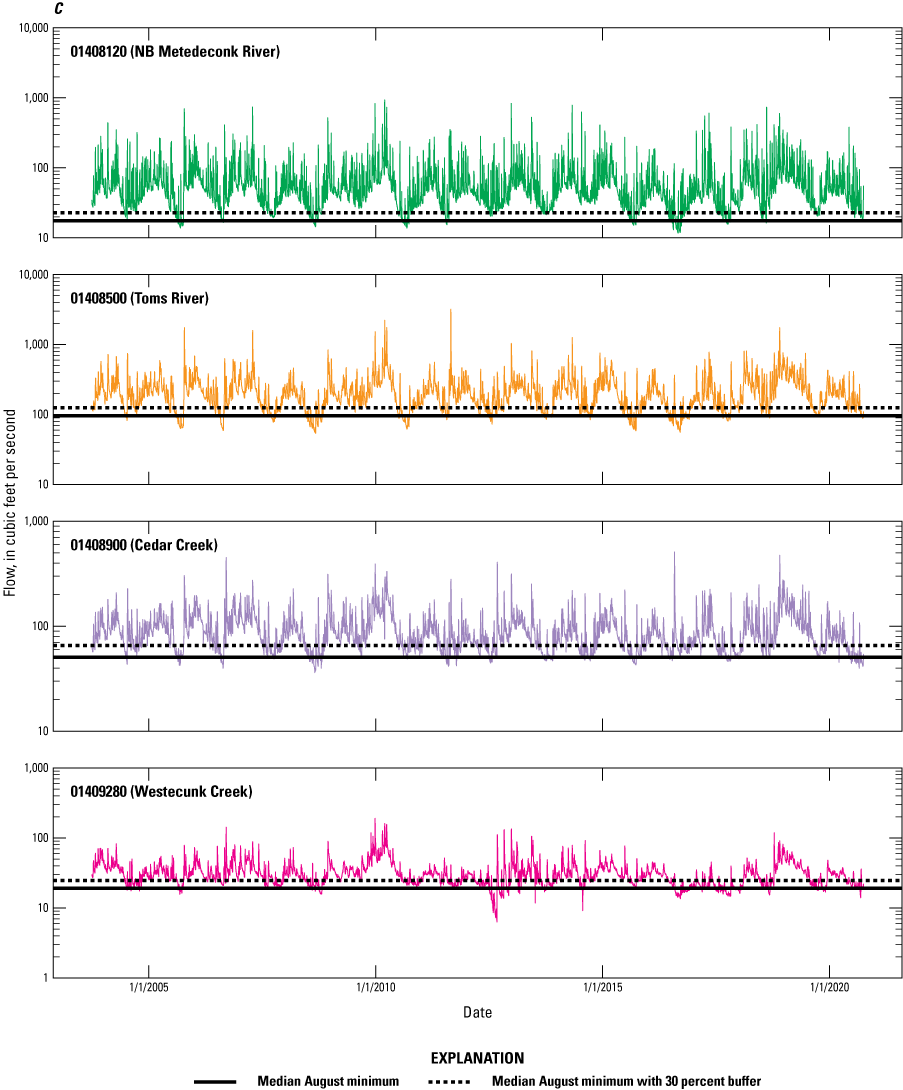
Graphs showing A, Hydrographs of the mean daily streamflow by site for water years 1933–58 (POR1); B, Hydrographs of the mean daily streamflow by site for water years 1974–90 (POR2); and C, Hydrographs of the mean daily streamflow by site for water years 2004–20 (POR3). [POR, period of record]
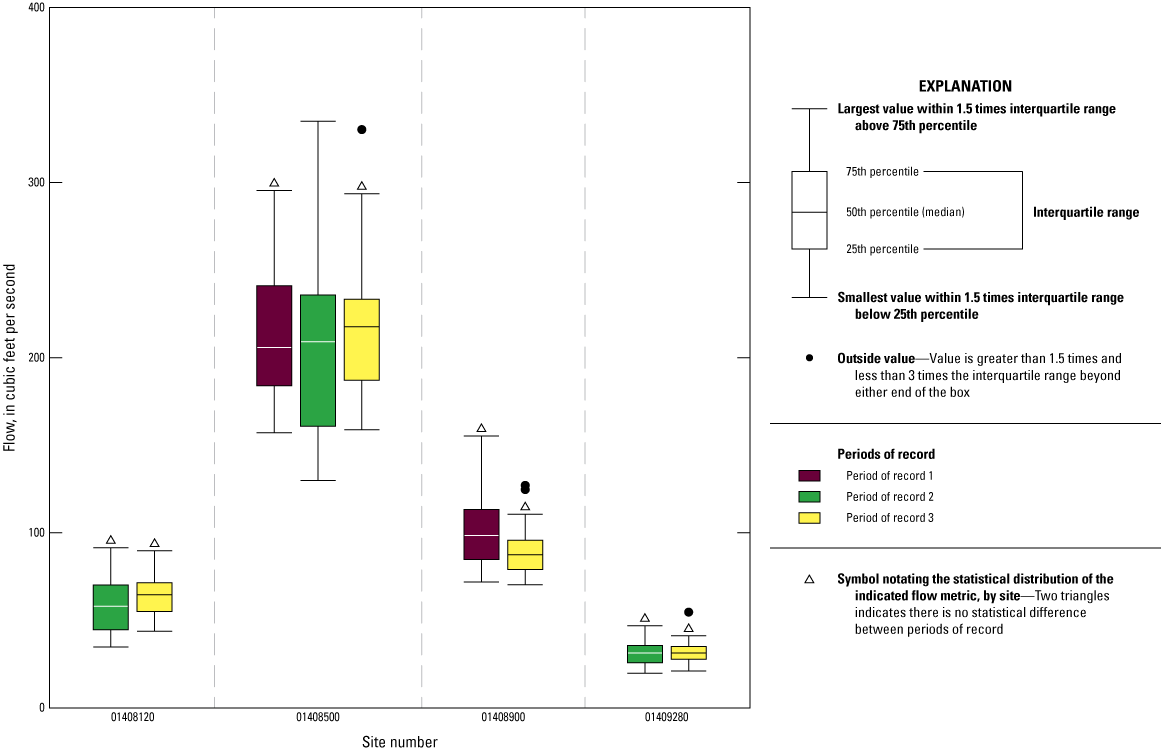
Boxplot showing the distribution of the mean daily streamflow (MA1) values by period of record and site. The shapes above the boxplot represent the results of the Wilcoxon rank-sum test comparing periods of record. The number of samples, represented by years, in POR1, POR2, and POR3 is 26, 15, and 17, respectively. [POR, period of record]
Frequency
The 7Q10 was computed for each site by season and POR to investigate potential sub-annual patterns in low-flow frequency. When comparing the earliest period, POR1, to the most recent period, POR3, the results for Toms River showed a net decrease in the magnitude of 7Q10 frequency for the spring, summer, and fall months (table 6; fig. 7). Of these, the greatest percent decrease (9 percent) occurred during the summer months, which had a 7Q10 of about 66 ft³/s in POR1 and 60 ft³/s in POR3. The winter season showed a smaller net increase (<2 percent) in the 7Q10 flow at Toms River. When comparing POR1 to POR2, the 7Q10 showed a marked decrease in magnitude for all four seasons, ranging from about 12 percent to 22 percent. This was followed by increases of varying degrees across all seasons between POR2 and POR3.
When comparing POR2 to POR3, the 7Q10 indicated a net increase in magnitude for the three streams with data available for both POR2 and POR3: NB Metedeconk River, Toms River, and Westecunk Creek (fig. 7). The increase in 7Q10 magnitude for all seasons between POR2 and POR3 ranged from 3.3 percent in the summer months at Toms River to greater than 47 percent in the spring at Westecunk Creek (tables 5, 6, and 8). Lastly, Cedar Creek showed large increases in the 7Q10 between POR1 and POR3, except for the spring months, for which there was a small decrease (table 7). These metrics help to illustrate how the shape of flow distribution may be changing throughout the period of record and help to explain the complex interactions that exist between changes in the magnitude of the 7Q10 and other flow metrics such as the mean daily streamflow, the daily minimum, or the normalized 75- and 90-percent exceedance streamflow.
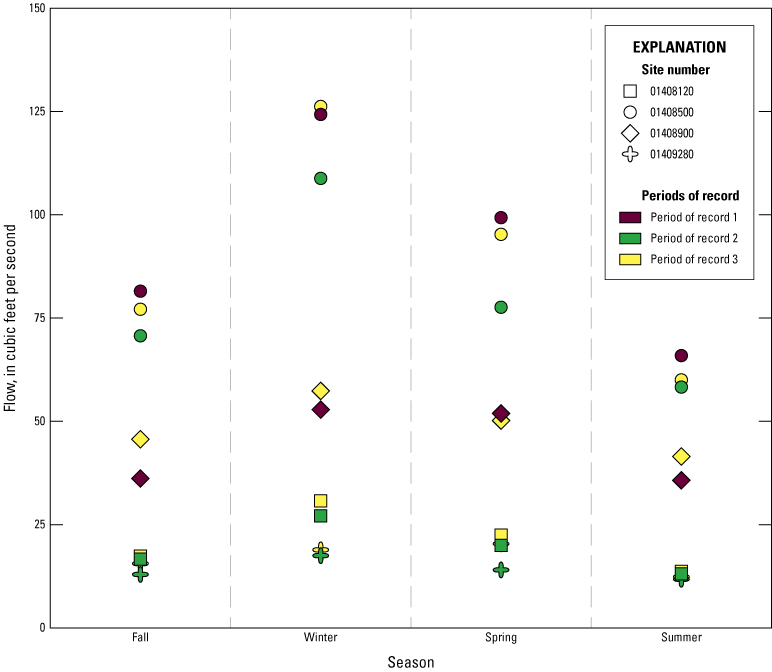
Plot showing the seasonal consecutive 7Q10 by period of record (POR) and site.
Analysis of Statistical Results to Inform Changes in Streamflow Conditions
Results of the selected historical analysis periods were examined separately for each site (tables 5, 6, 7, and 8) to help describe changes in streamflow patterns. Streamflow metrics5 were evaluated for each site. The streamgage records were not coincident for all periods; therefore, the primary focus was to understand how current streamflow conditions differ from past conditions.
Streamflow metrics are defined here as metrics that generally describe the majority of the streamflow in any given year or analysis period and metrics that can help highlight changes in the lower, or statistically rarer, streamflows.
The Toms River streamgage is the only study site with a complete record for all three time periods, giving insight on how the general streamflow patterns varied across the three PORs. Using the mean of the daily mean streamflow (MA1) values for each POR as a descriptor, Toms River showed a slight decrease in the average streamflow from POR1 to POR2 and a larger increase in streamflow from POR2 to POR3, with the average streamflow being greater for POR3 than for POR1. These results indicate that POR2 had the lowest flow of the three PORs. In addition to general streamflow increases, the Toms River sub-basin was identified earlier in the report as having the largest increase in development during the largest increase in urban land use between 1986 and 2015 (table 2).
For the Toms River, changes from POR1 to POR3 indicate increases in the mean of daily streamflows (MA1; fig. 6; table 6) and increases in the median of the annual daily minimum flow (DL1-median; fig. 8). However, little to no changes were identified in the minimum 7-day moving average flows (DL3; fig. 9) and the minimum 7-day moving average flows normalized to median streamflow (DL12; table 6). In contrast, the mean of the annual daily minimum flow (DL1-mean) decreased from POR1 to POR3, which indicates that the flow distribution may have changed. The pattern of an increasing MA1 and an increasing DL1-median flow contrasted with a decreasing DL1-mean may indicate more extreme daily minimum flows are occurring. Statistically significant decreases in the minimum 90-day moving average of flows (DL5) were also evident at Toms River between POR1 and POR3 (fig. 4) along with lower minimum monthly flows of about 20 ft³/s each for the months of April, May, and June (table 4). For Toms River, the dates of the annual minimum flows by POR were September 7, 13, and 21 (Julian days 250, 256, and 264, respectively), indicating a small but important shift in timing of low flows. These patterns can be further examined by reviewing the results of the seasonal low-flow frequency values for Toms River.
Boxplots showing the distribution of the annual minimum daily streamflow (DL1) values by period of record and site. The shapes above the boxplot represent the results of the Wilcoxon rank-sum test comparing periods of record. The number of samples, represented by years, in POR1, POR2, and POR3 is 26, 15, and 17, respectively. [POR, period of record]
When comparing 7Q10 values between POR1 and POR3 at Toms River, the 7Q10 decreased between 4 percent and 9 percent for the spring, summer, and fall months, and winter low-flow frequency values had a small increase of 1.6 percent (table 6). Although these statistics continue to describe changes in low-flow conditions, in some cases simply investigating the change in magnitude for a single frequency (such as 7Q10) may not provide enough insight to inform how the streamflow is changing. If the fitted frequency curve changes in shape from slightly concave to straighter, stepped, or slightly convex, that implies a potential change to the distribution of the 7-consecutive day minimum average streamflow over time (Vogel and Fennessey, 1995). An in-depth analysis of changes in low-flow frequency curve shape and statistics are beyond the scope of this study, but an example of this type of change was identified at the Toms River streamgage. A brief analysis of the frequency curve for the summer 7Q10 low-flow statistics for POR1 and POR3 at Toms River shows a change in the curve shape (fig. 10). In POR1, the frequency curve fitted to the 7Q10 was smooth and slightly concave in shape, consistent with a slightly positive-skewed distribution. In POR3, the fitted frequency curve shows a distinct step change between two flatter ranges of ranked data values. The step change occurs between the 30- and 40-percent non-exceedance probabilities so it does not impact the 10-percent probability and associated 7Q10, but the step change provides insight about other potential changes in low-flow conditions (fig. 10). The magnitude for the 10-year recurrence interval was slightly reduced, and the change in curve shape may be a signal that other changes are occurring at lower flows within the sub-basin. Coincident with this finding, decreases of about 2 percent and 3 percent also were observed in the normalized DL14 and DL15, respectively, at Toms River from POR1 to POR3 (table 6). The low-flow frequency and exceedance results help describe the magnitude and distribution of rarer streamflows, or streamflows along the left tail of the flow-distribution curve.
Examining the change from POR2 to POR3 for Toms River showed a pattern that was generally consistent—increasing flows from the low period of POR2 to POR3. Some of the changes were seen in low-flow frequency, including increases in the 7Q10 magnitude for all seasons; these changes are being influenced by the lower flows in POR2. Reviewing the collection of streamflow metrics for Toms River indicates that, although overall annual flows are increasing, the magnitudes of statistically rarer low flows and spring and summer low flows are getting lower. These types of increased variability at the lower end of the flow distribution tend to be consistent with increased water-supply demand or other types of alteration that is potentially influenced by increased development in the sub-basin (Kennen and others, 2014; Singh and Basu, 2022).
Results that compared POR2 to POR3 in the NB Metedeconk River followed a similar pattern to that seen in the Toms River for MA1 (tables 5 and 6). NB Metedeconk River also showed decreases in DL1, DL3, and DL5, and no change in the normalized 75- and 90-percent exceedance streamflows. The 7Q10 low-flow frequency metrics all showed increases for each season, indicating that streamflow throughout POR2 was lower. Collectively, results show a decrease in DL1, DL3 and DL5 when the 7Q10 magnitude was increasing from POR2 to POR3. These results may indicate multiple alterations occurred during lower-flow conditions that may require a more advanced analysis to better explain the changes. It is possible that increased downward spikes in low flows are meaningful enough to alter minimum flows, but other mechanisms (such as anthropogenic effects or shifts in precipitation) are altering slightly higher flows (Freeman and others, 2007; Falcone and others 2010; Rice and others 2015; Singh and Basu, 2022), increasing the overall skew of the minimum 7-consecutive day minimum streamflow, therefore changing the frequency curve that resulted in a slightly higher 7Q10 magnitude. Monthly minimums showed a mix of increases and decreases between POR2 and POR3; the greatest percent changes (>10 percent) were decreases and occurred during the months of February, August, and October. Lastly, for NB Metedeconk River, the median dates of the annual minimum flows for POR2 and POR3 were August 27 and September 25 (Julian days 239 and 268, respectively). The nearly 4-week difference was not statistically significant (p-value >0.1); however, it represented the greatest change in timing of minimum flows among the four sub-basins with a shift toward the fall season (fig. 11; tables 5, 6, 7, and 8).
Cedar Creek and Westecunk Creek streamgages are in the southern and less developed part of the Barnegat Bay-Little Egg Harbor watershed (fig. 2). Data were not available for all 3 PORs at these two streamgages, so comparisons were made for POR1 to POR3 and POR2 to POR3, respectively. The mean of the daily streamflow (MA1) was used again as a simple measure of the general conditions during each analysis period. In general, as the amount of human water-use demand goes up, streamflows tend to decrease concomitantly (Wada and others, 2013). As mentioned previously, results in NB Metedeconk River, Toms River, and Westecunk Creek sub-basins indicated that streamflow has increased or remained relatively flat over time (tables 5, 6, and 8). The Westecunk Creek streamgage showed a <1-percent increase in mean daily streamflow from POR2 to POR3 and there is a 3.8- to 6.6-percent increase in mean daily streamflow from POR2 to POR3 at Toms River and NB Metedeconk River. Conversely, there was an 8.4-percent decrease in MA1 in Cedar Creek between POR1 and POR3 (table 7).
For Cedar Creek, the mean and median of the annual daily minimums (DL1-mean and DL1-median), and the annual minimum 7-day moving average of flows (DL3) all increased from POR1 to POR3 (table 7). Both DL1 metrics more than doubled between POR1 and POR3. The monthly minimums increased for all months between POR1 and POR3, except for July, with notable increases occurring in the months of April, May, June, October, and December (23.9, 45.0, 58.8, 98.1, and 74.1 percent, respectively); the median of the minimum monthly flows increased by 15.6–28.0 ft³/s for these months (table 4). The large percent increase in DL1 and monthly minimums is likely related to gage location and the occurrence of low values year-round during POR1, as previously described in the “monthly minima” section of this report. The timing of the annual minimum flow (TL1) for Cedar Creek shifted toward later in the year, similar to NB Metedeconk and Toms River, albeit slight. The dates of the annual minimum flows for POR1 and POR3 were September 6 and September 12 (Julian days 249 and 255, respectively, table 7). In addition, DL12, DL14, and DL15 each increased between POR1 and POR3; the only duration metric that decreased at Cedar Creek was the 90-day moving average (DL5; 7.4 percent decrease). Low-flow frequency results at Cedar Creek also generally indicate increasing magnitudes for all the seasonal 7Q10s, with the exception of the spring 7Q10, which had a 3.3-percent decrease. In the case of Cedar Creek, results at the low end of the flow range may be influenced by improved flow monitoring conditions resulting from the relocation of the streamgage and may not be solely a result of differences between PORs. The streamflow past the gage at the previous location was occasionally affected by tide, resulting in short temporary periods of reduced or zero flow over the weir. The resulting daily flow should include the combined effect of water going into temporary storage and later being released downstream; however, it is possible that during low-flow periods, the methods for adjusting the computed streamflow introduced uncertainty, so the gage was moved upstream in 2012 and away from the influence of daily tide.
Similar to NB Metedeconk and Toms River, the seasonal 7Q10 for Westecunk Creek was greater in POR3 than in POR2 for all four seasons (table 8). Westecunk Creek exhibited some of the largest percent increases in seasonal 7Q10 values during these two time periods (up to 47.8 percent during spring). Summer 7Q10 values showed among the smallest percent increases for each of the study sites. Unlike the NB Metedeconk and the Toms River, which had decreases in one or more of the n-day duration metrics (DL1, DL3, and DL5) as well as DL12 between POR2 and POR3, Westecunk Creek exhibited an increase for each of the metrics, ranging from a 5.5 percent increase for DL12 to 31.7 percent increase for DL1-median. Monthly minimum values showed a mix of increases and decreases between POR2 and POR3, with the greatest percent increases occurring during the months of February, May, and August (12.4, 9.8, and 17.0 percent, respectively), and the greatest percent decreases occurring in September and October (10.5 and 9.1 percent, respectively, table 4). The timing of the annual minimum flow (TL1) for Westecunk Creek did not change between POR2 and POR3, with September 10th (Julian day 253) as the date of the annual minimum flow for both PORs (table 8).
Given that there has been no increase in development in the Westecunk Creek sub-basin, and LU/LC is predominantly forest and wetlands (table 2), this sub-basin may be viewed as a sub-basin with reference-like (relatively undisturbed) flow conditions in the study area. This sub-basin generally showed increases in flow metrics between POR2 and POR3. In contrast, the NB Metedeconk River showed a decrease in every low-flow duration metric that was evaluated (table 5) despite an increase in mean annual streamflow, and results of analysis of streamflow metrics in the Toms River indicated that some low-flow metrics increased while others decreased (table 6).
Skewness and kurtosis were computed from the daily streamflows for the four streamgages used in this study and evaluated for deviation from what would be expected for coastal streams (Armstrong and others, 2008). The skewness remained relatively close to zero (that is, a slightly negative skew) for all periods, and while no statistically significant changes were found, some patterns were identified. For example, the change in skewness from POR1 to POR3 for Toms River and Cedar Creek showed increases of 24 percent and 16 percent while changes for POR2 to POR3 at NB Metedeconk River and Westecunk Creek also showed increases of about 12 percent and 26 percent. The most recent period of POR2 to POR3 at the Toms River streamgage was the only skewness value to show a small decrease. Kurtosis results were a little more mixed, with generally increasing changes for most periods except POR1 to POR3 at Cedar Creek (a 10-percent decrease).
Boxplots showing the distribution of the minimum 7-day moving average flow (DL3) values by period of record and site. The shapes above the boxplot represent the results of the Wilcoxon rank-sum test comparing the number of samples, represented by years, in POR1, POR2, and POR3 is 24, 13, and 15, respectively. [POR, period of record]
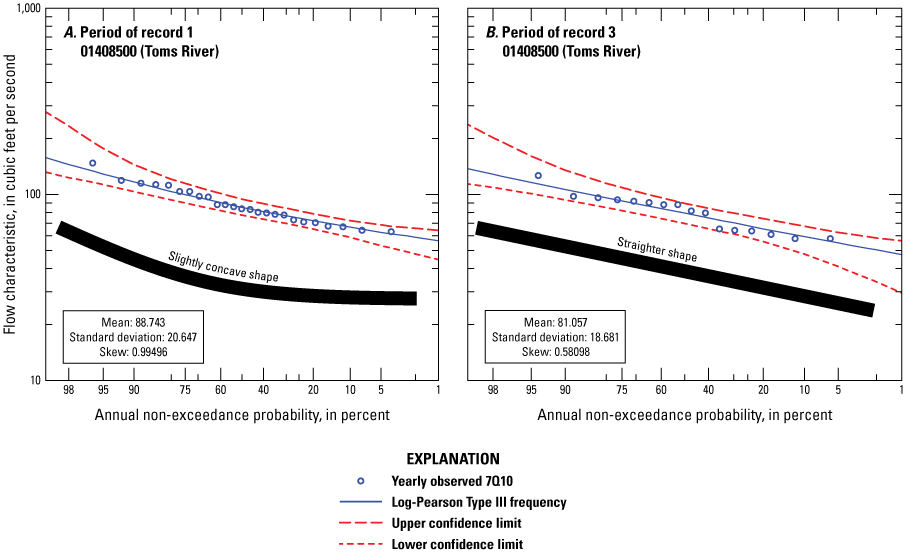
Low-flow frequency curve showing a log-Pearson Type III (LPIII) distribution fitted to the minimum consecutive 7-day average flow (7Q10) for the Toms River streamgage for A, POR1 and B, POR3. [POR, period of record]
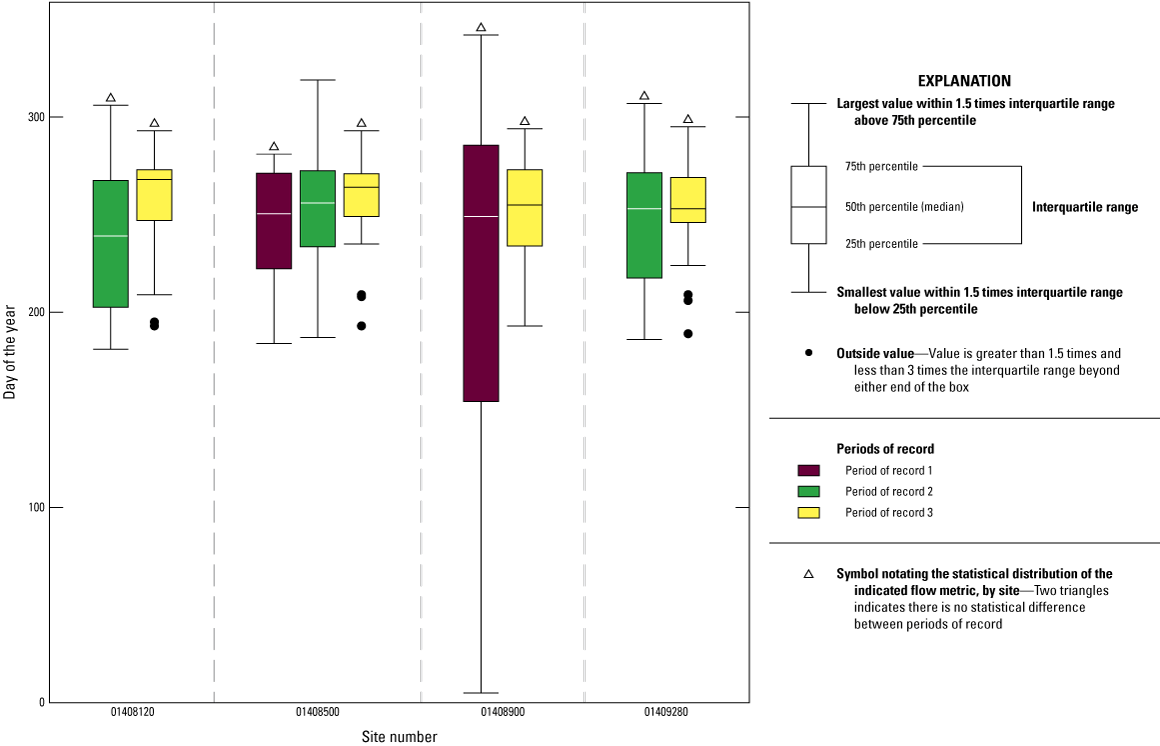
Boxplots showing the distribution of the date of the annual minimum flow (TL1) by period of record and site. The shapes above the boxplot represent the results of the Wilcoxon rank-sum test comparing periods of record. The number of samples, represented by years, in POR1, POR2, and POR3 is 26, 15, and 17, respectively. [POR, period of record]
Summary and Research Directions
The vitality of natural stream ecosystems is created and maintained by substantial variation in the physical, chemical and biological attributes across time and space (Reice and others, 1990; Turner, 1990; Reice, 1994). Understanding how human actions may have changed streamflow patterns can provide insight into how the aquatic ecosystem in the streams to Barnegat Bay-Little Egg Harbor estuary may be affected. For example, withdrawals from surface and groundwater systems can adversely affect aquatic ecosystems by altering streamflow regimes which can affect the suitability of a stream to sustain many types of aquatic fauna (Kennen and others, 2014). Flow components, including low flows (baseflows), annual-flow pulses, seasonality of flows, and annual variability provide the conditions necessary to support natural-assemblage complexity (Poff and Ward, 1989; Stanford and others, 1996; Poff and others, 1997; Richter and others, 1997; Baron and others, 2002). Alterations in the timing, duration, and magnitude of many of these flow components can substantially affect sensitive aquatic fauna that embody less resilient or robust life histories (Kennen and others, 2010). Management decisions regarding water resources depend on the status of the resource; therefore, a thorough understanding of the effects on the long-term hydrological and ecological sustainability of stream systems is essential to the development of water-supply plans and human water-use programs. These programs would benefit from accommodating both current and anticipated growth in population and potential changes in precipitation and temperature.
The focus of this study was to understand the current and historical streamflow conditions of four major sub-basins (North Branch Metedeconk River, Toms River, Cedar Creek, and Westecunk Creek) within the Barnegat Bay-Little Egg Harbor watershed and present the results of a comparative analysis of different periods of record (PORs). This approach provides insight into how each of the streams differ in terms of streamflow metrics and this study represents the first step in determining ecological-flow targets in the Barnegat Bay-Little Egg Harbor watershed. The results highlighted several instances where components of flow changed in either an increasing or decreasing direction. For example, the mean of daily streamflow (MA1) was used to describe broad changes in streamflow conditions. Results indicate that, in some streams (for example, Toms River), the mean of the daily streamflow (MA1) decreased from POR1 to POR2 and increased from POR2 to POR3; however, the larger changes seem to have occurred during specific months or were related to the seasonality of streamflow. Decreasing changes to low-flow metrics were evident at the two northern and most developed sites—NB Metedeconk and Toms Rivers. NB Metedeconk River exhibited the greatest number of decreases in low-flow duration metrics analyzed, with each of the minimum n-day moving averages (DL1, DL3, and DL5) showing a decline between POR2 and POR3. Despite an increase in daily mean flow at Toms River from POR1 to POR3, the 90-day moving average flow significantly decreased (p-value of >0.05 but <0.1). Toms River also had significant decreases in monthly minimum flows for the late spring and early summer months. Decreases in the 75- and 90-percent exceedance flows normalized to median streamflow as well as decreases in 7Q10 values for three out of four seasons were also noted. In comparison, there was little to no evidence of negative changes to low-flow metrics at Westecunk Creek, the southernmost and least developed site. All low-flow duration metrics and seasonal 7Q10s increased for this site between POR2 and POR3, and there were a mix of increases and decreases in monthly minimum flows, with decreases occurring mostly during the summer and fall months. Cedar Creek (similar to Westecunk Creek because it is largely undeveloped) had a mix of results which included a statistically significant decrease in the minimum of the 90-day moving average, but large increases in the shorter-scale duration metrics and seasonal 7Q10s. Some of these mixed results are likely related to a change in the gage location in 2012.
Flow components, such as low flows, seasonality of flows, and annual flow variability provide the conditions necessary to support natural assemblage complexity (Stanford and others, 1996; Poff and others, 1997; Mathews, 2005). Changes in many of these flow components can substantially affect sensitive aquatic fauna that embody less resilient or robust life histories (Poff and others, 1997). Changes in streamflow variability and its importance to aquatic fauna in New Jersey was previously reported in Kennen and Riskin (2010) and Kennen and others (2014). These prior findings accentuated that annual flow variability (specifically variability across minimum monthly flows) was important for maintaining assemblage structure and function and indicated that, as the magnitude of low-flow processes are altered, species with life-history and behavioral constraints that rely on annual flow patterns or fluctuations in flow for reproduction may become less abundant, whereas species with greater resilience to changes in natural stream variability (less desirable species) become more abundant. Other studies in the eastern United States further support these findings; for example, Armstrong and others (2001) identified fluvial-dependent fish species as being sensitive to hydrologic stress, which was associated with reduced streamflow. In contrast, abundances of habitat-generalist species have been found to increase (Roy and others, 2005). Prolonged periods of low- and reduced-magnitude flows also can reduce habitat availability and quality, ultimately altering trophic dynamics (Power and others, 1996; Poff and others, 1997).
Understanding these changes and developing flow-management plans that accommodate human needs while maintaining adequate streamflow to not adversely affect the unique habitats and ecology of the Barnegat Bay-Little Egg Harbor ecosystem is a delicate balance. However, to better understand the effect of human alterations on current and future streamflow in the Barnegat Bay-Little Egg Harbor watershed, additional information on the status of water availability and streamflow is needed. Planned follow-up in the ELOHA process could include the development of runoff and (or) hydraulic models (Poff and others, 2010) which can lead to the development of testable scenarios that provide insight into how much or how little water can be extracted from or preserved in streams. This ensures that the ecological-flow goal of retaining (or preserving) a 30-percent buffer over minimum ecological flow for gaged waterways indicated by the Barnegat Bay Partnership (BBP: Barnegat Bay Partnership, 2021) can be met. Later phases of this study plan to focus on directly addressing this question and developing hydrologic models to gain a more thorough understanding of the status of the resource. Ultimately, the goal is to support the BBP and other stakeholders collaboratively in development of flow-protection standards that address water supply needs while supporting the conservation of streamflow and ecological flows in the watershed.
References Cited
Archfield, S.A., Kennen, J.G., Carlisle, D.M., and Wolock, D.M., 2014, An objective and parsimonious approach for classifying natural flow regimes at a continental scale: River Research and Applications, v. 30, no. 9, p. 1166–1183. [Also available at https://doi.org/10.1002/rra.2710.]
Armstrong, D.S., Richards, T.A., and Parker, G.W., 2001, Assessment of habitat, fish communities, and streamflow requirements for habitat protection, Ipswich River, Massachusetts, 1998–99: U.S. Geological Survey Water-Resources Investigations Report 2001–4161, 72 p. [Also available at https://doi.org/10.3133/wri20014161.]
Armstrong, D.S., Parker, G.W., and Richards, T.A., 2008, Characteristics and classification of least altered streamflows in Massachusetts: U.S. Geological Survey Scientific Investigations Report 2007–5291, 113 p., CD–ROM in pocket. [Also available at https://pubs.usgs.gov/sir/2007/5291/.]
Arthington, A.H., Kennen, J.G., Stein, E.D., and Webb, J.A., 2018, Recent advances in environmental flows science and water management—Innovation in the Anthropocene: Freshwater Biology, v. 63, no. 8, p. 1022–1034. [Also available at https://doi.org/10.1111/fwb.13108.]
Baker, R.J., Wieben, C.M., Lathrop, R.G., and Nicholson, R.S., 2014, Concentrations, loads, and yields of total nitrogen and total phosphorus in the Barnegat Bay-Little Egg Harbor watershed, New Jersey, 1989–2011, at multiple spatial scales: U.S. Geological Survey Scientific Investigations Report 2014–5072, 64 p. [Also available at https://doi.org/10.3133/sir20145072.]
Barnegat Bay Partnership, 2021, 2021 comprehensive conservation and management plan for the Barnegat Bay-Little Egg Harbor estuary: Barnegat Bay Partnership, 109 p., 8 app., accessed January 26, 2023, at https://www.barnegatbaypartnership.org/about-us/ccmp/.
Baron, J.S., Poff, N.L., Angermeier, P.L., Dahm, C.N., Gleick, P.H., Hairston, N.G., Jr., Jackson, R.B., Johnston, C.A., Richter, B.D., and Steinman, A.D., 2002, Meeting ecological and societal needs for freshwater: Ecological Applications, v. 12, no. 5, p. 1247–1260. [Also available at https://doi.org/10.1890/1051-0761(2002)012[1247:MEASNF]2.0.CO;2.]
Bower, L.M., Peoples, B.K., Eddy, M.C., and Scott, M.C., 2022, Quantifying flow–ecology relationships across flow regime class and ecoregions in South Carolina: Science of the Total Environment, v. 802, 14 p. [Also available at https://www.sciencedirect.com/science/article/pii/S0048969721047963.]
Canace, R.J., and Sugarman, P.J., 2009, Kirkwood-Cohansey water-table aquifer: New Jersey Geological Survey Information Circular, 4 p., accessed January 25, 2023, at https://www.nj.gov/dep/njgs/enviroed/infocirc/kirkwood-cohansey.pdf.
Carlisle, D.M., Wolock, D.M., and Meador, M.R., 2010, Alteration of streamflow magnitudes and potential ecological consequences—A multiregional assessment: Frontiers in Ecology and the Environment, v. 9, no. 5, p. 264–270. [Also available at https://doi.org/10.1890/100053.]
England, J.F., Jr., Cohn, T.A., Faber, B.A., Stedinger, J.R., Thomas, W.O., Jr., Veilleux, A.G., Kiang, J.E., and Mason, R.R., Jr., 2019, Guidelines for determining flood flow frequency —Bulletin 17C (ver. 1.1, May 2019): U.S. Geological Survey Techniques and Methods, book 4, chap. B5, 148 p. Accessed January 14, 2025, at https://doi.org/10.3133/tm4B5.
Falcone, J.A., Carlisle, D.M., Wolock, D.M., and Meador, M.R., 2010, GAGES—A stream gage database for evaluating natural and altered flow conditions in the conterminous United States—Ecological archives E091–045: Ecology, v. 91, no. 2, 1 p. [Also available at https://doi.org/10.1890/09-0889.1]
Freeman, M.C., Pringle, C.M., and Jackson, C.R., 2007, Hydrologic connectivity and the contribution of stream headwaters to ecological integrity at regional scales: Journal of the American Water Resources Association, v. 43, no. 1, p. 5–14. [Also available at https://doi.org/10.1111/j.1752-1688.2007.00002.x.]
Gordon, A.D., 2003, Simulation of the ground-water flow system in 1992, and simulated effects of projected ground-water withdrawals in 2020 in the New Jersey Coastal Plain: U.S. Geological Survey Water-Resources Investigations Report 03–4000, 61 p. [Also available at https://pubs.usgs.gov/wri/wri03-4000/pdf/WRIR03-4000.pdf.]
Helsel, D.R., Hirsch, R.M., Ryberg, K.R., Archfield, S.A., and Gilroy, E.J., 2020, Statistical methods in water resources: U.S. Geological Survey Techniques and Methods, book 4, chap. A3, 458 p., accessed December 12, 2024, at https://doi.org/10.3133/tm4a3. [Supersedes USGS Techniques of Water-Resources Investigations, book 4, chap. A3, version 1.1.]
Henriksen, J.A., Heasley, J., Kennen, J.G., and Nieswand, S.P., 2006, Users’ manual for the hydroecological integrity assessment process software (including the New Jersey assessment tools): U.S. Geological Survey Open-File Report 2006–1093, 72 p. [Also available at https://doi.org/10.3133/ofr20061093.]
Hoffman, J.L., and Rancan, H.L.L., 2009, The hydroecological integrity assessment process in New Jersey: New Jersey Geological Survey Technical Memorandum 09–3: Trenton, New Jersey, New Jersey Department of Environmental Protection, 61 p. [Also available at https://dep.nj.gov/wp-content/uploads/njgws/reports/tmemo/tm09-3.pdf.]
Hunchak-Kariouk, K., and Nicholson, R.S., 2001, Watershed contributions of nutrients and other nonpoint source contaminants to the Barnegat Bay-Little Egg Harbor estuary: Journal of Coastal Research, no. 32, p. 28–81. [Also available at https://www.jstor.org/stable/25736226.]
Kennen, J.G., and Cuffney, T.F., 2023, Unravelling the influence of landscape alteration from flow alteration on benthic macroinvertebrate assemblage response in the Delaware River Basin: Ecohydrology, v. 16, no. 2, 41 p. accessed January 21, 2025, at https://doi.org/10.1002/eco.2508.
Kennen, J.G., Henriksen, J.A., and Nieswand, S.P., 2007, Development of the hydroecological integrity assessment process for determining environmental flows for New Jersey streams: U.S. Geological Survey Scientific Investigations Report 2007–5206, 55 p. [Also available at https://pubs.usgs.gov/sir/2007/5206/pdf/sir2007-5206-508.pdf.]
Kennen, J.G., Kauffman, L.J., Ayers, M.A., Wolock, D.M., and Colarullo, S.J., 2008, Use of an integrated flow model to estimate ecologically relevant hydrologic characteristics at stream biomonitoring sites: Ecological Modelling, v. 211, nos. 1–2, p. 57–76. [Also available at https://doi.org/10.1016/j.ecolmodel.2007.08.014.]
Kennen, J.G., and Riskin, M.L., 2010, Evaluating effects of potential changes in streamflow regime on fish and aquatic-invertebrate assemblages in the New Jersey Pinelands: U.S. Geological Survey Scientific Investigations Report 2010–5079, 34 p [Also available at https://doi.org/10.3133/sir20105079.]
Kennen, J.G., Riskin, M.L., and Charles, E.G., 2014, Effects of streamflow reductions on aquatic macroinvertebrates—Linking groundwater withdrawals and assemblage response in southern New Jersey streams, USA: Hydrological Sciences Journal, v. 59, nos. 3–4, p. 545–561. [Also available at https://doi.org/10.1080/02626667.2013.877139.]
Kennen, J.G., Riskin, M.L., Reilly, P.A., and Colarullo, S.J., 2013, Method to support total maximum daily load development using hydrologic alteration as a surrogate to address aquatic life impairment in New Jersey streams: U.S. Geological Survey Scientific Investigations Report 2013–5089, 86 p. [Also available at https://doi.org/10.3133/sir20135089.]
Kennen, J.G., Riva-Murray, K., and Beaulieu, K.M., 2010, Determining hydrologic factors that influence stream macroinvertebrate assemblages in the northeastern US: Ecohydrology, v. 3, no. 1, p. 88–106. [Also available at https://doi.org/10.1002/eco.99.]
Kennen, J.G., Stein, E.D., and Webb, J.A., 2018, Evaluating and managing environmental water regimes in a water-scarce and uncertain future: Freshwater Biology, v. 63, no. 8, p. 733–737. [Also available at https://doi.org/10.1111/fwb.13104.]
Kennish, M.J., 2001, Physical description of the Barnegat Bay-Little Egg Harbor estuarine system: Journal of Coastal Research, no. 32, p. 13–17, accessed January 21, 2025, at https://www.jstor.org/stable/25736225.
Kiang, J.E., Flynn, K.M., Zhai, T., Hummel, P., and Granato, G.E., 2018, SWToolbox—A surface-water tool-box for statistical analysis of streamflow time series: U.S. Geological Survey Techniques and Methods, book 4, chap. A–11, 33 p., accessed January 21, 2025, at https://doi.org/10.3133/tm4A11.
Mathews, R., 2005, A six-step framework for ecologically sustainable water management: Journal of Contemporary Water Research & Education, v. 131, no. 1, p. 60–65. [Also available at https://doi.org/10.1111/j.1936-704X.2005.mp131001010.x.]
Mazor, R.D., May, J.T., Sengupta, A., McCune, K.S., Bledsoe, B.P., and Stein, E.D., 2018, Tools for managing hydrologic alteration on a regional scale—Setting targets to protect stream health: Freshwater Biology, v. 63, no. 8, p. 786–803, accessed January 21, 2025, at https://doi.org/10.1111/fwb.13062.
McHugh, A.R., Suro, T.P., Sullivan, S.L., and Williams, B.M., 2024, Streamflow characteristics and trends in New Jersey, water years 1903–2017: U.S. Geological Survey Scientific Investigations Report 2024–5099, 59 p., accessed January 13, 2025, at https://doi.org/10.3133/sir20245099.
Mills, M.J., Blodgett, D.L., Smith, J.D., and Kiesel, J., 2017, EflowStats—Hydrologic indicator and alteration stats (ver. 5.0.0, August 2017): Github software release, accessed March 21, 2023, at https://github.com/DOI-USGS/EflowStats.
Mueller, D.S., Wagner, C.R., Rehmel, M.S., Oberg, K.A., and Rainville, F., 2013, Measuring discharge with acoustic Doppler current profilers from a moving boat (ver. 2.0, December 2013): U.S. Geological Survey Techniques and Methods, book 3, chap. A22, 95 p., accessed January 14, 2025, at https://dx.doi.org/10.3133/tm3A22.
New Jersey Department of Environmental Protection Bureau of GIS, 1998, Land use/land cover of New Jersey 1986: New Jersey Department of Environmental Protection Bureau of GIS dataset, accessed November 27, 2024, at https://gisdata-njdep.opendata.arcgis.com/documents/njdep::land-use-land-cover-of-new-jersey-1986-download/about.
New Jersey Department of Environmental Protection Bureau of GIS, 2000a, Land use/land cover of New Jersey 1995–1997: New Jersey Department of Environmental Protection Bureau of GIS dataset, accessed November 27, 2024, at https://gisdata-njdep.opendata.arcgis.com/documents/njdep::land-use-land-cover-of-new-jersey-1995-1997-download/about.
New Jersey Department of Environmental Protection Bureau of GIS, 2000b, Watershed management areas in New Jersey: New Jersey Department of Environmental Protection Bureau of GIS dataset, accessed November 27, 2024, at https://njogis-newjersey.opendata.arcgis.com/datasets/njdep::watershed-management-areas-in-new-jersey/about.
New Jersey Department of Environmental Protection Bureau of GIS, 2010a, Land use 2002 for New Jersey generalized from 2007 LULC: New Jersey Department of Environmental Protection Bureau of GIS dataset, accessed November 27, 2024, at https://gisdata-njdep.opendata.arcgis.com/documents/njdep::land-use-2002-for-new-jersey-generalized-from-2007-lulc-download/about.
New Jersey Department of Environmental Protection Bureau of GIS, 2010b, Land use/land cover of New Jersey 2007 generalized: New Jersey Department of Environmental Protection Bureau of GIS dataset, accessed November 27, 2024, at https://gisdata-njdep.opendata.arcgis.com/documents/njdep::land-use-land-cover-of-new-jersey-2007-generalized-download/about.
New Jersey Department of Environmental Protection Bureau of GIS, 2015a, Coastline (2012) of New Jersey: New Jersey Department of Environmental Protection Bureau of GIS dataset, accessed November 27, 2024, https://njogis-newjersey.opendata.arcgis.com/datasets/njdep::coastline-2012-of-new-jersey/about.
New Jersey Department of Environmental Protection Bureau of GIS, 2015b, Land use/land cover of New Jersey 2012: New Jersey Department of Environmental Protection Bureau of GIS dataset, accessed November 27, 2024, at https://gisdata-njdep.opendata.arcgis.com/documents/njdep::land-use-land-cover-of-new-jersey-2012-download/about.
New Jersey Department of Environmental Protection Bureau of GIS, 2019, Land use/land cover of New Jersey 2015: New Jersey Department of Environmental Protection Bureau of GIS dataset, accessed November 27, 2024, at https://gisdata-njdep.opendata.arcgis.com/documents/njdep::land-use-land-cover-of-new-jersey-2015-download/about.
New Jersey Pinelands Commission, 2022, Pinelands area: New Jersey Geographic Information Network (NJGIN) Open Data dataset, accessed November, 27, 2024 at https://njogis-newjersey.opendata.arcgis.com/datasets/NJPines::pinelands-area/about.
Nicholson, R.S., and Watt, M.K., 1997, Simulation of ground-water flow in the unconfined aquifer system of the Toms River, Metedeconk River, and Kettle Creek basins, New Jersey: U.S. Geological Survey Water-Resources Investigations Report 97–4066, 100 p. [Also available at https://doi.org/10.3133/wri974066.]
Novak, R., Kennen, J.G., Abele, R.W., Baschon, C.F., Carlisle, D.M., Dlugolecki, L., Eignor, D.M., Flotemersch, J.E., Ford, P., Fowler, J., Galer, R., Gordon, L.P., Hansen, S.E., Herbold, B., Johnson, T.E., Johnston, J.M., Konrad, C.P., Leamond, B., and Seelbach, P.W., 2016, Final EPA-USGS technical report—Protecting aquatic life from effects of hydrologic alteration: U.S. Environmental Protection Agency Report 822–R–16–007 and U.S. Geological Survey Scientific Investigations Report 2016–5164 (prepared by USGS and EPA), 155 p., accessed January 14, 2025, at https://www.epa.gov/sites/default/files/2016-12/documents/final-aquatic-life-hydrologic-alteration-report.pdf.
Olden, J.D., and Poff, N.L., 2003, Redundancy and the choice of hydrologic indices for characterizing streamflow regimes: River Research and Applications, v. 19, no. 2, p. 101–121. [Also available at https://doi.org/10.1002/rra.700.]
Peek, R., Irving, K., Yarnell, S.M., Lusardi, R., Stein, E.D., and Mazor, R., 2022, Identifying functional flow linkages between stream alteration and biological stream condition indices across California: Frontiers in Environmental Science, v. 9, article 790667, 14 p., accessed January 21, 2025, at https://doi.org/10.3389/fenvs.2021.790667.
Poff, N.L., Allan, J.D., Bain, M.B., Karr, J.R., Prestegaard, K.L., Richter, B.D., Sparks, R.E., and Stromberg, J.C., 1997, The natural flow regime—A paradigm for river conservation and restoration: Bioscience, v. 47, no. 11, p. 769–784. [Also available ] at https://doi.org/10.2307/1313099.]
Poff, N.L., Richter, B.D., Arthington, A.H., Bunn, S.E., Naiman, R.J., Kendy, E., Acreman, M., Apse, C., Bledsoe, B.P., Freeman, M.C., Henriksen, J., Jacobson, R.B., Kennen, J.G., Merritt, D.M., O’Keeffe, J.H., Olden, J.D., Rogers, K., Tharme, R.E., and Warner, A., 2010, The ecological limits of hydrologic alteration (ELOHA)—A new framework for developing regional environmental flow standards: Freshwater Biology, v. 55, no. 1, p. 147–170. [Also available at https://doi.org/10.1111/j.1365-2427.2009.02204.x.]
Poff, N.L., and Ward, J.V., 1989, Implications of streamflow variability and predictability for lotic community structure—A regional analysis of streamflow patterns: Canadian Journal of Fisheries and Aquatic Sciences, v. 46, no. 10, p. 1805–1818. [Also available at https://doi.org/10.1139/f89-228.]
Power, M.E., Dietrich, W.E., and Finlay, J.C., 1996, Dams and downstream aquatic biodiversity—Potential food web consequences of hydrologic and geomorphic change: Environmental Management, v. 20, no. 6, p. 887–895. [Also available at https://doi.org/10.1007/BF01205969.]
R Core Team, 2019, R—A Language and environment for statistical computing, version 3.6.2 (Dark and Stormy Night): R Foundation for Statistical Computing software release, accessed March 21, 2023, at https://www.R-project.org.
Rantz, S.E., and others, 1982, Measurement and computation of streamflow—Computation of discharge: U.S. Geological Survey Water-Supply Paper 2175, v. 2, p. 285–631. [Also available at https://doi.org/10.3133/wsp2175.]
Reice, S.R., Wissmar, R.C., and Naiman, R.J., 1990, Disturbance regimes, resilience, and recovery of animal communities and habitats in lotic ecosystems: Environmental Management, v. 14, no. 5, p. 647–659. [Also available at https://doi.org/10.1007/BF02394715.]
Reice, S.R., 1994, Nonequilibrium determinants of biological community structure: American Scientist, v. 82, p. 424–435. [Also available at https://www.jstor.org/stable/29775279.]
Resh, V.H., Brown, A.V., Covich, A.P., Gurtz, M.E., Li, H.W., Minshall, G.W., Reice, S.R., Sheldon, A.L., Wallace, J.B., and Wissmar, R.C., 1988, The role of disturbance in stream ecology: Journal of the North American Benthological Society, v. 7, no. 4, p. 433–455. [Also available at https://doi.org/10.2307/1467300.]
Rice, J.S., Emanuel, R.E., Vose, J.M., and Nelson, S.A.C., 2015, Continental U.S. streamflow trends from 1940 to 2009 and their relationships with watershed spatial characteristics: Water Resources Research, v. 51, no. 8, p. 6262–6275, accessed January 21, 2025, at https://doi.org/10.1002/2014WR016367.
Richter, B.D., Baumgartner, J.V., Powell, J., and Braun, D.P., 1996, A method for assessing hydrologic alteration within ecosystems: Conservation Biology, v. 10, no. 4, p. 1163–1174. [Also available at https://doi.org/10.1046/j.1523-1739.1996.10041163.x.]
Richter, B.D., Baumgartner, J.V., Wigington, R., and Braun, D.P., 1997, How much water does a river need?: Freshwater Biology, v. 37, no. 1, p. 231–249. [Also available at https://doi.org/10.1046/j.1365-2427.1997.00153.x.]
Riggs, H.C., 1972, Low-flow investigations: Techniques of Water-Resources Investigations of the United States Geological Survey, book 4, chap. B1, 18 p., accessed November 4, 2024, at https://pubs.usgs.gov/twri/twri4b1/pdf/twri_4-B1_a.pdf.
Roy, A.H., Freeman, M.C., Freeman, B.J., Wenger, S.J., Ensign, W.E., and Meyer, J.L., 2005, Investigating hydrologic alteration as a mechanism of fish assemblage shifts in urbanizing streams: Journal of the North American Benthological Society, v. 24, no. 3, p. 656–678, accessed January 21, 2025, at https://doi.org/10.1899/04-022.1.
Singh, N.K., and Basu, B.G., 2022, The human factor in seasonal streamflows across natural and managed watersheds of North America: Nature Sustainability, v. 5, p. 397–405, accessed January 21, 2025, at https://doi.org/10.1038/s41893-022-00848-1.
Stanford, J.A., Ward, J.V., Liss, W.J., Frissell, C.A., Williams, R.N., Lichatowich, J.A., and Coutant, C.C., 1996, A general protocol for restoration of regulated rivers: Regulated Rivers—Research & Management, v. 12, nos. 4–5, p. 391–413, accessed January 21, 2025, at https://onlinelibrary.wiley.com/doi/10.1002/(SICI)1099-1646(199607)12:4/5%3C391::AID-RRR436%3E3.0.CO;2-4.
Tasker, G.D., 1987, A comparison of methods for estimating low flow characteristics of streams: Journal of the American Water Resources Association, v. 23, no. 6, p. 1077–1083, accessed January 21, 2025, at https://doi.org/10.1111/j.1752-1688.1987.tb00858.x.
Turnipseed, D.P., and Sauer, V.B., 2010, Discharge measurements at gaging stations: U.S. Geological Survey Techniques and Methods book 3, chap. A8, 87 p. [Also available at https://doi.org/10.3133/tm3A8.]
Turner, M.G., 1990, Spatial and temporal analysis of landscape patterns: Landscape Ecology, v. 4, no. 1, p. 21–30, accessed January 21, 2025, at https://doi.org/10.1007/BF02573948.
U.S. Environmental Protection Agency, 2019, BASINS 4.5 (Better assessment science integrating point & non-point sources) modeling framework: Athens, Georgia, National Exposure Research Laboratory, 779 p. Accessed January 14, 2025, at https://www.epa.gov/hydrowq/basins-framework-and-features#:~:text=BASINS%20enables%20users%20to%20efficiently%20access%20nationwide%20environmental,wa ter%20quality%20models%20within%20a%20single%20GIS%20format.
U.S. Geological Survey, 2019, StreamStats version 4.11.1: U.S. Geological Survey software release, accessed January 3, 2023, at https://streamstats.usgs.gov/ss/.
U.S. Geological Survey, 2023, Staged products directory [NHD_H_0204Shape.zip]: U.S. Geological Survey database, accessed December 12, 2024, at https://prd-tnm.s3.amazonaws.com/index.html?prefix=StagedProducts/Hydrography/NHD/HU4/Shape/.
U.S. Geological Survey, 2024, USGS water data for the Nation: U.S. Geological Survey National Water Information System database, accessed July 14, 2023, at http://doi.org/10.5066/F7P55KJN.
Vogel, R.M., and Fennessey, N.M., 1995, Flow duration curves II—A review of applications in water resources planning: Journal of the American Water Resources Association, v. 31, no. 6, p. 1029–1039. [Also available at https://doi.org/10.1111/j.1752-1688.1995.tb03419.x.]
Wada, Y., van Beek, L.P.H., Wanders, N., and Bierkens, M.F.P., 2013, Human water consumption intensifies hydrological drought worldwide: Environmental Research Letters, v. 8, no. 3, 14 p. [Also available at https://doi.org/10.1088/1748-9326/8/3/034036.]
Watt, M.K., Johnson, M.L., and Lacombe, P.J., 1994, Hydrology of the unconfined aquifer system, Toms River, Metedeconk River, and Kettle Creek Basins, New Jersey, 1987-90: U.S. Geological Survey, Water-Resources Investigations Report 93-4110, 10 maps on 5 plates. [Also available at https://doi.org/10.3133/wri934110.]
Ziegeweid, J.R., Johnson, G.D., Krall, A.L., Fitzpatrick, K., and Levin, S.B., 2022, Quantifying relations between altered hydrology and fish community responses for streams in Minnesota: Ecological Processes, v. 11, no. 41, 25 p. [Also available at https://doi.org/10.1186/s13717-022-00383-z.]
Zorn, T.G., Seelbach, P.W., and Rutherford, E.S., 2012, A regional‐scale habitat suitability model to assess the effects of flow reduction on fish assemblages in Michigan streams: Journal of the American Water Resources Association, v. 48, no. 5, p. 871–895. [Also available at https://doi.org/10.1111/j.1752-1688.2012.00656.x.]
Appendix 1. Additional Plots for Select Flow Metrics
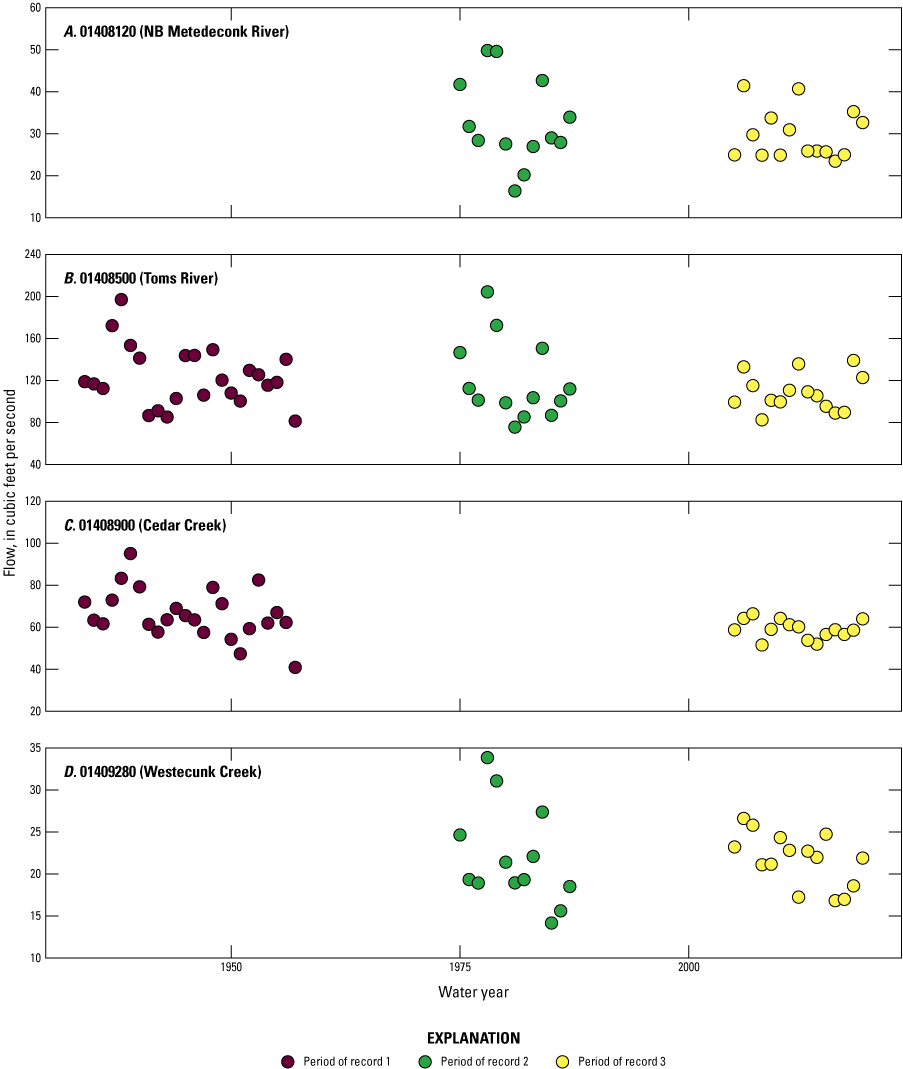
Scatterplot showing the minimum 90-day moving average flow (DL5) by period of record and site.
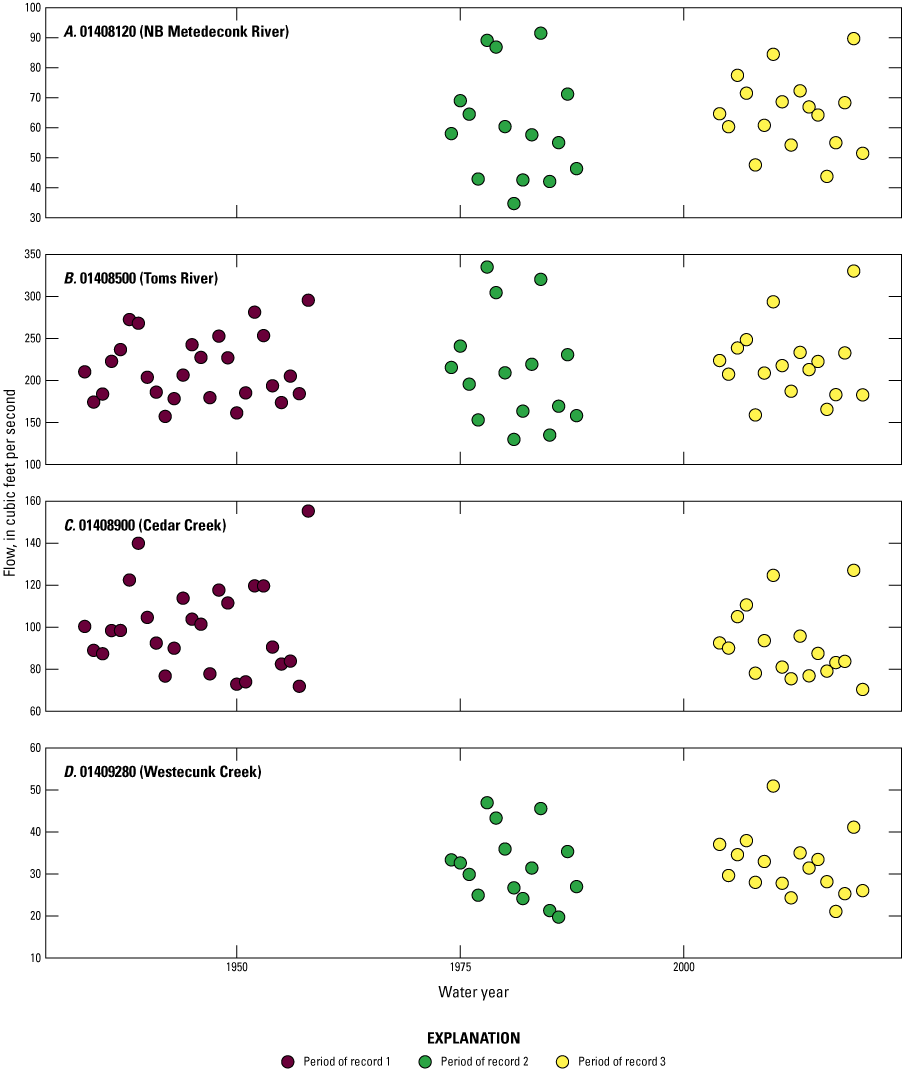
Scatterplot showing the daily mean streamflow (MA1) by period of record and site.
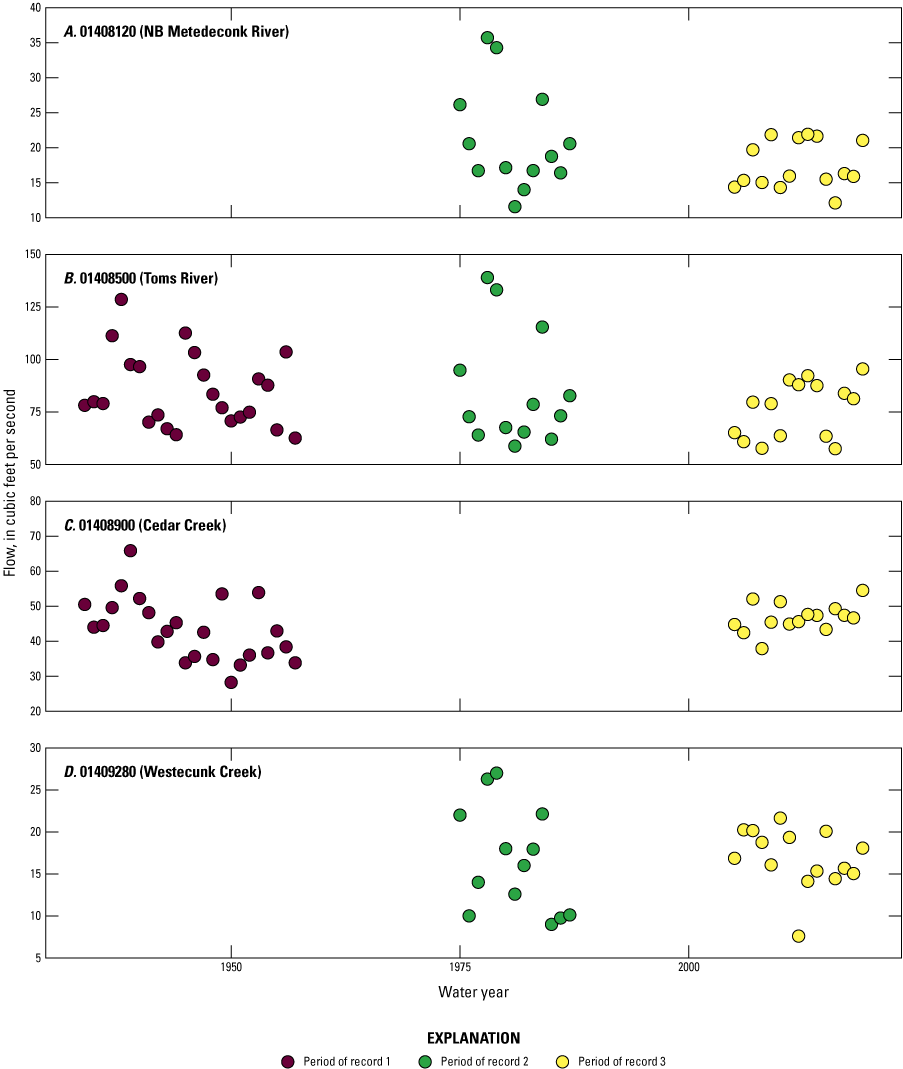
Scatterplot showing the minimum 7-day moving average flow (DL3) by period of record and site.
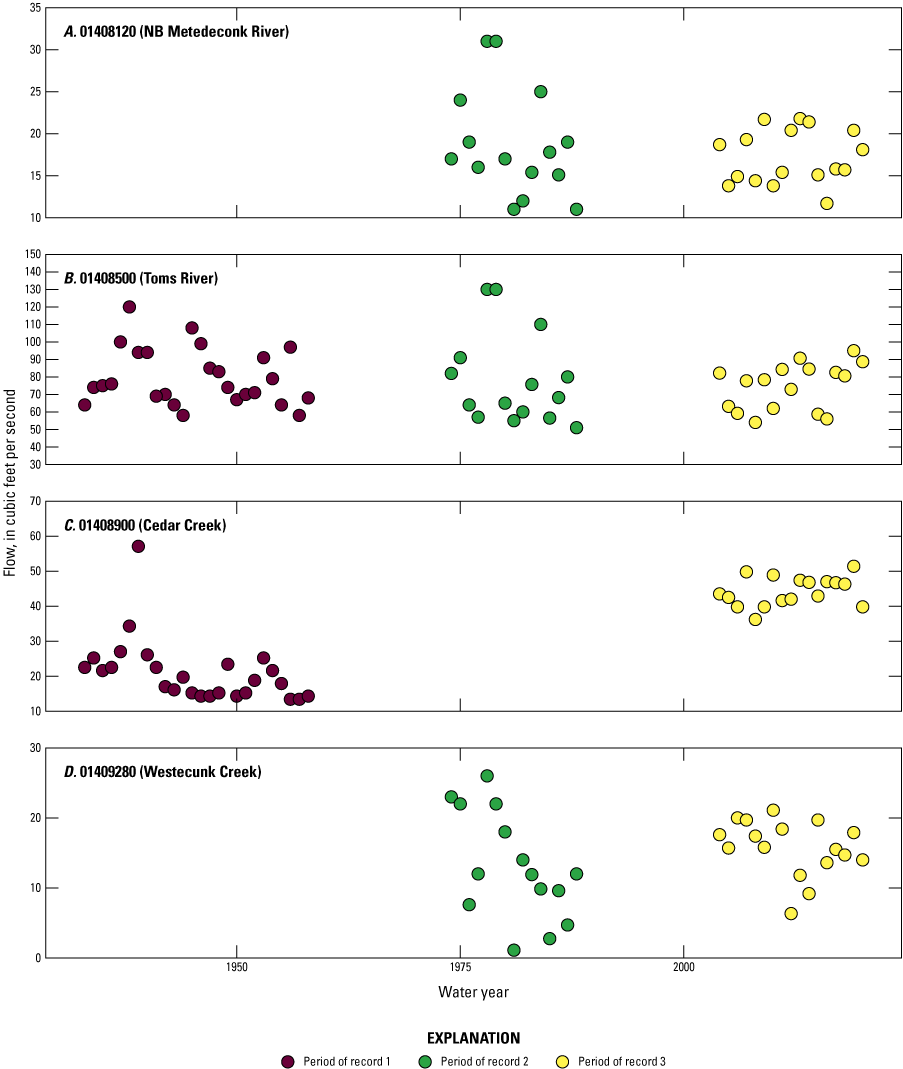
Scatterplot showing the annual minimum daily flow (DL1) by period of record and site.
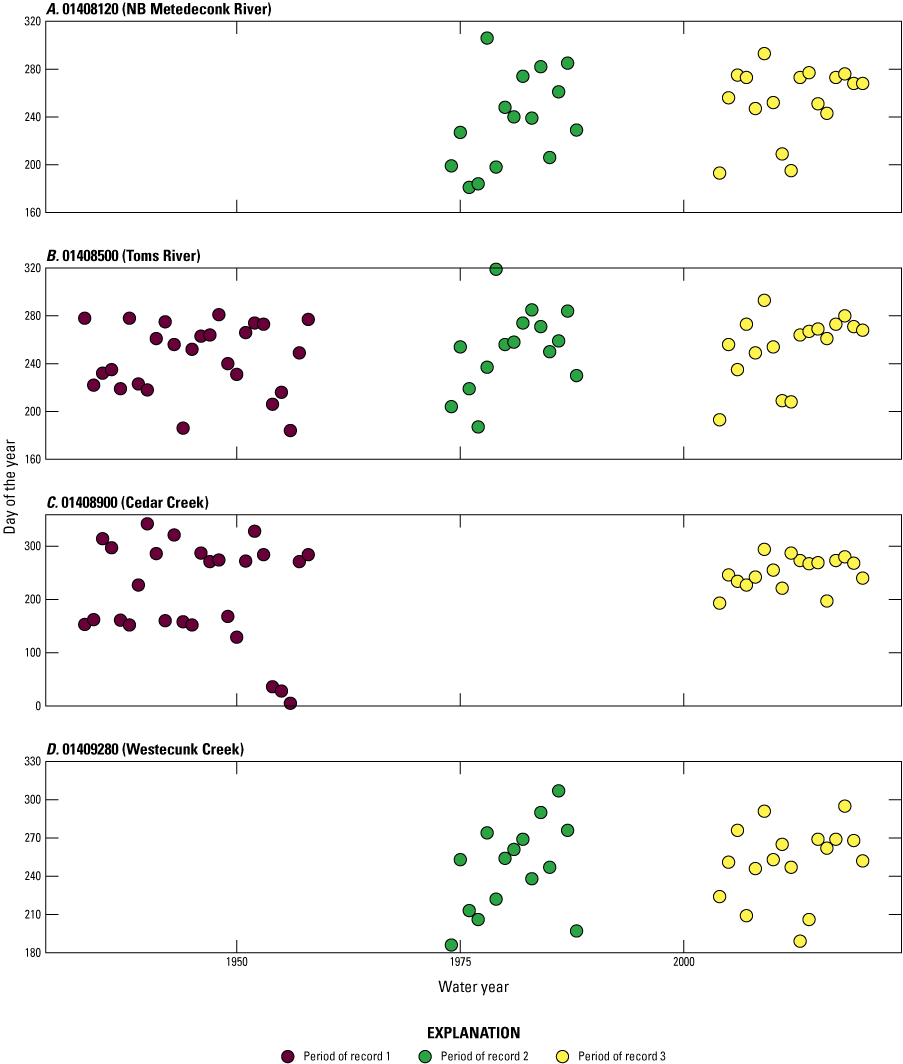
Scatterplot showing the date of the annual minimum flow (TL1) by period of record and site.
Datums
Vertical coordinate information is referenced to the [insert datum name (and abbreviation) here; for example, North American Vertical Datum of 1988 (NAVD 88)].
Horizontal coordinate information is referenced to the [insert datum name (and abbreviation) here; for example, North American Datum of 1983 (NAD 83)].
Supplemental Information
A water year is the 12-month period from October 1 through September 30 of the following year and is designated by the calendar year in which it ends.
Abbreviations
BB
Barnegat Bay
BB-LEH
Barnegat Bay-Little Egg Harbor
BBP
Barnegat Bay Partnership
CCMP
Comprehensive Conservation and Management Plan
ELOHA
Ecological Limits of Hydrologic Alteration
HIP
Hydroecological Integrity Assessment Process
LU/LC
land use/land cover
NB
North Branch
POR
period of record
USGS
U.S. Geological Survey
Disclaimers
Any use of trade, firm, or product names is for descriptive purposes only and does not imply endorsement by the U.S. Government.
Although this information product, for the most part, is in the public domain, it also may contain copyrighted materials as noted in the text. Permission to reproduce copyrighted items must be secured from the copyright owner.
Suggested Citation
Wieben, C.M., Kennen, J.G., and Suro, T.P., 2025, Determining low-flow conditions at select streams to Barnegat Bay-Little Egg Harbor as the first step towards the development of ecological-flow targets: U.S. Geological Survey Scientific Investigations Report 2024–5096, 39 p., https://doi.org/10.3133/sir20245096.
ISSN: 2328-0328 (online)
Study Area
| Publication type | Report |
|---|---|
| Publication Subtype | USGS Numbered Series |
| Title | Determining low-flow conditions at select streams to Barnegat Bay-Little Egg Harbor as the first step towards the development of ecological-flow targets |
| Series title | Scientific Investigations Report |
| Series number | 2024-5096 |
| DOI | 10.3133/sir20245096 |
| Publication Date | March 11, 2025 |
| Year Published | 2025 |
| Language | English |
| Publisher | U.S. Geological Survey |
| Publisher location | Reston, VA |
| Contributing office(s) | New Jersey Water Science Center |
| Description | vii, 39 p. |
| Country | United States |
| State | New Jersey |
| Other Geospatial | Barnegat Bay-Little Egg Harbor watershed |
| Online Only (Y/N) | Y |
| Additional Online Files (Y/N) | N |