Use of Continuous Water-Quality Time-Series Data to Compute Total Phosphorus Concentrations and Loads for the Missouri River at St. Joseph and Hermann, Missouri, 2007–22
Links
- Document: Report (6.4 MB pdf) , HTML , XML
- Dataset: USGS National Water Information System database - USGS water data for the Nation
- Data Release: USGS data release - Data and model archive summaries to support use of continuous water-quality time-series data to compute total phosphorus concentrations and loads for the Missouri River at St. Joseph and Hermann, Missouri, 2007–22
- NGMDB Index Page: National Geologic Map Database Index Page (html)
- Download citation as: RIS | Dublin Core
Acknowledgments
The author would like to thank the Missouri Department of Natural Resources for providing support for this project.
The author would like to acknowledge the staff from the U.S. Geological Survey Central Midwest Science Center who supported the project by assisting with data collection, administration, and technical reviews.
Abstract
In support of Missouri’s Nutrient Loss Reduction Strategy, which was created to reduce the nutrient contamination of Missouri’s waterways from point and nonpoint sources, total phosphorus concentrations and loads were computed for the Missouri River at St. Joseph, Missouri, streamgage (U.S. Geological Survey station 06818000) and the Missouri River at Hermann, Mo., streamgage (U.S. Geological Survey station 06934500) for October 2007 to September 2022 using surrogate models and continuous turbidity sensor data. To obtain a more complete total phosphorus record for the study period, LOAD ESTimator (LOADEST) regression models using flow were used when turbidity sensor data were unavailable to estimate daily total phosphorus loads. This report presents the methods and results for the computed total phosphorus concentrations, loads, and yields for the two study sites on the Missouri River. With continued data collection and ongoing model evaluation and maintenance, the surrogate models may be useful into the future for computing total phosphorus concentrations and loads.
Daily mean total phosphorus concentrations calculated using a surrogate model at the Missouri River at St. Joseph, Mo., streamgage during the 15-year study period (water years 2008 through 2022) ranged from 0.104 to 4.56 milligrams per liter (mg/L; median of 0.272 mg/L), and computed total phosphorus daily loads (with gaps in the daily record filled using the LOADEST regression model) ranged from 5.19 to 1,760 tons per day (tons/d; median of 36.5 tons/d). Annual loads ranged from 9,570 tons in water year 2022 to 50,500 tons in water year 2019. The total load for the study period was 437,000 tons.
For the Missouri River at Hermann, Mo., streamgage during the same 15-year study period, daily mean total phosphorus concentrations, calculated using surrogate models applied to low and high turbidity values, ranged from 0.183 to 1.97 mg/L (median of 0.319 mg/L), and computed total phosphorus daily loads (with gaps in the daily record filled using the LOADEST regression model) ranged from 12.7 to 1,970 tons/d (median of 76.8 tons/d). Annual loads ranged from 22,600 tons in water year 2022 to 101,000 tons in water year 2019. The total load for the study period was 833,000 tons, which is nearly twice that at the Missouri River at St. Joseph, Mo., streamgage.
Introduction
The U.S. Geological Survey (USGS) and the Missouri Department of Natural Resources collaborated to study total phosphorus concentrations and loads in the Missouri River at St. Joseph, Missouri, streamgage (USGS site number 06818000; hereinafter referred to as the “St. Joseph study site”), and the Missouri River at Hermann, Mo., streamgage (USGS site number 06934500; hereinafter referred to as the “Hermann study site”; fig. 1). The Missouri River is 2,341 miles long, making it the longest river in North America, and drains more than 500,000 square miles (Missouri Department of Conservation, 2023). The Missouri River drains 426,500 square miles at the St. Joseph study site, which is about 82 percent of the drainage area of the downstream Hermann study site (522,500 square miles; table 1; U.S. Geological Survey, 2023).
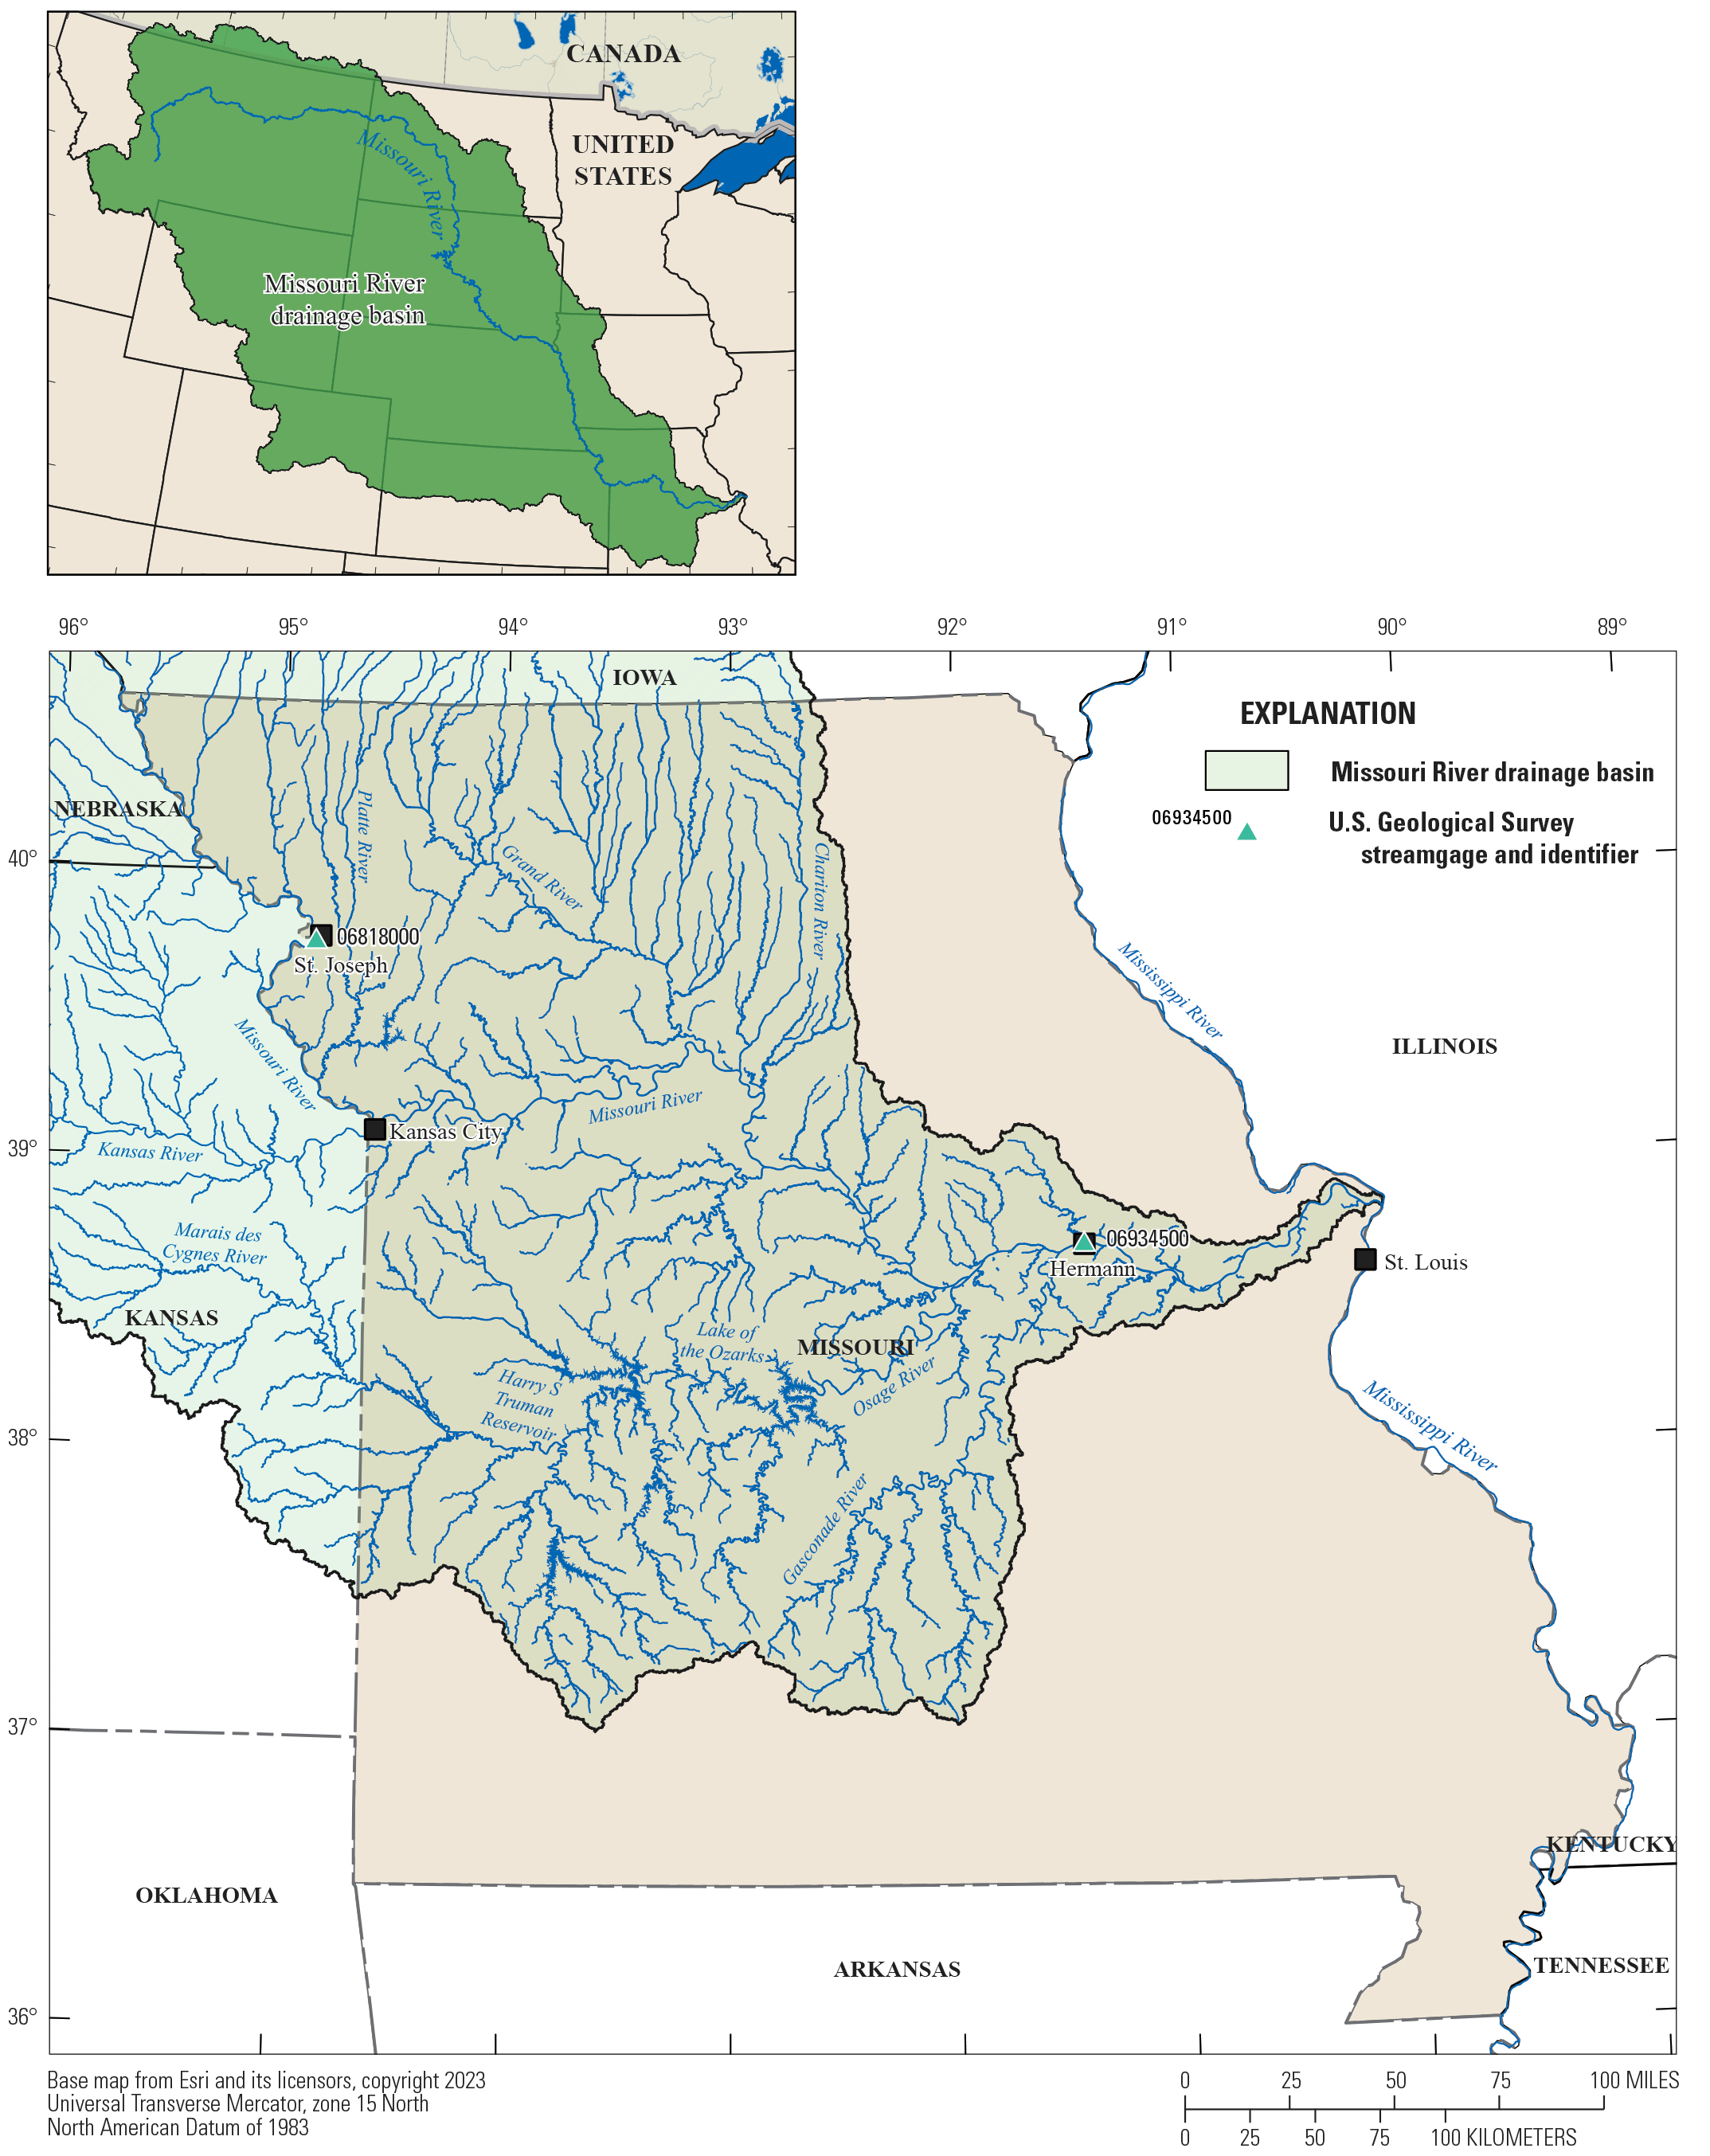
Study sites and location of the Missouri River Basin.
Table 1.
Location information for the study sites at the Missouri River at St. Joseph, Missouri, streamgage (U.S. Geological Survey station 06818000) and the Missouri River at Hermann, Mo., streamgage (U.S. Geological Survey station 06934500).[Data are from the U.S. Geological Survey National Water Information System database (U.S. Geological Survey, 2023). Coordinates are given in decimal degrees. USGS, U.S. Geological Survey; mi2, square mile]
| USGS site number (fig. 1) |
Station name | Latitude | Longitude | Drainage area (mi2) |
County | Period of record used in this study |
|---|---|---|---|---|---|---|
| 06818000 | Missouri River at St. Joseph, Missouri | 39.75325 | −94.8568333 | 426,500 | Buchanan County | October 2007–September 2022 |
| 06934500 | Missouri River at Hermann, Missouri | 38.70980556 | −91.4385 | 522,500 | Montgomery County | October 2007–September 2022 |
Like many Midwestern States, Missouri has developed nutrient loss reduction strategies. The Missouri Nutrient Loss Reduction Strategy (NLRS) calls for reductions in nutrient inputs to Missouri’s waterbodies and ultimately the Gulf of Mexico (Missouri Department of Natural Resources, 2020). The Missouri NLRS aims to reduce the nutrient contamination of Missouri’s waterways from point and nonpoint sources (Missouri Department of Natural Resources, 2020) and has a stated goal to reduce total nitrogen and total phosphorus 20 percent by 2025 and 45 percent by 2035. In an effort to control total phosphorus contamination from point sources, the Missouri Department of Natural Resources imposed a new rule for major wastewater treatment plants in 2023. The new total phosphorus limit of 1 milligram per liter (mg/L) as an annual mean was based on design flow applied to municipalities with wastewater treatment plant outflows greater than 1 million gallons per day, as well as major industrial facilities (Missouri Department of Natural Resources, 2023). Wastewater treatment plants can also meet the new requirement through a 75-percent overall reduction in influent to effluent or effluent to effluent of total phosphorus. Despite these regulatory changes to point sources, targeting reductions of nonpoint nitrogen and phosphorus contributions remains a challenge because of widespread potential nutrient sources on the landscape and the variable nature of the inputs dependent on the season and moisture conditions.
The Missouri Department of Natural Resources expends considerable resources on the water-quality monitoring of streams throughout the State. Advances in technology have resulted in the ability to directly measure some nutrients, such as nitrate, in real time using direct-read sensors. However, technology for directly analyzing total phosphorus concentrations in real time has not advanced as quickly. Total phosphorus technologies are more difficult to automate because they require a digestion step, which is challenging to implement in a field setting (Peake, 2022).
Comparisons of continuous nitrate sensor data to discrete nutrient samples indicate that fixed frequency discrete sampling can often miss short-term peaks in nutrient concentrations (Warner and others, 2013). Collection of discrete samples does not represent the variability in total phosphorus patterns in rivers and streams (Jones and others, 2011), as indicated by continuous sensor measurements. The St. Joseph and Hermann study sites have continuous nitrate sensors installed, which enables continuous monitoring of nitrate concentrations and more accurate calculations of nitrogen loads and changes over time. However, without real-time total phosphorus information, a large component of nutrient transport is missing. Because of the difficulty in monitoring phosphorus concentrations in real time, surrogate relations with turbidity, which are specific to each site, are often used to estimate total phosphorus concentrations. The use of the surrogate relation between turbidity and total phosphorus is well established (Jones and others, 2011; Schenk and others, 2016; Garrett, 2019, 2021a, 2021b), with a strong physical relation between total phosphorus loads and sediment-bound phosphorus (Garrett, 2012, 2019). The relation between total phosphorus and streamflow also has been used to supplement concentration and load estimates when turbidity data are missing (Robertson and others, 2018).
To estimate total phosphorus concentrations and loads at the St. Joseph and Herman study sites, turbidity-surrogate models were developed for each site. Because turbidity is dependent on the source of the suspended sediment, surrogate models are site-specific (Grayson and others, 1996; Christensen and others, 2002). When turbidity data were unavailable, streamflow data and the LOAD ESTimator (LOADEST) models were used to estimate daily loads of total phosphorus, and these estimates were used to fill the gaps in the record (Runkel and others, 2004). The complete daily total phosphorus record was used to calculate annual loads and yields of total phosphorus for the study period (water years 2008 through 2022; a water year is the period from October 1 to September 30 and is designated by the year in which it ends). With ongoing model evaluation and maintenance, the turbidity-surrogate models may be useful into the future for total phosphorus concentration and load estimations.
The purpose of this report is to describe the surrogate regression models developed to compute total phosphorus concentrations and loads at the St. Joseph and Hermann study sites for the period starting in October 2007. Continuous sensor data (15-minute interval) and sample results for the study period (water year 2008 through water year 2022) are summarized. The report also describes the use of streamflow data and LOADEST models to estimate daily total phosphorus loads when turbidity data are unavailable. The report summarizes the resulting concentrations, loads, and yields for the two study sites.
Methods
Both the St. Joseph and Hermann sites have streamgages and continuous water-quality stations that transmit measurements made every 15 minutes. Water-quality sensor data, including dissolved oxygen, specific conductance, temperature, and turbidity, are available at both study sites beginning in October 2007. Fluorescent dissolved organic matter data are also currently available at the Hermann study site. Continuous nitrate data are available, beginning in 2021 for the St. Joseph study site, and beginning in 2015 for the Hermann study site. Discrete water samples collected during water years 2008 through 2022 (October 1, 2007, through September 30, 2022) were used for calibration of the turbidity-based surrogate regression models to compute total phosphorus concentrations and loads. When less than 48 percent of the continuous total phosphorus load for the day (owing to missing turbidity data) was available or when turbidity values were outside of the specified range of the surrogate models, streamflow data were used with the LOADEST regression models to estimate daily total phosphorus loads for a more complete load record (Runkel and others, 2004).
Continuous Water-Quality Data Collection
A Yellow Springs Instruments (YSI) EXO turbidity sensor, installed on a YSI EXO multiparameter water-quality sonde, was used to monitor turbidity in formazin nephelometric units at both study sites. The sondes were deployed within a protective polyvinyl chloride pipe with holes cut in it to allow for water flow around the sensors. The sonde at the St. Joseph study site is deployed on the left bank at the downstream abutment of the St. Joseph and Grand Island Railroad Bridge in St. Joseph, Missouri (not shown). The associated gage house that contains the signal transmission equipment is mounted on the bridge railing. The sonde at the Hermann study site is deployed along the bridge pier located on the State Highway 19 bridge at Hermann, Mo. (not shown), and the associated gage house containing the signal transmission equipment is located on the downstream side of the bridge. During some years, sonde deployments were seasonal owing to low water and ice conditions. Data were recorded every 15 minutes and transmitted hourly by way of satellite telemetry. Maintenance and calibration of water-quality sensors followed methods described in Wagner and others (2006). The turbidity sensor was calibrated using a three-point calibration and YSI’s calibration standards. The sonde was serviced approximately every 6 to 8 weeks, which included cleaning of the sonde and calibration checks. Missing periods of record are due to equipment failures, biofouling, and (or) data corrections that exceeded correction criteria (Wagner and others, 2006). All continuous turbidity data are available in the USGS National Water Information System (NWIS) database (U.S. Geological Survey, 2023).
Water Sample Collection and Analysis
Discrete water-quality samples were collected as part of a long-term routine monitoring at both sites funded by the USGS and Missouri Department of Natural Resources. The St. Joseph study site is part of the Missouri Department of Natural Resources and USGS cooperative Ambient Water-Quality Monitoring Network, which is a network of river and stream sites across Missouri that are monitored to assess water resources in Missouri (Markland, 2023). The Hermann study site is part of the USGS National Water Quality Network (NWQN), which is a network of 110 sampling sites established to monitor current water-quality conditions and trends in rivers and streams across the Nation and over time (Riskin and Lee, 2021). Since October 2007, an average of 12 samples per year were collected at the St. Joseph study site and 13 samples per year were collected at the Hermann study site. Sampling was completed according to procedures described by the “National Field Manual for the Collection of Water-Quality Data” (U.S. Geological Survey, variously dated). Samples were analyzed for total phosphorus and other constituents by the USGS National Water Quality Laboratory. All discrete sample data are available in NWIS (U.S. Geological Survey, 2023).
Surrogate Model Development
Surrogate models used simple ordinary least squares regression to relate total phosphorus concentrations in discrete samples to continuous turbidity data. Model development was completed using the statistical software R (R Core Team, 2024) in RStudio software (R version 4.1.3; RStudio Team, 2024). The calibration datasets included discrete total phosphorus concentration matched to the nearest continuous turbidity value. For each study site, a surrogate model for the logarithm (log)-transformed total phosphorous concentration was fitted to the log-transformed turbidity because log-transformation resulted in a better fit of the data. The model form was selected by comparing the Akaike information criterion (AIC) of several potential models (Helsel and others, 2020).
Model residuals were investigated for potential outliers exhibiting undue influence on the models. Plots were evaluated for low residual variance, normality and homoscedasticity of residuals, and a ratio of mean observed (sampled) concentration to computed (simulated) concentration near 1.0. The log-transformed total phosphorus values were retransformed back to the original units to allow for direct calculation of total phosphorus concentrations from continuous turbidity values. Because of the potential bias introduced to the calculated total phosphorus concentration by retransformation, a nonparametric smearing bias-correction factor was applied (Duan, 1983). To compute total phosphorus loads in U.S. short tons per day, the continuous computed total phosphorus concentrations (in milligrams per liter) are multiplied by continuous streamflow (in cubic feet per second) and a unit conversion factor. The daily loads are summarized as the daily mean of the continuous total phosphorus loads and are available in NWIS (U.S. Geological Survey, 2023).
With continued discrete sample collection and continuous turbidity monitor operation, the surrogate models may be used beyond the study period that was used to develop them. Collection of samples throughout the year and during a variety of streamflow conditions along with an annual validation of the regression models to ensure the relation between turbidity and total phosphorus has not significantly changed is warranted. The annual model validation may include plotting new observations with the original model calibration dataset, recomputing the regression coefficients, and determining whether the recomputed coefficients are significantly different than the original coefficients (using an analysis of covariance and probability value significance level of 0.05). The regression models would benefit from continued refinement by the addition of the new data collected each year (Rasmussen and others, 2009).
When a continuous turbidity record was unavailable or when turbidity values were outside of the specified range of the surrogate models, streamflow data were used with the LOADEST model to estimate daily loads of total phosphorus (Runkel and others, 2004). Initially, an alternate surrogate model for each study site was explored for use when a turbidity record was unavailable. Log-transformed streamflow data were fitted to log-transformed total phosphorus concentrations (fig. 1.1). Because of the poor fit between streamflow and total phosphorus concentrations (adjusted coefficient of determination [R2a] of 0.243 for the St. Joseph study site and 0.453 for the Hermann study site), the alternate surrogate models for the calculation of continuous total phosphorus concentrations were not further pursued. Rather, the USGS rloadest package (Lorenz and others, 2024), which is the R version of the LOADEST program of Runkel and others (2004), was used to select a streamflow-based model to fill in the gaps of the computed daily total phosphorus load record. This process provided daily loads for days when loads from the turbidity-surrogate model were missing. The rloadest package assists the user in developing an appropriate regression model using explanatory variables that include various functions of streamflow and decimal time for the estimation of total phosphorus concentration and load (Runkel and others, 2004). The input variables for the LOADEST models included total phosphorus concentrations, streamflow, time, and seasonality. Coefficients with probability values less than 0.05 were considered significant. The best predefined model generated using LOADEST was selected based on the AIC value and the comparison of the observed and estimated loads across the range of values.
Water-Quality Sample and Sensor Data
The turbidity values in the calibration dataset well represented the time-series dataset for the St. Joseph study site, with the turbidity values used in the surrogate model calibration dataset ranging from 2.6 to 1,370 formazin nephelometric units (FNUs; median of 44 FNUs; table 2). The time-series (15-minute) turbidity data for the entire study period ranged from 1 to 1,750 FNUs (median of 48 FNUs). Approximately 0.08 percent of the time-series data were below the minimum turbidity in the calibration dataset, and only 0.05 percent of the time-series data were above the maximum turbidity in the calibration dataset (fig. 2). The total phosphorus concentrations ranged from 0.06 to 4.28 mg/L (median of 0.28 mg/L; table 2). The associated streamflows for the calibration dataset ranged from 22,500 to 228,000 cubic feet per second (ft3/s; median of 46,200 ft3/s), whereas the time-series streamflow data ranged from 16,800 to 317,000 ft3/s (median of 46,200 ft3/s; table 2; fig. 1.2). The input data for rloadest had similar ranges of total phosphorus concentrations and associated streamflows, when compared to the turbidity-surrogate calibration dataset (table 3).
Table 2.
Summary of turbidity-surrogate calibration data and continuous data, Missouri River at St. Joseph and Hermann, Missouri.[Data are from the U.S. Geological Survey National Water Information System database (U.S. Geological Survey, 2023). mg/L as P, milligram per liter as phosphorus; FNU, formazin nephelometric unit; ft3/s, cubic feet per second]
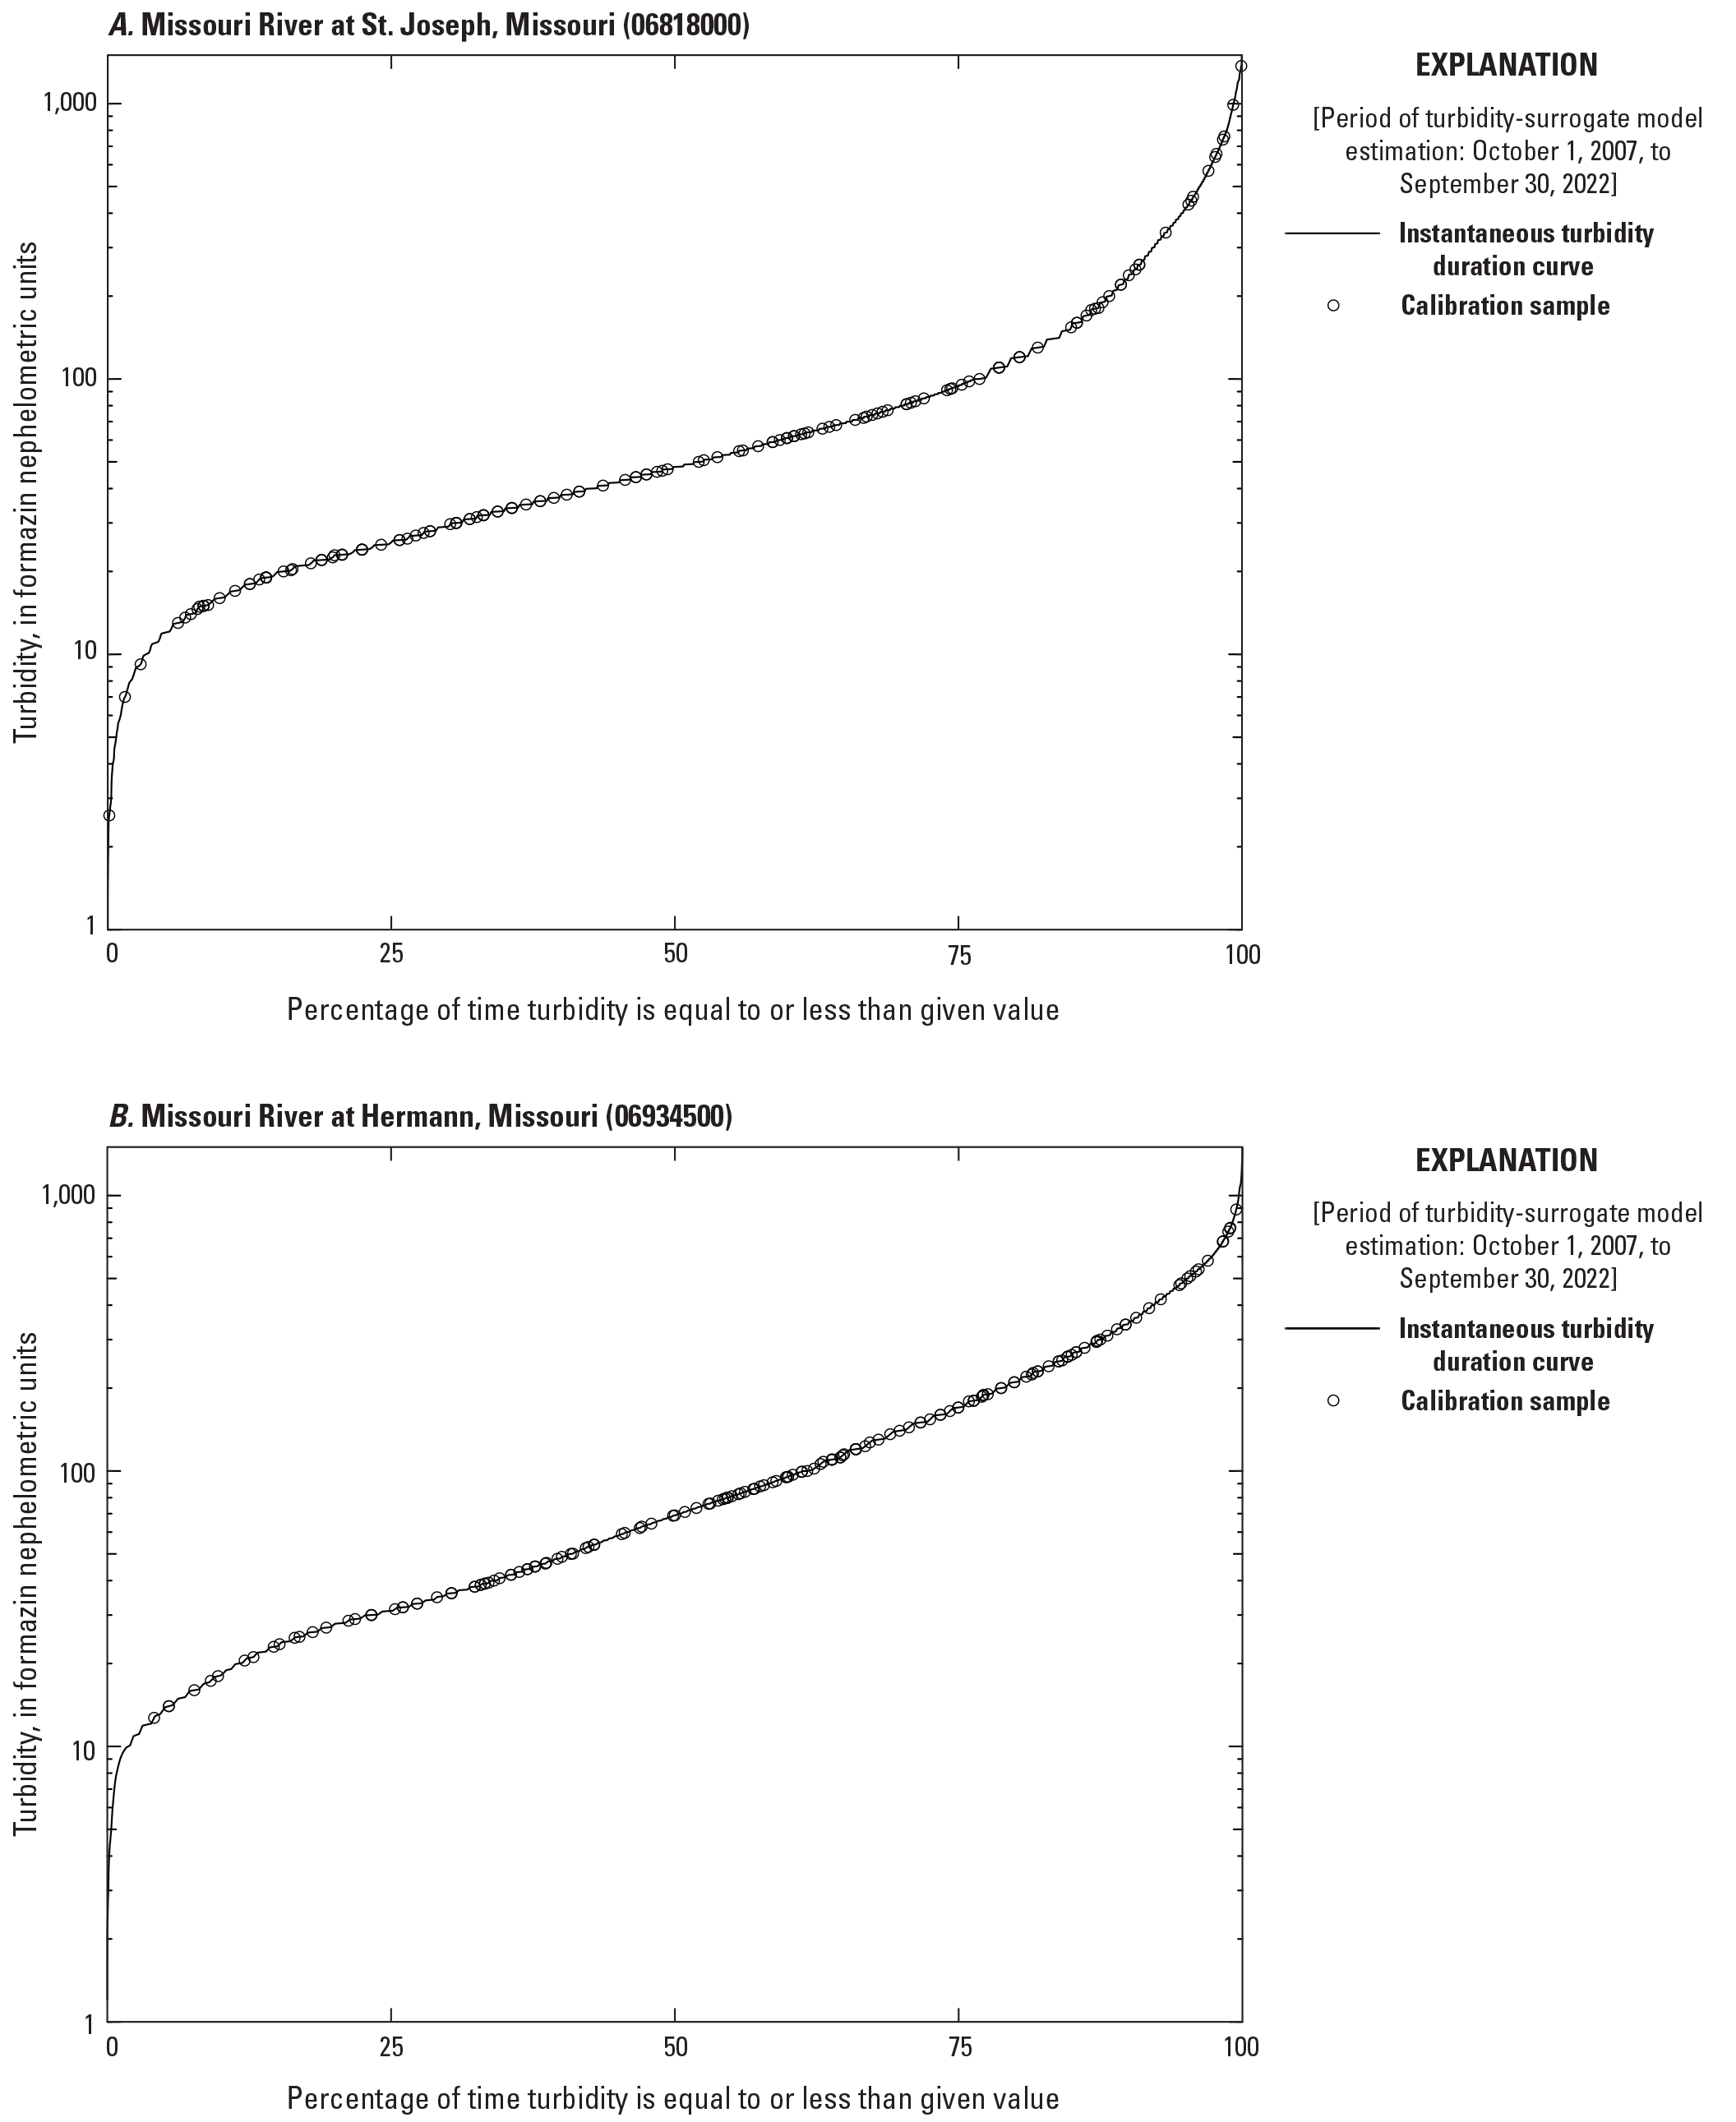
Turbidity duration curves with calibration samples at the Missouri River at St. Joseph, Missouri, streamgage (U.S. Geological Survey station 06818000) and the Missouri River at Hermann, Mo., streamgage (U.S. Geological Survey station 06934500).
Table 3.
Summary of LOAD ESTimator (LOADEST) model input datasets and predicted total phosphorus daily loads for the Missouri River at St. Joseph, Missouri, streamgage (U.S. Geological Survey station 06818000) and the Missouri River at Hermann, Mo., streamgage (U.S. Geological Survey station 06934500).[Input data are from the U.S. Geological Survey National Water Information System database (U.S. Geological Survey, 2023). mg/L as P, milligrams per liter as phosphorus; ft3/s, cubic feet per second; ton/d as P, U.S. short ton per day as phosphorus]
The turbidity values used in the Hermann turbidity-surrogate model ranged from 12.7 to 890 FNUs (median of 95 FNUs; table 2). The time-series (15-minute) turbidity data for the entire study period ranged from 1.2 to 1,690 FNUs (median of 69 FNUs). With approximately 4.10 percent of the time-series data below the minimum turbidity in the calibration dataset and approximately 0.530 percent of the time-series data above the maximum turbidity in the calibration dataset, the calibration dataset did not span the range of observed values at the Hermann study site quite as well as the other study site, which was considered when constraining the model to turbidity values less than or equal to (≤) 890 FNUs (fig. 2). The total phosphorus concentrations ranged from 0.159 to 2.72 mg/L (median of 0.386 mg/L; table 2). The associated streamflows for the calibration dataset ranged from 32,600 to 383,000 ft3/s (median of 103,000 ft3/s), whereas the time-series streamflow data ranged from 26,500 to 515,000 ft3/s (median of 83,600 ft3/s; table 2; fig. 1.2). The input data for rloadest had similar ranges of total phosphorus concentrations and associated streamflows when compared to the turbidity-surrogate calibration dataset (table 3).
Continuous turbidity records are available for approximately 88 percent of the estimation period (water years 2008 through 2022) for the St. Joseph study site and for approximately 86 percent of the estimation period for the Hermann study site. Gaps in the turbidity record were due to winter conditions, equipment failures, biofouling, and (or) data corrections that exceeded USGS criteria (Wagner and others, 2006).
Surrogate Models
Turbidity-surrogate models for the two study sites were used to calculate total phosphorus concentrations, loads, and yields for the study period. LOADEST was used to fill gaps in the calculated total phosphorus daily load record for days when an adequate turbidity record was not available or when turbidity values were outside of the range specified for the surrogate models. The 15-minute total phosphorus concentrations and the daily loads computed from the turbidity-surrogate models are available in NWIS (U.S. Geological Survey, 2023).
Turbidity-Surrogate Models
Because of curvature in the relation between turbidity and total phosphorus, a quadratic model was chosen for the St. Joseph study site (fig. 3, table 4) based on its low AIC compared to other models. The turbidity-surrogate model for the St. Joseph study site had an R2a of 0.885, a root mean square error (RMSE) of 0.137, and a retransformation bias correction factor (BCF) of 1.005 (table 4; figs. 3, 4). The model is applicable to turbidity values ≤1,750, the highest turbidity value in the continuous dataset through water year 2022 (tables 2 and 4).
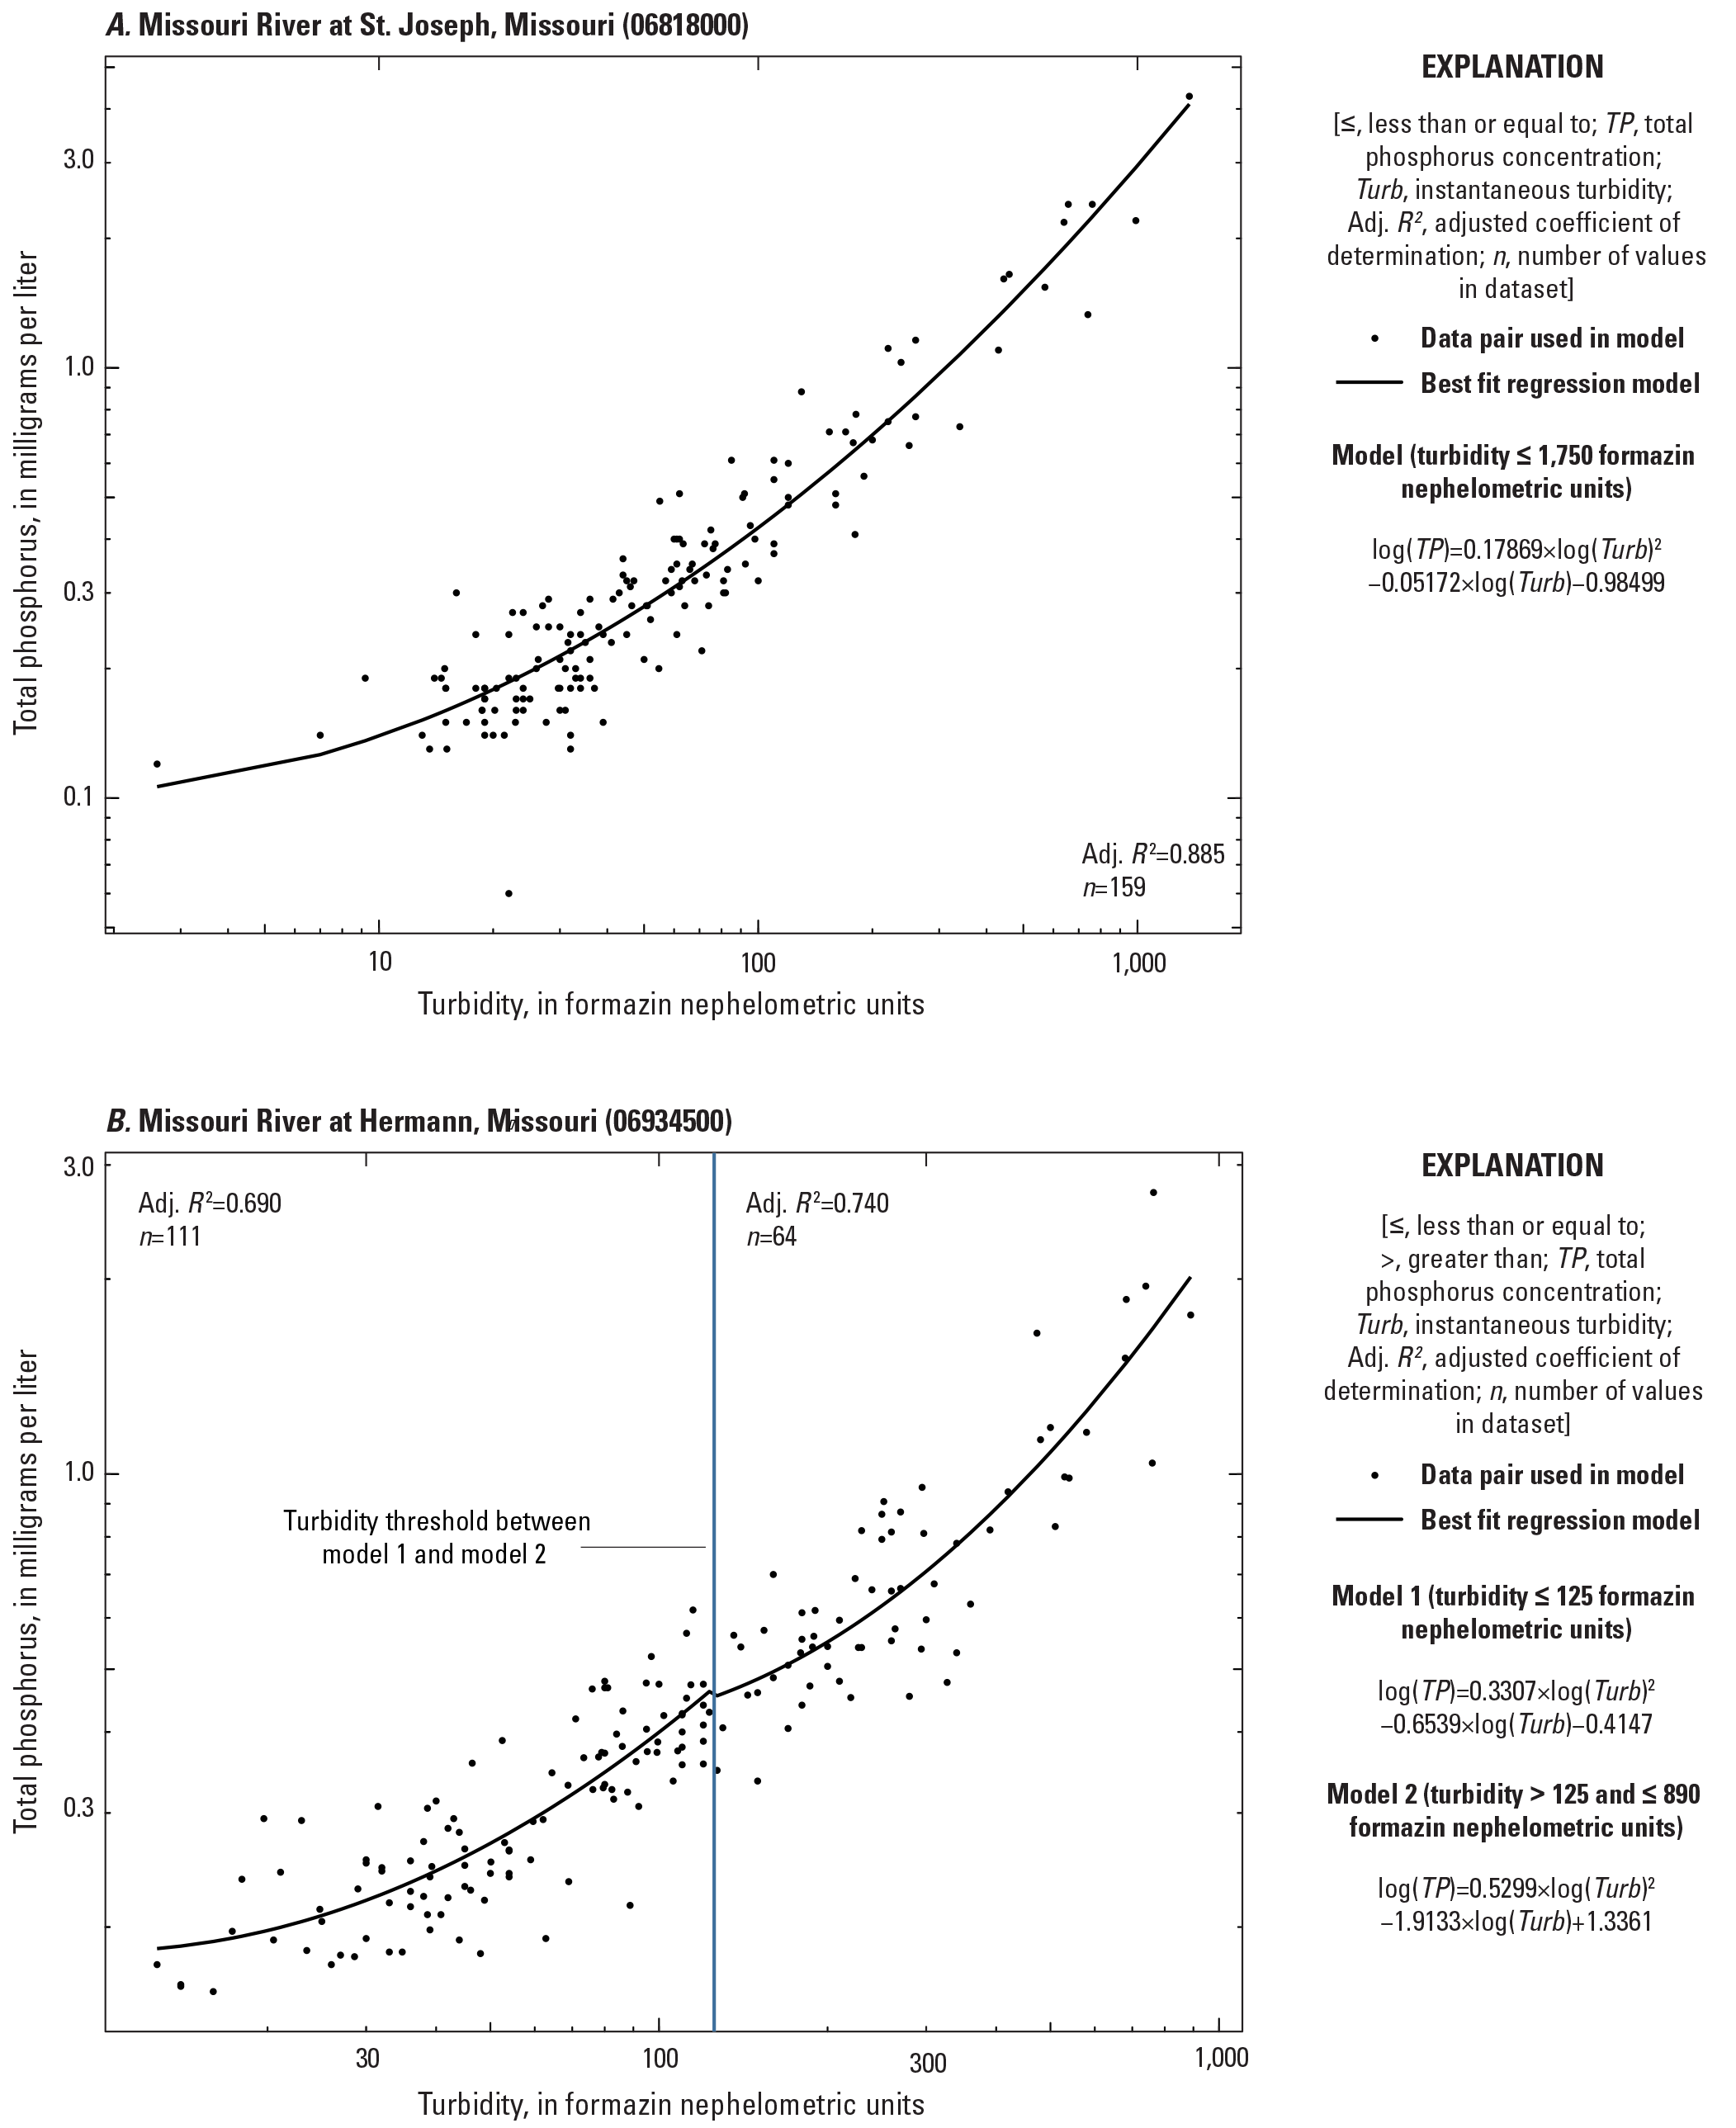
Total phosphorus turbidity-surrogate models at the Missouri River at St. Joseph, Missouri, streamgage (U.S. Geological Survey station 06818000) and the Missouri River at Hermann, Mo., streamgage (U.S. Geological Survey station 06934500).
Table 4.
Total phosphorus turbidity-surrogate models at the Missouri River at St. Joseph, Missouri, streamgage (U.S. Geological Survey station 06818000) and the Missouri River at Hermann, Mo., streamgage (U.S. Geological Survey station 06934500).[Dates are shown in month/day/year format. USGS, U.S. Geological Survey; R2a, adjusted coefficient of determination; RMSE, root mean square error; BCF, bias correction factor; n, count; ≤, less than or equal to; log, logarithm; TP, total phosphorus concentration, in milligrams per liter; Turb, turbidity, in formazin nephelometric units; >, greater than]
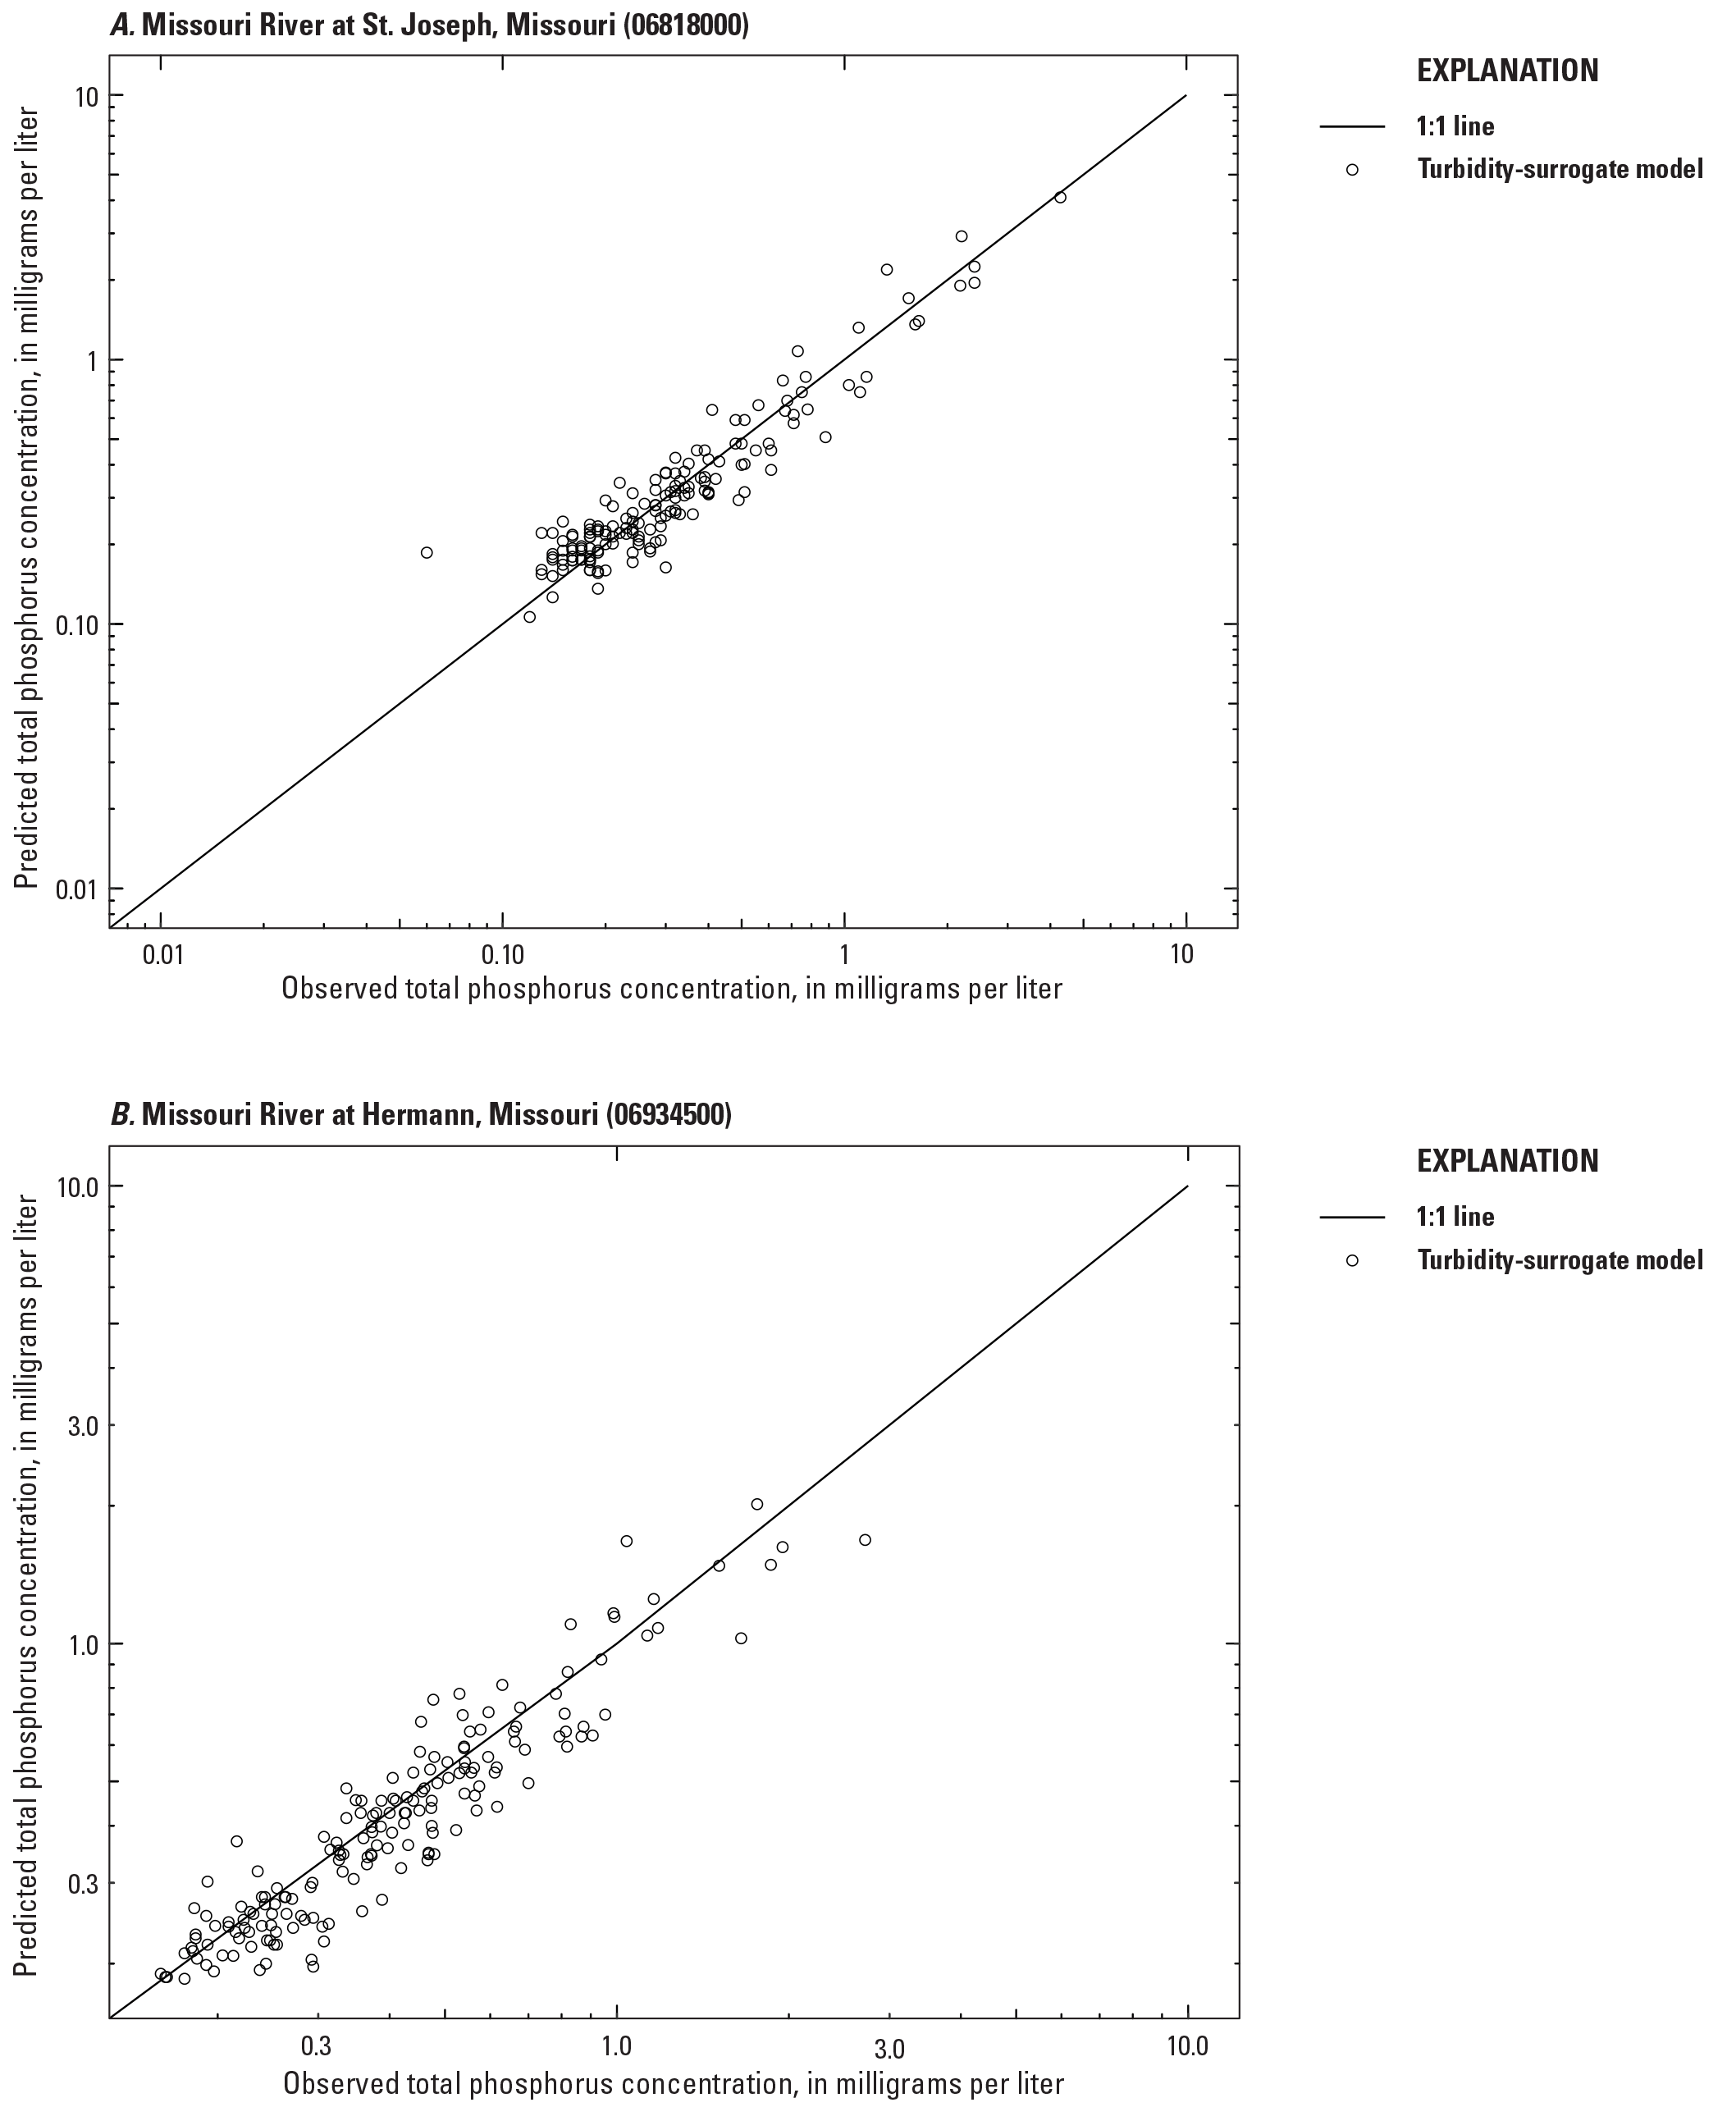
Observed and computed total phosphorus concentrations at the Missouri River at St. Joseph, Missouri, streamgage (U.S. Geological Survey station 06818000) and the Missouri River at Hermann, Mo., streamgage (U.S. Geological Survey station 06934500).
For the Hermann study site, the calibration dataset was split into two datasets and used to develop two surrogate models based on turbidity magnitudes. A low turbidity model was developed with calibration data ≤125 FNUs, and a high turbidity model was developed with calibration data greater than 125 and ≤890 FNUs (the highest turbidity value in the calibration dataset). Curvature between turbidity and total phosphorus also resulted in the selection of a quadratic model for the low and high turbidity datasets (fig. 3, table 4). The low turbidity model for the Hermann study site had an R2a of 0.690, an RMSE of 0.057, and a BCF of 1.003. The high turbidity model had an R2a of 0.740, an RMSE of 0.222, and a BCF of 1.004 (table 4; figs. 3, 4).
Quadratic models were chosen for both sites owing to larger residuals on the low and high ends that were not explained by other available parameters and that are likely controlled by different processes. When compared to linear models and models including additional explanatory variables (for example, temperature and streamflow), the quadratic models for both study sites had the lowest AIC. It is hypothesized that the curvature in the turbidity and total phosphorus relation at lower values is due to baseline total phosphorous contributions even during low turbidity and low flow conditions. Both study sites exhibited higher ratios of orthophosphate to total phosphorus during low turbidity conditions, with less of the total phosphorus attributed to orthophosphate during higher turbidity conditions (fig. 5). At the higher values of the turbidity and total phosphorus relation, it is hypothesized that the curvature is due to changes in the chemical or physical composition of the suspended sediment during high flow and high turbidity conditions. Both sites exhibited more consistent increased percentage of fine particles (less than 0.063 millimeter) at higher turbidity values (fig. 6), which are associated with higher total phosphorus concentrations, whereas larger particle sizes (described as percentage of coarse particles) are generally associated with lower total phosphorus concentrations (Capasso and others, 2020).
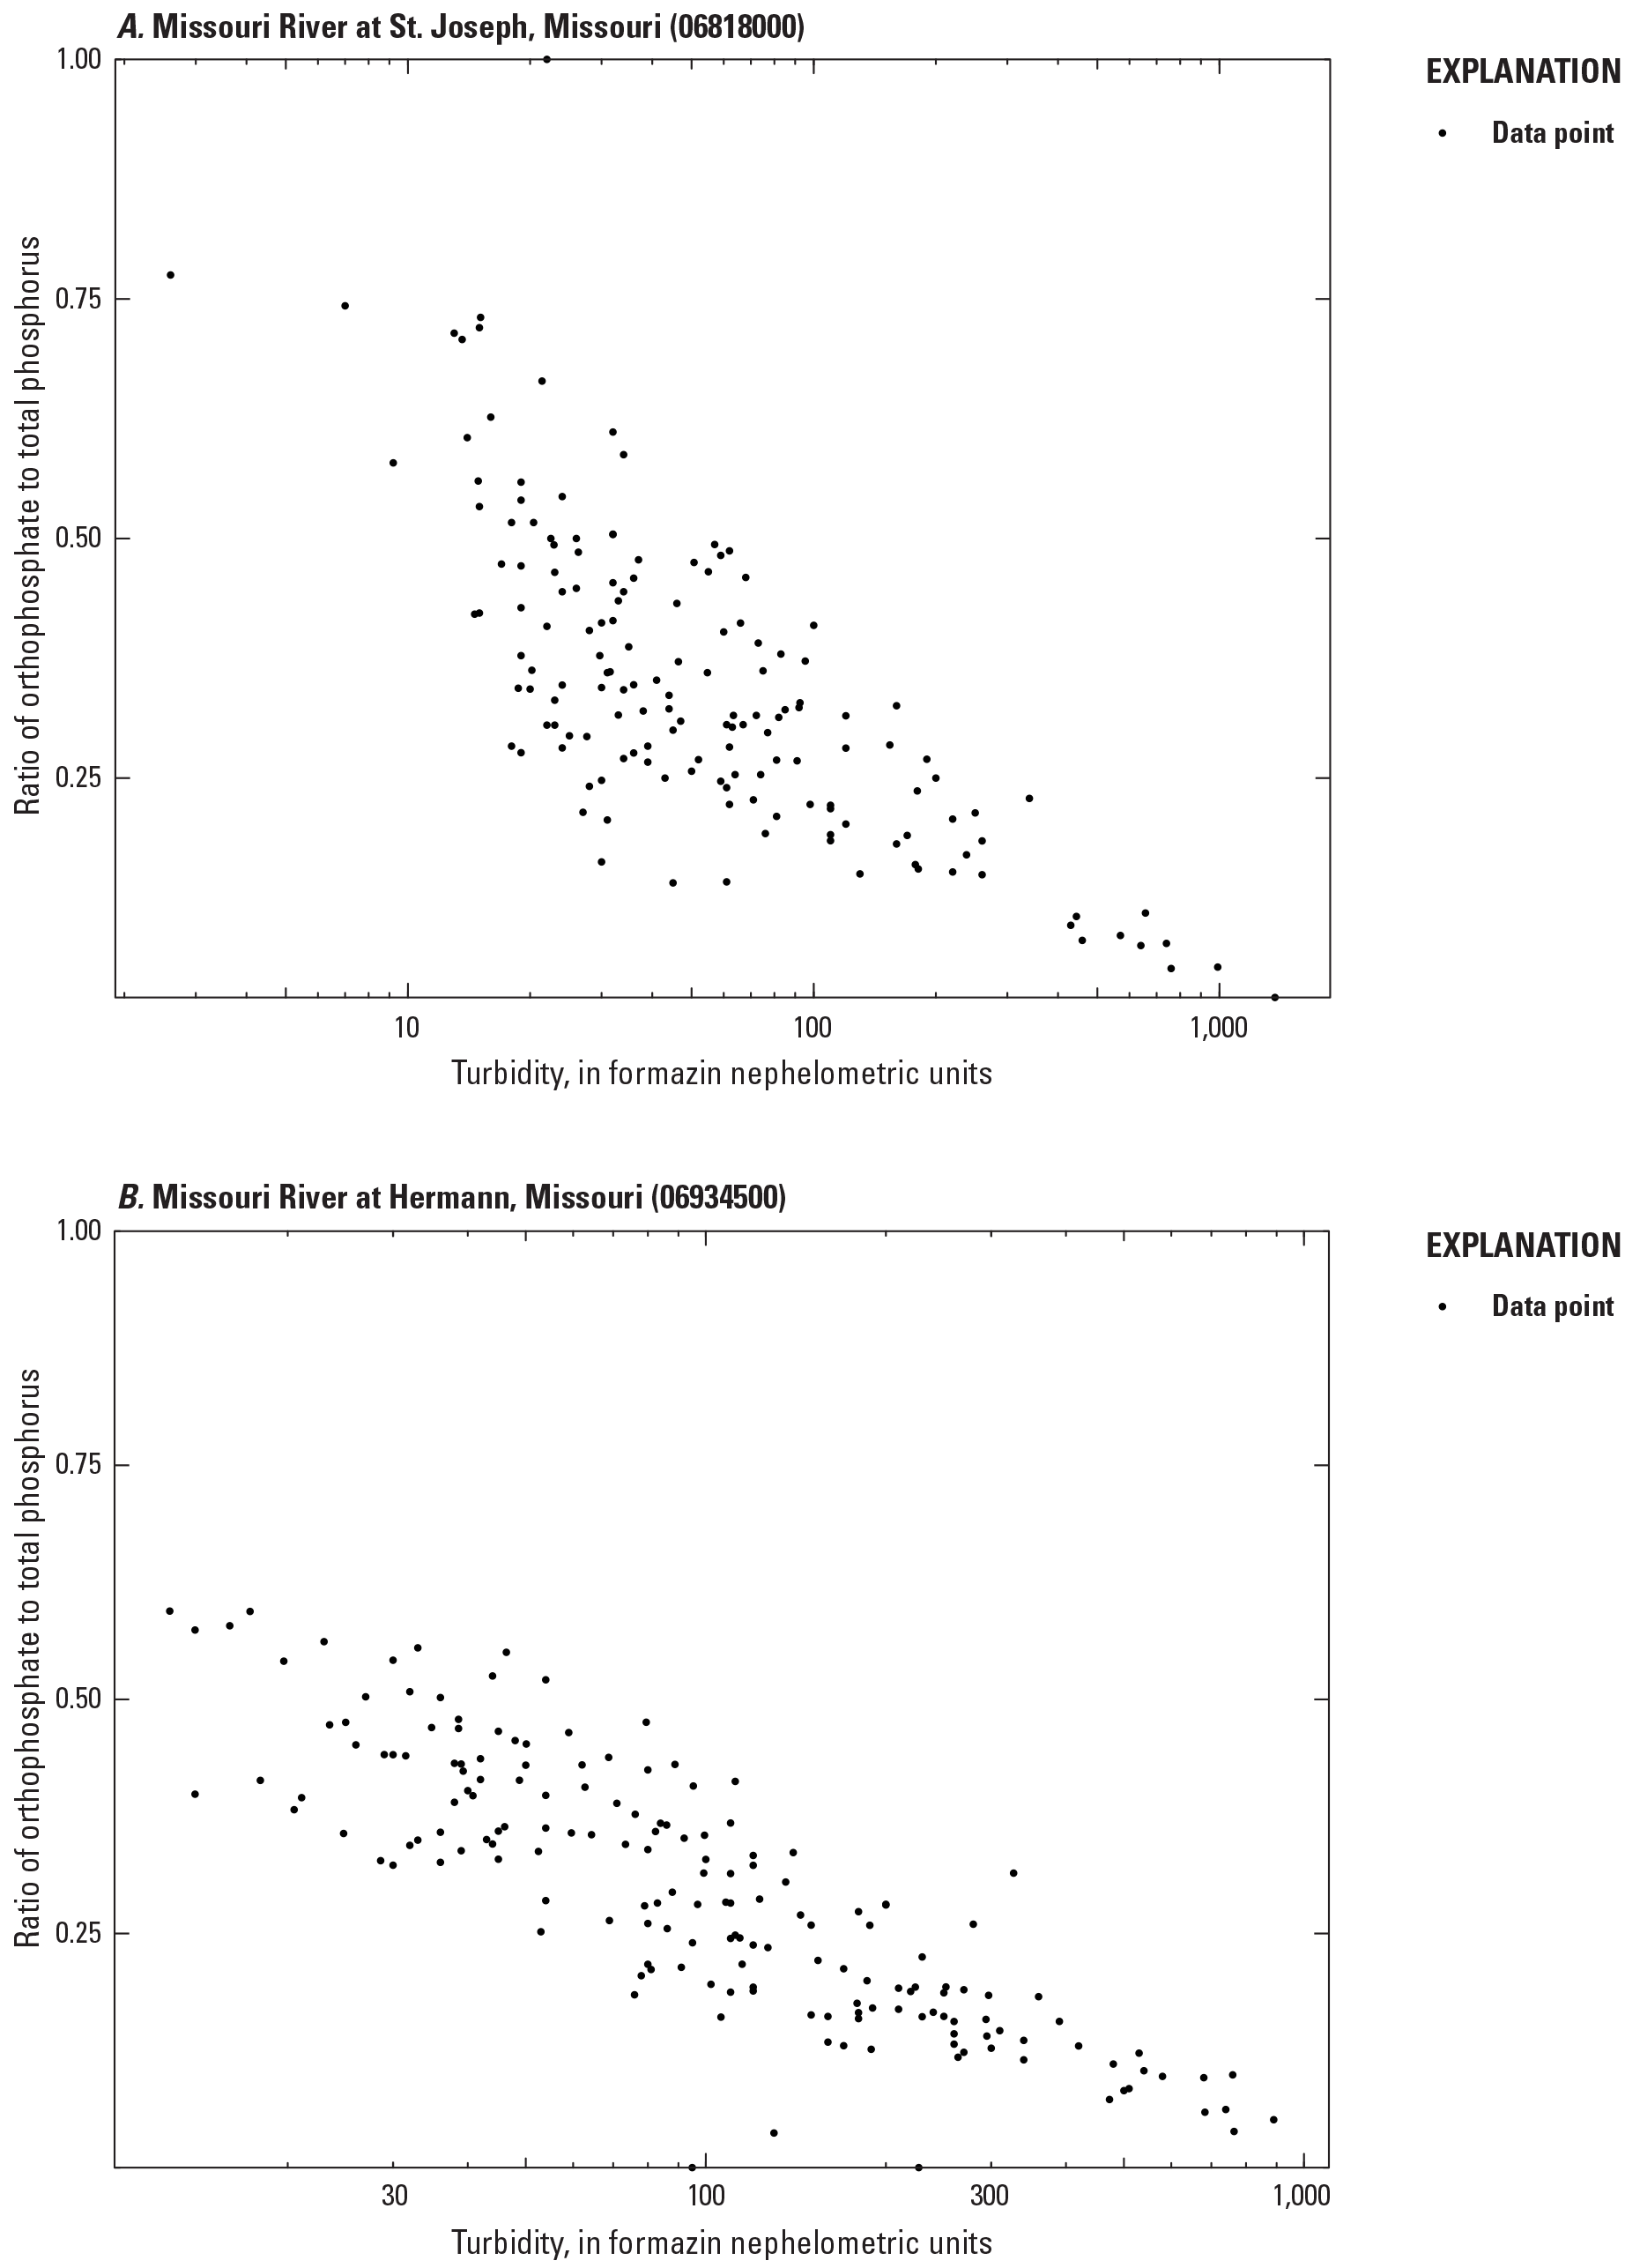
Relation between turbidity and the ratio of orthophosphate to total phosphorus at the Missouri River at St. Joseph, Missouri, streamgage (U.S. Geological Survey station 06818000) and the Missouri River at Hermann, Mo., streamgage (U.S. Geological Survey station 06934500).
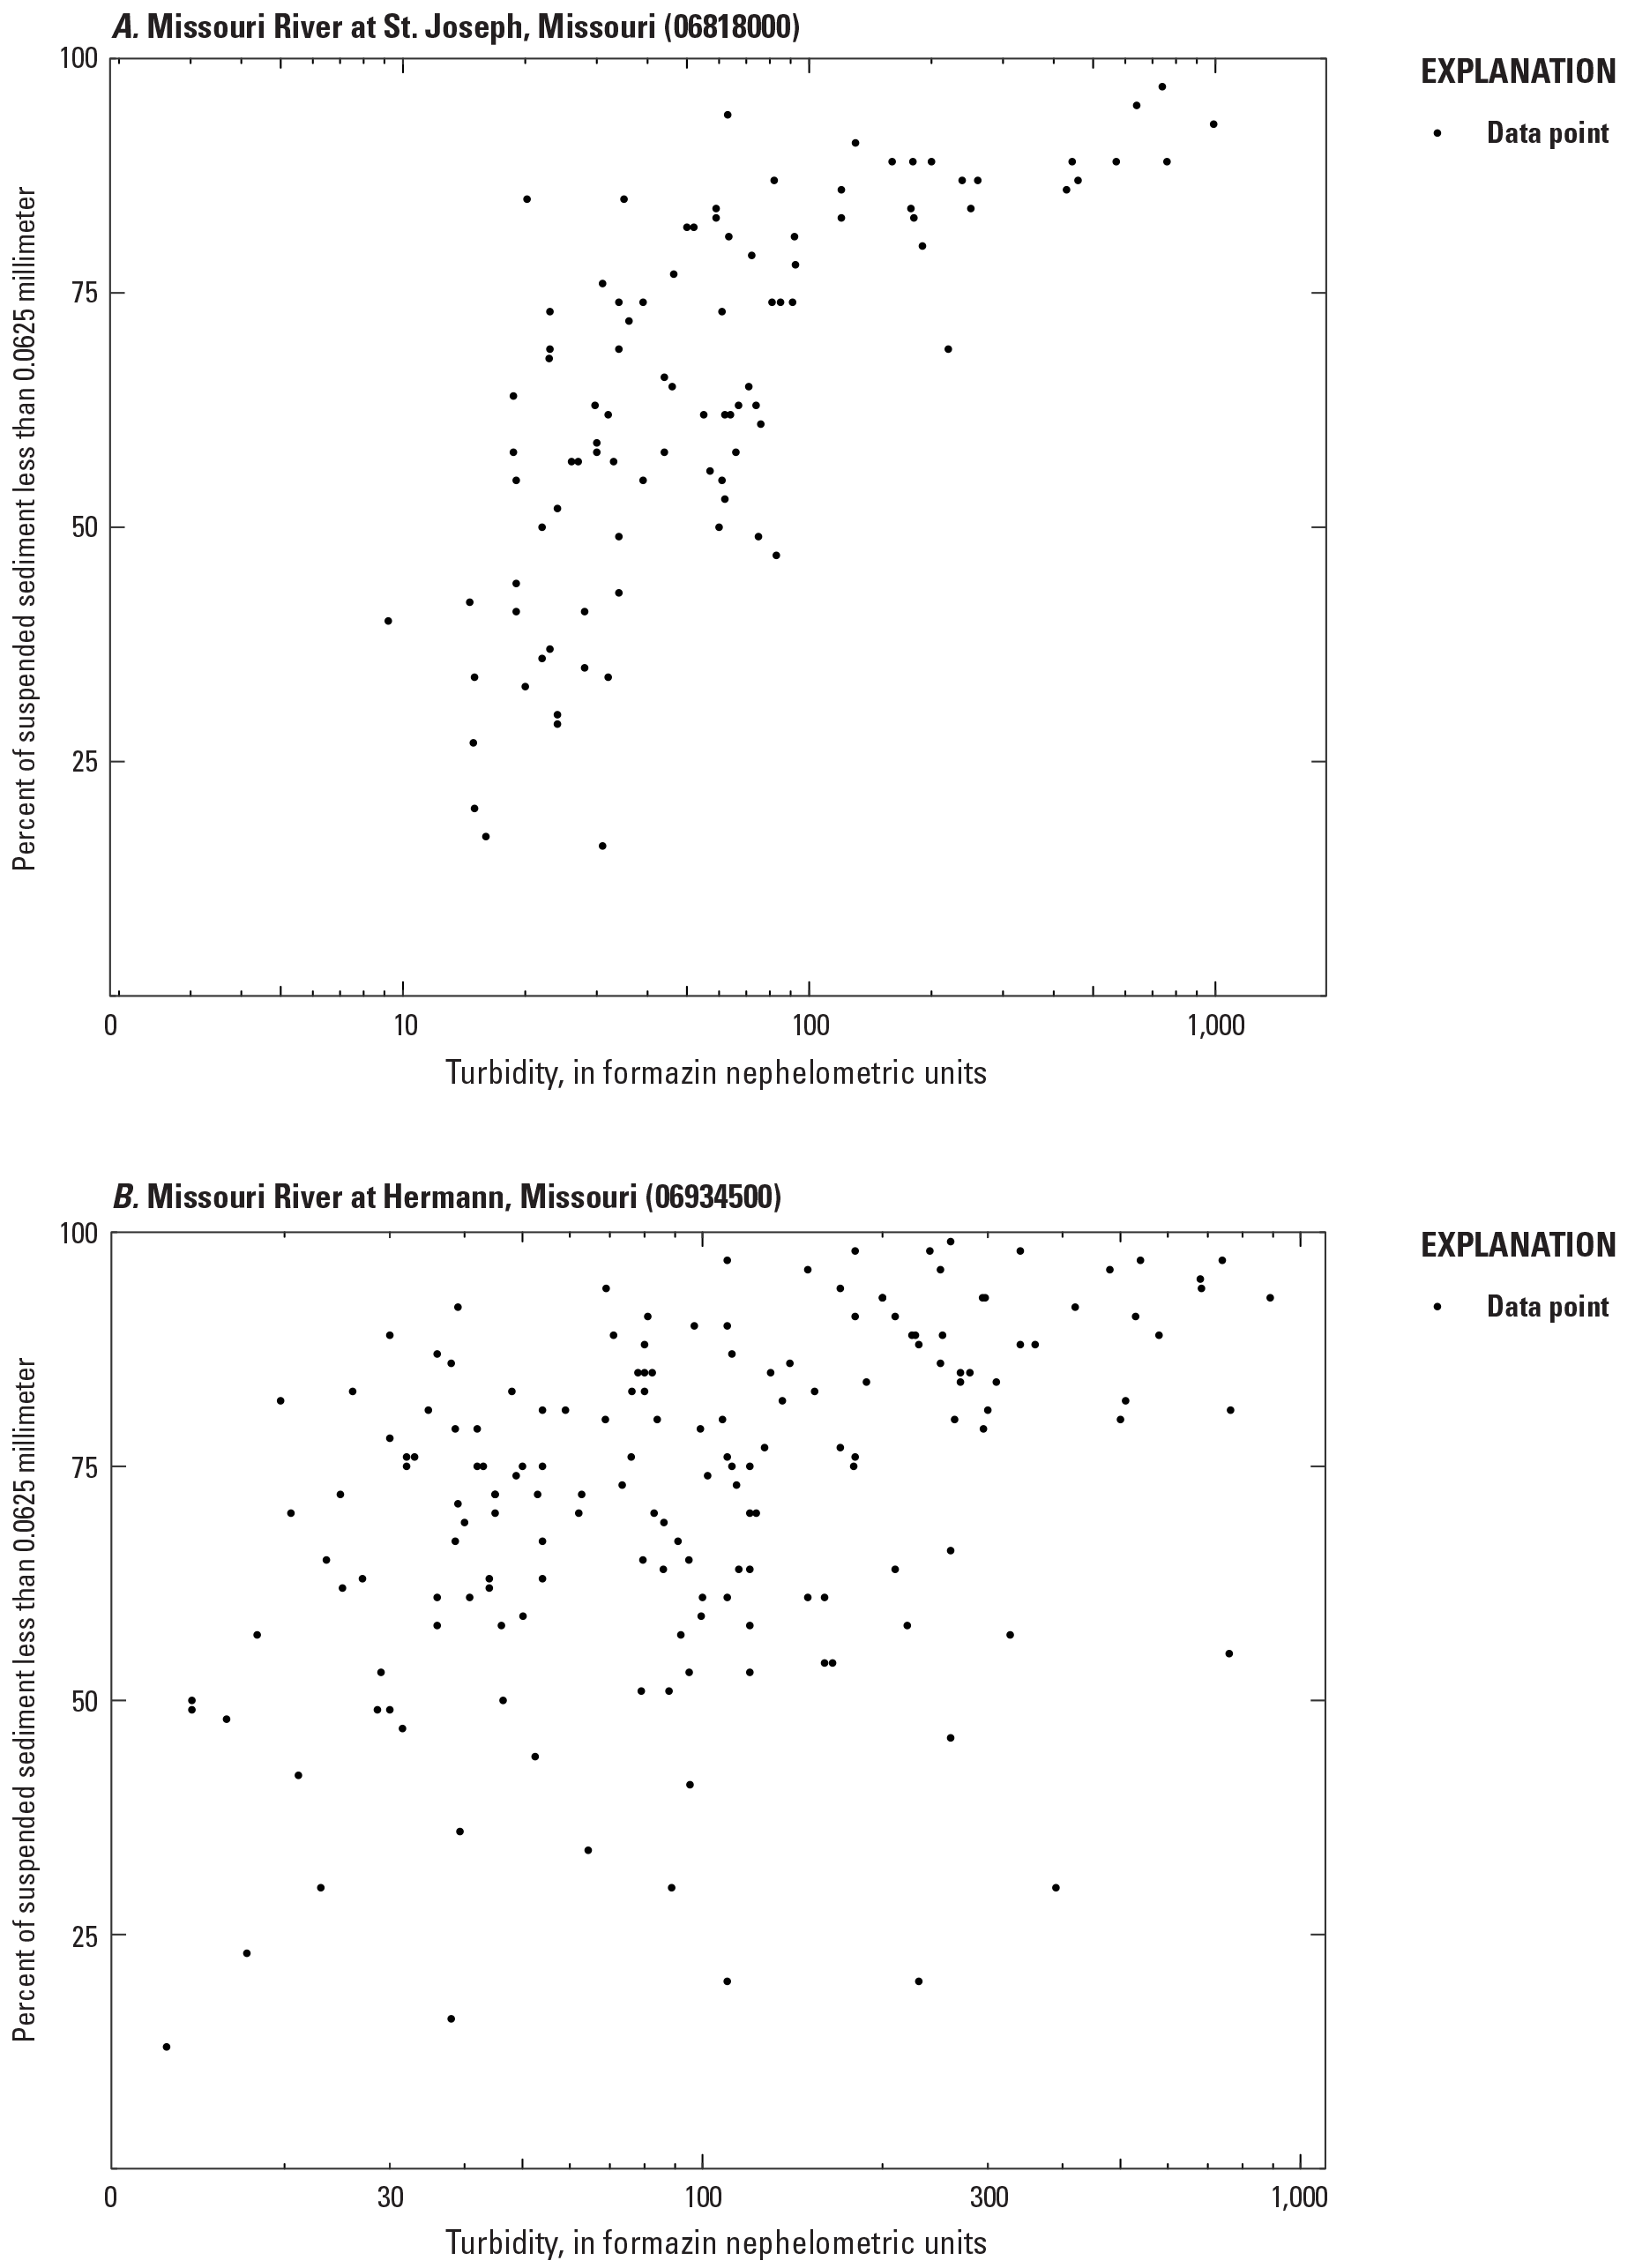
Relation between turbidity and the percentage of suspended sediment less than 0.0625 millimeter at the Missouri River at St. Joseph, Missouri, streamgage (U.S. Geological Survey station 06818000) and the Missouri River at Hermann, Mo., streamgage (U.S. Geological Survey station 06934500).
No outliers were excluded from the turbidity-surrogate model for the St. Joseph study site, whereas two outliers were excluded from the model for the Hermann study site. The outliers occurred on May 29, 2013 (turbidity=570 FNUs and total phosphorus less than 0.01 mg/L), and May 6, 2019 (turbidity=165 FNUs and total phosphorus=0.105 mg/L), and were excluded owing to undue influence on the model. The outliers did not represent extremes in turbidity or streamflow; thus, their exclusion did not constrain the models. These same outliers were also omitted from the input for the LOADEST calculations for the Hermann study site.
Supplemental LOAD ESTimator Model
The turbidity-surrogate models were used to estimate total phosphorus concentrations at the study sites (table 5). A regression model (LOADEST) that uses streamflow as the independent variable can supplement the surrogate model to obtain a complete total phosphorus record. When the turbidity record was unavailable or when values were outside of the specified ranges for the models (413 of the 5,479 days for the St. Joseph study site and 678 of the 5,479 days for the Hermann study site), rloadest regression equations were used to calculate daily total phosphorus loads for a more complete total phosphorus load record (table 5). Seasonal variables were significant and were included in the equation for the St. Joseph study site because total phosphorus followed a seasonal pattern at that site. The seasonal terms did not have the best fit for the Hermann study site and thus were not included in the LOADEST regression model (fig. 7). The rloadest regression equations had R2a of 0.73 and 0.83 for the St. Joseph and Hermann study sites, respectively. Both sites had overall negative load biases, with a larger bias at the St. Joseph study site (−12.43 percent) than the Hermann study site (−2.195 percent) (table 5).
Table 5.
Total phosphorus LOAD ESTimator (LOADEST) models at the Missouri River at St. Joseph, Missouri, streamgage (U.S. Geological Survey station 06818000) and the Missouri River at Hermann, Mo., streamgage (U.S. Geological Survey station 06934500).[Dates are shown in month/day/year format. USGS, U.S. Geological Survey; R2a, adjusted coefficient of determination; ln, natural logarithm; TPL, total phosphorus load, in kilograms per day; ln, natural logarithm; lnQ, ln(streamflow, in cubic feet per second)−center of ln(streamflow, in cubic feet per second); dtime, decimal time−center of decimal time; LOADEST, LOAD ESTimator]
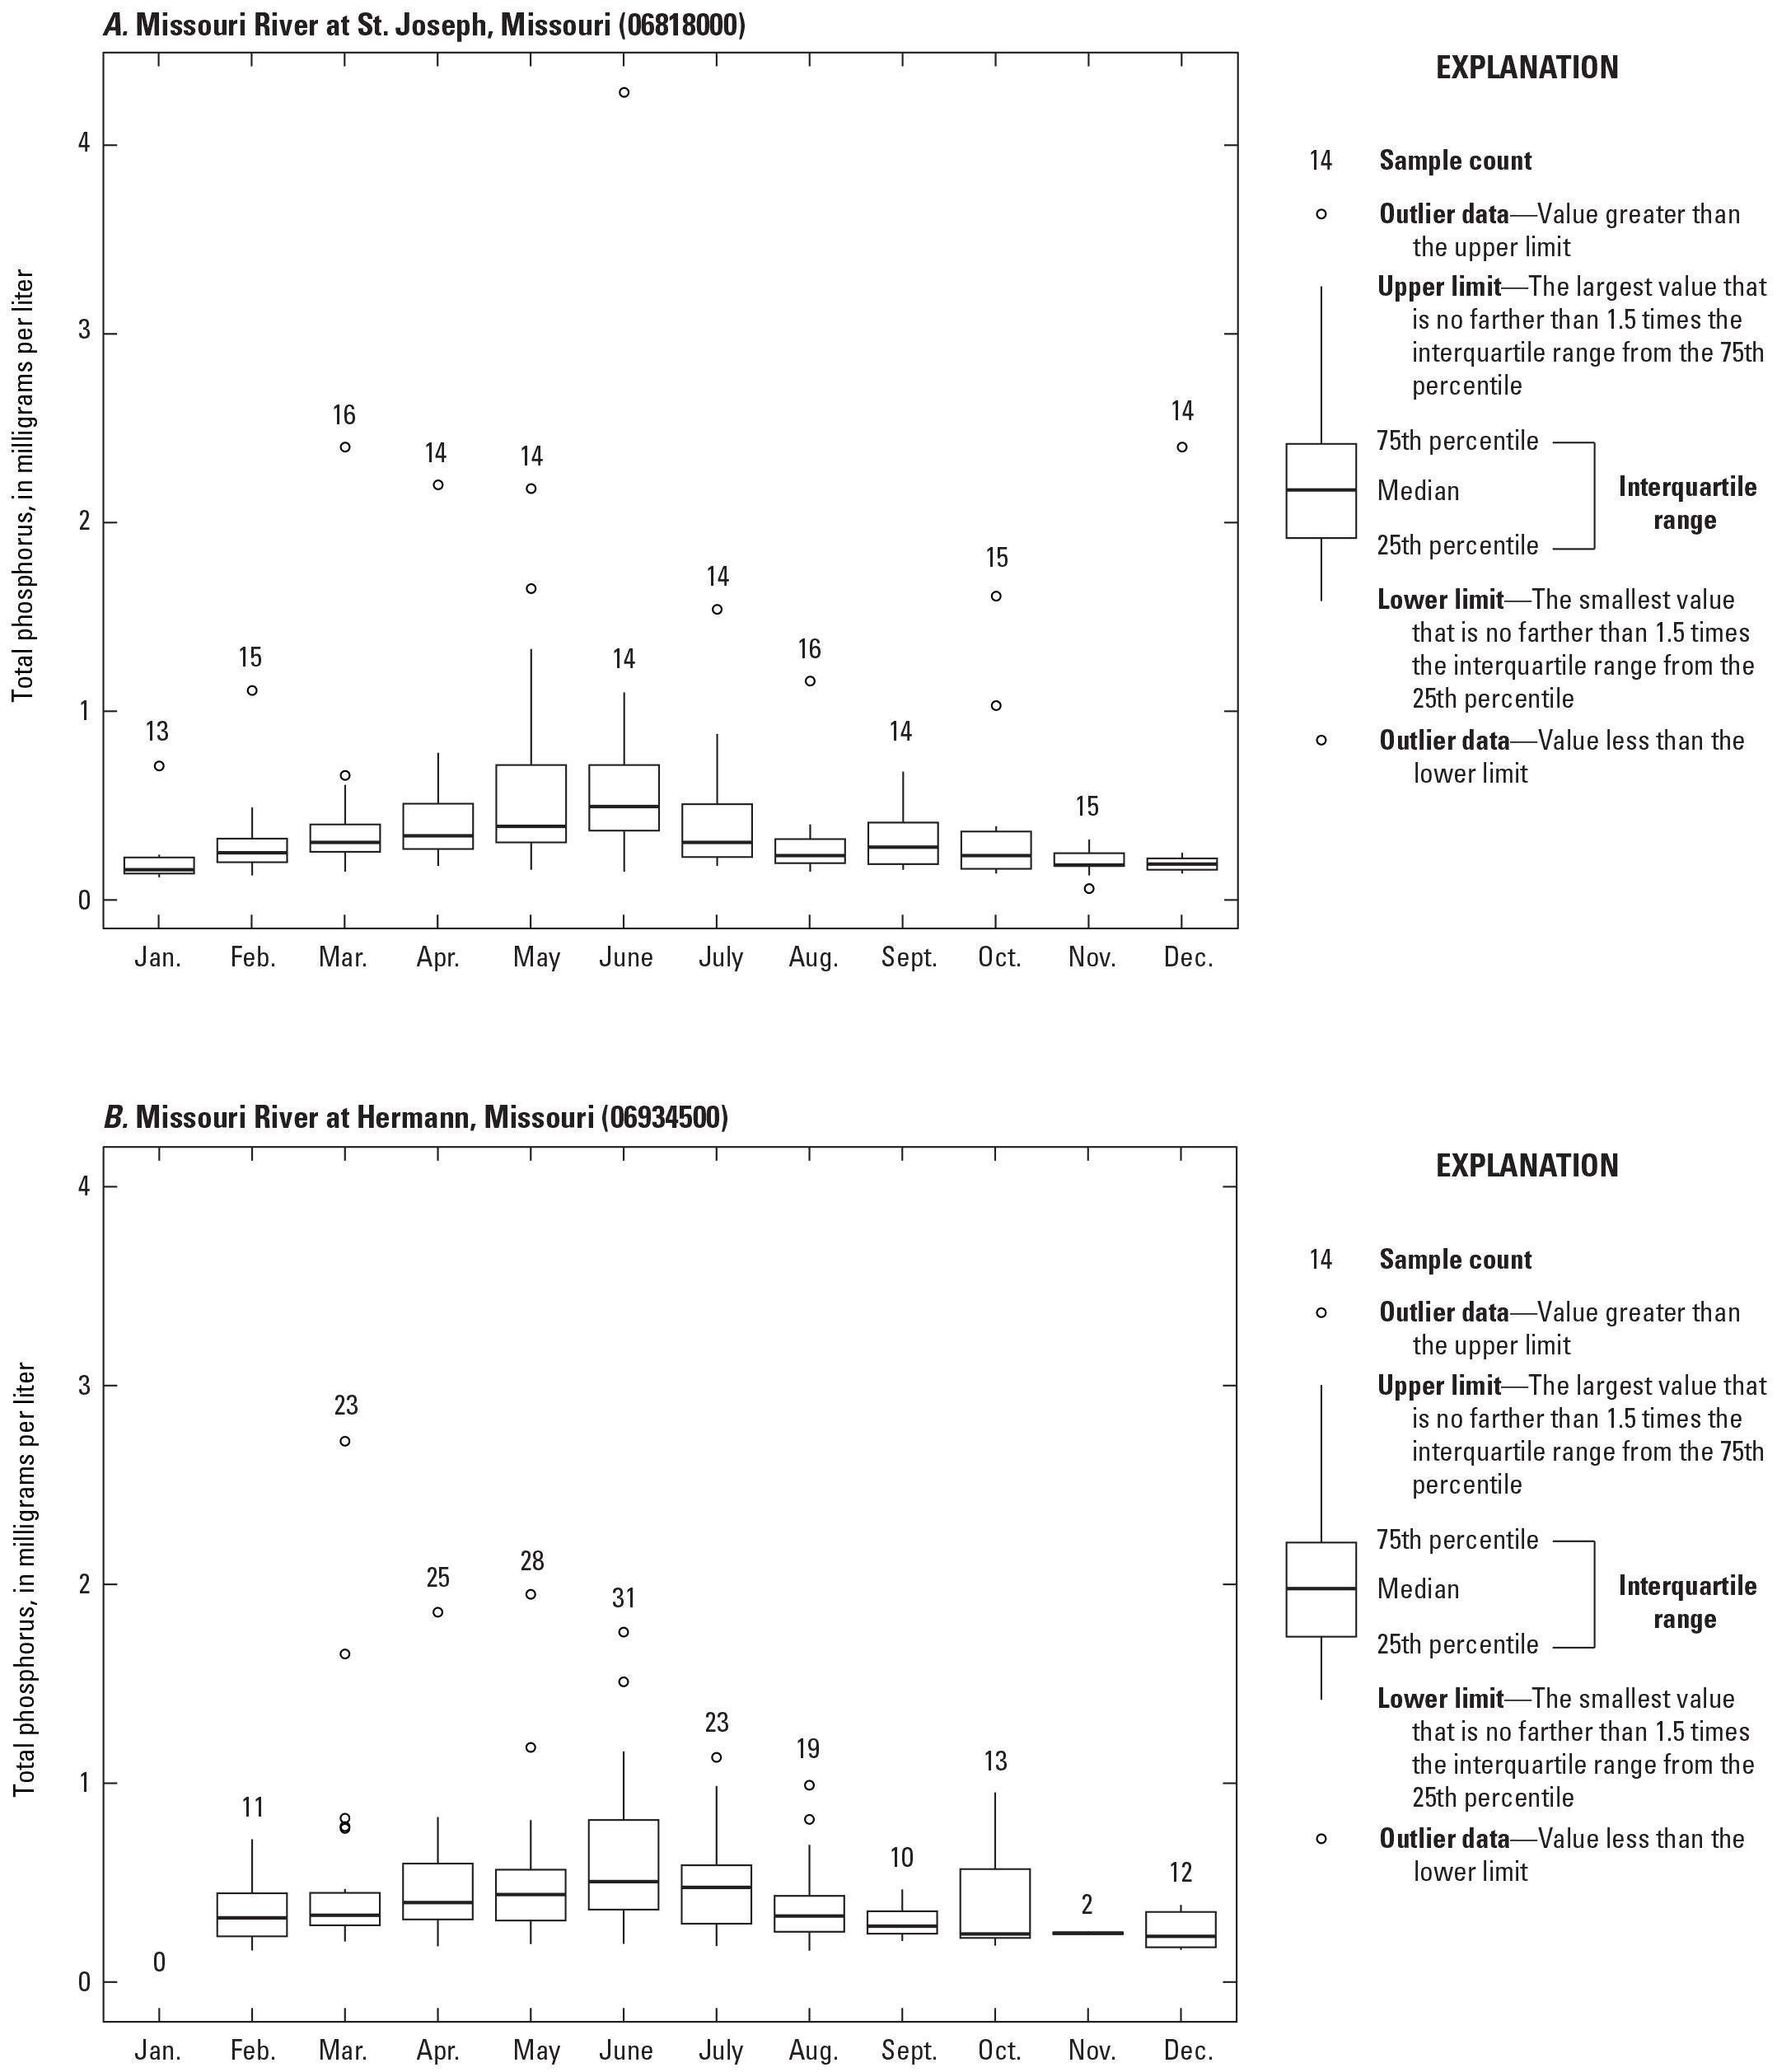
Total phosphorus concentrations by month at the Missouri River at St. Joseph, Missouri, streamgage (U.S. Geological Survey station 06818000) and the Missouri River at Hermann, Mo., streamgage (U.S. Geological Survey station 06934500).
Computed Total Phosphorus Concentrations, Loads, and Yields
During the 15-year study period for the St. Joseph study site, daily mean total phosphorus concentrations calculated using the surrogate model ranged from 0.104 to 4.56 mg/L (median of 0.272 mg/L and mean of 0.417 mg/L; table 6). Computed total phosphorus daily loads from the turbidity-surrogate model (with gaps in record filled with LOADEST data) ranged from 5.19 to 1,760 tons/d (median of 36.5 tons/d and mean of 79.8 tons/d), and daily yields ranged from 0.0243 to 8.24 pounds per square mile per day (lb/mi2/d; median of 0.171 lb/mi2/d and mean of 0.374 lb/mi2/d). Depending on the year, 67.1 to 100 percent of the daily loads were computed using the surrogate model, with 92.4 percent of the total load for the 15-year period calculated using the surrogate model (table 6).
Table 6.
Summary of total phosphorus concentrations, loads, and yields at the Missouri River at St. Joseph, Missouri, streamgage (U.S. Geological Survey station 06818000) and the Missouri River at Hermann, Mo., streamgage (U.S. Geological Survey station 06934500).[mg/L, milligram per liter; ton/d, U.S. short ton per day; lb/mi2/d, pound per square mile per day; lb/mi2/yr, pound per square mile per year; Max, maximum; Min, minimum; --, no data; LOADEST, LOAD ESTimator]
From the surrogate model with gaps filled with LOADEST models, annual total phosphorus loads at the St. Joseph study site ranged from 9,570 tons in water year 2022 to 50,500 tons in water year 2019 (total load for the study period of 437,000 tons), and annual yields ranged from 44.9 pounds per square mile per year (lb/mi2/yr) in water year 2022 to 237 lb/mi2/yr in water year 2019 (total yield for entire study period of 137 lb/mi2/yr; table 6, fig. 8).
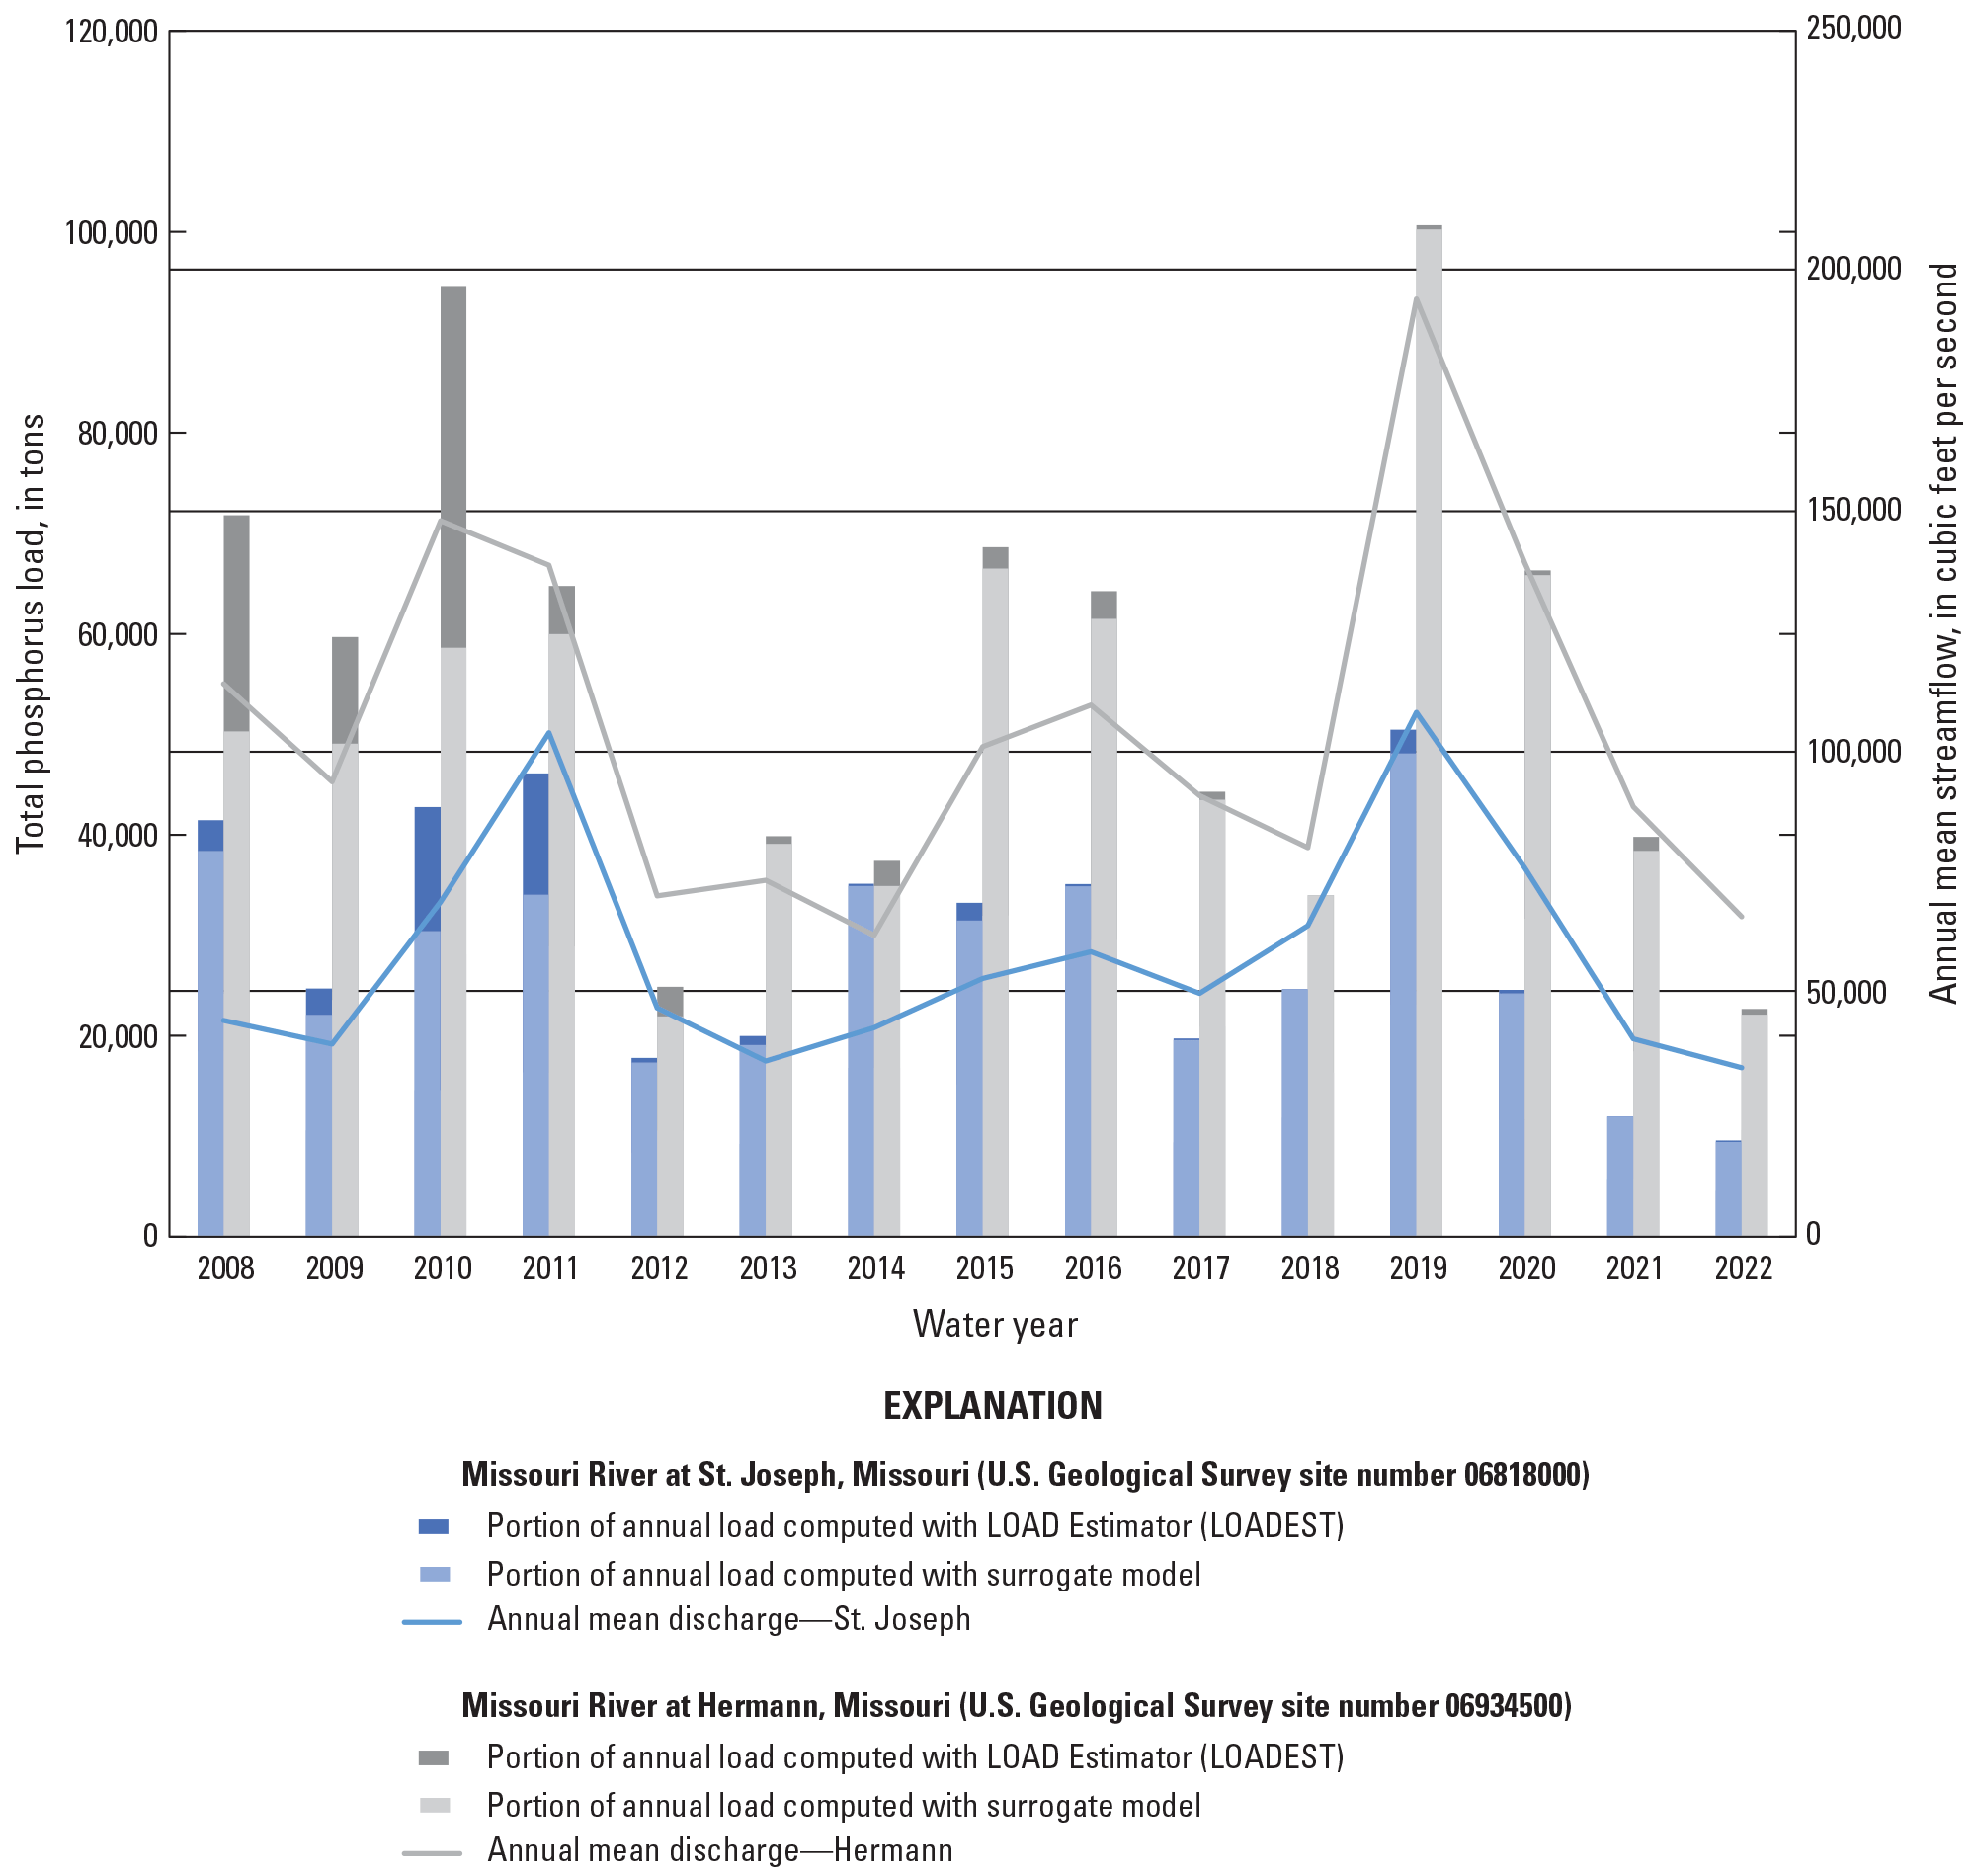
Estimated total phosphorus annual loads for water years 2008–22 at the Missouri River at St. Joseph, Missouri, streamgage (U.S. Geological Survey station 06818000) and the Missouri River at Hermann, Mo., streamgage (U.S. Geological Survey station 06934500).
For comparison purposes, total phosphorus loads computed only using LOADEST models were compared to the annual load calculated using the surrogate model for water year 2018 because it had a complete daily load record and did not require gaps to be filled with LOADEST data. The annual load calculated using the surrogate model for water year 2018 was 24,600 tons, and the annual load calculated using only LOADEST data was 27,600 tons (11.5-percent difference; Markland, 2024). Despite different inputs for these two models, the annual loads are within less than 15 percent of one another, which lends credence to the models. Total phosphorus concentrations, loads, and yields estimated using turbidity as the independent variable in the surrogate models are preferentially used instead of those using flow in the LOADEST models because total phosphorus concentrations are more highly correlated with turbidity than with flow. Estimates from the LOADEST models were used when turbidity data were not available.
For the Hermann study site, daily mean total phosphorus concentrations calculated using only surrogate regression models ranged from 0.183 to 1.97 mg/L (median of 0.319 mg/L and mean of 0.421 mg/L; table 6). Computed total phosphorus daily loads from the turbidity-surrogate model (with gaps in record filled with LOADEST data) ranged from 12.7 to 1,970 tons/d (median of 76.8 tons/d and mean of 152 tons/d), and daily yields ranged from 0.0486 to 7.55 lb/mi2/d (median of 0.294 lb/mi2/d and mean of 0.582 lb/mi2/d). Depending on the year, 54.1 to 100 percent of the daily loads were computed using the surrogate model, with 87.6 percent of the total load for the 15-year period calculated using the surrogate model (table 6).
Annual loads at the Hermann study site were approximately twice as much as those computed for the St. Joseph study site, ranging from 22,600 tons in water year 2022 to 101,000 tons in water year 2019 (total load for the study period of 833,000 tons; table 6, fig. 8). Annual yields ranged from 86.7 lb/mi2/yr in water year 2022 to 385 lb/mi2/yr in water year 2019 (total yield for entire study period of 213 lb/mi2/yr; table 6). For comparison purposes, total phosphorus loads computed using LOADEST were compared to the annual load calculated using the surrogate model for water year 2018 because it had a complete daily load record and did not require gaps to be filled with LOADEST data. The annual load calculated using the surrogate model for water year 2018 was 34,000 tons, and the annual load calculated using LOADEST was 30,700 tons (10.2-percent difference; Markland, 2024).
Because the Hermann study site is a USGS NWQN monitoring location, additional concentration and load estimates, as well as long-term trend information, are available using other methods for comparison to the concentrations and loads calculated in this report. Weighted regressions on time, discharge, and season (WRTDS) software has been used to calculate flow-normalized (removes effects of flow-related variability to aid in long-term trend analysis) total phosphorus loads at the Hermann study site since 1970, with results available through NWQN (U.S. Geological Survey, 2022). Discharge, as used in WRTDS, is the same as streamflow. For annual flow-normalized total phosphorus loads, a 3-percent decrease (attributed to changes in the watershed that were not streamflow-related) was observed for the period from 1982 to 2022. As for more recent trend periods, a 38-percent decrease and a 24-percent decrease were observed from 2002 to 2022 and from 2012 to 2022, respectively. As for annual loads of total phosphorus, approximately 716,000 tons of total phosphorus were calculated using the WRTDS model in water years 2008 through 2022 (U.S. Geological Survey, 2022), compared to the 833,000 tons calculated in this report (a 15.1-percent difference). The differences between various methods used to estimate total phosphorus loads have been explored, with total phosphorus being one of the more difficult constituents for which to accurately estimate annual loads (Lee and others, 2016, 2019). Because most of total phosphorus can often be transported during a small number of larger hydrologic events, it can be difficult to accurately estimate loads with discrete sampling methods when those events are not sampled (Lee and others, 2019). Conversely, the use of continuous turbidity monitor data and surrogate models can often better capture the range of hydrologic conditions and these larger events, which can result in the differences between methods in annual load estimations.
The sources of nutrient loads and yields from major subbasins within the Missouri River drainage basin were investigated using SPAtially Referenced Regressions On Watershed attributes (SPARROW models by Brown and others (2011). The total phosphorus load delivered to the Mississippi River from the Missouri River was estimated at approximately 43,000 tons per year (loads detrended to the base year 2002; Brown and others, 2011). The largest proportion of total phosphorus was contributed by the Middle Missouri and Lower Missouri subbasins (18.6 and 38.7 percent, respectively). The smallest proportions were delivered by the Upper Missouri and Yellowstone subbasins (0.1 percent each; Brown and others, 2011).
Although these studies of total phosphorus loading in the Missouri River provide important information, the use of turbidity time-series data in surrogate models improves the ability to estimate total phosphorus loads (Schilling and others, 2017). The use of continuous data allows for the capture of variability in nutrient transport during the full range of hydrologic conditions, which is not easily done by discrete sampling (Stutter and others, 2017; Villa and others, 2019). Using turbidity as a surrogate allows monitoring of total phosphorus, which is not practical to measure in a field setting, in a way that captures the concentrations and loads of total phosphorus in the Missouri River. The ability to calculate total phosphorus loads is critical in assessing progress towards nutrient reduction goals.
Summary
The U.S. Geological Survey (USGS) and the Missouri Department of Natural Resources collaborated to model total phosphorus concentrations and loads in the Missouri River at St. Joseph, Missouri, streamgage (USGS station 06818000; hereafter referred to as the “St. Joseph study site”), and the Missouri River at Hermann, Mo., streamgage (USGS station 06934500; hereafter referred to as the “Hermann study site”). The Missouri Nutrient Loss Reduction Strategy (NLRS) was created by the Missouri Department of Natural Resources to reduce the nutrient contamination of Missouri’s waterways from point and nonpoint sources, and the Missouri Department of Natural Resources expends considerable resources on the monitoring of water quality in streams throughout the State. Advances in technology have resulted in the ability to directly measure some nutrients, such as nitrate, in real time using direct-read sensors; however, technological advances in measuring total phosphorus concentrations in real time have not progressed as quickly.
To estimate total phosphorus concentrations and loads at the St. Joseph and Herman study sites, turbidity-surrogate models were developed for each site. Quadratic models were chosen for both sites owing to larger residuals on the low and high ends that were not explained by other available parameters. When turbidity data were unavailable or when turbidity values were outside of the specified ranges of the models, LOAD ESTimator (LOADEST) was used to develop regression models based on streamflow data to estimate daily loads of total phosphorus, and these estimates were used to fill the gaps in the calculated total phosphorus load record. This report describes the surrogate models developed to compute total phosphorus concentrations and loads for the St. Joseph and Hermann study sites for water years 2008 to 2022 (October 1, 2007, to September 30, 2022). With ongoing model evaluation and maintenance, the surrogate models may be useful in the future for computing total phosphorus concentrations and loads for the deployment periods beginning in October 2007.
During the 15-year study period for the St. Joseph site, daily mean total phosphorus concentrations calculated using the surrogate model ranged from 0.104 to 4.56 milligrams per liter (mg/L; median of 0.272 mg/L and mean of 0.417 mg/L). Computed total phosphorus daily loads from the turbidity-surrogate model (with gaps in record filled with LOADEST data) ranged from 5.19 to 1,760 tons per day (tons/d; median of 36.5 tons/d and mean of 79.8 tons/d), and daily yields ranged from 0.0243 to 8.24 pounds per square mile per day (lb/mi2/d; median of 0.171 lb/mi2/d and mean of 0.374 lb/mi2/d). Annual loads ranged from 9,570 tons in water year 2022 to 50,500 tons in water year 2019 (total load for the study period of 437,000 tons).
For the Hermann study site, daily mean total phosphorus concentrations calculated using the surrogate regression models ranged from 0.183 to 1.97 mg/L (median of 0.319 mg/L and mean of 0.421 mg/L). Computed total phosphorus daily loads from the turbidity-surrogate model (with gaps in record filled with LOADEST data) ranged from 12.7 to 1,970 tons/d (median of 76.8 tons/d and mean of 152 tons/d), and daily yields ranged from 0.0486 to 7.55 lb/mi2/d (median of 0.294 lb/mi2/d and mean of 0.582 lb/mi2/d). Annual loads ranged from 22,600 tons in water year 2022 to 101,000 tons in water year 2019 (total load for the study period of 833,000 tons).
The ability to calculate total phosphorus loads for the Missouri River is critical in assessing progress towards nutrient reduction goals. The use of continuous data and surrogate models allows for the capture of variability in nutrient transport during the full range of hydrologic conditions, which is not easily done by discrete sampling. Ongoing continuous monitoring of the Missouri River to maintain these models and their concentration and load estimations, along with discrete sampling for nutrients and other water-quality parameters, is warranted.
References Cited
Brown, J.B., Sprague, L.A., and Dupree, J.A., 2011, Nutrients sources and transport in the Missouri River Basin, with emphasis on the effects of irrigation and reservoirs: Journal of the American Water Resources Association, v. 47, no. 5, p. 1034–1060, accessed January 24, 2024, at https://doi.org/10.1111/j.1752-1688.2011.00584.x.
Capasso, J., Bhadha, J.H., Bacon, A., Vardanyan, L., Khatiwada, R., Pachon, J., Clark, M., and Lang, T., 2020, Influence of flow on phosphorus-dynamics and particle size in agricultural drainage ditch sediments: PLoS One, v. 15, no. 1, e0227489, accessed August 22, 2023, at https://doi.org/10.1371/journal.pone.0227489.
Christensen, V.G., Rasmussen, P.P., and Ziegler, A.C., 2002, Real-time water quality monitoring and regression analysis to estimate nutrient and bacteria concentrations in Kansas streams: Water Science and Technology, v. 45, no. 9, p. 205–219, accessed January 24, 2024, at https://doi.org/10.2166/wst.2002.0240.
Duan, N., 1983, Smearing estimate—A nonparametric retransformation method: Journal of the American Statistical Association, v. 78, no. 383, p. 605–610, accessed July 26, 2023, at https://doi.org/10.1080/01621459.1983.10478017.
Garrett, J.D., 2012, Concentrations, loads, and yields of select constituents from major tributaries of the Mississippi and Missouri Rivers in Iowa, water years 2004–2008: U.S. Geological Survey Scientific Investigations Report 2012–5240, 62 p., accessed August 8, 2023, at https://doi.org/10.3133/sir20125240.
Garrett, J.D., 2019, The use of continuous water-quality time-series data to compute nutrient loadings for selected Iowa streams, 2008–17: U.S. Geological Survey Scientific Investigations Report 2019–5054, 31 p., accessed August 9, 2023, at https://doi.org/10.3133/sir20195054.
Garrett, J.D., 2021a, The use of continuous water-quality time-series data to compute total phosphorus loadings for the Turkey River at Garber, Iowa, 2018–20: U.S. Geological Survey Scientific Investigations Report 2020–5131, 24 p., accessed August 9, 2023, at https://doi.org/10.3133/sir20205131.
Garrett, J.D., 2021b, Total phosphorus loadings for the Cedar River at Palo, Iowa, 2009–20: U.S. Geological Survey Scientific Investigations Report 2021–5127, 26 p., accessed August 8, 2023, at https://doi.org/10.3133/sir20215127.
Grayson, R.B., Finlayson, B.L., Gippel, C.J., and Hart, B.T., 1996, The potential of field turbidity measurements for the computation of total phosphorus and suspended solids loads: Journal of Environmental Management, v. 47, no. 3, p. 257–267, accessed January 24, 2024, at https://doi.org/10.1006/jema.1996.0051.
Helsel, D.R., Hirsch, R.M., Ryberg, K.R., Archfield, S.A., and Gilroy, E.J., 2020, Statistical methods in water resources: U.S. Geological Survey Techniques and Methods, book 4, chap. A3, 458 p., accessed September 25, 2024, at https://doi.org/10.3133/tm4a3. [Supersedes USGS Techniques of Water-Resources Investigations, book 4, chap. A3, version 1.1.]
Jones, A.S., Stevens, D.K., Horsburgh, J.S., and Mesner, N.O., 2011, Surrogate measures for providing high frequency estimates of total suspended solids and total phosphorus concentrations: Journal of the American Water Resources Association, v. 47, no. 2, p. 239–253, accessed January 24, 2024, at https://doi.org/10.1111/j.1752-1688.2010.00505.x.
Lee, C.J., Hirsch, R.M., Schwarz, G.E., Holtschlag, D.J., Preston, S.D., Crawford, C.G., and Vecchia, A.V., 2016, An evaluation of methods for estimating decadal stream loads: Journal of Hydrology, v. 542, p. 185–203, accessed May 3, 2024, at https://doi.org/10.1016/j.jhydrol.2016.08.059.
Lee, C.J., Hirsch, R.M., and Crawford, C.G., 2019, An evaluation of methods for computing water-quality loads: U.S. Geological Survey Scientific Investigations Report 2019–5084, 59 p., accessed May 3, 2024, at https://doi.org/10.3133/sir20195084.
Lorenz, D., Runkel, R., and De Cicco, L., 2024, River load estimation, rloadest package: U.S. Geological Survey software, accessed March 14, 2024, at https://github.com/USGS-R/rloadest.
Markland, K.M., 2023, Quality of surface water in Missouri, water year 2021: U.S. Geological Survey Data Report 1179, 24 p., accessed August 8, 2023, at https://doi.org/10.3133/dr1179.
Markland, K.M., 2024, Data and model archive summaries to support use of continuous water-quality time-series data to compute total phosphorus concentrations and loads for the Missouri River at St. Joseph and Hermann, Missouri, 2007–22: U.S. Geological Survey data release, accessed June 20, 2024, at https://doi.org/10.5066/P17PHYDZ.
Missouri Department of Conservation, 2023, Big rivers: Missouri Department of Conservation web page, accessed July 18, 2023, at https://mdc.mo.gov/discover-nature/habitats/rivers-streams/big-rivers.
Missouri Department of Natural Resources, 2020, Missouri Nutrient Loss Reduction Strategy, 2020 update: Missouri Department of Natural Resources web page, accessed July 18, 2023, at https://dnr.mo.gov/document-search/missouri-nutrient-loss-reduction-strategy-2020-update.
Missouri Department of Natural Resources, 2023, Missouri Nutrient Loss Reduction Strategy, 2022 update: Missouri Department of Natural Resources web page, accessed August 28, 2023, at https://dnr.mo.gov/document-search/missouri-nutrient-loss-reduction-strategy-2022-update.
Peake, C.S., 2022, Verification of multiple phosphorus analyzers for use in surface-water applications: U.S. Geological Survey Open-File Report 2022–1100, 23 p., accessed December 20, 2023, at https://doi.org/10.3133/ofr20221100.
R Core Team, 2024, R—A language and environment for statistical computing: Vienna, Austria, R Foundation for Statistical Computing, accessed July 18, 2023, at https://www.r-project.org/.
Rasmussen, P.P., Gray, J.R., Glysson, G.D., and Ziegler, A.C., 2009, Guidelines and procedures for computing time-series suspended-sediment concentrations and loads from in-stream turbidity-sensor and streamflow data: U.S. Geological Survey Techniques and Methods, book 3, chap. C4, 52 p., accessed May 2, 2024, at https://doi.org/10.3133/tm3C4.
Riskin, M.L., and Lee, C.J., 2021, USGS National Water Quality Monitoring Network: U.S. Geological Survey Fact Sheet 2021–3019, 2 p., accessed August 8, 2023, at https://doi.org/10.3133/fs20213019.
Robertson, D.M., Hubbard, L.E., Lorenz, D.L., and Sullivan, D.J., 2018, A surrogate regression approach for computing continuous loads for the tributary nutrient and sediment monitoring program on the Great Lakes: Journal of Great Lakes Research, v. 44, no. 1, p. 26–42, accessed May 5, 2024, at https://doi.org/10.1016/j.jglr.2017.10.003.
RStudio Team, 2024, RStudio—Integrated development for R: Boston, Mass., RStudio PBC, accessed July 18, 2023, at https://www.rstudio.com/.
Runkel, R.L., Crawford, C.G., and Cohn, T.A., 2004, Load estimator (LOADEST)—A FORTRAN program for estimating constituent loads in streams and rivers: U.S. Geological Survey Techniques and Methods, book 4, chap. A5, accessed January 24, 2024, at https://doi.org/10.3133/tm4A5.
Schenk, L.N., Anderson, C.W., Diaz, P., and Stewart, M.A., 2016, Evaluating external nutrient and suspended-sediment loads to Upper Klamath Lake, Oregon, using surrogate regressions with real-time turbidity and acoustic backscatter data: U.S. Geological Survey Scientific Investigations Report 2016–5167, 46 p., accessed August 8, 2023, at https://doi.org/10.3133/sir20165167.
Schilling, K.E., Kim, S.-W., and Jones, C.S., 2017, Use of water quality surrogates to estimate total phosphorus concentrations in Iowa rivers: Journal of Hydrology—Regional Studies, v. 12, p. 111–121, accessed January 24, 2024, at https://doi.org/10.1016/j.ejrh.2017.04.006.
Stutter, M., Dawson, J.J.C., Glendell, M., Napier, F., Potts, J.M., Sample, J., Vinten, A., and Watson, H., 2017, Evaluating the use of in-situ turbidity measurements to quantify fluvial sediment and phosphorus concentrations and fluxes in agricultural streams: Science of the Total Environment, v. 607–608, p. 391–402, accessed May 3, 2024, at https://doi.org/10.1016/j.scitotenv.2017.07.013.
U.S. Geological Survey, 2022, Tracking water quality in U.S. streams and rivers—USGS National Water Quality Network data, water-quality loads, and trends: U.S. Geological Survey webpage, accessed January 23, 2024, at https://nrtwq.usgs.gov/nwqn/#/.
U.S. Geological Survey, 2023, USGS water data for the Nation: U.S. Geological Survey National Water Information System database, accessed July 10, 2023, at https://doi.org/10.5066/F7P55KJN.
U.S. Geological Survey, variously dated, National field manual for the collection of water-quality data: U.S. Geological Survey Techniques of Water-Resources Investigations, book 9, chaps. A1–A9, accessed July 28, 2023, at https://pubs.water.usgs.gov/twri9A.
Villa, A., Fölster, J., and Kyllmar, K., 2019, Determining suspended solids and total phosphorus from turbidity—Comparison of high-frequency sampling with conventional monitoring methods: Environmental Monitoring and Assessment, v. 191, no. 605, 16 p., accessed May 3, 2024, at https://doi.org/10.1007/s10661-019-7775-7.
Wagner, R.J., Boulger, R.W., Jr., Oblinger, C.J., and Smith, B.A., 2006, Guidelines and standard procedures for continuous water-quality monitors—Station operation, record computation, and data reporting: U.S. Geological Survey Techniques and Methods, book 1, chap. D3, 51 p. + 8 attachments, accessed July 28, 2023, at https://doi.org/10.3133/tm1D3.
Warner, K.L., Terrio, P.J., Straub, T.D., Roseboom, D., and Johnson, G.P., 2013, Real-time continuous nitrate monitoring in Illinois in 2013: U.S. Geological Survey Fact Sheet 2013–3109, 3 p., accessed August 8, 2023, at https://doi.org/10.3133/fs20133109.
Appendix 1. Supplemental Figures
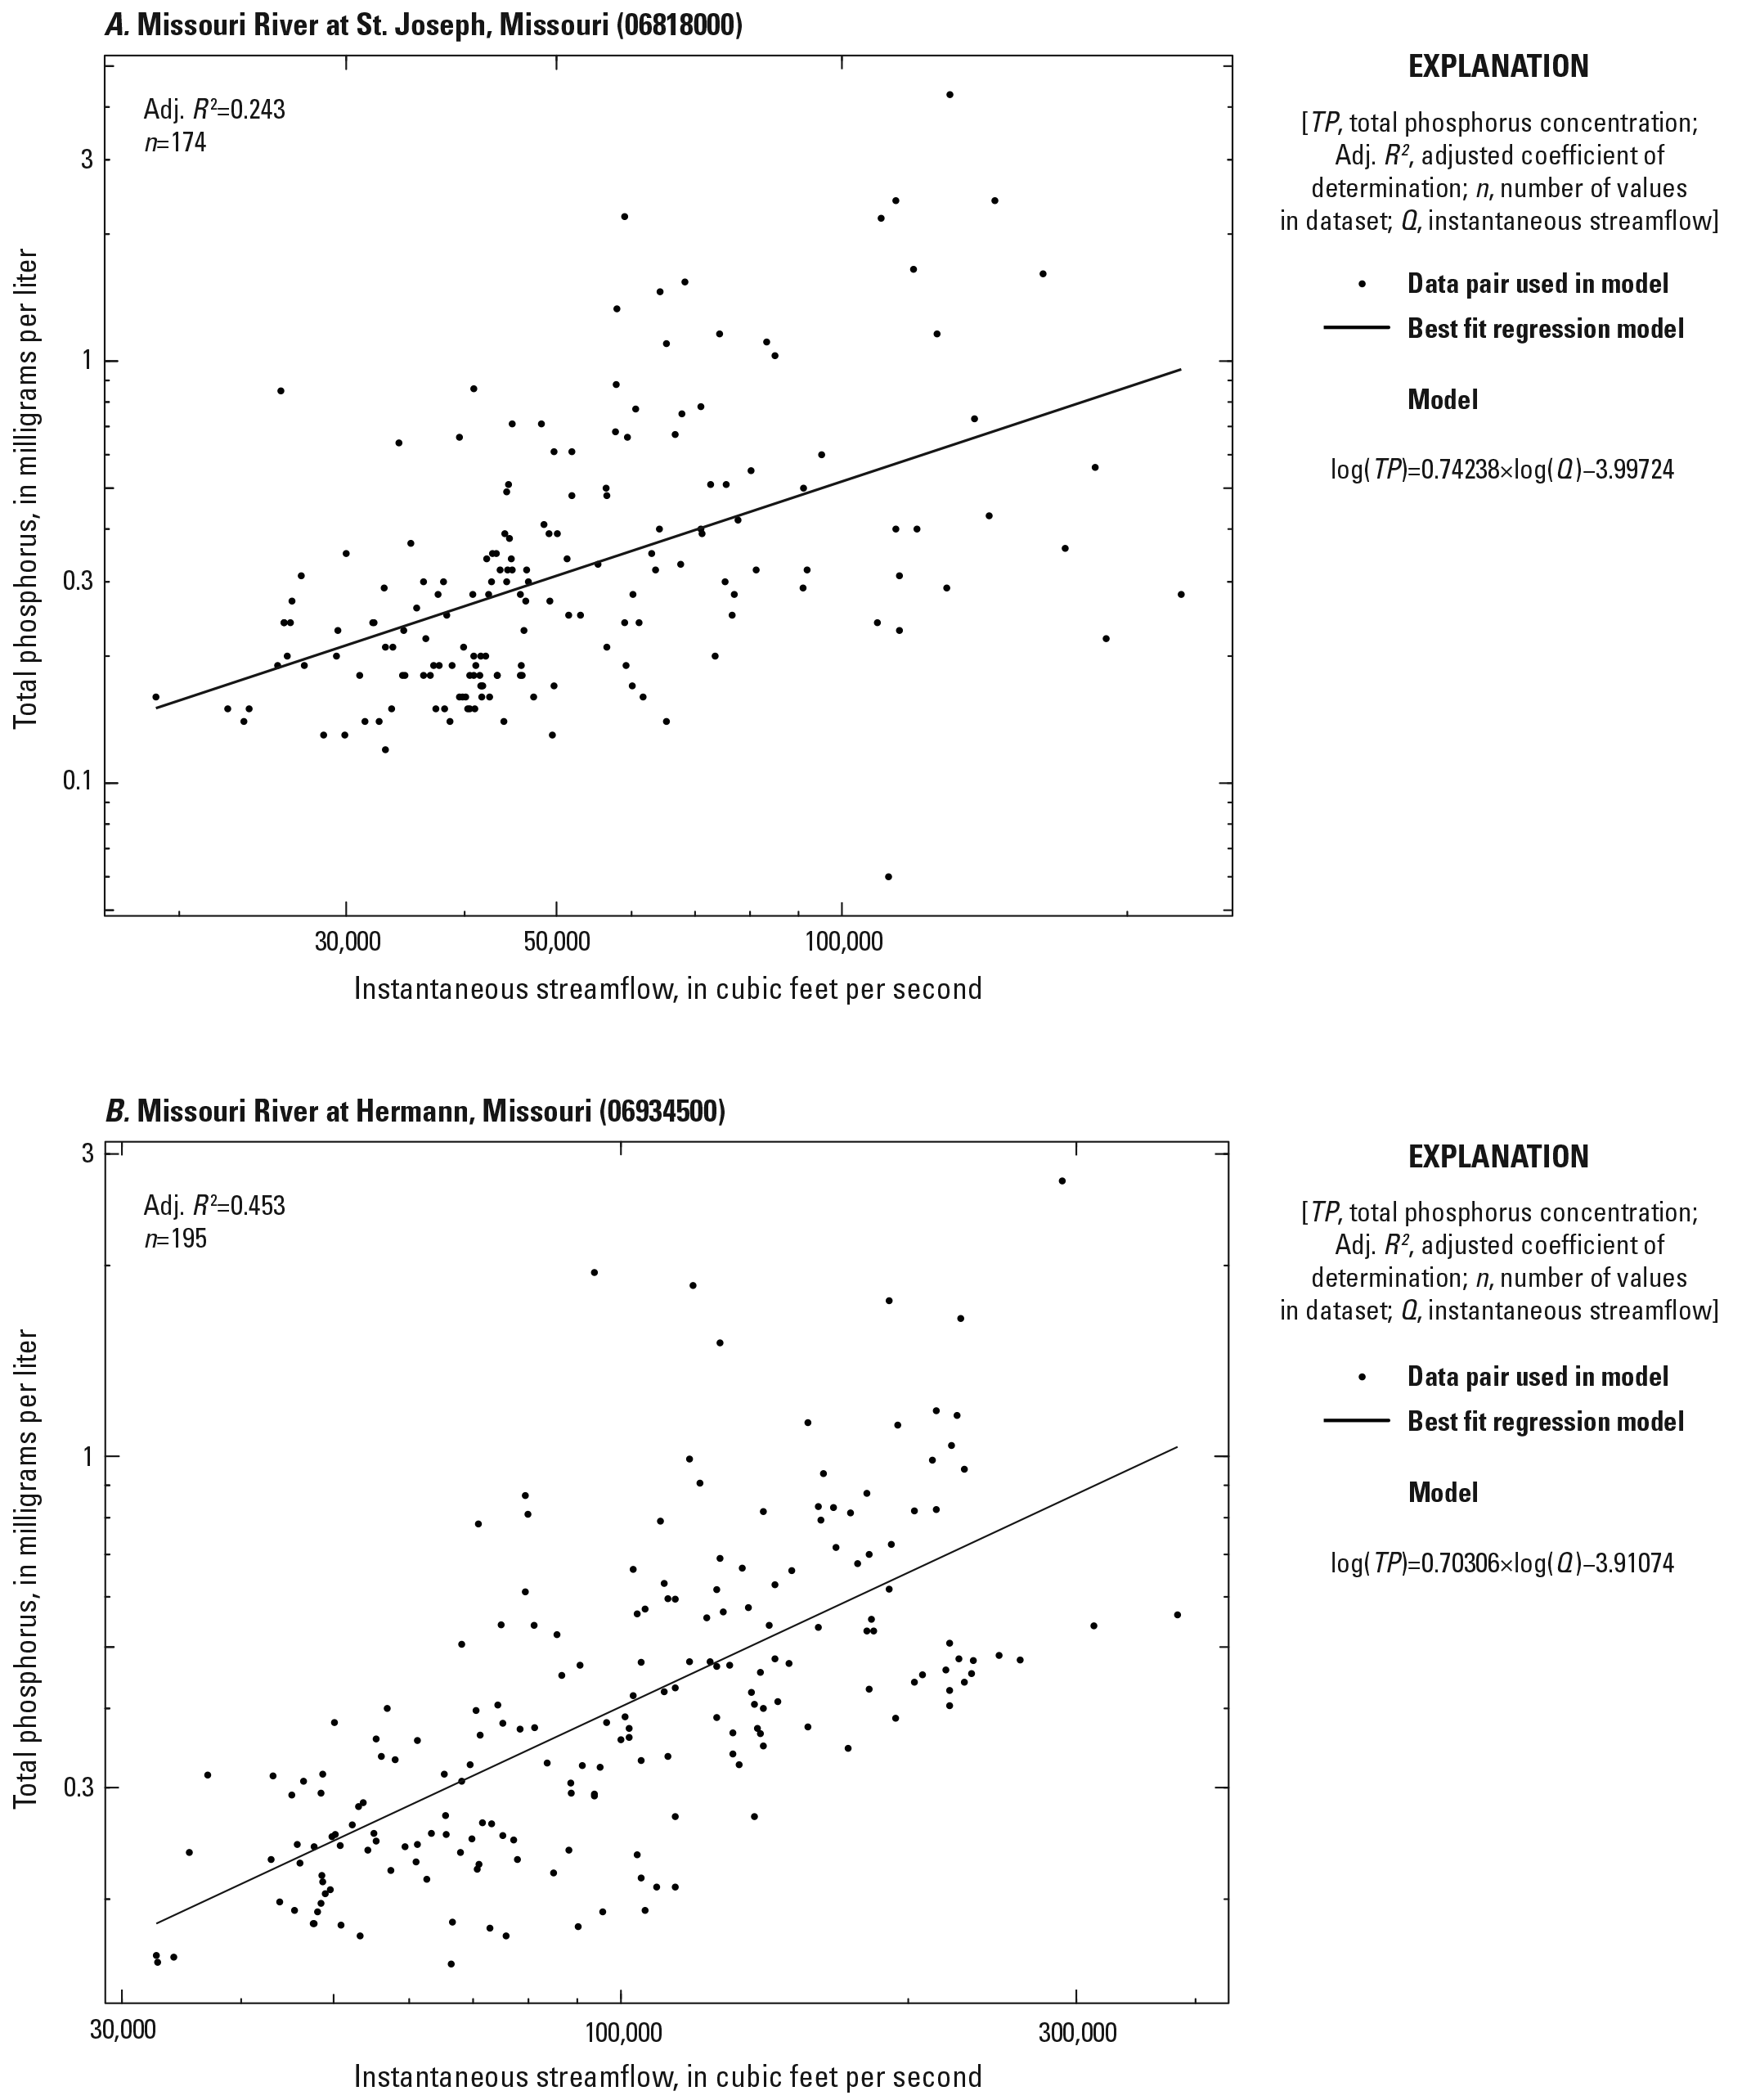
Total phosphorus streamflow-surrogate regression models at the Missouri River at St. Joseph, Missouri, streamgage (U.S. Geological Survey station 06818000) and the Missouri River at Hermann, Mo., streamgage (U.S. Geological Survey station 06934500).
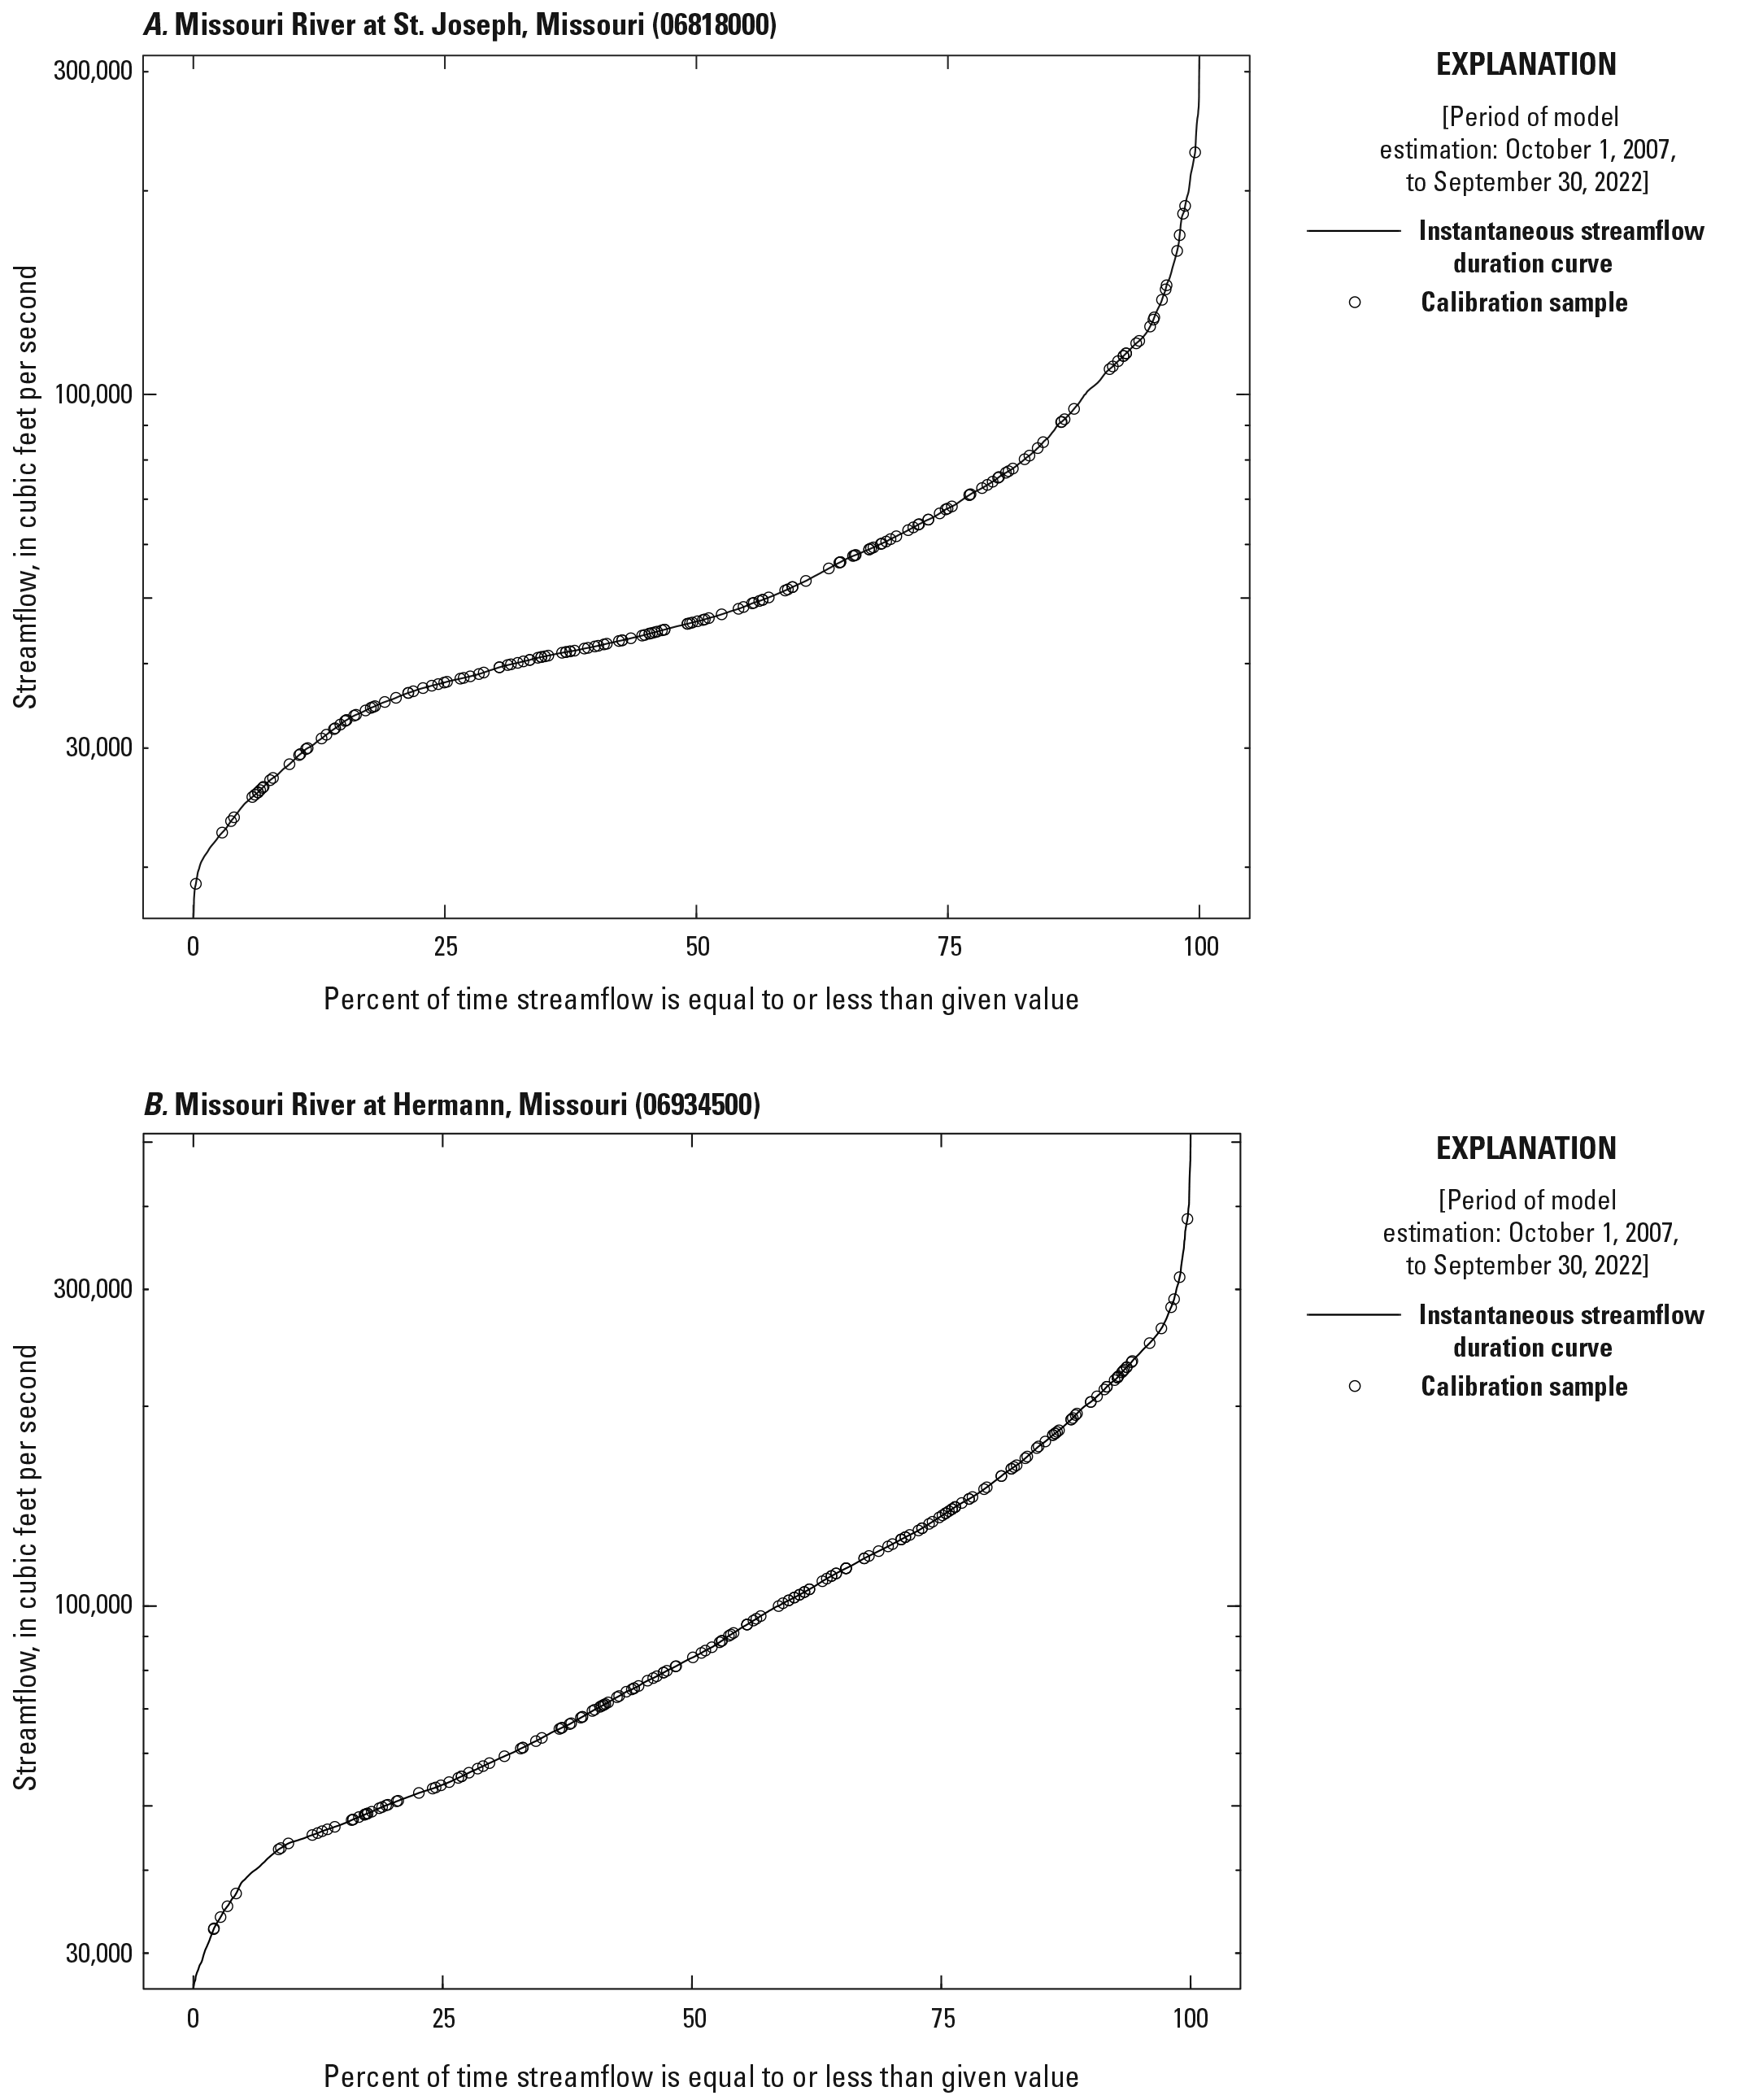
Graphs showing the streamflow duration curves with calibration samples at the Missouri River at St. Joseph, Missouri, streamgage (U.S. Geological Survey station 06818000) and the Missouri River at Hermann, Mo., streamgage (U.S. Geological Survey station 06934500).
Conversion Factors
U.S. customary units to International System of Units
Supplemental Information
Concentrations of chemical constituents in water are given in milligrams per liter (mg/L).
A water year is the period from October 1 to September 30 and is designated by the year in which it ends; for example, water year 2022 was from October 1, 2021, to September 30, 2022.
Abbreviations
AIC
Akaike information criterion
BCF
bias correction factor
FNU
formazin nephelometric unit
LOADEST
LOAD ESTimator
log
logarithm
NLRS
Nutrient Loss Reduction Strategy
NWIS
National Water Information System
NWQN
National Water Quality Network
R2a
adjusted coefficient of determination
RMSE
root mean square error
SPARROW
SPAtially Referenced Regressions on Watershed attributes
USGS
U.S. Geological Survey
WRTDS
weighted regression on time, discharge, and season
YSI
Yellow Spring Instruments
For more information about this publication, contact:
Director, USGS Central Midwest Water Science Center
400 South Clinton Street, Suite 269
Iowa City, IA 52240
319–337–4191
For additional information, visit: https://www.usgs.gov/centers/cm-water
Publishing support provided by the
Rolla Publishing Service Center
Disclaimers
Any use of trade, firm, or product names is for descriptive purposes only and does not imply endorsement by the U.S. Government.
Although this information product, for the most part, is in the public domain, it also may contain copyrighted materials as noted in the text. Permission to reproduce copyrighted items must be secured from the copyright owner.
Suggested Citation
Markland, K.M., 2024, Use of continuous water-quality time-series data to compute total phosphorus concentrations and loads for the Missouri River at St. Joseph and Hermann, Missouri, 2007–22: U.S. Geological Survey Scientific Investigations Report 2024–5097, 26 p., https://doi.org/10.3133/sir20245097.
ISSN: 2328-0328 (online)
Study Area
| Publication type | Report |
|---|---|
| Publication Subtype | USGS Numbered Series |
| Title | Use of continuous water-quality time-series data to compute total phosphorus concentrations and loads for the Missouri River at St. Joseph and Hermann, Missouri, 2007–22 |
| Series title | Scientific Investigations Report |
| Series number | 2024-5097 |
| DOI | 10.3133/sir20245097 |
| Publication Date | October 30, 2024 |
| Year Published | 2024 |
| Language | English |
| Publisher | U.S. Geological Survey |
| Publisher location | Reston, VA |
| Contributing office(s) | Central Midwest Water Science Center |
| Description | Report: vii, 26 p.; Data Release; Dataset |
| Country | United States |
| State | Missouri |
| City | Hermann, St. Joseph |
| Other Geospatial | Missouri River |
| Online Only (Y/N) | Y |
| Additional Online Files (Y/N) | N |


