

Evidence of Nitrate Attenuation in Intertidal and Subtidal Groundwater in a Subterranean Estuary at a Cape Cod Embayment, East Falmouth, Massachusetts, 2015–16
Links
- Document: Report (8.14 MB pdf) , HTML , XML
- Related Work: Scientific Investigations Report 2018–5095 Geochemical conditions and nitrogen transport in nearshore groundwater and the subterranean estuary at a Cape Cod embayment, East Falmouth, Massachusetts, 2013–14
- Data Release: USGS data release - Geochemical data supporting analysis of fate and transport of nitrogen in the nearshore groundwater and subterranean estuary near East Falmouth, Massachusetts, 2015–2016
- NGMDB Index Page: National Geologic Map Database Index Page (html)
- Download citation as: RIS | Dublin Core
Acknowledgments
The support and cooperation of the Seacoast Shores Association and the residents near the study site are deeply appreciated. The laboratory and field support of Mark White, Warren Boothman, Jim Latimer, Jerry Keefe, Mary Garren, and Daniel Granz of the U.S. Environmental Protection Agency, and Marcel Belaval, Douglas Kent, Denis LeBlanc, Jason Sorenson, Jennifer Savoie, Phillip Woodford, Adrian Mann, and Janet Hannon of the U.S. Geological Survey are gratefully acknowledged.
Abstract
Nitrogen dynamics in intertidal and nearshore subtidal groundwater (subterranean estuary) adjacent to the Seacoast Shores peninsula, Falmouth, Massachusetts, were investigated during 2015–16 by the U.S. Geological Survey. The peninsula is a densely populated residential area with septic systems and cesspools that are substantial sources of nitrogen to groundwater. The study area is in the Eel River, an estuarine saltwater embayment connected to the ocean adjacent to the western shore of the peninsula, that was the subject of an earlier study by Colman and others (2018, https://doi.org/10.3133/sir20185095) on nitrogen transport and transformations in groundwater between onshore and offshore locations. The previous study documented the distribution of nitrate concentrations and nitrate attenuation reactions in fresh groundwater beneath the peninsula and the estuary. The current study extended those observations with more detailed sampling and analysis of shallow groundwater from wells near discharge sites beneath the estuary. The current field investigation included sampling of existing wells and installation and sampling of clusters of wells and temporary sampling points in the subterranean estuary, including (1) shallow transects 0.3 to 1.2 meters (m) deep extending from 1 to 13.5 m offshore and (2) deeper wells (from 1.83 to 4.88 m deep) extending from 4.3 to 14.3 m offshore.
Measurements of hydraulic-head gradients 2–5 m below the sediment/water interface in the intertidal and nearshore subtidal zones indicated that groundwater flow generally was upwards (towards the estuary) under all tide conditions in October 2016. The magnitude of the gradient was greatest during low tide conditions, indicating that groundwater discharge likely decreased during high tides.
Measurements of specific conductance in shallow groundwater in the subterranean estuary in three transects perpendicular to shore were consistent with the existence of saltwater flow cells (infiltration of overlying saline water, mixing with fresh groundwater, and discharge to the overlying saline water) in the intertidal and nearshore subtidal regions. The size of these flow cells was variable in space and time and dependent on the elevation of the tide (spring or neap). At this location in the Eel River subterranean estuary, and offshore to at least 13.5 m, offshore flow of fresh groundwater apparently prevented a deeper saltwater wedge from discharging to the surface.
Nitrate concentrations in shallow groundwater (30 to 122 centimeters [cm] depth) were variable in space and time, ranging from not detectable to 600 micromoles per liter (µmol/L) (8.4 milligrams per liter as N), and were highest in June 2016 at depths from 61 to 122 cm below the sediment/water interface and from 4 to 9 m offshore. Nitrate generally was not detectable in saline shallow groundwater at 30-cm depth or at any depth from 30 to 122 cm from 10 to 13.5 m offshore. Dissolved oxygen concentrations were suboxic (less than 16 µmol/L) in 60 percent of the sampled subterranean groundwater beneath the intertidal and subtidal zones. In the remaining sites, the range of dissolved oxygen concentrations was from 18 to 272 µmol/L and the median concentration was 43 µmol/L.
Evidence for microbial nitrate reduction (denitrification and possibly anammox) was provided by the distribution of the reaction product nitrogen gas (excess N2, or N2MIC), as determined from analysis of the dissolved nitrogen gas and argon gas (Ar) concentrations in groundwater samples. Excess nitrogen gas provided evidence for nitrate reduction in shallow groundwater below the subtidal and, to a lesser extent, intertidal zones adjacent to the Seacoast Shores peninsula. These zones, where evidence for nitrate reduction was detected, were in fresh and brackish groundwater near subtidal or intertidal saltwater cells where discharging fresh groundwater mixed with infiltrating saline water. Infiltrating seawater may have supplied organic carbon, one of several potential electron donors that are required for denitrification. Other potential electron donors, such as organic carbon, iron, manganese, hydrogen, methane, ammonium, elemental sulfur, or sulfide phases, may have been supplied by the estuarine sediments. Drainage from surface runoff near the shore also may have supplied organic carbon to fresh groundwater near the intertidal saltwater cell.
The highest amounts of nitrate converted to excess nitrogen gas were estimated to be in the range of 230 to 430 µmol/L in nearly fresh groundwater near the subtidal saltwater cell at depths of 61 to 122 cm below the sediment/water interface and from 10 to 13.5 m offshore. Evidence of denitrification within 10 m of the shore was sparse (generally limited to less than 50 µmol/L of N2-N) despite the presence of high nitrate concentrations. The spatial distribution of estimated nitrate reduction in the intertidal and nearshore subtidal fresh and brackish groundwater may be related to local variability in the distribution of reactive electron donors in those zones. Variations in the amount of nitrate reduction to nitrogen gas were not clearly related to potential aqueous electron donors such as dissolved organic carbon, nor to potential reaction products such as alkalinity, but may have been controlled by combinations of aqueous and solid-phase reactants. The distribution of relatively shallow fresh groundwater containing nitrate could indicate potential nitrate discharge areas in the lower intertidal zone and uncertain locations farther offshore; however, the data did not extend all the way to the sediment/water interface or to the offshore freshwater limit. This study confirmed substantial loss of nitrate from some of the fresh and brackish groundwater in shallow subestuarine sediments prior to discharge but did not quantify how much nitrate eventually discharged to the estuary.
Introduction
Human-caused eutrophication in coastal ecosystems and the need to understand the fate of excess nitrogen is a complex global problem that is influenced by ongoing climate change and changes in atmospheric deposition of nitrogen (Paerl and others, 2014; Cloern and others, 2016; Valiela and others, 2016). There is substantial interest and urgency in understanding the fate and transport of nitrogen that is released from septic systems in high-density residential neighborhoods on Cape Cod that subsequently infiltrates the nearshore groundwater and subterranean estuaries in multiple embayments. This nitrogen is a pollutant that at sufficient concentrations and under certain conditions can cause eutrophication, macroalgal blooms, and associated environmental problems. Nitrogen loading to coastal embayments on Cape Cod, Massachusetts, is one of the more pressing environmental challenges faced by coastal communities in the northeastern United States (Valiela and others, 1992; Nixon, 1995; Short and Burdick, 1996; Valiela and others, 2000; Howarth and others, 2002; Valiela and others, 2016).
External nitrogen loading increases the growth of phytoplankton and macroalgae in coastal marine systems in the northeastern United States (Howarth, 1988; Valiela, 2006). In recent decades, the relative contribution to nitrogen loading from wastewater inputs has increased while the contribution of atmospherically deposited nitrogen has decreased (Valiela, Collins, and others, 1997; Valiela, McClelland, and others, 1997). Increased supply of nitrogen causes decreased water clarity from increased algal growth and encourages the growth of epiphytes on submerged aquatic vegetation that reduces light penetration to the detriment of more desirable plant species, for example, eel grass, and damages ecosystems favoring finfish and shellfish (Thomsen and others, 2012; Rasmussen and others, 2013; Nelson, 2017). Nitrogen inputs to coastal ecosystems also are partially responsible for ocean acidification through biogeochemical processes associated with eutrophication (Cai and others, 2011; Gledhill and others, 2015; Rheuban and others, 2019) that can harm vulnerable calcifying species that are important fisheries in the northeastern United States (Ekstrom and others, 2015; Hare and others, 2016). Nitrogen additions also can stimulate microbial decomposition of organic matter in coastal marsh sediments, potentially reducing their capacity for carbon sequestration (Bulseco and others, 2019). Because tourism, retirement, and fishing are the mainstays of the Cape Cod economy (Cape Cod Chamber of Commerce, 2013), degradation of the coastal aquatic ecosystems is an important issue on Cape Cod.
In 2000, recognizing the importance of nitrogen in eutrophication of Cape Cod waters, the Massachusetts Department of Environmental Protection established the Massachusetts Estuaries Project to evaluate nitrogen loading and capacity in 89 Cape Cod embayments (Massachusetts Department of Environmental Protection, 2018). In approximately one-half of the embayments to date, these evaluations have established regulatory numeric nitrogen loading limits, or total maximum daily loads (TMDLs) (Massachusetts Department of Environmental Protection, 2018). Currently, Massachusetts towns covered by the Massachusetts Estuaries Project are implementing nitrogen remediation actions that would meet the TMDL requirements.
On Cape Cod, principal sources of nitrogen are from onsite disposal of domestic sewage (through cesspools and septic systems) and lawn fertilizer (Valiela and others, 2000). Nitrogen transport from these sources to coastal water is largely through groundwater because streams are uncommon on the sand deposits of the narrow peninsulas. In much of the Cape Cod aquifer, where subsurface conditions are aerobic and the predominant form of nitrogen is nitrate, transport is likely to be conservative. Aerobic onsite wastewater-treatment systems (septic system leaching fields) have been shown to be inefficient at removing inorganic nitrogen (Costa and others, 2002; Van Cuyk and others, 2001). Along the flow path from onshore groundwater to submarine groundwater discharge sites, some portion of inorganic nitrogen commonly is attenuated by conversion to gaseous forms but a substantial fraction can be transported through the subsurface to the estuary (Valiela and others, 1992; Paerl, 1997; Charette and Sholkovitz, 2002). For example, nitrate reduction can occur where groundwater encounters onshore or offshore anaerobic sediments containing organic carbon or other electron donors (originating from infiltrating seawater or decomposition of particulate phases). Nitrogen attenuation reactions are not considered in the conservative assumptions used in determining TMDLs (Massachusetts Department of Environmental Protection, 2018) and are less well documented in the subterranean estuary than in many other groundwater settings affected by agricultural and wastewater nitrogen inputs.
Where subsurface conditions are anaerobic, nitrate, nitrite, and ammonium can be attenuated, that is, converted to gaseous forms (nitric oxide [NO], nitrous oxide [N2O], and nitrogen gas) through the bacterially mediated processes of denitrification and anaerobic ammonium oxidation (anammox) (Thamdrup and Dalsgaard, 2002; Strous and Jetten, 2004). Nitrate also can be microbially converted to ammonium through the process of dissimilatory nitrate reduction to ammonium (DNRA) (Giblin and others, 2013). Recently, it has been shown that bacterial denitrification occurs in sandy coastal sediments where tidal cycles resulted in fluctuating oxic to anoxic conditions (Marchant and others, 2017). Denitrification generally refers to microbial respiration, whereby nitrate nitrogen is reduced to gaseous forms of nitrogen (N2O and N2) in response to the oxidation of an electron donor such as organic matter, sulfide, methane, or reduced iron oxides (Knowles, 1982). Nitrogen gas can be released to the atmosphere or reduced to ammonia through nitrogen fixation in coastal sediments (Newell and others, 2016). One of the intermediate gaseous products of bacterial denitrification, nitric oxide that is produced from nitrite, can be chemically denitrified in the presence of Fe(II) or denitrified by fungi; in both cases, it is converted to N2O that can subsequently be released to the atmosphere (Wankel and others, 2017). Denitrification is common in aquatic anaerobic or suboxic environments in freshwater, wetlands, and estuarine and marine waters, as well as groundwaters where geochemical conditions are suitable (Smith and others, 1991; Korom, 1992; Seitzinger and others, 2006). Denitrification was reported to be an important nitrate reducing mechanism in a nitrate-contaminated aquifer on Cape Cod (Smith and Duff, 1988; Smith and others, 2004).
In DNRA, microbes oxidize organic matter and use nitrate as an electron acceptor for respiration, reducing it first to nitrite and then to ammonium. Denitrification and DNRA compete for nitrate. Denitrification is usually the dominant nitrate reduction process; however, certain factors can favor DNRA (Giblin and others, 2013). DNRA may be favored when concentrations of organic matter are high and concentrations of nitrate are low (Tiedje and others, 1983; Dong and others, 2011) or when salinity increases (Giblin and others, 2010). DNRA retains inorganic nitrogen in the sediment as ammonium, which could later be converted back to nitrate in an aerobic environment.
In anammox, ammonium and nitrite are converted into nitrogen gas, and nitrite is used as a terminal electron acceptor (Thamdrup and Dalsgaard, 2002; Strous and Jetten, 2004). The anammox reaction does not require organic carbon, but it does require nitrite that, in anaerobic environments, would most likely be available if nitrate was present and anammox was coupled with ongoing denitrification or DNRA (where nitrite was produced). Similarly, fungal-mediated denitrification or abiotic (Fe(II)-mediated chemodenitrification) reactions (Wankel and others, 2017) converting nitrite to N2O require nitrate conversion to nitrite. Gaseous forms of nitrogen are released to the atmosphere and therefore are unavailable to algae, potentially mitigating eutrophic conditions. Conditions conducive to attenuation and losses of inorganic nitrogen have been documented in landfill plumes and in large plumes formed by land disposal of municipal sewage (Smith and others, 1991; Christensen, and others, 1994; DeSimone and Howes, 1995; Repert and others, 2006) and in many other aquifer settings. Denitrification and anammox processes have been documented in a wastewater-contaminated plume in the Cape Cod aquifer system (Smith and Duff, 1988; Smith and others, 2004, 2015).
The current study was conducted to address questions that arose in a previous study at the Eel River, a coastal embayment in East Falmouth, Massachusetts, on western Cape Cod (Colman and others, 2018). The goal of the previous study was to identify pathways of nitrogen transport and areas of potential nitrogen attenuation in the subterranean estuary through bacterially mediated denitrification or anammox. Colman and others (2018) found evidence for nitrate reduction in some portions of the subterranean estuary but concluded that further study was needed to determine the distribution of nitrate reduction in shallow groundwater below the intertidal and nearshore subtidal zones. The goal of this follow-up project was to investigate nitrogen attenuation in the subterranean estuary below the intertidal and nearshore subtidal zones at the same study site to refine the conceptual model of nitrogen attenuation at the Eel River subterranean estuary. This study includes geochemical and hydraulic information in the subterranean environment of the intertidal and adjacent subtidal zones with a focus on the sediment/water interface and shallow offshore zones where fresh and saline water mix. This report includes details of field investigations, analytical methods, results, and discussion of geochemical indicators of nitrate reduction. The results presented in this report may help inform the design of future nitrogen remediation investigations in peninsular, coastal areas with high-housing density adjacent to saline surface water that may be targeted for sewer installation to prevent coastal eutrophication.
Geographic, Geologic, and Hydrologic Setting
The Seacoast Shores neighborhood occupies a peninsula that extends southward from the mainland area of Cape Cod towards Vineyard Sound (fig. 1). The peninsula is about 2.6 kilometers (km) long and as much as 615 meters (m) wide and is bordered by saline tidal surface-water bodies that include the Eel River on the west and Eel Pond and the Childs and Seapit Rivers on the south and east. Land-surface altitudes generally decrease from about 10 m on the north to less than 1 m on the south. The topography generally is flat, with steep bluffs along the sides of the peninsula and a few low-lying areas in the interior.
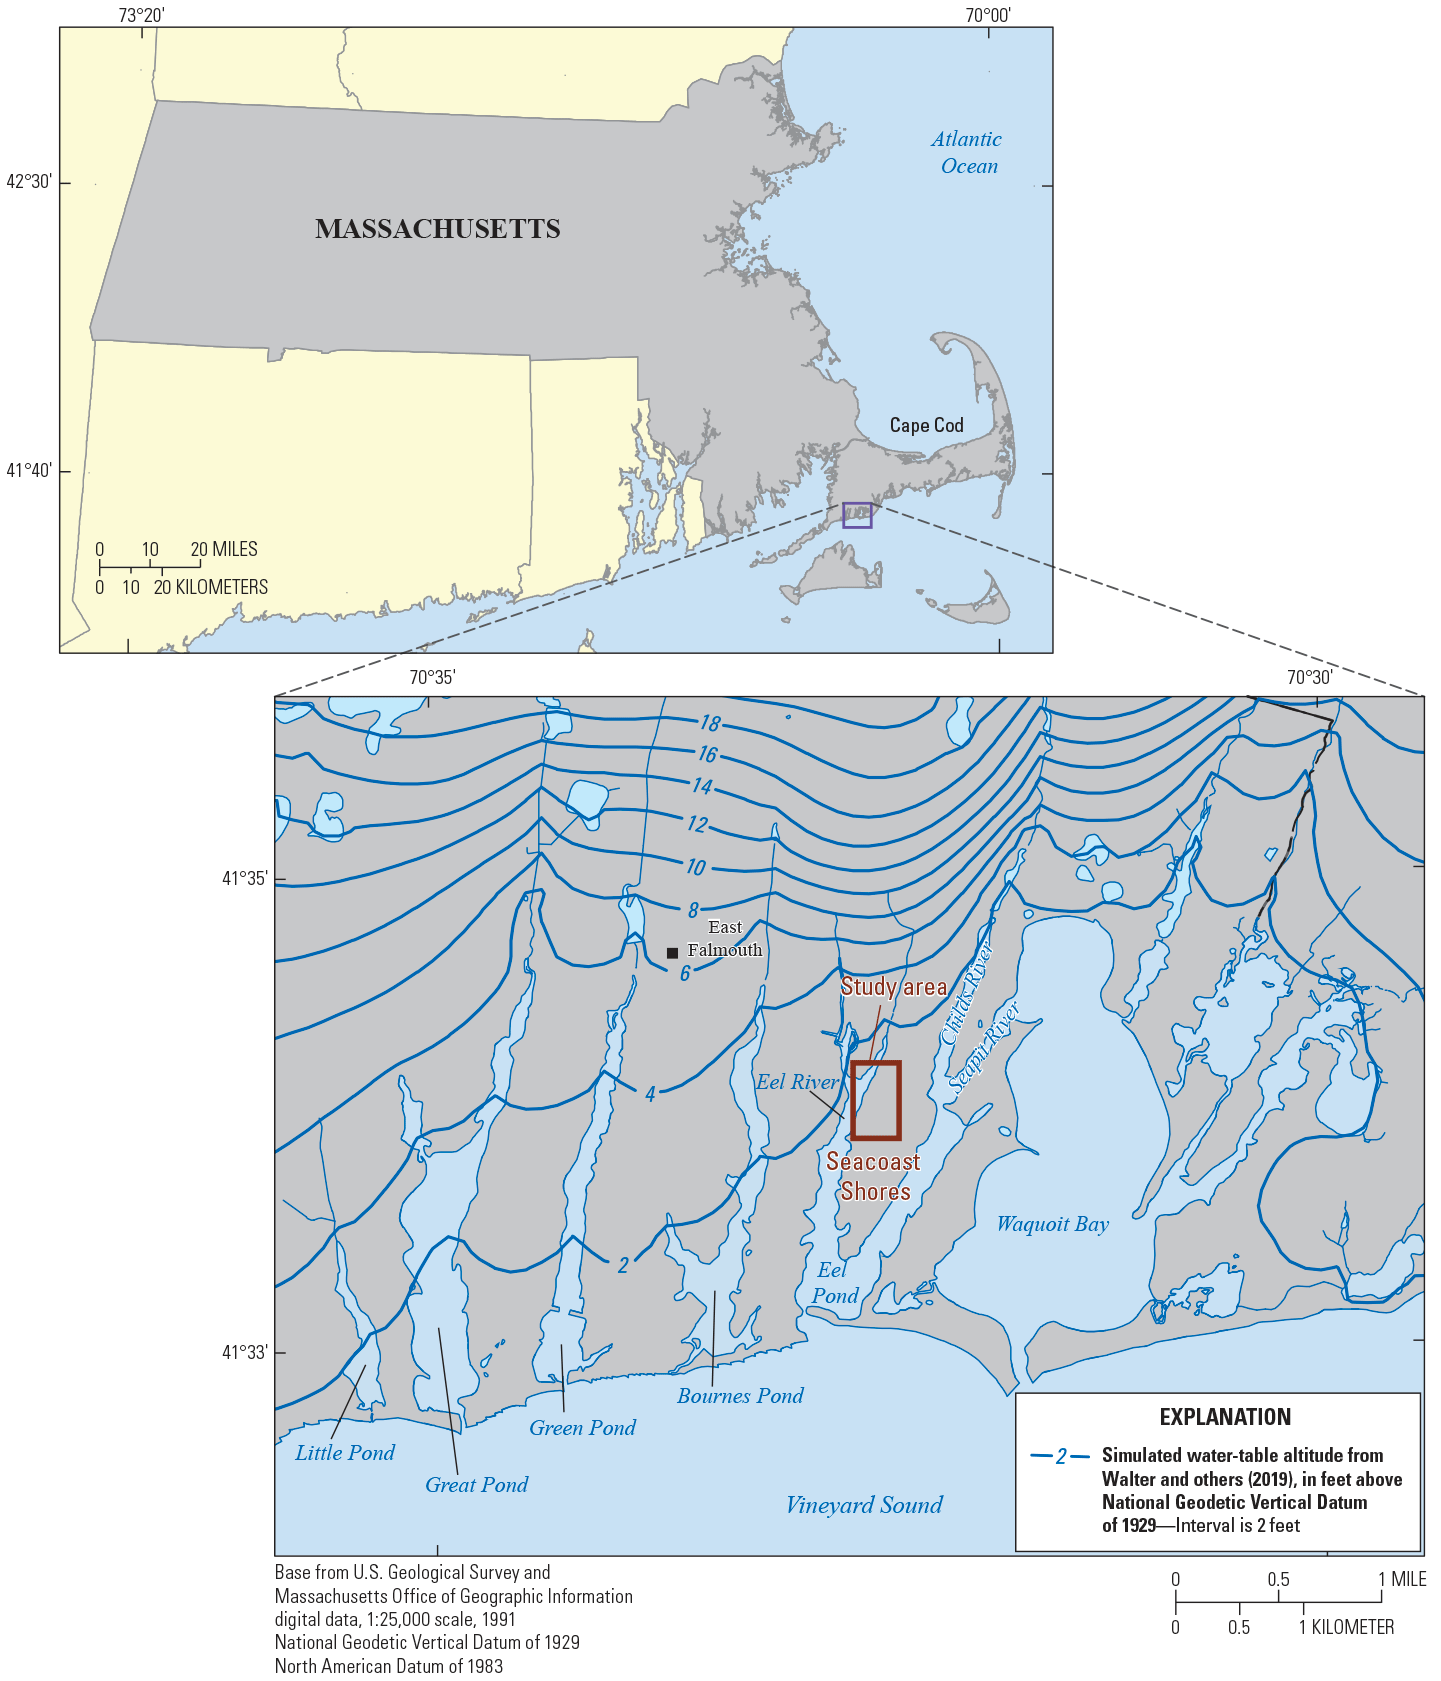
Map showing coastal embayments in southern Falmouth, regional water-table contours, and location of the study area at the Eel River and Seacoast Shores peninsula in East Falmouth, Massachusetts.
The peninsula and its adjacent narrow saltwater bays are similar to other peninsulas and bays along the southwestern shore of Cape Cod near East Falmouth. The bays occupy valleys that were cut into the glacial outwash plain at the end of the Pleistocene Epoch. The bays were subsequently drowned when sea level rose, leaving the intervening areas of the outwash plain as long, narrow peninsulas interspersed with coastal embayments. The aquifer materials are glacial outwash sand and gravel that generally grades downward into fine-grained glaciolacustrine sand, silt, and clay (Oldale, 1992; Masterson and others, 1997; Hull and others, 2019). The unconsolidated sediments are about 90 m thick and lie on crystalline, granitic bedrock (Fairchild and others, 2013).
The Seacoast Shores peninsula is a part of the Sagamore flow lens, a part of the Cape Cod aquifer system consisting of several hydrogeologic units (outwash plains, terminal and ground moraines, and ice contact deposits) primarily composed of sand and gravel, with some silt and clay. The units were deposited during the late glaciation of New England. The regional aquifer is a shallow, unconfined hydrologic system in which groundwater flows radially outward from the top of a water-table mound that underlies western Cape Cod (Masterson and others, 1997; Walter and Whealan, 2005; Walter and others, 2019). The horizontal hydraulic conductivity of the sand and gravel is estimated to be about 60–110 meters per day and that of the interbedded fine sands and silts in the aquifer less than 15 meters per day (Walter and Whealan, 2005; Hull and others, 2019). The study area is located along the southern coastline, where the regional groundwater system discharges to Vineyard Sound. The peninsular freshwater aquifer is bounded at the top by the water table, at the bottom by the freshwater/saltwater interface, and at the lateral boundaries by the tidal saltwater bodies. The freshwater aquifers beneath the peninsulas are seaward extensions of the much larger regional groundwater-flow system that also discharges to the tidal saltwater bodies.
The Seacoast Shores peninsula receives an estimated 114 centimeters per year (cm/yr) of precipitation. Slightly more than one-half of the precipitation recharges the aquifer at the water table (LeBlanc and others, 1986); the remainder is lost to evapotranspiration. Surface runoff is negligible owing to the sandy soils and low topographic relief of the area. Water supply is public water obtained from wells and a lake inland from the peninsula. Data from the Cape Cod Commission (2015) indicated that about 1,000 dwellings on the peninsula account for about 10.5 cm/yr of wastewater disposal averaged over the total 1.2 square kilometer (km2) area of the peninsula (Colman and others, 2018). The concentration of nitrate in domestic wastewater reaching groundwater on Cape Cod is estimated to be about 3,000 micromoles per liter (µmol/L) (Eichner and Cambareri, 1992). Colman and others (2015) estimated that the volume-averaged concentration of dissolved nitrogen in groundwater in the Seacoast Shores peninsula based on wastewater inputs and dilution by recharge from precipitation should be about 500 µmol/L. These estimates indicate an annual loading of 3,675 kg N/km2 to the aquifer below the Seacoast Shores peninsula. Colman and others (2018) summarized the historical residential development on the Seacoast Shores and the legacy of onsite domestic wastewater disposal that led to contamination of the subterranean aquifer with nitrogen.
Previous Investigations and Conceptual Flow Model
Previous studies on Cape Cod have examined the Seacoast Shores groundwater system, the Cape Cod subterranean estuary, tidal mixing at Waquoit Bay, and the fate of nitrogen in the subterranean estuary at the Seacoast Shores peninsula.
Seacoast Shores Groundwater System
In a previous study, the Cape Cod Commission installed monitoring wells and collected sediment and groundwater samples at three sites along an east-west transect across the Seacoast Shores peninsula to examine nitrogen concentrations in shallow groundwater in an area served by onsite wastewater disposal (Thomas Cambareri, Cape Cod Commission, oral presentation for Waquoit Bay National Estuarine Research Reserve Research Exchange Day, 1994). Details of that investigation were reviewed by Colman and others (2018). The borings encountered mostly medium to coarse sand. The altitude of the water table at three sites was approximately 0.27 meters (m) above sea level (National Geodetic Vertical Datum of 1929 [NGVD 1929]). The freshwater lens overlying saltwater was about 14 m thick near the western side and middle of the peninsula where the present study was conducted and about 8 m thick at the eastern site. Elevated nitrate concentrations, as high as 1,200 micromoles per liter (µmol/L), were measured in the deepest fresh groundwater (about 11 m below the water table and immediately above the freshwater/saltwater interface in an onshore well about 20 m from the shore) (Colman and others, 2018, figs. 3 and 5).
Cape Cod Subterranean Estuary
The subterranean estuary is a zone near the coastline and below the sediment/water interface where freshwater and saltwater mix and where biotic and abiotic reactions can occur (Moore, 1999). Groundwater must pass through the subterranean estuary to move from land to offshore surface water. Past investigations of the subterranean estuary on Cape Cod focused primarily on the upper end of Waquoit Bay, Falmouth, Massachusetts, and Salt Pond, Eastham, Massachusetts, and were briefly reviewed by Colman and others (2018). Of these investigations, only the work at Waquoit Bay included estimation of nitrogen loss in the subterranean estuary, and results there varied. Where nitrate attenuation was observed (Kroeger and Charette, 2008), it occurred in regions of mixing between nitrate-bearing, suboxic, fresh groundwater and ammonium-bearing near-anoxic fresh or saline groundwater. Whether nitrate attenuation occurs in a subterranean estuary may depend on specific geochemical and hydrologic conditions that are spatially, seasonally, and interannually variable.
Conceptual Model of the Subterranean Estuary Flow
The physics of tidal mixing have been investigated at Waquoit Bay by using two-dimensional computer models calibrated by seepage-meter, subsurface-salinity, and hydraulic-head measurements (Michael and others, 2003, 2005; Abarca and others, 2013). The modeling efforts from previous investigations at Waquoit Bay have led to a conceptual flow model for the subterranean estuary (fig. 2). In the conceptual model, fresh or mixed brackish groundwater discharge (FGD) is focused in the lower intertidal zone. Intertidal saltwater discharge (ISD) from an intertidal saltwater cell (ISC) formed by intertidal saltwater infiltration (ISI) occurs just landward of the FGD. Deep saltwater discharge (DSD) from a deep saltwater wedge (DSW) occurs seaward of the FGD. Farther offshore, deep saltwater infiltration (DSI) occurs seaward of the deep saltwater discharge. The ISC is tidally driven such that the cell is filled by ISI during high tides and discharges saltwater (ISD) as the tide recedes. This tidally driven recirculation is sensitive to the amplitude of the tides, being greatest during spring tides and waning or disappearing during neap tides (Abarca and others, 2013).
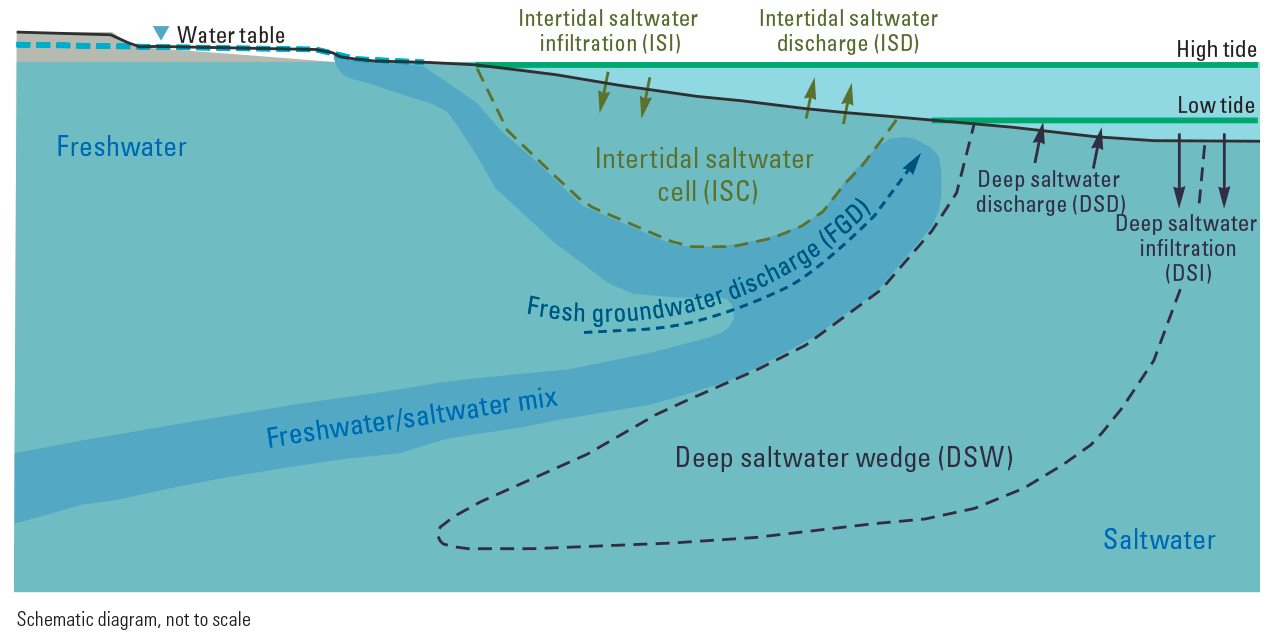
Schematic diagram showing conceptual model of the subterranean estuary at Waquoit Bay, East Falmouth, Massachusetts (modified from Abarca and others, 2013; copyrighted; used with permission). DSD, deep saltwater discharge; DSI, deep saltwater infiltration; DSW; deep saltwater wedge; FGD, fresh groundwater discharge; ISC, intertidal saltwater cell; ISD, intertidal saltwater discharge; ISI, intertidal saltwater infiltration; arrows indicate inferred directions of groundwater flow.
Colman and others (2018) showed that the conceptual model for Waquoit Bay does not fully explain groundwater flow at the current study location in the Eel River embayment. In the Eel River embayment, Colman and others (2018) found evidence for FGD in the intertidal zone and just seaward of the intertidal zone; however, they did not find evidence for a deep saltwater wedge (DSW) driven by DSI and DSD (fig. 3A). Instead, their measurements indicated broader distribution of deeper fresh groundwater beneath the estuary that extended offshore as far as they sampled (about 18 m offshore), consistent with geophysical transient electromagnetic surveys along the entire length of the Eel River (Lane and others, 2020). Lane and others (2020) reported fresher groundwater extending from the surface sediment to at least 10 m depth underlain by an apparent transition toward more saline groundwater along a north-to-south track line near the center of the river at the current study location. These findings and other analyses, which are described in the section “Hydrogeologic and Geochemical Observations,” suggest a different conceptual model for fresh groundwater flow in the Eel River subterranean estuary, as illustrated in figure 3.
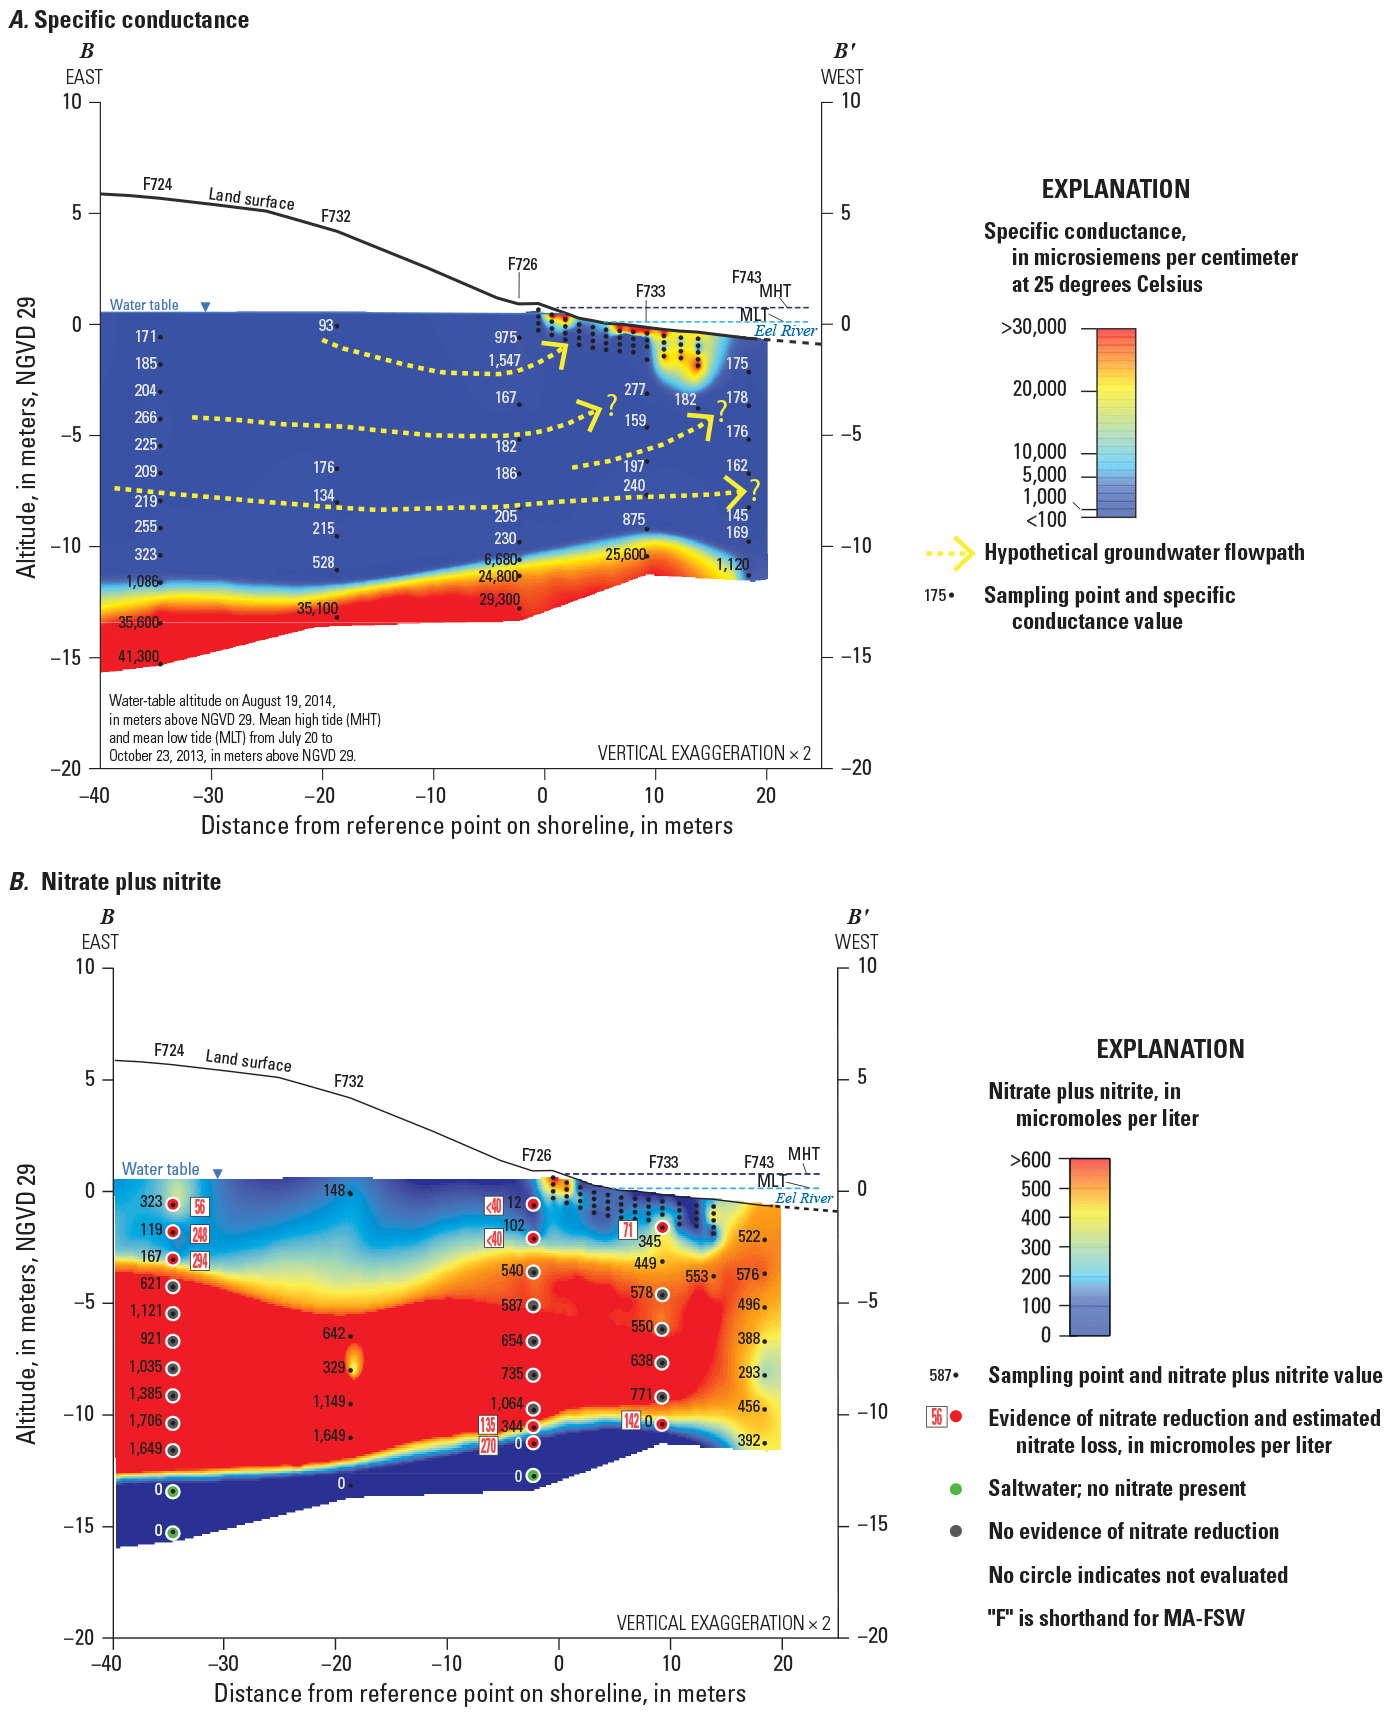
Section B–B′ showing distribution of A, specific conductance, and B, measured nitrate plus nitrite in groundwater and selected features of the conceptual model of nitrogen transport and attenuation, including estimated nitrate loss at selected points, along transect B–B′ beneath the Eel River, Seacoast Shores peninsula, East Falmouth, Massachusetts, September 5–25, 2013. (Modified from Colman and others, 2018, fig. 3A).
Fate of Nitrogen in the Subterranean Estuary at Seacoast Shores Peninsula
An assessment of potential nitrogen attenuation in the subterranean estuary near the Eel River embayment, adjacent to a densely populated coastal community (Seacoast Shores peninsula, Falmouth Massachusetts), was conducted in 2013 and 2014 (Colman and others, 2018). A network of onshore and estuarine nearshore wells was established to track dissolved nitrogen and identify flow paths, recharge areas, and zones of nitrogen attenuation. The primary goals of that study were to obtain information on the occurrence of nitrogen attenuation and how nitrogen losses could affect loading of wastewater nitrogen to the estuary. Water levels and hydraulic gradients indicated that the water table generally sloped downwards and northwest towards the Eel River from the center of the peninsula and that fresh groundwater was flowing upward on the western side of the peninsula and discharging into the Eel River.
Colman and others (2018) determined that two of the necessary requirements for nitrate reduction by denitrification or anammox (anaerobic environment and relatively high nitrate concentrations) are widespread in groundwater beneath the peninsula. They measured geochemical indicators for evidence of nitrate reduction, including concentrations of the reaction product nitrogen gas, stable isotope ratios of nitrate and nitrogen gas, and changes in alkalinity. Evidence for attenuation of nitrate inputs to the Eel River by nitrate reduction was limited to two vertical intervals. A shallower nitrate reduction interval was identified near the water table in fresh groundwater onshore and, also, at one location offshore. Nitrate reduction in this interval may be related to particular recharge conditions at nearby sources, or to an interval of fine-grained sediments at about the same altitude (−1 to −6 m relative to the NGVD 1929) where flow is slower and reactive electron donors such as solid organic carbon, iron, or sulfide phases may be present to drive the reduction (Di Capua and others, 2019). A deeper nitrate reduction interval was identified near the freshwater/saltwater transition zone. Nitrate reduction in this interval may be related to mixing of freshwater containing nitrate and saltwater containing dissolved organic carbon (DOC) and ammonium, or to fine-grained sediments near the transition zone.
The shallow and deep nitrate reduction intervals were separated vertically by a 7- to 8-m-thick zone of freshwater containing nitrate but with no evidence of nitrate reduction (Colman and others, 2018, fig. 32). Colman and others (2018) concluded that the absence of evidence for nitrate reduction in the intermediate depth interval may result from the lack of reactive electron donors in the water or aquifer material.
Colman and others (2018) observed that a shallow intertidal saltwater flow cell was formed during a spring tide by saltwater infiltration during tidal run-up on the beach. They found variable nitrate concentrations in shallow groundwater beneath intertidal and subtidal zones of the estuary and speculated that nitrate reduction might occur if nitrate-containing fresh groundwater passed through reducing sediments or mixed with saltwater containing DOC before discharging in these areas. However, they did not evaluate shallow groundwater beneath the intertidal or subtidal zones systematically for evidence of nitrate reduction. They suggested further studies in shallow offshore groundwater could improve understanding of the fate of septic-derived inorganic nitrogen near potential discharge areas in the estuary. The current study was undertaken to investigate whether nitrate reduction was occurring in these shallow offshore groundwater environments that were not fully characterized in the previous study.
Well Installation
Pushpoint samplers (MHE Products, East Tawas, Michigan) for collection of water samples were installed vertically into the bottom sediments beneath the Eel River estuary to the desired depth to sample groundwater along transects A–A′ and D–D′ (fig. 4). Each sampler consisted of a stainless steel 3.175-cm-diameter, 15.24-cm-long, 0.010-slot well screen connected to 152.4-cm lengths of 3.175-cm-diameter stainless steel pipe. Multiple pushpoints at 12 approximately evenly spaced locations from 1 m onshore to 13.5 m offshore were installed along these transects. The positions of offshore locations are reported relative to the shoreline. The depths and horizontal distances from the shoreline of all well points in transects A–A′, B–B′, C–C′, and D–D′ are shown in figure 5 and reported in Huntington and others (2024). The latitude and longitude of the location of the shoreline for each transect are listed for the points described as 0.0 feet along each east-west transect (Huntington and others, 2024). The distances and directions from the shoreline referred to in this report correspond to the values on the x-axes for all relevant figures. Four pushpoints were installed in each of the 12 clusters. The samplers were installed so that the bottoms of the well screens were positioned at 30, 61, 91, or 122 cm below the sediment/water interface. Three additional permanent Solinst well point clusters (transect C–C′, fig. 4) were installed parallel to and about 3 m northeast of transect D–D′. These clusters were located 4.3, 9.8, and 14.3 m from the shore. The three Solinst well points in these clusters were installed so that the bottom of the well screens were positioned at depths of 1.83, 3.35, and 4.88 m below the sediment/water interface (transect C–C′, fig. 4) by using a slide-hammer or an air-driven post driver.
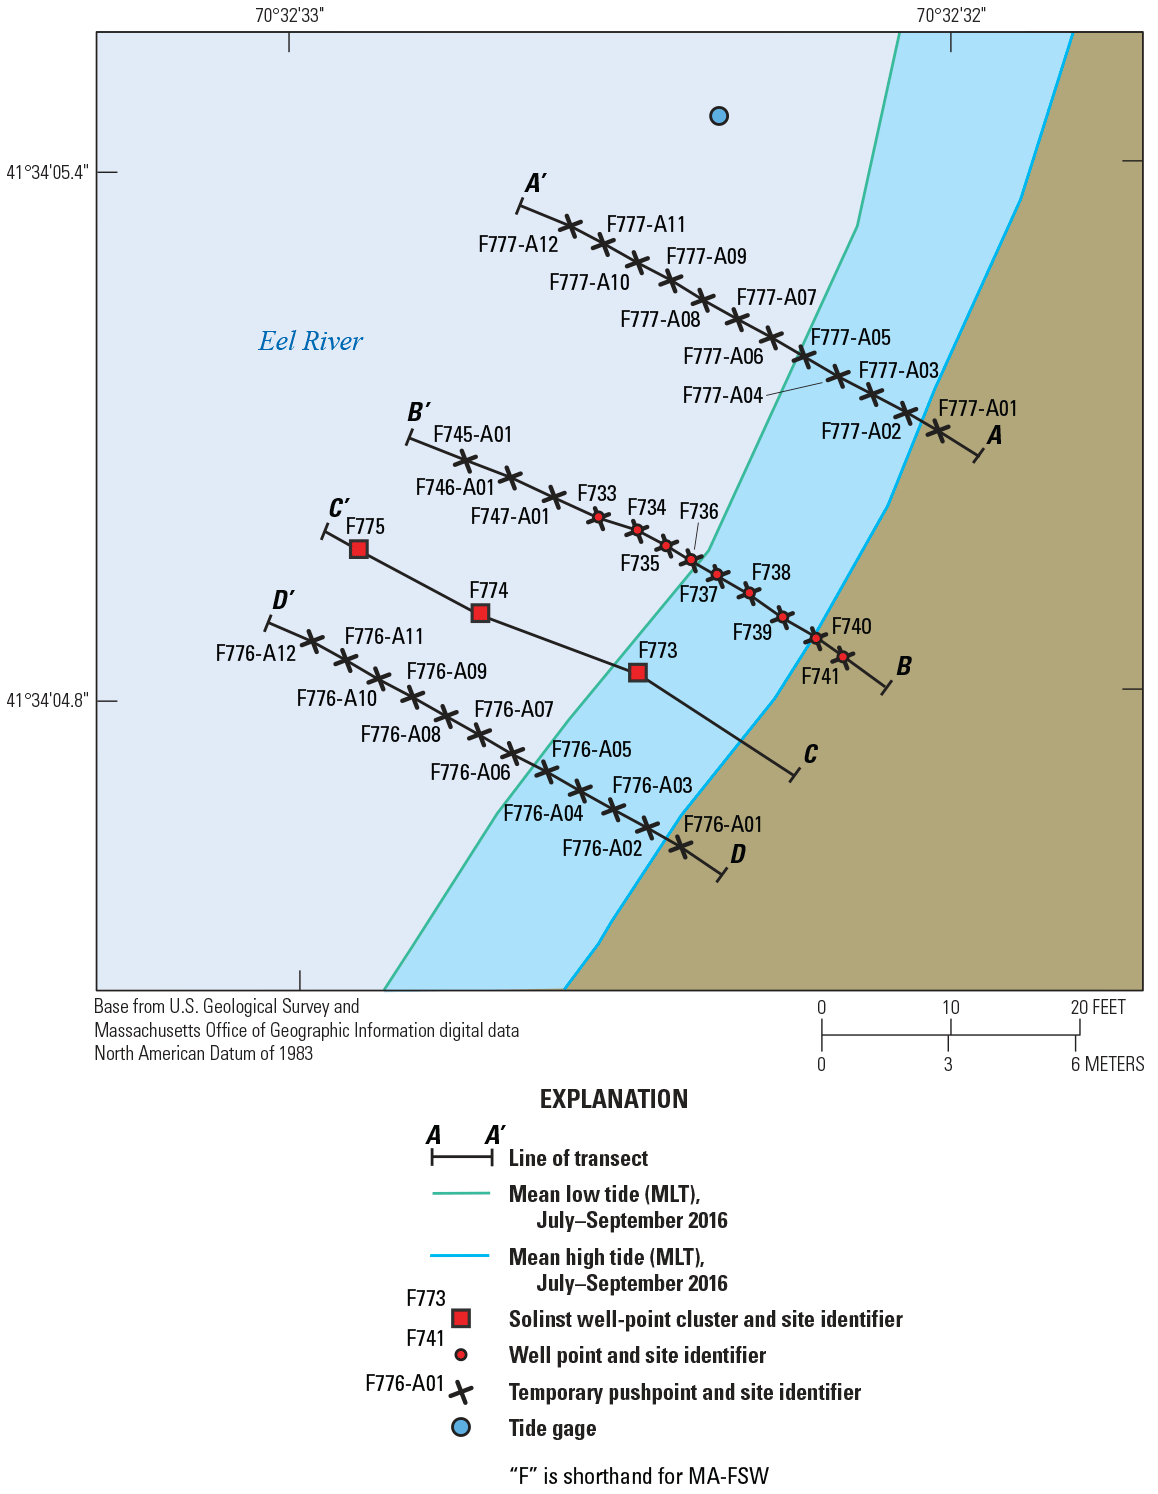
Map showing locations and types of monitoring sites near the western shore of the Eel River, Seascoast Shores peninsula, East Falmouth, Massachusetts. Locations of transects A–A′, B–B′, C–C′, and D–D′ are shown.
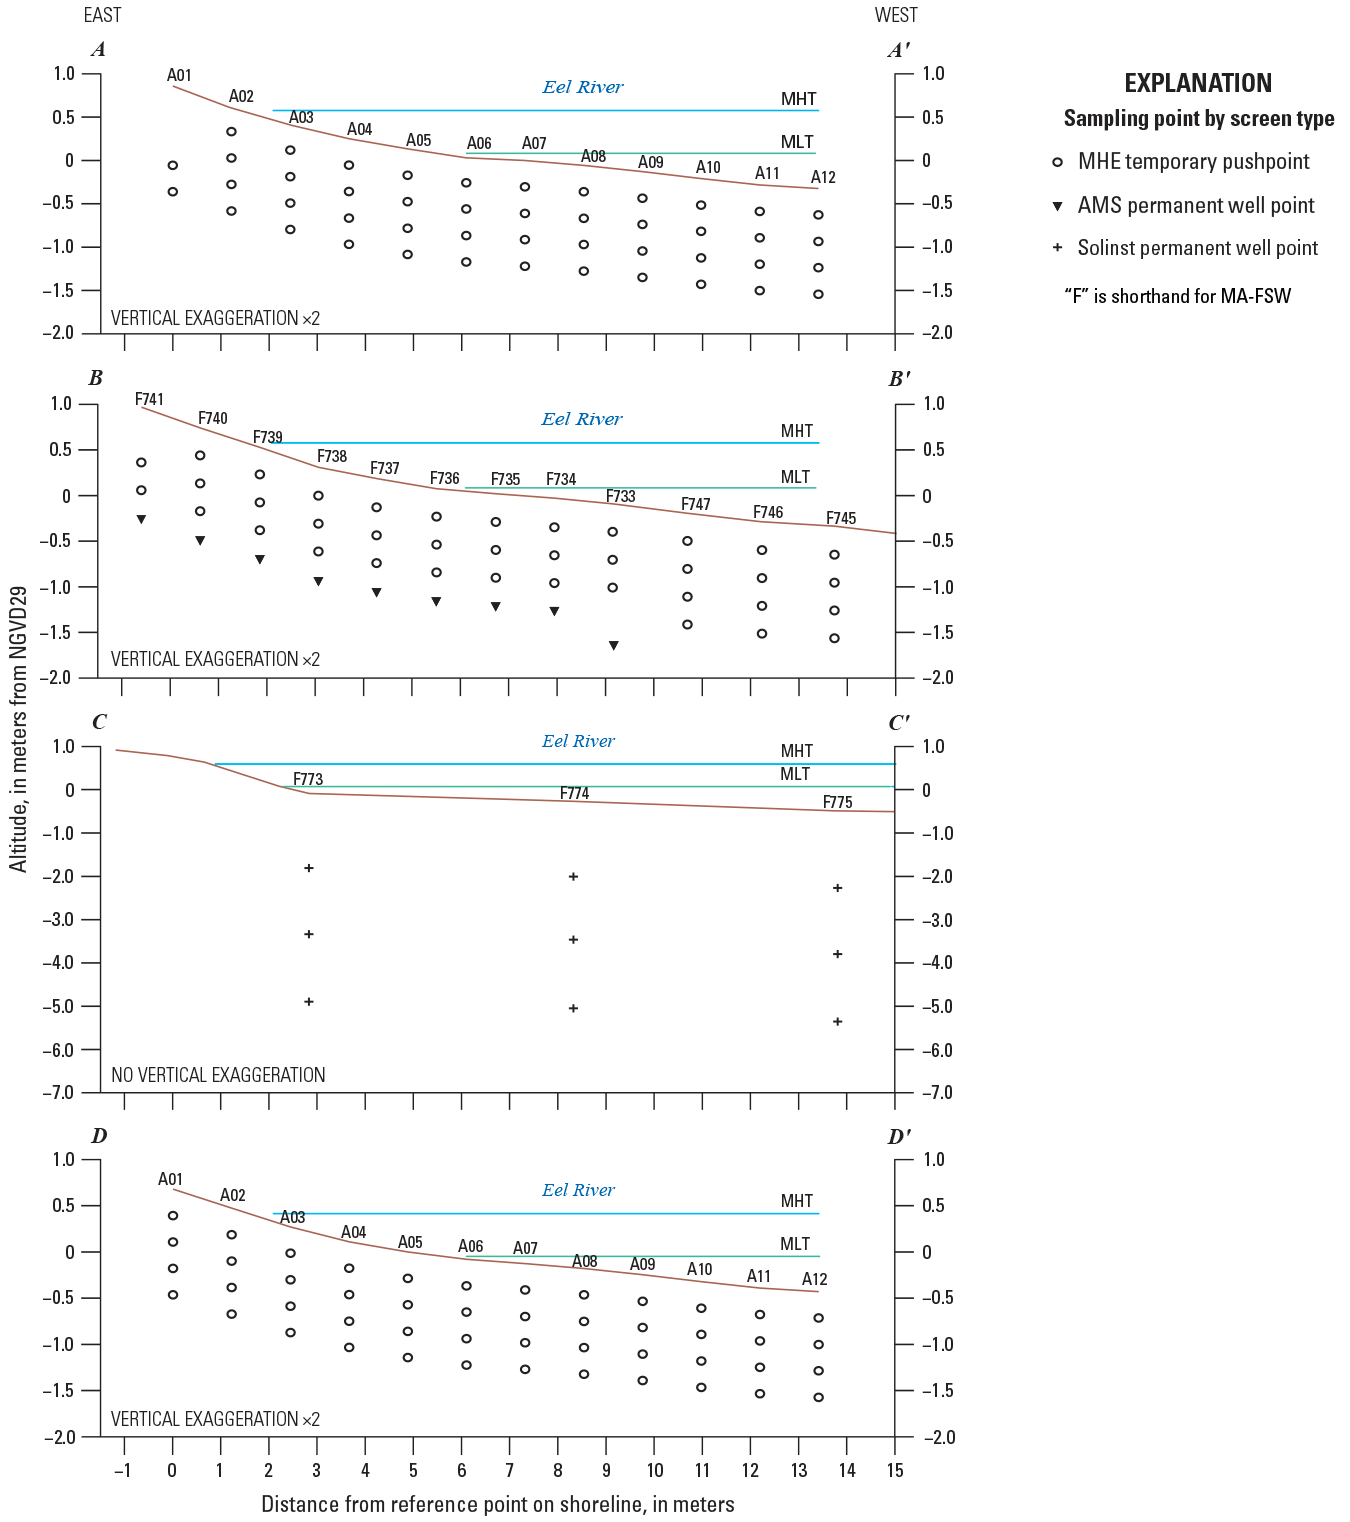
Vertical transects showing locations of monitoring sites, land surface, and approximate altitudes of mean high tide (MHT) and mean low tide (MLT) for transects A–A′, B–B′, C–C′, and D–D′ near the eastern shore of the Eel River, Seacoast Shores peninsula, East Falmouth, Massachusetts. MHT and MLT determined from tide-stage data from July 13 to September 8, 2016. Locations of transects are shown in figure 4.
Another transect of well clusters that was installed in the earlier study also was sampled during this study. That transect (B–B′, fig. 4) consisted of 12 well clusters of stainless steel pushpoint samplers (MHE Products Inc.) and permanent well points (AMS Inc., American Falls, Idaho), from the onshore site (F741) spaced evenly and extending 13.7 m offshore (F745) parallel to the other transects and midway between transects A–A′ and D–D′. The deepest samplers in each cluster were AMS permanent well points, and the remainder were MHE pushpoints. These well clusters each included four wells installed with the bottom of the well screens positioned 30, 61, 91, or 122 cm below the sediment/water interface. The installation of those wells is described in Colman and others (2018).
Measurement of Hydraulic Head and Interpretation of Flow Direction
Water-level altitudes were measured during October 24–26, 2016, in the nine drive-point wells at the three well clusters (transect C–C′; sites F773, F774, and F776, fig. 4) at low, high, and mean tides to determine hydraulic-head gradients. The measurements were made with HOBO dataloggers (Onset Computer Corp., Bourne, Massachusetts). The values were plotted in vertical cross sections relative to the bottom of the Eel River by using graphing software. Contour lines were hand-drawn at varying intervals, and arrows were added perpendicular to the contours to indicate direction of flow.
A pressure-transducer tide gage was installed to monitor the water level in the Eel River near the study area, and hydraulic heads were measured during October 24–26, 2016. The gage consisted of an open-bottom polyvinyl chloride (PVC) standpipe that was secured to a permanent dock piling at a nearby private residence. The tide gage installation is described in Colman and others (2018, app. 1). Measurements of tidal elevation were not recorded at the Eel River during water-quality sampling in 2015 and 2016. Tide data for the sampling periods in this study were retrieved for the U.S. Geological Survey (USGS) tide gage for Popponesset Bay, Mashpee Neck Road, near Mashpee, Massachusetts (USGS site 413601070275800), from the USGS National Water Information System (NWIS) database (U.S. Geological Survey, 2018).
Water-Quality Sampling and Laboratory Analyses
Well clusters in transect B–B′ were sampled once during November 9–10, 2015. Well clusters in transect D–D′ were sampled once during June 14–15, 2016. Well clusters in transect A–A′ were sampled once during June 15–16, 2016. Well clusters in transect C–C′ were sampled once on October 24, 2016.
Samples for water-quality analyses were collected by peristaltic pump and polyethylene tubing. Field water-quality parameters were measured by using parameter-specific meters for water temperature (in degrees Celsius [°C]), temperature-corrected specific conductance (SpC) (µS/cm), and pH. Methods for water temperature and pH are described in the USGS national field manual (U.S. Geological Survey, variously dated). Methods for SpC are described in a U.S. Geological Survey Techniques and Methods book chapter (U.S. Geological Survey, 2005). Dissolved oxygen concentration (DO as O2) in milligrams per liter (mg/L) was analyzed colorimetrically with the indigo Rhodazine-D method (less than 1 mg/L) (Chemetrics, Inc., 2015) or by using a dissolved oxygen probe and meter (greater than 1 mg/L) (U.S. Geological Survey, variously dated). Alkalinity, in microequivalents per liter (µeq/L), was analyzed by titration (Fishman and Friedman, 1989).
Samples for analysis of nitrate plus nitrite, ammonium, total Kjeldahl nitrogen, and total phosphorus concentrations were filtered (0.45 micrometer), preserved with sulfuric acid to pH <2, refrigerated at <4 °C, and shipped to analytical laboratories. Nitrate plus nitrite was analyzed by hydrazine reduction and colorimetric analysis (EPA Method 353.1) (Wendt, 1995). Ammonium was analyzed by the alkaline phenol method and colorimetric analysis (EPA Method 353.1) (U.S. Environmental Protection Agency, 1983b). Total Kjeldahl nitrogen was analyzed by Kjeldahl digestion with a mercury catalyst followed by colorimetric analysis (EPA Method 353.2) (O’Dell, 1993). Dissolved organic nitrogen concentrations were determined from the difference between total Kjeldahl nitrogen and ammonium nitrogen concentrations. Total phosphorus was analyzed by Kjeldahl digestion with a mercury catalyst followed by molybdate colorimetric analysis (EPA Method 365.4) (U.S. Environmental Protection Agency, 1983a). DOC was analyzed with a Shimadzu TOC–VCPH analyzer using high temperature catalytic oxidation followed by nondispersive infrared detection of carbon dioxide (EPA Method 415.3) (Potter and Wimsatt, 2005). The median relative percent difference for duplicate samples analyzed for nutrients was 4.2 percent (range 0.6 to 32 percent). In some cases, analyses of constituent concentrations were reported as beneath the level of quantitation. In the associated data release (Huntington and others, 2024), these results were reported with a “<” symbol (for example, <0.019). Values that were beneath the level of quantitation were plotted as 0 in the figures in this report.
Samples for analysis of dissolved nitrogen gas and argon gas concentrations were collected in 12.4-milliliter (mL) glass vials with a threaded cap and butyl rubber septum. Vials were filled from the bottom with a continuous stream of pumped groundwater, gently overflowed with greater than 5 vial volumes, capped quickly without bubbles or headspace, and stored under water at less than 4 °C. In the laboratory at the Woods Hole Oceanographic Institution, samples were analyzed by membrane inlet mass spectrometry (Kana and others, 1994; Young and others, 2013; Szymczycha and others, 2017). Sample water was pumped through a section of capillary-diameter, gas-permeable, silicon tubing with the external space under vacuum. Extracted gas passed through a liquid nitrogen trap to remove water vapor and carbon dioxide, through a copper reduction tube at 600 °C to remove oxygen, and to a quadrupole mass spectrometer. The quadrupole mass spectrometer signals representing dissolved gas concentrations were recorded for the three masses of nitrogen gas (28, 29, 30) and the primary mass for argon gas (40). A deionized water bath, held at constant temperature (10 °C) and circulated continuously with a head space at 100-percent relative humidity served as a calibration solution for the gases and was sampled repeatedly before and after each set of 15 to 20 field samples. Readings for field samples were corrected for minor instrument drift. The relative standard deviation of three replicated analyses of the calibration bath was 0.02 percent for 28N2 and 0.01 percent for 40Ar. Duplicate samples collected from 12 locations using the same collection method, with duplicates collected sequentially from a stream of pumped groundwater, resulted in an average relative standard deviation of 2.0 percent, with a range of 0.04 to 9.0 percent. Data from samples that degassed substantially during sample handling were excluded; minor degassing may have contributed to overall uncertainties of the evaluated dissolved gas data, as described in the section “Evaluation of Nitrate Reduction to Nitrogen Gas.”
Additional information on methods is provided in the accompanying data release (Huntington and others, 2024). Reported concentration units for various parameters in the data release were converted for discussion in this report. Quality assurance procedures were previously described (Colman and others, 2018).
Determination of Nitrogen Attenuation
The primary method for quantifying permanent removal of fixed nitrogen from the subterranean estuary in this study was to evaluate the distribution of nitrogen gas produced by microbial nitrate reduction ± anaerobic ammonium oxidation (denitrification ± anammox). Other microbial nitrogen transformation processes such as dissimilatory nitrate reduction to ammonium (DNRA) or assimilation are more difficult to quantify using porewater data where potentially large reservoirs of solid-phase ammonium and organic nitrogen also exist, and they are more likely to represent temporary fixed nitrogen sinks that can be oxidized, mobilized, and discharged subsequently.
Measured concentrations of dissolved nitrogen gas (N2) and argon gas (Ar) were used to estimate concentrations of excess nitrogen gas produced by nitrate reduction that could indicate nitrogen attenuation. Interpretation of denitrification or other microbial metabolic pathways for nitrogen gas production in groundwater must be conducted in the context of conditions in which the groundwater was recharged that control “background” gas concentrations in the absence of microbial nitrogen gas production (for example, Böhlke and others, 2002; Griggs and others, 2003; Szymczycha and others, 2017). The following processes can contribute to dissolved nitrogen gas in groundwater: (1) equilibration with the atmosphere and soil gas during recharge to the aquifer, with solubility determined by temperature, salinity, and atmospheric pressure (elevation), (2) dissolution of air bubbles entrained during recharge, resulting in “excess air” (EA), and (3) nitrogen gas production by microbial processes (denitrification or anammox). Argon gas occurs in groundwater due to processes 1 and 2 and, depending on various assumptions, can be used as a tracer to estimate nitrogen gas concentration resulting from those processes. Dissolved nitrogen gas and argon gas concentrations were evaluated as follows (Böhlke and others, 2002):
where N2ASW and ArASW refer to “air saturated water,” or the molar concentrations of nitrogen gas and argon gas from equilibration with the atmosphere at recharge. N2MIC is the concentration of nitrogen gas produced by microbial processes. N2EA and ArEA refer to concentrations of nitrogen gas and argon gas added to the equilibrium values by dissolution of air bubbles (excess air). Observations commonly indicate that excess air results from complete or nearly complete dissolution of bubbles, resulting in an excess air composition that is similar to atmospheric air, thus allowing estimation of the excess air component of total nitrogen gas as follows (Böhlke and others, 2002): where N2AMF and ArAMF are atmospheric mole fractions of N2 and Ar, respectively.In this study, the concentration of microbial nitrogen gas (N2MIC) in each water sample was used to estimate the concentration of nitrate that was lost by nitrate reduction in the water parcel represented by the sample. The N2MIC was assumed to have accumulated after the water in the sample entered the saturated zone during recharge, and it was assumed initially that 1 mole of N2MIC (2 moles of N2-NMIC) were produced from 2 moles of nitrate, as in denitrification. The initial nitrate concentration in the water at the point of recharge was estimated as the sum of the measured nitrate concentration and the estimated concentration of nitrate lost (converted to nitrogen gas) in the water sample. Estimated concentrations of nitrate lost and initial nitrate could be smaller if nitrate reduction was coupled with ammonium oxidation (anammox), which could yield 1 mole of N2MIC (2 moles of N2-NMIC) from 1 mole of nitrate. Additional details of these calculations and assumptions are presented in the context of the dissolved gas data in the section “Evaluation of Nitrate Reduction to Nitrogen Gas.”
Hydrogeologic and Geochemical Observations
Observations reported in this section include water levels measured at wells, hydraulic head gradients, field water-quality characteristics measured during sampling, and chemical analytical results from laboratory analyses. All well-location and water-level data collected in this investigation are stored in the National Water Information System database (U.S. Geological Survey, 2018), available at https://doi.org/10.5066/F7P55KJN. All water-quality data are listed in the data release associated with this publication (Huntington and others, 2024).
Hydraulic-Head Gradients during Low, High, and Mean Tides
Water levels were measured from October 24 through October 26, 2016, during a neap tide at transect C–C′. The magnitudes of the hydraulic gradients can be visualized as the differences in water levels between the drive-point wells and the estuary (figs. 6A–6C). Water-level contours indicated that the hydraulic gradients from about −4 to −2 m altitude generally were consistent with upward flow (toward the estuary) at low, high, and mean tides as shown by the arrows in figures 6A–6C. The gradients were steeper at low tide than at high tide, implying greater potential for upward flow at low tide in this depth interval. Although these data appear to be consistent with net fresh groundwater discharge to the estuary in this area, they may not indicate local flow conditions within shallower parts of the subterranean estuary (altitude greater than 2 m) represented by water-quality data from the other transects sampled in this study. Furthermore, Colman and others (2018) concluded from the distribution of dissolved oxygen that groundwater flow in this area may have been partly oblique to the sampled transects. Groundwater from a regional flow system may have been converging under the estuary near the study area and interacting with local groundwater flow from the peninsula, and flow directions may have been affected by aquifer sediment heterogeneity (Colman and others, 2018; Lane and others, 2020). Information about the physical properties of the sediments and stratigraphy is limited, and gradient observations were collected along one transect; therefore, direct inferences about groundwater flow are limited.
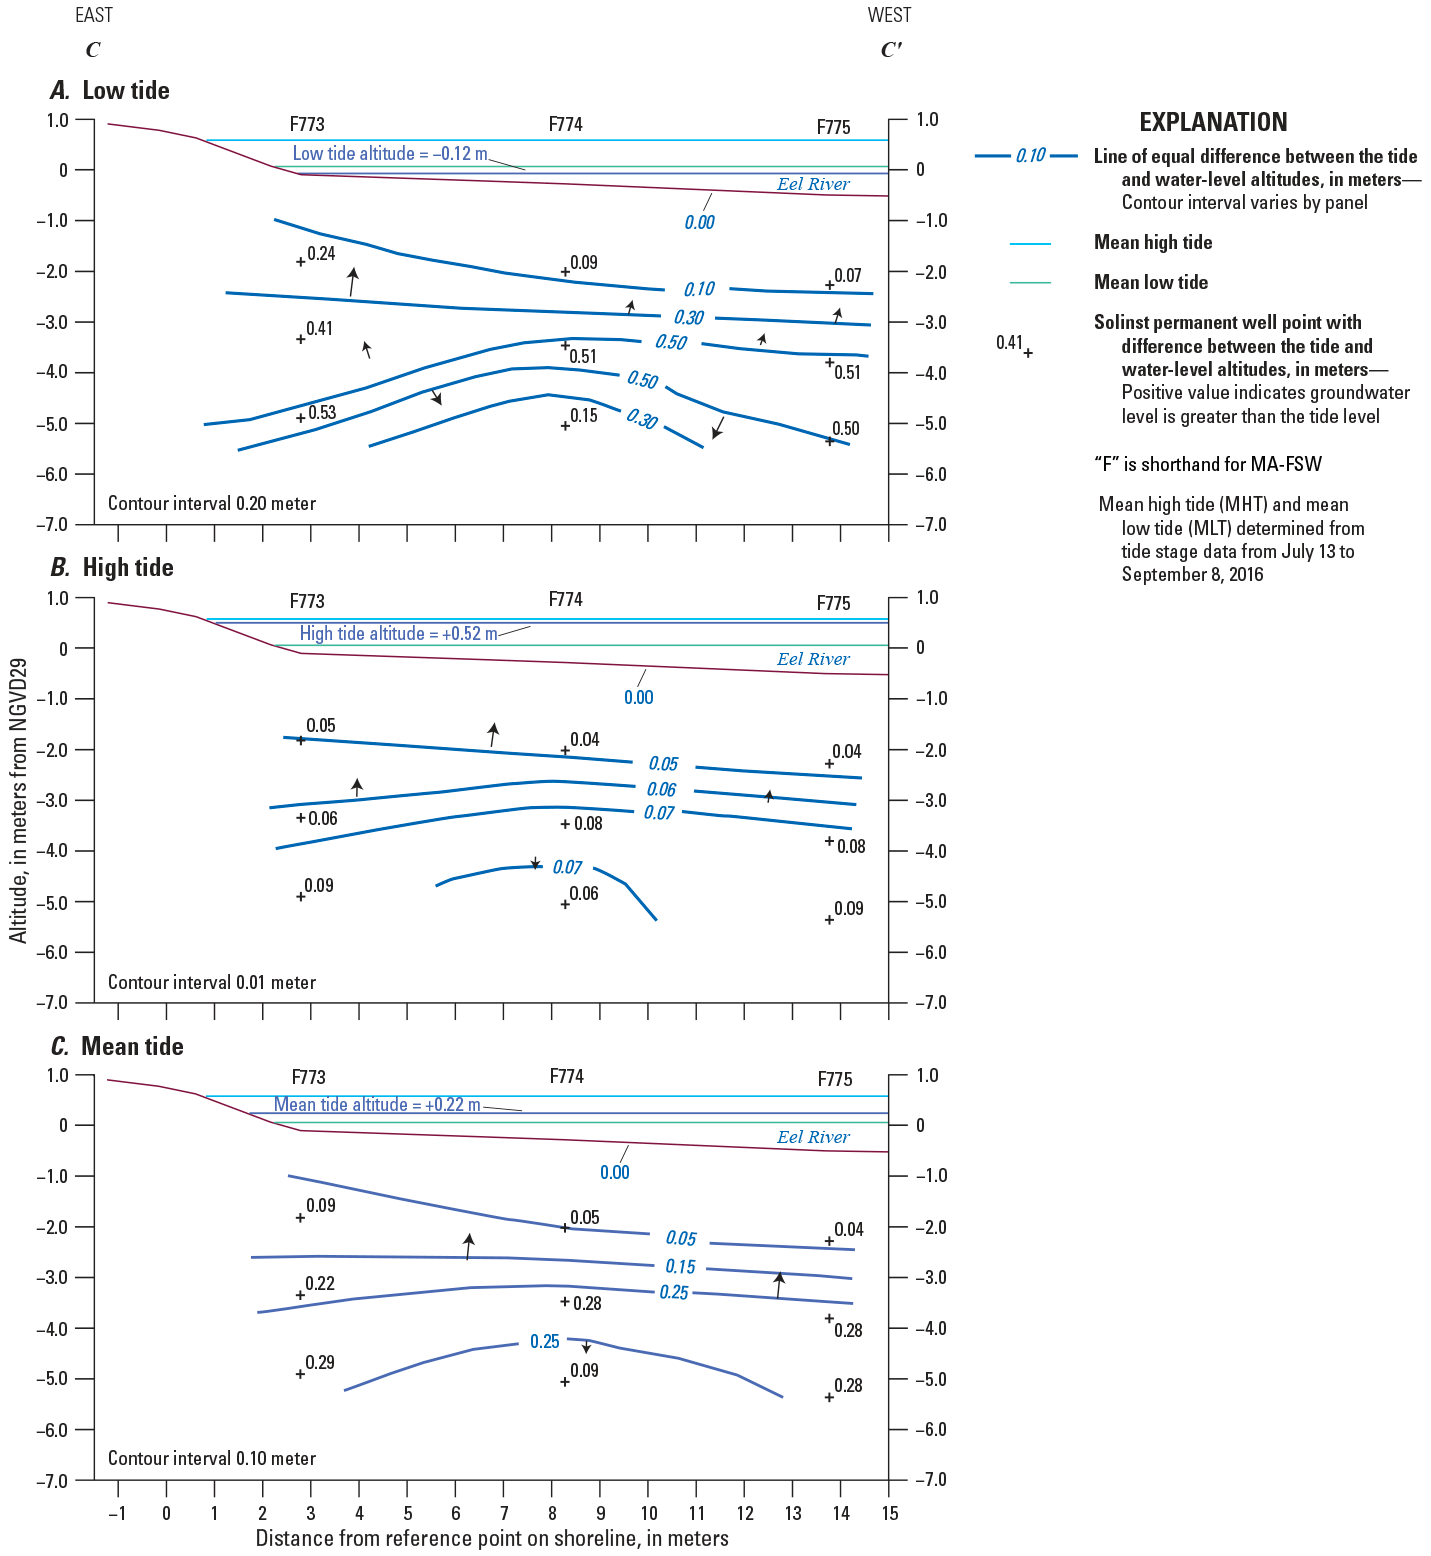
Vertical sections showing water-level altitudes measured in drive-point wells and in the Eel River at A, low tide, B, high tide, and C, mean tide, October 24–26, 2006. Arrows indicate inferred directions of groundwater flow.
Chemical Characteristics of Shallow Groundwater in the Nearshore Subterranean Estuary
This section includes results and discussion of observations of specific conductance, DO, pH, alkalinity, nitrate plus nitrite, ammonium, total Kjeldahl nitrogen, and DOC in the nearshore subterranean estuary. These observations are for samples collected in three shallow transects at various depths from 0.3 to 1.52 m below the sediment/water interface in November 2015 (transect B–B′) and June 2016 (transects A–A′ and D–D′), and for a smaller set of samples collected from approximately 2 to 5 m below the sediment/water interface in October 2016 (transect C–C′).
Specific Conductance
The vertical profiles for specific conductance in transects A–A′, B–B′, and D–D′ generally are consistent with the formation of an intertidal saltwater cell (ISC) where fresh groundwater mixes with infiltrating seawater from the estuary above (figs. 7A, 8A, and 9A). In the conceptual model of Abarca and others (2013) (fig. 2), an ISC develops in shallow groundwater during high tides when saltwater infiltrates beach sands at the highest altitudes of the intertidal zone and then flows through the sand to discharge back into the estuary near the lowest altitude of the intertidal zone at low tide. The ISC in mid-June 2016 (figs. 7A, 8A, and 9A) appeared to be somewhat less well defined than the ISC characterized by Colman and others (2018). Samples were collected during neap tides in November 2015, June 2016, and October 2016 (fig. 10). The transect characterized by Colman and others (2018), where evidence for the ISC was more pronounced, was measured during a spring tide. The fact that the apparent strength of the ISC was more robust in 2013 than in 2015 and 2016 may be due to the height of the tides. Saline-water infiltration and strength of the ISC are expected to be greater during spring tides. This pattern is consistent with the conceptual model of tidal control of infiltration and potential absence of an ISC during a neap tide (Robinson and others, 2007; Abarca and others, 2013).
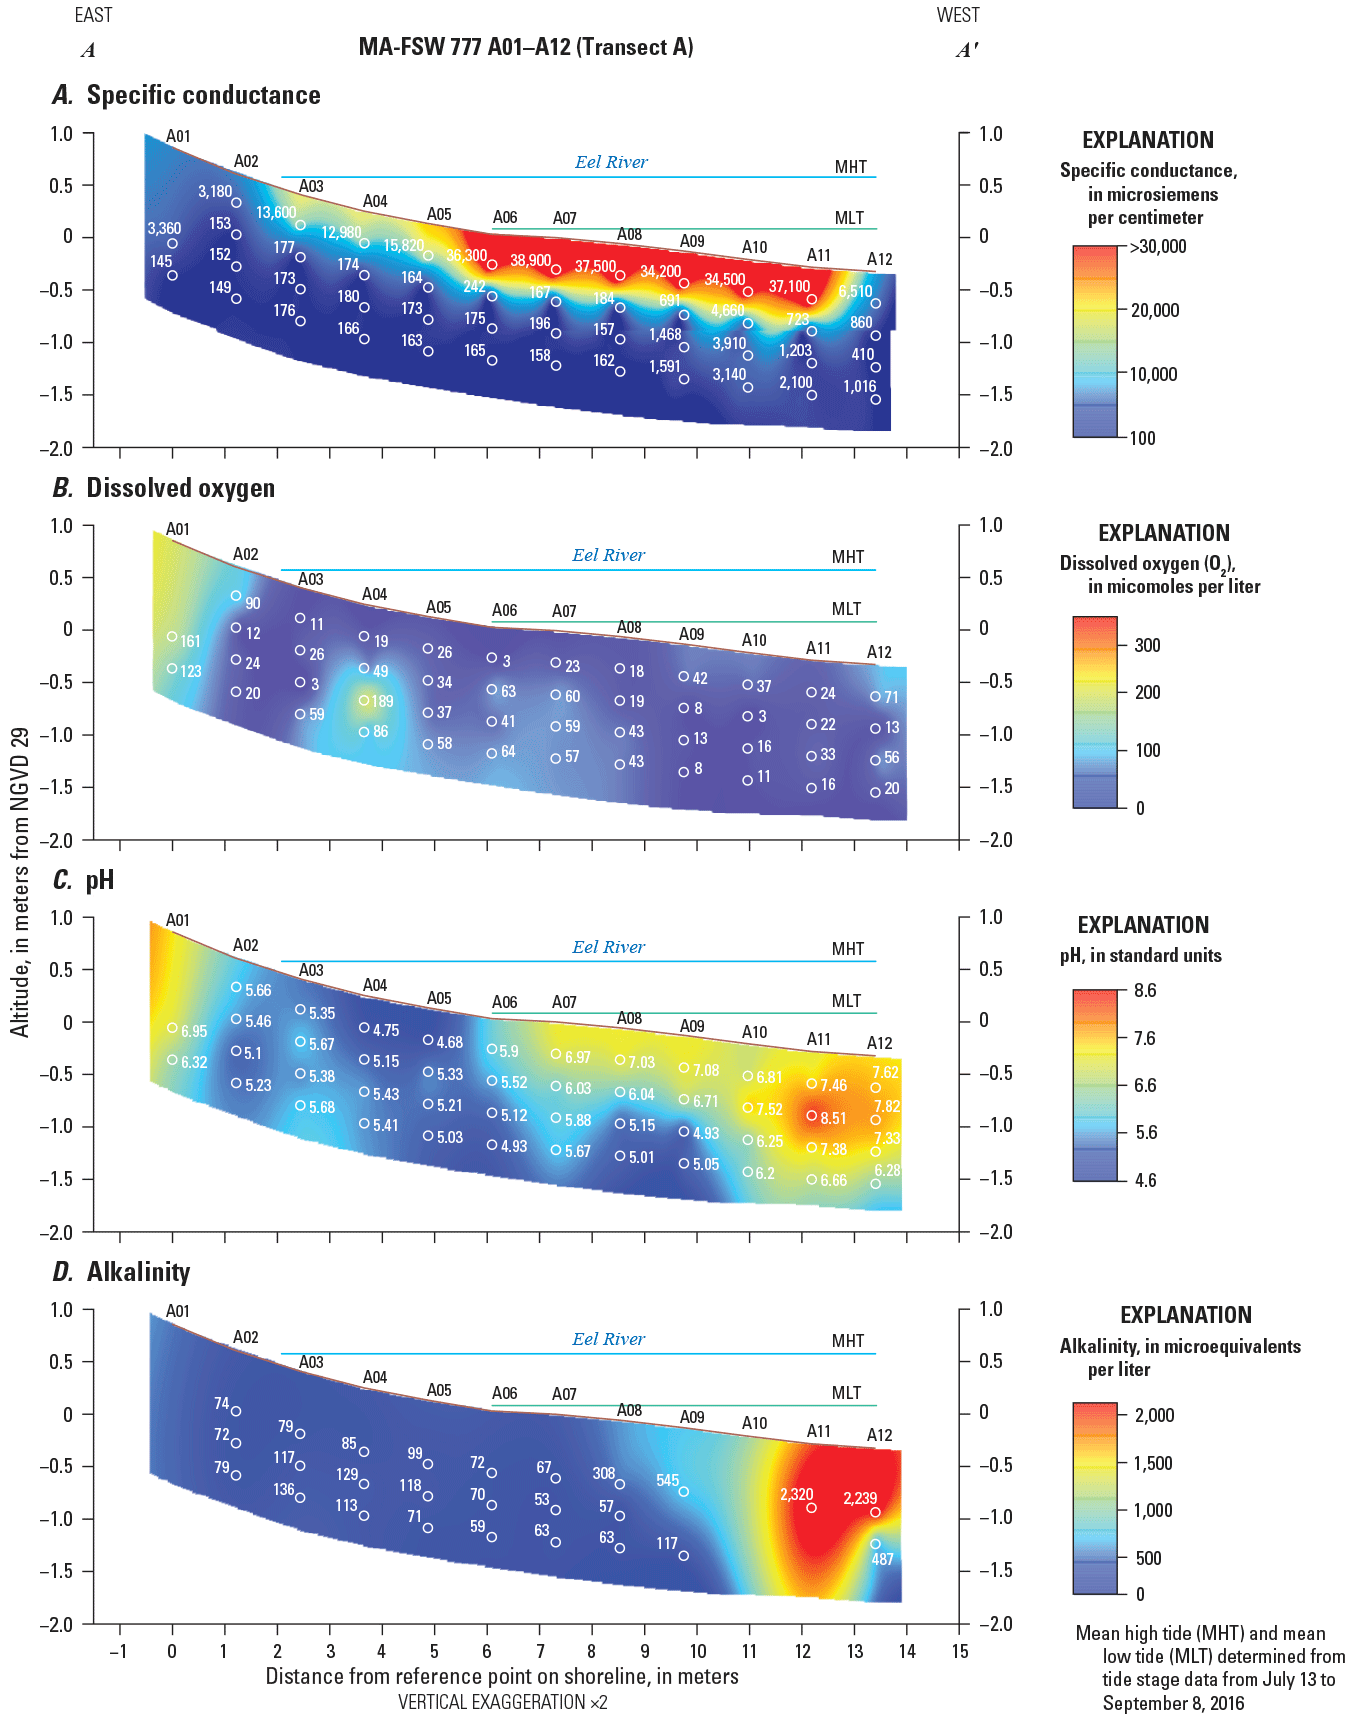
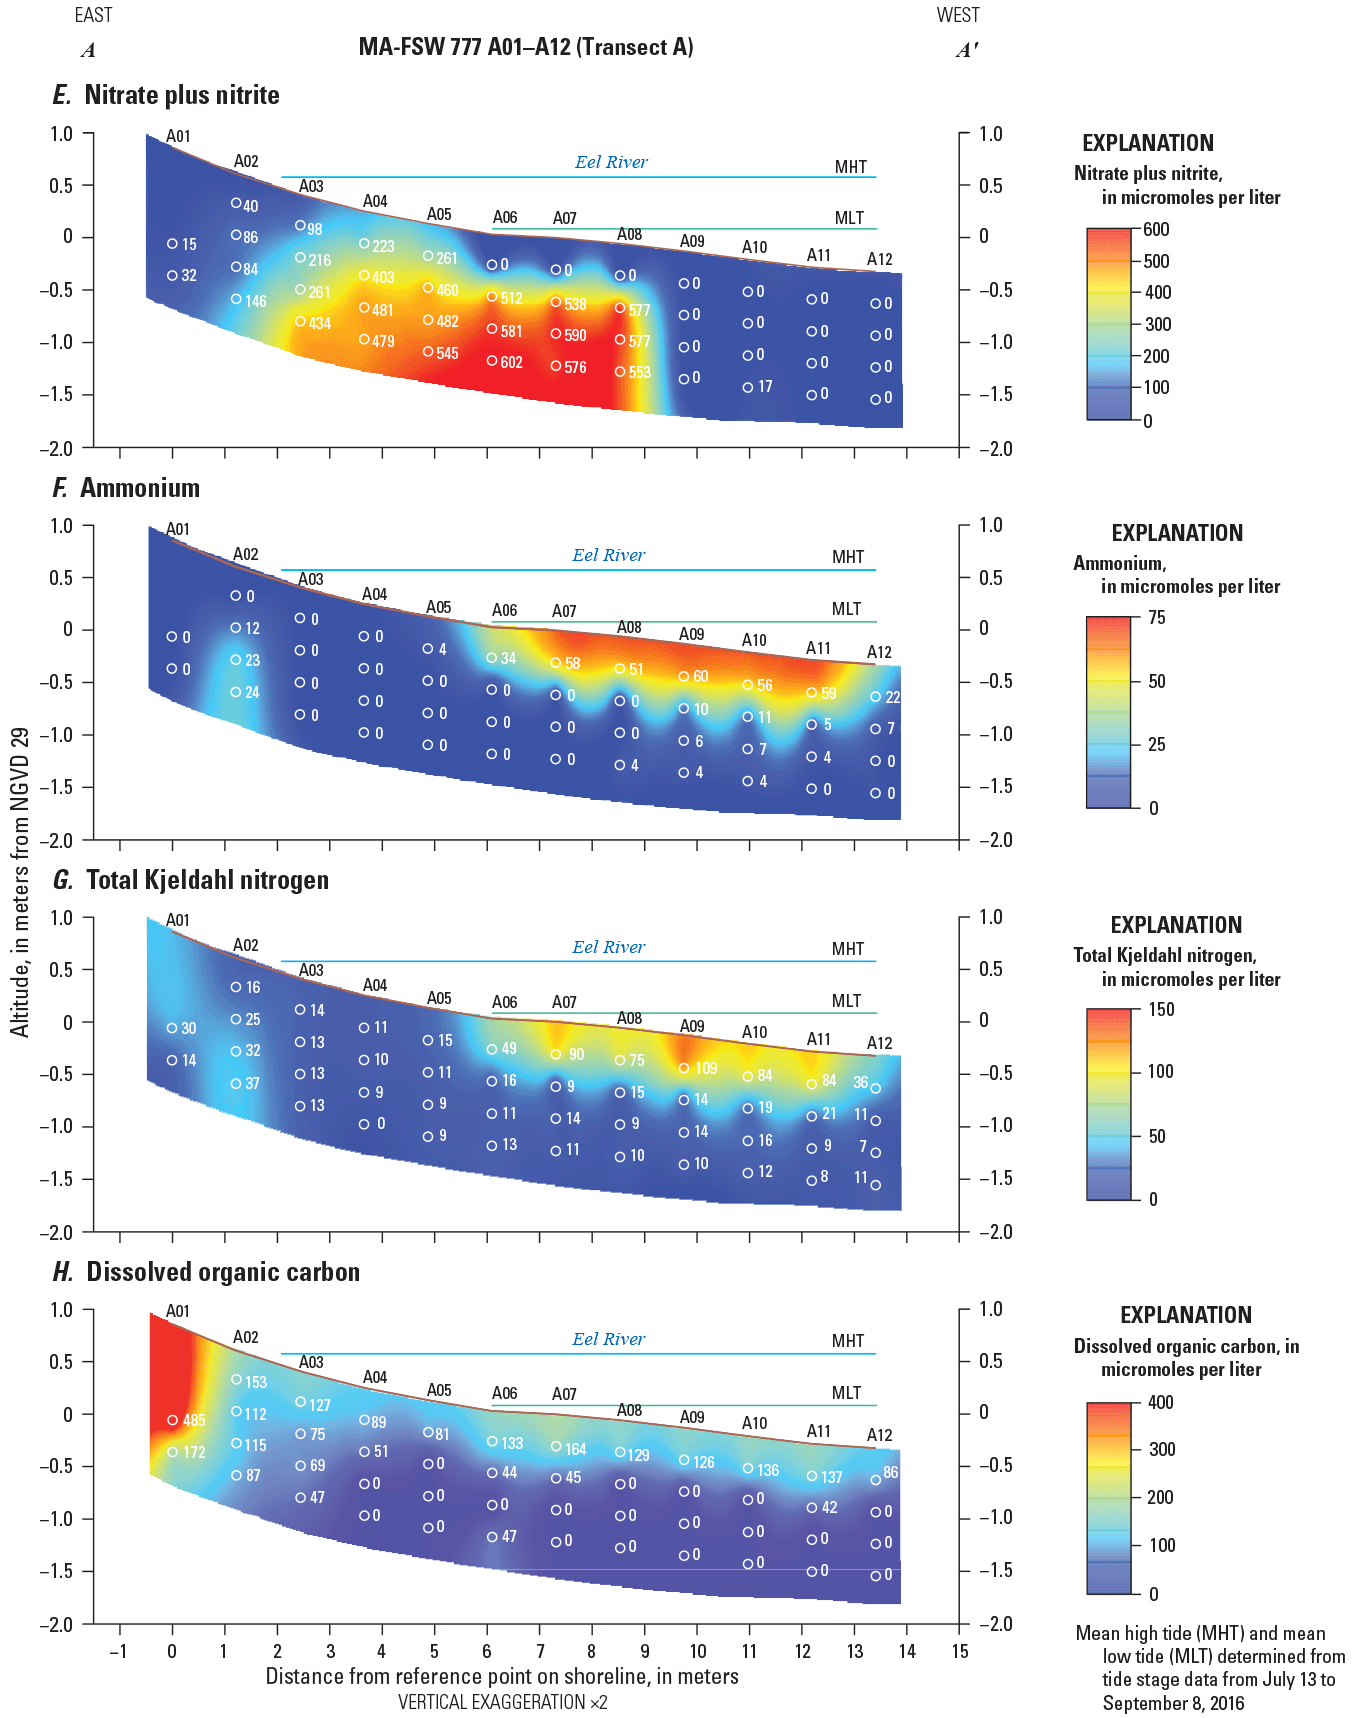
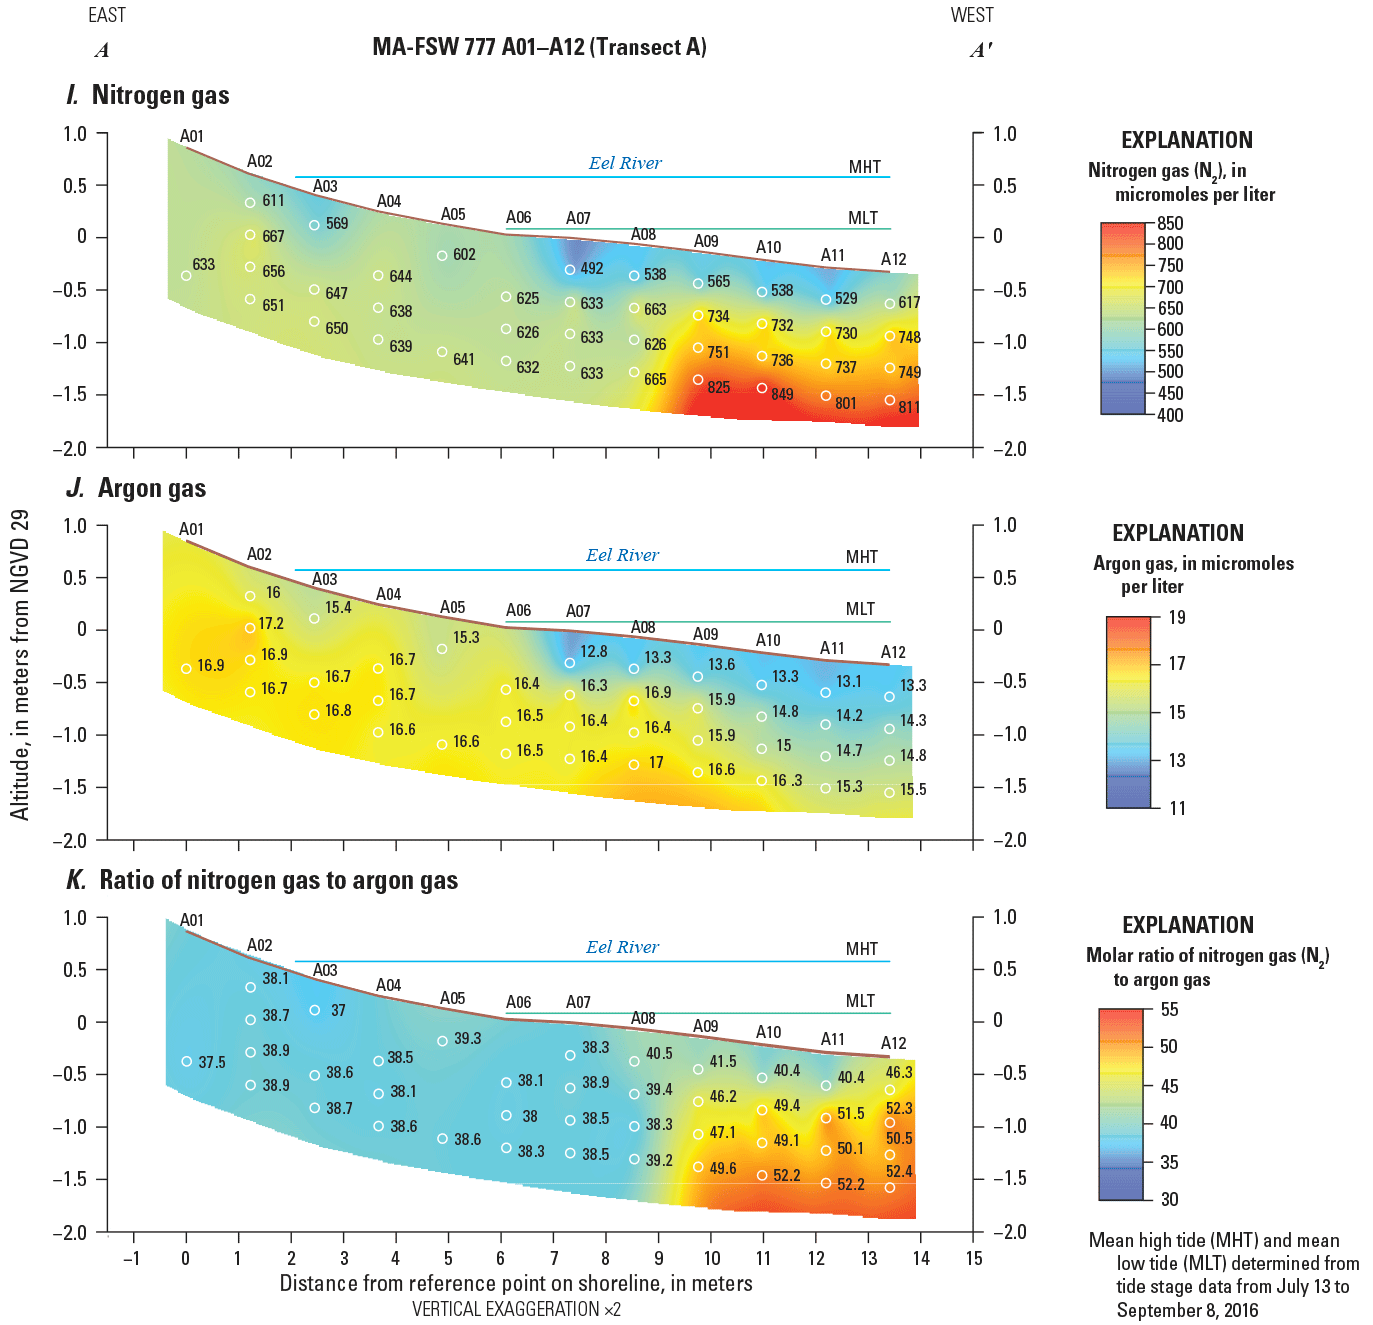
Vertical transects showing distributions of A, specific conductance, B, dissolved oxygen, C, pH, D, alkalinity, E, nitrate plus nitrite, F, ammonium, G, total Kjeldahl nitrogen, H, dissolved organic carbon, I, nitrogen gas, J, argon gas, and K, ratio of nitrogen gas to argon gas in groundwater along transect A–A′ (F777) beneath the Eel River, Seacoast Shores peninsula, East Falmouth, Massachusetts, June 15–16, 2016. Location of transect is shown in figure 4.
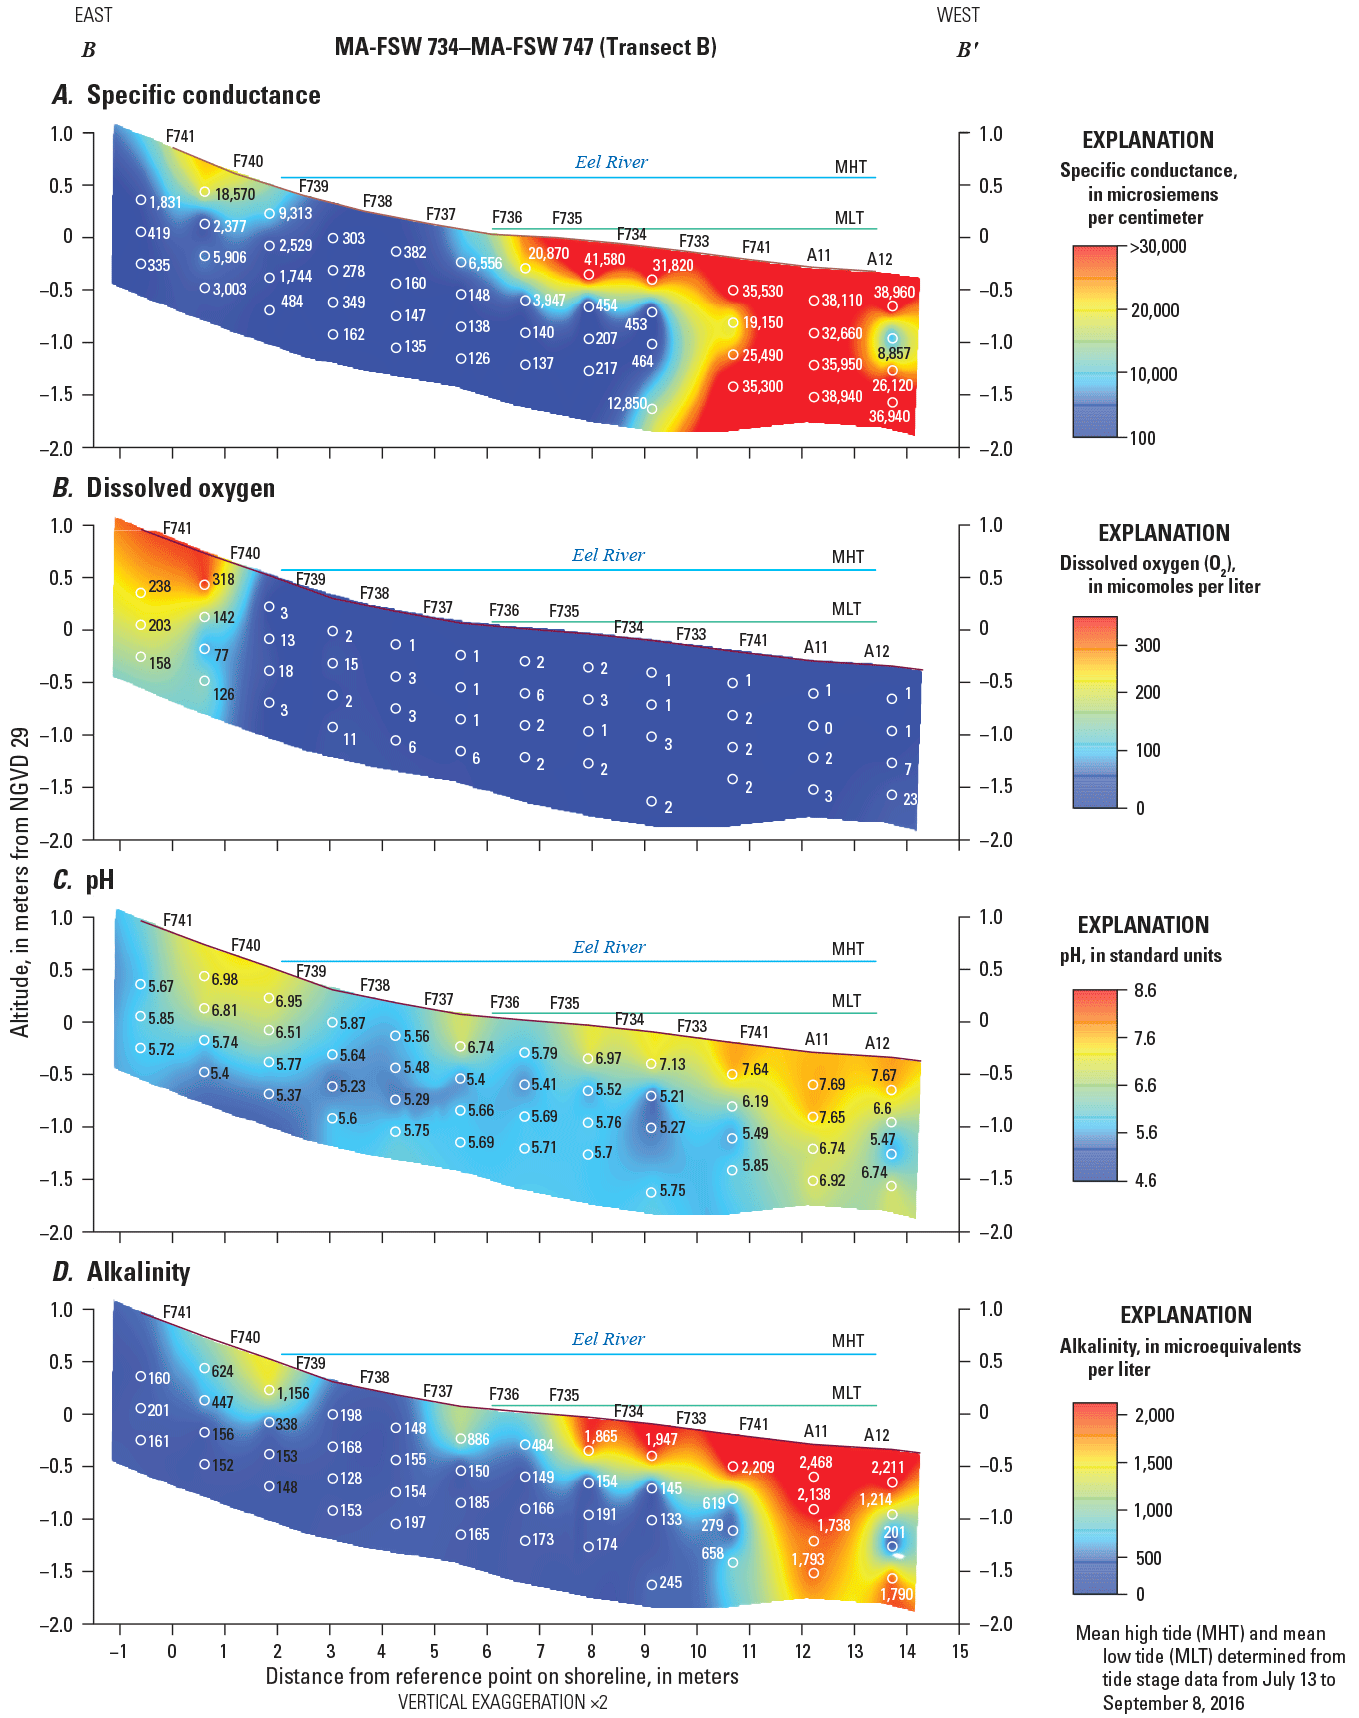
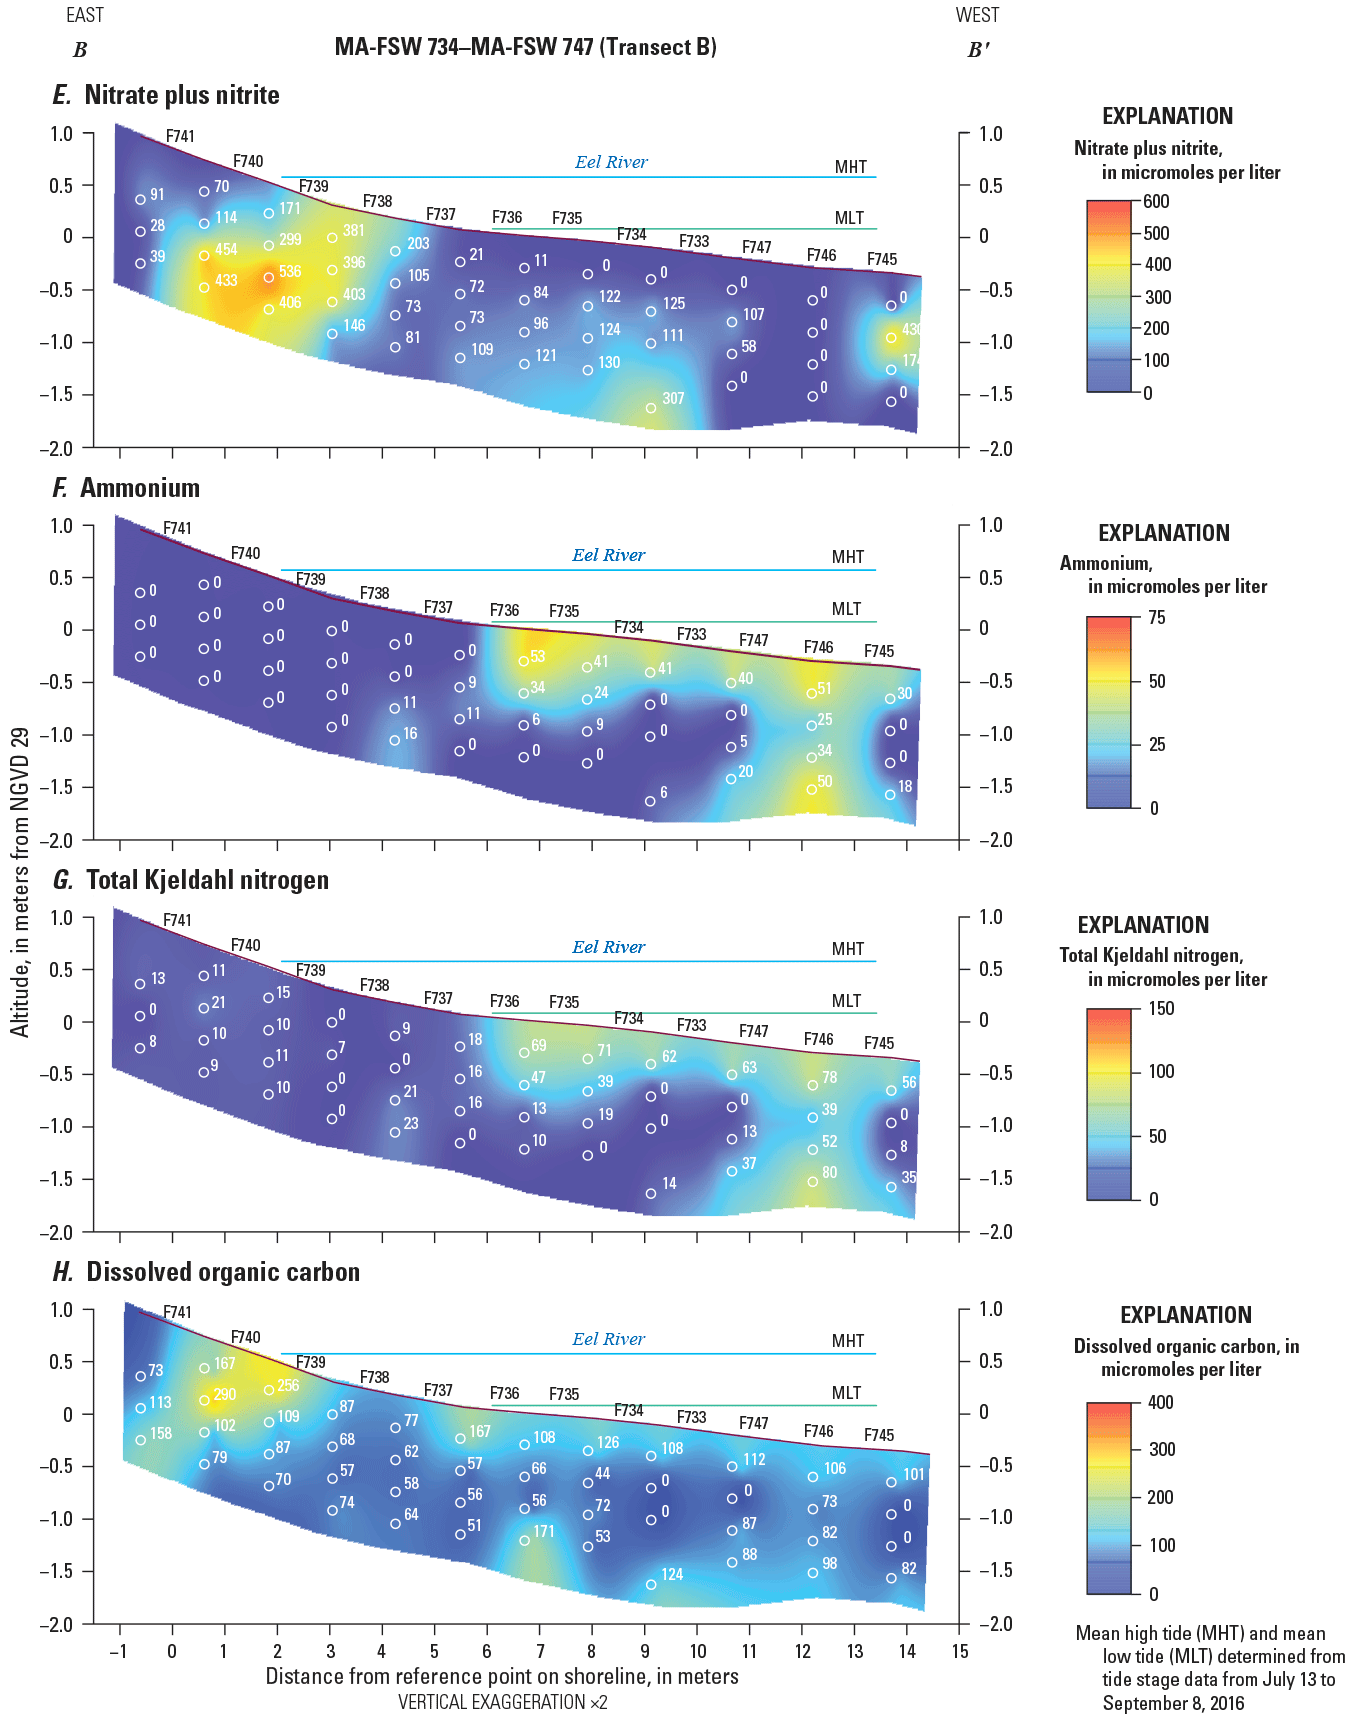
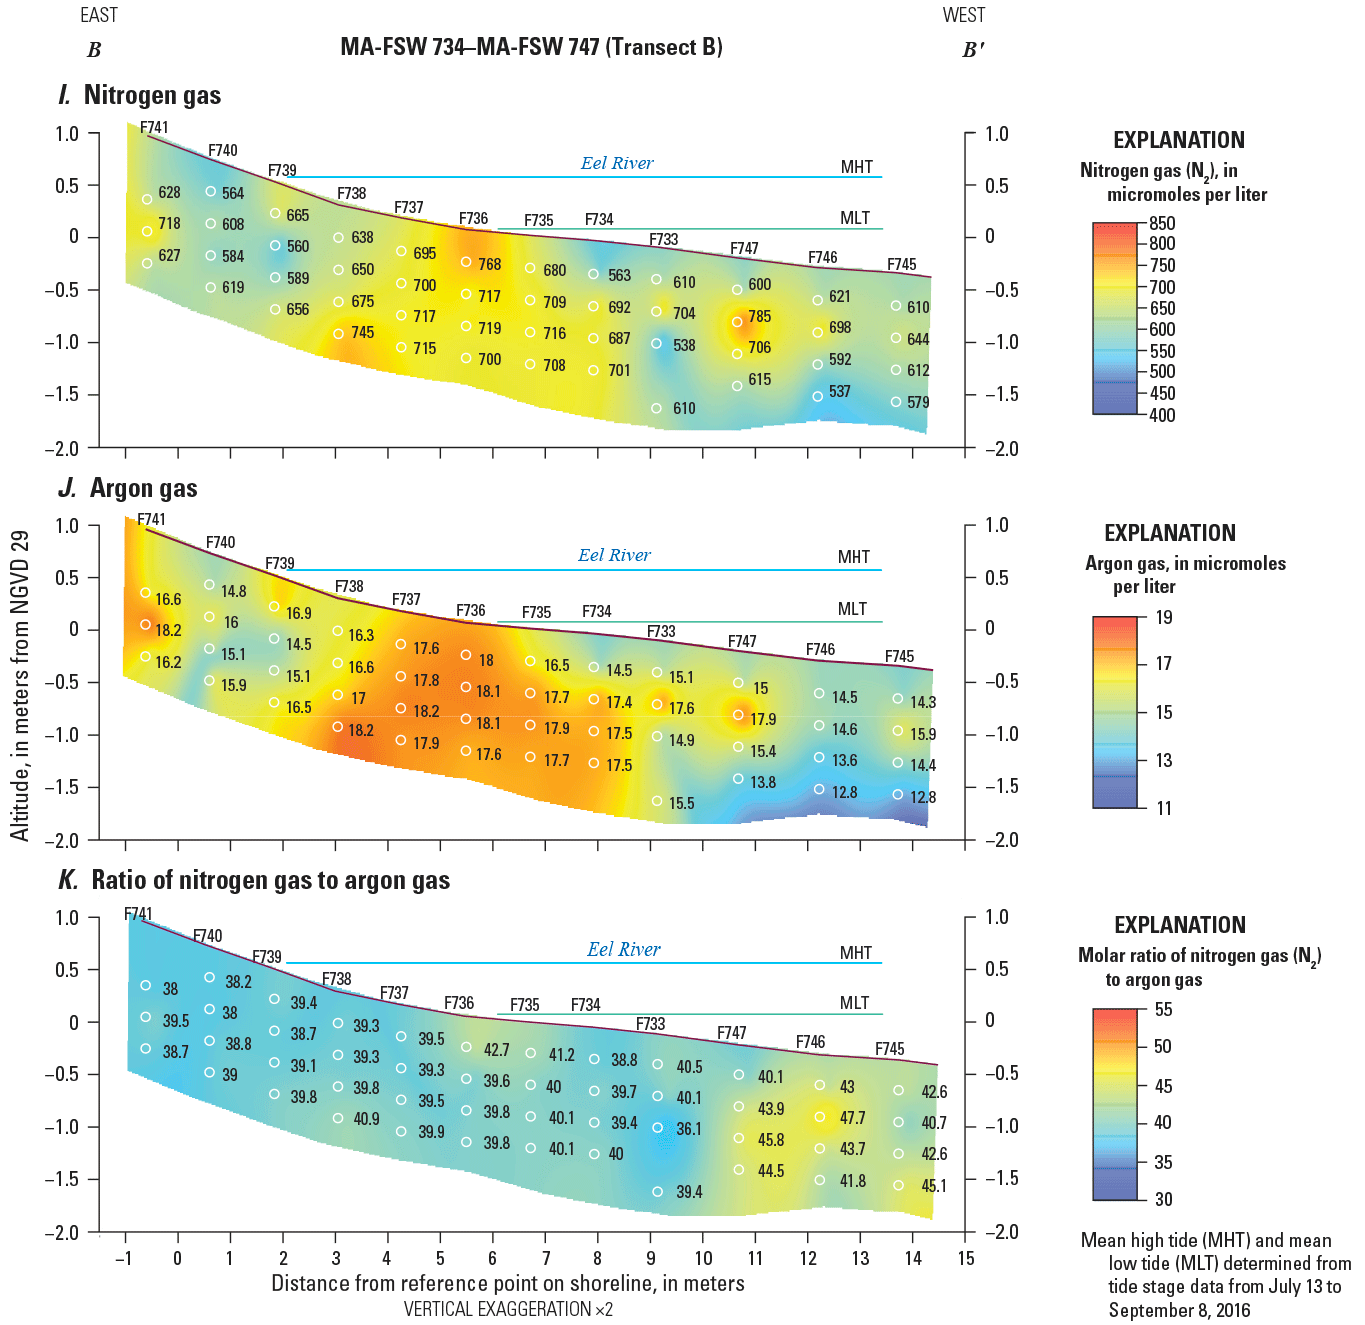
Vertical transects showing distributions of A, specific conductance, B, dissolved oxygen, C, pH, D, alkalinity, E, nitrate plus nitrite, F, ammonium, G, total Kjeldahl nitrogen, H, dissolved organic carbon, I, nitrogen gas, J, argon gas, and K, ratio of nitrogen gas to argon gas in groundwater along transect B–B′ beneath the Eel River, Seacoast Shores peninsula, East Falmouth, Massachusetts, November 9–10, 2015. Location of transect is shown in figure 4.
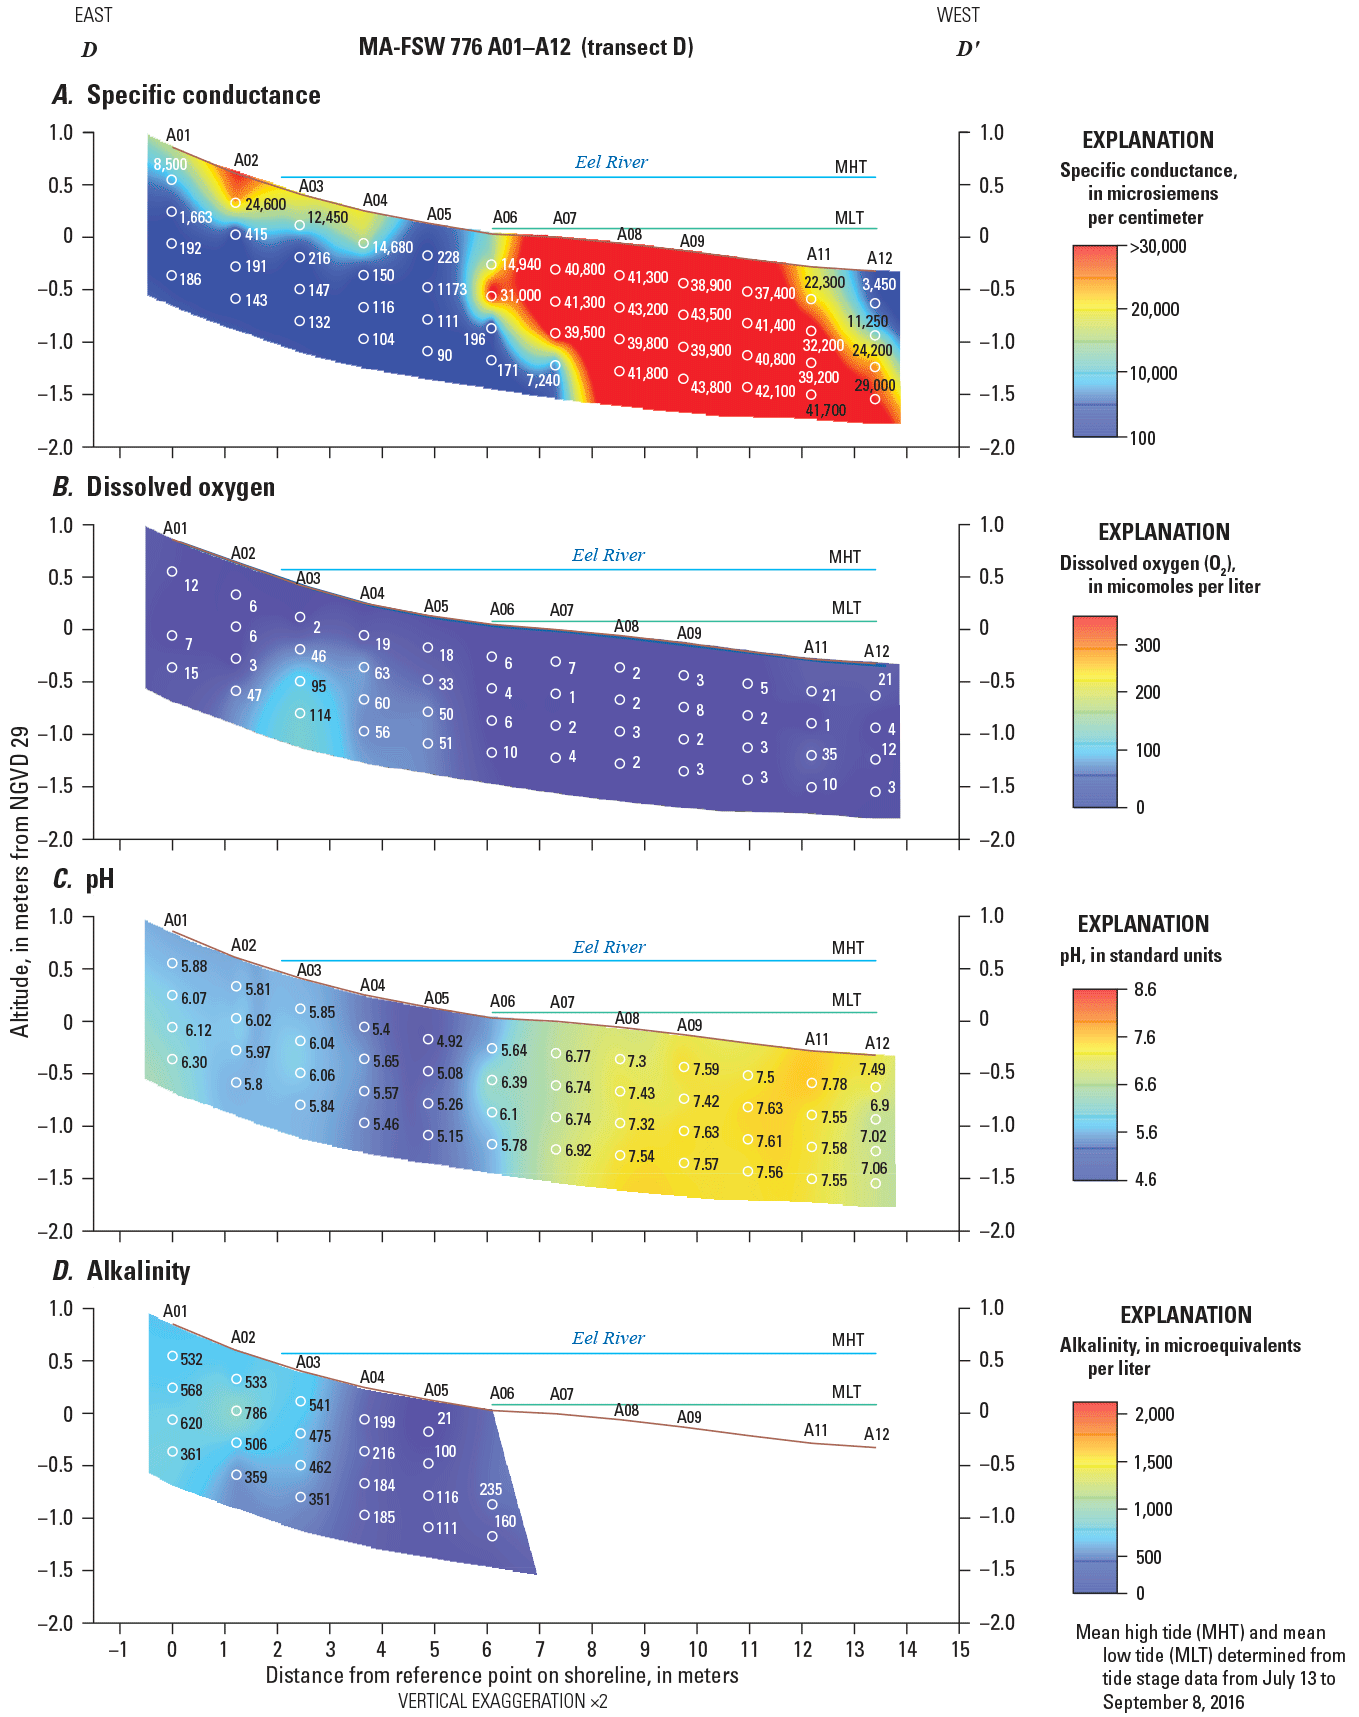
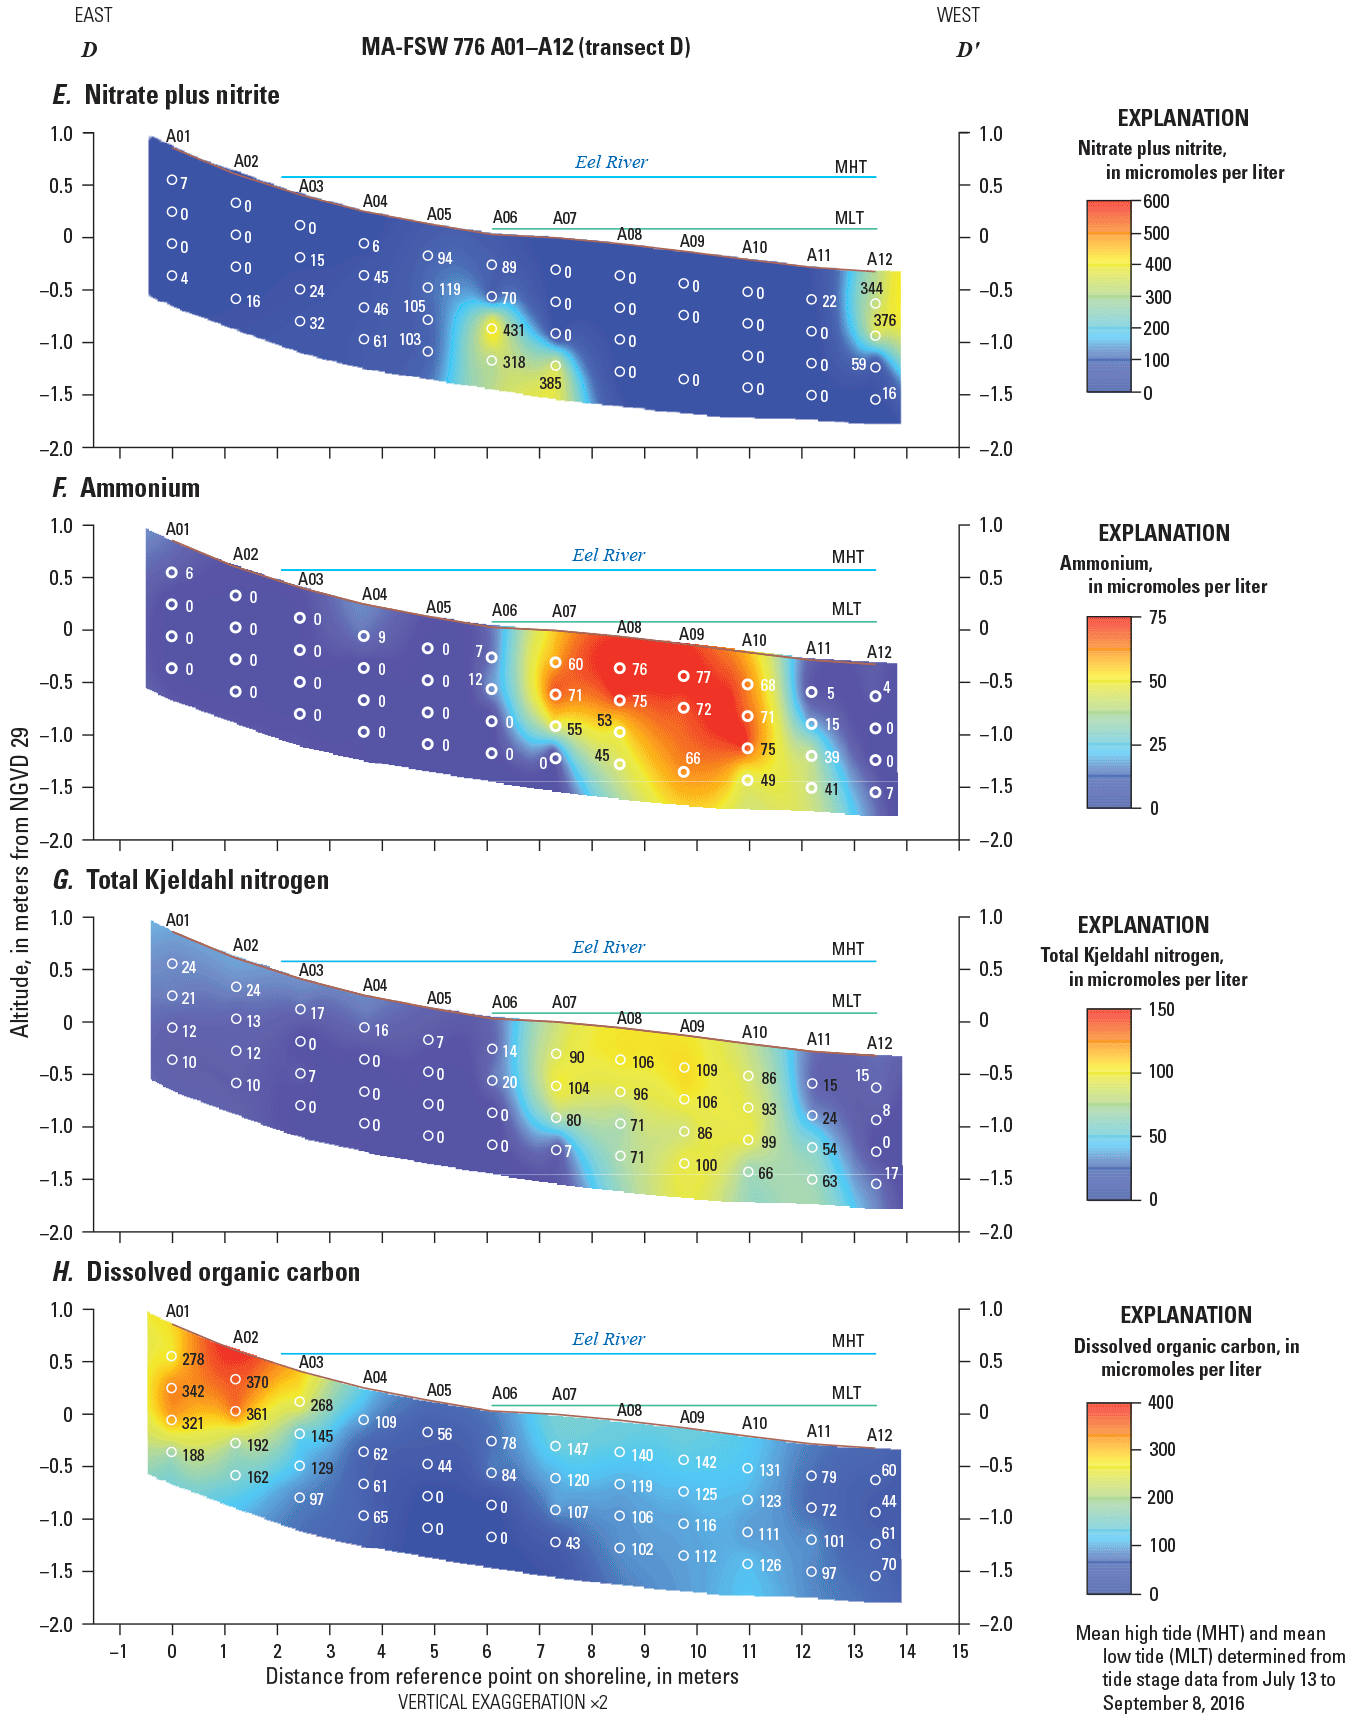
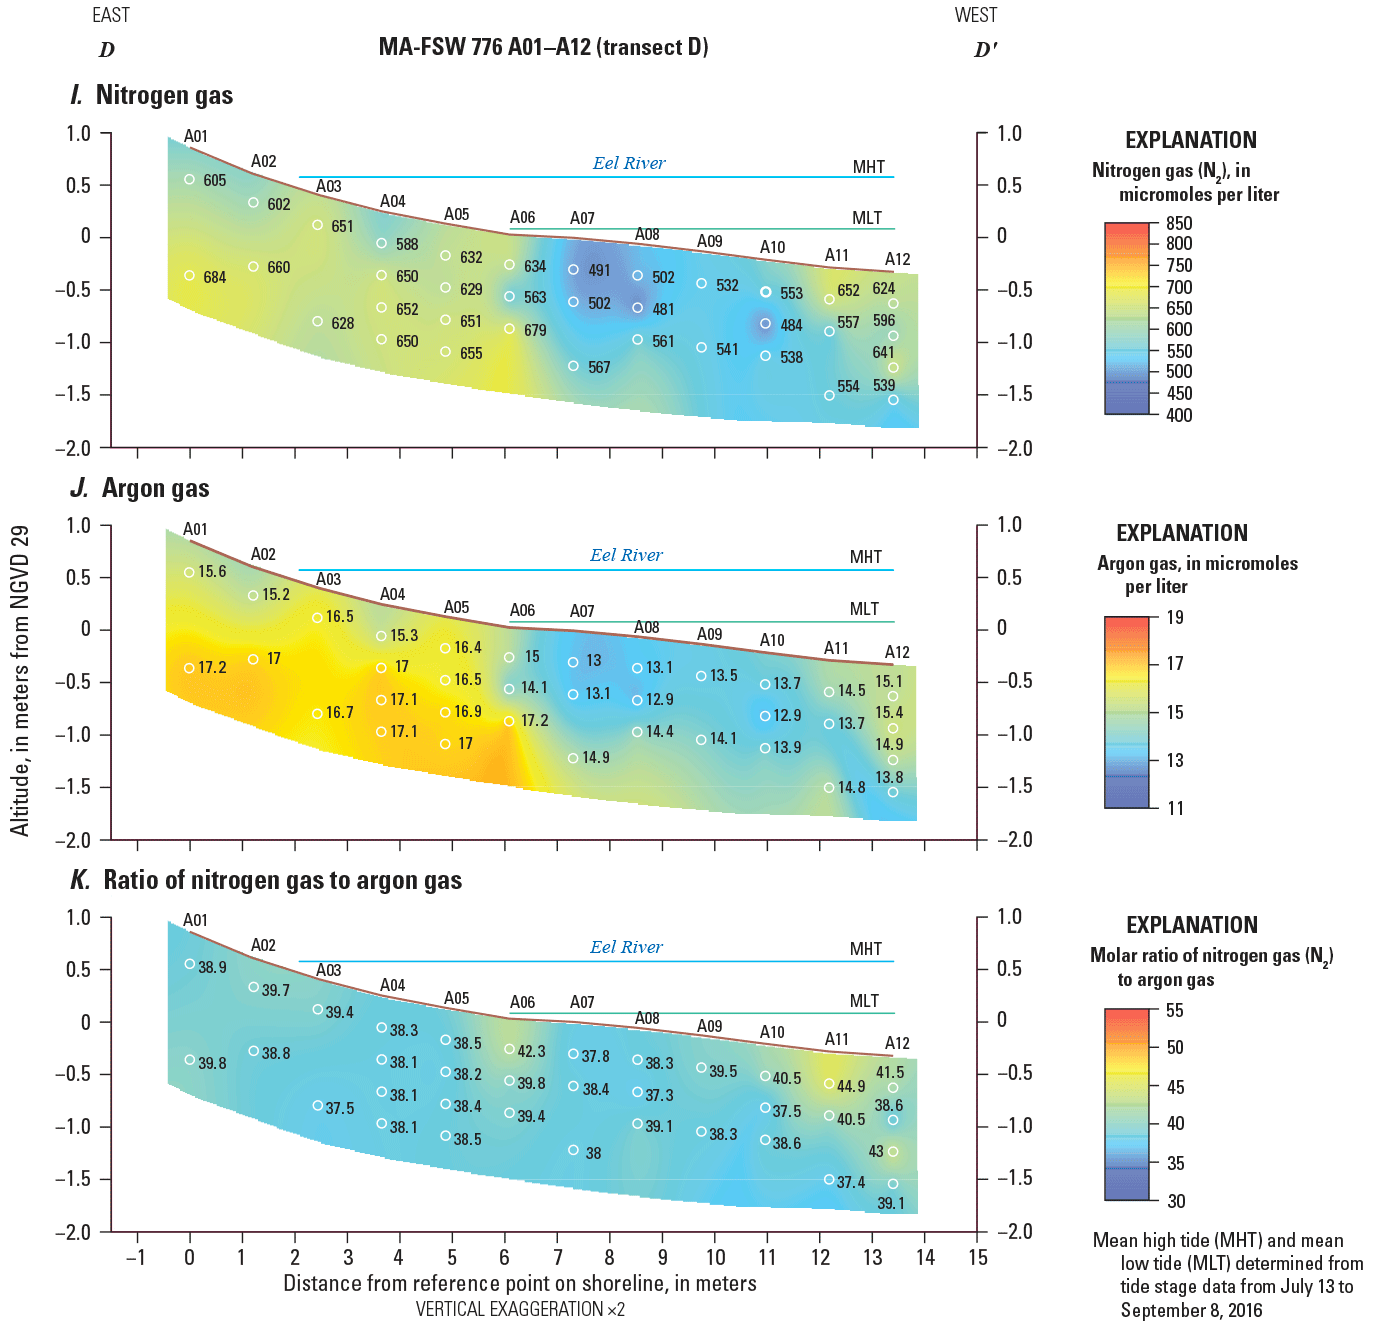
Vertical transects showing distributions of A, specific conductance, B, dissolved oxygen, C, pH, D, alkalinity, E, nitrate plus nitrite, F, ammonium, G, total Kjeldahl nitrogen, H, dissolved organic carbon, I, nitrogen gas, J, argon gas, and K, ratio of nitrogen gas to argon gas in groundwater along transect D–D′ (F776) beneath the Eel River, Seacoast Shores peninsula, East Falmouth, Massachusetts, June 14–15, 2016. Location of transect is shown in figure 4.
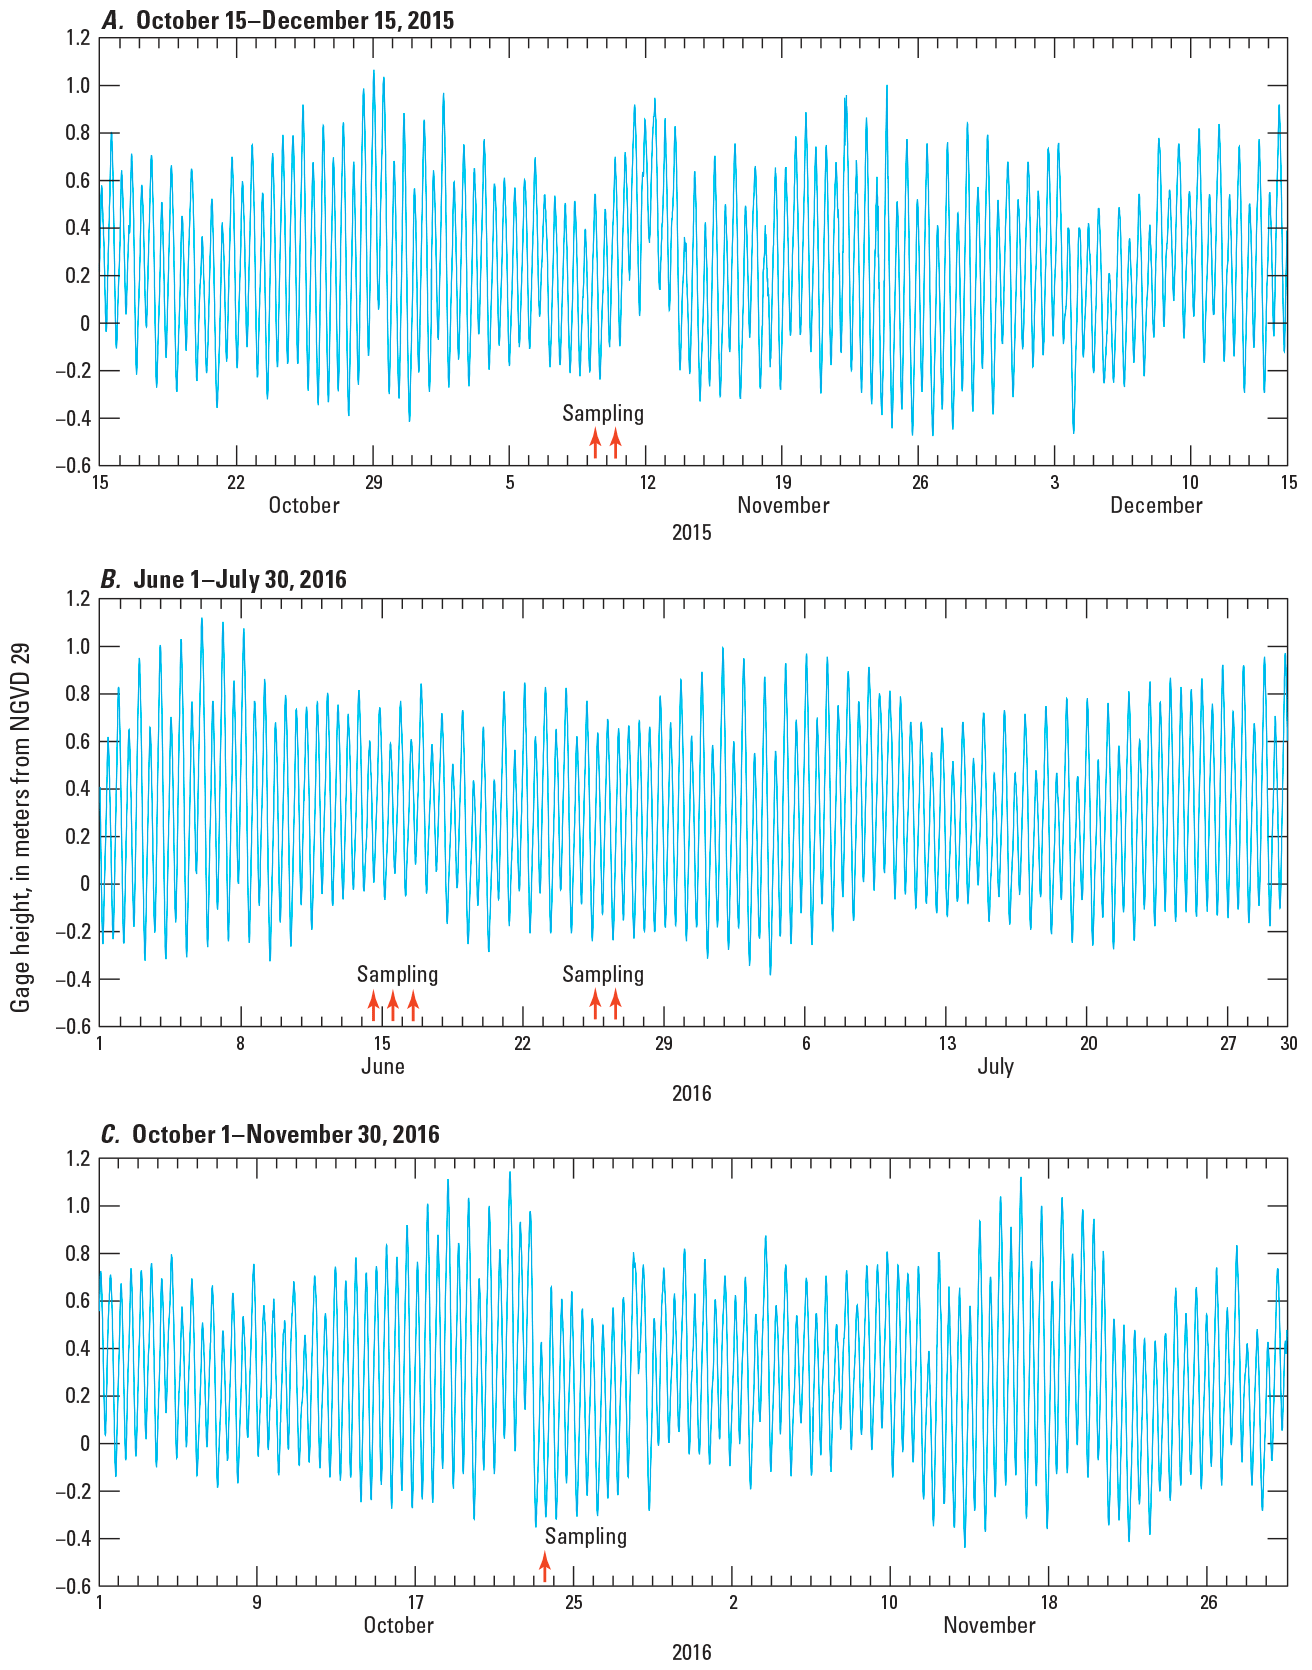
Graphs showing tidal stage and shallow nearshore groundwater sampling days (red arrows) during neap tide during A, November 2015 sampling, B, June 2016 sampling, and C, October 2016 sampling. Tide data for U.S. Geological Survey site 413601070275800, Popponesset Bay, Mashpee Neck Road, near Mashpee, Massachusetts. NGVD 1929, National Geodetic Vertical Datum of 1929.
The patterns observed in this study suggest fresh groundwater discharge in the intertidal zone, particularly in the lower intertidal zone. The pattern of more saline water at greater depths in the subtidal zone at transect D–D′ compared with transect A–A′ could indicate fresh groundwater inputs were stronger at transect A–A′ and saline water infiltration was stronger at transect D–D′ when the transects were sampled. The middle transect, B–B′, which was sampled in November 2015, was more like transect A–A′ in the subtidal zone from 8 to 10 m offshore and more like transect D–D′ from 11 to 14 m offshore.
The SpC data from all three transects are consistent with a conceptual model of saline water infiltrating from the estuary above and mixing with freshwater in the subterranean estuary. There is evidence for an ISC in the intertidal zone, plus a subtidal shallow zone of saline water farther offshore, consistent with the findings of Colman and others (2018) (fig. 3). The overall pattern of SpC data in the intertidal and subtidal zones in transect B–B′ was approximately the same in 2015 (fig. 8A) as it was in 2013 (fig. 3). The subtidal shallow saline zone apparently does not represent the landward edge of a deeper upwelling saltwater wedge (fig. 2), as it is bounded in part by freshwater below and farther offshore. Instead, the source of the near-surface saline water more than 5 m offshore could include local saltwater infiltration from the estuary above. Although flow patterns in this subtidal area were not well characterized, it is referred to in this report as a “subtidal saltwater cell,” where infiltrating estuarine water overlies and mixes with underlying fresh groundwater. At this location in the Eel River subterranean estuary, and offshore to at least 14 m, a thick, fresh groundwater lens apparently prevents a deep saltwater wedge from discharging to the surface. The estuary is about 100 m wide in this area and it is possible that a deep saltwater wedge could be present farther offshore and that it is connected with the overlying estuary as in the Waquoit Bay model. Colman and others (2018) reported a zone of fresh groundwater within the vertical profile from approximately 2 to 10 m below the sediment/water interface and extending offshore to their farthest measurement location (18 m offshore) (fig. 3). Although no samples have been collected farther offshore, geophysical resistivity surveys indicate fresh groundwater may be widespread beneath the Eel River estuary (Lane and others, 2020).
The subterranean estuary groundwater was sampled at 1.83- 3.35-, and 4.88-m depths below the sediment/water interface in October 2016 at three locations on transect C–C′ (F773, F774, and F775) (fig. 4). The vertical profiles for SpC and other water-quality variables for transect C–C′ are not shown in figures in this report because only nine points were sampled and all depths were below those sampled on the other transects. The data are available in the accompanying data release (Huntington and others, 2024). SpC measurements at these locations and sampling depths were consistent with observations reported by Colman and others (2018). Samples were brackish to saline, (10,040 to 35,620 microsiemens per centimeter at 25 degrees Celsius [µS/cm at 25 °C]) at 1.83 m, moderately brackish (593–5,327 µS/cm at 25 °C) at 3.35 m and fresh (343–955 µS/cm at 25 °C) at 4.88 m. Saline conditions at 1.83-m depth in transect C–C′ were consistent with saline-water infiltration that extends from the sediment/water interface to approximately 2-m depth as was reported by Colman and others (2018) when transect B–B′ was sampled in September 2013.
In two of the transects (A–A′ and D–D′) in June 2016, the vertical profiles at the farthest offshore sampling location indicated possible freshwater discharge at about 13–14 m offshore (figs. 7A and 9A) that is consistent with the SpC profile observed in 2013 (Colman and others, 2018). The groundwater sampling in 2013 extended about 20 m offshore and to 11 m below the sediment/water interface, and the deeper underlying saltwater wedge that was identified during that sampling did not discharge to the sediment surface as shown in the conceptual model by Abarca and others (2013).
Dissolved Oxygen
Dissolved oxygen concentrations generally were suboxic in the subtidal zone in transects B–B′ and D–D′ (figs. 8B and 9B). Suboxic is defined here as dissolved oxygen concentrations less than about 0.5 mg/L (<16 µmol/L as O2) (Hinkle and others, 2007). Dissolved oxygen concentrations (as O2) less than 30 µmol/L are favorable for classical denitrification (Spiteri and others, 2008). Dissolved oxygen concentrations in the subtidal zone in transect A–A′ were more variable, ranging from suboxic to 71 µmol/L (fig. 7B). In the intertidal zone in transects A–A′ and D–D′ from 61-cm to 122-cm depths below the sediment surface, dissolved oxygen concentrations generally ranged from 18 to 86 µmol/L. The intertidal zone in transect B–B′ was suboxic (fig. 8B). For the three locations sampled in October 2016 along transect C–C′, dissolved oxygen concentrations were less than 10 µmol/L at 1.8-m depth, 80–270 µmol/L at 3.3-m depth, and 36–126 µmol/L at 4.88-m depth (Huntington and others, 2024). Dissolved oxygen concentrations were similar to those measured at depths less than 2 m in 2013 (Colman and others, 2018) but were about two times higher than what was measured from 3- to 5-m depths in 2013.
pH
Measured pH values ranged from about 5.0 to 7.7 (figs. 7C–9C) and generally were correlated positively with SpC, qualitatively consistent with differences between fresh groundwater recharge on land and saline recharge from the estuary. There was little difference in pH with depth in transect D–D′ and substantial variability with depth in the other transects, similar to the vertical trends in SpC with the exception of the farthest offshore profiles on transect A–A′.
Alkalinity
Measurements of total alkalinity in groundwater were made to determine whether alkalinity gradients were consistent with organic carbon oxidation coupled with nitrate reduction (Abrams and others, 1998; Colman and others, 2018). Alkalinity is substantially higher in seawater than in fresh groundwater at the study site. Therefore, it can be difficult to detect minor effects of carbon oxidation on alkalinity in the subterranean estuary where estuarine saline waters infiltrate and mix with fresh groundwater. However, increases in alkalinity have been attributed to denitrification in high salinity groundwater in Waquoit Bay, Cape Cod, Massachusetts (Liu and others, 2017). Other processes can generate alkalinity, including organoclastic sulfate reduction, aerobic metabolism of organic matter, iron reduction, and DNRA (Rassmann and others, 2020; Meister and others, 2022); therefore, increases in alkalinity are only potential indicators of denitrification.
Alkalinity was measured only at selected locations on the transects; however, a general pattern of higher alkalinity associated with higher specific conductance is apparent in transect B–B′ (fig. 8D). Alkalinity was somewhat elevated in the shallow (30-cm depth) groundwater beneath the intertidal zone in transect B–B′ (greater than 1,000 µeq/L) (fig. 8D) and transect D–D′ (greater than 500 µeq/L) (fig. 9D). In this zone, saline water is thought to infiltrate at high tide, mix with fresh groundwater, and discharge back to the estuary at low tide. Alkalinity was more highly elevated (1,800–2,500 µeq/L) in shallow groundwater (30-cm depth) in the subtidal zone in transect B–B′ (fig. 8D) and at two locations (A11 and A12) where it was measured at the 61-cm depth in the subtidal in transect A–A′ (fig. 7D). Despite a general trend indicating that elevated alkalinity was usually associated with saltwater infiltration, there was some evidence of alkalinity in excess of what was typically measured that may be from other sources, for example, at two sites farthest from shore in transect A–A′ (A11 and A12) (fig. 7D) and in the near intertidal zone at 61 to 122 cm below the sediment/water interface in transect D–D′ (fig. 9D).
The elevated alkalinity in two samples at 61-cm depth from 12 to 14 m offshore in the subtidal region of transect A–A′ (fig. 7D) were associated with relatively high N2/Ar ratios (fig. 7K) (refer to section, “Concentrations and Ratios of Nitrogen and Argon Gases”) and relatively low SpC (fig. 7A) and could include components of alkalinity derived from carbon oxidation by nitrate or oxygen reduction. Alkalinities also were somewhat elevated at the 91-cm depths at A12 (farthest offshore location) and the 61-cm depth at A09 on the transect A–A′ where the groundwater was near the freshest end of the mixed salinity zone (fig. 7A) and N2/Ar ratios also were elevated. Alkalinities were lower at the 61-cm depth closer to shore (A05 to A07) in the mixing zone below saline waters (fig. 7A, 7D), indicating that infiltrating sea water may not be the only source of elevated alkalinities.
Nitrate Plus Nitrite
The vertical profiles of nitrate plus nitrite concentrations differed substantially among transects. In transect A–A′, relatively high nitrate plus nitrite concentrations (400–600 µmol/L) extended from the intertidal zone (A03) to 9 m offshore into the subtidal zone (A08) from 61 to 122 cm below the sediment/water interface (fig. 7E). This zone of elevated nitrite plus nitrate is notable in that these concentrations in the shallow subterranean estuary beneath the intertidal zone were five times higher than the concentrations measured in 2013 at the same depths below the intertidal zone in transect B–B′. There was a smaller spatial extent and lower elevated concentration zone in transect B–B′ in 2015, compared with the zone in transect A–A′ extending from onshore to the middle of the intertidal zone with the highest nitrate plus nitrite concentrations at the 91-cm depth below the sediment/water interface at F740 and F739 (fig. 8E). Additionally, nitrate plus nitrite concentrations were moderately elevated at 1.5-m depth at F733 and at 61-cm depth at F745 (fig. 8E).
The nitrate plus nitrite concentrations were low in transect D–D′ but detectable in most of the intertidal zone but were substantially higher at the offshore end of the intertidal zone at 91-cm and 122-cm depths (A06) and the nearest subtidal (A07) locations and at 30-cm and 61-cm depth at the farthest offshore location (A12) (fig. 9E). Below the 30-cm depth and from the intertidal to near subtidal zone (A03 to A08), nitrate plus nitrite concentrations were substantially higher in the subtidal zone in the northernmost transect A–A′ than in transect D–D′. Nitrate plus nitrite concentrations in deeper zones (3.3-m and 4.88-m depth) in transect C–C′ ranged from 300 to 700 µmol/L (Huntington and others, 2024) and were similar to the concentrations measured at this depth in transect B–B′ sampled in 2013 (fig. 3) (Colman and others, 2018).
Nitrite concentrations were less than the reporting limit of 7 µmol/L in all but six samples with intermediate salinities. Reported nitrite concentrations ranged from 5 to 30 µmol/L, and nitrite/nitrate ratios were less than 0.1 in all but one sample (0.2 at the shallowest location at A11 in transect D–D′). In this report, nitrate (or NO3−) commonly is used to refer to nitrate plus nitrite.
Ammonium
Dissolved ammonium concentrations generally were positively correlated with SpC. Ammonium was either not detected, or detected at very low concentrations, at all depths and in all transects in the intertidal region from the shore to 4 m offshore (figs. 7F, 8F, and 9F). In the subtidal region, 6–14 m offshore, ammonium concentrations generally were elevated (30–100 µmol/L) relative to fresh groundwater concentrations in the intertidal zone at the shallowest depth (30 cm) in transects A–A′ and B–B′ (figs. 7F and 8F). In transect D–D′, ammonium concentrations generally were elevated (30–53 µmol/L) at all depths in the subtidal zone 7.5–12 m offshore (fig. 9F). These ammonium concentrations and the concentrations measured for the three well clusters sampled in October 2016 (transect C–C′) that were sampled at 1.8-m, 3.3-m, and 4.88-m depths were similar to those measured in 2013, indicating persistence of somewhat elevated ammonium in the shallow subterranean estuary wherever relatively saline porewater was observed.
In most locations and sampling depths within 4–5 m of the shore in transects A–A′ and B–B′, there was measurable nitrate plus nitrite but little or no detectable ammonium. Where ammonium and nitrate plus nitrite were both present in measurable concentrations, ammonium was typically a factor of 5 or 10 lower in concentration than nitrate plus nitrite. At the shallower sampling depths from about 7 to 13 m offshore, there were many instances where ammonium was present but nitrate plus nitrite was not detected. Ammonium concentrations tended to be highest in the most saline groundwater. It is unlikely that the ammonium in this zone originated from infiltrating surface water that mixed with the underlying freshwater flowing into this zone (fig. 3) because ammonium was less than detection limits in the Eel River when measured in 2013 (Colman and others, 2018). Ammonium likely originated in part from the anaerobic degradation of organic matter in the shallow subestuarine sediments (Reddy and others, 1984). Ammonium also could be produced by microbial dissimilatory nitrate reduction (Lam and Kuypers, 2011); however, concentrations of nitrate were low in infiltrating saline water. Furthermore, the low oxygen concentrations in saline groundwater would not have supported substantial ammonium oxidation to nitrite or nitrate. Ammonium also can sorb to or desorb from sediment ion-exchange sites.
Mixing of nitrate-bearing fresh groundwater with ammonium-bearing fresh or saline shallow porewater could have supported anammox, the coupled anaerobic oxidation of ammonium and reduction of nitrite to produce nitrogen gas (Smith and others, 2015). It is not clear whether all of the ammonium was carried into the mixing zone by saline groundwater that transported ammonium produced through anaerobic metabolism in the subestuarine sediments, or if some of the ammonium was produced within the mixing zone; however, there is no evidence for substantial ammonium enrichment in mixed-salinity samples.
Ammonium concentrations in saline groundwater below the freshwater lens (8 or more meters below our lowest sampling point) ranged from 89 to 119 μmol/L in groundwater 35 m onshore and from 4 to 62 μmol/L in the subterranean estuary at approximately 10 m offshore, as determined by Colman and others (2018).
Ammonium concentrations in sample locations where evidence of nitrate reduction was observed (refer to section “Evaluation of Nitrate Reduction to Nitrogen Gas”) typically ranged from 5 to 10 µmol/L, whereas ammonium was largely absent from other areas, except the shallowest (30-cm) depth, where SpC indicated saltwater infiltration from the estuary where ammonium concentrations typically were 50–60 µmol/L (fig. 7F). This association between locations where there was geochemical evidence for denitrification and the presence of ammonium also was reported by Colman and others (2018).
Total Kjeldahl Nitrogen and Organic Nitrogen
The distribution of dissolved total Kjeldahl nitrogen in transects A–A′ and D–D′ sampled in June 2016 generally were similar to the distribution of SpC. Total Kjeldahl nitrogen concentrations ranged from 40 to 130 µmol/L at the shallowest depth (30 cm) in the subtidal zone in transect A–A′ (fig. 7G) and at all depths in the subtidal zone from 7.5 to 11.5 m from shore in transect D–D′ (fig. 9G). Total Kjeldahl nitrogen concentrations generally were elevated (60–80 µmol/L) at the shallowest depth (30 cm) and ranged from 2 to 80 µmol/L at all depths from 61 to 122 cm in the subtidal zone of transect B–B′ (fig. 8G).
The similar distributions of salinity and total Kjeldahl nitrogen in these mixing zones, and the fact that Colman and others (2018) reported minimal total Kjeldahl nitrogen concentrations (less than 10 µmol/L) throughout the freshwater subterranean estuary in this area, indicates a predominantly estuarine (surface water or sediment) source rather than an upwelling fresh groundwater source. Dissolved organic nitrogen concentrations (determined from the difference between total Kjeldahl nitrogen and ammonium nitrogen) in the subtidal zones of transects D–D′ and A–A′ ranged from 0 to 85 (median=17) μmol/L and 0 to 49 (median=8) μmol/L, respectively. Colman and others (2018) reported dissolved organic nitrogen concentrations in Eel River surface water of 22 μmol/L in August 2013. Dissolved organic nitrogen in the subtidal zone could be derived from infiltrating estuarine water or anaerobic metabolism in subestuarine sediments.
Dissolved Organic Carbon
The patterns in the vertical profiles of DOC concentration (figs. 7H, 8H, and 9H) generally were similar to the patterns of SpC (figs. 7A, 8A, and 9A) in all transects, with the exception of a zone of high DOC concentrations (200–480 µmol/L as carbon) in onshore groundwater that generally decreased with depth and with increasing distance from the shore. DOC was moderately elevated (60–167 µmol/L as carbon) in the shallow subsurface (30-cm depth) in the subtidal zone from 7 to 14 m offshore. At depths of 61 to 122 cm in the intertidal and subtidal regions, DOC generally was below the level of detection in transect A–A′ and ranged from 50 to 120 µmol C/L in transects B–B′ and D–D′. Colman and others (2018) reported DOC concentrations ranged from 160 to 250 µmol/L in the Eel River surface water in August 2013. The vertical distributions suggest a terrestrial surface soil source for the zone of elevated DOC onshore and an estuarine source infiltrating the shallow sediments offshore that is variable in time. In general, DOC concentrations were relatively low in fresh groundwater containing high nitrate concentrations; thus, DOC in the subterranean estuary apparently was derived from sources other than onshore wastewater recharge.
Concentrations and Ratios of Nitrogen and Argon Gases
The concentrations of dissolved nitrogen and argon in samples from transects A–A′, B–B′, and D–D′ are shown in figures 7I, 7J, 8I, 8J, 9I, and 9J, respectively. Argon and nitrogen gas concentrations generally were inversely correlated with SpC values because the solubilities of atmospheric gases in water are inversely related to salinity. Minor deviations from this relation commonly result from varying amounts of excess air in groundwater samples, whereas larger deviations can result from addition of excess nitrogen gas from nitrate reduction (N2MIC). In general, areas of the profiles with relatively high N2/Ar ratios are interpreted to contain substantial concentrations of N2MIC. The area of highest N2/Ar ratios is in relatively fresh groundwater in transect A–A′, 10 to 13.5 m from the shoreline at 61-cm to 122-cm depth below the sediment/water interface (fig. 7K). Other areas with elevated N2/Ar ratios include 9–10 m from the shoreline at the 30-cm depth in transect A–A′ (fig. 7K), 11–13.5 m from the shoreline at 30-cm to 122-cm depths in transect B–B′ (fig 8K), and 11–13.5 m from the shoreline at the 30-cm depth in transect D–D′ (fig. 9K).
The N2/Ar ratios in groundwater samples collected on transect C–C′ in October 2016 from locations F773, F774, and F775 at depths of 1.83, 3.35, and 4.88 m below the sediment/water interface with 343 < SpC < 2,560 µS/cm at 25 °C had relatively low N2/Ar ratios, suggesting relatively little nitrogen gas from nitrate reduction (Huntington and others, 2024). In contrast, two of the three wells with intermediate-to-high salinity (10,040 < SpC < 35,620 µS/cm at 25 °C) showed evidence of microbial production of nitrogen gas, resulting in higher N2/Ar ratios. The two wells showing evidence for excess nitrogen gas were at the shallowest depth (1.83 m) and highest SpC (27,360–35,620 µS/cm at 25 °C) and farthest from the shore (F774 and F775). Nitrate concentrations were about 600 µmol/L in the relatively fresh groundwater beneath those wells.
Evaluation of Nitrate Reduction to Nitrogen Gas
A common method for evaluation of nitrogen gas and argon gas concentrations in groundwater, and estimation of microbial nitrogen gas production, includes plotting the data as scatterplots of nitrogen gas in relation to argon gas (fig. 11). In this plot, the solid lines indicate theoretical dissolved gas concentrations in equilibrium with air (ASW, air-saturated water; Weiss, 1970) for water having salinities and recharge temperatures roughly bracketing those of the samples (0 and 30 practical salinity units [psu]; 10, 15, and 20 °C), and dotted lines indicate the effect of adding 2 mL (standard temperature and pressure, STP) of excess air per liter due to dissolution of bubbles during recharge or sample processing.
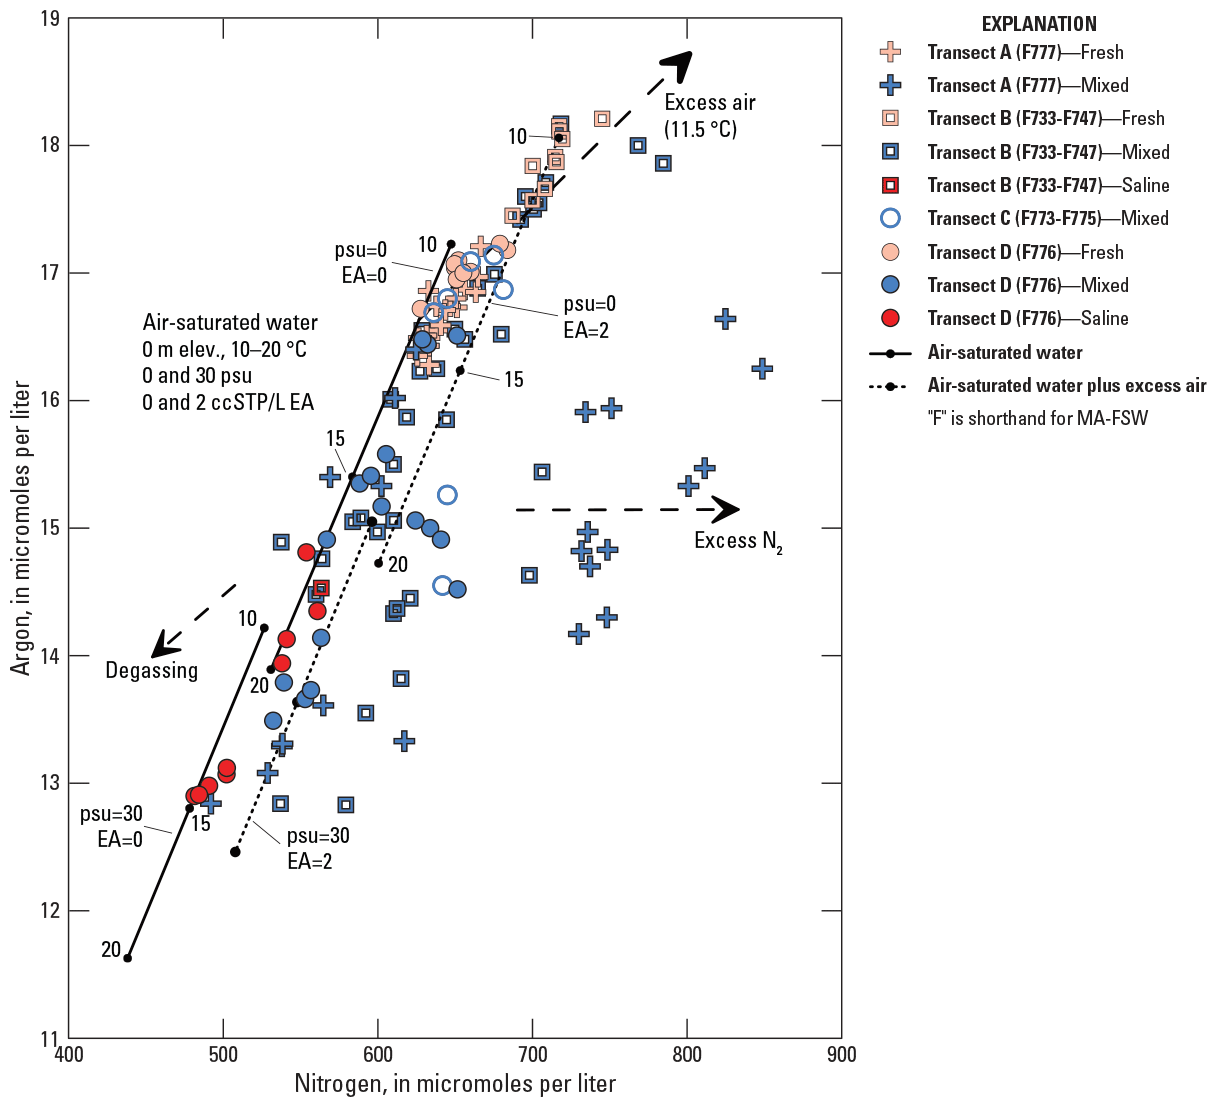
Graph showing relation between nitrogen gas (N2) and argon gas (Ar) concentrations from transects A, B, C, and D in the nearshore subterranean Eel River estuary adjacent to the Seacoast Shores peninsula, East Falmouth, Massachusetts. Locations of transects are shown in figure 4. Samples are grouped by salinity: “Fresh” indicates samples (pink symbols) with salinity <0.1 practical salinity units (psu) (450 microsiemens per centimeter), “Saline” indicates samples (red symbols) with salinity >25.0 psu (39,500 microsiemens per centimeter), and “Mixed” indicates samples (blue symbols) with salinity intermediate between the fresh and saline endmembers. The solid lines indicate theoretical dissolved gas concentrations in equilibrium with air (ASW, air-saturated water) for freshwater (0 psu) and saline water (30 psu), with recharge temperatures of 10, 15, and 20 degrees Celsius (°C) (solubility data from Weiss, 1970). Dotted lines indicate the effects of adding 2 cubic centimeters (cc) of excess air at standard temperature and pressure per liter (2ccSTP/L EA). Dashed arrows indicate hypothetical trajectories that could result from degassing, excess N2 (addition of N2MIC), and addition of excess air at constant temperature.
The nitrogen and argon gas concentrations in the freshest (salinity <0.1 psu) endmember groundwater samples collected from transects A–A′, B–B′, and D–D′ are clustered in an array that resembles a hypothetical trajectory for air-saturated water (ASW) plus variable amounts of excess air (EA ≈ 0–3 ccSTP/L) at relatively constant recharge temperature (T ≈ 11–12 °C) (fig. 11). Average groundwater recharge temperatures commonly are similar to average air temperatures in humid temperate regions (Stute and others, 1995). Apparent recharge temperature can deviate significantly from average air temperature where the vadose zone is thin, and, because of warming through time of air and soil temperature, estimated recharge temperature can vary with date of recharge (Szymczycha and others, 2017). Thus, the observed scatter of points around the estimated recharge temperature and EA line is likely due to variations in recharge temperature as well as procedural and analytical errors. As the average air temperature at the nearby Barnstable airport from 1991 to 2020 was 11.1 °C (Northeast Regional Climate Center, http://www.nrcc.cornell.edu, accessed on April 11, 2022), the clustering of gas data indicating a similar recharge temperature with variable excess air (fig. 11) suggests that gas concentrations in the fresh groundwater endmember samples were largely controlled by physical processes, and that microbial nitrogen gas was relatively minor.
In high-salinity groundwater samples (salinity ≥ 25 psu), gas concentrations plot in an array that is roughly parallel to the ASW curve for saline water (30 psu), with a relatively wide range of apparent recharge temperatures (fig. 11). Data suggest relatively little EA content, and little or no clearly resolvable N2MIC in the high salinity samples, consistent with general lack of nitrate in saline estuarine recharge. The pattern observed for samples with intermediate salinity (0.1 < salinity ≤ 25 psu) (fig. 11) contrasts strongly with the pattern for the fresh and saline endmember samples. Gas concentrations in many of these intermediate-salinity samples show evidence of substantial microbial production of nitrogen gas, resulting in a large shift to the right along the nitrogen gas axis (fig. 11). Previous studies have provided evidence for microbial removal of nitrate in subterranean estuaries on Cape Cod, Massachusetts, where nitrate conveyed by fresh groundwater approaches discharge areas near the land/sea margin where reducing, saline groundwater also is present (Kroeger and Charette, 2008; Colman and others, 2018).
Quantification of nitrate losses, as freshwater parcels transit toward the estuary and mix prior to discharge with saline groundwater that has recharged through Eel River sediment, requires a different approach to that commonly used for fresh groundwater samples (Böhlke and others, 2002; Griggs and others, 2003; Szymczycha and others, 2017). In estuarine research, it is common practice to examine behavior of dissolved constituents across the salinity gradient, to determine whether concentrations deviate from conservative mixing between representative freshwater “endmember” concentrations and saline endmember concentrations. Concentrations above such mixing lines are evidence of production of the constituent of interest during transit through the subterranean estuary, while concentrations below the conservative mixing line provide evidence for loss or consumption of the constituent of interest. In groundwater settings where dispersion is limited, substantial variability in constituent concentrations can occur at relatively small spatial scales, and there can be uncertainty regarding which freshwater and saltwater samples best represent the endmembers for any given mixed salinity sample. Those features present a challenge for analysis of conservative mixing. Nonetheless, the ranges of concentrations and concentration changes in groundwater environments commonly are large enough that chemical transformation can be readily detected, particularly where a large number of samples have been collected across each salinity zone (Kroeger and Charette, 2008).
In the current study, we applied conservative mixing analysis for dissolved gas samples in the subterranean estuary beneath the Eel River (fig. 12A–12E). Samples were divided into groups representing a “fresh” endmember (<0.1 psu) that displayed evidence of varying excess air but no clear evidence of N2MIC, a “saline” endmember (>25.0 psu) that presumably was recharged from the estuary with little or no nitrate and also displayed little or no evidence of N2MIC, and “mixed” samples (≥0.1 to 25 psu) with evidence of varying N2MIC concentrations. Whereas the individual gas concentrations vary substantially because of varying physical factors such as recharge temperature and excess air, the N2/Ar ratios are less affected by those factors and relatively more sensitive to addition of microbial nitrogen gas. Data from the “fresh” and “saline” endmembers were used to determine a “baseline” relation between salinity and the N2/Ar ratio for samples most likely to have no N2MIC (fig. 12C). The N2/Ar baseline equation was constrained by the mean values of psu and N2/Ar in the fresh and saline endmembers and by the assumption that the mean values of calculated N2MIC concentrations in those groups should be 0:
Samples that plot substantially above this N2/Ar mixing baseline indicate excess (non-atmospheric) nitrogen gas that may be a result of nitrate reduction (that is, N2MIC). The apparent concentration of N2MIC in each sample was estimated from:
Calculated N2MIC concentrations are summarized in figure 12D, where small positive and negative apparent values (for example, −25 µmol/L < N2MIC < 25 µmol/L) are related in part to uncertainties in the data and assumptions, as described below. The relation between calculated N2MIC and salinity indicates that nitrate loss occurred over a wide range of salinity values from nearly fresh to greater than 24 psu (fig. 12D).
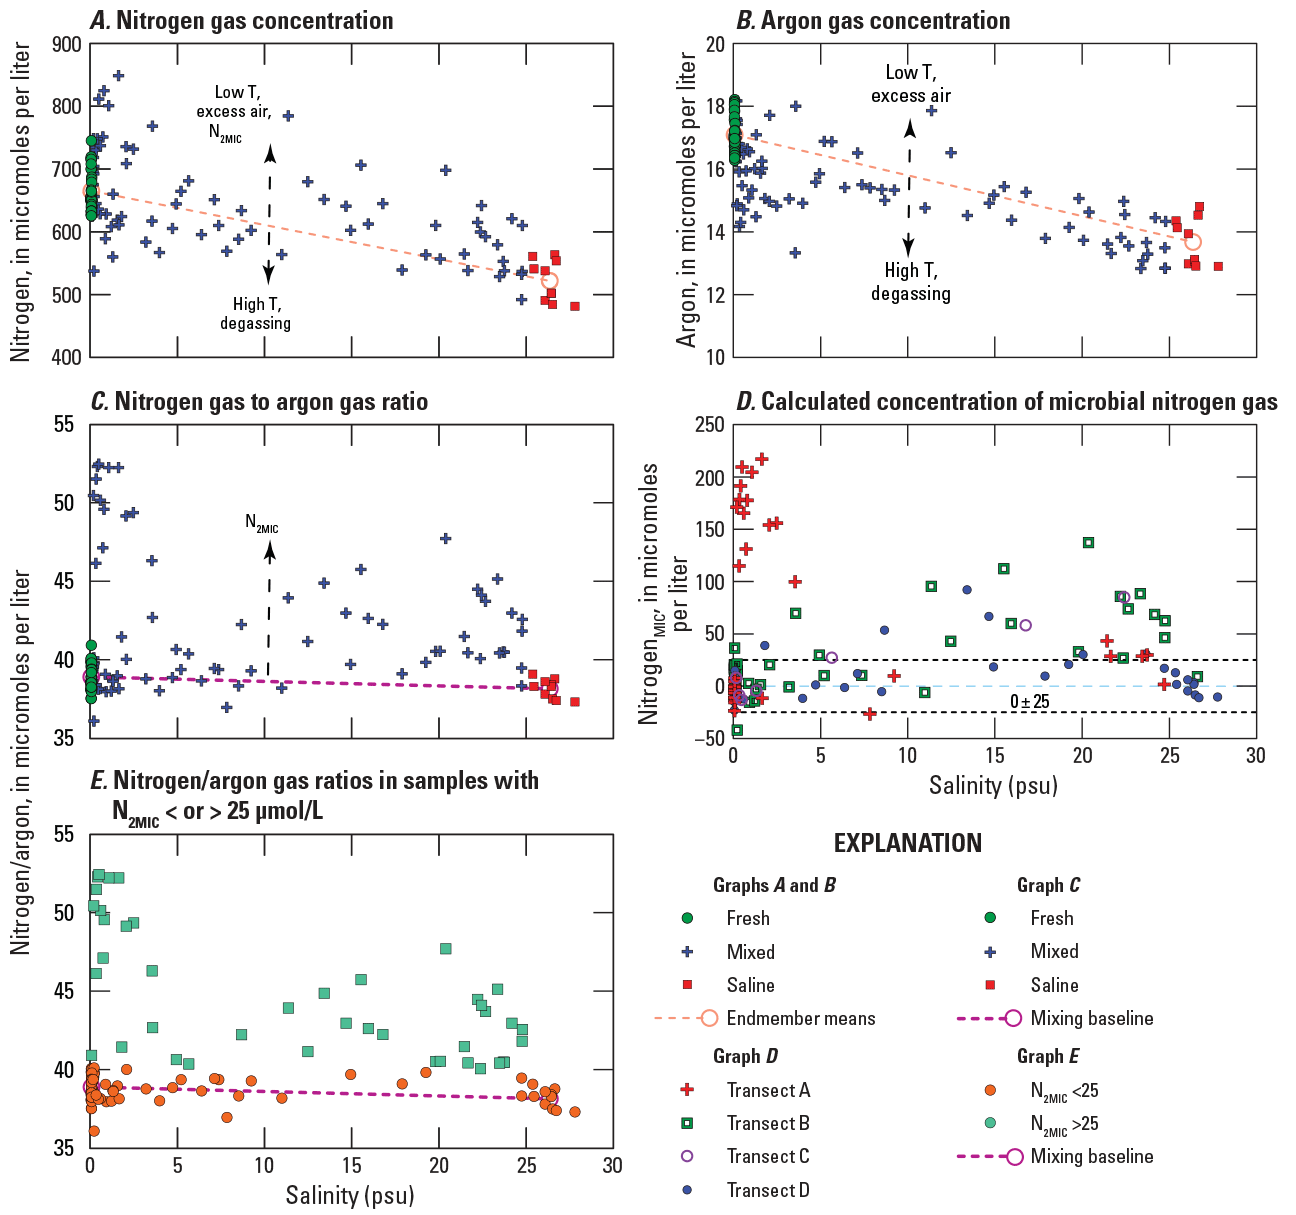
Graphs showing relations between salinity and A, nitrogen gas concentration (N2), B, argon gas concentration (Ar), C, N2/Ar ratio, D, calculated concentration of microbial N2 (N2MIC), and E, N2/Ar ratios in samples with N2MIC concentrations greater or less than the reporting limit of 25 µmol/L in groundwater from transects A–A′, B–B′, C–C′, and D–D′ in the nearshore subterranean Eel River estuary adjacent to the Seacoast Shores peninsula, East Falmouth, Massachusetts, November 2015–October 2016. Locations of transects are shown in figure 4. Samples are grouped in three salinity groups: “Fresh” indicates samples with salinity <0.1 practical salinity units (psu), “Saline” indicates samples with salinity >25.0 psu, and “Mixed” indicates samples with salinity intermediate between fresh and saline. The dashed lines indicate theoretical concentrations and gas ratios in a conservative mixing scenario between mean “endmember” values for fresh and saline samples, while the vertical dashed arrows indicate various causes of variation of gas concentrations. The “mixing baseline” is described by equation 3. N2/Ar ratios significantly above the mixing baseline are interpreted as evidence of microbial nitrogen gas production through denitrification (± anammox) during groundwater transport through coastal sediments and mixing with saline groundwater.
For the “fresh” samples (n=37), equations 3 and 4 yielded a mean value of 0±13 (stdev) µmol/L for N2MIC and was consistent with a mean recharge temperature of 11.5 °C and excess air concentration of 1.1 ccSTP/L. For the “saline” samples (n=10), these equations yielded a mean value of 0±8 (stdev) µmol/L for N2MIC, which was consistent with a mean recharge temperature of 13.8 °C and excess air concentration of 0.6 ccSTP/L. For the “mixed” samples (n=82), equations 3 and 4 yielded variable concentrations of N2MIC ranging up to 217 µmol/L. The mean estimated fresh groundwater recharge temperature was similar to the mean annual air temperature in the area (11.1 °C), as discussed above; whereas the slightly higher mean estimated saline groundwater recharge temperature may have been related to the fact that many of the shallow saline samples were collected when infiltrating surface water from the estuary would have been warmer than the mean annual air temperature (for example, June 2016). The apparent difference in endmember excess air concentrations was consistent with previous coastal groundwater studies indicating subaqueous (saline) recharge is less likely to incorporate excess air than terrestrial (fresh) infiltration recharge (Böhlke and Krantz, 2003; Kroeger and Charette, 2008; Colman and others, 201818). The current calculations differ slightly from the approach used by Colman and others (2018), which was based on the approximation that all samples had 1±1 ccSTP/L of excess air.
Relatively high and variable excess air concentrations in fresh samples were indicated by an array of sample data in the upper part of the Ar-N2 diagram (fig. 11). For comparison with results of the N2/Ar baseline equation (eq. 3), N2MIC concentrations for individual fresh samples also were calculated by assuming they were all recharged at a constant temperature and with variable excess air. For a constant recharge temperature of 11.53 °C, the mean N2MIC concentration in fresh samples was 0±17 µmol/L, indicating more variability with this approach than with equation 3, for the same assumed mean value of 0 for N2MIC.
For the saline samples, an alternative approach to equation 3 was based on the assumption that no excess air was incorporated during recharge beneath the estuary. In this case, N2MIC concentrations were mostly positive, with mean value of 12±10 µmol/L. Thus, some N2MIC may have been present in saline samples, but the calculated concentrations were not significantly different from zero and it is possible that trace amounts of excess air were introduced as a result of imperfect sample handling.
For each sample, the concentration of N2MIC derived from equations 3 and 4 was used to quantify the concentration of nitrate that may have been reduced to nitrogen gas by denitrification, where 2 moles of nitrate are consumed to produce 1 mole of N2:
If anammox was an important process of nitrogen attenuation, then each mole of N2MIC could represent as little as 1 mole of nitrate loss, with concurrent consumption of ammonium. For plotting and interpretation of the data, results were considered to be insignificant if less than 25 µmol/L as N2MIC (figs. 12D and 12E) and 50 µmol/L as N2-NMIC, based on the standard deviations of the “fresh” and “saline” endmember values and additional uncertainties that could be related to sample handling (for example, air contamination, leakage, gas loss) or the calculations (for example, incompletely constrained assumptions). Calculation uncertainties were related to the fact that multiple variables affect the total concentration of nitrogen gas in a groundwater sample, including recharge temperature, salinity, amount of excess air incorporated, fractionation of excess air, production of excess nitrogen gas from denitrification (or anammox), amount of degassing, and fractionation during degassing; thus, measurements of Ar, N2, and salinity do not provide unique estimates of the nitrogen gas yield from nitrate reduction. Additional measurements, such as other noble gases, can help reduce those uncertainties in some situations (for example, Böhlke and others, 2007).
For each sample with dissolved gas data, measured nitrate plus nitrite concentrations were combined with the calculated concentration of nitrate loss (assuming all N2-NMIC was from denitrification) to obtain an estimate of the nitrate concentration the sample would have had in the absence of nitrate loss (apparent initial nitrate concentration). For these calculations, zero values were assigned to censored data (less than 7 µmol/L for measured nitrate plus nitrite and less than 50 µmol/L for nitrate loss). When plotted against salinity, these results provide useful constraints on major factors affecting the distribution of nitrate in the shallow subterranean estuary (fig. 13).
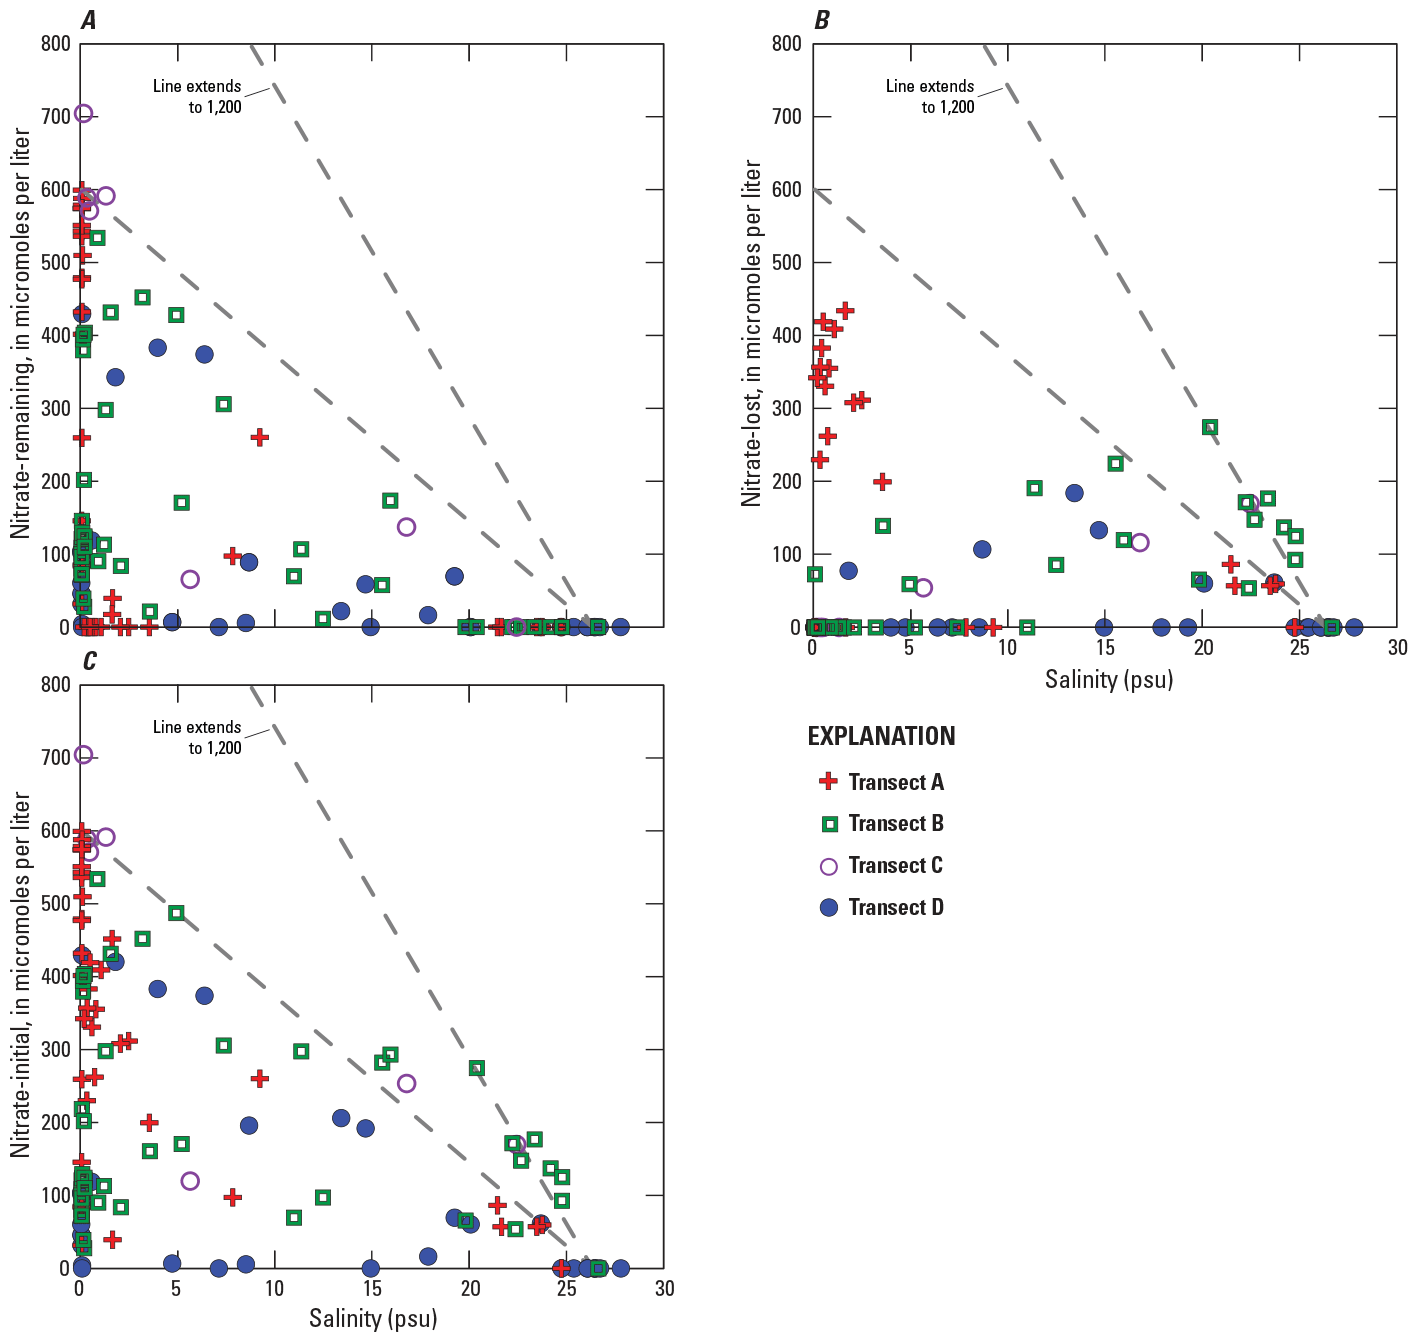
Mixing plots showing A, measured nitrate concentration (nitrate-remaining), B, calculated nitrate loss (N2-NMIC) assuming denitrification (nitrate-lost), and C, estimated initial nitrate concentration (nitrate remaining plus nitrate lost) (nitrate-initial), versus salinity in samples that were analyzed for argon and nitrogen gas from all transects beneath the Eel River, Seacoast Shores peninsula, East Falmouth, Massachusetts. Locations of transects are shown in figure 4. Zero values were assigned to censored data (less than 7 micromoles [µmol/L] for measured nitrate plus nitrite and less than 50 µmol/L for nitrate loss). Dashed lines indicate hypothetical mixtures of saline groundwater with no initial nitrate and fresh groundwater with either 600 or 1,200 µmol/L initial nitrate.
In figure 13A, measured nitrate plus nitrite (“NO3−”) concentrations in samples analyzed for argon gas and nitrogen gas plot within the triangular area defined by (1) saline water with no initial nitrate, (2) freshwater with no initial nitrate, and (3) freshwater with high initial nitrate (maximum near 700 µM). With few exceptions, calculated concentrations of N2-NMIC (nitrate loss) and initial nitrate (assuming denitrification) also plot within the same triangular area (figs. 13B and 13C). These patterns are consistent with the interpretation that freshwater was recharged on land with variable concentrations of nitrate (more or less contaminated by wastewater) and then the nitrate was variably reduced microbially and variably diluted by mixing with saline water in the subterranean estuary. These data do not indicate clearly where the nitrate reduction occurred (only that it had occurred between recharge and sampling), nor do they indicate a common factor that controlled the distribution of nitrate reduction (which could have been promoted by electron donors in the freshwater, saline water, or sediment). Some of the largest concentrations of N2-NMIC were in samples that were nearly fresh, indicating that aqueous electron donors in saline water likely were not the predominant controlling factor in those cases.
Some of the nearly saline samples with no measurable nitrate apparently had significant concentrations of N2-N and initial nitrate that plot outside the triangular area described above. Assuming no problems with sample handling, storage, and analyses, those data potentially could be consistent with either (1) dilution and denitrification of a freshwater component with initial nitrate concentration substantially higher than implied by the other samples (for example, around 1,200 µmol/L) or (2) anammox rather than denitrification as the predominant nitrate reduction process in a freshwater component more similar to the other samples (maximum around 700 µmol/L). Option 1 could be consistent with nitrate concentrations up to 1,700 µmol/L reported previously for deeper fresh groundwater beneath the study site (Colman and others, 2018), although flow paths consistent with this hypothesis have not been identified. Option 2 could be consistent with apparent ammonium deficits in some samples with moderate to high salinities, in comparison to conservative groundwater mixing (dilution) curves. If anammox were indicated as a predominant process in any of the samples, then it could have contributed partially to nitrate loss in other samples as well. Additional studies involving isotopic tracers, microbial data, and field experiments could help resolve these possibilities (for example, Smith and others, 2015).
Results summarized in figure 13 were aggregated to yield mean values and standard deviations for the concentrations of measured nitrate plus nitrite (158±202), nitrate loss (60±110 µmol/L), and initial nitrate (219±191 µmol/L) for the complete sample set with reported nitrogen gas and argon gas concentrations. These averages include saline samples that were recharged with little or no nitrate as well as fresh and mixed samples that were recharged with variable nitrate concentrations. The ratio of nitrate loss to initial nitrate in this evenly weighted sample set would be equivalent to a fractional nitrate loss of 27 percent. It is not possible to assess the accuracy and uncertainty of these aggregated data as representations of overall nitrogen removal in the subterranean estuary. Nonetheless, there is a high degree of certainty that a detectable quantity of land-derived groundwater nitrate was reduced to microbial nitrogen gas within the subterranean estuary before being discharged, as indicated by nitrogen gas concentrations that were commonly greater in the mixed salinity sample set than in the endmember sample sets (figs. 11 and 12C; table 1).
Table 1.
Summary statistics for dissolved gas concentrations and derived quantities in “Fresh,” “Saline,” and “Mixed” sample groups.[n, number of samples in group; Ar, argon concentration; N2, nitrogen gas concentration; N2/Ar, molar ratio of N2 to Ar; N2MIC, estimated concentration of microbial N2; T, mean estimated recharge temperature; EA, mean estimated concentration of excess unfractionated air; psu, practical salinity unit; µmol/L, micromole per liter; ccSTP/L, cubic centimeter at standard temperature and pressure per liter; std dev, standard deviation; --, not applicable]
As described in the text, calculations were based on the assumption that the mean concentrations of N2MIC were zero in the fresh and saline endmember groups (eq. 3).
Patterns and Controls of Nitrogen Transport and Attenuation
Some of the major processes affecting the distribution of nitrate can be resolved by comparing the distributions of salinity, measured nitrate, and nitrate lost along transects A–A′, B–B′, and D–D′ (fig. 14). The extent, or completeness, of denitrification at a given sampled location can be inferred from the proportion of estimated nitrate loss to initial nitrate (sum of nitrate measured and lost). In most locations in the region from A03 to A08 (from 2.5 to 8.5 m from the reference point on the shoreline), nitrate removal from fresh and brackish groundwater was less than 50 µmol/L and maximum nitrate concentrations (500 and 700 µmol/L) were similar to those associated with the underlying groundwater moving upwards in the interval from 2 to 10 m below the sediment/water interface measured by Colman and others (2018) (fig. 3). In contrast, from A09 to A12 (from 10 to 14 m from shore), fresh and brackish groundwater commonly had little or no measured nitrate because of partial or complete nitrate reduction.
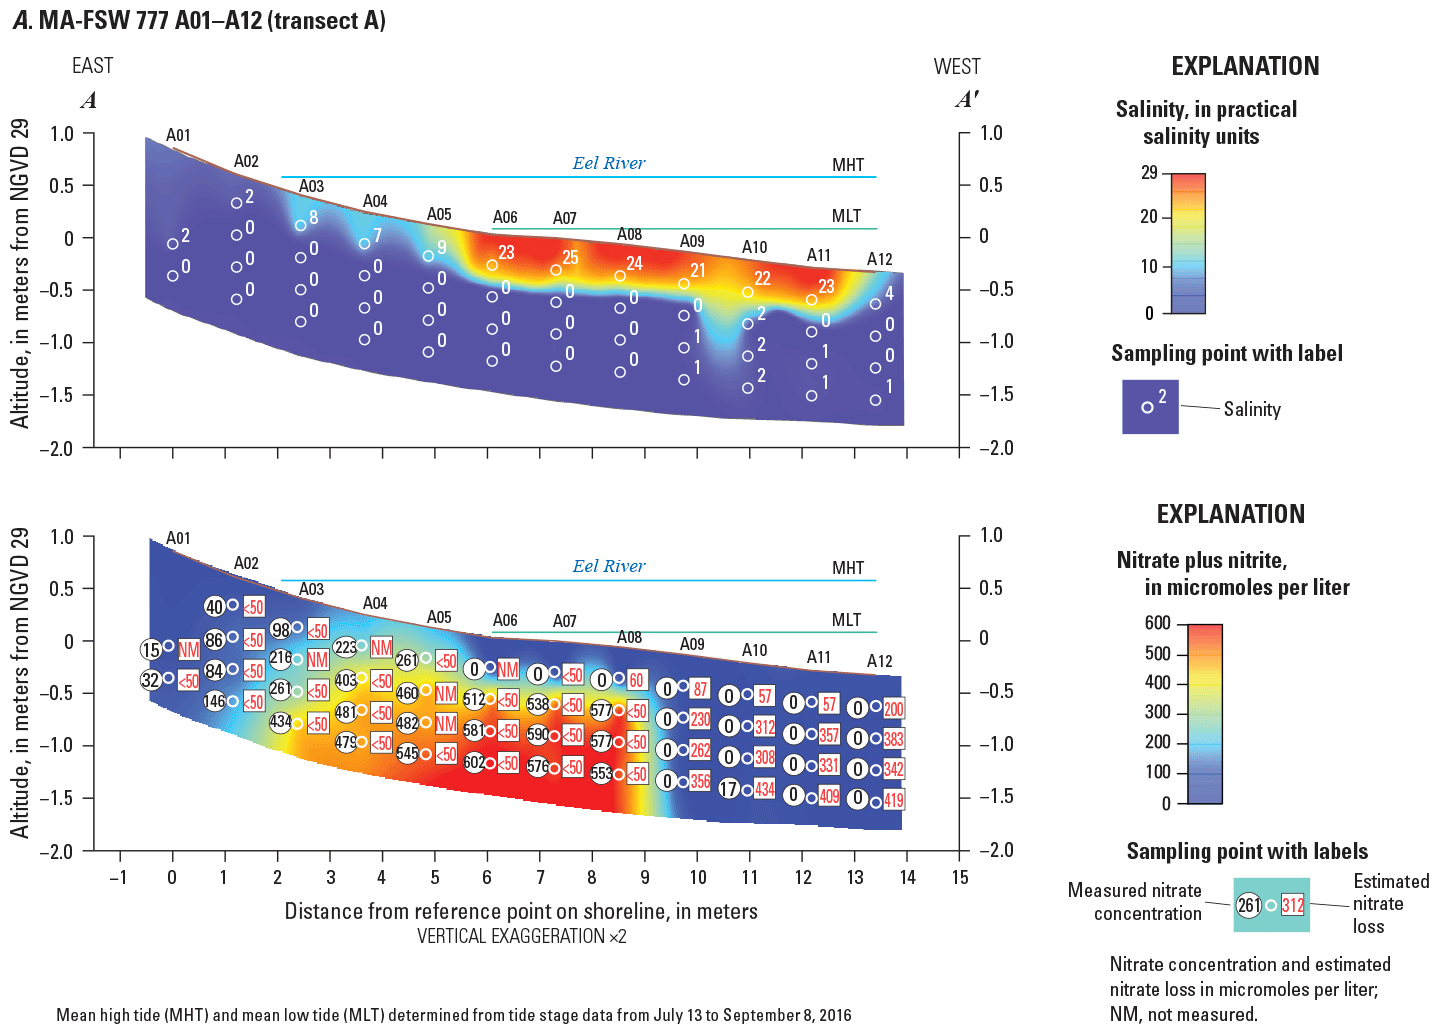
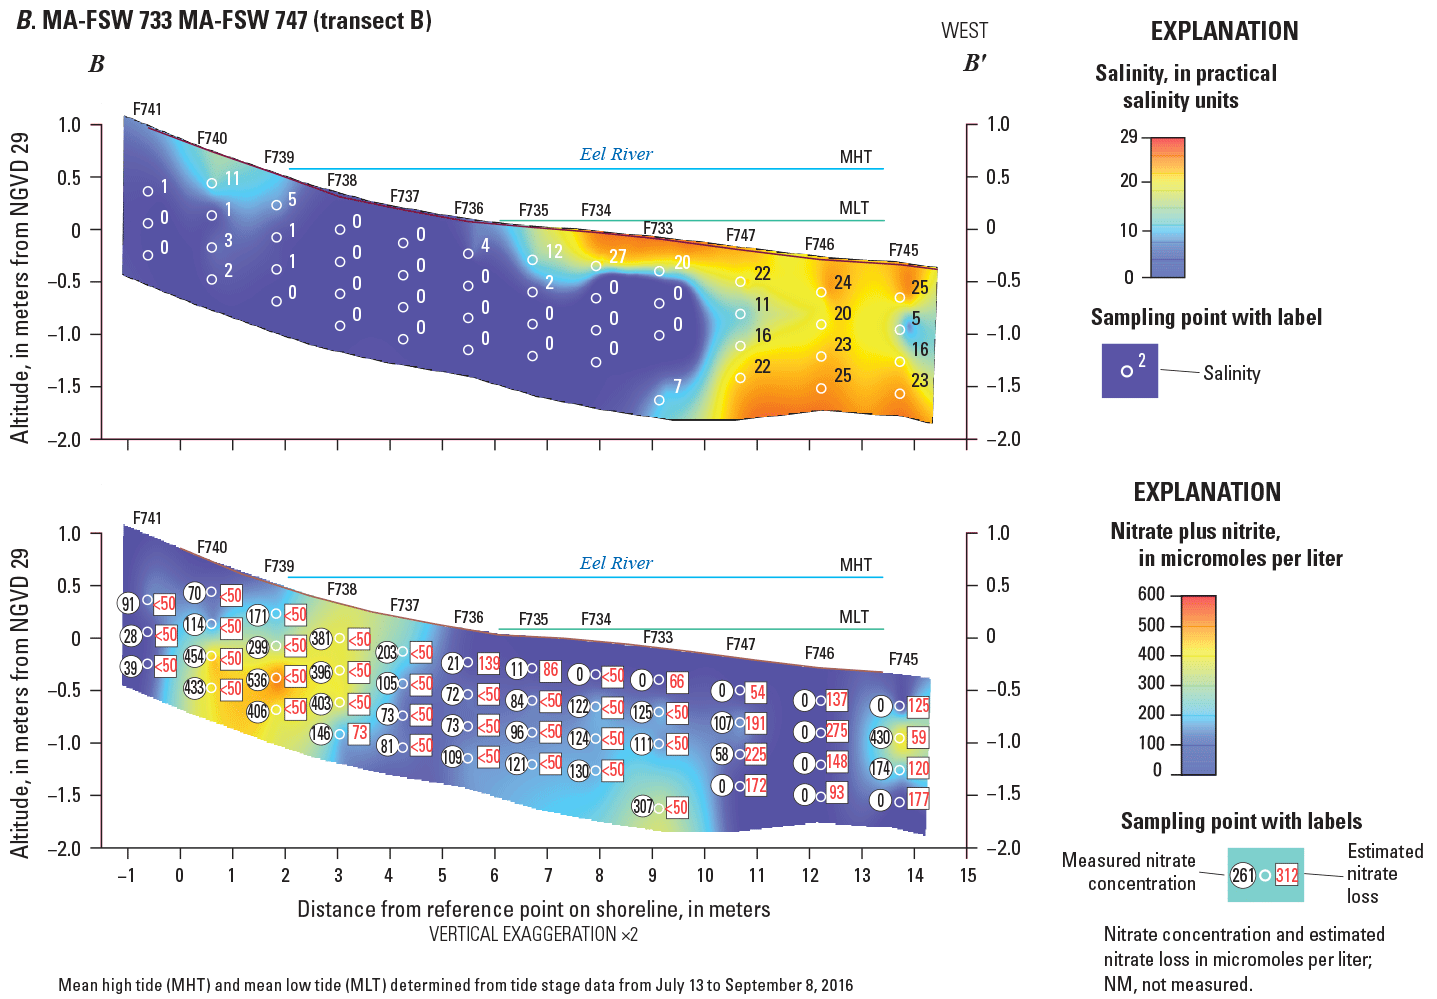
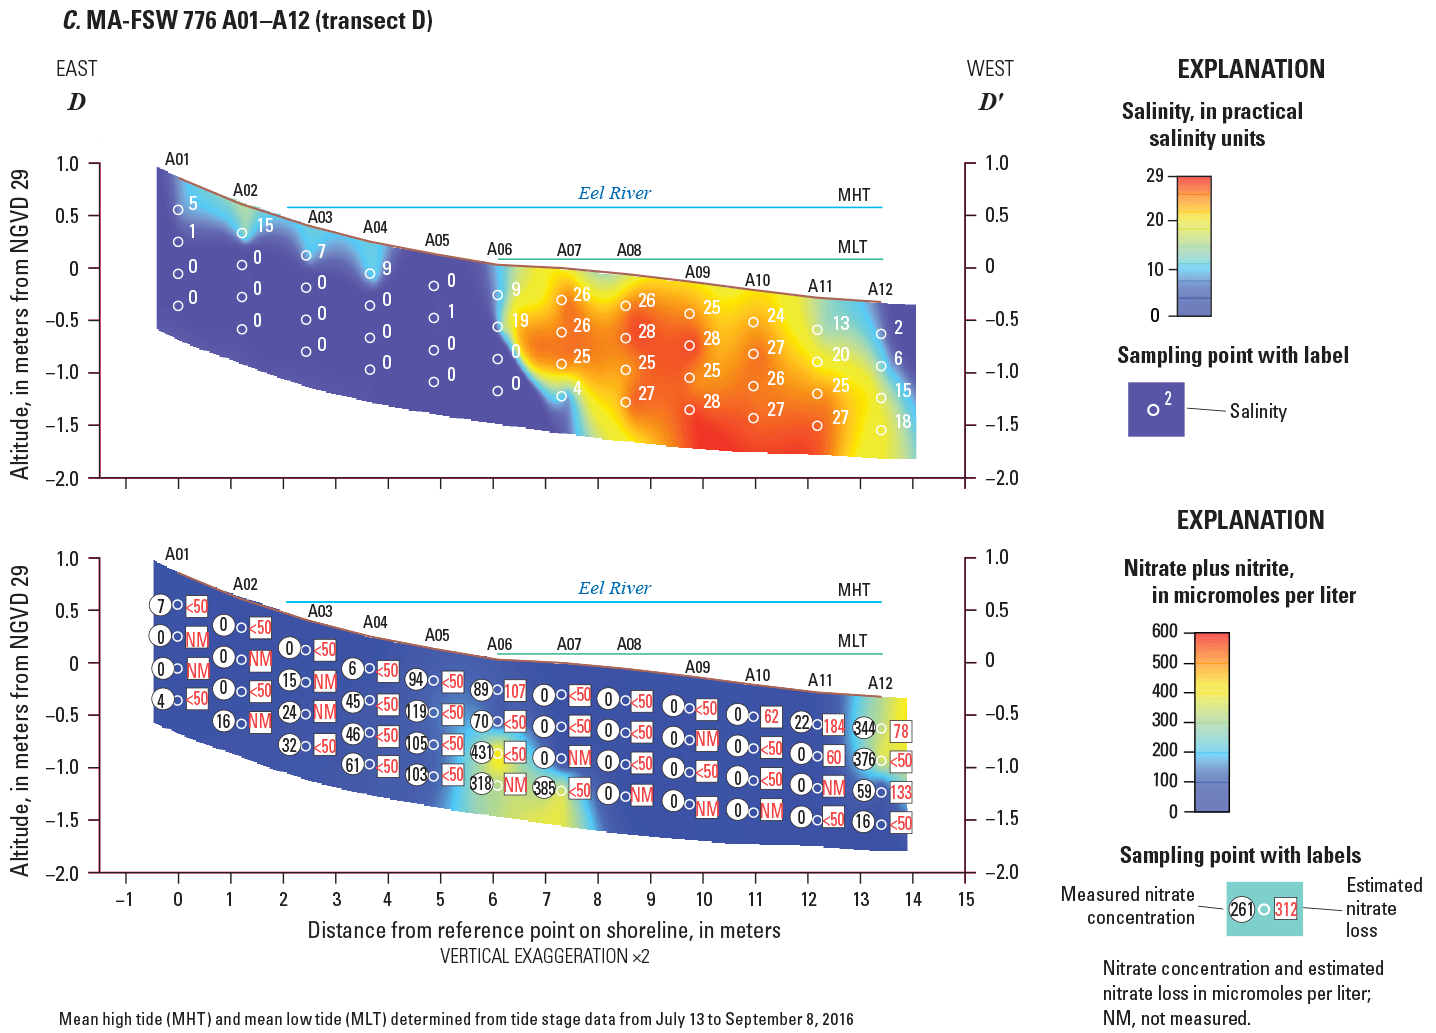
Vertical transects showing distribution of salinity and measured nitrate plus nitrite in groundwater including estimated nitrate loss at selected points, along A, northernmost transect A–A′ (MA–FSW 777, A01–A12, June 2016), B, middle transect B–B′ (MA–FSW 733—MA–FSW 747, November 2015), and C, southernmost transect D–D′ (MA–FSW 776, A01–A12, June 2016) beneath the Eel River, Seacoast Shores peninsula, East Falmouth, Massachusetts. Locations of transects are shown in figure 4.
The dissolved gas data suggest the following broad patterns regarding nitrate reduction in groundwater sampled in the present study, as detailed in the following paragraphs and as shown in figure 14. Relatively little nitrate reduction was evident in the nearshore fresh groundwater, as indicated by gas concentrations that are largely explained by solubility and by bubble dissolution during recharge (fig. 11). Colman and others (2018) reported substantial N2MIC in shallow fresh groundwater in the upland more than 30 m from the shore (fig. 3). In the highest salinity zones, there may be weak evidence for minor nitrate reduction (24±20 stdev µmol/L, assuming no excess air); this could indicate a small nitrate source in estuarine surface water or estuarine sediment porewaters, possibly associated with coupled nitrification-denitrification near the sediment/water interface. The major occurrences of nitrate reduction were in or near areas where nitrate-bearing terrestrial fresh groundwater encountered more reducing saline groundwater recharged beneath the Eel River estuary, where electron donors may have been supplied by infiltrating surface water and shallow subestuarine sediments (for example, Kroeger and Charette, 2008).
Geochemical indicators of nitrate reduction were observed principally during the June 2016 sampling of transect A–A′, November 2015 sampling of transect B–B′, and October 2016 sampling of transect C–C′. Samples with the highest concentrations of excess nitrogen were observed 9 m or more from shore. Estimated nitrate loss was greatest in the zone from 10 to 14 m offshore and depths of 61 to 122 cm in the subterranean estuary of transect A–A′ and ranged from 230 to 434 µmol/L of nitrate (fig. 14A). Estimated nitrate loss in the zone from 10 to 14 m offshore and depths of 30 to 122 cm in the subterranean estuary of transect B–B′ ranged from 54 to 275 µmol/L of nitrate (fig. 14B). Four of the 12 samples collected from these locations in transect B–B′ had detectable nitrate at concentrations ranging from 58 to 430 µmol/L (fig. 8E). We cannot rule out the possibility that some fraction of the excess nitrogen gas was derived from anammox rather than denitrification. Almost all samples collected from transect D–D′ in June 2016 had estimated nitrate loss of less than 50 µmol/L (fig. 14C). Where estimated nitrate loss was less than 50 µmol/L (generally within about 8 m of the shoreline position at mean high water), there may have been some nitrate reduction but the concentrations of N2-NMIC were within the estimated combined uncertainties of the data and assumptions.
A limited number of analyses in this study in transect C–C′ showed evidence of partial to complete nitrate removal at 178 cm below the sediment/water interface in the subtidal zone from 2.5 to 14 m offshore. The nitrate concentrations in these samples were 66, 138, and 0 µmol/L at 2.75, 8.25, and 13.75 m from shore, respectively. Colman and others (2018) measured partial nitrate removal of 71 µmol/L and nitrate concentration of 346 µmol/L in a similar location to the 178-cm depth of transect C–C′ at 152-cm depth and 9 m offshore (fig. 3).
Dissolved oxygen concentrations generally were low (less than 25 µmol/L as O2) in the regions of the highest nitrate loss (figs. 7B and 8B), which is consistent with an environment suitable for denitrification activity. Alkalinity was elevated relative to conservative mixing of fresh and saline endmembers in some areas of high nitrate loss (figs. 7D and 8D), which could be consistent with potential denitrification activity because alkalinity is a biproduct of microbial oxidation of organic matter; however, the data are incomplete and appear to be somewhat inconsistent with simple reaction stoichiometries. In relatively saline groundwater from the shallowest sampled depths in the subterranean estuary (30 cm) and from 9 to 13.5 m offshore, ammonium concentrations (figs. 7F, 8F, and 9F) were elevated in comparison to those of either fresh groundwater or overlying saline surface water, based on ammonium measurements in the Eel River reported by Colman and others (2018). Elevated ammonium concentrations in saline groundwater likely were generated by anaerobic biodegradation of sedimentary organic matter. However, some mixed-salinity samples with detectable N2MIC appeared to be relatively depleted in ammonium when compared with conservative mixtures of fresh and saline groundwater endmembers, possibly indicating ammonium loss (for example, anammox) or sediment-water exchange processes. DOC concentrations were relatively low in fresh groundwaters that had high initial nitrate concentrations, including some that were denitrified and some that were not denitrified. This could be viewed as evidence for the importance of electron donors from solid phases, rather than aqueous species, as controls of localized nitrate reduction (as in the subtidal area of transect A–A′ (figs. 7H and 14A).
Hydraulic gradients and vertical profiles of SpC indicate that fresh groundwater originating from recharge under the peninsula migrates towards the estuary as depicted in the conceptual dashed yellow lines in figure 3. Figure 3 is modified from the earlier study (Colman and others, 2018) to illustrate our current understanding of groundwater flow in this subterranean estuary and how that compares to the earlier conceptual model shown in figure 2. In two of the three transects in the current study (A–A′ and B–B′), nitrate concentrations in the near-shore intertidal zone generally were relatively low initially and may have been partially diluted by mixing with saltwater; this nitrate was minimally or not denitrified and some of it may have been discharging to the estuary. In the third transect (D–D′), nitrate concentrations were substantially lower. The nitrate in the intertidal zones of these transects was minimally or not denitrified and some of it may have been discharging to the estuary. Slightly farther offshore in a narrow region from 5 to 6 m from shore, generally there was little evidence of mixing with infiltrating saltwater and low nitrate concentrations and minimal evidence of denitrification; small amounts of nitrate may have been discharging to the estuary in this zone. Farther from shore in the subtidal area from about 7 to 12.5 m offshore, salty porewater overlays the freshwater plume, indicating no freshwater discharge directly to the estuary and possible horizontal offshore movement of groundwater. Groundwater in this freshwater zone was depleted in nitrate and this is consistent with evidence for nearly complete nitrate reduction. Farther offshore, Colman and others (2018) reported fresh groundwater with relatively high nitrate concentrations from about 1.5 to 11 m below the sediment/water interface, but data were not available at shallower depths to indicate whether mixing, reaction, or discharge might have occurred there (fig. 3). Thus, there appears to be a large body of fresh groundwater containing substantial nitrate underlying the estuary farther offshore than our measurements, but there are insufficient data to determine where or how it discharges.
Summary
This study was conducted to follow up on a previous study (Colman and others, 2018, https://doi.org/10.3133/sir20185095) that investigated the fate and transformations of nitrogen in the groundwater below the Seacoast Shores peninsula. The previous study found evidence of nitrate reduction near the water table in fresh groundwater onshore and near the freshwater/saltwater transition zone beneath a 7–8 meter (m)-thick freshwater zone in the subterranean aquifer. That study documented variable concentrations of nitrate in fresh and brackish shallow groundwater beneath intertidal and subtidal portions of the estuary but did not assess the distribution of nitrate reduction in those areas. The current study focused on evidence for the distribution of nitrate reduction in shallow groundwater from 0 to 1.5 m beneath the intertidal and subtidal portions of the estuary.
The distributions of fresh and saline groundwater in the subtidal area of the subterranean estuary under the Eel River are consistent with shallow intertidal and subtidal saltwater cells where infiltrating saline and underlying freshwater mix. However, these distributions do not conform to the simplified conceptual model of groundwater flow in the subterranean estuary at Waquoit Bay, East Falmouth, Massachusetts, where a deep saltwater wedge discharges to the estuary. At the location of this study in the Eel River subterranean estuary, to a distance offshore of at least 18 m, lateral subsurface fresh groundwater flow apparently prevented a deep saltwater wedge from discharging to the surface near the shoreline (Colman and others, 2018). Studies elsewhere have documented similar offshore flow of fresh groundwater lenses beneath estuaries, in some cases extending hundreds of meters offshore (for example, Bratton and others, 2004, 2009; Russoniello and others, 2013). The distribution of salinity determined in this study, and in Colman and others (2018), although variable over time, indicates a nearshore intertidal cell and a subtidal saltwater cell where rising fresh groundwater mixes with infiltrating saline water, and an intermediate zone in the intertidal area closer to mean low water where freshwater discharges without mixing with saline water. Specific conductance data were collected to about 18 m offshore in the Colman and others (2018) study and to about 13.5 m in this study, and both studies seem to indicate fresh groundwater discharges into the estuary farther offshore beyond the shallow subtidal saltwater cell.
Hydraulic-head gradients measured 2 to 5 m below the sediment/water interface in October 2016 indicated that fresh groundwater flow generally was upwards (towards the estuary) under all tide conditions, providing a mechanism for transport of nitrate from deeper nitrate-rich groundwater (that was documented in Colman and others, 2018) into the shallower subestuarine sediments where fresh and saline porewaters mixed.
Nitrate-bearing fresh and brackish groundwater in some of the shallowest samples (less than 61 centimeters below the sediment/water interface) might indicate direct discharge of groundwater nitrate to the estuary in portions of the intertidal and subtidal zones. In other areas, fresh and brackish groundwater was overlain by nitrate-free saline water, indicating little or no direct local nitrate discharge. Variability of nitrate concentrations in shallow intertidal and subtidal groundwater was related to a combination of (1) variable original nitrate concentrations in fresh groundwater recharge, (2) dilution by mixing with nitrate-free saline water recharged beneath the estuary, and (3) nitrate reduction along groundwater flow paths.
The primary geochemical indicator of nitrate reduction (excess nitrogen gas) indicated only minimal attenuation of nitrate by microbial denitrification or anammox in the intertidal zone. Other nitrate reduction processes such as dissimilatory nitrate reduction to ammonium and assimilation were not evaluated quantitatively, in part because they involve interactions with solid phases that were not sampled. There was no aqueous evidence for substantial ammonium production in mixed-salinity samples, and the distributions of initial nitrate, nitrate remaining, and concentration of microbially produced nitrogen gas, as N2 (N2MIC) could reasonably be explained as a result of mixing and local denitrification (± anaerobic ammonium oxidation [anammox]) of freshwater sources of nitrate. In the subtidal zone, data were consistent with complete removal of nitrate by denitrification in fresh groundwater in one of the transects measured in June 2016. Anammox was not measured directly and it cannot be ruled out as a potential microbial source for some of the excess nitrogen gas. Excess nitrogen gas, determined from analysis of dissolved gases (nitrogen gas and argon gas), indicated that microbial conversion of nitrate to nitrogen gas was likely occurring in the intertidal zone and especially in the subtidal zones. The estimated amounts of nitrate loss were less than 50 to 139 micromoles per liter (µmol/L) in the intertidal zone and less than 50 to 434 µmol/L in the subtidal zone. Estimated amounts of nitrate reduction were highest in subtidal area greater than 10 m from the shore in one of two of the transects sampled in June 2016 (A–A′), in one transect sampled in November of 2015 (B–B′), and in another sampled in October 2016 (C–C′). In the highest salinity zones, there may be weak evidence for minor nitrate reduction (24 ± 20 standard deviation µmol/L, assuming no excess air). Although these values are considered to be within the uncertainties of the calculations, they could potentially indicate a minor nitrate source in estuarine surface water or estuarine sediment porewaters, possibly associated with coupled nitrification-denitrification near the sediment/water interface.
The primary zone where evidence for nitrate reduction was detected was in subtidal fresh groundwater that was overlain by a thin layer of saline and mixed groundwater. The fact that geochemical evidence for nitrate reduction was less pronounced in other areas of the subterranean estuary that were suboxic but rich in nitrate may indicate more reactive sources of electron donors in shallow subtidal sediments than in shallow intertidal sediments. Fresh groundwater with high initial nitrate concentrations had relatively low dissolved organic carbon (DOC) concentrations in areas with and without N2MIC, indicating that wastewater DOC may have been depleted by microbial reactions before reaching the shallow subterranean estuary. The concentration and chemical nature of DOC also are important variables that can limit nitrate reduction if the concentration is too low or if the carbon is resistant to decomposition (Devito and others, 2000; Rivett and others, 2008).
The transport of nutrient-rich groundwater through a hydrogeologically complex subterranean estuary can be influenced by variable transmissivity due to the occurrence of heterogeneous confining layers that can restrict flow (Mulligan and others, 2007; Bokuniewicz and others, 2008; Michael and others, 2011; Russoniello and others, 2013), tidal and current dynamics (De Simoni and others, 2005; Rezaei and others, 2005) that affect mixing between fresh groundwater discharge and saltwater infiltration, and the biogeochemical processes that can attenuate nutrient transport. Previous geologic borings on the Seacoast Shores peninsula encountered fine sands and silts directly upgradient of the study area (Colman and others, 2018). Natural heterogeneities of the subsurface lithology combined with tidal and hydrologic effects, therefore, make it difficult to rely on a single conceptual model that describes groundwater flow in these complex subterranean estuaries in Cape Cod embayments.
Further study could better quantify the seasonal, spatial, and tidal variation in excess nitrogen gas in the subterranean estuary adjacent to the Seacoast Shores peninsula, because large variations were observed in this and the previous study. Densely spaced vertical and longitudinal water-level measurements and sampling of groundwater along potential or suspected flow paths from septic sources to the nearshore subterranean estuary could be used to follow nitrate along these logical flow paths to better discern where transformations may occur. This information could be supplemented with isotopic and conservative tracers to confirm suspected flow paths and timing of transport. Further studies using molecular techniques (environmental DNA) or isotopic enrichment experiments could also be employed to determine the relative importance of denitrification, anammox, DNRA, or other nitrate attenuation processes. The ultimate fate of deep fresh groundwater and associated nitrate prior to discharge might be determined by extending such studies farther offshore and possibly all the way across the Eel River.
References Cited
Abarca, E., Karam, H., Hemond, H.F., and Harvey, C.F., 2013, Transient groundwater dynamics in a coastal aquifer—The effects of tides, the lunar cycle, and the beach profile: Water Resources Research, v. 49, no. 5, p. 2473–2488, accessed August 7, 2017, at https://doi.org/10.1002/wrcr.20075.
Abrams, R.H., Loague, K., and Kent, D.B., 1998, Development and testing of a compartmentalized reaction network model for redox zones in contaminated aquifers: Water Resources Research, v. 34, no. 6, p. 1531–1541, accessed February 20, 2018, at https://doi.org/10.1029/98WR00485.
Böhlke, J.K., and Krantz, D.E., 2003, Isotope geochemistry and chronology of offshore ground water beneath Indian River Bay, Delaware: U.S. Geological Survey Water-Resources Investigations Report 03–4192, 37 p., accessed February 22, 2017, at https://doi.org/10.3133/wri034192.
Böhlke, J.K., Verstraeten, I.M., and Kraemer, T.F., 2007, Effects of surface-water irrigation on the sources, fluxes, and residence times of water, nitrate, and uranium in an alluvial aquifer: Applied Geochemistry, v. 22, p. 152–174, accessed March 12, 2021, at https://doi.org/10.1016/j.apgeochem.2006.08.019.
Böhlke, J.K., Wanty, R., Tuttle, M., Delin, G., and Landon, M., 2002, Denitrification in the recharge area and discharge area of a transient agricultural nitrate plume in a glacial outwash sand aquifer, Minnesota: Water Resources Research, v. 38, no. 7, p. 10–11 to 10–26, accessed March 12, 2021, at https://doi.org/10.1029/2001WR000663.
Bokuniewicz, H., Taniguchi, M., Ishitoibi, T., Charette, M., Allen, M., and Kontar, E.A., 2008, Direct measurements of submarine groundwater discharge (SGD) over a fractured rock aquifer in Flamengo Bay Brazil: Estuarine, Coastal and Shelf Science, v. 76, no. 3, p. 466–472, accessed February 22, 2018, at https://doi.org/10.1016/j.ecss.2007.07.047.
Bratton, J.F., Böhlke, J.K., Krantz, D.E., and Tobias, C.R., 2009, Flow and geochemistry of groundwater beneath a back-barrier lagoon—The subterranean estuary at Chincoteague Bay, Maryland, USA: Marine Chemistry, v. 113, nos. 1–2, p. 78–92, accessed February 22, 2017, at https://doi.org/10.1016/j.marchem.2009.01.004.
Bratton, J.F., Böhlke, J.K., Manheim, F.T., and Krantz, D.E., 2004, Ground water beneath coastal bays of the Delmarva Peninsula—Ages and nutrients: Ground Water, v. 42, no. 7, p. 1021–1034, accessed February 22, 2017, at https://doi.org/10.1111/j.1745-6584.2004.tb02641.x.
Bulseco, A.N., Giblin, A.E., Tucker, J., Murphy, A.E., Sanderman, J., Hiller-Bittrolff, K., and Bowen, J.L., 2019, Nitrate addition stimulates microbial decomposition of organic matter in salt marsh sediments: Global Change Biology, v. 25, no. 10, p. 3224–3241, accessed January 8, 2020, at https://doi.org/10.1111/gcb.14726.
Cai, W.-J., Hu, X., Huang, W.-J., Murrell, M.C., Lehrter, J.C., Lohrenz, S.E., Chou, W.-C., Zhai, W., Hollibaugh, J.T., Wang, Y., Zhao, P., Guo, X., Gundersen, K., Dai, M., and Gong, G.-C., 2011, Acidification of subsurface coastal waters enhanced by eutrophication: Nature Geoscience, v. 4, p. 766–770, accessed January 22, 2017, at https://doi.org/10.1038/ngeo1297.
Cape Cod Chamber of Commerce, 2013, Economic development: Cape Cod Chamber of Commerce web page, accessed May 2015 at http://www.ecapechamber.com/cape-cod-chamber-economic-development.asp.
Cape Cod Commission, 2015, WatershedMVP—Multivariant planner: Cape Cod Commission interactive map application, accessed October 15, 2015, at http://www.watershedmvp.org/.
Charette, M.A., and Sholkovitz, E.R., 2002, Oxidative precipitation of groundwater-derived ferrous iron in the subterranean estuary of a coastal bay: Geophysical Research Letters, v. 29, no. 10, p. 85–1 to 85–4, accessed January 24, 2022, at https://doi.org/10.1029/2001GL014512.
Chemetrics, Inc., 2015, Operator’s Manual V–2000 Photometer (December 2015, rev. 23): Chemetrics Water Analysis Systems user’s manual, accessed February 21, 2017, at https://www.chemetrics.com/image/data/pdf/v2000manual.pdf.
Christensen, T.H., Kjeldsen, P., Albrechtsen, H.J., Heron, G., Nielsen, P.H., Bjerg, P.L., and Holm, P.E., 1994, Attenuation of landfill leachate pollutants in aquifers: Critical Reviews in Environmental Science and Technology, v. 24, no. 2, p. 119–202, accessed March 2017 at https://doi.org/10.1080/10643389409388463.
Cloern, J.E., Abreu, P.C., Carstensen, J., Chauvaud, L., Elmgren, R., Grall, J., Greening, H., Johansson, J.O.R., Kahru, M., Sherwood, E.T., Xu, J., and Yin, K., 2016, Human activities and climate variability drive fast-paced change across the world’s estuarine-coastal ecosystems: Global Change Biology, v. 22, no. 2, p. 513–529, accessed March 2017 at https://doi.org/10.1111/gcb.13059.
Colman, J.A., Carlson, C.S., and Robinson, C., 2015, Simulation of nitrogen attenuation in a subterranean estuary, representative of southern coast of Cape Cod, Massachusetts: U.S. Geological Survey Open-File Report 2015–1085, 30 p., accessed March 2017 at https://doi.org/10.3133/ofr20151085.
Colman, J.A., LeBlanc, D.R., Böhlke, J.K., McCobb, T.D., Kroeger, K.D., Belaval, M., Cambareri, T.C., Pirolli, G.F., Brooks, T.W., Garren, M.E., Stover, T.B., and Keeley, A., 2018, Geochemical conditions and nitrogen transport in nearshore groundwater and the subterranean estuary at a Cape Cod embayment, East Falmouth, Massachusetts, 2013–14: U.S. Geological Survey Scientific Investigations Report 2018–5095, 69 p., accessed September 26, 2018, at https://doi.org/10.3133/sir20185095.
Costa, J.E., Heufelder, G., Foss, S., Millham, N.P., and Howes, B., 2002, Nitrogen removal efficiencies of three alternative septic technologies and a conventional septic system: Environment Cape Cod, v. 5, no. 1, p. 15–24, accessed July 29, 2024, at https://buzzardsbay.org/etistuff/results/costaenvccarticle2.pdf.
DeSimone, L.A., and Howes, B.L., 1995, Hydrogeologic, water-quality, and biogeochemical data collected at a septage-treatment facility, Orleans, Cape Cod, Massachusetts, October 1988 through December 1992: U.S. Geological Survey Open-File Report 95–439, 73 p., accessed March 2017 at https://doi.org/10.3133/ofr95439.
De Simoni, M., Carrera, J., Sánchez-Vila, X., and Guadagnini, A., 2005, A procedure for the solution of multicomponent reactive transport problems: Water Resources Research, v. 41, no. 11, 16 p., accessed February 23, 2018, at https://doi.org/10.1029/2005WR004056.
Devito, K.J., Fitzgerald, D., Hill, A.R., and Aravena, R., 2000, Nitrate dynamics in relation to lithology and hydrologic flow path in a river riparian zone: Journal of Environmental Quality, v. 29, no. 4, p. 1075–1084, accessed December 26, 2019, at https://doi.org/10.2134/jeq2000.00472425002900040007x.
Di Capua, F., Pirozzi, F., Lens, P.N.L., and Esposito, G., 2019, Electron donors for autotrophic denitrification: Chemical Engineering Journal, v. 362, p. 922–937, accessed December 27, 2019, at https://doi.org/10.1016/j.cej.2019.01.069.
Dong, L.F., Sobey, M.N., Smith, C.J., Rusmana, I., Phillips, W., Stott, A., Osborn, A.M., and Nedwell, D.B., 2011, Dissimilatory reduction of nitrate to ammonium, not denitrification or anammox, dominates benthic nitrate reduction in tropical estuaries: Limnology and Oceanography, v. 56, no. 1, p. 279–291, accessed July 13, 2018, at https://doi.org/10.4319/lo.2011.56.1.0279.
Eichner, E.M., and Cambareri, T.C., 1992, Nitrogen loading—Technical Bulletin 91–001 (Final): Cape Cod Commission, Water Resources Office, April 1992, 21 p., accessed December 27, 2019, at https://www.capecodcommission.org/resource-library/file/?url=/dept/commission/team/Website_Resources/regulatory/NitrogenLoadTechbulletin.pdf.
Ekstrom, J.A., Suatoni, L., Cooley, S.R., Pendleton, L.H., Waldbusser, G.G., Cinner, J.E., Ritter, J., Langdon, C., van Hooidonk, R., Gledhill, D., Wellman, K., Beck, M.W., Brander, L.M., Rittschof, D., Doherty, C., Edwards, P.E.T., and Portela, R., 2015, Vulnerability and adaptation of US shellfisheries to ocean acidification: Nature Climate Change, v. 5, p. 207–214, accessed December 31, 2019, at https://doi.org/10.1038/nclimate2508.
Fairchild, G.M., Lane, J.W., Jr., Voytek, E.B., and LeBlanc, D.R., 2013, Bedrock topography of western Cape Cod, Massachusetts, based on bedrock altitudes from geologic borings and analysis of ambient seismic noise by the horizontal-to-vertical spectral-ratio method: U.S. Geological Survey Scientific Investigations Map 3233, 1 sheet, maps variously scaled, 17-p. pamphlet, accessed February 22, 2017, at https://doi.org/10.3133/sim3233.
Fishman, M.J., and Friedman, L.C., eds., 1989, Methods for determination of inorganic substances in water and fluvial sediments (3d ed.): U.S. Geological Survey Techniques of Water-Resources Investigations, book 5, chap. A1, 545 p., accessed February 14, 2018, at https://doi.org/10.3133/twri05A1.
Giblin, A.E., Tobias, C.R., Song, B., Weston, N., Banta, G.T., and Rivera-Monroy, V.H., 2013, The importance of dissimilatory nitrate reduction to ammonium (DNRA) in the nitrogen cycle of coastal ecosystems: Oceanography (Washington, D.C.), v. 26, no. 3, p. 124–131, accessed July 13, 2018, at https://doi.org/10.5670/oceanog.2013.54.
Giblin, A.E., Weston, N.B., Banta, G.T., Tucker, J., and Hopkinson, C.S., 2010, The effects of salinity on nitrogen losses from an oligohaline estuarine sediment: Estuaries and Coasts, v. 33, p. 1054–1068, accessed July 13, 2018, at https://doi.org/10.1007/s12237-010-9280-7.
Gledhill, D.K., White, M.M., Salisbury, J., Thomas, H., Mlsna, I., Liebman, M., Mook, B., Grear, J., Candelmo, A.C., Chambers, R.C., Gobler, C.J., Hunt, C.W., King, A.L., Price, N.N., Signorini, S.R., Stancioff, E., Stymiest, C., Wahle, R.A., Waller, J.D., Rebuck, N.D., Wang, Z.A., Capson, T.L., Morrison, J.R., Cooley, S.R., and Doney, S.C., 2015, Ocean and coastal acidification off New England and Nova Scotia, Oceanography (Washington, D.C.), v. 28, no. 2, p. 182–197, accessed October 20, 2016, at https://doi.org/10.5670/oceanog.2015.41.
Griggs, E.M., Kump, L.R., and Böhlke, J.K., 2003, The fate of wastewater-derived nitrate in the subsurface of the Florida Keys—Key Colony Beach, Florida: Estuarine, Coastal and Shelf Science, v. 58, no. 3, p. 517–539, accessed May 16, 2023, at https://doi.org/10.1016/S0272-7714(03)00131-8.
Hare, J.A., Morrison, W.E., Nelson, M.W., Stachura, M.M., Teeters, E.J., Griffis, R.B., Alexander, M.A., Scott, J.D., Alade, L., Bell, R.J., Chute, A.S., Curti, K.L., Curtis, T.H., Kircheis, D., Kocik, J.F., Lucey, S.M., McCandless, C.T., Milke, L.M., Richardson, D.E., Robillard, E., Walsh, H.J., McManus, M.C., Marancik, K.E., and Griswold, C.A., 2016, A vulnerability assessment of fish and invertebrates to climate change on the northeast U.S. Continental Shelf: PLoS One, v. 11, no. 2, 30 p., accessed January 8, 2020, at https://doi.org/10.1371/journal.pone.0146756.
Hinkle, S.R., Böhlke, J.K., Duff, J.H., Morgan, D.S., and Weick, R.J., 2007, Aquifer-scale controls on the distribution of nitrate and ammonium in ground water near La Pine, Oregon, USA: Journal of Hydrology, v. 333, nos. 2–4, p. 486–503, accessed April 11, 2022, at https://doi.org/10.1016/j.jhydrol.2006.09.013.
Howarth, R.W., 1988, Nutrient limitation of net primary production in marine ecosystems: Annual Review of Ecology and Systematics, v. 19, no. 1, p. 89–110, accessed February 22, 2017, at http://www.jstor.org/stable/2097149.
Howarth, R.W., Sharpley, A., and Walker, D., 2002, Sources of nutrient pollution to coastal waters in the United States—Implications for achieving coastal water quality goals: Estuaries, v. 25, p. 656–676, accessed March 14, 2017, at https://doi.org/10.1007/BF02804898.
Hull, R.B., Johnson, C.D., Stone, B.D., LeBlanc, D.R., McCobb, T.D., Phillips, S.N., Pappas, K.L., and Lane, J.W., Jr., 2019, Lithostratigraphic, geophysical, and hydrogeologic observations from a boring drilled to bedrock in glacial sediments near Nantucket sound in East Falmouth, Massachusetts: U.S. Geological Survey Scientific Investigations Report 2019–5042, 27 p., accessed March 26, 2020, at https://doi.org/10.3133/sir20195042.
Huntington, T.G., Colman, J.A., McCobb, T.D., Kroeger, K.D., Bohlke, J.K., Brooks, T.W., and Syzmczycha, B., 2024, Geochemical data supporting analysis of fate and transport of nitrogen in the nearshore groundwater and subterranean estuary near East Falmouth, Massachusetts, 2015–2016: U.S. Geological Survey data release, https://doi.org/10.5066/P13LGNTT.
Kana, T.M., Darkangelo, C., Hunt, M.D., Oldham, J.B., Bennett, G.E., and Cornwell, J.C., 1994, Membrane inlet mass spectrometer for rapid high-precision determination of N2, O2, and Ar in environmental water samples: Analytical Chemistry, v. 66, no. 23, p. 4166–4170, accessed December 31, 2019, at https://doi.org/10.1021/ac00095a009.
Knowles, R., 1982, Denitrification: Microbiological Reviews, v. 46, no. 1, p. 43–70, accessed July 20, 2018, at https://doi.org/10.1128/mr.46.1.43-70.1982.
Korom, S.F., 1992, Natural denitrification in the saturated zone—A review: Water Resources Research, v. 28, no. 6, p. 1657–1668, accessed July 20, 2018, at https://doi.org/10.1029/92WR00252.
Kroeger, K.D., and Charette, M.A., 2008, Nitrogen biogeochemistry of submarine groundwater discharge: Limnology and Oceanography, v. 53, no. 3, p. 1025–1039, accessed July 9, 2018, at https://doi.org/10.2307/40058216.
Lam, P., and Kuypers, M.M.M., 2011, Microbial nitrogen cycling processes in oxygen minimum zones: Annual Review of Marine Science, v. 3, no. 1, p. 317–345, accessed December 20, 2019, at https://doi.org/10.1146/annurev-marine-120709-142814.
Lane, J.W., Jr., Briggs, M.A., Maurya, P.K., White, E.A., Pedersen, J.B., Auken, E., Terry, N., Minsley, B., Kress, W., LeBlanc, D.R., Adams, R., and Johnson, C.D., 2020, Characterizing the diverse hydrogeology underlying rivers and estuaries using new floating transient electromagnetic methodology: Science of the Total Environment, v. 740, article 140074, accessed October 20, 2020, at https://doi.org/10.1016/j.scitotenv.2020.140074.
LeBlanc, D.R., Guswa, J.H., Frimpter, M.H., and Londquist, C.J., 1986, Ground-water resources of Cape Cod, Massachusetts: U.S. Geological Survey Hydrologic Atlas 692, 4 sheets, scale 1:48,000. [Also available at https://doi.org/10.3133/ha692.]
Liu, Q., Charette, M.A., Breier, C.F., Henderson, P.B., McCorkle, D.C., Martin, W., and Dai, M., 2017, Carbonate system biogeochemistry in a subterranean estuary—Waquoit Bay, USA: Geochimica et Cosmochimica Acta, v. 203, p. 422–439, accessed July 20, 2018, at https://doi.org/10.1016/j.gca.2017.01.041.
Marchant, H.K., Ahmerkamp, S., Lavik, G., Tegetmeyer, H.E., Graf, J., Klatt, J.M., Holtappels, M., Walpersdorf, E., and Kuypers, M.M.M., 2017, Denitrifying community in coastal sediments performs aerobic and anaerobic respiration simultaneously: The ISME Journal, v. 11, no. 8, p. 1799–1812, accessed December 20, 2019, at https://doi.org/10.1038/ismej.2017.51.
Massachusetts Department of Environmental Protection, 2018, The Massachusetts Estuaries Project and Reports: Massachusetts Department of Environmental Protection web page, accessed December 26, 2019, at https://www.mass.gov/guides/the-massachusetts-estuaries-project-and-reports.
Masterson, J.P., Stone, B.D., Walter, D.A., and Savoie, J., 1997, Hydrogeologic framework of western Cape Cod, Massachusetts: U.S. Geological Survey Hydrologic Investigations Atlas HA–741. [Also available at https://doi.org/10.3133/ha741.]
Meister, P., Herda, G., Petrishcheva, E., Gier, S., Dickens, G.R., Bauer, C., and Liu, B., 2022, Microbial alkalinity production and silicate alteration in methane charged marine sediments—Implications for porewater chemistry and diagenetic carbonate formation: Frontiers in Earth Science, v. 9, 18 p., accessed October 24, 2023, at https://doi.org/10.3389/feart.2021.756591.
Michael, H.A., Charette, M.A., and Harvey, C.F., 2011, Patterns and variability of groundwater flow and radium activity at the coast—A case study from Waquoit Bay, Massachusetts: Marine Chemistry, v. 127, nos. 1–4, p. 100–114, accessed February 23, 2018, at https://doi.org/10.1016/j.marchem.2011.08.001.
Michael, H.A., Lubetsky, J.S., and Harvey, C.F., 2003, Characterizing submarine groundwater discharge—A seepage meter study in Waquoit Bay, Massachusetts: Geophysical Research Letters, v. 30, no. 6, p. 30–1 to 30–4, accessed March 2017 at https://doi.org/10.1029/2002GL016000.
Michael, H.A., Mulligan, A.E., and Harvey, C.F., 2005, Seasonal oscillations in water exchange between aquifers and the coastal ocean: Nature, v. 436, p. 1145–1148, accessed March 14, 2017, at https://doi.org/10.1038/nature03935.
Moore, W.S., 1999, The subterranean estuary—A reaction zone of ground water and sea water: Marine Chemistry, v. 65, nos. 1–2, p. 111–125, accessed April 11, 2022, at https://doi.org/10.1016/S0304-4203(99)00014-6.
Mulligan, A.E., Evans, R.L., and Lizarralde, D., 2007, The role of paleochannels in groundwater/seawater exchange: Journal of Hydrology, v. 335, nos. 3–4, p. 313–329, accessed March 2017 at https://doi.org/10.1016/j.jhydrol.2006.11.025.
Nelson, W.G., 2017, Development of an epiphyte indicator of nutrient enrichment—Threshold values for seagrass epiphyte load: Ecological Indicators, v. 74, p. 343–356, accessed March 2017 at https://doi.org/10.1016/j.ecolind.2016.11.035.
Newell, S.E., McCarthy, M.J., Gardner, W.S., and Fulweiler, R.W., 2016, Sediment nitrogen fixation—A call for re-evaluating coastal N budgets: Estuaries and Coasts, v. 39, no. 6, p. 1626–1638, accessed December 20, 2020, at https://doi.org/10.1007/s12237-016-0116-y.
Nixon, S.W., 1995, Coastal marine eutrophication—A definition, social causes, and future concerns: Ophelia, v. 41, no. 1, p. 199–219, accessed February 22, 2017, at https://doi.org/10.1080/00785236.1995.10422044.
O’Dell, J.W., ed., 1993, Method 350.1, Revision 2.0—Determination of ammonia nitrogen by semi-automated colorimetry: U.S. Environmental Protection Agency report, 16 p., accessed February 21, 2017, at https://www.epa.gov/sites/default/files/2015-08/documents/method_350-1_1993.pdf.
Paerl, H.W., 1997, Coastal eutrophication and harmful algal blooms—Importance of atmospheric deposition and groundwater as “new” nitrogen and other nutrient sources: Limnology and Oceanography, v. 42, no. 5, part 2, p. 1154–1165, accessed March 2017 at https://doi.org/10.4319/lo.1997.42.5_part_2.1154.
Paerl, H.W., Hall, N.S., Peierls, B.L., and Rossignol, K.L., 2014, Evolving paradigms and challenges in estuarine and coastal eutrophication dynamics in a culturally and climatically stressed world: Estuaries and Coasts, v. 37, no. 2, p. 243–258, accessed March 2017 at https://doi.org/10.1007/s12237-014-9773-x.
Potter, B.B., and Wimsatt, J.C., 2005, Method 415.3—Determination of total organic carbon and specific UV absorbance at 254 nm in source water and drinking water—revision 1.1: U.S. Environmental Protection Agency, Office of Research and Development, report EPA–/600/R-05/055, 56 p., accessed July 15, 2024, at https://cfpub.epa.gov/si/si_public_record_report.cfm?Lab=NERL&dirEntryId=103917.
Rasmussen, J.R., Pedersen, M.F., Olesen, B., Nielsen, S.L., and Pedersen, T.M., 2013, Temporal and spatial dynamics of ephemeral drift-algae in eelgrass, Zostera marina, beds: Estuarine, Coastal and Shelf Science, v. 119, p. 167–175, accessed February 22, 2017, at https://doi.org/10.1016/j.ecss.2013.01.006.
Rassmann, J., Eitel, E.M., Lansard, B., Cathalot, C., Brandily, C., Taillefert, M., and Rabouille, C., 2020, Benthic alkalinity and dissolved inorganic carbon fluxes in the Rhône River prodelta generated by decoupled aerobic and anaerobic processes: Biogeosciences, v. 17, no. 1, p. 13–33, accessed October 24, 2023, at https://doi.org/10.5194/bg-17-13-2020.
Reddy, K.R., Patrick, W.H., and Broadbent, F.E., 1984, Nitrogen transformations and loss in flooded soils and sediments: CRC Critical Reviews in Environmental Control, v. 13, no. 4, p. 273–309, accessed December 20, 2019, at https://doi.org/10.1080/10643388409381709.
Repert, D.A., Barber, L.B., Hess, K.M., Keefe, S.H., Kent, D.B., Leblanc, D.R., and Smith, R.L., 2006, Long-term natural attenuation of carbon and nitrogen within a groundwater plume after removal of the treated wastewater source: Environmental Science & Technology, v. 40, no. 4, p. 1154–1162, accessed March 2017 at https://doi.org/10.1021/es051442j.
Rezaei, M., Sanz, E., Raeisi, E., Ayora, C., Vázquez-Suñé, E., and Carrera, J., 2005, Reactive transport modeling of calcite dissolution in the fresh-salt water mixing zone: Journal of Hydrology, v. 311, no. 1, p. 282–298, accessed February 23, 2018, at https://doi.org/10.1016/j.jhydrol.2004.12.017.
Rheuban, J.E., Doney, S.C., McCorkle, D.C., and Jakuba, R.W., 2019, Quantifying the effects of nutrient enrichment and freshwater mixing on coastal ocean acidification: Journal of Geophysical Research: Oceans, v. 124, no. 12, p. 9085–9100, accessed January 18, 2020, at https://doi.org/10.1029/2019JC015556.
Rivett, M.O., Buss, S.R., Morgan, P., Smith, J.W.N., and Bemment, C.D., 2008, Nitrate attenuation in groundwater—A review of biogeochemical controlling processes: Water Research, v. 42, no. 16, p. 4215–4232, accessed February 23, 2017, at https://doi.org/10.1016/j.watres.2008.07.020.
Robinson, C., Gibbes, B., Carey, H., and Li, L., 2007, Salt-freshwater dynamics in a subterranean estuary over a spring-neap tidal cycle: Journal of Geophysical Research: Oceans, v. 112, no. C9, 15 p., accessed March 2017 at https://doi.org/10.1029/2006JC003888.
Russoniello, C.J., Fernandez, C., Bratton, J.F., Banaszak, J.F., Krantz, D.E., Andres, A.S., Konikow, L.F., and Michael, H.A., 2013, Geologic effects on groundwater salinity and discharge into an estuary: Journal of Hydrology, v. 498, p. 1–12, accessed February 23, 2018, at https://doi.org/10.1016/j.jhydrol.2013.05.049.
Seitzinger, S., Harrison, J.A., Böhlke, J.K., Bouwman, A.F., Lowrance, R., Peterson, B., Tobias, C., and Drecht, G.V., 2006, Denitrification across landscapes and waterscapes—A synthesis: Ecological Applications, v. 16, no. 6, p. 2064–2090, accessed July 20, 2018, at https://doi.org/10.1890/1051-0761(2006)016[2064:DALAWA]2.0.CO;2.
Short, F.T., and Burdick, D.M., 1996, Quantifying eelgrass habitat loss in relation to housing development and nitrogen loading in Waquoit Bay, Massachusetts: Estuaries, v. 19, no. 3, p. 730–739, accessed March 2017 at https://doi.org/10.2307/1352532.
Smith, R.L., Böhlke, J.K., Garabedian, S.P., Revesz, K.M., and Yoshinari, T., 2004, Assessing denitrification in groundwater using natural gradient tracer tests with 15N—In situ measurement of a sequential multistep reaction: Water Resources Research, v. 40, no. 7, 17 p., accessed March 2017 at https://doi.org/10.1029/2003WR002919.
Smith, R.L., Böhlke, J.K., Song, B., and Tobias, C.R., 2015, Role of anaerobic ammonium oxidation (anammox) in nitrogen removal from a freshwater aquifer: Environmental Science & Technology, v. 49, no. 20, p. 12169–12177, accessed May 9, 2018, athttps://doi.org/10.1021/acs.est.5b02488.
Smith, R.L., and Duff, J.H., 1988, Denitrification in a sand and gravel aquifer: Applied and Environmental Microbiology, v. 54, no. 5, p. 1071–1078, accessed July 20, 2018, athttps://doi.org/10.1128%2Faem.54.5.1071-1078.1988.
Smith, R.L., Howes, B.L., and Duff, J.H., 1991, Denitrification in nitrate-contaminated groundwater—Occurrence in steep vertical geochemical gradients: Geochimica et Cosmochimica Acta, v. 55, no. 7, p. 1815–1825, accessed March 2017 athttps://doi.org/10.1016/0016-7037(91)90026-2.
Spiteri, C., Slomp, C.P., Charette, M.A., Tuncay, K., and Meile, C., 2008, Flow and nutrient dynamics in a subterranean estuary (Waquoit Bay, MA, USA)—Field data and reactive transport modeling: Geochimica et Cosmochimica Acta, v. 72, no. 14, p. 3398–3412, accessed March 2017 at https://doi.org/10.1016/j.gca.2008.04.027.
Strous, M., and Jetten, M.S.M., 2004, Anaerobic oxidation of methane and ammonium: Annual Review of Microbiology, v. 58, p. 99–117, accessed March 2017 athttps://doi.org/10.1146/annurev.micro.58.030603.123605.
Stute, M., Forster, M., Frischkorn, H., Serejo, A., Clark, J.F., Schlosser, P., Broecker, W.S., and Bonani, G., 1995, Cooling of tropical Brazil (5°C) during the last glacial maximum: Science, v. 269, no. 5222, p. 379–383, accessed July 20, 2018, athttps://doi.org/10.1126/science.269.5222.379.
Szymczycha, B., Kroeger, K.D., Crusius, J., and Bratton, J.F., 2017, Depth of the vadose zone controls aquifer biogeochemical conditions and extent of anthropogenic nitrogen removal: Water Research, v. 123, p. 794–801, accessed March 2017 athttps://doi.org/10.1016/j.watres.2017.06.048.
Thamdrup, B., and Dalsgaard, T., 2002, Production of N2 through anaerobic ammonium oxidation coupled to nitrate reduction in marine sediments: Applied and Environmental Microbiology, v. 68, no. 3, p. 1312–1318, accessed July 13, 2018, athttps://doi.org/10.1128/aem.68.3.1312-1318.2002.
Thomsen, M.S., Wernberg, T., Engelen, A.H., Tuya, F., Vanderklift, M.A., Holmer, M., McGlathery, K.J., Arenas, F., Kotta, J., and Silliman, B.R., 2012, A meta-analysis of seaweed impacts on seagrasses—Generalities and knowledge gaps: PLoS One, v. 7, no. 1, 8 p., accessed March 2017 at https://doi.org/10.1371/journal.pone.0028595.
Tiedje, J.M., Sexstone, A.J., Myrold, D.D., and Robinson, J.A., 1983, Denitrification—Ecological niches, competition and survival: Antonie van Leeuwenhoek, v. 48, no. 6, p. 569–583, accessed July 20, 2018, at https://doi.org/10.1007/BF00399542.
U.S. Environmental Protection Agency, 1983a, Method 365.4 (Colorimetric, automated, block digestor AA II)—Phosphorus, total, in Methods for chemical analysis of water and wastes: U.S. Environmental Protection Agency, Office of Research and Development, report EPA–600/7–79–20, 491 p., accessed February 21, 2017, at https://www.lachatinstruments.com/download/Lachat-Methods-Regulatory-QRG_10-09.pdf.
U.S. Environmental Protection Agency, 1983b, Methods for chemical analysis of water and wastes: U.S. Environmental Protection Agency, Office of Research and Development, report EPA–600/7–79–20, 460 p., accessed February 21, 2017, at https://www.lachatinstruments.com/download/Lachat-Methods-Regulatory-QRG_10-09.pdf.
U.S. Geological Survey, [variously dated], National field manual for the collection of water-quality data (NFM): U.S. Geological Survey Techniques of Water-Resources Investigations, book 9, chaps. A1–A9, accessed February 21, 2017, at https://water.usgs.gov/owq/FieldManual/compiled/NFM_complete.pdf.
U.S. Geological Survey, 2005, Specific conductance (ver. 1.2): U.S. Geological Survey Techniques and Methods, book 9, chap. A6.3, 15 p., accessed February 21, 2017, at https://doi.org/10/133/tm9A6.3.
U.S. Geological Survey, 2018, USGS water data for the Nation: U.S. Geological Survey National Water Information System database, accessed July 11, 2018, at https://doi.org/10.5066/F7P55KJN.
Valiela, I., Collins, G., Kremer, J., Lajtha, K., Geist, M., Seely, B., Brawley, J., and Sham, C.H., 1997, Nitrogen loading from coastal watersheds to receiving estuaries—New method and application: Ecological Applications, v. 7, no. 2, p. 358–380, accessed August 3, 2020, at https://doi.org/10.1890/1051-0761(1997)007[0358:NLFCWT]2.0.CO;2.
Valiela, I., Foreman, K., LaMontagne, M., Hersh, D., Costa, J., Peckol, P., DeMeo-Andreson, B., D’Avanzo, C., Babione, M., Sham, C.-H., Brawley, J., and Lajtha, K., 1992, Couplings of watersheds and coastal waters—Sources and consequences of nutrient enrichment in Waquoit Bay, Massachusetts: Estuaries, v. 15, no. 4, p. 443–457, accessed August 17, 2017, at https://doi.org/10.2307/1352389.
Valiela, I., Geist, M., McClelland, J., and Tomasky, G., 2000, Nitrogen loading from watersheds to estuaries—Verification of the Waquoit Bay Nitrogen Loading Model: Biogeochemistry, v. 49, p. 277–293, accessed March 2017 at https://doi.org/10.1023/A:1006345024374.
Valiela, I., McClelland, J., Hauxwell, J., Behr, P.J., Hersh, D., and Foreman, K., 1997, Macroalgal blooms in shallow estuaries—Controls and ecophysiological and ecosystem consequences: Limnology and Oceanography, v. 42, no. 5, part 2, p. 1105–1118, accessed February 22, 2017, at https://doi.org/10.4319/lo.1997.42.5_part_2.1105.
Valiela, I., Owens, C., Elmstrom, E., and Lloret, J., 2016, Eutrophication of Cape Cod estuaries—Effect of decadal changes in global-driven atmospheric and local-scale wastewater nutrient loads: Marine Pollution Bulletin, v. 110, no. 1, p. 309–315, accessed February 22, 2017, at https://doi.org/10.1016/j.marpolbul.2016.06.047.
Van Cuyk, S., Siegrist, R.L., and Logan, A.J., 2001, Evaluation of virus and microbiological purification in wastewater soil absorption systems using multicomponent surrogate and tracer addition in Mancl, K., ed., On-site wastewater treatment: Proceedings of the Ninth National Symposium on Individual and Small Community Sewage Systems, Fort Worth, Tex., March 11–14, 2001, American Society of Agricultural Engineers, p. 30–40. [Also available at https://doi.org/10.13031/2013.6039.]
Walter, D.A., McCobb, T.D., and Fienen, M.N., 2019, Use of a numerical model to simulate the hydrologic system and transport of contaminants near Joint Base Cape Cod, western Cape Cod, Massachusetts: U.S. Geological Survey Scientific Investigations Report 2018–5139, 98 p. [Also available at https://doi.org/10.3133/sir20185139.]
Walter, D.A., and Whealan, A.T., 2005, Simulated water sources and effects of pumping on surface and ground water, Sagamore and Monomoy flow lenses, Cape Cod, Massachusetts: U.S. Geological Survey Scientific Investigations Report 2004–5181, 85 p. [Also available at https://doi.org/10.3133/sir20045181.]
Wankel, S.D., Ziebis, W., Buchwald, C., Charoenpong, C., de Beer, D., Dentinger, J., Xu, Z., and Zengler, K., 2017, Evidence for fungal and chemodenitrification based N2O flux from nitrogen impacted coastal sediments: Nature Communications, v. 8, no. 1, accessed December 20, 2019, at https://doi.org/10.1038/ncomms15595.
Weiss, R.F., 1970, The solubility of nitrogen, oxygen, and argon in water and seawater: Deep-Sea Research and Oceanographic Abstracts, v. 17, no. 4, p. 721–735, accessed June 14, 2023, at https://doi.org/10.1016/0011-7471(70)90037-9.
Wendt, K., 1995, QuikChem method 10-107-04-1-A—Determination of nitrate/nitrite in surface and wastewaters by flow injection analysis (low flow method): Lachat Instruments, Inc., report, 17 p., accessed February 21, 2017, at https://www.uvm.edu/bwrl/lab_docs/protocols/Nitrate_water_lachat.pdf [revised in August 2000 by A. Sardina].
Young, C., Kroeger, K.D., and Hanson, G., 2013, Limited denitrification in glacial deposit aquifers having thick unsaturated zones (Long Island, USA): Hydrogeology Journal, v. 21, p. 1773–1786, accessed February 22, 2017, at https://doi.org/10.1007/s10040-013-1038-4.
Conversion Factors
International System of Units to U.S. customary units
Temperature in degrees Celsius (°C) may be converted to degrees Fahrenheit (°F) as follows:
°F = (1.8 × °C) + 32.
Temperature in degrees Fahrenheit (°F) may be converted to degrees Celsius (°C) as follows:
°C = (°F – 32) / 1.8.
Datum
Vertical coordinate information is referenced to the National Geodetic Vertical Datum of 1929 (NGVD 1929).
Horizontal coordinate information is referenced to the North American Datum of 1983 (NAD 83).
Altitude, as used in this report, refers to distance above the vertical datum.
Supplemental Information
Specific conductance is given in millisiemens per centimeter at 25 degrees Celsius (mS/cm at 25 °C) or microsiemens per centimeter at 25 degrees Celsius (µS/cm at 25 °C). Specific conductance values were converted to practical salinity units (psu) by using the GSW (Gibbs Sea Water Functions) (version 3.05) package in R, http://www.teos-10.org/pubs/gsw/html/gsw_SP_from_C.html, accessed September 29, 2022.
Concentrations of chemical constituents in water are given either in micromoles per liter (µmol/L), microequivalents per liter (µeq/L), practical salinity units (psu), milligrams per liter (mg/L), or micrograms per liter (µg/L).
Concentrations of nitrate plus nitrite (NO3 + NO2) are reported as micromoles per liter (µmol/L) nitrate-nitrogen (NO3-N) unless noted otherwise because nitrite concentration was usually small.
Excess air concentrations are reported in units of cubic centimeters of gas at standard temperature (0 °C) and pressure (1 atmosphere) per liter of water (ccSTP/L).
Site identifiers use shorthand “F” for “MA–FSW” unless noted otherwise. MA refers to Massachusetts and FSW refers to stations in Falmouth, Massachusetts.
Abbreviations
δ15N
delta nitrogen-15
anammox
anaerobic ammonium oxidation
Ar
argon gas
ASW
air-saturated water
CaCO3
calcium carbonate
ccSTP/L
cubic centimeters of gas at standard temperature and pressure per liter of water
DNRA
dissimilatory nitrate reduction to ammonium
DO
dissolved oxygen as O2
DOC
dissolved organic carbon
DSD
deep saltwater discharge
DSI
deep saltwater infiltration
DSW
deep saltwater wedge
EA
excess air
Fe(II)
ferrous iron
FGD
fresh groundwater discharge
GC
gas chromatography
ISC
intertidal saltwater cell
ISD
intertidal saltwater discharge
ISI
intertidal saltwater infiltration
MHT
mean high tide
MIC
microbially produced
MLS
multilevel sampler
MLT
mean low tide
N2
nitrogen gas
N2-NMIC
concentration of microbially produced N2 gas, as N
N2O
nitrous oxide
N2MIC
concentration of microbially produced N2 gas, as N2
NO
nitric oxide
NO3 + NO2
nitrate plus nitrite
NWIS
National Water Information System
O2
oxygen gas
psu
practical salinity units
PVC
polyvinyl chloride
SpC
specific conductance
STP
standard temperature and pressure
TMDL
total maximum daily loads
USGS
U.S. Geological Survey
For more information about this report, contact:
Director, New England Water Science Center
U.S. Geological Survey
10 Bearfoot Road
Northborough, MA 01532
dc_nweng@usgs.gov
or visit our website at
https://www.usgs.gov/centers/new-england-water
Publishing support provided by the Pembroke and Reston Publishing Service Centers
Disclaimers
Any use of trade, firm, or product names is for descriptive purposes only and does not imply endorsement by the U.S. Government.
Although this information product, for the most part, is in the public domain, it also may contain copyrighted materials as noted in the text. Permission to reproduce copyrighted items must be secured from the copyright owner.
Suggested Citation
Huntington, T.G., Kroeger, K.D., McCobb, T.D., Böhlke, J.K., Colman, J.A., Brooks, T.W., and Szymczycha, B., 2024, Evidence of nitrate attenuation in intertidal and subtidal groundwater in a subterranean estuary at a Cape Cod embayment, East Falmouth, Massachusetts, 2015–16: U.S. Geological Survey Scientific Investigations Report 2024–5100, 45 p., https://doi.org/10.3133/sir20245100.
ISSN: 2328-0328 (online)
Study Area
| Publication type | Report |
|---|---|
| Publication Subtype | USGS Numbered Series |
| Title | Evidence of nitrate attenuation in intertidal and subtidal groundwater in a subterranean estuary at a Cape Cod embayment, East Falmouth, Massachusetts, 2015–16 |
| Series title | Scientific Investigations Report |
| Series number | 2024-5100 |
| DOI | 10.3133/sir20245100 |
| Publication Date | December 11, 2024 |
| Year Published | 2024 |
| Language | English |
| Publisher | U.S. Geological Survey |
| Publisher location | Reston, VA |
| Contributing office(s) | New England Water Science Center |
| Description | Report: ix, 45 p.; Data Release |
| Country | United States |
| State | Massachusetts |
| Other Geospatial | Cape Cod Embayment, East Falmouth |
| Online Only (Y/N) | Y |
| Additional Online Files (Y/N) | N |