

North American Waterfowl Management Plan Survey Regional Profile—Southeast Region
Links
- Document: Report (3 MB pdf) , HTML , XML
- Download citation as: RIS | Dublin Core
Acknowledgments
This project was funded and supported by the U.S. Fish and Wildlife Service’s Southeast Human Dimensions Working Group and builds on work funded by the member States of the National Flyway Council and Ducks Unlimited. The North American Waterfowl Management Plan Human Dimensions Working Group and Public Engagement Team developed the original study design, and data collection was conducted by David Fulton and the U.S. Geological Survey (USGS), Minnesota Cooperative Research Unit. The study objectives were jointly developed with Wiley Carr, Heath Hagy and input from U.S. Fish and Wildlife Service refuge managers. This project benefitted from intellectual contributions from Rudy Schuster (USGS), Howie Harshaw (University of Alberta), Ashley Dayer (Virginia Tech University), Jennifer Duberstein (U.S. Fish and Wildlife Service), and Andy Raedeke (Missouri Department of Conservation). The survey described in this report was organized and implemented by the University of Alberta and University of Minnesota and was not conducted by or on behalf of the USGS.
Executive Summary
Gaining a better understanding of the human dimensions of waterfowl management to inform the North American Waterfowl Management Plan is a valuable but challenging goal for the future success of waterfowl management. Increasing engagement with key stakeholder groups will lead to more support and effective waterfowl management. Social systems are complex because individual values and preferences may vary across geographic and cultural dimensions, so it is valuable to describe those differences rather than only looking at national-scale trends. Therefore, using broad engagement strategies that do not consider the differences among regional groups may do more harm than good.
This study analyzed a subset of responses from waterfowl hunters (hereafter respondents) in the Southeast region of the United States from a national-scale survey (Patton, 2018). This study compared how respondents’ opinions differed among two subsections of the Atlantic and Mississippi flyways—the Atlantic subflyway and Mississippi subflyway—and responses from the national survey. Respondents in the Atlantic subflyway had a primary home ZIP code in Florida, Georgia, North Carolina, South Carolina, and Tennessee. Respondents in the Mississippi subflyway had a primary home ZIP code in Alabama, Arkansas, Kentucky, Louisiana, Missouri, and Mississippi. Investigating these differences provides waterfowl managers decision-making support and a better understanding of how perceptions may differ among respondents in the Southeast region and the Nation. Responses from each group are presented for each for each survey topic, and statistical tests of homogeneity are included to inform how the differences may be considered when managing for waterfowl and waterfowl hunting.
Respondents from the Mississippi and Atlantic subflyways did not differ substantially except in their perceptions and preferences of waterfowl harvest and harvest regulations. Respondents from the Mississippi subflyway consistently reported a higher average harvest of ducks and geese, emphasized the importance of higher harvest for their satisfaction with waterfowl hunting, and typically placed a greater emphasis on regulatory decisions that facilitated increased harvest opportunity than respondents from the Atlantic subflyway. This emphasis was especially true when preferring species-specific limits more than simpler aggregate limits. Respondents in the Mississippi subflyway were in direct opposition to respondents in the Atlantic subflyway and preferred the opportunity for increased harvest that species-specific bag limits provide.
Respondents in the Mississippi subflyway placed greater emphasis on harvest and larger bag limits compared with respondents in the Atlantic subflyway and the national survey. Respondents in the Atlantic subflyway often aligned with the national survey respondents’ perceptions of harvest that placed a lower emphasis on the number of ducks or geese harvested in comparison to Mississippi subflyway respondents. The Atlantic and Mississippi subflyway respondents reported hunting ducks and geese to a much lower degree than the national survey respondents, who favored only hunting ducks or hunting neither ducks nor geese. Similarly, respondents in the Mississippi and Atlantic subflyways reported that overcrowding, high hunting pressure, and interference from other respondents limited their participation to a higher degree than respondents from the national survey.
The trip-specific preferences for waterfowl hunting in the Southeast region were calculated using latent class analysis and three groups were determined based on individual estimates of attribute importance: generalist, seclusionist, and harvest oriented. The generalist group did not place a high degree of importance on any one attribute and was most likely to choose to not participate given suboptimal conditions. The seclusionist group placed a high degree of importance on lower levels of competition from other groups and felt their well-being was most affected by higher levels of competition. The harvest-oriented group placed a higher degree of importance on harvesting more than three birds and felt their well-being was most negatively affected if they only expected to harvest a single bird. These groups existed uniformly between the Mississippi and Atlantic subflyways, had a slightly higher membership of each group in rural areas, and an overall higher membership in the seclusionist group.
Subsetting national survey data to profile regional differences provides key information to waterfowl managers seeking to make tailored decisions in their region or flyway. This investigation provides an important resource for informed management decisions in the Southeast region and will assist waterfowl managers by supporting engagement and communication with respondents in the Southeastern United States.
Reference Cited
Patton, S., 2018, National survey of respondents—Nationwide and flyway comparisons: National Flyway Council, prepared by the Minnesota Cooperative Fish and Wildlife Research Unit and University of Minnesota, St. Paul, Minn., 167 p., accessed July 22, 2022, at https://nawmp.org/sites/default/files/2021-03/National%20Waterfowl%20Hunter%20Survey.pdf.
Introduction
The North American Waterfowl Management Plan (NAWMP [NAWMP, 2012]) has been in place since 1986 to provide unified guidance across government agencies in North America to maintain waterfowl abundance at quality levels and protect wetlands and other habitats needed by waterfowl populations. The NAWMP was revised in 2012, and an additional focus was added that emphasized the importance of describing the human dimensions of waterfowl management and waterfowl-related outdoor recreation. Specifically, the NAWMP plan committee suggested engaging respondents and nontraditional stakeholder communities to nurture support for waterfowl and wetland conservation. The NAWMP plan committee recognized that understanding and incorporating social information was imperative to the continued success of waterfowl management in North America.
To successfully meet the objectives in the 2012 NAWMP revision, it is first necessary to collect human dimensions information that describes the perceptions and beliefs of waterfowl and wetland stakeholders to inform future engagement and communication strategies. Stakeholders in target communities have different views based on their backgrounds, which can lead to unexpected behaviors or reactions to management actions that are difficult to predict. As a result, operationalizing baseline human dimensions information within engagement and communication strategies can be challenging. Effectively using human dimensions information in the decision-making process for wildlife management requires recognizing the diversity inherent among the community's wildlife management serve. Standard engagement and communication will not always be effective because stakeholders perceive wildlife management differently based on unique backgrounds, life experience, and trust.
Waterfowl and other bird species use regular routes during annual migrations known as flyways. In North America, there are four distinct flyways. The eastern most flyway is called the Atlantic flyway and the other flyways—moving from the east to the west—are the Mississippi flyway, the Central flyway, and the Pacific flyway. Each flyway has unique ecological dynamics and are managed separately within the NAWMP. This study evaluated respondents within a subset of the Atlantic and Mississippi flyways in the Southeast region of the United States—the Atlantic subflyway and the Mississippi subflyway.
The objective of this study was to identify where waterfowl hunter (hereafter respondents) perceptions and attitudes may diverge in the Southeast region. The information presented here was collected from responses collected from a national survey effort (Patton, 2018). This study evaluated responses at a regional scale so that waterfowl managers in the Southeast region may better incorporate the information into their decision-making processes. Stakeholder experiences are primarily dependent on the flyway they hunt; therefore, comparisons among respondents in the Atlantic subflyway, the Mississippi subflyway, and the national survey may help better inform waterfowl managers in the Southeast region.
Background
To meet the revised goals of the NAWMP to emphasize on human dimensions goals, an effort was launched to provide baseline social science information related to waterfowl and wetland conservation. This information is needed to develop appropriate engagement strategies and inform ongoing management actions in the United States and Canada. The joint effort was headed by the NAWMP Human Dimensions Working Group and Public Engagement Team, which worked with the U.S. Geological Survey, Minnesota Cooperative Research Unit, and the University of Alberta to develop and administer surveys that now inform broader NAWMP objectives like waterfowl harvest dynamics, habitat management, and stakeholder engagement (Patton, 2018).
Although the surveys collected information on a binational scale (United States and Canada), the results are applicable across most scales of management, governance, and outreach. After the survey effort, the collected data were analyzed, and reports were generated on a per flyway basis. These reports quantified preferences among respondents and nontraditional stakeholders, described baseline information for waterfowl and wetland stakeholders that informed NAWMP objectives, and informed decision making for harvest and habitat management to provide optimal benefits to waterfowl and wetland stakeholders.
The overall project included three surveys—a public survey, a waterfowl hunter survey, and a birdwatcher survey. The general public survey was mailed to 5,000 individuals throughout the continental United States and had a completed sample size target of 1,200 respondents (Wilkins and Miller, 2018). The waterfowl hunter survey was mailed to 33,359 recipients and was completed by 7,689 respondents (Patton, 2018). The birdwatcher survey was mailed to 126,083 recipients and was completed by 32,818 respondents (Patton, 2021). The original survey efforts asked questions to meet baseline information objectives related to participation in waterfowl hunting including unique identities and backgrounds, social networks, and preferences.
Survey Methods and Analysis
The survey described in this report was organized and implemented by the University of Alberta and University of Minnesota and was not conducted by or on behalf of the U.S. Geological Survey. The information presented here is a regional subset of the national waterfowl hunter survey that has already been presented at a national (Patton, 2018) and flyway scale (Slagle and Dietsch, 2018a, b). More detailed background, methods, and the original survey can be found in those reports.
Any U.S. resident 18 years or older and who had participated in waterfowl hunting in 2015 was contacted for the original survey effort (Patton, 2018). Contact information was collected from the 2015 Migratory Bird Harvest Information Program. A total of 138,948 respondents were selected in 49 States. The 4 flyways were divided into 3 subflyways for a total of 12 sampling regions in the United States. The survey was designed with the intended purpose of achieving a minimum of 400 completed surveys in each of the 12 subflyway regions. Some States (Arkansas, Florida, and Missouri) requested oversampling, which resulted in larger sample sizes. Other States, such as Alabama, Georgia, Louisiana, and Mississippi, did not request oversampling and had particularly low response rates. A State-specific breakdown of selected survey results in the Southeast region (number of responses, demographics, involvement, donations, trust, satisfaction, and barriers) is provided in appendix 1 (tables 1.1–1.6).
Potential respondents were initially notified about the survey using a standard multiple contact mail-out survey. Then, the survey was administered online in November 2016–January 2016. Response rates from the national survey varied among States and was as low as about (~) 10 percent (for example, Georgia, Maine, and Louisiana) and as high as ~30 percent (for example, Ohio and Nebraska). In the Southeast region, Georgia (91) and Louisiana (121) had the lowest number of respondents, whereas Arkansas (438) and Missouri (421) had the highest number of respondents (Patton, 2018).
Respondents in the Atlantic subflyway had a primary home ZIP code in Florida, Georgia, North Carolina, South Carolina, and Tennessee. Respondents in the Mississippi subflyway had a primary home ZIP code in Alabama, Arkansas, Kentucky, Louisiana, Missouri, and Mississippi. When appropriate, a test of homogeneity (Pearson’s chi-squared) was used to compare results between the respondents in the Atlantic and Mississippi subflyways and identify the likelihood that the differences between the subflyways occurred by chance. For each test, the chi-squared value, number of degrees of freedom, and p-value are reported in the figure caption or an associated table. As the chi-squared value increases, there is a lower chance the differences among the observed categorical distributions could have arisen by chance (Bilder and Loughin, 2014). For this study, an alpha threshold of 0.05 was used. As such, p-values greater than 0.05 were considered homogenous across the two subflyways. When only two categories were included in a survey question—which resulted in a 2 by 2 contingency table—a Fisher’s exact test was preferred more than the Pearson’s chi-squared because of the limited values available (Bilder and Loughin, 2014). When a Fisher’s exact test was used, an odds ratio was reported as a measure of effect size; the closer the odds ratio value was to one, the more likely it was to occur from random chance. When Pearson’s chi-squared was used, a Cramer’s V was given as a measure of effect size because it better incorporates sample variance and is more appropriate in larger contingency tables. The strength of the relationship in a Cramer’s V test is determined by the reported value and the degrees of freedom; therefore, low effect sizes are marked as “*,” medium effect sizes are marked as “**,” high effect sizes are marked as “***,” and negligible effect sizes are unmarked. A p-value of 0.05 or less refers to a statistical difference between the subflyways, whereas the effect size describes the magnitude of that difference. A negligible effect size indicates that the significant difference between the two factors should be effectively ignored. Low effect size indicates the significant difference between two factors and should be carefully considered before revising existing management actions or policies.
Regional Findings
The “Results” section is separated into subsections by survey topic. Respondents in the Atlantic and Mississippi subflyways were consistently similar among many of the investigated topics. These consistent results are key and best represented by the measure of effect size. Where significant differences were found between the two subflyways, the effect sizes were almost always negligible or low.
Trip Characteristics
Preference for certain waterfowl hunting trip characteristics is a foundational component of a respondent’s experience where respondents self-select trip characteristics that they believe will lead to a satisfying experience that fulfills their motivations (Schroeder and others, 2019). Respondents have substantial control over trip characteristics within the bounds of economic and logistical barriers and make those decisions to maximize well-being.
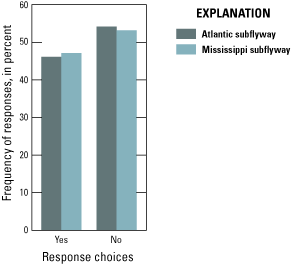
When asked about the circumstances under which they choose to participate in waterfowl hunting, respondents in both subflyways chose “both”; they regularly planned waterfowl hunting for themselves and went hunting when invited by someone else (table 1; fig 1A–E). There were differences between types of trip choices respondents made in the two subflyways, but the effect sizes were still classified as “low.” In the Mississippi subflyway, 57 percent of respondents reported seeking ducks and geese (fig. 1B). Respondents in the Atlantic subflyway were equally likely to seek both ducks and geese and 40 percent of respondents reported only seeking ducks. Respondents in both subflyways differed substantially from the national survey and were less likely to seek ducks and geese in a normal year. In the Atlantic subflyway, 19 percent of respondents reported that they did not seek either ducks or geese.
Table 1.
Chi-squared test of homogeneity comparing trip characteristics among respondents in the Mississippi and Atlantic subflyways, the Mississippi subflyway and the national survey, and the Atlantic subflyway and the national survey.[x2, chi-squared statistic; p, p-value; φ2, effect size; <, less than; *, low effect size; **, medium effect size; ***, high effect size]
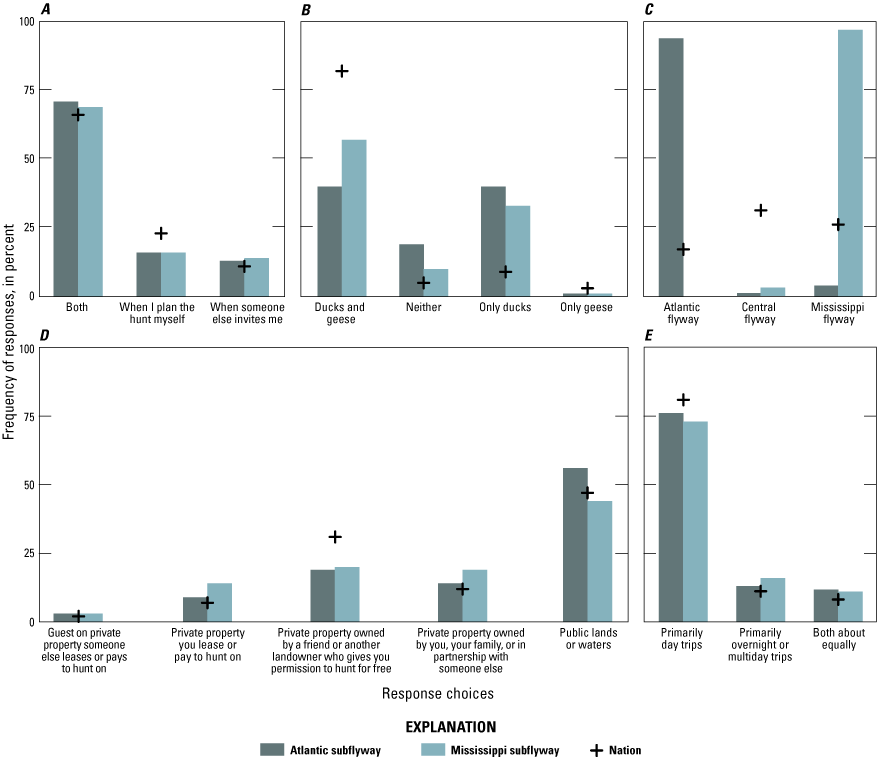
Bar graphs showing the frequency of responses (in percent) for the Atlantic and Mississippi subflyway respondents. A, Respondents who plan waterfowl hunts on their own, go when someone else invites them, or both. B, Respondents who seek different ducks or geese in an average year. C, Respondents who most often hunted for waterfowl in 2016. D, Land types where respondents primarily do most of their waterfowl hunting. E, The typical length of hunting trips that respondents tend to take.
When asked about the flyways they tended to hunt in 2016, respondents in the Mississippi and Atlantic subflyways preferentially hunted in the flyway where they live (fig. 1C). There were differences in the land types that respondents reported they primarily hunted on, but these differences had low effect sizes. Most respondents in the Mississippi subflyway (44 percent) and Atlantic subflyway (56 percent) reported that they primarily hunted on public land. National survey respondents also primarily hunted on public land but were slightly more likely to hunt on land owned by a friend or family member than respondents in the Southeast region (fig. 1D). Respondents in the Atlantic subflyway (76 percent) and Mississippi subflyway (73 percent) reported they primarily took day trips, which was highly in line with the national survey response (fig. 1E). Respondents who took multiday trips hunting trips were a substantial minority in the Southeast region and the national survey.
Harvest Characteristics
Harvest characteristics for ducks and geese were statistically different between the Mississippi and Atlantic subflyway and had a low effect size. Respondents in the Atlantic subflyway reported harvesting substantially fewer ducks and geese than respondents in the Mississippi subflyway; respondents from the national survey reported harvesting even fewer ducks and geese. Respondents in both subflyways reported harvesting more ducks than geese and that they averaged 10 or fewer geese per year (table 2; fig. 2A, B). Thus, respondents in the Mississippi subflyway are more inclined to hunt geese than respondents in the Atlantic subflyway, but respondents in both subflyways preferentially seek and harvest ducks more than geese.
Table 2.
Chi-squared test of homogeneity comparing harvest characteristics among respondents in the Mississippi and Atlantic subflyways, the Mississippi subflyway and the national survey, and the Atlantic subflyway and the national survey.[X2, chi-squared statistic; p, p-value; ϕ2, effect size; <, less than; *, low effect size]
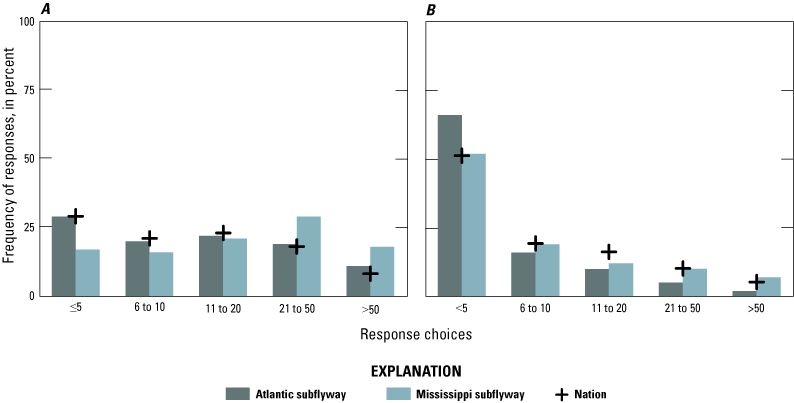
Bar graphs showing the frequency of responses (in percent) for Atlantic and Mississippi subflyway respondents of A, ducks and B, geese harvested per respondent per year on average throughout the last 5 years (2011–16). ≤, less than or equal to; >, greater than
In the Mississippi subflyway, 51 percent of respondents reported that they harvested an average of 21–50 or more ducks annually in 2011–15; only 30 percent of respondents in the Atlantic subflyway reported the same (fig. 2A). In comparison, only 17 percent of respondents in the Mississippi subflyway and 7 percent of respondents in the Atlantic subflyway reported harvesting an average of 21–50 or more geese. In the Atlantic subflyway, 29 percent of respondents reported that they harvested 5 or fewer ducks on average across 5 years and 66 percent harvested 5 or fewer geese (fig. 2B). The respondents in the Mississippi subflyway reported harvesting more ducks than geese than the national survey respondents.
Avidity Characteristics
Avidity is a key metric when measuring a participant’s involvement in an activity and describes their level of participation (Salz and others, 2001). A participant’s level of involvement is an important factor in describing how a person feels about the activity, how likely they are to continue to participate, and how important it is to how they view themselves. Respondents in the Mississippi subflyway reported being more avid than respondents in the Atlantic subflyway and most hunted at least 11 days per year in the previous 5 years (table 3; fig. 3A–C). Similarly, the Mississippi subflyway had less turnover between years, and 70 percent of respondents reported hunting every year in the previous 5 years.
Table 3.
Chi-squared test of homogeneity comparing avidity characteristics among respondents in the Mississippi and Atlantic subflyways, the Mississippi subflyway and the national survey, and the Atlantic subflyway and the national survey.[X2, chi-squared statistic; p, p-value; ϕ2, effect size; <, less than; *, low effect size]
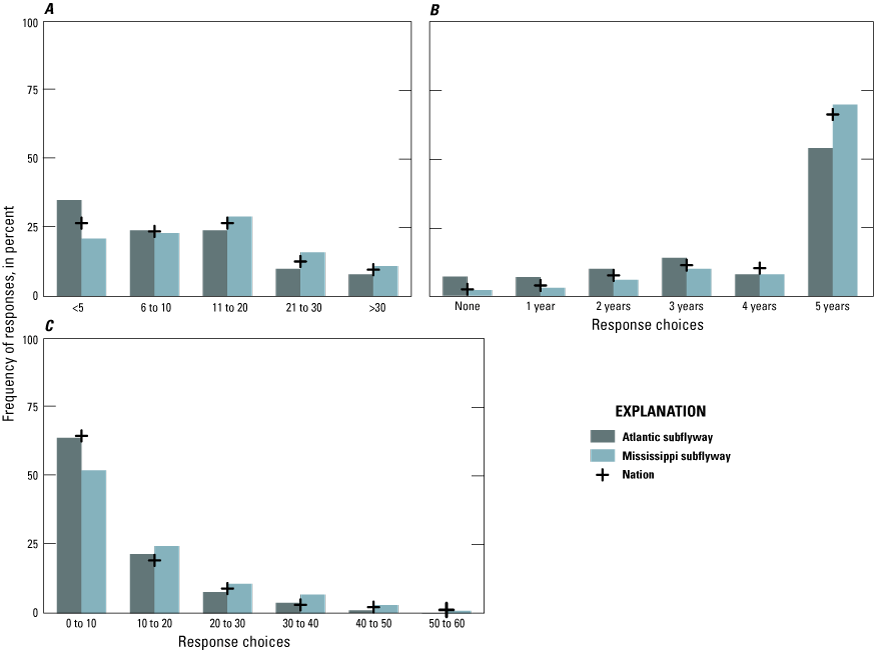
Bar graphs showing the frequency of responses (in percent) for Atlantic and Mississippi subflyway respondents. A, The number of days of respondents usually hunted waterfowl per year throughout the last 5 years. B, The number of years respondents usually hunted waterfowl per year throughout the last 5 years. C, The number of days respondents reported hunting waterfowl in 2016.
Most respondents in the Atlantic subflyway reported hunting all 5 years (56 percent) but had more turnover than the Mississippi subflyway and the national survey. In the Mississippi subflyway, 30 percent of respondents averaged hunting 21 or more days, but only 18 percent of respondents in the Atlantic subflyway hunted 21 or more days and most hunted 10 days or fewer (table 3; fig. 3B). The effect sizes were low for these differences, but important management implications may still exist given the role that avidity plays in describing waterfowl hunting involvement. The finding that most respondents tended to hunt each year across the previous 5 years supports findings that waterfowl hunting tends to have lower turnover compared with other recreational hunting activities (Hinrichs and others, 2020).
In the Mississippi and Atlantic subflyways and the national survey, respondents overwhelmingly reported hunting 0–10 days in 2016 (fig. 3C). The Mississippi subflyway reported hunting more days than respondents in the Atlantic subflyway, but most respondents in both subflyways reported hunting 10 days or fewer (table 3; fig. 3C).
Hunter Satisfaction and Motivations
Satisfaction with any recreational activity can be assessed using a variety of mechanisms, but satisfaction is always based on a person’s ability to achieve a range of expectations for participating (Brunke and Hunt, 2008). Some expectations will exert an increased effect on satisfaction overall based on its importance to that individual. Often, expectations are split into harvest- and nonharvest-related forms because participants tend to control directly for their nonharvest-related motivations in choosing when and where to hunt (Schroeder and others, 2018). Harvest-related satisfaction in waterfowl hunting is often assessed in the number of birds harvested or the number of times respondents are able to meet the daily bag limit in their flyway.
When respondents were asked about the minimum number of ducks they needed to harvest per trip to feel satisfied, respondents in the Mississippi subflyway tended to base their satisfaction on harvest more than respondents in the Atlantic subflyway; however, the effect size for the Mississippi subflyway indicates that the differences should be carefully considered when making management decisions. In the Atlantic subflyway, 60 percent of respondents were satisfied with 1–3 birds harvested per trip, but only 44 percent of respondents in the Mississippi subflyway felt the same, and most respondents required 3–5 ducks harvested (table 4; fig. 4A–C).
Table 4.
Chi-squared test of homogeneity comparing hunter satisfaction and motivations among respondents in the Mississippi and Atlantic subflyways, the Mississippi subflyway and the national survey, and the Atlantic subflyway and the national survey.[X2, chi-squared statistic; p, p-value; ϕ2, effect size; <, less than; *, low effect size]
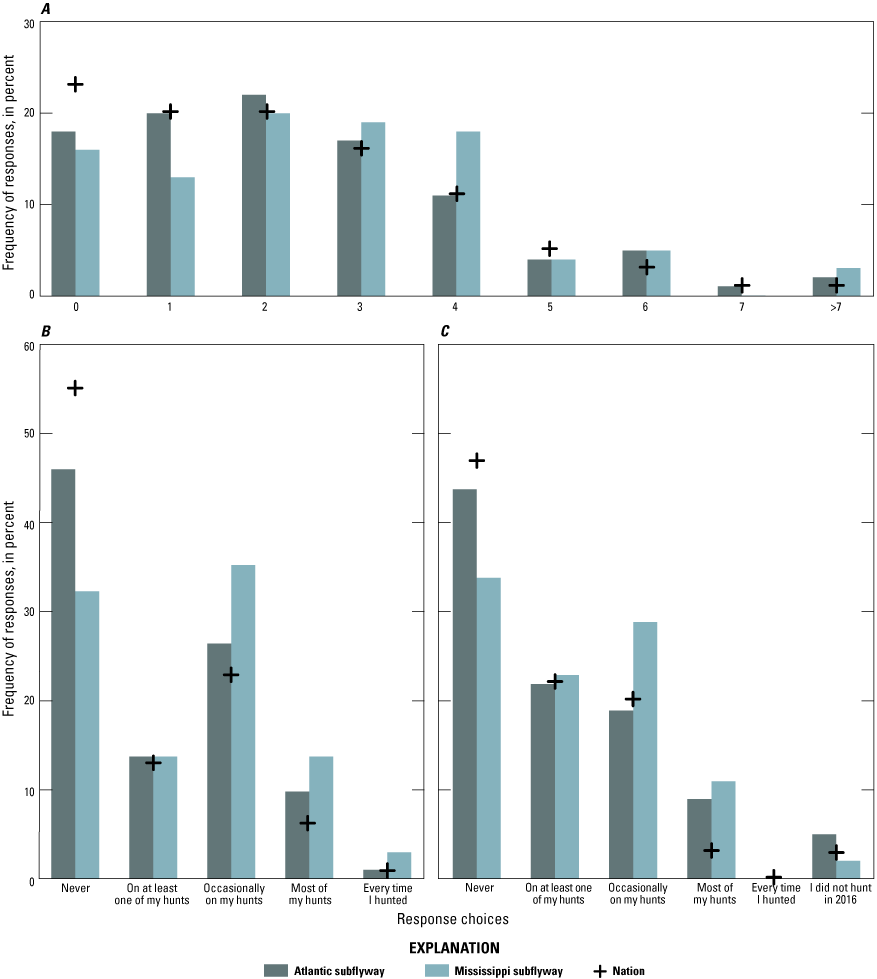
Bar graphs showing the frequency of responses (in percent) for Atlantic and Mississippi subflyway respondents. A, The minimum number of harvested ducks per trip a hunter in needed to feel satisfied. B, The number of times a hunter needed to shoot a daily bag limit of ducks or geese to have a satisfying season. C, The number of times a hunter shot a bag limit of ducks or geese in the 2016 season.
When asked about the number of times respondents needed to shoot their daily bag limit on their hunts to be satisfied, 17 percent of respondents in the Mississippi subflyway reported needing to occasionally shoot their limit and 38 percent in the Atlantic subflyway reported needing to occasionally shoot their limit (table 4; fig. 4B). In comparison, only 10 percent of respondents in the Atlantic subflyway reported needing to shoot their daily bag limit most of the time and 27 percent reported needing to occasionally shoot their limit. Few respondents in both subflyways reported needing to shoot their daily bag limit every time they hunted to be satisfied. Respondents were also asked how many times they were able to meet these expectations and shoot their daily bag limit in 2016. The responses for both subflyways corresponded well with their expectations for satisfaction (table 4; fig. 4C). This trend indicates that respondents in both subflyways are likely satisfied with their ability to regularly harvest their daily bag limit. Across these harvest-oriented motivations, respondents in the Mississippi subflyway tended to prioritize harvest in determining satisfaction more than respondents in the Atlantic subflyway and the national survey. This orientation was represented in the number of birds harvested and in meeting the bag limit allowed.
When asked about satisfaction with hunting regulations, like daily limits or the number of days in the season, most respondents were neutral (fig. 5A–G). The number of ducks typically present in the areas respondents hunted or the number of ducks respondents typically saw had the lowest satisfaction among both subflyways; respondents in the Mississippi subflyway were more satisfied than respondents in the Atlantic subflyway (fig. 5A–G). Respondents in both subflyways were most satisfied with nonharvest-related attributes, like the quality of the habitat where they hunted or their overall hunting experience. Mississippi subflyway respondents were consistently more satisfied with management and regulatory aspects of waterfowl hunting (daily limits, days in the season, ducks present, and quality of habitats), and this increased satisfaction accounted for the significant differences identified between the two subflyways (table 5).
Table 5.
Chi-squared test of homogeneity comparing perceptions of waterfowl hunter satisfaction among respondents in the Mississippi and Atlantic subflyways, the Mississippi subflyway and the national survey, and the Atlantic subflyway and the national survey.[X2, chi-squared statistic; p, p-value; ϕ2, effect size; <, less than; *, low effect size]
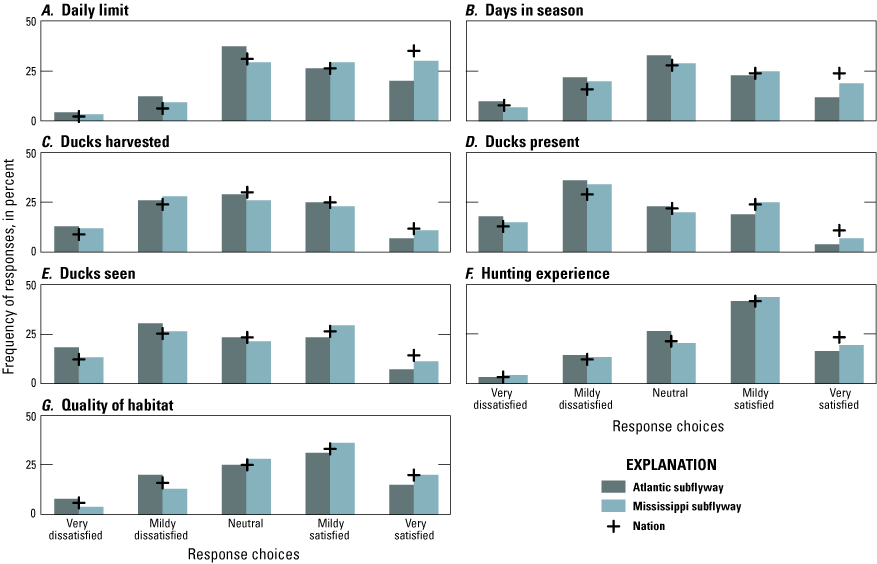
Frequency of responses (in percent) for Atlantic and Mississippi subflyway respondents’ satisfaction with aspects of duck hunting in the Atlantic and Mississippi subflyways and the Nation. A, Daily limit. B, Days in season. C, Ducks harvested. D, Ducks present. E, Ducks seen. F, Hunting experience, G, Quality of habitat.
Species Importance
The most relevant species to each flyway were selected by the NAWMP Human Dimensions Working Group and Public Engagement Team and tailored based on the opinions of experts in those flyways (Patton, 2018). Respondents from both subflyways were asked to describe the importance of selected species to their preferences of waterfowl hunting. Dabbling duck species like Spatula spp. (teal), Anas acutta (pintail), and Aix sponsa (wood ducks) were most important, followed closely by Anas platyrhynchos (mallard) and diving ducks. Sea duck species were reported as one of the least important species (fig. 6A–I). Similarly, geese species like Branta canadensis (Canada geese), Anser caerulescens (snow geese), and Branta bernicla (brant) were also less important, and 30 percent of all respondents reported that they were not at all important. Respondents in the Mississippi subflyway were asked about their preference of four particular species (diving ducks, geese, mallards, and other dabbling ducks); the results were similar with mallards and other dabbling ducks, like teal and pintails, being the most important species and diving ducks being the least important species (fig. 7A–D).
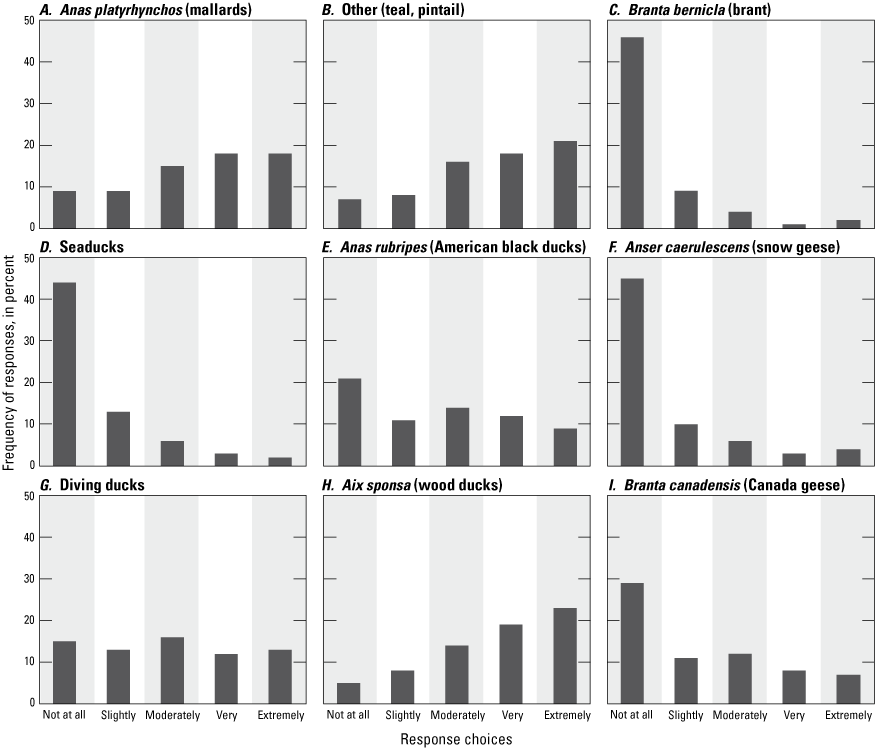
Bar graphs showing the frequency of responses (in percent) of the importance of waterfowl species to respondents in the Atlantic subflyway. A, Anas platyrhynchos (mallards). B, Other (teal, pintail). C, Branta bernicla (brant). D, Seaducks. E, Anas rubripes (American black ducks). F, Anser caerulescens (snow geese). G, Diving ducks. H, Aix sponsa (wood ducks). I, Branta canadensis (Canada geese).
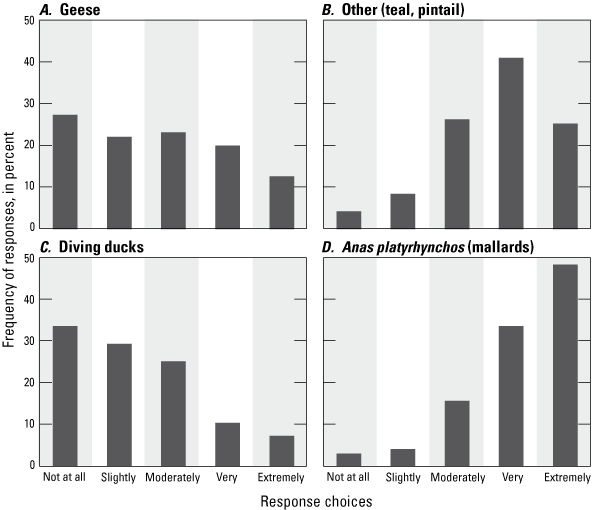
Bar graphs showing the frequency of responses (in percent) of importance of waterfowl species to respondents in the Mississippi subflyway in the Southeast United States. A, Geese. B, Other (teal, pintail). C, Diving ducks. D, Anas platyrhynchos (mallards).
Barriers to Participation
Respondents were asked about the degree to which different barriers prevented them from participating in waterfowl hunting (fig. 8A–E). There was strong agreement between respondents in both subflyways among all barriers except for the lack of available public places for waterfowl hunting (table 6). Respondents in the Atlantic subflyway (36 percent) and Mississippi subflyway (25 percent) reported that available public places for hunting was extremely low or very limiting (fig. 8E). Respondents in both subflyways differed from the national survey in several key barriers and were significantly more concerned about crowding, hunting pressure, and interference with other respondents (fig. 8B–D). Respondents in the Atlantic subflyway (43 percent) and Mississippi subflway (49 percent) reported that overcrowding was extremely or very limiting. Respondents in the Mississippi subflyway (33 percent) and Atlantic subflyways (28 percent) reported that there was too much existing hunting pressure.
Table 6.
Chi-squared test of homogeneity comparing barriers to participation in waterfowl hunting among respondents in the Mississippi and Atlantic subflyways, the Mississippi subflyway and the national survey, and the Atlantic subflyway and the national survey.[X2, chi-squared statistic; p, p-value; ϕ2, effect size; <, less than; *, low effect size]
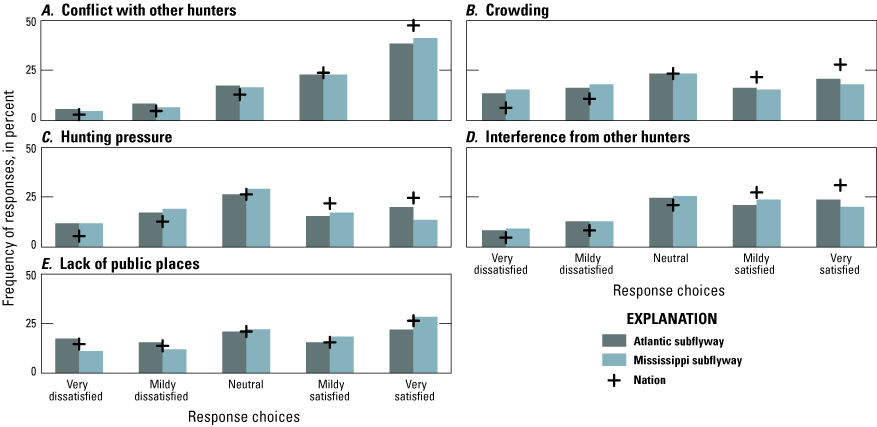
Bar graphs showing the frequency of responses (in percent) for Atlantic and Mississippi subflyway respondents’ perceptions of the degree to which barriers limit participation in waterfowl hunting. A, Conflict with other hunters. B, Crowding. C, Hunting pressure. D, Interference from other hunters. E, Lack of public places.
The least limiting barrier among all respondents was conflict with other respondents. Respondents in both subflyways (67 percent) reported that conflict with other hunters was slightly or not at all limiting, which was a much larger proportion in the national survey response (5 percent; fig. 8A). Although, interference from other respondents was a more pressing concern to respondents in the two subflyways than the national survey, at least half of the respondents reported interference was only moderately, or less, concerning.
Preferences for Regulations
When respondents were asked about their preferences for waterfowl hunting regulations and policy, there were substantial differences among the Mississippi and Atlantic subflyways and the national survey responses. Harvest and harvest-related regulations were viewed differently by the subflyway respondents. The Atlantic subflyway respondents reported a slightly lower priority on larger bag limits and longer season than the Mississippi subflyway respondents (table 7). Similarly, the Mississippi subflyway respondents placed a slightly higher emphasis on larger bag limits for mallard ducks. Although there were statistically significant differences among these regulation and policy priorities, the effect sizes were low.
Table 7.
Chi-squared test of homogeneity comparing respondents’ priorities for annual waterfowl regulations among respondents in the Mississippi and Atlantic subflyways, the Mississippi subflyway and the national survey, and the Atlantic subflyway and the national survey.[X2, chi-squared statistic; p, p-value; ϕ2, effect size; <, less than; *, low effect size]
The differences between respondents in the Mississippi and Atlantic subflyways were most pronounced (very high and very low differences) when they were asked about mallard-specific bag limits (fig. 9A–G). In the Mississippi subflyway, 12 percent of respondents reported that the largest drake mallard limits were a very high priority, and only 5 percent reported that it was a very low priority (fig. 9E). Compared with the Atlantic subflyway, only 6 percent of respondents reported that it was a very high priority, and 10 percent reported that it was very low. Among regulatory priorities where there was agreement between the subflyways, the largest possible waterfowl populations and simpler regulations were the highest priorities and ~80 percent (Mississippi subflyway) and ~65 percent (Atlantic subflyway) of respondents selected “high” or “very high.” Despite an emphasis on simpler regulations, most respondents in both subflyways moderately prioritized the largest possible bag limits and fewer species-specific limits (fig. 10A).
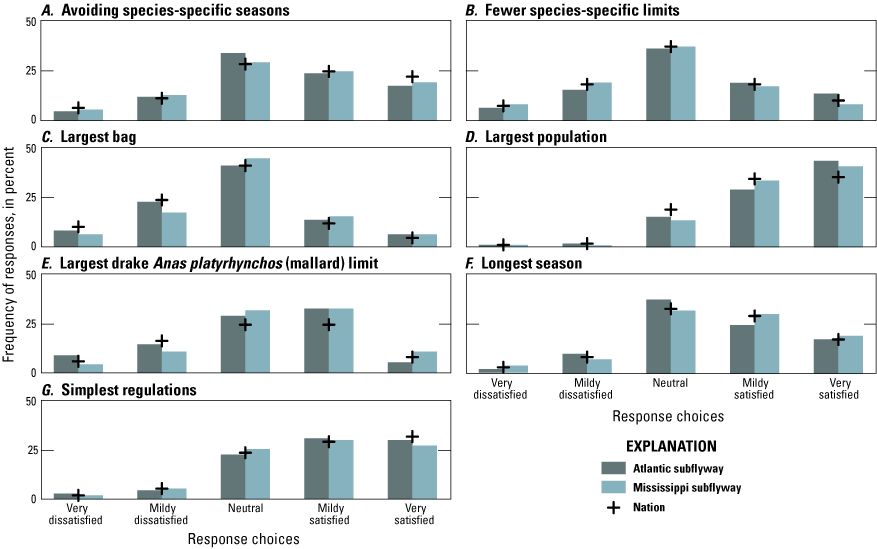
Bar graphs showing the frequency of responses (in percent) for Atlantic and Mississippi subflyway respondents’ prioritization of various annual waterfowl regulations in the Atlantic and Mississippi subflyways. A, Avoiding species-specific seasons. B, Fewer species-specific limits. C, Largest bag. D, Largest population. E, Largest drake Anas platyrhynchos (mallard) limit. F, Longest season. G, Simplest regulations.
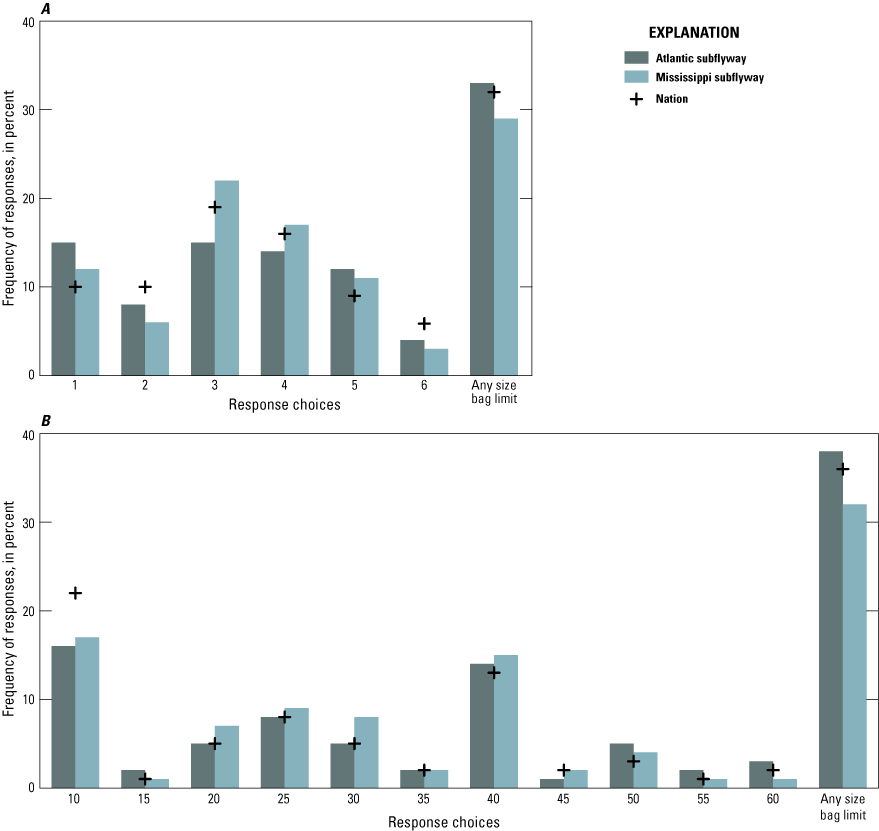
Bar graphs showing the frequency of responses (in percent) for Atlantic and Mississippi subflyway respondents of A, smallest daily bag limit identified by respondents before deciding to no longer hunt ducks and B, minimum number of days in a waterfowl hunting season a hunter would accept before no longer hunting.
Identifying when regulatory changes might result in lower participation can be an important measure of regulatory preferences. Respondents were asked about the potential to not participate in waterfowl hunting based on changes to bag limits and hunting season length. Although there were subtle differences between the two subflyways, respondents’ preferences were still in line with the national survey responses (table 8; fig. 10A, B). Although the specific bag limit that respondents reported they would stop participating at differed between the two subflyways, Atlantic subflyway respondents (78 percent) and Mississippi subflyway respondents (80 percent) reported that they would stop participating in waterfowl hunting if bag limits decreased to three or fewer birds (fig. 10A).The same phenomena were observed when it came to season length and most respondents in either subflyway chose to stop participating if there were seven or fewer days in the season (fig. 10B). When respondents were asked about how challenging species-specific regulations were to comply with or understand, there were some differences in the magnitude of responses between the Mississippi and Atlantic subflyways. Overall, most respondents felt that the regulations were not difficult to understand or comply with in the field. More respondents in the Mississippi subflyway than in the Atlantic subflyway believed that species-specific regulations are not difficult to comply with or understand (table 9; fig. 11A, B).
Table 8.
Chi-squared test of homogeneity comparing respondents’ preferences for regulations among respondents in the Mississippi and Atlantic subflyways, the Mississippi subflyway and the national survey, and the Atlantic subflyway and the national survey.[X2, chi-squared statistic; p, p-value; ϕ2, effect size; <, less than; *, low effect size]
Table 9.
Fisher’s exact test comparing preferences for regulations among respondents in the Mississippi and Atlantic subflyways, the Mississippi subflyway and the national survey, and the Atlantic subflyway and the national survey.[p, p-value; OR, odds ratio; CI, confidence interval; <, less than; *, low effect size; **, medium effect size]
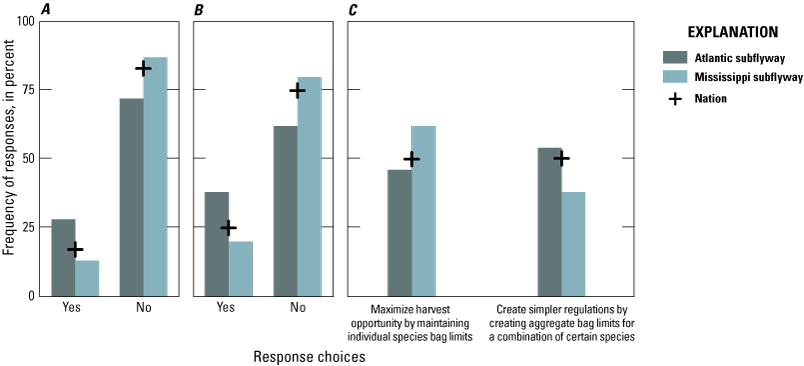
Bar graphs showing the frequency of responses (in percent) for Atlantic and Mississippi subflyway respondents A, beliefs of the difficulty to understand current species-specific bag limits for waterfowl, B, whether the respondent believes the current species-specific bag limits for waterfowl are difficult to comply with in the field, and C, hunter preference for bag limit regulations for duck species that typically have smaller bag limits.
There was clear disagreement between respondents in the Mississippi and Atlantic subflyways when it came to preferences for regulation intentions (table 9; fig. 11C). The Mississippi subflyway respondents showed a clear preference for regulations that maximize harvest opportunity by maintaining individual species regulations (62 percent) relative to the Atlantic subflyway respondents, who preferred simpler aggregate regulations even at the expense of harvest opportunity (54 percent). The subflyway respondents differed in these opinions from the national survey response, which was split equally between each preference (fig. 11C).
Identity and Connection to Waterfowl Hunting
Like avidity, asking recreation participants how strongly they identify with aspects of an activity can be an effective way to measure their involvement in that activity (Arlinghaus and others, 2020). Measuring connections to an activity or how central it is to the respondent’s sense of self describes how important it is to that person’s life or even how they view themselves and want others to perceive them. Respondents were asked to describe how strongly they identify with various aspects of waterfowl recreation and waterfowl hunting.
There was strong agreement among subflyway respondents when it came to identifying themselves with waterfowl and wetland-related activities (fig. 12A–E); ~65 percent of all respondents strongly or very strongly identified as duck hunters (fig. 12C). This result was also true for respondents who identified as “conservationists” and as “goose hunters” despite slight differences in the extremes (very low or very high). Few respondents identified as “birdwatchers” or “other hunter” and at least 22 percent of respondents reported that they do not identify with those activities at all. There was a key difference in respondents who identified as “other hunter.” Respondents in both subflyways were less likely to strongly identify as “other hunter” than a respondent in the national survey, and the Atlantic subflyway respondents were least likely to identify as “other hunter” (table 10).
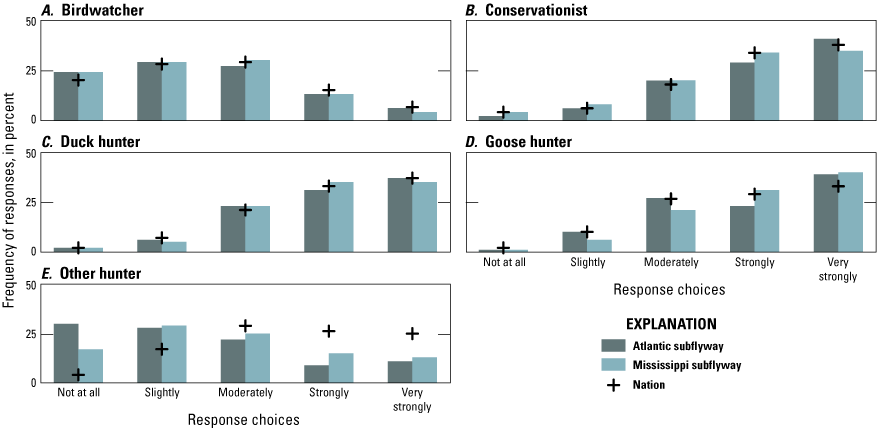
Bar graphs showing the frequency of responses (in percent) of how strongly Atlantic and Mississippi subflyway respondents identified with waterfowl and wetland-related identities. A, Birdwatcher. B, Conservationist. C, Duck hunter. D, Goose hunter. E, Other hunter.
Table 10.
Chi-squared test of homogeneity comparing how respondents self-identified with waterfowl and wetland-related activities among respondents in the Mississippi and Atlantic subflyways, the Mississippi subflyway and the national survey, and the Atlantic subflyway and the national survey.[X2, chi-squared statistic; p, p-value; ϕ2, effect size; <, less than; *, low effect size; ** medium effect size]
Respondents were asked about how central or how much of a central role waterfowl hunting has in their lives (table 11; fig. 13A–C). Similarly, about 30 percent of respondents in both subflyways were neutral when asked whether waterfowl hunting was central to their life or if they organize their life around it. About half of the respondents in both subflyways disagreed or strongly disagreed that they would not know what to do if they could not go waterfowl hunting. Respondents in the Mississippi subflyway felt stronger than Atlantic subflyway respondents that waterfowl hunting played a central role in their lives ().
Table 11.
Chi-squared test of homogeneity comparing an emotional connection to waterfowl hunting among respondents in the Mississippi and Atlantic subflyways, the Mississippi subflyway and the national survey, and the Atlantic subflyway and the national survey.[Topics are questions taken directly from Patton (2021). X2, chi-squared statistic; p, p-value; ϕ2, effect size; <, less than; *, low effect size]
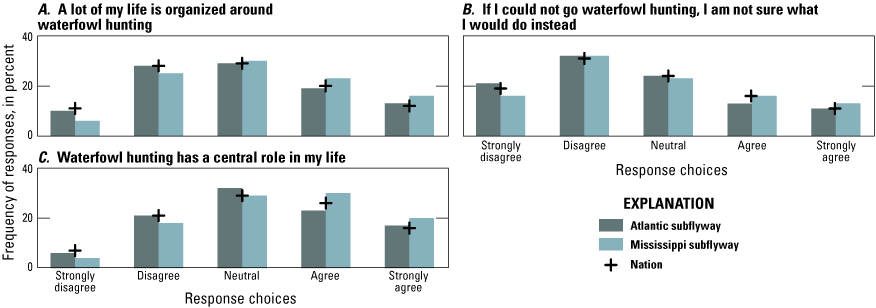
Bar graphs showing the frequency of responses (in percent) of how strongly Atlantic and Mississippi subflyway respondents agreed with statements (Patton, 2021) on how much waterfowl hunting means to them. A, A lot of my life is organized around waterfowl hunting. B, If I could not go waterfowl hunting, I am not sure what I would do instead. C, Waterfowl hunting has a central role in my life.
Participation and Trust in Organization
It is important to understand and describe participation in waterfowl and wetland-related organizations because it can be indicative of stronger social connections to an activity and provide information for the best avenues for communication and outreach. Respondents were asked how involved they were in common waterfowl hunting organizations, such as Ducks Unlimited and Delta Waterfowl (table 12; fig. 14A–C). Overall, respondents were not particularly active in any of the organizations and more than 70 percent of respondents in either subflyway suggesting that they are not involved in Delta Waterfowl or other regional waterfowl associations. Ducks Unlimited had the highest involvement for both subflyways and about half of all respondents had some involvement.
Table 12.
Chi-squared test of homogeneity comparing involvement of waterfowl hunters in waterfowl-related organizations among respondents in the Mississippi and Atlantic subflyways, the Mississippi subflyway and the national survey, and the Atlantic subflyway and the national survey.[X2, chi-squared statistic; p, p-value; ϕ2, effect size; <, less than; *, low effect size]
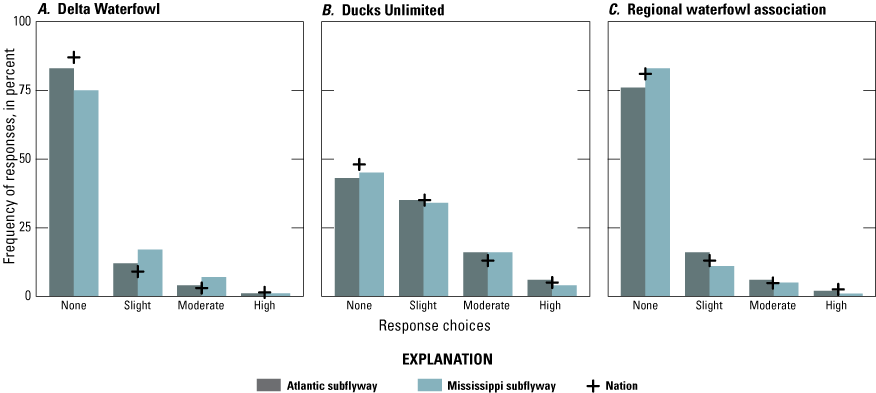
Bar graphs showing the frequency of responses (in percent) of degree of involvement of Atlantic and Mississippi subflyway respondents in waterfowl-related organizations in the past 12 months. A, Delta Waterfowl. B, Ducks Unlimited. C, Regional waterfowl association.
Describing the trust that respondents have in waterfowl-related organizations is imperative to understanding how communication and outreach are likely perceived (table 13; fig. 15A-G). Waterfowl hunting and conservation organizations were the most trusted organizations across both subflyways and about half of all respondents trusted them a lot or completely (fig. 15G). Similarly, Federal and State wildlife agencies and university researchers were also well trusted with 35–45 percent of respondents trusting them either a lot or completely; the only entity that respondents largely did not trust was elected officials (fig. 15C, E, F). Respondents in the Atlantic subflyway had less trust for elected officials than respondents in the Mississippi subflyway with 41 percent and 35 percent, respectively, stating that they did not trust them at all. A low effect size also confirmed differences between the Atlantic and Mississippi subflyways, which related to birding and bird conservation organizations and other conservation organizations.
Table 13.
Chi-squared test of homogeneity comparing perceived trust in organizations expressed by waterfowl hunters among respondents in the Mississippi and Atlantic subflyways, the Mississippi subflyway and the national survey, and the Atlantic subflyway and the national survey.[X2, chi-squared statistic; p, p-value; ϕ2, effect size; <, less than; *, low effect size]
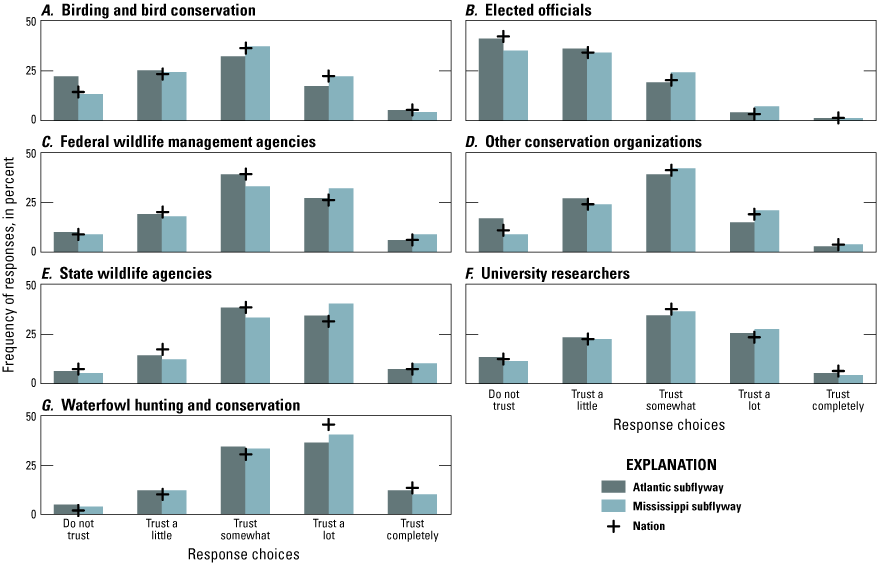
Bar graphs showing the frequency of responses (in percent) of perceived trust expressed by Atlantic and Mississippi subflyway respondents that each organization will keep respondents’ best interests in mind. A, Birding and bird conservation. B, Elected officials. C, Federal wildlife management agencies. D, Other conservation organizations. E, State wildlife agencies. F, University researchers. G, Waterfowl hunting and conservation.
Another aspect of involvement in a recreational activity beyond waterfowl or wetland-related organizations is how involved participants are in peripheral activities that relate to or support the activity. For waterfowl hunting, these activities are often conservation behaviors that are tied to protecting waterfowl or preserving waterfowl-related habitat. Respondents did not often participate in these conservation behaviors, and more than half of all respondents stated that they never participated in these activities (table 14; fig. 16A–F). The only exception was voting for candidates or ballot issues that support waterfowl and wetland conservation where only ~43 percent of all respondents stated they never participate. Similarly, the conservation behavior that was participated in the least was contacting elected officials or agencies with 74 percent of all respondents stating they never participate (fig. 16C). There were no differences among respondents in both Mississippi and Atlantic subflyways and the rest of the national response (table 8).
Table 14.
Chi-squared test of homogeneity comparing involvement of waterfowl hunters in wetlands and waterfowl conservation activities among respondents in the Mississippi and Atlantic subflyways, the Mississippi subflyway and the national survey, and the Atlantic subflyway and the national survey.[X2, chi-squared statistic; p, p-value; ϕ2, effect size; <, less than]
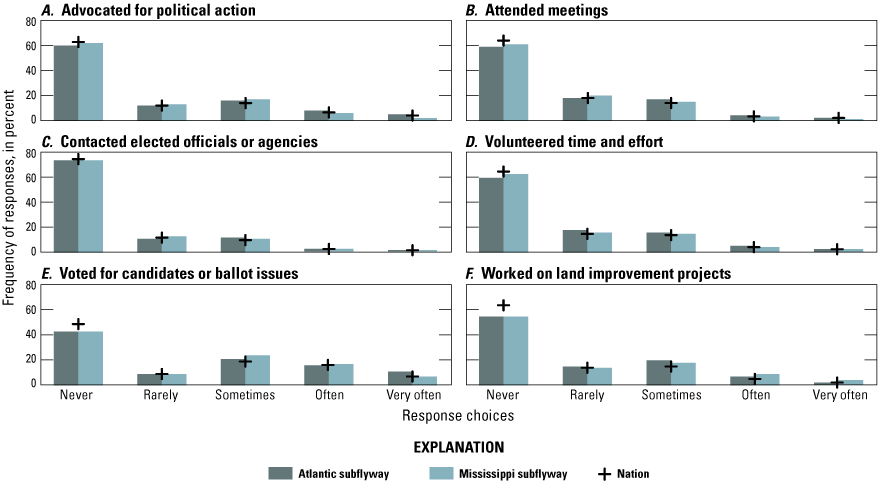
Bar graphs showing the frequency of responses (in percent) for Atlantic and Mississippi subflyway respondents’ involvement in wetlands or waterfowl conservation activities in the past 12 months. A, Advocated for political action. B, Attended meetings. C, Contacted elected officials or agencies. D, Volunteered time and effort. E, Voted for candidates or ballot issues. F, Worked on land improvement projects.
Demographics
The demographics of respondents in the Southeast fit closely with those demographics that are observed nationally in waterfowl hunting (Patton, 2018). The median age for respondents from both subflyways was 45 years old, and most respondents were between 35 and 55 years old (fig. 17A). Similarly, almost all respondents were male and only 4 percent female in the Atlantic subflyway and 2 percent in the Mississippi subflyway (table 15; fig. 17B). Slightly more respondents in the Mississippi subflyway achieved bachelor’s and graduate degrees than those in the Atlantic subflyway but the effect size was low (table 16; fig. 18A). The study did not identify a significant difference in the income of respondents between the two subflyways, and most respondents reported making less than $75,000 (fig. 18B). About 70 percent of respondents reported that their primary source of personal income did not come from a nature-related profession (fig. 18C; table 15). When assessing differences between the urban–rural gradient, where a person currently resides may be different from where they were raised. For that reason, respondents were asked where their childhood and current residence are on the urban–rural gradient. Respondents in the Mississippi subflyway were slightly more rural than respondents in the Atlantic subflyway, although the effect size was low (fig. 19A). For childhood residence, there were no statistically significant difference between the two subflyways, but the effect size was negligible, which indicates that they should be considered the same (fig. 19B).
Table 15.
Fisher’s exact test comparing demographics among respondents in the Mississippi and Atlantic subflyways, the Mississippi subflyway and the national survey, and the Atlantic subflyway and the national survey.[p, p-value; OR, odds ratio; CI, confidence interval; <, less than]
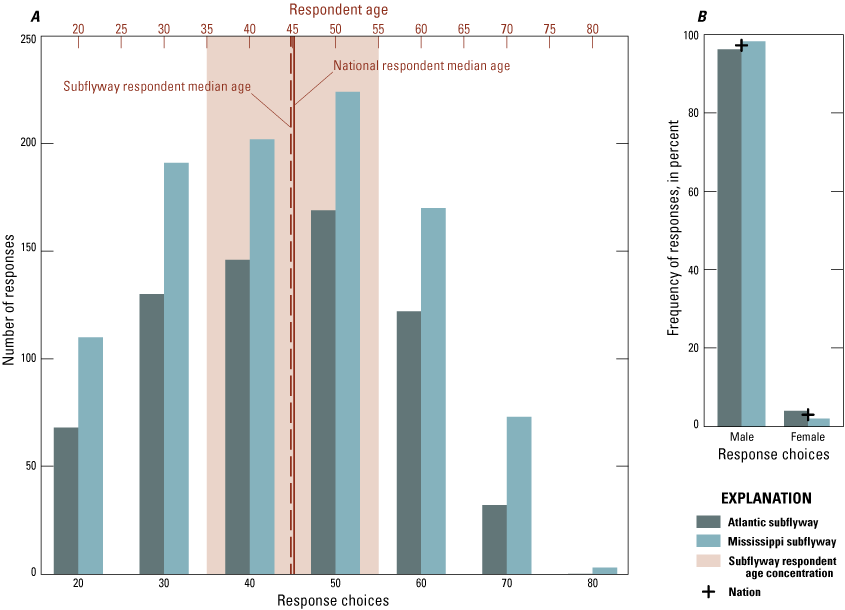
Bar graphs showing the frequency of responses (in percent) of A, ages and B, gender among Atlantic and Mississippi subflyway respondents. The Atlantic and Mississippi subflyway median age was 45 years old and the national median age was 47 years old.
Table 16.
Chi-squared test of homogeneity comparing demographics among respondents in the Mississippi and Atlantic subflyways, the Mississippi subflyway and the national survey, and the Atlantic subflyway and the national survey.[X2, chi-squared statistic; p, p-value; ϕ2, effect size; <, less than; *, low effect size]
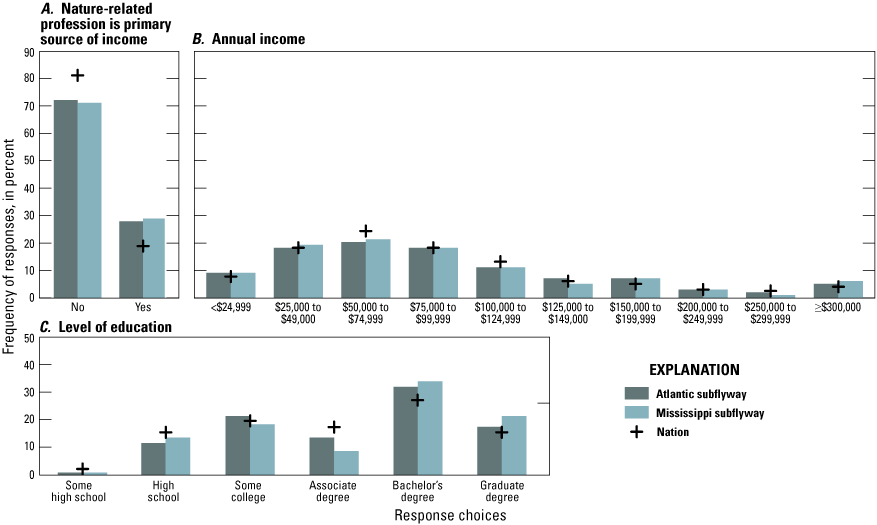
Bar graphs showing the frequency of responses (in percent) for Atlantic and Mississippi subflyway respondents A, nature-related profession as the primary source of income, B, annual income, and C, level of education they completed. <, less than; ≥, greater than or equal to
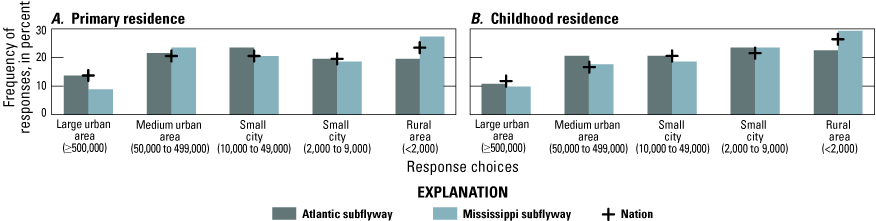
Bar graphs showing the frequency of responses (in percent) for Atlantic and Mississippi subflyway respondents A, current primary residence and B, childhood residence with the urban–rural gradient. ≥, greater than or equal to; <, less than
Waterfowl Hunting Trip Preferences
Understanding preferences for waterfowl hunting trips is useful for managers who are considering options for allocating management resources and making regulatory decisions. One of the most effective methods for describing preferences for any outdoor recreational activity is discrete choice experiments (DCE; Ryan and others, 2008). A DCE is a form of statistical modeling framework called choice models that originates from an economics theory that assumes people will seek to maximize their own enjoyment (in other words, utility; McFadden, 1972). These types of models use hypothetical scenarios with strategically designated attributes and levels that are presented in a way that preference for each attribute can be predicted relative to all others included in the experiment. Respondents are asked to select their most preferred scenarios relative to other combinations of attributes across many different iterations, which allows researchers to estimate the importance and utility of each attribute and its levels.
Each respondent was asked 10 individual DCE questions with predetermined attributes and levels so that each combination was asked equally across all respondents. The DCE in this survey was given as a two-option experiment with an opt-out. Each respondent received and was asked to select among three options: an “a” scenario, a “b” scenario, and an “opt-out” (neither “a” nor “b”). When respondents selected the opt-out, it implied that they would rather not participate if “a” and “b” were their only two options. The attributes selected for this DCE were harvest, access difficulty, travel time, waterfowl abundance, and competition with other respondents (table 17). These attributes and their associated levels were selected based on input from respondents in 13 different qualitative workshops that were administered across the country.
Table 17.
Attributes and levels included in the discrete choice experiment, where respondents were given one of the potential levels and each of the associated attributes.[Harvest and waterfowl abundance attribute levels are measured by the number of birds. Access difficulty levels takes little effort for “easy,” some effort for “moderate,” and a lot of effort for “difficult.” min., minute]
There are several ways to estimate preference using a DCE, and most ways estimate a central preference that represents all respondents included in the experiment. The issue with using these central tendency-based solutions is the underlying assumption that the sample population is homogenous. There is substantial evidence that this is a faulty assumption and that most outdoor recreator populations are heterogenous with clearly defined groups based on circumstances, backgrounds, and motivations.
In recognition of limitations of assuming a homogenous population, we estimated waterfowl hunter preference using a method called “latent class analysis” (LCA). This method is a likelihood-based estimation method (probabilistic) that hypothesizes a certain number of groups within the overall sample population that have unique central tendencies relative to other groups (Swait, 1994). Using the hypothesized number of groups, individual estimates of preference among the included attributes and levels are obtained for each. Based on each respondents’ selections, a probability of membership to each group can be calculated.
Latent class analysis is a model-based method where standard model selection methods are applied, selecting the number of groups that account for the most uncertainty. Instead of model selection, we chose to use a more limited number of groups that are more appropriate to meet the realities of management given input from U.S. Fish and Wildlife Service decision making. We chose to use a three-group estimation that was conducted using the Sawtooth Software LCA package (Sawtooth Software, 2019). Attribute importance for each group was calculated based on the preferred attributes—attributes that had the greatest effect on a respondent’s enjoyment—that contributed most to determining which respondents were most likely in that group.
Attribute importance is best used to determine what drives heterogeneity within the population and what is effective for naming each group (fig. 20A–C). For group 1, we found that 31 percent of importance was based on lower travel time, 24 percent on increased harvest, and 22 percent on lower competition. Respondents in group 2 placed slightly less importance on travel time (25 percent) but much more importance on decreased competition (40 percent). Respondents in group 3 placed much more importance on increased harvest (43 percent) and less importance on travel time (21 percent) and competition than respondents in groups 1 and 2. Based on these results, group 1 is more of a generalist group that places similarly high importance on multiple attributes (fig. 20A). Group 2 is characterized by being averse to competition and is likely to value seclusion more than other attributes (fig. 20B). Group 3 is comprised of harvest-driven individuals whose enjoyment is largely based on the number of birds they can harvest (fig. 20C). Once groups are determined, positive or negative changes in respondent enjoyment in each group can be visualized (fig. 21A–C). Enjoyment is visualized using part-worth utility, which is a hypothetical, unitless measure that expresses enjoyment such that as values increase, so does enjoyment of individuals in the group. The enjoyment values are additive, which means that a cumulative utility value can be calculated by measuring the part-worth utility values for each attribute that respondents are likely to experience and adding them together. Therefore, a key aspect of the utility for each attribute is the level where it changes to a negative value because this level is where enjoyment begins to decrease for group members.
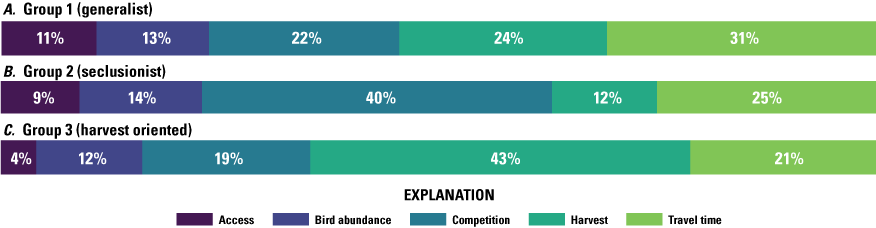
Graphic showing the relative importance of attributes in determining group membership of respondents for A, group 1 (generalists), B, group 2 (seclusionists), and C, group 3 (harvest oriented). The percentages correspond to how much each attribute contributed to the overall preference for each group. %, percent
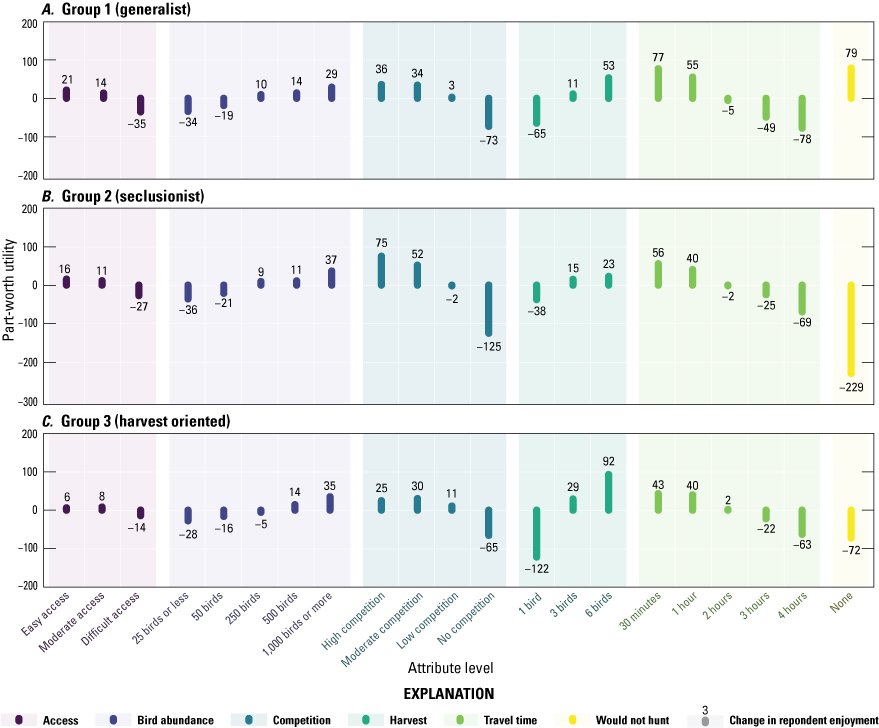
Graphic showing the part-worth utility (a hypothetical, unitless measure of enjoyment) of attributes and associated levels evaluated by members (respondents) in A, group 1 (generalists), B, group 2 (seclusionists), and C, group 3 (harvest oriented). The values for each attribute and level are additive; negative values represent decreasing enjoyment and positive values increasing enjoyment.
For the generalists (group 1), travel time was the most important attribute and distance traveled more than 2 hours is where generalists begin to experience less enjoyment for the trip (fig. 21A). The same was true for respondents in the seclusionists (group 2; fig. 21B). The harvest-oriented respondents (group 3) did not experience negative utility until 3 hours, which means they can be expected to go farther more consistently (fig. 21C). This information helps decisionmakers because they can expect that many respondents are unlikely to travel farther than 2 hours for a single trip.
The range of part-worth utility can be evaluated between the lowest level and the highest level for each group. For example, evaluating the enjoyment that members of each group obtain from increasing harvest shows the seclusionist group experiences relatively little change in utility in comparison to the harvest-oriented group who experience a drastic increase in enjoyment for each additional bird harvested (fig. 21B, C). This is an important finding given that levels of enjoyment were not strongly positive or negative among any of the groups for two related attributes—bird abundance and access. This finding would imply that these attributes are less important than others attributes in the DCE because they contribute little to overall enjoyment for respondents.
Finally, “None” represented the choice each respondent had to opt-out rather than select one of the two scenarios that were presented (fig. 21). The choice represents the change in enjoyment that each group would experience to choose not to participate. The generalist group was the only group that had a positive utility for not participating, which implies that they are also more likely to not participate if the other attributes that are available are suboptimal. The seclusionist group expressed a substantial negative utility by choosing not to participate, which indicates that a substantial part of their total utility is derived just from participating and are likely to participate no matter what other attributes they perceive to be available (fig. 21B).
Respondents in both subflyways and all three latent groups were most likely currently living in a rural area (fig. 22A–C). The urban–rural gradient of current residence was not predictive of preference among the surveyed respondents and was similar across the three latent groups; rural seclusionists were the most prevalent group in both subflyways (fig. 22B). The harvest-oriented group was the least prevalent in both subflyways, but it is important to recognize that increasing harvest was important to all groups of respondents, as shown by the increasing part-worth utility for the increased harvest attribute in figure 21. The harvest-oriented group placed a larger importance on increased harvest relative to other attributes and will benefit more by achieving increased harvest (fig. 21C).
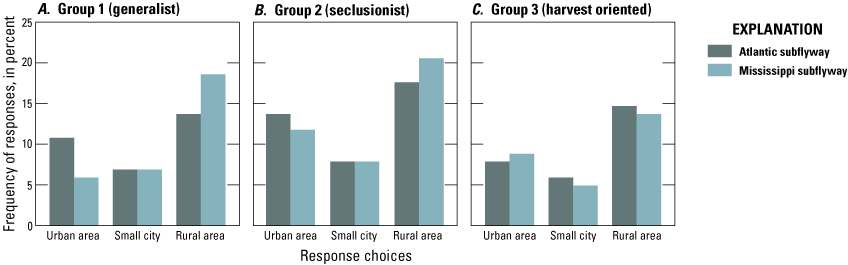
Bar graphs showing the Atlantic and Mississippi subflyway respondents’ preferences, by A, group 1 (generalists). B, group 2 (seclusionist), and C, group 3 (harvest oriented), in relation to the urban–rural gradient of the respondent’s current residence.
Social Connections to Waterfowl and Wetland Conservation
The number of social ties to an outdoor recreational activity a person possesses measures how important that activity is to a respondent and their overall involvement. Social connections correspond to concepts around social capital and networks. Social capital can refer to a variety of functions, but all incorporate some aspect of the respondent’s social network and the corresponding actions of individuals within that network. Although social capital is often represented as social goods (for example, relevant information, education, or training related to a subject), it can also represent the positive value or status gained within one’s social network from showing behaviors that are positively associated with certain activities, professions, or organizations related to that activity. As the number of social ties increases, the more social value an individual would be expected to gain from showing behaviors closely connected to the activity being considered. There are different forms of social ties, such as relatives, close friends, or acquaintances. People are generally more emotionally invested in family and close friends, so these social ties are considered stronger than ties like acquaintances.
Respondents were asked to report whether they had at least one acquaintance, close friend, or relative who participated in a range of 24 activities, professions, or organizations related to waterfowl hunting. The following options were provided for activities:
The following options were provided for professions:-
• Farmer and rancher,
-
• National park manager,
-
• State park manager,
-
• Outdoor educator,
-
• Federal wildlife manager,
-
• State wildlife manager,
-
• Wildlife artist,
-
• Wildlife photographer, and
-
• Wildlife biologist.
-
• Fishing and fish conservation organizations,
-
• Birding and birdwatching groups,
-
• Bird conservation groups,
-
• Ornithological societies and groups,
-
• Ducks Unlimited,
-
• Delta Waterfowl,
-
• State or regional waterfowl associations,
-
• National hunting and conservation organizations,
-
• Regional and local hunting and conservation organizations,
-
• Naturalist organizations, and
-
• National or internal conservation organizations.
Respondents in the Mississippi subflyway had more social ties overall to waterfowl hunting-related categories than respondents in the Atlantic subflyway (figs. 23, 24). In the Mississippi subflyway, 43 percent of respondents had between 6 and 13 strong social ties as compared to only 33 percent of respondents in the Atlantic subflyway. Mentorship and facilitating hunting for others were additional aspects of social connections that respondents were asked about. Respondents were asked if they had taken anyone who had not hunted waterfowl in the previous year. Responses were similar across both subflyways and just greater than 50 percent of respondents reported that they had not done so (fig. 25).
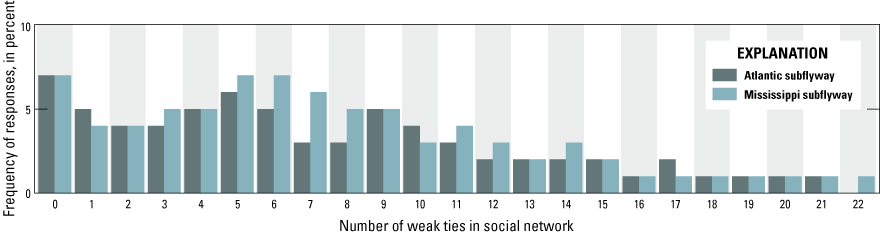
Bar graph showing the frequency of responses (in percent) for Atlantic and Mississippi subflyway respondents who had weak social ties (in other words, acquaintances) to conservation-related individuals and positions.
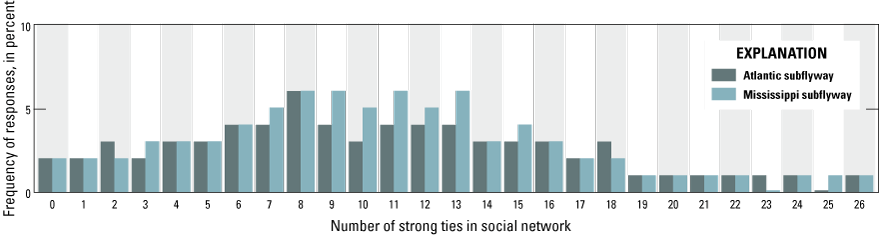
Bar graph showing the frequency of responses (in percent) for Atlantic and Mississippi subflyway respondents who had strong social ties (in other words, friends and family) to conservation-related individuals and positions.
Bar graph showing the frequency of responses (in percent) for whether Atlantic and Mississippi subflyway respondents took anyone hunting who had not hunted waterfowl in the previous year (2016 hunting season).
Conclusions
Incorporating social science information into wildlife management is continually recognized as an important step for the future success of increasingly challenging ecological circumstances. This study sought to support incorporating human dimensions into waterfowl management by subsetting national-scale survey data of respondents to inform waterfowl management in the Southeast region. Respondents in the Atlantic and Mississippi subflyways held many of the same perceptions, and there were many similarities between the subflyways and respondents from the national survey. Therefore, it may be beneficial to treat the Southeast region as a single management unit when considering management objectives tied to the preferences of respondents.
Respondents in the Mississippi subflyway often differed in their perceptions of harvest and harvest regulations, and consistently placed a higher importance on harvest and regulations that support harvesting more birds. When assessing preferences for trip characteristics, three basic groups were found: generalists, seclusionists, and harvest oriented. Mississippi subflyway respondents were not consistently placed in the harvest-oriented group despite the clear importance placed on harvest. This result is likely because the harvest-oriented group benefited more from increasing harvest than other groups, but they all continue to benefit from increasing harvest. Overall, respondents in the Southeast region had similar perceptions of waterfowl management, and the same management decisions may be justified for the two subflyways because survey responses did not differentiate between the two. Where respondents did differ in their perceptions among the Atlantic subflyway, the Mississippi subflyway, and the national survey, the effect sizes were generally low, and waterfowl managers should carefully consider those differences when incorporating them into their decision-making processes.
References Cited
Arlinghaus, R., Beardmore, B., Riepe, C., and Pagel, T., 2020, Species-specific preference heterogeneity in German freshwater anglers, with implications for management: Journal of Outdoor Recreation and Tourism, v. 32, art. 100216, 14 p., accessed July 22, 2022, at https://doi.org/10.1016/j.jort.2019.03.006.
Bilder, C.R., and Loughin, T.M., 2014, Analysis of categorical data with R (1st ed.): New York, CRC Press, 547 p. [Also available at https://doi.org/10.1201/b17211.]
Brunke, K.D., and Hunt, K.M., 2008, Mississippi waterfowl hunter expectations, satisfaction, and intentions to hunt in the future: Human Dimensions of Wildlife, v. 13, no. 5, p. 317–328, accessed July 22, 2022, at https://doi.org/10.1080/10871200802227422.
Hinrichs, M.P., Price, N.B., Grunterod, M.P., Pope, K.L., Fontaine, J.J. and Chizinski, C.J., 2020, Understanding sportsperson retention and reactivation through license purchasing behavior: Wildlife Society Bulletin, v. 44, no. 2, p. 383–390, accessed July 22, 2022, at https://doi.org/10.1002/wsb.1088.
McFadden, D., 1972, Conditional logit analysis of qualitative choice behavior: University of California, Berkley eScholarship, working paper no. 199/BART 10, 58 p., accessed July 22, 2022, at https://escholarship.org/uc/item/61s3q2xr.
North American Waterfowl Management Plan [NAWMP], 2012, North American Waterfowl Management Plan 2012—People conserving waterfowl and wetlands: North American Waterfowl Management Plan, 70 p., accessed July 22, 2022, at https://nawmp.org/document/2012-nawmp-plan-people-conserving-waterfowl-and-wetlands.
Patton, S., 2018, National survey of respondents—Nationwide and flyway comparisons: National Flyway Council, prepared by the Minnesota Cooperative Fish and Wildlife Research Unit and University of Minnesota, St. Paul, Minn., 167 p., accessed July 22, 2022, at https://nawmp.org/sites/default/files/2021-03/National%20Waterfowl%20Hunter%20Survey.pdf.
Patton, S., 2021, National survey of birdwatchers—Nationwide and flyway comparisons: National Flyway Council, prepared by the Minnesota Cooperative Fish and Wildlife Research Unit and University of Minnesota, St. Paul, Minn., 141 p., accessed July 22, 2022, at https://nawmp.org/sites/default/files/2021-03/National%20Birdwatcher%20Survey.pdf.
Ryan, M., Gerard, K., and Amaya-Amaya, M., eds., 2008, Discrete choice experiments in a nutshell, in Using discrete choice experiments to value health and health care: Amsterdam, Netherlands, Springer, p. 13–46. [Also available at https://doi.org/10.1007/978-1-4020-5753-3_1.]
Salz, R.J., Loomis, D.K., and Finn, K.L., 2001, Development and validation of a specialization index and testing of specialization theory: Human Dimensions of Wildlife, v. 6, no. 4, p. 239–258, accessed July 22, 2022, at https://doi.org/10.1080/108712001753473939.
Sawtooth Software, 2019, Latent class estimation for choice-based conjoint (ver. 4.5, 2015): Sawtooth Software data release, accessed March 2019 at https://sawtoothsoftware.com/.
Schroeder, S.A., Fulton, D.C., Cornicelli, L., Cordts, S.D., and Lawrence, J.S., 2019, Clarifying how hunt‐specific experiences affect satisfaction among more avid and less avid respondents: Wildlife Society Bulletin, v .43, no. 3, p. 455–467, accessed July 22, 2022, at https://doi.org/10.1002/wsb.1006.
Schroeder, S.A., Cornicelli, L., Fulton, D.C., and Merchant, S.S., 2018, Explicit versus implicit motivations—Clarifying how experiences affect turkey hunter satisfaction using revised importance-performance, importance grid, and penalty-reward-contrast analyses: Human Dimensions of Wildlife, v. 23, no. 1, p. 1–20, accessed July 22, 2022, at https://doi.org/10.1080/10871209.2018.1385112.
Slagle, K., and Dietsch, A., 2018a, North American birdwatching survey—Summary report Mississippi Flyway 2018: National Flyway Council, prepared by Minnesota Cooperative Fish and Wildlife Research Unit and University of Minnesota, St. Paul, Minn., 119 p., accessed July 22, 2022, at https://nawmp.org/document/north-american-birdwatching-survey-summary-report-mississippi-flyway.
Slagle, K., and Dietsch, A., 2018b, North American birdwatching survey—Summary report Atlantic Flyway: National Flyway Council, prepared by Minnesota Cooperative Fish and Wildlife Research Unit and University of Minnesota, St. Paul, Minn., 118 p., accessed July 22, 2022, at https://nawmp.org/sites/default/files/2018-03/North%20American%20Birdwatching%20Survey%20Atlantic%20Flyway%20Summary%20Report%202018.pdf.
Swait, J., 1994, A structural equation model of latent segmentation and product choice for cross-sectional revealed preference choice data: Journal of Retailing and Consumer Services, v. 1, no. 2, p. 77–89, accessed July 22, 2022, at https://doi.org/10.1016/0969-6989(94)90002-7.
Wilkins, E.J., and Miller, H.M., 2018, Public views of wetlands and waterfowl conservation in the United States—Results of a survey to inform the 2018 update of the North American Waterfowl Management Plan: U.S. Geological Survey Open-File Report 2017–1148, 134 p., accessed July 22, 2022, at https://doi.org/10.3133/ofr20171148.
Appendix 1. State-Level Information
Table 1.1.
Waterfowl hunter demographics by State.[Some college indicates no degree, an Associates degree is 2 years, and a Bachelor’s degree is 4 years. GED, general equivalency diploma; %, percent; —, no data]
Table 1.2.
Involvement of waterfowl hunters in either Delta Waterfowl or Ducks Unlimited by State.[SD, standard deviation; %, percent; —, no data]
Table 1.3.
Money donated by waterfowl hunters to different conservation causes by State.[SD, standard deviation; %, percent; —, no data]
Table 1.4.
Trust waterfowl hunters have in different conservation organizations and nonrelated entities.[SD, standard deviation; %, percent; —, no data]
Table 1.5.
Satisfaction of respondents with waterfowl hunting by State.[SD, standard deviation; %, percent; —, no data]
Table 1.6.
Barriers to waterfowl hunting participation by State as reported by respondents.[SD, standard deviation; %, percent; —, no data]
Reference Cited
Patton, S., 2021, National survey of birdwatchers—Nationwide and flyway comparisons: National Flyway Council, prepared by the Minnesota Cooperative Fish and Wildlife Research Unit and University of Minnesota, St. Paul, Minn., 141 p., accessed July 22, 2022, at https://nawmp.org/sites/default/files/2021-03/National%20Birdwatcher%20Survey.pdf.
Publishing support provided by the Science Publishing Network,
Denver Publishing Service Center
For more information concerning the research in this report,
contact the
Center Director, USGS Fort Collins Science Center
2150 Centre Ave., Bldg. C
Fort Collins, CO 80526-8118
(970) 226-9100
Or visit the Fort Collins Science Center website at:
Disclaimers
Any use of trade, firm, or product names is for descriptive purposes only and does not imply endorsement by the U.S. Government.
Although this information product, for the most part, is in the public domain, it also may contain copyrighted materials as noted in the text. Permission to reproduce copyrighted items must be secured from the copyright owner.
Suggested Citation
Cole, N., and Fulton, D., 2025, North American Waterfowl Management Plan survey regional profile—Southeast region: U.S. Geological Survey Scientific Investigations Report 2024–5102, 38 p., https://doi.org/10.3133/sir20245102.
ISSN: 2328-0328 (online)
| Publication type | Report |
|---|---|
| Publication Subtype | USGS Numbered Series |
| Title | North American Waterfowl Management Plan survey regional profile—Southeast region |
| Series title | Scientific Investigations Report |
| Series number | 2024-5102 |
| DOI | 10.3133/sir20245102 |
| Publication Date | March 03, 2025 |
| Year Published | 2025 |
| Language | English |
| Publisher | U.S. Geological Survey |
| Publisher location | Reston VA |
| Contributing office(s) | Fort Collins Science Center |
| Description | vii, 38 p. |
| Online Only (Y/N) | Y |