Estimating Domestic Self-Supplied Water Use in Rhode Island, 2014–21
Links
- Document: Report (7.07 MB pdf) , HTML , XML
- Data Release: USGS data release - Monthly and annual population and self-supplied domestic water withdrawal maps of Rhode Island, 2014–2021
- NGMDB Index Page: National Geologic Map Database Index Page (html)
- Download citation as: RIS | Dublin Core
Acknowledgments
Kathleen Crawley and Patrick Killian of the Rhode Island Water Resources Board provided useful feedback to the direction of the project. Andrew Murray (U.S. Environmental Protection Agency) and Joshua Larsen (U.S. Geological Survey) provided peer reviews of this report. The authors appreciate the feedback of the following U. S. Geological Survey employees for technical review: Joe Ayotte, Luther Schalk, Paul Barlow, Rob Dudley, and Laura Medalie, who also assisted with project development.
Abstract
Water withdrawal from private groundwater wells is often unaccounted for in water planning studies, and water from private wells can be a source of exposure to environmental contaminants. The sizes of populations that depend on private wells for domestic water use and the amounts of water that are withdrawn from these wells are generally poorly represented in data collection efforts because of the challenges of locating, metering, or gathering withdrawal information from individual property owners. To address this problem, the U.S. Geological Survey, in cooperation with the Rhode Island Water Resources Board, estimated the volume of water withdrawn from domestic self-supply wells and the populations who use them for the State of Rhode Island at a 30-meter pixel spatial resolution and one-month temporal resolution between July 2014 and June 2021.
The number of people reliant on domestic self-supply wells has increased in Rhode Island over the study period; however, the statewide estimate of total water withdrawal has not statistically increased. Withdrawals from private wells are largest in the inland areas of the western part of the State, and the towns of Scituate and Charlestown have the highest estimated withdrawals. Statewide monthly withdrawals ranged from 3.987 million gallons per day in March 2018 to 7.767 million gallons per day in September 2016. The median per capita domestic water use rate was 46.0 gallons per capita per day.
Introduction
Water for domestic use in the United States generally comes from either public water systems (PWSs) or private groundwater wells (domestic self-supply wells). Domestic water use includes water for indoor and outdoor household purposes, such as drinking, cleaning, cooking, bathing, and watering lawns and home gardens. Nationally, about 87 percent of the population is served by PWSs (Dieter and others, 2018). PWSs are generally more efficient than self-supply wells in terms of providing clean and treated water but require investment in physical infrastructure and have higher operation costs. In rural areas, investment requirements for public supply become much greater relative to the number of people served. Thus, the proportion of houses dependent on domestic self-supply wells tends to decrease as housing density increases (Johnson and others, 2019). The northeastern United States has the highest population density in the country, yet even in this region sizeable portions of the population rely on self-supply wells. Rhode Island has the second highest population density in the United States, and as much as 10 percent of the population is estimated to use self-supply wells (Johnson and others, 2022). Fifty-one percent of all estimated water withdrawals in Rhode Island in 2015 were for domestic use: 6.6 million gallons per day (Mgal/d) were from self-supply wells and 56 Mgal/d were deliveries from PWSs, out of total withdrawals of 122 Mgal/d (Dieter and others, 2018).
An understanding of which populations use self-supply wells is important for managing water resources and assessing risk from various environmental contaminants. Domestic self-supply wells may be pathways through which populations are exposed to environmental and anthropogenic contaminants, such as arsenic, uranium, pesticides, fertilizers, and hydrocarbons (Bulka and others, 2022; DeSimone and others, 2014; Lombard and others, 2021; Soriano and others, 2022). Many well owners are unaware of the risk of possible exposure through self-supply wells because these wells are not frequently tested for contaminants that do not affect the taste or clarity of the water. Additionally, withdrawals from domestic self-supply wells (or any wells) may affect, or be affected by, changes in groundwater levels from drought or competing uses (Jasechko and Perrone, 2021; Mullaney, 2004). Though withdrawals from self-supply wells represent a relatively small percentage of total domestic water use in the United States (Dieter and others, 2018), in aggregate they may be a substantial part of overall water resources available in rural areas. Furthermore, because self-supply wells are commonly shallower than public-supply wells, they are more likely to be vulnerable to declines in water-table levels and contamination than public supply wells (DeSimone and others, 2014).
Despite their importance, determining the locations of domestic self-supply wells remains a challenge. Domestic self-supply wells are largely unregulated and are not subject to the reporting requirements placed on PWSs by State and Federal Government organizations (Bowen and others, 2019). Between 1960 and 1990, household water source was reported on the long-form decennial census questionnaire, but this questionnaire was only sent to a subset of the population (one in five households in 1990), and the question about household water source was removed after 1990. Many studies still use the results of the 1990 decennial census to estimate populations who use domestic self-supply wells (Wild and Nimiroski, 2007; Johnson and Belitz, 2017; Murray and others, 2021). A snapshot of county- and State-level estimates of total domestic water use (self-supplied water withdrawals and deliveries from PWSs) for 2015 is available in Dieter and others (2018); however, we are not aware of studies that estimate domestic self-supplied water withdrawals statewide at a greater spatial resolution than counties for any State other than Maine (Ryan P. Gordon, Amber H. Whittaker, and Robert G. Marvinney, Maine Geological Survey, written commun., 2021).
The Rhode Island Water Resources Board (RIWRB) is an agency charged with managing the use and conservation of water throughout the State, including ensuring sufficient water supplies (Rhode Island General Assembly, 1956). As such, this agency has been working to amass comprehensive withdrawal information throughout Rhode Island, which is entered into the Water Use Needs, Data, and Reporting (WUNDR) database created by the RIWRB in collaboration with the University of Rhode Island and the Rhode Island Geological Survey (Rhode Island Water Resources Board, 2022). This database enables users to visualize and download water withdrawal and use information at the subwatershed scale, each of which is assigned a 12-digit hydrologic unit code (HUC12). Deliveries to domestic water users from large and small PWSs have been quantified through reporting (large PWSs report annually to the RIWRB) or through previous investigations (domestic use estimates for small PWSs were the subject of a previous study; Kathleen Crawley, RIWRB, written commun., 2022); however, withdrawals from domestic self-supply wells are not accounted for in these data. In order to provide comprehensive domestic water-use in Rhode Island, the U.S. Geological Survey, in cooperation with the RIWRB, generated data that provide estimates of the amounts of water withdrawn from domestic self-supply wells and the populations who use them (Chamberlin and Armstrong, 2024).
Purpose and Scope
The purpose of this report is to (1) provide estimates of the population served by PWSs and domestic self-supply wells in Rhode Island and (2) provide estimates of the amount of domestic self-supplied water use in Rhode Island. Seasonal population estimates for winter (January 1 to March 31 and October 1 to December 31) and summer (April 1 to September 30) and monthly domestic self-supplied water withdrawal estimates from July 2014 to June 2021 are provided as 30-meter (m) pixel raster datasets that can be aggregated to any level of interest for Rhode Island (Chamberlin and Armstrong, 2024). Results in this report are presented at scales of municipality and subwatershed (HUC12).
Data and Methods
Estimates of populations served by public supply and domestic self-supply wells were generated by updating published population information for the State of Rhode Island and by using the spatial boundaries of PWS service areas to partition the population into areas that are served by public-supply or self-supply wells. Daily per capita domestic water use rates calculated from reported PWS water-use data were combined with the updated population estimates to generate estimates of water withdrawals from domestic self-supply wells.
Population Rasters
Seasonal (summer and winter) statewide dasymetric population rasters were created by following methodology developed for Maine (Ryan P. Gordon, Amber H. Whittaker, and Robert G. Marvinney, Maine Geological Survey, written commun., 2021). Dasymetric maps reorganize map data from a collection unit (such as a census block group) into more precise areas using additional information (such as land cover; Baynes and others, 2022). Briefly stated, this method was applied to update populations from a 2010 national dasymetric raster (U.S. Environmental Protection Agency, 2016) for each season from 2014 to 2021 on the basis of U.S. Census Bureau American Community Survey 5-year (ACS5) estimates. All U.S. Census Bureau data for this project were acquired through the National Historic Geographic Information System supported by IPUMS (Manson and others, 2023).
The base 2010 national dasymetric raster was clipped to the State of Rhode Island (figs. 1 and 2). The base 2010 national dasymetric raster (U.S. Environmental Protection Agency, 2016) was generated by using the 2011 National Land Cover Database release (Homer and others, 2015) and the 2010 U.S. Census Bureau decennial census (Manson and others, 2023). The product attributed the populations reported in the 2010 decennial census for each census block group to 30-m pixels of developed land from the National Land Cover Database, as well as some additional processing that is detailed in U.S. Environmental Protection Agency (2016). Population changes were calculated for each year at the census block group level as the percent change in population between the 2010 decennial census count (on which the U.S. Environmental Protection Agency dasymetric raster was based) and the ACS5 population estimates for 2014–19 and 2021. For 2020, the estimates were taken from the 2020 decennial census count. The block group boundaries were static between 2010 and 2019, and no adjustments were made for these years. Block group boundaries were redrawn, however, for the 2020 census: some block groups were merged or split, and the boundaries of others were altered. Because the base population map was generated from the 2010 census boundaries, we remapped the 2020 and 2021 census populations to 2010 census boundaries. Using the published nationwide relationship files for 2020 and 2010 block groups (U.S. Census Bureau, 2023), we divided the 2020 boundary population values into each area of overlapping land area by assuming population was evenly distributed across land area and then recombined values on the basis of the 2010 block group associations. Block groups in Rhode Island had a median land area of 0.88 square kilometer in 2010 and 0.94 square kilometer in 2020.
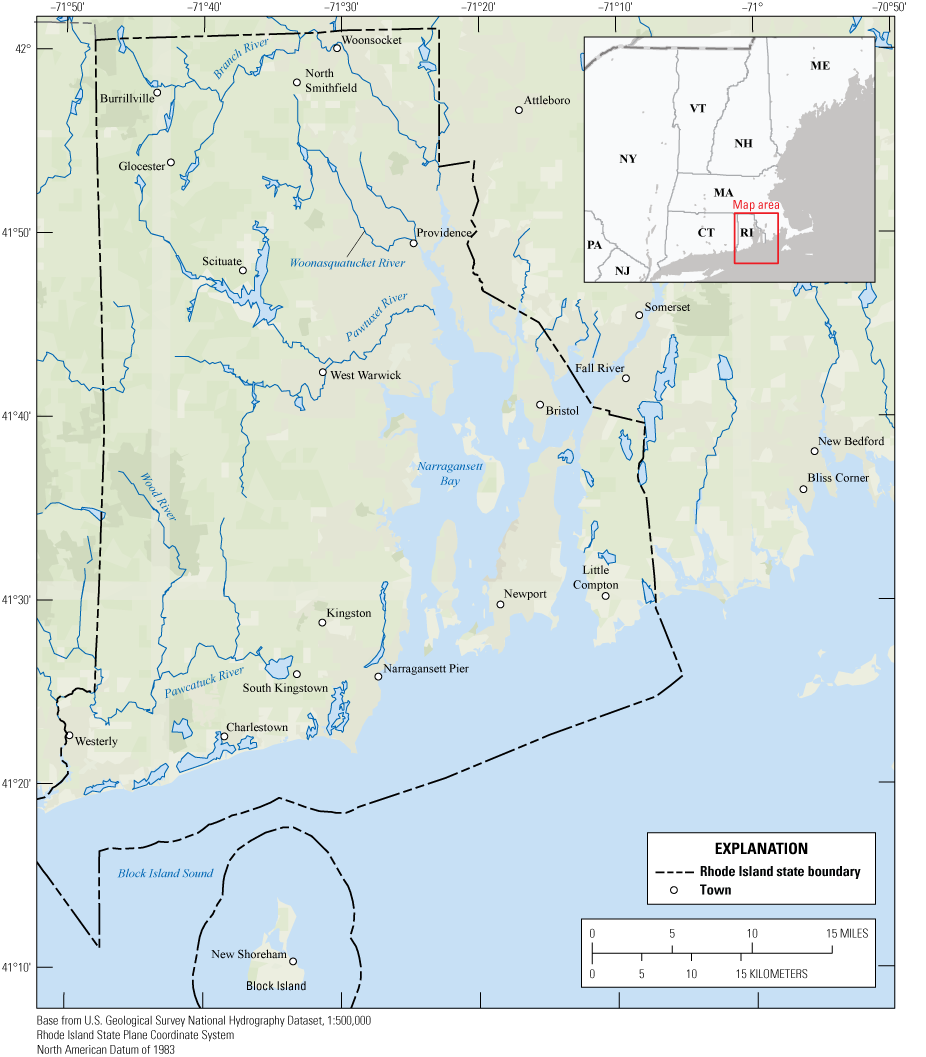
Map showing the study area, which encompasses the State of Rhode Island. The study area excludes adjacent water bodies within the State borders, such as Narragansett Bay and Block Island Sound.
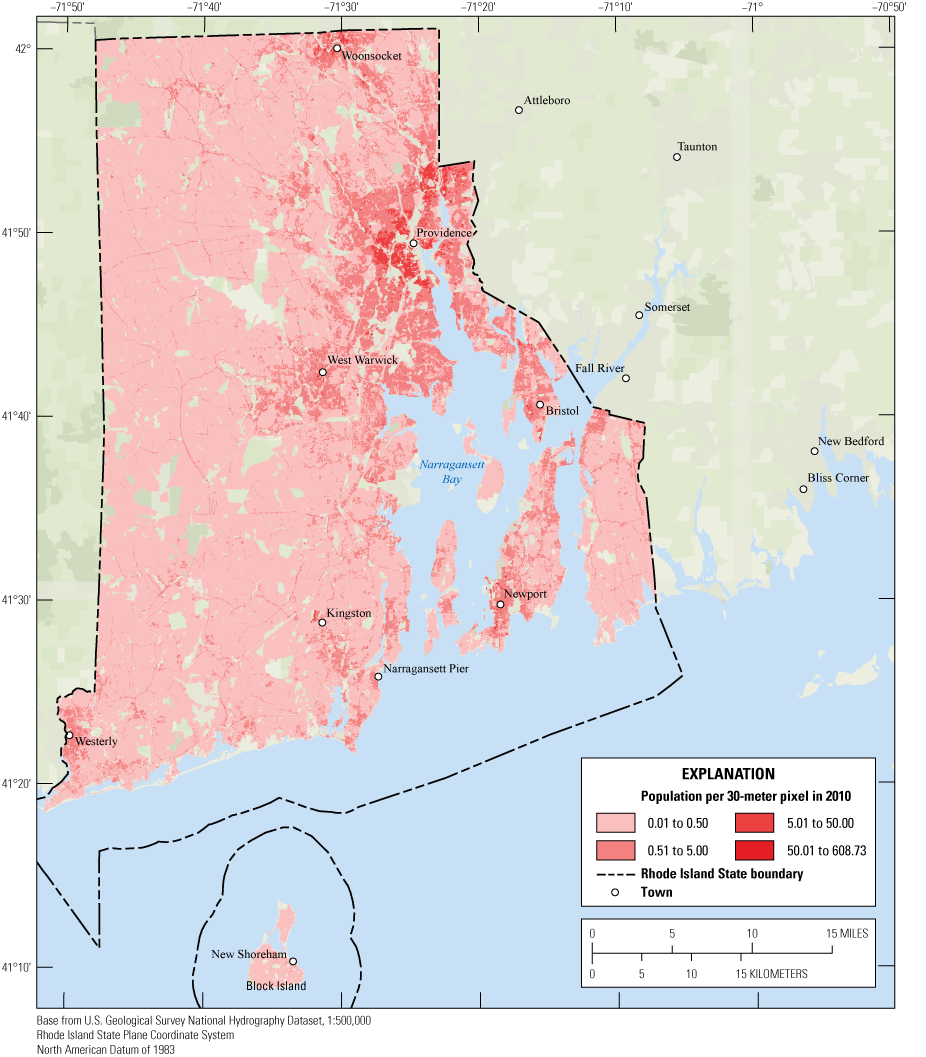
Map showing the U.S. Environmental Protection Agency 2010 dasymetric raster plotted for Rhode Island. Data from U.S. Environmental Protection Agency (2016).
Block group population estimates from the ACS5 are published yearly, but they represent the average of the 5 years leading up to the publication year. A similar product, the U.S. Census Bureau American Communities Survey 1-year (ACS1; Manson and others, 2023) was used to adjust for the 5-year averaging. The ACS1 population estimates represent the value for the reported year only; however, these estimates have a great amount of error at small spatial scales, making them unsuitable for use at subcounty scales. The ACS1 population estimates of larger areas, such as States, are more robust. To adjust the block group population estimates for the 5-year averaging in the ACS5 data, the statewide sum of each yearly dasymetric raster was compared with the published ACS1 population of Rhode Island. Then, each pixel was multiplied by a coefficient C for each year y, described as
whereP
represents the published ACS1 population for Rhode Island in year y,
d
represents the population of the dasymetric raster for pixel i and year y, and
n
is the number of pixels in the dasymetric raster of Rhode Island.
Many parts of Rhode Island, such as the coastlines of southern Rhode Island, are popular summer tourist destinations, which affects the seasonal population of these areas. For each block group, we based the amount of the seasonal population variation on ASC5 estimates (and decennial census count values for 2020) of the fraction of housing units that are classified as “vacant for seasonal recreational use.” Using the yearly dasymetric rasters as the baseline population, we assumed that the size of households vacant for seasonal recreational use were the same as the year-round households and calculated the summer population estimates for each pixel as
where After discussion with experts at the RIWRB with knowledge of seasonal tourism in Rhode Island, seasonal adjustments were applied to create summer population estimates, and year-round population estimates from the U.S. Census Bureau were used for winter population estimates (Kathleen Crawley, RIWRB, oral commun., 2022).Public Water System Boundaries
Domestic self-supply wells were assumed to be the source of water in areas of the State outside the boundaries of PWS service areas. For this analysis, boundaries for all PWS service areas in Rhode Island were used, including community (serving primarily domestic water users) and noncommunity (which may provide water for other uses as well, such as schools or businesses) boundaries. All areas within Rhode Island that were outside of PWS boundaries were assumed to be served by domestic self-supply wells. To obtain geospatial boundaries of the service areas of PWSs, we used different methods for large (defined as >50 million gallons per year) and small (defined as <50 million gallons per year and >10 connections) systems.
The boundaries of 28 large PWS service areas were obtained from the Rhode Island Geographic Information System (2022). Adjustments were made to account for the mergers of two PWSs (East Smithfield Water District and Johnston Water Control Facilities) with a larger PWS (Providence Water) during the study period (East Smithfield in 2017 and Johnston in 2020). A PWS boundary shapefile that represented 1995 system boundaries (Kathleen Crawley, RIWRB, written commun., 2020) provided historical boundaries that were used to separate the district of Johnston Water Control Facilities from Providence Water for 2014–19, and the East Smithfield Water District from Providence Water for 2014–16.
The boundaries of the small community and noncommunity PWS service areas were generated manually for this project. A list of 416 small providers in the Rhode Island Safe Drinking Water Information System (SDWIS; maintained by the Rhode Island Department of Health and accessible through the Rhode Island Drinking Water Viewer; Rhode Island Department of Health, 2024) was obtained in 2020. Metadata in SDWIS was first used to identify the general service area of a PWS; then, more precise boundaries of service areas were estimated on a building-by-building basis. Geospatial boundaries were manually drawn around clusters of buildings assumed to be within the service area for each small provider.
Service areas of large PWSs make up 50 percent of the area of Rhode Island. Service areas of the small PWSs are estimated to be 1 percent of the area of the State. The large PWSs are concentrated around the Narragansett Bay, where population density is highest (figs. 2 and 3). Small PWSs are primarily scattered throughout the western half of the State, though they can also be found on islands in the Narragansett Bay, within pockets surrounded by large PWSs, and in other parts of the State (fig. 3).
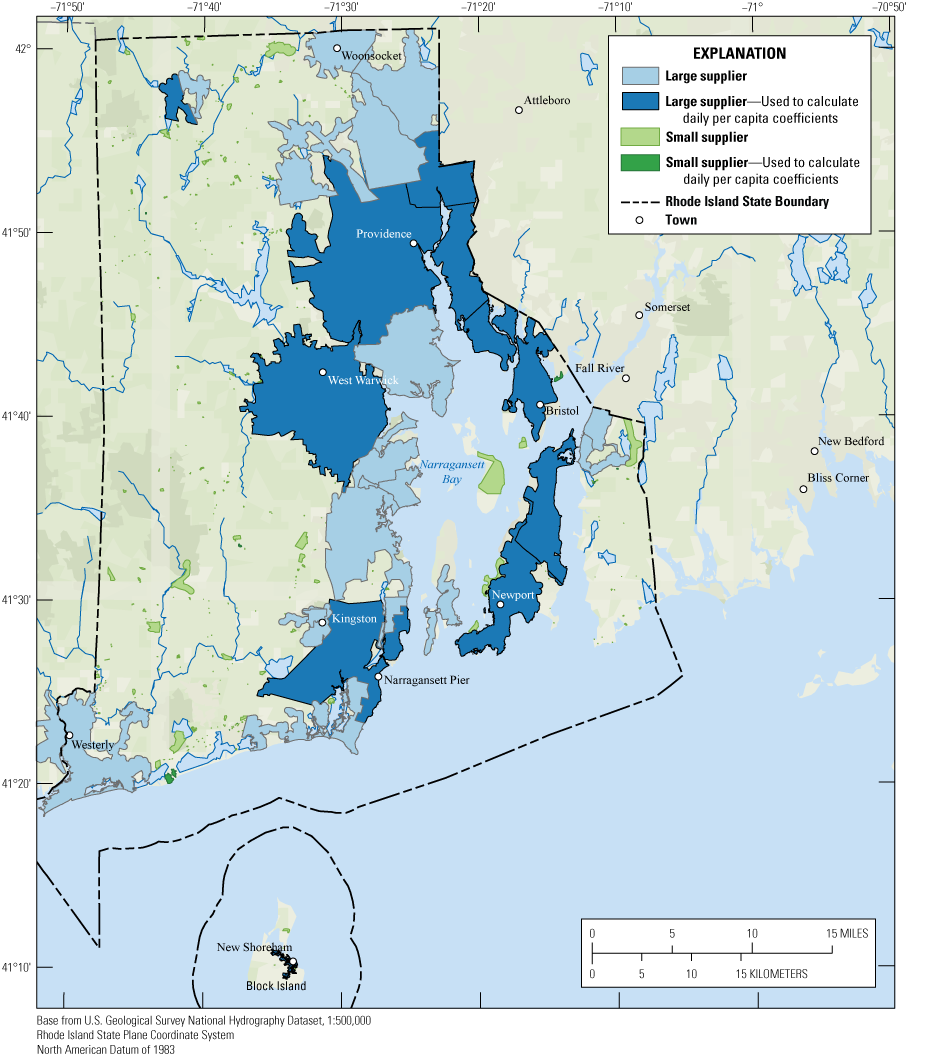
Map of public water systems in Rhode Island in 2022. Service area boundaries from Rhode Island Geographic Information System (2022) and this study.
Per Capita Rates of Water Use
Daily per capita domestic water use was calculated from available water-use data of selected PWSs throughout the State. Nineteen systems were selected on the basis of the completeness and availability of monthly residential water sales or withdrawal data for both seasons. Additional criteria for selection of representative PWSs were that (1) they were in operation in 2010 and would therefore be represented by the base 2010 dasymetric raster (U.S. Environmental Protection Agency, 2016), (2) the seasonality of reported water use matched expected patterns for domestic water use (higher in summer than winter), and (3) the calculated daily per capita residential water use coefficients did not greatly exceed those reported for domestic use in Dieter and others (2018), here defined as being >200 gallons per capita per day (gpcd). Water retail sales data for 10 large PWSs were obtained from annual reports submitted to the RIWRB. These systems serve a variety of customer types, but only the sales to residential customers (including both single and multi-family customers) were used because these were assumed to represent domestic water use. Metered water withdrawal data for the small systems were provided by an engineering firm overseeing many water systems to RIWRB, and the 9 small systems used in this study represent systems serving exclusively residential communities. Therefore, water withdrawal was assumed to represent domestic water use in these systems. The 19 selected systems are highlighted in figure 3.
To calculate per capita rates of domestic water use, data on volumes of withdrawals (for the 9 small systems) or water sales (for the 10 large systems) were converted to per capita rates by using computed estimates of the population served for each system (described in the report section “Population Served by Public Supply and Self-Supply Wells”). These per capita water use rates were applied to areas of domestic self-supply on the basis of physical nearness by using the simplifying assumption that water-use behavior might vary across parts of the State but does not vary between domestic water users regardless of whether the source of water is a public-supply or self-supply well.
Water Volumes Withdrawn or Sold
The RIWRB collects annual reports from all large PWSs each year, which includes monthly residential water-use sales by volume (Kathleen Crawley, RIWRB, written commun., 2020). Monthly residential data were compiled for 10 large PWSs from July 2014 to June 2021. Initial quality assurance and quality control included checking that sales data remained within the same order of magnitude across a time series; values outside of these criteria were investigated for errors in reporting units. Monthly values that appeared to be outliers or that were missing were flagged, and the RIWRB contacted the individual PWS to resolve flagged data. No efforts were made to fill gaps in a time series if the RIWRB was unable to obtain records or corrections from the suppliers. The monthly data for each system were then converted to mean daily water use volumes according to the number of days in each month.
Small PWSs are not required to submit annual reports to the RIWRB. However, an engineering firm that operates dozens of small PWSs in the State provided metered information for nine small community (residential) suppliers (Kathleen Crawley, RIWRB, written commun. 2022). For these systems, volume per day was calculated as the change in total metered volume divided by the number of days between meter readings. We excluded periods between meter reads that were greater than 6 months because this exceeded the seasonal resolution of our population estimates. In several instances, the engineering firm that provided these data had adjusted the volume per day measurements on the basis of knowledge of their operations (for example, meter replacements or recalibrations); these changes were incorporated into our study. If a single system withdrew water from multiple wells, the volume per day withdrawals from the wells were summed to get a systemwide total. The daily withdrawals were averaged over each month.
Population Estimates
For the 10 large PWSs, reported populations served were obtained from the annual reports submitted to the RIWRB. Annual reports are generally reported for fiscal years (defined as the 12-month period from July 1 to June 30 and designated by the calendar year in which it ends), and we therefore used the end of one fiscal year and the beginning of the next as the time step for year-to-year population changes when comparing these annual report values with recalculated population-served values described in the report section “Population Served by Public-Supply and Self-Supply Wells.” The methods used to estimate populations served that are reported to the RIWRB varied widely among suppliers, from values based on the number of service connections to values based on professional estimates of tourist activity (Kathleen Crawley, RIWRB, written commun. 2023).
For small PWSs, reported populations served were obtained from metadata in the SDWIS and from a report that summarized small PWS populations served in Rhode Island (Kathleen Crawley, RIWRB, written commun. 2022). SDWIS population-served estimates are generated by the Rhode Island Department of Health using methodology that differs from methods used for the large PWSs.
Owing to the variation in methodology of estimates of reported populations served, for consistency, we recalculated populations served for all large and small PWSs using the boundary polygons for each PWS and the population dasymetric rasters created for each season in this study. The per capita rates of water use were calculated by using our recalculated population-served values.
For all PWSs, recalculated populations served were derived from summer and winter dasymetric rasters for each year, and from the spatial polygons of system service-area boundaries. Populations served were calculated by summing raster pixel values within the polygons using the terra package in R (Hijmans, 2023). Small PWSs are required to register with SDWIS if they serve an average of at least 25 people for at least 60 days per year or have at least 15 service connections. Therefore, we adjusted any recalculated populations served of fewer than 25 people to 25 people.
Water-Withdrawal Calculations
Water withdrawal in gallons per day was calculated for each pixel as the product of population per pixel and the per capita water-use rate in gallons per person per day. Per capita water-use rates from the supplier data were applied across the State using nearest neighbor assignments. Differences in per capita water-use rates between suppliers were considered to be representative of regional water use, incorporating variations in water use on the basis of variations in weather patterns, land use, and socioeconomics across the State. For each month, the State was divided into Voronoi polygons surrounding suppliers who had reported data for the given month. Voronoi polygons depict areas of the State that are spatially closest to each of these suppliers (fig. 4). The Voronoi polygons were converted to rasters at the same resolution as the seasonal dasymetric rasters. For each fiscal year, the total withdrawal for each pixel (in Mgal/d) was calculated as a weighted average of the monthly rasters (also in Mgal/d), weighted by the number of days in each month.
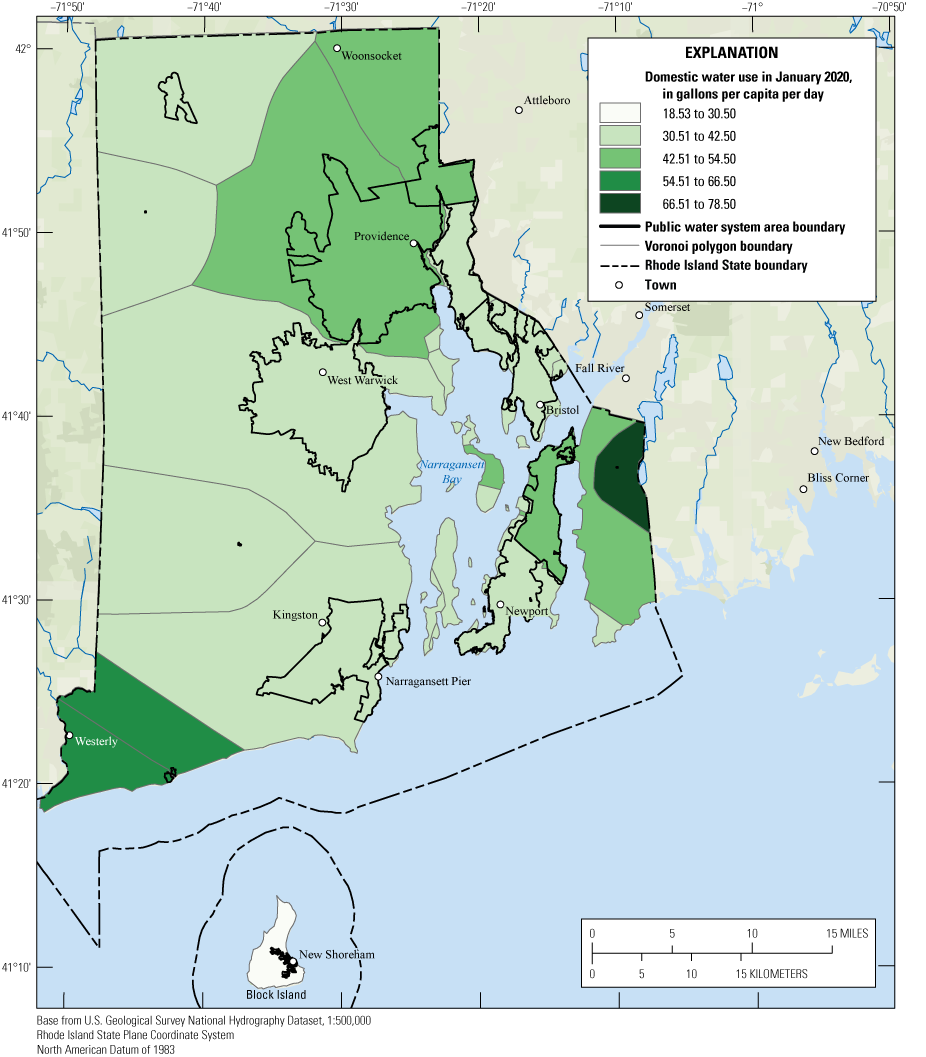
Map showing Voronoi polygons of daily per capita domestic water use rate coefficients in Rhode Island for January 2020. Public water system service boundaries that the daily per capita domestic water use rates were calculated from are overlain for reference. Data from Rhode Island Geographic Information System (2022).
Results
All spatial results of this study are generated as 30-m monthly rasters (Chamberlin and Armstrong, 2024) that can be used as input for further applications by any interested parties. This report summarizes results by municipality and subwatershed (HUC12).
Population Change Rasters
Population in Rhode Island has generally been increasing since 2010; however, increases are not consistent across the State. In 2020, 98.7 percent of block groups had population change coefficients between −1 and 1 (unitless), with a median change of 0.04 (fig. 5). Block groups along the coastline, on Block Island, and along Narragansett Bay generally had the highest seasonality coefficients, sometimes exceeding 2 (a doubling of population in the summer), indicating the highest variability between summer and winter populations (fig. 6). Statewide in 2020, 79 percent of block groups had seasonality coefficients of 1 (meaning there were no vacant seasonal units in the block group), and 98.9 percent of block groups had seasonality coefficients less than 2.
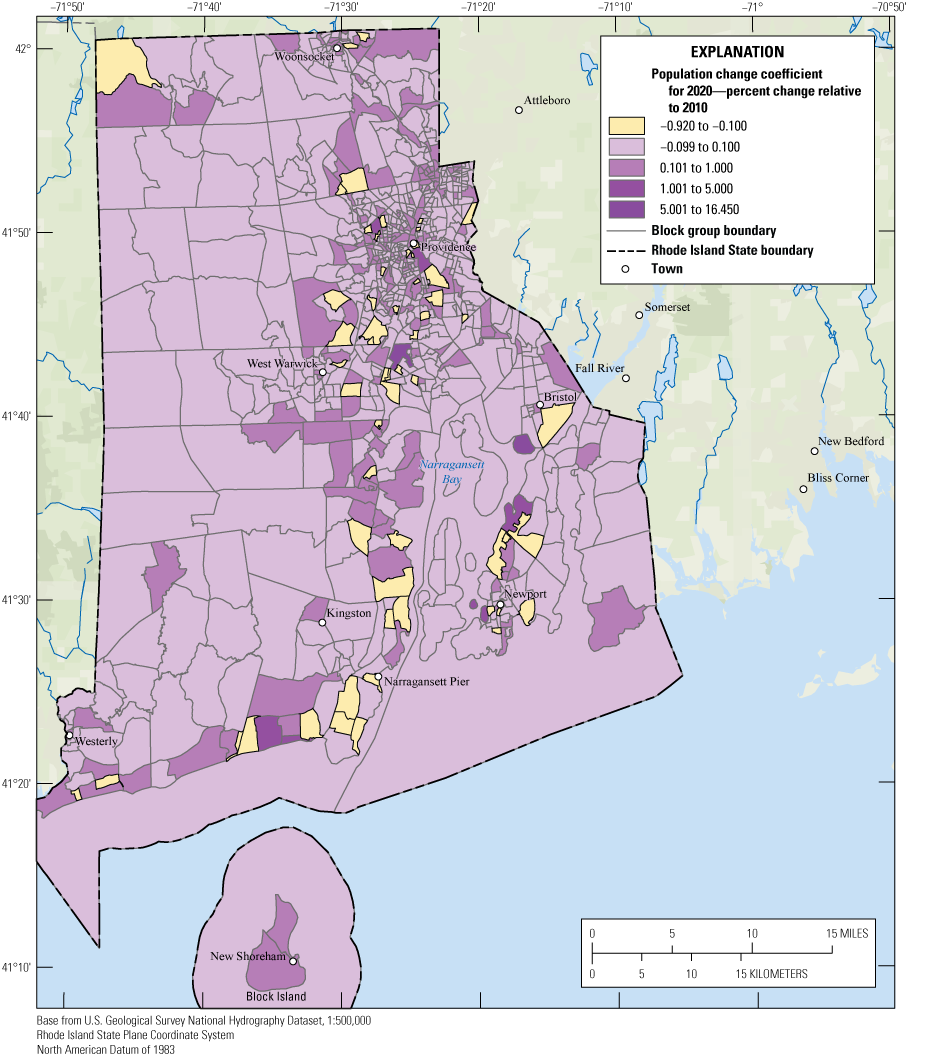
Map showing population change coefficients for block groups in Rhode Island between 2010 and 2020. Data from Chamberlin and Armstrong (2024).
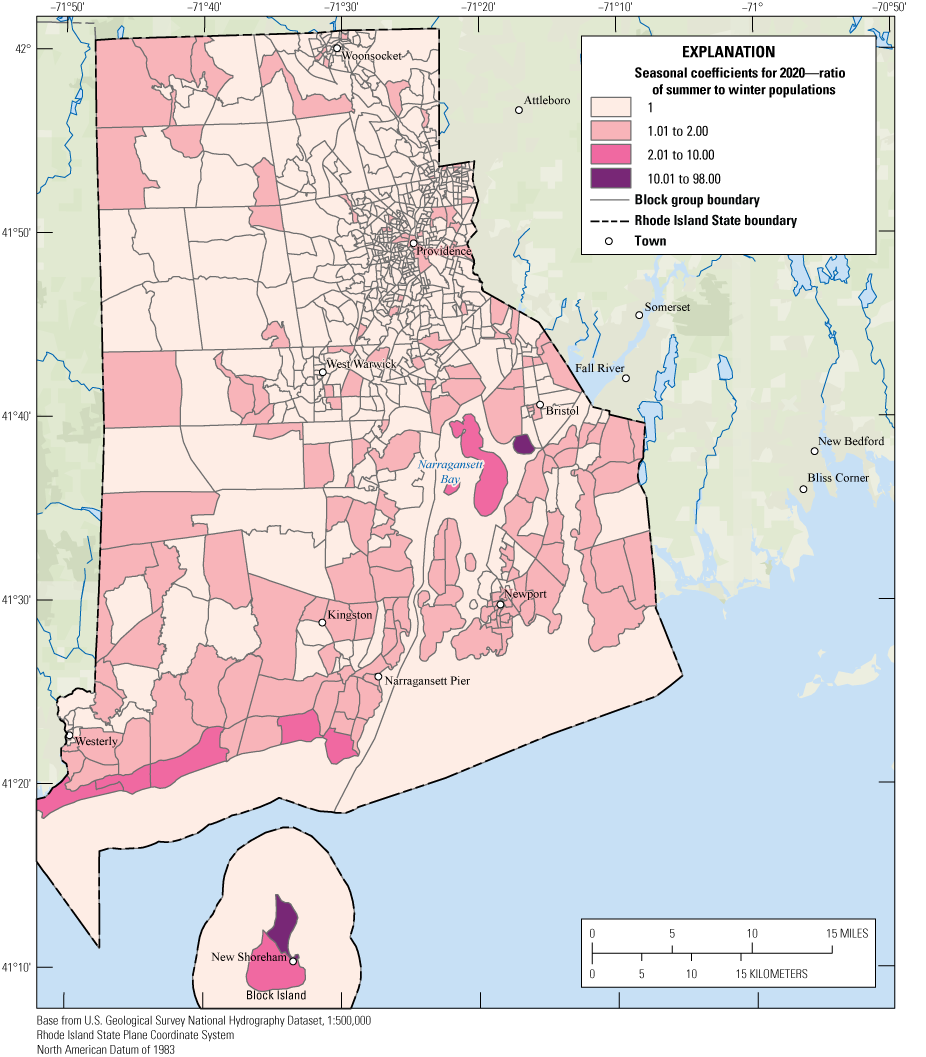
Map showing seasonal scaling coefficients for block groups in Rhode Island in 2020. Winter is defined as January 1 to March 31 and October 1 to December 31; summer is defined as April 1 to September 30. Data from Chamberlin and Armstrong (2024).
Population Served by Public Supply and Self-Supply Wells
Our recalculated estimates of population served by each PWS generally agreed with reported values (Kendall’s τ = 0.78; fig. 7). This association was stronger for the larger suppliers (Kendall’s τ = 0.89) than for the smaller suppliers (Kendall’s τ = 0.39). For large PWSs, the median difference between values was 6.6 percent of the reported population values, whereas for small suppliers the median difference was 27 percent of the reported value. This difference was largely driven by smaller reported populations for the small districts (median reported population of 170 people; Kathleen Crawley, RIWRB, written commun., 2020) than for the large districts (median reported population of 40,000 people; Kathleen Crawley, RIWRB, written commun., 2020; Rhode Island Department of Health, 2024). There was little bias overall (percent bias = 0.8 percent); however, the recalculated population-served estimates for the small PWSs were biased low compared with the reported population-served estimates (percent bias = −46.8 percent). We found that the recalculated population served by a PWS increased over time for large PWSs (seasonal Mann-Kendall, p < 0.001, Sen slope = 1,591 people per month; fig. 8) but did not change significantly over time for small PWSs (seasonal Mann-Kendall, p = 0.46).
Much of the change for large PWSs occurred between 2019 and 2020. Population served by large PWSs was lowest in October–December 2014 (934,295 people), and highest in April–September 2020 (1,004,405 people). Over the timeframe of this study, a median of 20,440 people were served by small PWSs in winter, and a median of 21,961 people were served in summer (fig. 8). Estimates of the statewide population served by domestic self-supply wells increased over fiscal years 2015–21 (seasonal Mann-Kendall, p = 0.01, Sen slope = 253 people per month; fig. 8). Much of this increase occurred between 2019 and 2020, and Rhode Island reported an increase in population that year of 3.5 percent (Manson and others, 2023). Though 2020 data came from the decennial census and 2019 data came from the American Community Survey, the increase continued in 2021, which also used data from the American Community Survey. This increase was exaggerated in some locations, such as in the two block groups on Block Island, which together had a 54 percent increase in reported population from 2019 to 2020 (916 people to 1,410 people); however, reported population decreased in 2021 to 1,007 people. As Block Island has a large number of seasonally vacant units (1,444 units out of 1,947 total units in 2020; Manson and others, 2023), this population increase was even greater in the summer using our methodology.
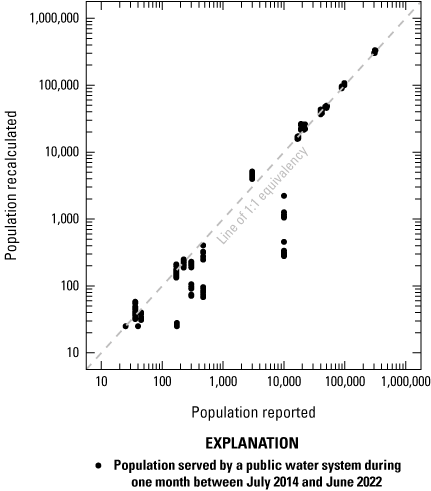
Graph showing recalculated population-served estimates of public water supply systems in Rhode Island for 2014–21 (y-axis) plotted against the reported population-served estimates (x-axis).
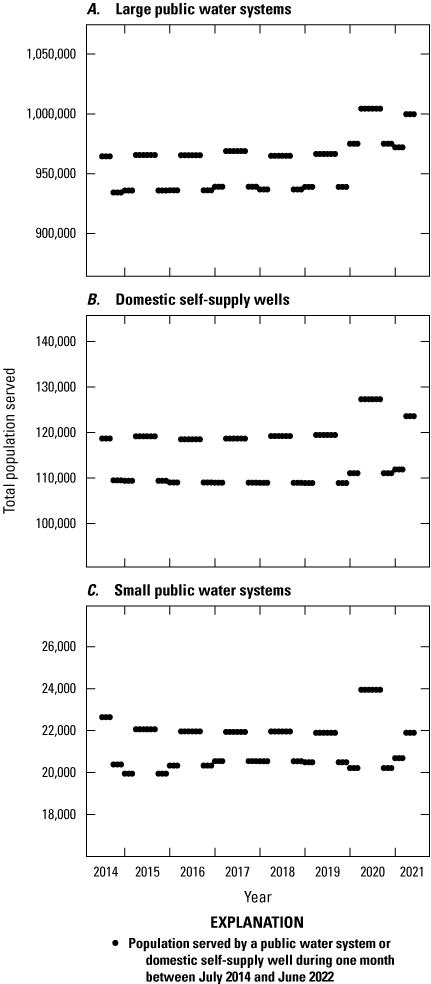
Graphs showing total populations in Rhode Island served by A, large public water systems reporting to the Rhode Island Water Resources Board (RIWRB); B, domestic self-supply wells; and C, small public water systems not reporting to the RIWRB. Data from Chamberlin and Armstrong (2024).
Populations who relied on self-supply wells varied spatially: the largest populations of self-supply well users were in the towns of Charlestown, Glocester, Scituate, Burrillville, and North Smithfield (table 1) and in the drainage basins of Branch River, Woonasquatucket River, Moswansicut Pond-Huntinghouse Brook, Upper Wood River, and Tomaquag Brook-Pawcatuck River1 (table 2; Moswansicut Pond, Huntinghouse Brook, and Tomaquag Brook not shown on any map). The largest differences between summer and winter populations who use domestic self-supply wells were seen in the towns of Charlestown, Glocester, Little Compton, New Shoreham, and South Kingstown. Populations who use domestic self-supply wells are available in Chamberlin and Armstrong (2024) and can be aggregated to other spatial resolutions as well.
HUC12s 010900030204, 010900040502, 010900040604, 010900050101, and 010900050205.
Table 1.
Populations who use domestic self-supply wells in Rhode Island by municipality for calendar years 2014–2021.[Data from Chamberlin and Armstrong (2024). Winter is defined as January 1 to March 31 and October 1 to December 31; summer is defined as April 1 to September 30.]
Table 2.
Populations who use domestic self-supply wells in Rhode Island by 12-digit hydrologic unit code (HUC12) subwatershed for calendar years 2014–2021.[Data from Chamberlin and Armstrong (2024). HUC12s from U.S. Geological Survey (2020), accessed with nhdplusTools (Blodgett and Johnson, 2023). Map labels correspond to labels on figure 10. Winter is defined as January 1 to March 31 and October 1 to December 31; summer is defined as April 1 to September 30. —, no data]
Water Use and Water Withdrawal
The median daily per capita domestic water use rate calculated in this study from the 19 PWSs was 46.0 gpcd, and the 95-percent confidence interval was 20.1–108.2 gpcd (fig. 9). Overall, seasonality was significant (Kruskal-Wallis test on months, p < 0.05): the highest daily per capita domestic water use rates were in August–October (medians of 56.3, 55.5, and 54.4 gpcd, respectively), and the lowest daily per capita domestic water use rates were in March–May (medians of 39.1, 39.3, and 38.5 gpcd, respectively). No significant annual trend was seen over the period of this study in the daily per capita domestic water use rates (seasonal Mann-Kendall test, 11 degrees of freedom, p = 0.29).
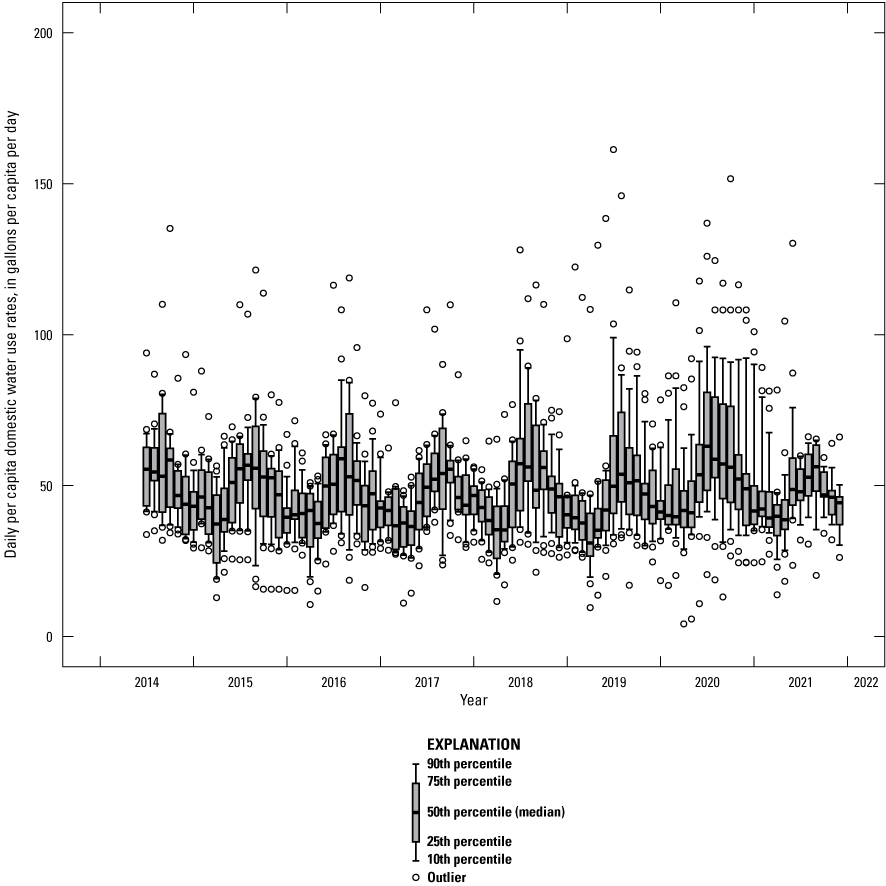
Graph showing daily per capita domestic water use coefficients by month in Rhode Island for 2014–21. Rates from Chamberlin and Armstrong (2024).
The greatest amount of domestic self-supply water withdrawal occurred in the western part of the State, which is the area with the largest number of people who rely on self-supply wells (fig. 10). Total self-supplied domestic withdrawals varied by municipality and drainage basin, and the greatest total annual withdrawals were in the towns of Scituate (an average of 0.459 Mgal/d between July 2014 and June 2021) and Charlestown (an average of 0.438 Mgal/d between July 2014 and June 2021), and in the drainage basins of the Tomaquag Brook-Pawcatuck River2 (an average of 0.379 Mgal/d between 2014 and 2021) and Woonasquatucket River3 (an average of 0.342 Mgal/d between 2014 and 2021; tables 3 and 4). Statewide, total monthly withdrawals from private wells ranged from 3.987 Mgal/d in March 2018 to 7.767 Mgal/d in September 2016, and no trend over time was detected in the monthly values (seasonal Mann-Kendall test on months, 11 degrees of freedom, p = 0.24; fig. 11). Statewide, water withdrawals from self-supply wells are generally higher in summer than in winter, similar to the seasonal pattern of use for PWSs (Stagnitta and Medalie, 2023).
HUC12 010900050205.
HUC12 010900040502.
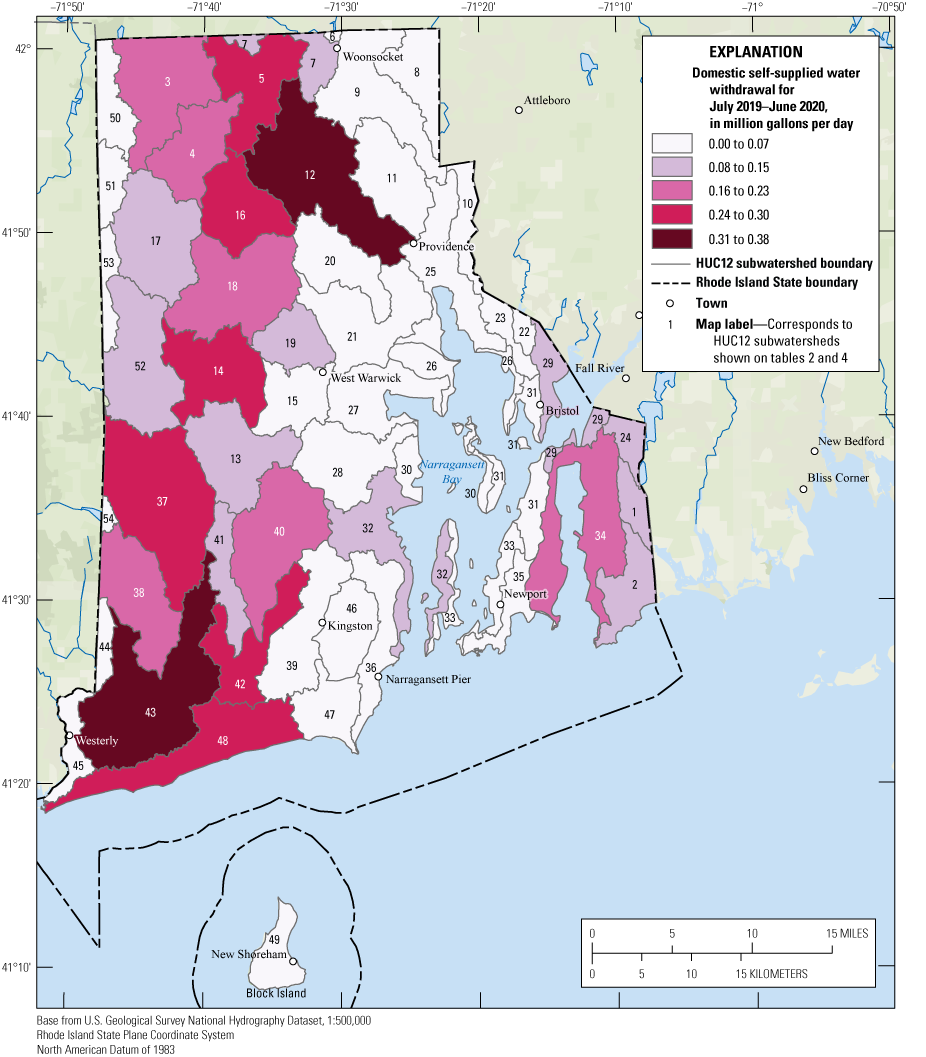
Map of domestic self-supply water withdrawals in Rhode Island for fiscal year 2020 (July 2019–June 2020) for 12-digit hydrologic unit code (HUC12) subwatersheds. Data from Chamberlin and Armstrong (2024).
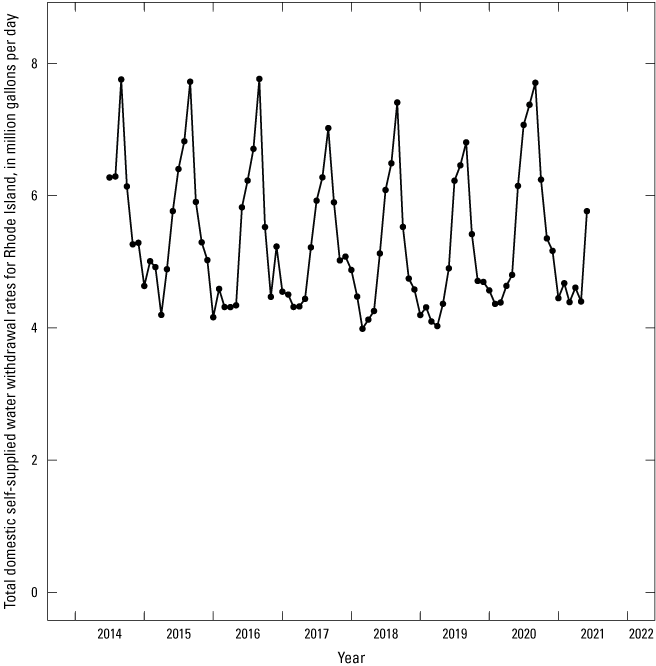
Graph showing time series of total domestic water withdrawals from self-supply wells in Rhode Island for 2014–21. Data from Chamberlin and Armstrong (2024).
Table 3.
Annual domestic self-supply water withdrawals by municipality in Rhode Island for fiscal years 2015–21 (July 2014–June 2021).[Data from Chamberlin and Armstrong (2024). Fiscal year is defined as the 12-month period from July 1 to June 30 and designated by the calendar year in which it ends. Mgal/d, million gallons per day]
Table 4.
Annual domestic self-supply water withdrawals by 12-digit hydrologic unit code (HUC12) subwatershed in Rhode Island for fiscal years 2015–21 (July 2014–June 2021).[Data from Chamberlin and Armstrong (2024). HUC12s from U.S. Geological Survey (2020), accessed with nhdplusTools (Blodgett and Johnson, 2023). Map labels correspond to labels on figure 10. Fiscal year is defined as the 12-month period from July 1 to June 30 and designated by the calendar year in which it ends. Mgal/d, million gallons per day; —, no data]
Discussion
The estimates of domestic self-supply water withdrawals from private wells are largest in rural, less populated parts of the State. Self-supply withdrawals are generally highest in summer, when water use per capita is highest (largely due to increased water use for outdoor purposes, such as irrigating lawns, maintaining swimming pools, and watering gardens) and when populations increase in areas popular for summer tourism. Self-supply withdrawals appear to be largely consistent over the period of this study (July 2014–June 2021), though the population of Rhode Island increased over this time, especially after 2019. Statewide, domestic self-supply water withdrawal is a small fraction of the State’s water budget: summer peak withdrawals were <8 Mgal/d, as compared with an estimated 120 Mgal/d for summer averages from all reported and estimated public-supply withdrawals (Rhode Island Water Resources Board, 2022). Locally, however, domestic self-supply wells may be the largest source of water withdrawal within a municipality or subwatershed (HUC12), and providing this previously unavailable information can assist with planning in these areas. Additionally, periods of high withdrawal frequently correspond to periods of low groundwater levels during hot and dry summers.
Our estimates of the domestic self-supply population are compatible with estimates for Rhode Island from other national and regional studies. Using two methods to estimate housing units using domestic self-supply wells in 2010, Murray and others (2021) produced estimates of roughly 10,000 housing units (based on the number of reported wells) and 60,000 housing units (based on the net housing units). With an average of 2.43 people per household for 2018–22 (Manson and others, 2023), 10,000 to 60,000 housing units is equivalent to 24,300–145,800 people who use domestic self-supply wells. Johnson and others (2019) estimated the population who use self-supply wells in Rhode Island to be 100,001 to 250,000 people in 2010. This study estimated 107,419–125,323 people served by domestic self-supply wells in the State between 2014 and 2021. The wide ranges of estimates in Murray and others (2021) and Johnson and others (2019) demonstrate the difficulty of precisely estimating domestic self-supply and why smaller scale studies, such as this one, can be useful in generating more precise local estimates. At the drainage basin scale, the results of this study were similar to estimates from a 1995–99 study (Wild and Nimiroski, 2007). In drainage basins that overlap between the two studies, we estimated an average of 23,890 people who use self-supply wells in the Pawtuxet River drainage basin4 (compared with 26,784 people in Wild and Nimiroski [2007]) and 4,360 people in the Quinebaug River drainage basin5 (compared with 4,501 people; Quinebaug River not shown on any map). The decrease in the population who use self-supply wells from 1995–99 to the period described in this study is consistent with the negative population change coefficients seen between 2014 and 2021 for many census block groups in the interior western parts of the State (fig. 5).
HUC12s 010900040601, 010900040602, 010900040603, 010900040604, 010900040605, 010900040606, 010900040607, 010900040608, and 010900040609.
HUC12s 011000010301, 011000010302, 011000010501, 011000010502, and 011000010601.
Wild and Nimiroski (2007) also estimated water withdrawal from domestic self-supply wells in the Pawtuxet River and Quinebaug River drainage basins. Though different methods were used to estimate withdrawal in this study, our results are largely consistent with their estimates from the 1990s and overall trends. Wild and Nimiroski (2007) constructed detailed water budgets of the Pawtuxet River drainage basin and Rhode Island portions of the Quinebaug River drainage basin and estimated annual domestic self-supply withdrawals of 1.915 Mgal/d for the Pawtuxet River drainage basin and 0.319 Mgal/d for the Quinebaug River drainage basin. Over the time period of this study (20 years after the study period of Wild and Nimiroski [2007]), we estimated average annual domestic self-supply withdrawals of 1.198 Mgal/d for the Pawtuxet River drainage basin and 0.205 Mgal/d for the Quinebaug River drainage basin. The decreases in water withdrawals are consistent with a decrease in population in the drainage basins and also decreases of the per capita water use coefficients. Nationally, domestic water use has been declining because of many factors, including technological advancements and government policies (DeOreo and Mayer, 2012; Dieter and others, 2018). Wild and Nimiroski (2007) used per capita water use coefficients of 71 gallons per person per day, whereas the calculated per capita water use coefficients in this study were typically less than this value (fig. 9).
Conclusions
Understanding the spatial and temporal distribution of water withdrawals from private domestic wells is necessary for a complete accounting of domestic water withdrawals throughout Rhode Island. This understanding is also important because of the greater potential for drinking water contamination in private wells as a result of increased vulnerabilities and lower testing requirements (DeSimone and others 2014). Water withdrawal through private wells in Rhode Island occurs primarily in the western parts of the State. The spatial patterns closely correspond to the estimates of population density in areas not served by public water supply.
The U.S. Geological Survey, in cooperation with the Rhode Island Water Resources Board, found that water withdrawals through private wells account for a small portion of the State’s total domestic water withdrawals and that, statewide, annual withdrawals have been steady between 2014 and 2021. Though populations who use domestic self-supply wells have increased in Rhode Island between 2014 and 2021, and though substantial seasonal fluctuation in the domestic self-supply population exists, there have been no statistically significant annual or seasonal trends in domestic self-supply water withdrawals between 2014 and 2021. Withdrawals from private wells are largest in the inland areas of the western part of the State, and the towns of Scituate and Charlestown have the highest estimated withdrawals. Statewide withdrawals ranged from 3.987 to 7.767 million gallons per day over the study period. The median per capita domestic water use rate was 46.0 gallons per capita per day. With the estimates from this study, water-budget and availability of individual basins can be studied in more detail.
This study produced newly available monthly and annual 30-meter dasymetric rasters of estimates of populations who rely on domestic self-supply wells and water withdrawal from these wells for the state of Rhode Island. These products complement the withdrawal and population information currently available for domestic water use for public water systems. The combination of these products may assist water managers and planners in providing estimates of total withdrawal for domestic use at any spatial resolution, including subwatersheds, municipality boundaries, or counties. As water demands from future development projects are considered, a unified and complete estimate of current and historical water withdrawals for domestic use can be useful for managing Rhode Island’s water resources.
References Cited
Baynes, J., Neale, A., and Hultgren, T., 2022, Improving intelligent dasymetric mapping population density estimates at 30 m resolution for the conterminous United States by excluding uninhabited areas: Earth Systems Science Data, v. 14, no. 6, p. 2833–2849, accessed October 2, 2024, at https://doi.org/10.5194/essd-14-2833-2022.
Blodgett, D. and Johnson, M., 2023, nhdplusTools—Tools for accessing and working with the NHDPlus, version 0.7.1: R Foundation for Statistical Computing software release, accessed September 1, 2023, at https://cran.r-project.org/package=nhdplusTools.
Bowen, K., Krishna, T., Backer, L., Hodgins, K., Waller, L.A., and Gribble, M.O., 2019, State-level policies concerning private wells in the United States: Water Policy, v. 21, no. 2, p. 428–435, accessed January 10, 2024, at https://doi.org/10.2166/wp.2019.205.
Bulka, C.M., Bryan, M.S., Lombard, M.A., Bartell, S.M., Jones, D.K., Bradley, P.M., Vieira, V.M., Silverman, D.T., Focazio, M., Toccalino, P.L., Daniel, J., Backer, L.C., Ayotte, J.D., Gribble, M.O., and Argos, M., 2022, Arsenic in private well water and birth outcomes in the United States: Environment International, v. 163, article 107176, 12 p., accessed January 11, 2024, at https://doi.org/10.1016/j.envint.2022.107176.
Chamberlin, C.A., and Armstrong, I.P., 2024, Monthly and annual population and self-supplied domestic water withdrawal maps of Rhode Island, 2014–2021: U.S. Geological Survey data release, https://doi.org/10.5066/P9WU48KY.
DeOreo, W.B., and Mayer, P.W., 2012, Insights into declining single-family residential water demands: Journal—American Water Works Association, v. 104, no. 6, p. E383–E394, accessed June 10, 2022, at https://doi.org/10.5942/jawwa.2012.104.0080.
DeSimone, L.A., McMahon, P.B., and Rosen, M.R., 2014, Water quality in principal aquifers of the United States, 1991–2010: U.S. Geological Survey Circular 1360, 151 p., plus 4 app. and data, accessed January 10, 2024, at https://doi.org/10.3133/cir1360.
Dieter, C.A., Maupin, M.A., Caldwell, R.R., Harris, M.A., Ivahnenko, T.I., Lovelace, J.K., Barber, N.L., and Linsey, K.S., 2018, Estimated use of water in the United States in 2015: U.S. Geological Survey Circular 1441, 65 p., accessed February 8, 2024, at https://doi.org/10.3133/cir1441. [Supersedes Open-File Report 2017–1131.]
Hijmans, R. J., 2023, terra—Spatial data analysis, version 1.7-39: R Foundation for Statistical Computing software release, accessed January 2, 2024, at https://cran.r-project.org/package=terra.
Homer, C.G., Dewitz, J.A., Yang, L., Jin, S., Danielson, P., Xian, G., Coulston, J., Herold, N.D., Wickham, J.D., and Megown, K., 2015, Completion of the 2011 National Land Cover Database for the conterminous United States—Representing a decade of land cover change information: Photogrammetric Engineering and Remote Sensing, v. 81, no. 5, p. 345–354, accessed March 6, 2024, at https://www.ingentaconnect.com/content/asprs/pers/2015/00000081/00000005/art00002.
Jasechko, S., and Perrone, D., 2021, Global groundwater wells at risk of running dry: Science, v. 372, no. 6540, p. 418–421 accessed January 10, 2024, at https://doi.org/10.1126/science.abc2755.
Johnson, T.D., and Belitz, K., 2017, Domestic well locations and populations served in the contiguous U.S.—1990: Science of the Total Environment, v. 607–608, p. 658–668, accessed February 7, 2023, at https://doi.org/10.1016/j.scitotenv.2017.07.018.
Johnson, T.D., Belitz, K., Kauffman, L.J., Watson, E., and Wilson, J.T., 2022, Populations using public-supply groundwater in the conterminous U.S. 2010; Identifying the wells, hydrogeologic regions, and hydrogeologic mapping units: Science of the Total Environment, v. 806, part 2, article 150618, 15 p., accessed January 11, 2024, at https://doi.org/10.1016/j.scitotenv.2021.150618.
Johnson, T.D., Belitz, K., and Lombard, M.A., 2019, Estimating domestic well locations and populations served in the contiguous U.S. for years 2000 and 2010: Science of the Total Environment, v. 687, p. 1261–1273, accessed July 18, 2022, at https://doi.org/10.1016/j.scitotenv.2019.06.036.
Lombard, M.A., Bryan, M.S., Jones, D.K., Bulka, C., Bradley, P.M., Backer, L.C., Focazio, M.J., Silverman, D.T., Toccalino, P., Argos, M., Gribble, M.O., and Ayotte, J.D., 2021, Machine learning models of arsenic in private wells throughout the conterminous United States as a tool for exposure assessment in human health studies: Environmental Science & Technology, v. 55, no. 8, p. 5012–5023, accessed May 19, 2022, at https://doi.org/10.1021/acs.est.0c05239.
Manson, S., Schroeder, J., Van Riper, D., Knowles, K., Kugler, T., Roberts, F., and Ruggles, S., 2023, IPUMS National Historical Geographic Information System, version 18.0: IPUMS database, accessed June 13, 2023, at: https://doi.org/10.18128/D050.V18.0.
Mullaney, J.R., 2004, Water use, ground-water recharge and availability, and quality of water in the Greenwich area, Fairfield County, Connecticut, and Westchester County, New York, 2000–2002: U.S. Geological Survey Water-Resources Investigations Report 03–4300, 64 p., accessed March 22, 2024, at https://doi.org/10.3133/wri034300.
Murray, A., Hall, A., Weaver, J., and Kremer, F., 2021, Methods for estimating locations of housing units served by private domestic wells in the United States applied to 2010: Journal of the American Water Resources Association, v. 57, no. 5, p. 828–843, accessed February 7, 2023, at https://doi.org/10.1111/1752-1688.12937.
Rhode Island Department of Health, 2024, Drinking water viewer: Rhode Island Department of health database, accessed November 12, 2024, at https://dwq.health.ri.gov/.
Rhode Island General Assembly, 1956, Legislative declaration: The State of Rhode Island General Laws, title 46, chap. 15, section 1, accessed August 12, 2024, at https://webserver.rilegislature.gov//Statutes/TITLE46/46-15/46-15-1.htm.
Rhode Island Geographic Information System, 2022, Water supply districts: University of Rhode Island Environmental Data Center and Rhode Island Geographic Information System database, accessed November 8, 2022, at https://www.rigis.org/datasets/edc::water-supply-districts-2022/.
Rhode Island Water Resources Board, 2022, RI Water Use Needs, Data, and Reporting (WUNDR): Rhode Island Water Resources Board database, accessed April 22, 2024, at https://rigs.uri.edu/water/index.html.
Soriano, M.J., Jr., Deziel, N.C., and Saiers, J.E., 2022, regional scale assessment of shallow groundwater vulnerability to contamination from unconventional hydrocarbon extraction: Environmental Science & Technology, v. 56, no. 17, p. 12126–12136, accessed January 10, 2024, at https://doi.org/10.1021/acs.est.2c00470.
Stagnitta, T., and Medalie, L., 2023, Assessment of factors that influence human water demand for Providence, Rhode Island: U.S. Geological Survey Scientific Investigations Report 2023–5057, 18 p., accessed September 5, 2023, at https://doi.org/10.3133/sir20235057.
U.S. Census Bureau, 2023, Relationship files for 2020: U.S. Census Bureau data, accessed March 6, 2024 at https://www.census.gov/geographies/reference-files/time-series/geo/relationship-files.2020.html.
U.S. Environmental Protection Agency, 2016, EnviroAtlas—Dasymetric population for the conterminous United States, version 1: U.S. Environmental Protection Agency dataset, accessed August 31, 2023, at https://gaftp.epa.gov/epadatacommons/ORD/EnviroAtlas/dasymetric_us_20160208.zip.
U.S. Geological Survey, 2020, NHDPlus National Data: U.S. Geological Survey dataset [October 2020 snapshot], accessed March 15, 2024, at https://labs.waterdata.usgs.gov/geoserver/web. [Data are item wmadata:wbd12_20201006.]
Wild, E.C., and Nimiroski, M.T., 2007, Estimated water use and availability in the Pawtuxet and Quinebaug River Basins, Rhode Island, 1995–99: U.S. Geological Survey Scientific Investigations Report 2006–5154, 68 p., accessed May 16, 2022, at https://doi.org/10.3133/sir20065154.
Conversion Factors
U.S. customary units to International System of Units
Abbreviations
ACS1
U.S. Census Bureau American Community Survey 1-year
ACS5
U.S. Census Bureau American Community Survey 5-year
gpcd
gallons per capita per day
HUC12
12-digit hydrologic unit code
PWS
public water system
RIWRB
Rhode Island Water Resources Board
SDWIS
Rhode Island Safe Drinking Water Information System
WUNDR
Rhode Island Water Use Needs, Data, and Reporting database
For more information about this report, contact:
Director, New England Water Science Center
U.S. Geological Survey
10 Bearfoot Road
Northborough, MA 01532
dc_nweng@usgs.gov
or visit our website at
https://www.usgs.gov/centers/new-england-water
Publishing support provided by the Pembroke Publishing Service Center
Disclaimers
Any use of trade, firm, or product names is for descriptive purposes only and does not imply endorsement by the U.S. Government.
Although this information product, for the most part, is in the public domain, it also may contain copyrighted materials as noted in the text. Permission to reproduce copyrighted items must be secured from the copyright owner.
Suggested Citation
Chamberlin, C.A., Armstrong, I.P., and Stagnitta, T.J., 2024, Estimating domestic self-supplied water use in Rhode Island, 2014–21: U.S. Geological Survey Scientific Investigations Report 2024–5109, 29 p., https://doi.org/10.3133/sir20245109.
ISSN: 2328-0328 (online)
Study Area
| Publication type | Report |
|---|---|
| Publication Subtype | USGS Numbered Series |
| Title | Estimating domestic self-supplied water use in Rhode Island, 2014–21 |
| Series title | Scientific Investigations Report |
| Series number | 2024-5109 |
| DOI | 10.3133/sir20245109 |
| Publication Date | December 18, 2024 |
| Year Published | 2024 |
| Language | English |
| Publisher | U.S. Geological Survey |
| Publisher location | Reston, VA |
| Contributing office(s) | New England Water Science Center |
| Description | Report: vii, 29 p.; Data Release |
| Country | United States |
| State | Rhode Island |
| Online Only (Y/N) | Y |
| Additional Online Files (Y/N) | N |


