

Ungulate Migrations of the Western United States, Volume 5
Links
- Document: Report (89.9 MB pdf) , HTML , XML
- Related Works:
- Data Release: USGS data release - Ungulate Migrations of the Western United States, volume 5
- Download citation as: RIS | Dublin Core
Acknowledgments
Numerous agency biologists, wildlife officers, students, and postdoctoral researchers contributed thousands of hours of planning, collecting, analyzing, and visualizing the data for the herds mapped and described in this report. Map design and production were done by staff and students from the InfoGraphics Lab at the University of Oregon, including research assistant Joanna Merson and student cartographers Mack Gray and Zoë Kleiner. Initial formatting was conducted by Jessica Perry at Creative Blue Yonder. Coordination and administration of this work with the U.S. Department of the Interior and Western United States were facilitated by Casey Stemler, Zach Bowen, and Jonathan Mawdsley.
In Arizona, numerous individuals contributed to data collection and coordination including, but not limited to, the following: Henry Apfel, Colin Beach, Sue Boe, David Daniels, John Dickson, Norris Dodd, Bruce Eilerts, John Goodwin, Tim Holt, Keith Knutson, Chad Loberger, Carl Lutch, Jarrod McFarlin, Craig McMullen, Haley Nelson, Robert Nelson III, Siobhan Nordhaugen, Richard Ockenfels, Lucas Olson, Larry Phoenix, Natalie Robb, Steve Rosenstock, Ray Schweinsburg, Ron Seig, Thorry Smith, Steve Thomas, Justin White, and Todd Williams.
In California, Kristin Denryter, Dave German, Brian Leo, Cody Massing, Jane McKeever, Mike Morrison, Jim Pope, Kelley Stewart, Dan Taylor, and Tim Taylor contributed to data collection and coordination.
In Colorado, numerous individuals contributed to data collection including, but not limited to, the following: Gary Birch, Larry Gepfert, Greg Krieger, Bryan Lamont, Patrick McEachern, Kirk Oldham, Quicksilver Air employees, and Sam Towne.
In Idaho, the following individuals at the Idaho Fish and Game assisted with data collection and project coordination, herd descriptions, and information: Paul Atwood, Frank Edelmann, Mike Elmer, Charlie Henderson, Iver Hull, Mike McDonald, Matt Pieron, Shane Roberts, Josh Rydalch, Ryan Walker, Ryan Walrath, and Rick Ward.
In Navajo Nation, Lionel Tsosie and Jeffrey Cole at the Navajo Nation Department of Fish and Wildlife assisted with data collection and coordination.
In Nevada, numerous individuals contributed to data collection and coordination including, but not limited to, the following: Brittany Allen, Rachel Cook, Mike Cox, Ken Gray, Kari Huebner, Peter Lacono, Nathan Lahue, Chris Morris, Scott Roberts, and Peregrine Wolff.
In New Mexico, the following agencies assisted with data collection or project logistics: the Bureau of Land Management Taos Field Office, New Mexico Department of Game & Fish, and the U.S. Department of Agriculture Forest Service Carson National Forest.
In Oregon, the following individuals at the Oregon Department of Fish and Wildlife contributed to captures, data collection, and project logistics: Chris Bottom, Steve Cherry, Tom Collam, Jenny Dalton, Lee Foster, Bre Furfey, Corey Heath, Melody Henderson, Greg Jackle, Matt Keenan, Zac Kendall, Rod Klus, Gabrielle McNassar, Andrew Meyers, Mike Moore, Jon Muir, Justin Primos, Brian Ratliff, Josh Smith, Jeremy Thompson, and Andrew Walch.
In Wyoming, numerous individuals and agencies contributed to data collection, communication, and logistical support including, but not limited to, the following: Ellen Aikens, Shannon Albeke, the Bureau of Land Management—Rawlins Field Office, the Bureau of Land Management Rock Springs Field Office, BreAnna Bonner, Gary Boyd, Travis Brown (PacifiCorp Energy), Clay Buchanan, Patrick Burke, Russel Burton, Corey Class, Walter Cook, Holly Ernest, Scott Edberg, Hank Edwards, Brady Frude, Scott Gamo, Ron Grogan, Abel Guevara, Cole Hansen, Rodney Harned, Carol Havlik, John Henningsen, Jennifer Hess, Matt Huizenga, Jessica Jennings-Gaines, Teal Joseph, Rachel Keller, Aaron Kerr, Jake Kettley, Brett Klamer, Rod Lebert, Patrick Lionberger, Glen Liston (InterWorks Consulting LLC), Katy Lohse, Darly Lutz, Eric Maichak, Brian Mealor, Kevin Monteith, Mark Nelson, Heather O’Brien, Kim Olson, Jordan Ongstad, Joe Parsons, Jacob Pelham, Cory Reinking, Derek Scasta, Will Schultz, Sam Stephens, Cheyenne Stewart, Scott Talbott, Jack Taylor, Dan Thiele, Tim Thomas, Troy Tobiasson, Kelly Todd, Miguel Valdez, Amy Williams, Ben Wise, Mary Wood, and the many private landowners, ranch managers, and ranch outfitters who provided access to their land. France Flying Service, Native Range Capture Services, Owyhee Air Research, and Sky Aviation provided aerial support for animal capture and monitoring efforts.
Funding for the collaring and collection of ungulate migration data for all States with herd maps was provided by the following organizations: Anadarko Petroleum Corporation, Arizona Department of Transportation, Arizona Game & Fish Department, Black Diamond Minerals, LLC, Bord Gulch Ranch, Bowhunters of Wyoming, British Petroleum North America, Bureau of Land Management, the Bureau of Land Management Rawlins Field Office, California Deer Association, California Department of Fish and Wildlife, Colorado Parks and Wildlife, Colorado Parks and Wildlife Habitat Partnership Program, Devon Energy, Elko Bighorns Unlimited, Federal Aid in Wildlife Restoration, Federal Highway Administration, Knobloch Family Foundation, Linn Energy, Memorial Resource Development LLC, Mule Deer Foundation, Cody Chapter of Muley Fanatic Foundation, Muley Fanatic Foundation, National Council for Air and Stream Improvement, The Nature Conservancy, Navajo Guide Association, Navajo Nation Department of Fish and Wildlife, Nevada Bighorns Unlimited Midas Chapter, Nevada Department of Wildlife, Wildlife Heritage Trust Account, Oregon Department of Fish and Wildlife, PacifiCorp Energy, Rocky Mountain Elk Foundation, Samson Resources, Sheridan Community Land Trust, Sport Fish and Wildlife Restoration Programs, University of Wyoming Department of Ecosystem Science and Management, University of Wyoming Office of Academic Affairs, University of Wyoming Reclamation and Restoration Center, University of Wyoming Research and Extension Center, U.S. Fish and Wildlife Service, U.S. Geological Survey, U.S. Geological Survey National Wildlife Health Center, Warren Resources, Wyoming Department of Transportation, Wyoming Game and Fish Department, Wyoming Governor’s Big Game License Coalition, and Wyoming State Veterinary Laboratory.
The U.S. Geological Survey and the Rocky Mountain Elk Foundation provided the primary funding for the analysis and compilation of this report.
Drs. Andrew Jakes and Steffen Mumme provided thoughtful and constructive comments that greatly improved the report.
Abstract
Many ungulates migrate between distinct summer and winter ranges to take advantage of spatially and temporally variable food sources and avoid threats such as predators and deep snow. In 2018, the U.S. Department of the Interior established Secretarial Order 3362, which provided Federal support to expand existing research efforts to study ungulate populations and conserve their migrations by enhancing habitat quality for ungulates across the Western United States. In response to the order, the U.S. Geological Survey (USGS) created the Corridor Mapping Team, which is a collaboration among 11 State agencies, regional and Federal partners, and an expanding number of Tribal wildlife agencies. Together, the Corridor Mapping Team maps ungulate migrations throughout the Western United States and publishes them in the USGS “Ungulate Migrations of the Western United States” report series. This report details migrations and seasonal ranges from 36 additional herds and includes 2 herd updates detailed in previous reports. The Corridor Mapping Team has mapped the migrations and seasonal ranges of 218 unique herds for the report series, including this report. The report series serves as a map-based inventory of the ungulate migrations across the Western United States for biologists, managers, policymakers, and conservation practitioners. Building on the previous report volumes in the series, volume 5 additionally describes some of the local and national initiatives that are incorporating the products, tools, and information from this growing USGS report series.
Introduction
In 2018, the U.S. Department of the Interior established Secretarial Order 3362, which called on the U.S. Geological Survey (USGS) to assist State agencies in enhancing the habitat quality of big game winter ranges and migration corridors (U.S. Department of the Interior, 2018). In response to Secretarial Order 3362, the USGS created the Corridor Mapping Team (CMT), which is a collaboration among State agencies, regional and Federal partners, and an expanding number of Tribal wildlife agencies. The team collaboratively designs and implements a unified mapping effort for ungulate (hooved mammal) migrations throughout the Western United States. Led by the USGS, the CMT produces the USGS “Ungulate Migrations of the Western United States” report series, which is published annually and includes maps and migration details for ungulate herds throughout the West (Kauffman and others, 2020a, 2022a, c, 2024a). The map layers for most of the herds included in the report series are also available from Kauffman and others (2020b, 2022b, d, 2024b). This report, volume 5 in the series, details migrations and seasonal ranges from 36 additional herds and includes 2 herd updates from Kauffman and others (2020a, 2022a). Taken together, the report series has detailed the migrations of 218 unique ungulate herds throughout the Western United States and continues to serve as a valuable resource in local and regional management, policy, and conservation regarding ungulate migrations.
The CMT’s work and importance builds from three principles: (1) migration is an important behavior that is fundamental to sustaining many ungulate herds in the Western United States, (2) human development and other threats continue to negatively affect ungulate migration through decreasing landscape permeability and accelerating habitat loss, and (3) additional resources and tools, such as maps documenting and describing known migratory routes, are fundamental to advancing conservation opportunities.
Throughout the Western United States, ungulates commonly migrate to track spatially and temporally variable resources or environmental conditions, such as optimal forage (Merkle and others, 2016; Aikens and others, 2020) or variability in regional winter conditions (Kauffman and others, 2021). Migrations have evolved across generations in ungulates (Jesmer and others, 2018; Lowrey and others, 2020) and are vital to sustaining healthy herds throughout the region. As global positioning system (GPS) technology continues to advance our understanding of ungulate migrations, biologists have also documented an expanding number of threats. The Western United States underwent widespread human development in the late 1900s (1970–99; Gude and others, 2006), which was further heightened during the 2000s and the Coronavirus Disease 2019 pandemic (U.S. Census Bureau, 2022; Rawlings, 2023). The expanding human footprint of roads, fences, housing, energy infrastructure, and increasing traffic volumes result in direct habitat loss, reduced habitat availability, and an increasing number of barriers across the landscapes that ungulates traverse during their migrations and within their seasonal ranges. Such activities can negatively affect wildlife, including ungulates (Sawyer and others, 2009; Aikens and others, 2022; Eacker and others, 2023) and can result in population declines. Documenting and describing migrations across the Western United States provides decisionmakers with information and tools to better mitigate the effects of existing or proposed development through targeted conservation, policy, and management measures. Decisions regarding wildlife that are implemented in the absence of mapped migrations may not be as effective as when relevant information and tools describing existing migrations are readily available and incorporated into the decision-making process.
The CMT uses multiple approaches to ensure that the products and tools from the mapping effort across the Western United States are available to local, State, regional, and national decisionmakers. For example, the CMT primarily consists of wildlife biologists and researchers who work with regional supervisors and other State or Tribal leaders to define and execute local priorities, such as deciding which herds should be mapped and what methods should be used. Additionally, the CMT summarizes aspects of the report series and delivers summary products directly to agency directors. In 2023, the CMT compiled a detailed list of the herds that migrated across lands managed by the U.S. Department of Agriculture (USDA) Forest Service (FS), U.S. Fish and Wildlife Service, Bureau of Land Management (BLM), National Park Service (NPS), and regional Tribal agencies, and created a package containing maps and summary information, which was sent to the directors of the respective agencies. Similar packages have been compiled for each of the Western States and sent to the director of the respective State wildlife management agency. These approaches, which span local, regional, and Federal levels, help to ensure that the products and tools from this mapping effort are available to inform management across the Western United States.
The most useful aspect of this report series is the ways in which the migration maps are being used for on-the-ground management and conservation. Here we build from Kauffman and others (2020a, 2022a, c, 2024a) and describe some of the new initiatives that are incorporating the products, tools, and information from this report series. These case studies do not provide an exhaustive list of the State, Tribal, regional, or Federal initiatives using the mapped migrations as a resource. Instead, the case studies are meant to illustrate the many ways that the migration maps can be used to better manage and accommodate ungulate migrations amid changing landscapes.
U.S. Department of Agriculture Migratory Big Game Initiative
Mapping ungulate migrations across the Western United States has shown that these seasonal movements depend on working lands owned by Tribes or other private landowners. Although public lands, including national parks and forests, protect key migratory habitats (such as stopover areas), the patchwork of private lands helps to connect seasonal ranges along the full length of the migration corridor. For example, in a study of Cervus canadensis (elk) migrations in the Greater Yellowstone Ecosystem (including lands in Idaho, Montana, and Wyoming and encompassing Yellowstone and Grand Teton National Parks), Gigliotti and others (2022) found that private lands comprised an average of 21 percent of the migration corridors and as much as 91 percent for some migratory herds.
Recognizing the unique role that private lands have in ungulate conservation, the USDA worked with Wyoming in 2022 to create a partnership, the Migratory Big Game Initiative, to support voluntary conservation of working lands in the State. The multimillion-dollar initiative focused on key geographic areas, including the earliest migrations mapped in Wyoming, and leveraged Federal funding to conserve and enhance migratory habitat through conservation easements, weed treatments, and fence modifications. In 2023, the USDA expanded their Migratory Big Game Initiative to include Montana and Idaho in addition to the pilot work already begun in Wyoming (Natural Resources Conservation Service [NRCS], 2023). Through the 2018 U.S. Farm Bill (Public Law 115–334) funding and the Inflation Reduction Act (Public Law 117–169), the USDA will make substantial investments in the private lands that support migration in all three States. This initiative, like previous work in the Working Lands for Wildlife program of the USDA NRCS, recognizes that private lands provide the best wildlife habitat when they are maintained as large working ranches rather than subdivided into smaller parcels with a subsequent increase in homes, fences, and roads. Many of the USDA’s efforts in priority areas have been guided by migrations mapped in figure 1 (Kauffman and others, 2020a, 2022a, c).
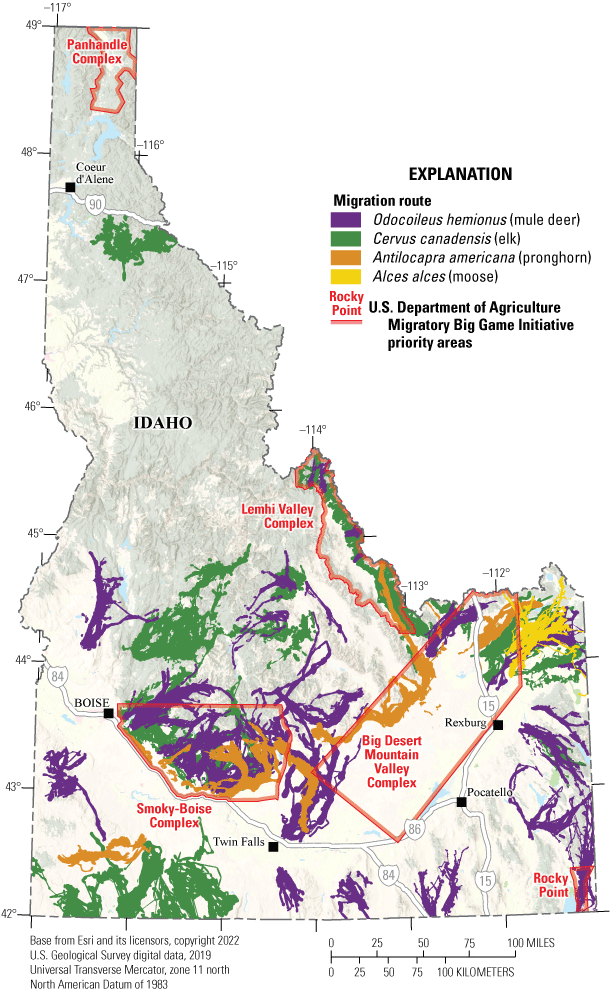
Map showing five priority areas in Idaho to receive funding from the U.S. Department of Agriculture Migratory Big Game Initiative. These priority areas were partially defined by the mapped migration routes for Odocoileus hemionus (mule deer), Cervus canadensis (elk), Antilocapra americana (pronghorn), and Alces alces (moose) across Idaho.
Planning for Renewable Energy in Arizona
A key challenge for herds that cross the mosaic of working lands of the Western United States has been maintaining the necessary migrations in the face of new development. Research indicates that most kinds of development impede or constrain ungulate movements to some degree (Sawyer and others, 2013; Wyckoff and others, 2018), which can reduce the ability of migrants to track phenological gradients, or changes in nutritious plant green-up, and access optimal forage (Aikens and others, 2022). As of 2024, tolerable thresholds of fences, roads, or other barriers are not clearly identified, and it is important to minimize barrier effects to maintain functional migration corridors across the landscape (Sawyer and others, 2013, 2020).
Because of the global push to reduce greenhouse gas emissions and build up renewable energy, industrial solar development is increasing across the landscapes where ungulates migrate and there are unknown consequences for migration (Sawyer and others, 2022). The Arizona Game and Fish Department (AZGFD) has been an active participant in the CMT since Secretarial Order 3362 was signed in 2018. Secretarial Order 3362 supported new GPS collaring in 2019, which allowed AZGFD to expand existing efforts and map migrations of the San Francisco Peaks Odocoileus hemionus (mule deer) herd that were originally identified in a 2007–09 highway study (Dodd and others, 2012a). A coarse-scale migration of this herd was mapped in Kauffman and others (2020a) using migration data from a few GPS-collared individuals. The map was then updated with a larger sample size funded through Secretarial Order 3362 in Kauffman and others (2022a). In total, 46 migrations were included in the final map (Kauffman and others, 2022a). A GPS-collar study of the North of Interstate 40 Antilocapra americana (pronghorn) herd, also mapped in Kauffman and others (2022a), revealed a migration parallel to that of the mule deer (fig. 2).
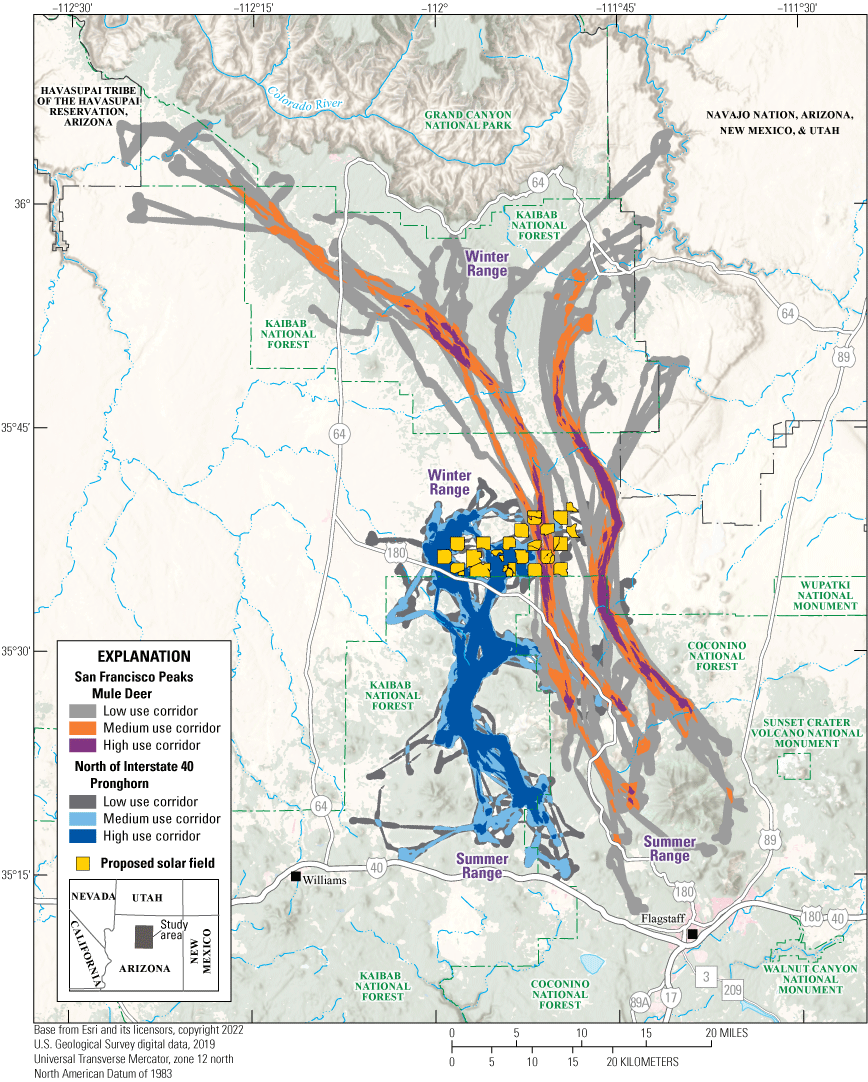
Map showing the San Francisco Peaks mule deer herd and the North of Interstate 40 pronghorn herd. After the signing of Secretarial Order 3362, the Arizona Game and Fish Department worked with the Corridor Mapping Team to analyze and map these two herds. Detailed migration maps helped the agency work with the private landowner and developer to design a solar energy footprint to facilitate migratory movements.
The AZGFD already had the mule deer and pronghorn migration maps when a new renewable energy development was proposed: building 17 different solar arrays and 66 wind turbines was proposed on private ranch lands overlapping the identified migration corridors. The Babbitt Ranches comprises a complex of ranch properties that, together with leased public lands, cover approximately 700,000 acres (283,280 hectares [ha]) in Arizona. One of the Babbitt Ranches, CO Bar Ranch, is a checkerboard of State and private lands nestled among the Kaibab National Forest to the north, the Coconino National Forest to the south, and Navajo Nation, Arizona, New Mexico, & Utah (hereafter Navajo Nation) lands to the east (fig. 2). The proposed development considerably overlapped the North of Interstate 40 pronghorn corridor where it approached the herd’s winter range (Kauffman and others, 2022a). For the San Francisco Peaks mule deer herd, the planned development overlapped a segment of the migration corridor that was fairly narrow and 30–40 miles (mi; 48–64 kilometers [km]) to the south of winter ranges and to the north of summer ranges, respectively.
The migration maps revealed that the development had the potential to constrain the existing migratory movements for these two Arizona ungulate herds. The landowners were aware of the ranch value to wildlife and motivated to find a design that would allow the development of renewable energy while still enabling pronghorn and mule deer to move across their lands each spring and fall. Maintaining movement through the renewable energy development meant creating gaps for the animals to move through, but as of 2024, it is still unknown with sufficient precision how wide such gaps should be to accommodate different kinds of disturbance (Sawyer and others, 2020). Together, the AZGFD, CO Bar Ranch, Coconino County, and the solar developer designed many corridors ranging from a few hundred feet (ft) to 0.5 mi (0.8 km) wide through the arrays of solar panels. This design was implemented as a natural experiment using continuous monitoring of GPS-collared mule deer and pronghorn to identify the corridor widths preferred by each species. These GPS collars use an option, called “geofence,” that increases the frequency of recorded GPS locations from every 3 hours to every 15 minutes when animals are near a solar facility. This approach will allow AZGFD to evaluate which corridor widths allow free passage of migrating animals. This study—like others guided by migration maps created from movement data—can potentially mitigate the barrier effects of renewable energy development and help biologists and managers learn and refine best management practices that can sustain ungulate movements in the face of a rapidly developing Western United States.
Ungulate Migrations Across Tribal Lands
Tribal lands provide exceptional wildlife habitat for ungulates and other animals, especially during vulnerable periods like spring and fall migrations. The 218 herds mapped as a part of this USGS report series navigate a complex landscape of State, Tribal, Federal, and privately owned lands during their seasonal migrations (Kauffman and others, 2020a, 2022a, c, 2024a). Of the 218 herds mapped in Kauffman and others (2020a, 2022a, c, and 2024a), 42 herds (14 elk herds, 24 mule deer herds, 3 pronghorn herds, and 1 Odocoileus virginianus [white-tailed deer] herd) use 35 unique Tribal lands during their seasonal migrations. Some of these herds are administered by Tribes like the Navajo Nation, Eastern Shoshone Tribe of the Wind River Reservation, Wyoming, and Northern Arapaho Tribe of the Wind River Reservation, Wyoming; other herds are managed by the respective State wildlife management agency. We highlight five herds that rely on Tribal lands, which were previously described in Kauffman and others (2022a, c) in the “Navajo Nation Canyon de Chelly and Ram Pasture Mule Deer,” “New Mexico Rosa Mule Deer,” and “Wind River Reservation Owl Creek Mountains and Wind River Mule Deer” sections. The compilation of the migration patterns of western ungulates in this report series emphasized that migratory ungulates traverse vast gradients in elevation, vegetation green-up, snow, and other landscape attributes (for example, human development), and that their movements do not follow jurisdictional boundaries. The diversity of landscape attributes that ungulates require means that some migratory ungulates must access Tribal lands for shelter during harsh winters or to find forage in the spring and summer. Although some migrations are fully contained on Tribal lands, most migrations move beyond Tribal lands for at least part of the annual cycle. These lands and the wildlife habitat stewarded by Tribes are thus a key component of the western landscapes that sustain ungulate migrations.
Navajo Nation Canyon de Chelly and Ram Pasture Mule Deer
The Navajo Nation Canyon de Chelly and Ram Pasture mule deer herds are two of several herds that winter in the foothills of the Chuska Mountains within the southeast Colorado Plateau on Navajo Nation land (fig. 3A; Kauffman and others, 2022c). Both herds were previously mapped in Kauffman and others (2022c). The winter ranges and migration corridors of the Navajo Nation Canyon de Chelly mule deer herd are 7 mi (11 km) south of the Navajo Nation Ram Pasture herd but are separated geographically by Canyon del Muerto and Black Rock Canyon. These canyons are part of a larger canyon system known as the Canyon de Chelly National Monument, one of four parks in the Federal park system managed by a Native American Tribe, although the U.S. Government owns none of the parklands (NPS, 2021).
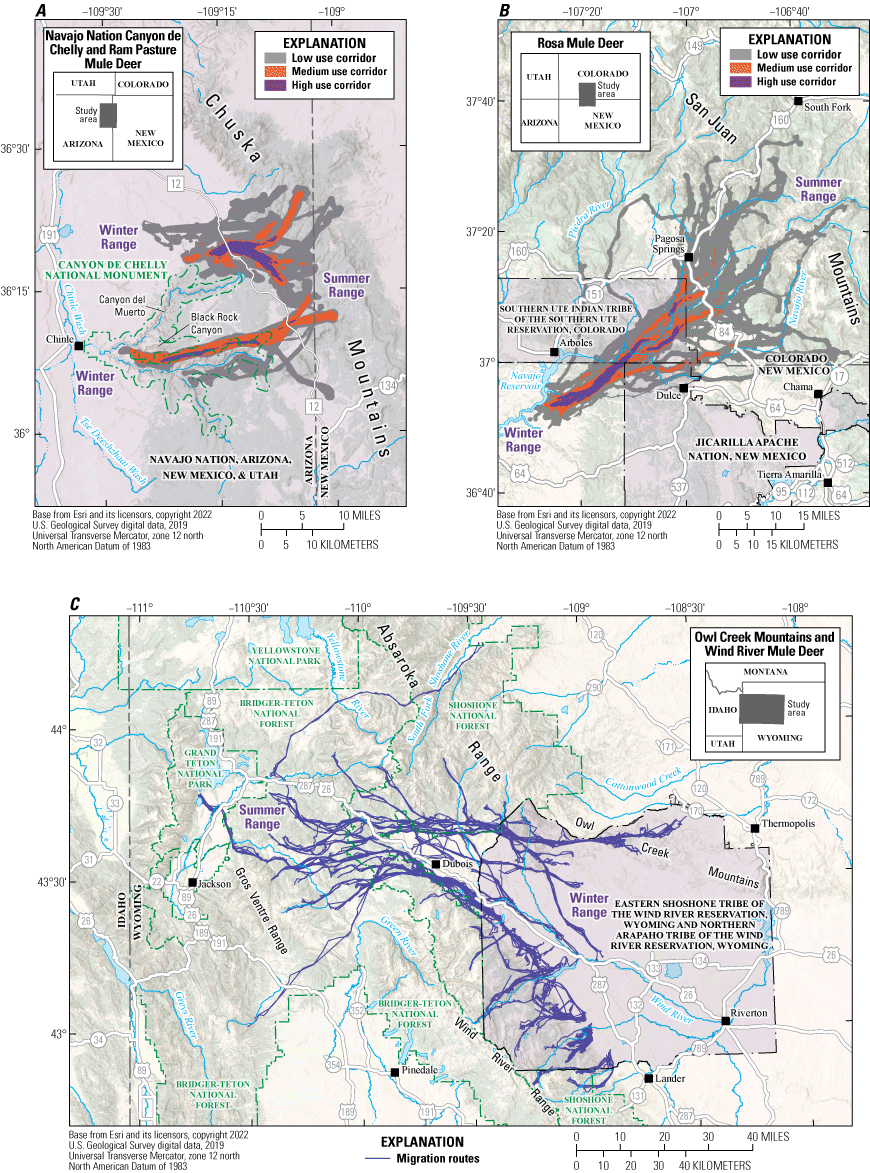
Maps showing Tribal lands and the wildlife habitat stewarded by Tribal wildlife managers are critical to sustain ungulate migrations. Navajo Nation Canyon de Chelly and Ram Pasture mule deer herds depend on A, Navajo Nation, Arizona, New Mexico, & Utah land; B, Rosa mule deer cross the Southern Ute Indian Tribe of the Southern Ute Reservation, Colorado Reservation and Jicarilla Apache Nation, New Mexico Tribal lands during their seasonal migrations; and C, Wind River and Owl Creek Mountains mule deer rely on the Wind River Reservation.
Navajo Nation Canyon de Chelly mule deer migrate an average of 18 mi (28 km) and spend most of the winter on top of the canyon mesas. In these areas, windmills installed for livestock used by the Navajo Nation Department of Water Resources provide a valuable water source for the Navajo Nation Canyon de Chelly mule deer. Navajo Nation Ram Pasture mule deer migrate an average of 11 mi (17 km) and have winter and summer ranges that remain entirely within Tribal trust lands managed by the Navajo Nation Department of Fish and Wildlife. During spring and fall migrations, Navajo Nation Canyon de Chelly mule deer and Ram Pasture mule deer must cross Indian Route 12, a busy rural highway along the Arizona and New Mexico border where wildlife-vehicle collisions (WVC) are a common problem. Limiting factors for the Navajo Nation Ram Pasture herd include low-quality habitat caused by overgrazing and resource competition with feral horses and unregulated livestock (Davies and Boyd, 2019; Wallace and others, 2021). Furthermore, extended drought and habitat fragmentation caused by urban development have accelerated the decline of habitat suitability (Redsteer and others, 2013; Nania and others, 2014). Mule deer in these herds were first GPS-collared in 2018 and are part of a long-term project to provide baseline data for the development of a Navajo Mule Deer Management Plan and an ultimate goal of recovering mule deer populations to historical numbers across Navajo Nation land.
New Mexico Rosa Mule Deer
The Rosa Mule Deer herd, previously mapped in Kauffman and others (2022a), migrates an average of 45 mi (73 km) from the herd’s winter range in northwest New Mexico, crossing the Southern Ute Indian Tribe of the Southern Ute Reservation, Colorado, and Jicarilla Apache Nation, New Mexico, lands during their 3-week-long migration, before settling on summer ranges in the San Juan Mountains in Colorado (fig. 3B). Analysis of the GPS data collected between 2011 and 2018 identified four high use corridors that radiate from a shared winter range to multiple summer ranges. These data revealed that mule deer migrating along exterior high use corridors—which researchers suspect experienced different conditions than those conditions on the interior corridors—had a nearly three times higher mortality risk than mule deer using interior corridors (Sawyer and others, 2019). The data also identified several specific areas where mule deer migrated across U.S. Highway 84, to the south of Pagosa Springs, Colorado (Sawyer, 2018); these areas have been used to inform highway crossings to minimize WVC (Kauffman and others, 2022c).
Wind River Reservation Owl Creek Mountains and Wind River Mule Deer
The Owl Creek Mountains and Wind River mule deer herds winter on the Wind River Reservation and were previously mapped in Kauffman and others (2022a). The winter ranges of both mule deer herds are largely within the Wind River Reservation, managed by the Eastern Shoshone Tribe of the Wind River Reservation, Wyoming, and Northern Arapaho Tribe of the Wind River Reservation, Wyoming. The Owl Creek Mountains mule deer migrate an average of 63 mi (101 km), moving to the west from their winter ranges to the south of the Absaroka Range and Owl Creek Mountains. The Wind River mule deer winter in habitats south of the Wind River and migrate an average of 29 mi (47 km), moving largely unimpeded in a northwestern direction along the slopes of the Wind River Range (fig. 3C). The two herds overlap on productive summer ranges of the Gros Ventre and Absaroka Ranges and the Shoshone and Bridger-Teton National Forests. The migration routes of some Wind River mule deer in the southwestern section of the Wind River Reservation stay within the reservation; thus, their entire annual cycle is within the sovereignty of the Eastern Shoshone Tribe of the Wind River Reservation, Wyoming, and Northern Arapaho Tribe of the Wind River Reservation, Wyoming (Kauffman and others, 2022a).
The reservation is largely intact with very little human development. Additionally, Tribal policies limit where rural housing and development are allowed, and the Tribes manage sustainable harvest through a Tribal game code that was established in 1984 to help ensure the long-term persistence of these herds (Nickerson, 2019; Shoshone & Arapaho Tribal Court, 2004). However, some of the herds’ winter range and migrations intersect U.S. Highway 26/287, which is one of the highest priority areas in Wyoming for reducing WVC (Wyoming Wildlife and Roadways Initiative, 2019). Critically, the migration routes extend through residential areas, such as Dubois, Wyoming, threatening migrating mule deer with risks of WVC, fences, and other barriers (Kauffman and others, 2022a).
Herd Summaries
The herd-specific maps and associated summary text make up the core content of the USGS “Ungulate Migrations of the Western United States” report series. This section includes maps documenting the migrations for 36 mule deer, elk, pronghorn, and Alces alces (moose) herds from most Western States and select Tribal lands. In addition, this report contains updates to two herds, the Soda Hills and Bear Lake Plateau mule deer in Idaho, that were included in Kauffman and others (2020a, 2022a). The maps in this report were produced in close collaboration with participating State or Tribal agencies that collected and analyzed the GPS-collar data to delineate the migration corridors and seasonal ranges. The specific methods, space-use classifications (for example, low, medium, or high use corridors), and data layers (for example, migration routes shown as lines and corridors, stopovers, winter ranges, or annual ranges shown as polygons) vary across herds in the report to adhere to agency-specific policies and procedures.
In addition to the herd maps, this section includes project and analytical details, summary statistics for the underlying data, and relevant contacts and reports for each herd. The general workflow for each herd’s data analysis consisted of the following steps: (1) selecting migration dates for each animal year using the Migration Mapper application (Merkle and others, 2022; app. 1), (2) using a Brownian bridge movement model to estimate a utilization distribution (UD) for each migration sequence (Horne and others, 2007; app. 1), (3) averaging the UDs for a given individual’s migration sequences for all years, and (4) stacking the averaged individual UD for a given herd and defining different levels of migration-route use on the basis of the number of individuals using a given pixel or defined area of space. In general, we define “low use” as areas traversed by at least 1 collared individual during migration, “medium use” as areas used by 10–20 percent of collared individuals in the herd, and “high use” as areas used by greater than (>) 20 percent of collared individuals in the herd. A complete description of the methods and herd-specific modifications is included in appendix 1. The data layers for many of the herd maps in this report are also publicly available in the associated USGS data release (Kauffman and others, 2025).
California | Mule Deer
Casa Diablo Mule Deer
Casa Diablo mule deer are largely traditional migrants and use a wide area primarily spread across public lands. The herd’s winter range extends between the Benton Range and eastern Inyo National Forest. Snowfall can be extreme in the Sierra Nevada and exceed 800 inches (in.; 20.3 meters [m]) in heavy-snow winters, during which deer migrate to areas less than (<) 6,000 ft (1,829 m) in elevation to escape deep snow. In spring, individuals move to the west using a wide range of routes; however, a concentrated migration corridor passes through Long Valley, California (in Mono County), across U.S. Highways 395 and 120, and into the high mountains of the Sierra Nevada (fig. 4). Summer range habitat extends across both sides of U.S. Highway 395. The herd remains to the east and to the south of the Yosemite National Park boundary, typically summering at elevations from 8,000 to 11,000 ft (2,438 to 3,353 m). The primary causes of mortality include Puma concolor (mountain lion) predation, followed by vehicle collisions, most of which are on U.S. Highway 395 during fall and spring migrations. In 2019, the population size of the Casa Diablo herd was estimated at 2,460 (range of 2,037–3,107) mule deer.
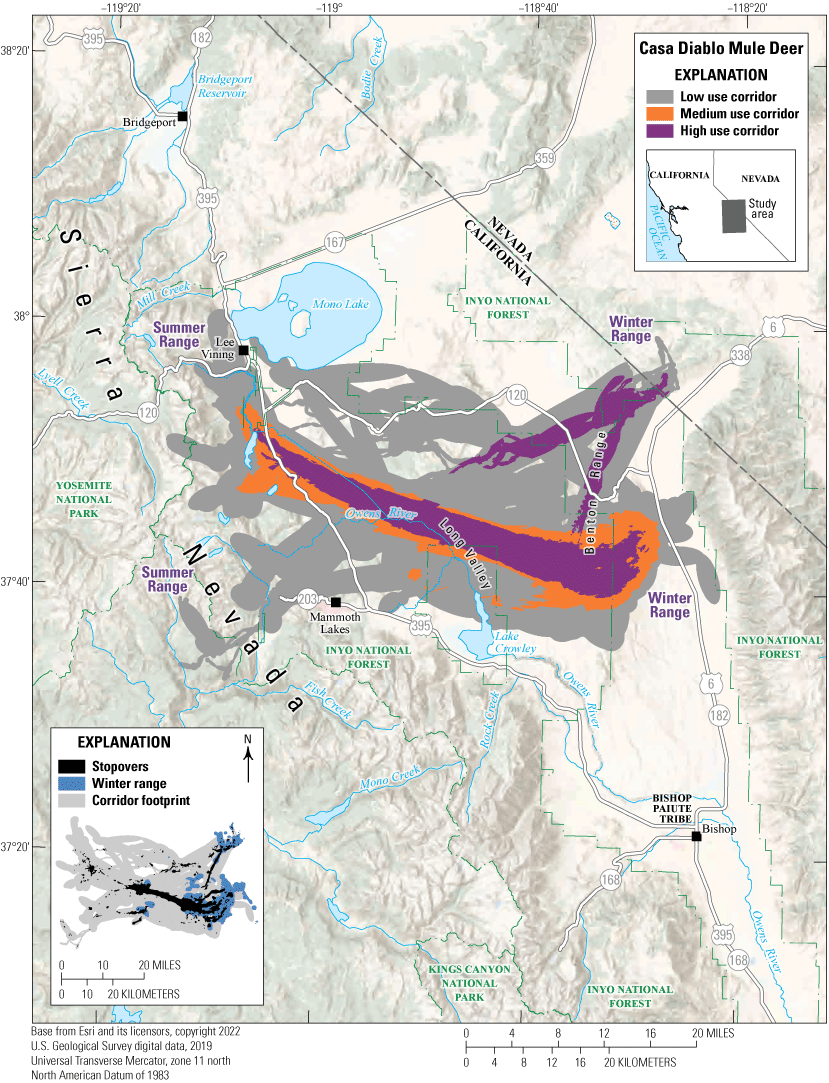
Map showing migration corridors, stopovers, and winter ranges of the Casa Diablo mule deer herd.
Animal Capture and Data Collection
Sample size: 130 adult female mule deer
Relocation frequency: Approximately 1−24 hours
Project duration: 2014–23
Data Analysis
Corridor, stopover, and winter range analysis: Fixed Motion Variance (refer to app. 1 for further description)
Delineation of migration periods: Net Squared Displacement (Bunnefeld and others, 2011; app. 1)
Models derived from:
Migration use classifications:Corridor and Stopover Summary
Migration start and end dates (median):
Number of days migrating (mean): Migration corridor length: Migration corridor area:California | Mule Deer
Pacific Mule Deer
The Pacific mule deer herd inhabits 353 square miles (mi2; 914 square kilometers [km2]) of public and private lands in Placer and El Dorado Counties in California (Hinz, 1981), including the Eldorado National Forest and private lands owned by Sierra Pacific Industries and Sacramento Municipal Utility District. During the fall migration, Pacific mule deer move approximately 19 mi (30 km) to the foothills of the western Sierra Nevada, using stopovers while migrating to their winter range (fig. 5). U.S. Highway 50 and the Middle Fork American River bound the herd’s migration routes on the south and the north, respectively. During winter, the migratory part of the population intersperses with resident deer at lower elevations (2,296–2,953 ft [700–900 m]).
The Pacific mule deer herd has been declining for decades because of several factors, including predation, recreation, poaching, disease, and wildfire suppression (Hinz, 1981). Studies indicate a below-average adult survival rate of 77 percent for this herd (Merrell and others, 2023). In September and October of 2014, the King fire, a severe wildfire, burned 151 mi2 (391 km2) across much of the midelevation area (Merrell and others, 2023). Plant succession after the fire modified the way mule deer use the area; for example, females now remain in the burned areas during winter months (Merrell and others, 2023).
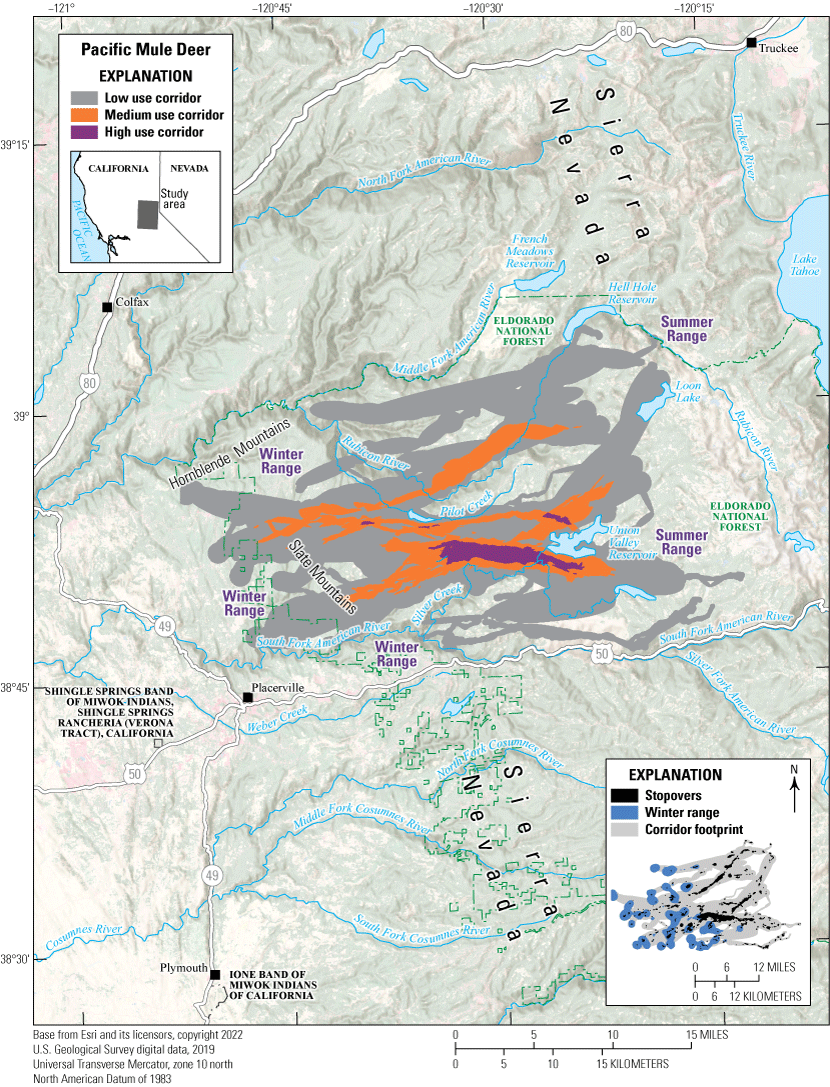
Map showing migration corridors, stopovers, and winter ranges of the Pacific mule deer herd.
Animal Capture and Data Collection
Sample size: 52 adult female mule deer
Relocation frequency: Approximately 1−13 hours
Project duration: 2015–20
Data Analysis
Corridor, stopover, and winter range analysis: Fixed Motion Variance (refer to app. 1 for further description)
Delineation of migration periods: Net Squared Displacement (Bunnefeld and others, 2011; app. 1)
Models derived from:
Migration use classifications:Corridor and Stopover Summary
Migration start and end dates (median):
Number of days migrating (mean): Migration corridor length: Migration corridor area:Winter Range Summary
Winter start and end dates (median):
-
• November 2 to April 29
-
• Winter length (mean): 170 days
-
• Winter range (50 percent contour) area: 52,393 acres (21,203 ha)
-
• Shelly Blair (Shelly.Blair@wildlife.ca.gov), Wildlife Biologist, California Department of Fish and Wildlife
-
• Brian Leo (Brian.Leo@wildlife.ca.gov), Statewide Deer Coordinator, California Department of Fish and Wildlife
-
• Jerrod Merrell (jmerrell@unr.edu), Graduate Student, University of Nevada Reno
Colorado | Mule Deer
Middle Park Mule Deer
The Middle Park mule deer herd (Data Analysis Unit [DAU] D9) inhabits the large, high-elevation basin of Middle Park in northwestern Colorado, surrounded by mountain ranges (fig. 6). The area encompasses approximately 2,387 mi2 (6,182 km2) and is bound on the east, the north, and the south by the Continental Divide, and on the west by the Gore Range. Elevations within the herd management area (HMA) for the Middle Park mule deer range from 7,300 ft (2,225 m) along the Colorado River near Kremmling, Colorado, to peaks exceeding 14,200 ft (4,328 m) along the Continental Divide and Tenmile Range. The area comprises a mix of land ownership, including 5 percent State land, 25 percent private land, and 70 percent Federal land (FS, BLM, and NPS). Most private land is at the lower elevations.
Historically, the Middle Park mule deer herd contained between 9,000 and 17,000 animals and, as of 2024, was estimated at 7,500 mule deer (Colorado Parks and Wildlife [CPW], 2023; E. Slezak, CPW, written commun., 2024). Since 1998, CPW has intensively monitored the Middle Park mule deer herd with very high frequency (VHF) radio collars and GPS collars. The primary goals of this ongoing study are to assess survival rates and determine cause-specific mortality, and secondary goals are to identify the herd’s distribution, movement, and migration patterns. Efforts were initially focused on females and fawns, but males were added to the study in 2010. The CPW began transitioning from VHF radio collars to GPS collars in 2019 and maintains a minimum sample size of 90 males and 90 females each year. Additionally, CPW collars 60 fawns annually, although they transitioned from VHF radio collars to GPS collars in 2024. The analysis in this report includes a subset of the total GPS-collared individuals—67 adult female and 71 adult male mule deer—that were monitored from 2019 to 2021.
During the summer, the herd is widely dispersed, inhabiting a range of habitats from agricultural areas in valley bottoms to alpine habitats that exceed elevations of 10,000 ft (3,048 m). During mild winters, the herd primarily inhabits Artemisia spp. (sagebrush) and Populus spp. (aspen) woodland interfaces. Mule deer concentrate closer to the valley and along southern- and western-facing exposures—where they frequently overlap with wintering elk—as temperatures drop and snow depth increases. During severe winters, adult survival declines and estimated fawn survival is much lower than average. Since 1980, 4 of the 7 most severe winters were within the past decade (2013–23). Severe winter conditions can concentrate animals at lower elevations and increase the number of WVC along U.S. Highway 40 and Colorado State Highway 9, which intersect the core winter ranges of the Middle Park mule deer herd. Wildlife crossing structures and fencing erected in 2016 along a 10-mi (16-km) section of Colorado State Highway 9 to the south of Kremmling, Colorado, have decreased WVC (primarily mule deer-vehicle collisions [DVC]) by more than 90 percent (Colorado Virtual Library, 2022).
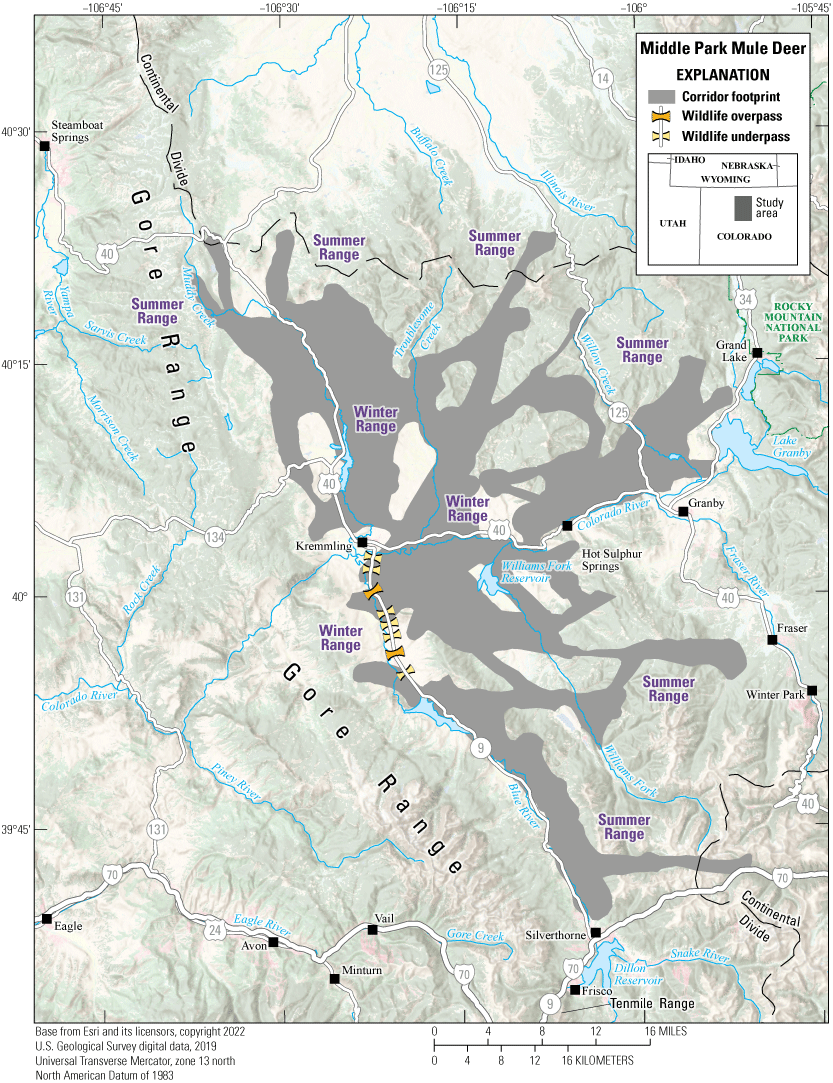
Map showing migration footprint used by at least two individuals of the Middle Park mule deer herd.
Animal Capture and Data Collection
Sample size: 138 adult mule deer (71 males, 67 females)
Relocation frequency: 13 hours
Project duration: 2019–present (data through December 2021 analyzed for this report)
Data Analysis
Corridor analysis: Fixed Motion Variance (refer to app. 1 for further description)
Delineation of migration periods: Net Squared Displacement (Bunnefeld and others, 2011; app. 1)
Models derived from:
Migration use classifications:Corridor Summary
Migration start and end dates (median):
Number of days migrating (mean): Migration corridor length: Migration corridor area:Other Information
Project contacts:
-
• Elissa Slezak (elissa.slezak@state.co.us), Wildlife Biologist, Colorado Parks and Wildlife
-
• Michelle Cowardin (michelle.cowardin@state.co.us), Wildlife Movement Coordinator, Colorado Parks and Wildlife
-
• Michelle Flenner (michelle.flenner@state.co.us), Geographic Information System (GIS) Specialist, Colorado Parks and Wildlife
-
• Andy Holland (andy.holland@state.co.us), Big Game Manager, Colorado Parks and Wildlife
Colorado | Mule Deer
White River Mule Deer
The White River mule deer herd (DAU D7) inhabits the northern part of the Colorado plateau in northwestern Colorado (fig. 7). Encompassing approximately 4,120 mi2 (10,670 km2), the White River HMA contains the headwaters of the White River, Yampa River, and Williams Fork. It is primarily bound on the north by the Yampa River and U.S. Highway 40; on the east by U.S. Highway 40, Colorado State Highway 131, and the divide between the Yampa River and Williams Fork; on the south by the divide between the Colorado River and White River; and on the west by the divide between Douglas Creek and Piceance Creek. Elevations range from 5,400 ft (1,645 m) along the White River to 12,000 ft (3,657 m) in The Flat Tops. Land ownership is a mix of 42 percent private land, nearly 5 percent State land, and 54 percent Federal land (FS, BLM, and NPS); most private land is at lower elevations.
Historically, the White River mule deer herd contained more than 100,000 mule deer; however, the herd has declined from those levels and contains <20,000 mule deer as of 2024 (CPW, 2023; D. Finley, CPW, written commun., 2024). The causes for the decline include cumulative effects from weather, such as drought and severe winters, habitat conditions, and disease, such as chronic wasting disease (CWD; CPW, 2023). Since 2001, CPW has intensively monitored the White River mule deer herd with VHF radio collars and GPS collars. Similar to the Middle Park mule deer herd (refer to the “Middle Park Mule Deer” section in this report), the primary goals of this ongoing study are to assess survival rates and determine cause-specific mortality, and secondary goals are to identify the herd’s distribution, movement, and migration patterns. The CPW initially focused their collaring efforts on females and fawns and then started collaring males in 2008. After 2012, CPW transitioned from using VHF radio to GPS collars for females and collared a minimum of 90 females each year. The CPW made the same transition to GPS collars for males after 2019 and for fawns after 2021 and collared at least 110 males and 80 fawns each year. The analysis in this report includes a subset of the total GPS-collared individuals—493 adult female mule deer—that were monitored from 2013 to 2021.
During the summer, the GPS-collared White River mule deer use higher-elevation public lands and privately owned agricultural areas. Winter ranges for this herd primarily contain lower elevation Pinus spp. (pinyon)-Juniperus spp. (juniper) woodlands and sagebrush, as well as midelevation mixed-mountain shrub ranges. In the winter, mule deer concentrate along the south- and west-facing exposures across western Colorado as temperatures drop and snow depth increases. During severe winters, mule deer adult survival declines, and estimated fawn survival is much lower than average. In addition, mule deer and elk overlap on winter ranges and potentially increase competition for high-quality winter forage. The severity of winter conditions can increase the number of WVC along Colorado State Highways 13 and 64, which intersect the herd’s winter ranges and migration corridors.
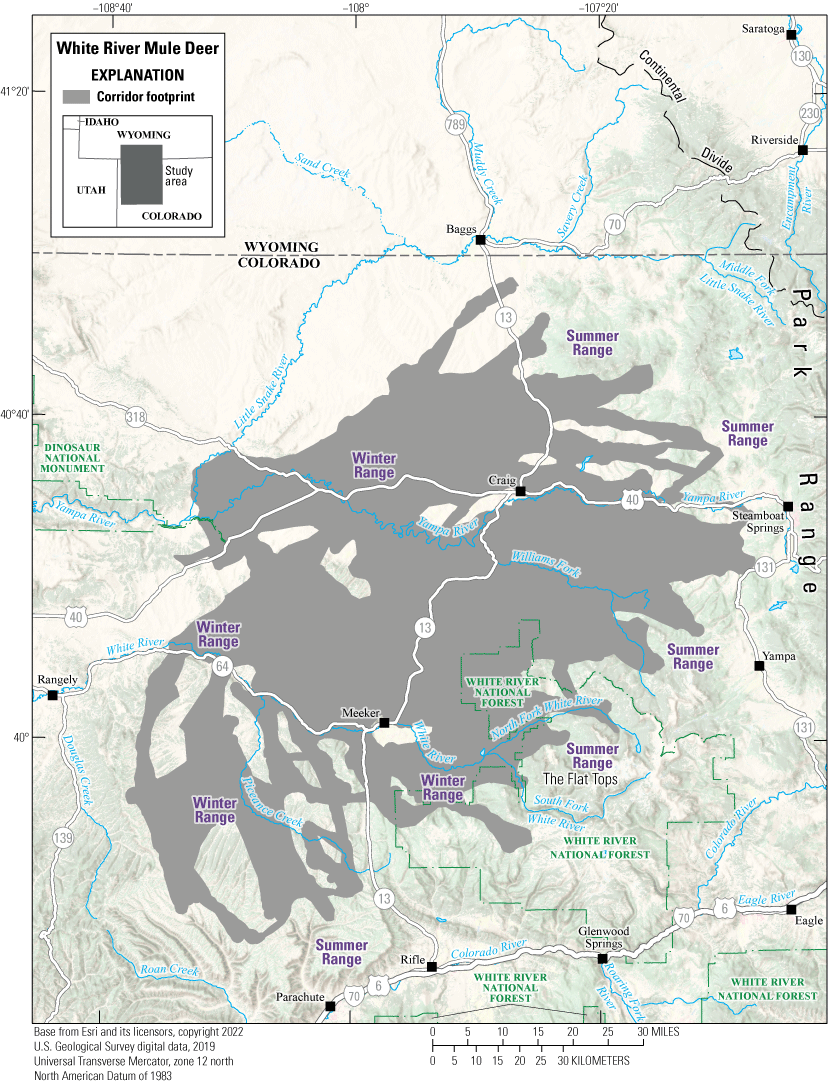
Map showing migration footprint used by at least two individuals of the White River mule deer herd.
Animal Capture and Data Collection
Sample size: 493 adult female mule deer (includes mule deer from the adjacent unit to the north that shared winter ranges)
Relocation frequency: 12 hours
Project duration: 2014–present (data through November 2021 analyzed for this report)
Data Analysis
Corridor analysis: Fixed Motion Variance (refer to app. 1 for further description)
Delineation of migration periods: Net Squared Displacement (Bunnefeld and others, 2011; app. 1)
Models derived from:
Migration use classifications:Corridor Summary
Migration start and end dates (median):
Number of days migrating (mean): Migration corridor length: Migration corridor area:Other Information
Project contacts:
-
• Darby Finley (darby.finley@state.co.us), Wildlife Biologist, Colorado Parks and Wildlife
-
• Michelle Cowardin (michelle.cowardin@state.co.us), Wildlife Movement Coordinator, Colorado Parks and Wildlife
-
• Michelle Flenner (michelle.flenner@state.co.us), GIS Specialist, Colorado Parks and Wildlife
-
• Andy Holland (andy.holland@state.co.us), Big Game Manager, Colorado Parks and Wildlife
Idaho | Mule Deer
Bear Lake Plateau Mule Deer
This herd was originally included in Kauffman and others (2022a) and has been updated for this report because new data from seasonally migrating individuals have nearly doubled (from 28 to 54 mule deer) since the previous analysis in 2020 (Kauffman and others, 2022a). The Bear Lake Plateau mule deer herd inhabits three Western States, Idaho, Utah, and Wyoming, although the herd spends most of the year in southeastern Idaho (fig. 8). The winter range for this tristate herd extends across the Bear Lake Plateau in Idaho and Utah. The seasonal migration routes extend an average of 39 mi (62 km) from southern Idaho, by the west edge of Bear Lake, north to Caribou-Targhee National Forest. These seasonal migrations are funneled across U.S. Highway 30 between mileposts 442 and 448, an area locally referred to as “Rocky Point,” where State highways, railways, and the Bear River converge, condensing routes. After crossing these natural and human-made barriers, the migration follows the Preuss Range north into several summer ranges splitting off from the main migration route. Summer ranges include the Gannett Hills in Wyoming, and the Aspen and Caribou Ranges in Idaho. Challenges for this herd include WVC, wildlife-unfriendly fencing, and mining developments in their summer range.
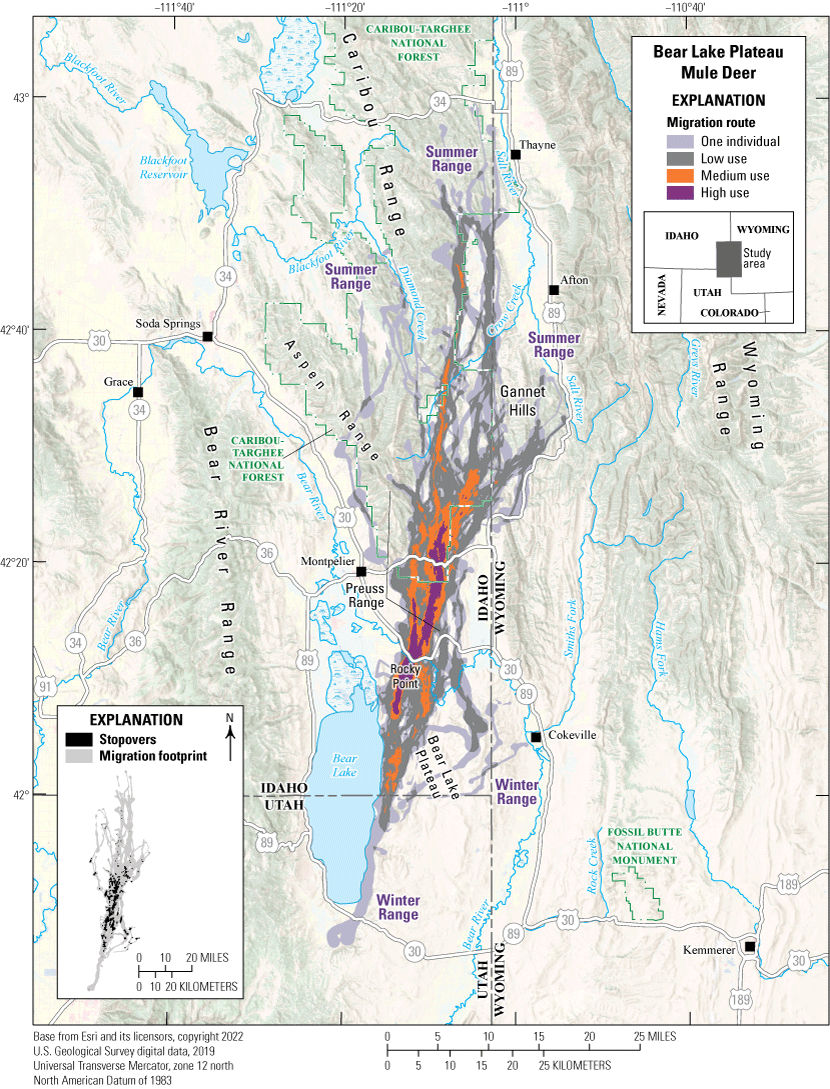
Map showing migration routes and stopovers of the Bear Lake Plateau mule deer herd.
Animal Capture and Data Collection
Sample size: 54 female mule deer
Relocation frequency: Approximately 4–6 hours
Project duration: 2018–21
Data Analysis
Migration route and stopover analysis: Brownian bridge movement models (Sawyer and others, 2009) with an 8-hour time lag
Delineation of migration periods: Net Squared Displacement (Bunnefeld and others, 2011; app. 1)
Models derived from:
Migration use classifications:Migration Route and Stopover Summary
Migration start and end dates (median):
Number of days migrating (mean): Migration route length: Migration route area:Other Information
Idaho migration routes are updated and viewable by the Idaho Fish and Game (Idaho Fish and Game, 2024). Mapping layers shown for this herd are sensitive but may be made available to researchers upon request by contacting Idaho Fish and Game (idfgdatarequests@idfg.idaho.gov).
Project contacts:
-
• Matt Mumma (matt.mumma@idfg.idaho.gov), Wildlife Research Manager, Idaho Fish and Game
-
• Jacob Gray (jacob.gray@idfg.idaho.gov), Natural Resources Program Coordinator—Habitat and Migration, Idaho Fish and Game
-
• Zach Lockyer (zach.lockyer@idfg.idaho.gov), Regional Wildlife Manager, Idaho Fish and Game
-
• Eric Freeman (eric.freeman@idfg.idaho.gov), Regional Wildlife Biologist, Idaho Fish and Game
-
• Scott Bergen, Senior Wildlife Research Biologist, Idaho Fish and Game
-
• Robert Ritson, Associate Research Scientist, Wyoming Cooperative Fish and Wildlife Research Unit, University of Wyoming
-
• Meints, D., Ward, R., Knetter, J., Miyasaki, H., Oelrich, K., Mosby, C., Ellstrom, M., Roche, E., Elmer, M., Crea, S., Smith, D., Hribik, D., Hickey, C., Berkley, R., McDonald, M., Lockyer, Z., Hendricks, C., Painter, G., and Newman, D., 2020, F19AF00858 statewide surveys and inventory final performance report: Boise, Idaho, Idaho Fish and Game, 20 p. [Also available at https://collaboration.idfg.idaho.gov/WildlifeTechnicalReports/F19AF00858%20Statewide%20Surveys%20%20Inventory%20Final%20Report%20FY20.pdf.]
-
• Roberts, S., and Mumma, M., 2023, F22AF03552 statewide wildlife research final performance report: Boise, Idaho, Idaho Fish and Game, 48 p.
Idaho | Mule Deer
Owinza Mule Deer
The Owinza mule deer herd winters in sagebrush-steppe habitat to the north of Interstate 84 in southern Jerome County, near Eden, Idaho (fig. 9). Approximately 20 percent of the Owinza mule deer herd will pause on winter range between the Picabo Hills and northeast of Dietrich, Idaho. When winter snows start to accumulate, these individuals move farther south, toward the southern tip of the winter range. These delayed winter movements, sometimes more than 50 mi (80 km) in straight-line distance, usually do not occur until January or February. In spring, this herd leaves the southern tip of the winter range and migrates through parts of the sagebrush-steppe habitat near Owinza, Idaho, and Sid Butte toward higher elevation habitats within the Sawtooth National Forest and valleys near the Big Wood River. Most of the Owinza mule deer herd summers at high elevations in the Pioneer and Soldier Mountains on the Sawtooth National Forest. Individuals also summer in the foothills along the Camas Prairie and on BLM and private lands in the southern Pioneer Mountains. The Owinza mule deer summer range overlaps with the Pioneer Reservoir and Antelope Creek mule deer herds (refer to the “Pioneer Reservoir Mule Deer Migration Routes” and “Antelope Creek Mule Deer Migration Routes” sections in Kauffman and others, 2020a). Owinza mule deer face multiple challenges along these migration routes, including crossing five highways and navigating a renewable energy development. On their winter ranges, they encounter an increasingly fragmented matrix of private and public lands, renewable energy development, and frequent wildfires that degrade winter range quality and promote the establishment of invasive annual grasses.
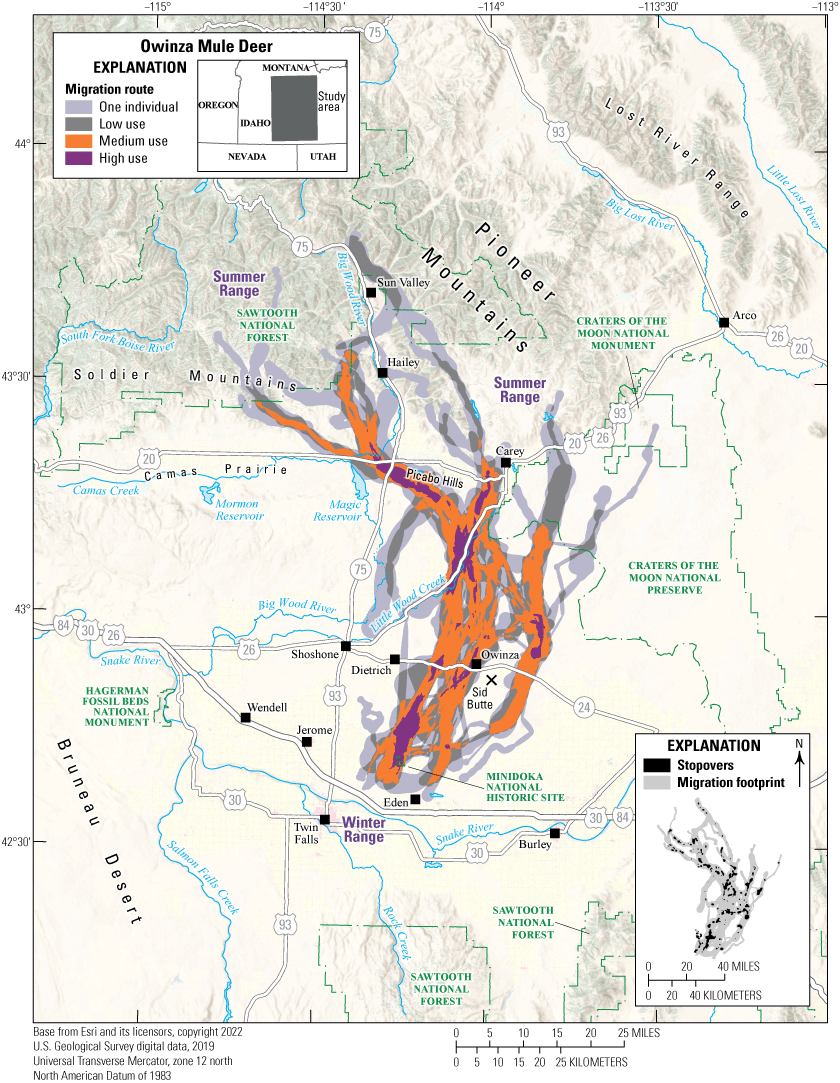
Map showing migration routes and stopovers of the Owinza mule deer herd.
Animal Capture and Data Collection
Sample size: 27 mule deer (3 males, 24 females)
Relocation frequency: Approximately 4–13 hours
Project duration: 2018–20
Data Analysis
Migration route and stopover analysis: Brownian bridge movement models (Sawyer and others, 2009) with an 8-hour time lag for 50 migration sequences and Fixed Motion Variance (11,840 square foot [ft2;1,100 m2]; McKee and others, 2024) with a 14-hour time lag for 2 migration sequences (app. 1)
Delineation of migration periods: Net Squared Displacement (Bunnefeld and others, 2011; app. 1)
Models derived from:
Migration use classifications:Migration Route and Stopover Summary
Migration start and end dates (median):
Number of days migrating (mean): Migration route length: Migration route area:Other Information
Idaho migration routes are updated and viewable by the Idaho Fish and Game (Idaho Fish and Game, 2024). Mapping layers shown for this herd are sensitive but may be made available to researchers upon request by contacting Idaho Fish and Game (idfgdatarequests@idfg.idaho.gov).
Project contacts:
-
• Matt Mumma (matt.mumma@idfg.idaho.gov), Wildlife Research Manager, Idaho Fish and Game
-
• Mike McDonald (mike.mcdonald@idfg.idaho.gov), Regional Wildlife Manager, Idaho Fish and Game
-
• Jake Powell (jake.powell@idfg.idaho.gov), Regional Wildlife Biologist, Idaho Fish and Game
-
• Sierra Robatcek (sierra.robatcek@idfg.idaho.gov), Big Game Habitat Biologist, Idaho Fish and Game
Idaho | Mule Deer
Reynolds Creek Mule Deer
The Reynolds Creek mule deer herd spends the winter at lower elevations to the east of U.S. Highway 95, to the west of Idaho State Highway 78, to the south of the Snake River, and generally to the north of Reynolds, Idaho (fig. 10). During the spring, these mule deer migrate an average of 15 mi (24 km) to the south–southwest along Reynolds Creek and its tributaries to higher elevations in the Owyhee Mountains to the west of Johnston Lakes and to the north of Silver City, Idaho. The winter range and migration habitat primarily comprise low-lying Artemisia tridentata ssp. wyomingensis (Wyoming big sagebrush) steppe, invasive annual grasses, and sporadic agriculture. The summer range comprises a mix of montane grassland, aspen, conifer forest, Cercocarpus ledifolius (curl-leaf mountain-mahogany), and deciduous shrubland. Most of this area is publicly owned and grazed by livestock. Important considerations for environmental planning of the herd’s winter range include mitigating adverse effects of recreation and potential renewable energy development, as well as continued management of wildfire and invasive Bromus tectorum (cheatgrass) encroachment.
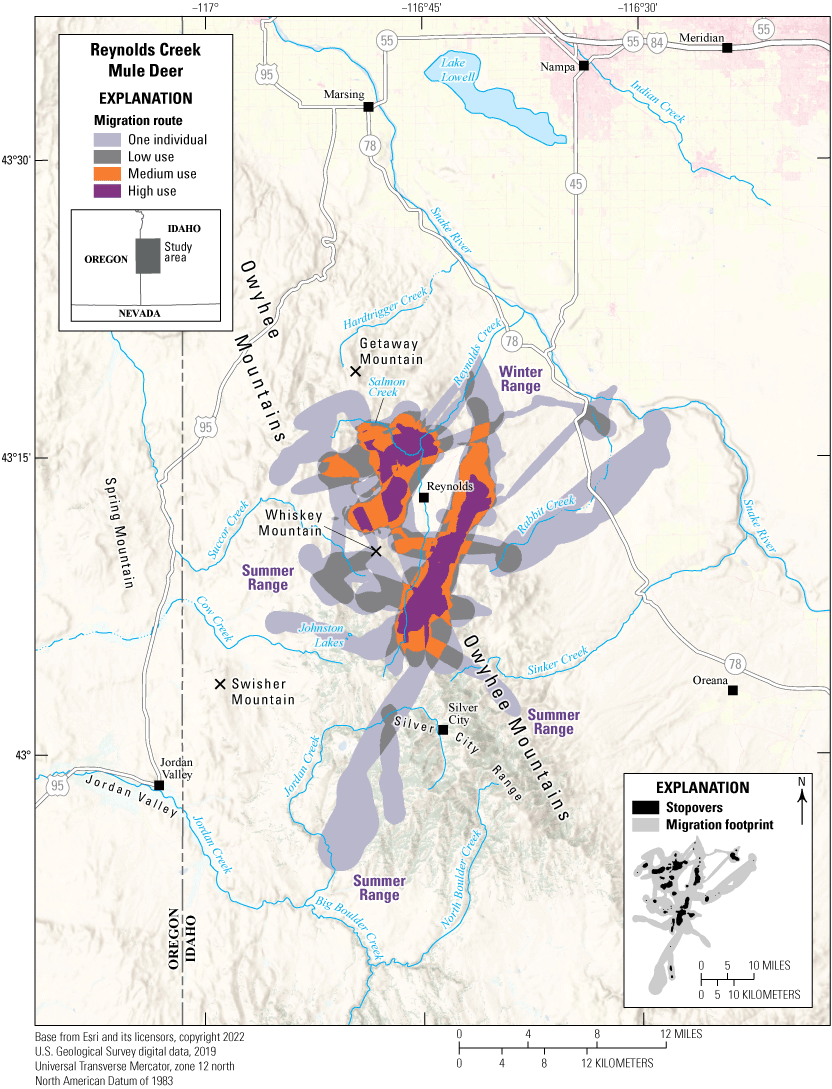
Map showing migration routes and stopovers of the Reynolds Creek mule deer herd.
Animal Capture and Data Collection
Sample size: 23 mule deer (14 males, 9 females)
Relocation frequency: Approximately 0.25–13 hours
Project duration: 2018–23
Data Analysis
Migration route and stopover analysis: Brownian bridge movement models (Sawyer and others, 2009) with an 8-hour time lag for 26 migration sequences, Fixed Motion Variance (10,764 ft2 [1,000 m2]; McKee and others, 2024) with a 14-hour time lag for 22 migration sequences, and Fixed Motion Variance (10,764 ft2 [1,000 m2]) with a 27-hour time lag for 5 migration sequences (app. 1)
Delineation of migration periods: Net Squared Displacement (Bunnefeld and others, 2011; app. 1)
Models derived from:
Migration use classifications:Migration Route and Stopover Summary
Migration start and end dates (median):
Number of days migrating (mean): Migration route length: Migration route area:Other Information
Idaho migration routes are updated and viewable by the Idaho Fish and Game (Idaho Fish and Game, 2024). Mapping layers shown for this herd are sensitive but may be made available to researchers upon request by contacting Idaho Fish and Game (idfgdatarequests@idfg.idaho.gov).
Project contacts:
-
• Matt Mumma (matt.mumma@idfg.idaho.gov), Wildlife Research Manager, Idaho Fish and Game
-
• Jacob Gray (jacob.gray@idfg.idaho.gov), Natural Resources Program Coordinator—Habitat and Migration, Idaho Fish and Game
-
• Ryan Walrath (ryan.walrath@idfg.idaho.gov), Regional Wildlife Manager, Idaho Fish and Game
-
• Rachel Curtis (rachel.curtis@idfg.idaho.gov), Regional Wildlife Biologist, Idaho Fish and Game
-
• Scott Bergen, Senior Wildlife Research Biologist, Idaho Fish and Game
-
• Robert Ritson, Associate Research Scientist, Wyoming Cooperative Fish and Wildlife Research Unit, University of Wyoming
-
• Meints, D., Ward, R., Knetter, J., Miyasaki, H., Oelrich, K., Mosby, C., Ellstrom, M., Roche, E., Elmer, M., Crea, S., Smith, D., Hribik, D., Hickey, C., Berkley, R., McDonald, M., Lockyer, Z., Hendricks, C., Painter, G., and Newman, D., 2020, F19AF00858 statewide surveys and inventory final performance report: Boise, Idaho, Idaho Fish and Game, 20 p. [Also available at https://collaboration.idfg.idaho.gov/WildlifeTechnicalReports/F19AF00858%20Statewide%20Surveys%20%20Inventory%20Final%20Report%20FY20.pdf.]
-
• Roberts, S., and Mumma, M., 2023, F22AF03552 statewide wildlife research final performance report: Boise, Idaho, Idaho Fish and Game, 48 p.
Idaho | Mule Deer
Silver City Mule Deer
The Silver City mule deer winter to the east of Silver City, Idaho, along Sinker Creek and to the west of Idaho State Highway 78 (fig. 11). This herd generally spends the summer at higher elevations in Game Management Unit (GMU) 40 to the south and to the west of the historic mining towns of Silver City, Idaho, and De Lamar, Idaho. Migration distances averaged 17 mi (27 km), but some migrations were considerably longer (>40 mi [>64 km]) and crossed into GMU 41, as far south as the basin of Little Jacks Creek. The Silver City mule deer herd shares summer ranges in the Owyhee Mountains with several distinct mule deer herds that winter in eastern Oregon. Summer habitats comprise mixed-conifer forest, aspen, and some curl-leaf mountain-mahogany woodland communities, whereas the herd’s migration and winter range habitats comprise a mix of Wyoming big sagebrush-steppe, invasive annual grasses, and juniper woodland. Seasonal migrations near Silver City, Idaho, span private, State, and Federal lands. The area includes valuable mineral reserves and potential renewable energy sources and provides abundant recreational opportunities, so mitigating adverse effects from these land uses may be an important consideration for environmental planning.
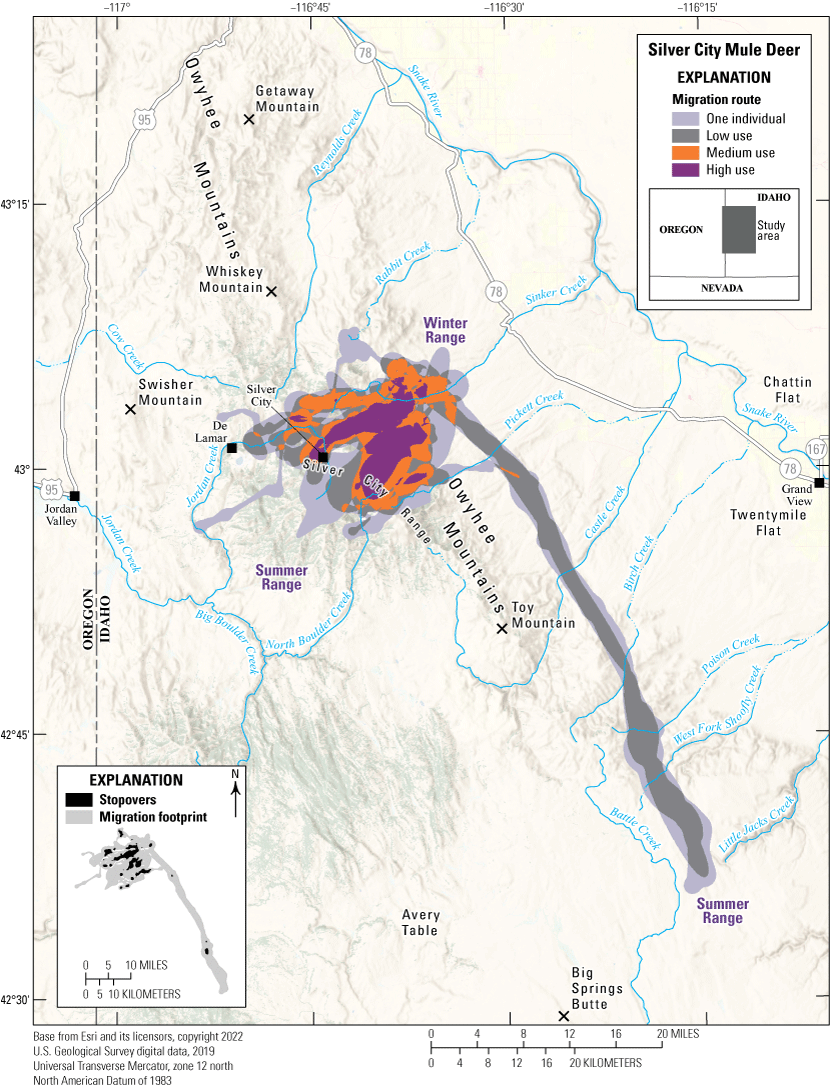
Map showing migration routes and stopovers of the Silver City mule deer herd.
Animal Capture and Data Collection
Sample size: 23 mule deer (10 males, 13 females)
Relocation frequency: Approximately 0.25–13 hours
Project duration: 2018–23
Data Analysis
Migration route and stopover analysis: Brownian bridge movement models (Sawyer and others, 2009) with an 8-hour time lag for 27 migration sequences, Fixed Motion Variance (10,764 ft2 [1,000 m2]; McKee and others, 2024) with a 14-hour time lag for 10 migration sequences, and Fixed Motion Variance (10,764 ft2 [1,000 m2]) with a 27-hour time lag for 8 migration sequences (app. 1)
Delineation of migration periods: Net Squared Displacement (Bunnefeld and others, 2011; app. 1)
Models derived from:
Migration use classifications:Migration Route and Stopover Summary
Migration start and end dates (median):
Number of days migrating (mean): Migration route length: Migration route area:Other Information
Idaho migration routes are updated and viewable by the Idaho Fish and Game (Idaho Fish and Game, 2024). Mapping layers shown for this herd are sensitive but may be made available to researchers upon request by contacting Idaho Fish and Game (idfgdatarequests@idfg.idaho.gov).
Project contacts:
-
• Matt Mumma (matt.mumma@idfg.idaho.gov), Wildlife Research Manager, Idaho Fish and Game
-
• Jacob Gray (jacob.gray@idfg.idaho.gov), Natural Resources Program Coordinator—Habitat and Migration, Idaho Fish and Game
-
• Ryan Walrath (ryan.walrath@idfg.idaho.gov), Regional Wildlife Manager, Idaho Fish and Game
-
• Rachel Curtis (rachel.curtis@idfg.idaho.gov), Regional Wildlife Biologist, Idaho Fish and Game
-
• Scott Bergen, Senior Wildlife Research Biologist, Idaho Fish and Game
-
• Robert Ritson, Associate Research Scientist, Wyoming Cooperative Fish and Wildlife Research Unit, University of Wyoming
-
• Meints, D., Ward, R., Knetter, J., Miyasaki, H., Oelrich, K., Mosby, C., Ellstrom, M., Roche, E., Elmer, M., Crea, S., Smith, D., Hribik, D., Hickey, C., Berkley, R., McDonald, M., Lockyer, Z., Hendricks, C., Painter, G., and Newman, D., 2020, F19AF00858 statewide surveys and inventory final performance report: Boise, Idaho, Idaho Fish and Game, 20 p. [Also available at https://collaboration.idfg.idaho.gov/WildlifeTechnicalReports/F19AF00858%20Statewide%20Surveys%20%20Inventory%20Final%20Report%20FY20.pdf.]
-
• Roberts, S., and Mumma, M., 2023, F22AF03552 statewide wildlife research final performance report: Boise, Idaho, Idaho Fish and Game, 48 p.
Idaho | Mule Deer
Soda Hills Mule Deer
The Soda Hills mule deer herd primarily resides in southeastern Idaho, close to the Idaho–Wyoming border. The herd was included in Kauffman and others (2020a) and has been updated for this report because new data from seasonally migrating mule deer have more than doubled (from 15 to 31 mule deer) since this analysis was first done (Kauffman and others, 2020a). Soda Hills mule deer winter to the north of Soda Springs, Idaho (fig. 12). The mule deer migrate to the north, northeast, and south to several summer ranges in the Chesterfield Range, Caribou Range, Grays Range, and the northern extent of the Bear River Range. On average, Soda Hills mule deer migrate 22 mi (35 km) between their summer and winter ranges. The Soda Hills mule deer herd population is about 3,000–5,000 animals during the winter, depending on winter weather conditions. Seasonal movements for mule deer wintering in the Soda Hills may be affected by development infrastructure and busy roads, such as U.S. Highway 34 to the north of Soda Springs, Idaho. Habitat loss from mineral extraction, compounded by the loss of aspen communities associated with fire suppression and Pseudotsuga menziesii (Douglas fir) encroachment, is changing the herd’s summer habitats.
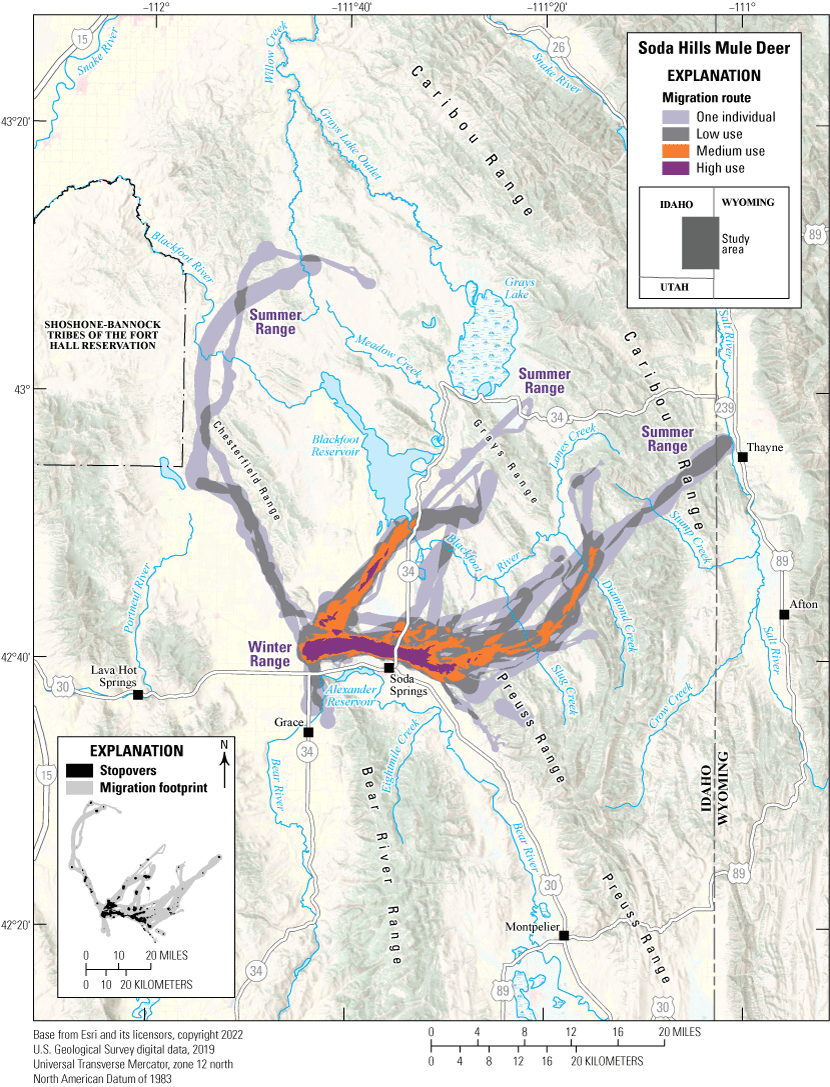
Map showing migration routes and stopovers of the Soda Hills mule deer herd.
Animal Capture and Data Collection
Sample size: 31 female mule deer
Relocation frequency: Approximately 4−13 hours
Project duration: 2013−22
Data Analysis
Migration route and stopover analysis: Brownian bridge movement models (Sawyer and others, 2009) with an 8-hour time lag for 27 migration sequences, Fixed Motion Variance (10,764 ft2 [1,000 m2]; McKee and others, 2024) with a 14-hour time lag for 25 migration sequences, and Fixed Motion Variance (10,764 ft2 [1,000 m2]) with a 27-hour time lag for 14 migration sequences (app. 1)
Delineation of migration periods: Net Squared Displacement (Bunnefeld and others, 2011; app. 1)
Models derived from:
Migration use classifications:Migration Route and Stopover Summary
Migration start and end dates (median):
Number of days migrating (mean): Migration route length: Migration route area:Other Information
Idaho migration routes are updated and viewable by the Idaho Fish and Game (Idaho Fish and Game, 2024). Mapping layers shown for this herd are sensitive but may be made available to researchers upon request by contacting Idaho Fish and Game (idfgdatarequests@idfg.idaho.gov).
Project contacts:
-
• Matt Mumma (matt.mumma@idfg.idaho.gov), Wildlife Research Manager, Idaho Fish and Game
-
• Jacob Gray (jacob.gray@idfg.idaho.gov), Natural Resources Program Coordinator Habitat and Migration, Idaho Fish and Game
-
• Zach Lockyer (zach.lockyer@idfg.idaho.gov), Regional Wildlife Manager, Idaho Fish and Game
-
• Eric Freeman (eric.freeman@idfg.idaho.gov), Regional Wildlife Biologist, Idaho Fish and Game
-
• Scott Bergen, Senior Wildlife Research Biologist, Idaho Fish and Game
-
• Robert Ritson, Associate Research Scientist, Wyoming Cooperative Fish and Wildlife Research Unit, University of Wyoming
-
• Meints, D., Ward, R., Knetter, J., Miyasaki, H., Oelrich, K., Mosby, C., Ellstrom, M., Roche, E., Elmer, M., Crea, S., Smith, D., Hribik, D., Hickey, C., Berkley, R., McDonald, M., Lockyer, Z., Hendricks, C., Painter, G., and Newman, D., 2020, F19AF00858 statewide surveys and inventory final performance report: Boise, Idaho, Idaho Fish and Game, 20 p. [Also available at https://collaboration.idfg.idaho.gov/WildlifeTechnicalReports/F19AF00858%20Statewide%20Surveys%20%20Inventory%20Final%20Report%20FY20.pdf.]
-
• Roberts, S., and Mumma, M., 2023, F22AF03552 statewide wildlife research final performance report: Boise, Idaho, Idaho Fish and Game, 48 p.
Navajo Nation | Mule Deer
South Carrizo Mule Deer
The South Carrizo mule deer herd represents a subherd inhabiting the Carrizo Mountains, an area entirely contained within Hunt Unit 12 to the south of U.S. Highway 64 (fig. 13). The Carrizo Mountains form a small, mostly circular mountain range 9–12-mi (14–19-km) wide on the Colorado Plateau in northeastern Arizona, approximately 12 mi (19 km) southwest of the intersection of Arizona, Utah, Colorado, and New Mexico. Elevation ranges from the highest point at 9,413 ft (2,869 m), Pastora Peak, to approximately 5,900 ft (1,798 m) on the surrounding plateau. The higher elevations of the Carrizo Mountains remain largely unpopulated by resident mule deer because of its remote and challenging accessibility. The mountain range is mostly intact with one unmaintained dirt road, and therefore considered critical habitat by the Navajo Nation Department of Fish and Wildlife.
Challenges to the herd within the lower-elevation plateau of the Carrizo Mountains include new housing development, frequent wood cutting activity, and unregulated livestock, such as feral horses. Only a few mule deer and elk hunting tags are allocated within Hunt Unit 12, and some cattle ranching and sheep herding occur during the summer at higher elevations. However, a rapidly increasing feral horse population in the Carrizo Mountains is progressively deteriorating the habitat, diminishing forage availability, and restricting access to water sources. In 2018, the Navajo Nation Department of Fish and Wildlife issued 60 hunting tags to help manage the feral horse population because the remote location on the upper elevations of the Carrizo Mountains precluded horse roundups. However, the hunt was cancelled because some groups opposed it as a management tool (J. Fort, Navajo Nation Department of Fish and Wildlife, written commun., 2024).
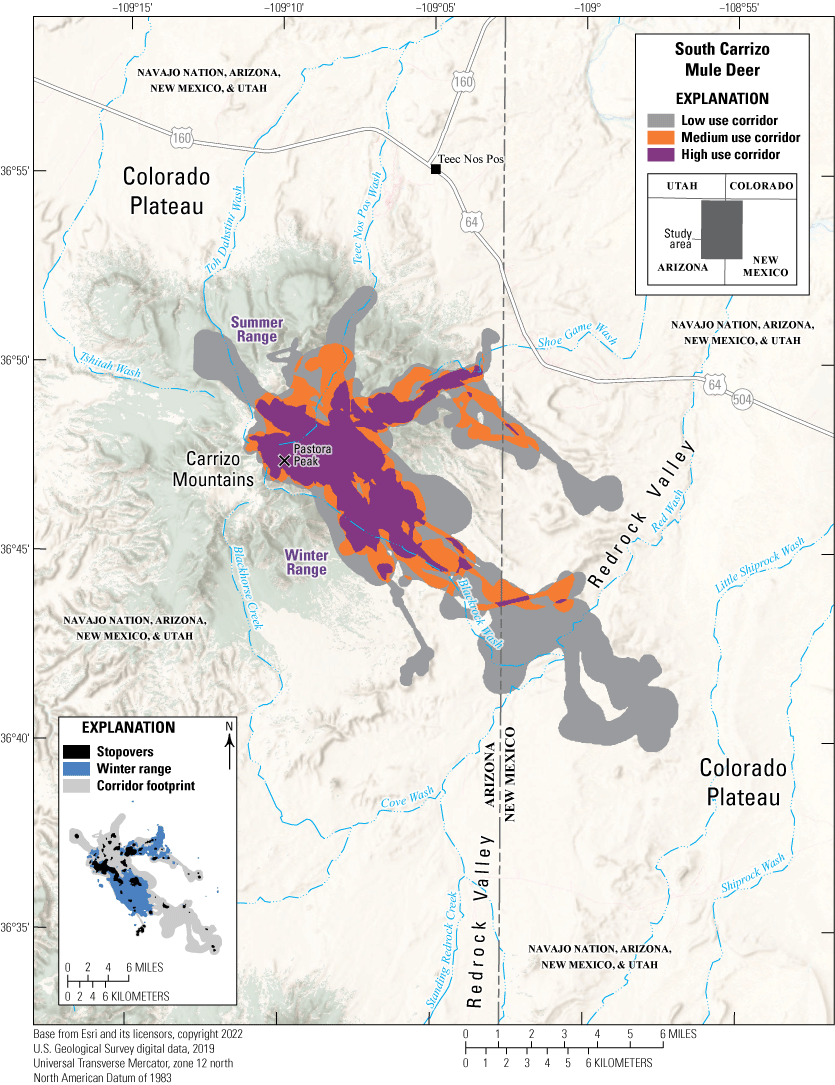
Map showing migration corridors, stopovers, and winter ranges of the South Carrizo mule deer herd.
Animal Capture and Data Collection
Sample size: 19 adult mule deer (15 males, 4 females)
Relocation frequency: Approximately 2 hours
Project duration: 2018–present (data through September 2023 analyzed for this report)
Data Analysis
Corridor, stopover, and winter range analysis: Brownian bridge movement models (Sawyer and others, 2009)
Delineation of migration periods: Net Squared Displacement (Bunnefeld and others, 2011; app. 1)
Models derived from:
Migration use classifications:Corridor and Stopover Summary
Migration start and end dates (median):
Number of days migrating (mean): Migration corridor length: Migration corridor area:Oregon | Mule Deer
Biggs Mule Deer
Most of the Biggs mule deer herd is nonmigratory. Annual ranges are scattered throughout the flat, low-elevation landscape near rivers such as the John Day River, Deschutes River, Buck Hollow Creek, Ward Creek, and Hay Creek (fig. 14). Northern seasonal ranges are in unforested expanses of grassland and Artemisia tridentata ssp. tridentata (basin big sagebrush) that are interspersed with farmland, nonnative annual grasses, and areas of intact sagebrush-steppe. Grain and hay are economically valuable crops in the northern part of the herd’s range, where many mule deer ranges overlap winter wheat fields. Canyon areas around John Day River and Deschutes River allow mule deer to access unfarmed habitat. Compared with the northern ranges, the southern ranges are more mountainous and feature more Juniperus occidentalis (western juniper). Only 6.5 percent of the Biggs mule deer herd (a total of three mule deer) tracked for >100 days showed migratory behavior and distinct seasonal ranges. These three GPS-collared mule deer in the southern region of the Biggs herd range migrated to T V Ridge, Shoestring Ridge, and Ward Creek, where Pinus ponderosa (ponderosa pine), western juniper, and mixed-conifer forests overtake herbaceous grasslands.
Most land occupied by the Biggs herd is privately owned farmland. Farmers across the United States can enroll their fields in the USDA Conservation Reserve Program, administered by the Farm Service Agency, and receive a yearly rental payment from USDA to remove land from agricultural production for 10–15 years, thus reducing habitat loss (Farm Service Agency, 2023). Along with habitat degradation from encroaching invasive grasses and western juniper, Biggs mule deer are negatively affected by U.S. Highway 97. From 2010 to 2022, the Oregon Department of Transportation (ODOT) recorded an average of 30.5 DVC (all local deer species) annually for a 77-mi (124-km) section of U.S. Highway 97 (ArcGIS REST Services Directory, undated b).
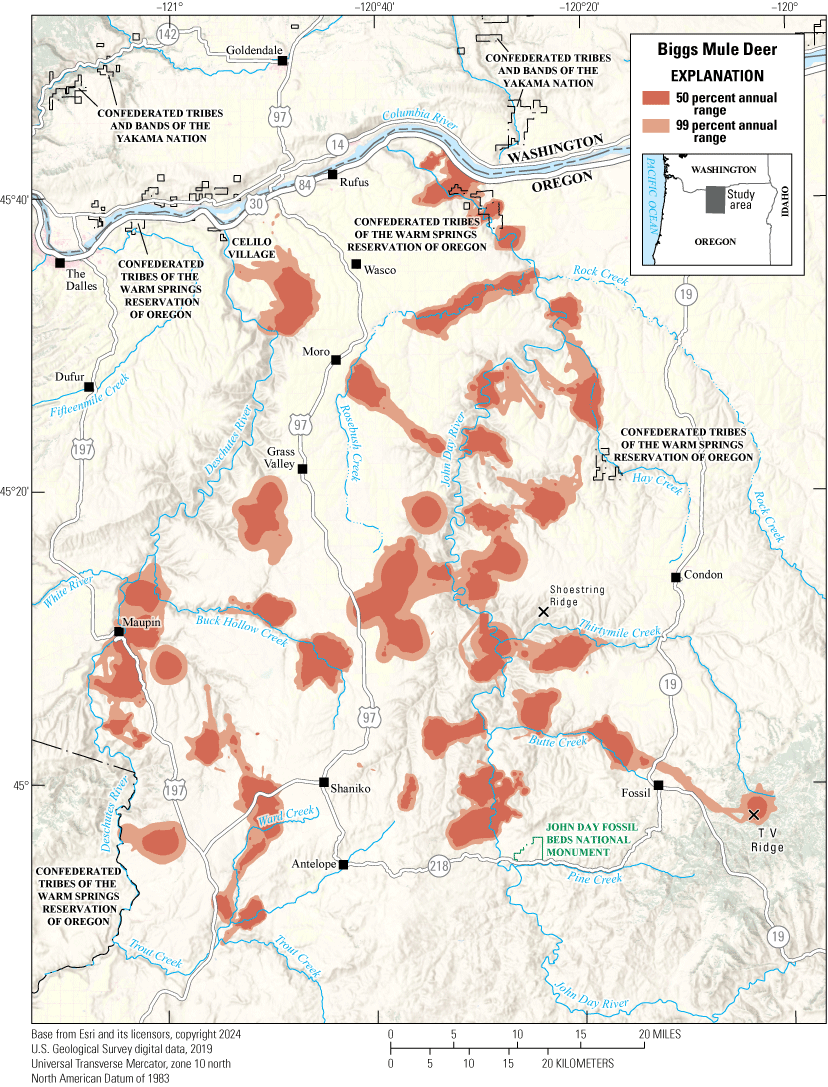
Map showing annual ranges of the Biggs mule deer herd.
Animal Capture and Data Collection
Sample size: 52 adult female mule deer
Relocation frequency: Approximately 5−13 hours
Project duration: 2019–present (data through June 2023 analyzed for this report)
Data Analysis
Annual range analysis: Brownian bridge movement models (Sawyer and others, 2009)
Models derived from:
Oregon | Mule Deer
Crescent Mule Deer
More than 87 percent of GPS-collared Crescent mule deer tracked for >100 days had clear migratory behavior, which makes this herd one of the more migratory herds in Oregon. Most mule deer winter close to Oregon Route 31 and the northwest border of the High Desert region in areas containing Artemisia tridentata (big sagebrush), Artemisia tridentata ssp. vaseyana (mountain big sagebrush), Artemisia arbuscula (low sagebrush), and western juniper (fig. 15). Other mule deer winter to the north, near Crooked River and U.S. Highway 20, in areas with additional western juniper instead of low sagebrush. Both groups migrate to summer ranges with big sagebrush, mountain big sagebrush, and mixed-conifer species, including Pinus contorta (lodgepole pine) and ponderosa pine, near the Paulina Mountains, U.S. Highway 97, and the Maury Mountains. A separate group wintering near Wagontire Mountain in patches of mixed sagebrush, western juniper, and early shrub-tree habitat migrates to the northeast to stands of ponderosa pine and mixed-conifer forest near Donnelly Butte in spring. In summer, Crescent mule deer usually migrate to higher elevations that are less affected by drought. Mule deer cross U.S. Highway 97, Oregon Route 31, and U.S. Highway 20 during migration, and some summer ranges span U.S. Highway 97. From 2010 to 2022, ODOT recorded annual averages of 209 DVC and 55 DVC (all local deer species) for 88-mi (142-km) and 73-mi (117-km) sections of U.S. Highway 97 and Oregon Route 31, respectively (ArcGIS REST Services Directory, undated b). In 2012, ODOT constructed two wildlife undercrossings with guiding fences on U.S. Highway 97 near Lava Butte, which reduced DVC within the fenced area by 85 percent the first year after installation and 100 percent the second year (Bliss-Ketchum and Parker, 2015). In 2022, ODOT finished two additional undercrossings near Gilchrist, Oregon, and one more outside Sunriver, Oregon.
The Crescent mule deer herd inhabits sections of the Paulina and Fort Rock Wildlife Management Units (WMUs), which were included in the Oregon Department of Fish and Wildlife (ODFW) Mule Deer Initiative 5-year plans in 2010 (Paulina WMU) and 2015 (Fort Rock WMU; ODFW, 2015, 2020). Since then, ODFW, in collaboration with the BLM, NRCS, and other Federal and nongovernmental organizations, removed 1,966 acres (796 ha) of western juniper, reseeded 525 acres (212 ha) with native shrubs and grasses, and constructed 812 water development projects and other habitat-improvement efforts. Water development projects included drilling wells, cultivating springs, piping water, repairing guzzlers, and managing riparian areas to help mitigate the severe to exceptional droughts that affect many Crescent mule deer on their winter ranges.
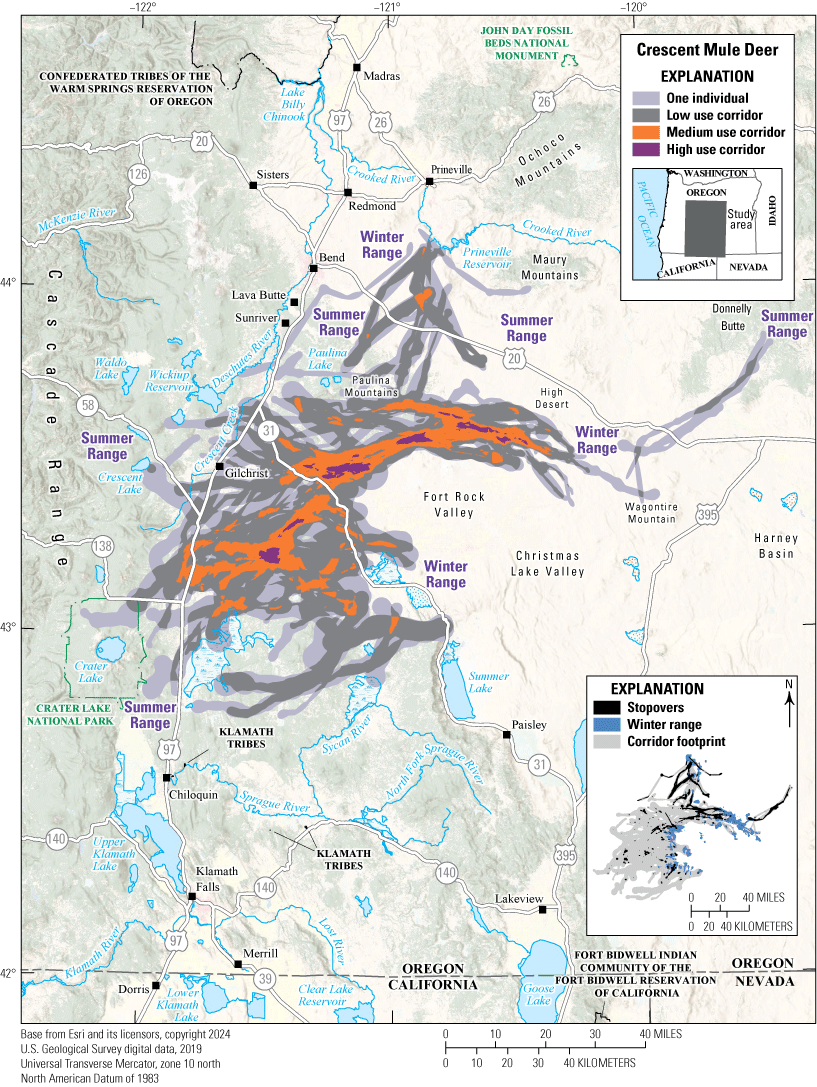
Map showing migration corridors, stopovers, and winter ranges of the Crescent mule deer herd.
Animal Capture and Data Collection
Sample size: 121 adult female mule deer
Relocation frequency: Approximately 3−13 hours
Project duration: 2015–present (data through June 2023 analyzed for this report)
Data Analysis
Corridor, stopover, and winter range analysis: analysis for the 3- to 5-hour duty cycle GPS collars used Brownian bridge movement models (Sawyer and others, 2009) with an 8-hour time lag; analysis for the 13-hour duty cycle GPS collars used Fixed Motion Variance (McKee and others, 2024) with a 48-hour time lag (app. 1)
Delineation of migration periods: Net Squared Displacement (Bunnefeld and others, 2011; app. 1)
Models derived from:
Migration use classifications:Corridor and Stopover Summary
Migration start and end dates (median):
Number of days migrating (mean): Migration corridor length: Migration corridor area:Oregon | Mule Deer
Deschutes Mule Deer
The Deschutes mule deer herd winters near Deep Canyon, the Deschutes River, and U.S. Highway 20 in areas dominated by western juniper, ponderosa pine, and big sagebrush (fig. 16). In spring, mule deer migrate southwest to summer ranges near Wickiup Reservoir, Mount Bachelor, and Oregon Route 242. These summer ranges are covered by mixed-conifer forests including ponderosa pine, Abies amabilis (Pacific silver fir), Tsuga mertensiana (mountain hemlock), and lodgepole pine. Frequent small wildfires are common in winter ranges, which help improve habitat quality by reducing canopy cover, thereby promoting the growth of palatable shrubs and forbs. Most of this region is forested and has some scattered patches of sagebrush-steppe. Mule deer tend to migrate along the wide, steep-sloped Deschutes River rather than attempting to cross the river, which creates a high use corridor where multiple migratory paths overlap on the west side of the Deschutes River.
In addition to western juniper encroachment, Deschutes mule deer are also affected by human-caused disturbance. Multiple mule deer traverse or have seasonal ranges adjacent to a 32-mi (51-km) section of U.S. Highway 20, which recorded 155 DVC (all local deer species) on average each year between 2010 and 2022 (ArcGIS REST Services Directory, undated b). Several mule deer winter ranges also overlap agricultural land in low-elevation areas where hay, grain, chickpeas, and grass seed are grown.
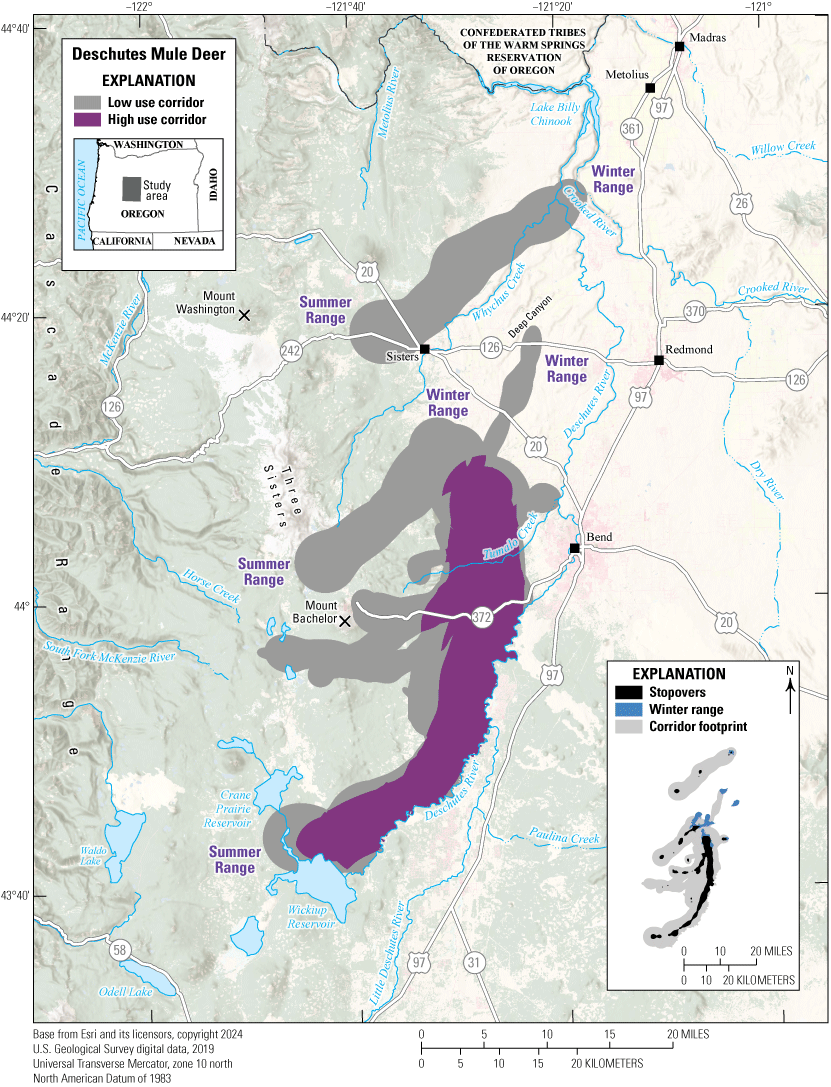
Map showing migration corridors, stopovers, and winter ranges of the Deschutes mule deer herd.
Animal Capture and Data Collection
Sample size: 17 adult female mule deer
Relocation frequency: Approximately 2−5 hours
Project duration: 2020–present (data through June 2023 analyzed for this report)
Data Analysis
Corridor, stopover, and winter range analysis: analysis used Brownian bridge movement models (Sawyer and others, 2009) with an 8-hour time lag
Delineation of migration periods: Net Squared Displacement (Bunnefeld and others, 2011; app. 1)
Models derived from:
Migration use classifications:Corridor and Stopover Summary
Migration start and end dates (median):
Number of days migrating (mean): Migration corridor length: Migration corridor area:Oregon | Mule Deer
Fossil-Grizzly Mule Deer
Most of the Fossil-Grizzly mule deer herd winters near Bear Creek and the fork of the John Day River and Bridge Creek, in habitats composed of big sagebrush, western juniper, and grassland (fig. 17). Another group winters to the southwest, near U.S. Highway 26, in areas with more western juniper. In spring, both groups migrate to ponderosa pine, western juniper, and mixed-conifer forests around the Ochoco Mountains. Other Fossil-Grizzly mule deer winter to the north, near Arrastra Canyon, Dry Hollow, and the fork of the John Day River and Muddy Creek, and use a mix of grassland, western juniper, and big sagebrush habitats interspersed with nonnative and invasive annual grasses. Summer ranges for migratory individuals comprise more big sagebrush, ponderosa pine, and mixed-conifer forest near Eagle Valley and Bald Mountain. One Fossil-Grizzly mule deer in this area only migrated once before remaining on the summer range for multiple years. Mule deer traveling to summer ranges on the Ochoco Mountains often cross U.S. Highway 26, where ODOT recorded an annual average of 74.2 DVC (all local deer species) from 2010 to 2022 along a 45-mi (72-km) section of road (ArcGIS REST Services Directory, undated b). In 2014, the Pine Creek Complex and Bailey Butte fires burned 30,257 acres (12,245 ha) and 10,277 acres (4,159 ha) of winter and summer habitat, respectively (BLM, 2023a). In 2018, the Jennie’s Peak fire burned an additional 45,975 acres (18,605 ha) of winter habitat (BLM, 2023a). These fires were in a mosaic of habitat types, and potentially spread invasive grasses in areas without sufficient perennial plant cover, but beneficially reduced dense canopy cover in heavily forested areas.
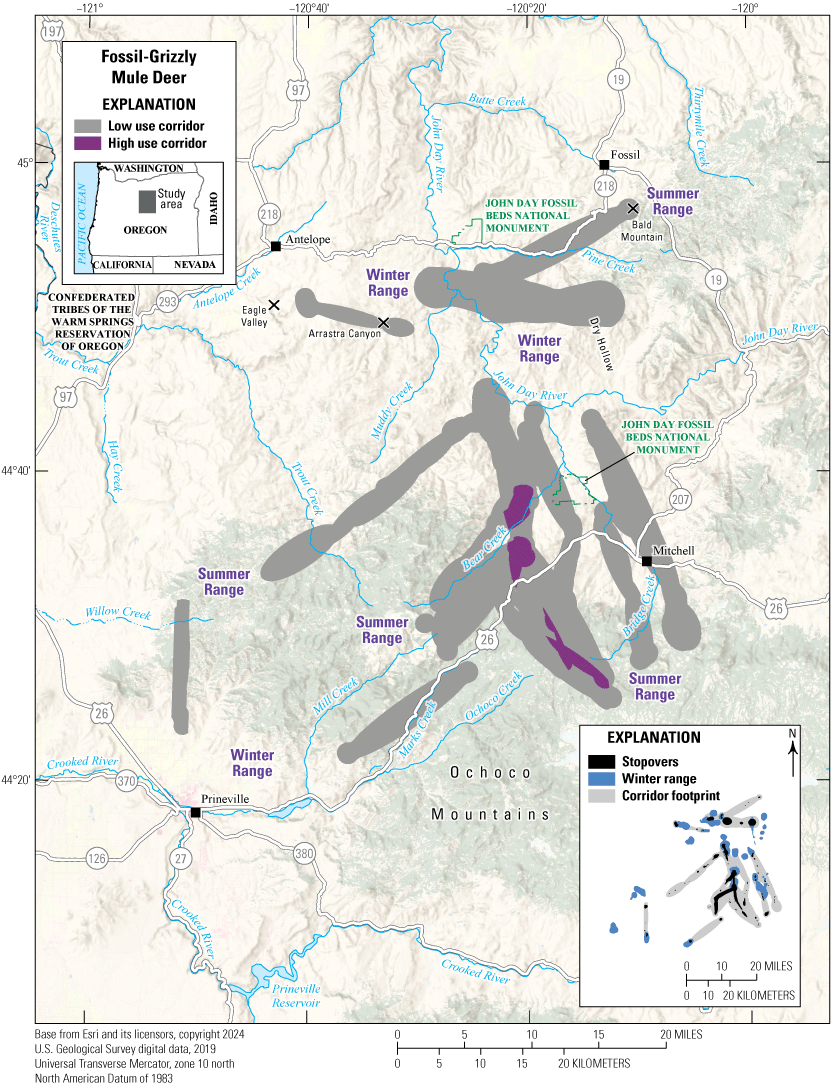
Map showing migration corridors, stopovers, and winter ranges of the Fossil-Grizzly mule deer herd.
Animal Capture and Data Collection
Sample size: 33 adult female mule deer
Relocation frequency: Approximately 5−13 hours
Project duration: 2015–21
Data Analysis
Corridor, stopover, and winter range analysis: analysis for the 5-hour duty cycle GPS collars used Brownian bridge movement models (Sawyer and others, 2009) with an 8-hour time lag; analysis for the 13-hour duty cycle GPS collars used Fixed Motion Variance (McKee and others, 2024) with a 48-hour time lag (app. 1)
Delineation of migration periods: Net Squared Displacement (Bunnefeld and others, 2011; app. 1)
Models derived from:
Migration use classifications:Corridor and Stopover Summary
Migration start and end dates (median):
Number of days migrating (mean): Migration corridor length: Migration corridor area:Oregon | Mule Deer
Juniper-Silvies Mule Deer
The Juniper-Silvies mule deer herd uses three main winter ranges. Many of the southern winter ranges near Oregon Route 205 were affected by wildfire at least once in the last 40 years, which resulted in a mosaic of native and nonnative grassland, sagebrush, and western juniper (fig. 18). In 2012, the 160,800-acre (65,073-ha) Miller Homestead fire burned the entire southern section of this winter range (BLM, 2023a). When migrating, these mule deer usually travel between Mud Lake and Harney Lake—shallow alkaline lakes that dry completely during droughts. Northwestern winter ranges on the Glass Buttes and Juniper Ridge are covered by western juniper and early shrub-tree habitat, as well as a variety of sagebrush species. The habitats of winter ranges close to U.S. Highway 395, Dry Mountain, and Street Flat are similar but contain more ponderosa pine, grassland, and mixed-conifer forest than early shrub-tree habitat. Including the eastern part of these winter ranges, about 55,421 acres (22,428 ha) burned in the 2007 Egley Complex fire (BLM, 2023a); post-fire, shrub recovery varied by elevation and aspect across the area. Juniper-Silvies mule deer collectively migrate to summer ranges near Silver Creek, King Mountain, Emigrant Creek, and Bald Butte. In comparison to winter ranges, summer ranges contain more ponderosa pine, western juniper, mixed-conifer forest, and scattered sections of mixed sagebrush. Large parts of summer range burned during the 73,258-acre (29,646-ha) Pine Springs Basin fire in 1990, as well as the 55,421-acre (22,428-ha) Egley Complex and 52,890-acre (21,404-ha) Bear Canyon fires in 2007 (BLM, 2023a). Ceanothus spp. (California lilac) and regenerating conifers dominate the burned areas of this summer range.
The Juniper-Silvies mule deer herd face several challenges, including nonnative annual grass invasion, western juniper encroachment, post-fire habitat succession, extreme drought, interactions with feral horses, and highway mortality. Wildfires burned more than 76,800 acres (31,080 ha) of winter range in the past 40 years and converted large areas to invasive annual grasses. Burned habitat on the summer range has neared the end of peak productivity 16 years post-fire, and conifer succession and senescence are beginning to affect shrubs. The Palomino Butte and Warm Springs HMAs overlap multiple mule deer winter ranges and contain feral horses; Palomino Butte HMA has approximately 212 feral horses (more than the maximum appropriate management level [AML] of 64 horses) and Warm Springs HMA has approximately 272 feral horses (more than the maximum AML of 202 horses; BLM, 2023b). U.S. Highway 20 also contributes to high annual mortalities: an average of 41.8 DVC (all local deer species) were recorded each year from 2010 to 2022 for a 36-mi (58-km) section of road near Burns, Oregon (ArcGIS REST Services Directory, undated b).
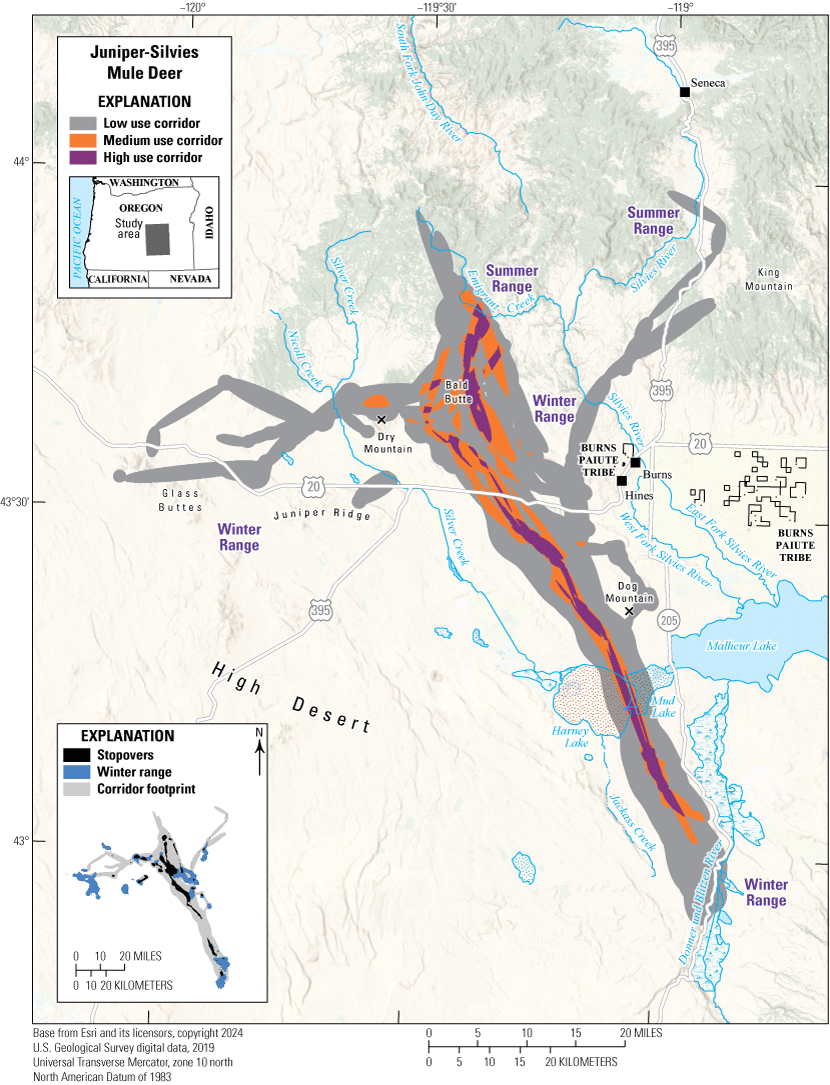
Map showing migration corridors, stopovers, and winter ranges of the Juniper-Silvies mule deer herd.
Animal Capture and Data Collection
Sample size: 27 adult female mule deer
Relocation frequency: Approximately 5−13 hours
Project duration: 2015–present (data through June 2023 analyzed for this report)
Data Analysis
Corridor, stopover, and winter range analysis: analysis for the 5-hour duty cycle GPS collars used Brownian bridge movement models (Sawyer and others, 2009) with an 8-hour time lag; analysis for the 13-hour duty cycle GPS collars used Fixed Motion Variance (McKee and others, 2024) with a 48-hour time lag (app. 1)
Delineation of migration periods: Net Squared Displacement (Bunnefeld and others, 2011; app. 1)
Models derived from:
Migration use classifications:Corridor and Stopover Summary
Migration start and end dates (median):
Number of days migrating (mean): Migration corridor length: Migration corridor area:Oregon | Mule Deer
Keno Mule Deer
The Keno mule deer herd primarily winters between Oregon Route 66 and the Oregon–California border along the slopes of the Cascade Range, but smaller wintering grounds are also at lower elevations to the west of Klamath Falls, Oregon (fig. 19). Winter ranges primarily contain Quercus spp. (oak) woodland with mixed-conifer, ponderosa pine, and early shrub-tree forests at higher elevations. In spring, mule deer migrate to the north across Oregon Route 66 to forested summer ranges higher along the eastern slope of the Cascade Range. One GPS-collared mule deer traveled to the south to summer near Snag Hill, almost 46 mi (74 km) into California.
In 2014, the Oregon Gulch fire burned 35,302 acres (14,286 ha) of forested winter habitat (BLM, 2023a), including critical seasonal ranges near Grizzly Mountain. The fire reduced tree cover, prompting the growth of more palatable early-seral forbs and shrubs. In addition, a largely residential population of mule deer subspecies, Odocoileus hemionus columbianus (black-tailed deer) inhabits the Keno region. Although typically preferring habitats not frequented by mule deer, black-tailed deer can hybridize with mule deer where ranges overlap. Keno mule deer also experience extended periods of severe drought during which they can compete for resources with elk and feral horses in summer where the Pokegama HMA intersects the summer ranges of resident mule deer. The Pokegama HMA contains approximately 295 feral horses, surpassing the maximum AML of 50 horses (BLM, 2023b).
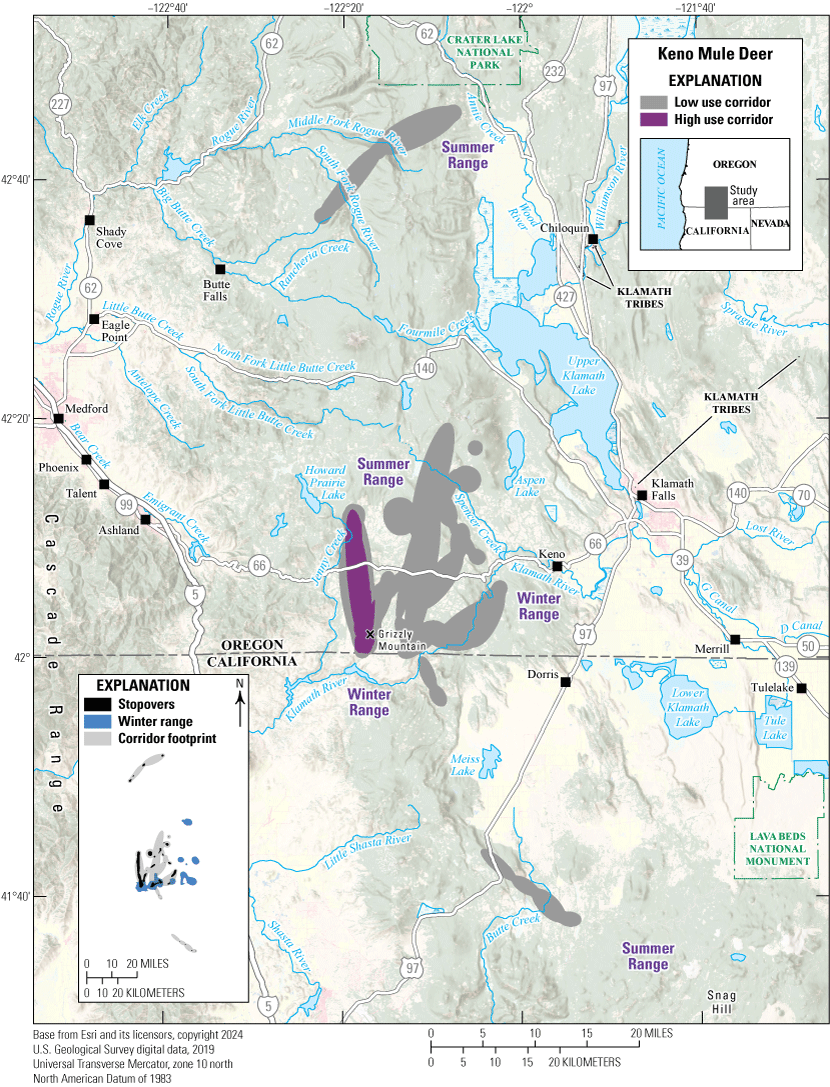
Map showing migration corridors, stopovers, and winter ranges of the Keno mule deer herd.
Animal Capture and Data Collection
Sample size: 20 adult female mule deer
Relocation frequency: Approximately 13−26 hours
Project duration: 2018–21
Data Analysis
Corridor, stopover, and winter range analysis: Fixed Motion Variance (McKee and others, 2024) with a 72-hour time lag (app. 1)
Delineation of migration periods: Net Squared Displacement (Bunnefeld and others, 2011; app. 1)
Models derived from:
Migration use classifications:Corridor and Stopover Summary
Migration start and end dates (median):
Number of days migrating (mean): Migration corridor length: Migration corridor area:Oregon | Mule Deer
Mid-Columbia Mule Deer
The Mid-Columbia mule deer herd inhabits a highly variable landscape that has annual precipitation ranging from 112 in. (284 centimeters [cm]) near Red Hill in the western part of the herd’s range to 14 in. (36 cm) near The Dalles, Oregon, in the eastern part (National Oceanic and Atmospheric Administration, 2021). Mule deer wintering in the east usually occupy altered grassland and agricultural habitats interspersed with patches of basin big sagebrush, nonnative annual grasses, and native and planted grassland (Conservation Reserve Program fields). Most of these mule deer are nonmigratory and reside year round near Fifteenmile Creek, Eightmile Creek, and Deschutes River (fig. 20). The mule deer that do migrate travel to the south to similar kinds of vegetation near Summit Ridge. Habitats to the west, however, contain more forested cover, and winter ranges primarily feature a combination of grasslands, Purshia tridentata (antelope bitterbrush), oak, ponderosa pine, and mixed-conifer forest. Mule deer in the western region are more migratory with individuals that travel to the west to the foothills of Fir Mountain, Lookout Mountain, and Mount Hood in the spring. Summer ranges are dominated by mixed-conifer forests and include Pacific silver fir, mountain hemlock, Tsuga heterophylla (western hemlock), and Douglas fir. Pastures and farmland are prevalent in the east, where dryland wheat, alfalfa hay, and cherries are economically valuable crops. Black-tailed deer co-occur with mule deer to the west of U.S. Highway 197, and the two can hybridize in this area.
Along with frequent smaller wildfires, in 2018, the South Valley Road fire burned 20,026 acres (8,104 ha) of winter habitat near U.S. Highway 197, and the Substation and Long Hollow fires burned a combined 111,881 acres (45,277 ha) along the northern part of the Deschutes River (BLM, 2023a). The 2020 White River fire burned 17,405 acres (7,044 ha) and 2022 Miller Road fire burned 10,847 acres (4,390 ha) of seasonal range and migration corridor habitat outside of Pine Grove, Oregon (BLM, 2023a). Depending on the location, these large wildfires can have positive or negative effects on the Mid-Columbia mule deer herd. In the east, wildfires reduce shelter and allow invasive grasses to proliferate in habitats lacking perennial plant cover; in the west, they can beneficially open canopy cover in heavily forested areas, which exposes the understory to sunlight and promotes valuable forage species.
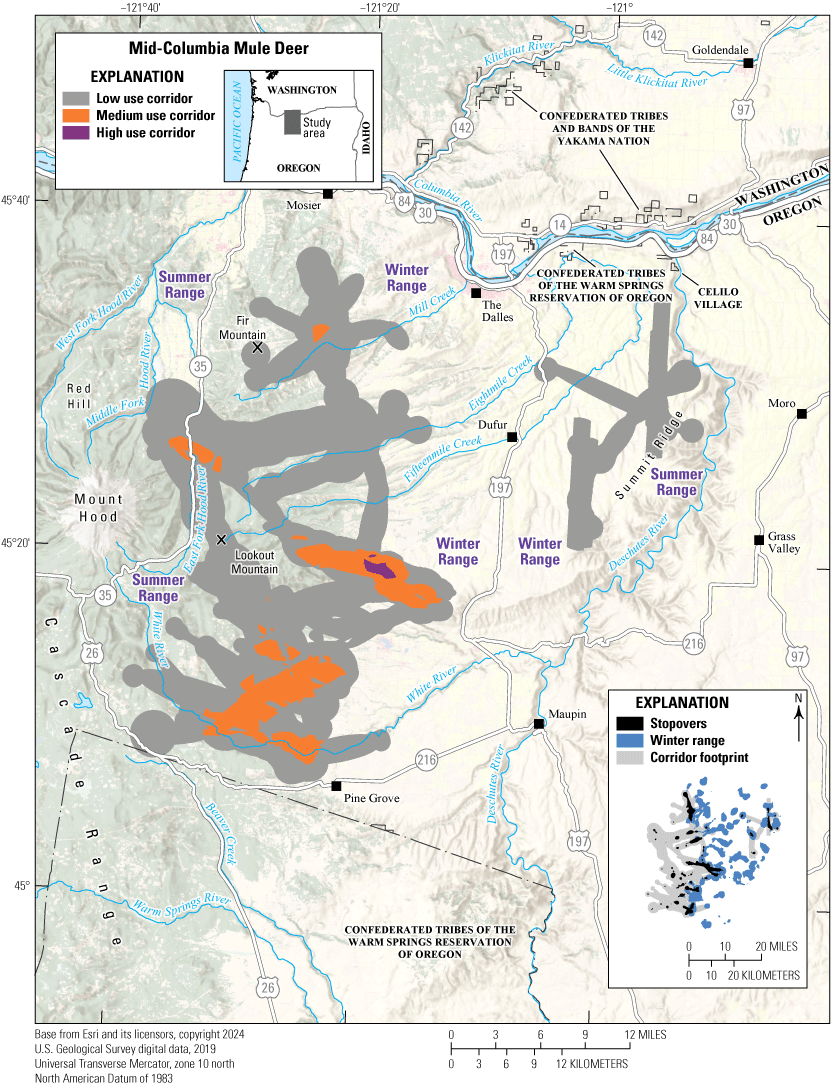
Map showing migration corridors, stopovers, and winter ranges of the Mid-Columbia mule deer herd.
Animal Capture and Data Collection
Sample size: 82 adult female mule deer
Relocation frequency: Approximately 5−13 hours
Project duration: 2017–present (data through June 2023 analyzed for this report)
Data Analysis
Corridor, stopover, and winter range analysis: analysis for the 5-hour duty cycle GPS collars used Brownian bridge movement models (Sawyer and others, 2009) with an 8-hour time lag; analysis for the 13-hour duty cycle GPS collars used Fixed Motion Variance (McKee and others, 2024) with a 48-hour time lag (app. 1)
Delineation of migration periods: Net Squared Displacement (Bunnefeld and others, 2011; app. 1)
Models derived from:
Migration use classifications:Corridor and Stopover Summary
Migration start and end dates (median):
Number of days migrating (mean): Migration corridor length: Migration corridor area:Oregon | Mule Deer
North Blues Mule Deer
The North Blues mule deer herd is primarily nonmigratory. Most GPS-collared mule deer were captured on annual ranges along Oregon Route 206, Oregon Route 74, and U.S. Highway 395 (fig. 21). High mule deer densities also occur in annual ranges along Butter Creek, East Birch Creek, and Rock Creek. In these areas, native, herbaceous grassland is interspersed with patches of nonnative grasses such as cheatgrass and Taeniatherum caput-medusae (medusahead rye). In spring, <21 percent of GPS-collared North Blues mule deer tracked for >100 days migrated between distinct seasonal ranges. These few migratory mule deer usually migrated southeast to scattered summer ranges near Little Butter Creek and the foothills of the Blue Mountains in the spring; one mule deer traveled as far as 45 mi (72 km) to Chicken Hill. Multiple summer ranges in these areas are dominated by invasive Ventenata dubia (ventenata), which is largely unpalatable to mule deer.
Although no GPS-collared North Blues mule deer crossed Interstate 84, the roadway accounted for an average of 61.5 DVC (all local deer species) annually from 2010 to 2022 between mile points 210 and 237 (ArcGIS REST Services Directory, undated b). Many mule deer winter along or migrate across Oregon Route 74 and U.S. Highway 395; Oregon Route 74 contributed to an average of 22.4 DVC annually from 2010 to 2022 for a 16-mi (26-km) section of road and U.S. Highway 395 contributed to an average of 53.1 DVC annually from 2010 to 2022 for a 44-mi (71-km) section of road (ArcGIS REST Services Directory, undated b). Summer and winter ranges overlap agricultural fields near Oregon Route 74 and Oregon Route 206, where grain and hay are common crops that attract mule deer.
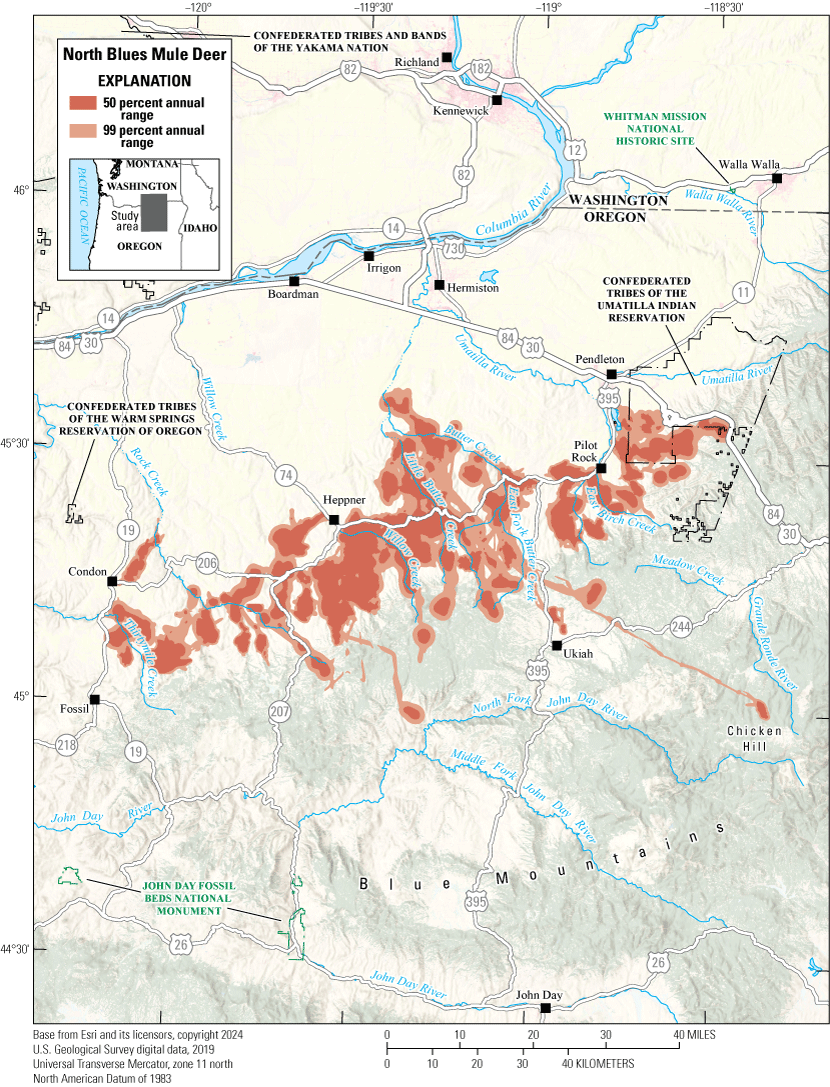
Map showing annual ranges of the North Blues mule deer herd.
Animal Capture and Data Collection
Sample size: 143 adult female mule deer
Relocation frequency: Approximately 5−13 hours
Project duration: 2015–present (data through June 2023 analyzed for this report)
Data Analysis
Annual range analysis: Brownian bridge movement models (Sawyer and others, 2009)
Models derived from:
Oregon | Mule Deer
Northeast Mule Deer
Most of the Northeast mule deer herd is nonmigratory, and annual ranges are dispersed throughout the northeastern Blue Mountains (fig. 22). Only 23 percent of GPS-collared mule deer tracked for >100 days have clear migratory behavior between summer and winter ranges. When migrations do occur, they are usually elevational migrations with timing dependent on snow depth. In general, migratory Northeast mule deer travel to the east or to the south in spring. On the western slopes of the Blue Mountains, mule deer reside near the Umatilla River, South Fork Walla Walla River, and Meacham Creek, and some mule deer travel to summer ranges near Oregon Route 204 and Mount Emily. Annual ranges primarily contain mixed-conifer forest, ponderosa pine, and grassland. Some of the mule deer to the south of Oregon Route 82 and Oregon Route 350 summer on the Wallowa Mountains. These mule deer use herbaceous grassland and mixed-conifer forest with more montane-foothill shrubland and ponderosa pine at lower elevations, and more riparian habitat and conifer forest at higher elevations. Other mule deer reside along Joseph Creek, Crow Creek, Chesnimnus Creek, and the Grande Ronde River in ranges, which contain grasslands, mixed-conifer forest, and ponderosa pine; in the spring, some of these mule deer migrate to grassland-dominated habitat near Greenwood Butte, Findley Buttes, and Flora, Oregon.
This herd faces several challenges, including mortalities from DVC and habitat degradation from wildfires. Many annual ranges border agricultural crops and fields along Oregon Route 82 and Oregon Route 350. From 2010 to 2022, Oregon Route 82 experienced an average of 132 DVC (all local deer species) annually; most occurred near Enterprise, Oregon (ArcGIS REST Services Directory, undated b). Oregon Route 204 contributed to an additional average of 24 DVC annually during the same time. Interstate 84 creates an effective barrier to the south and prevents successful crossings for this herd. Summer wildfires are frequent in the Northeast mule deer herd range. The Double Creek fire burned 171,312 acres (69,328 ha) of forest and grassland to the east of Imnaha River in 2022 (BLM, 2023a). Large wildfires like the Double Creek fire allow invasive grasses to proliferate in areas without sufficient perennial plant coverage.
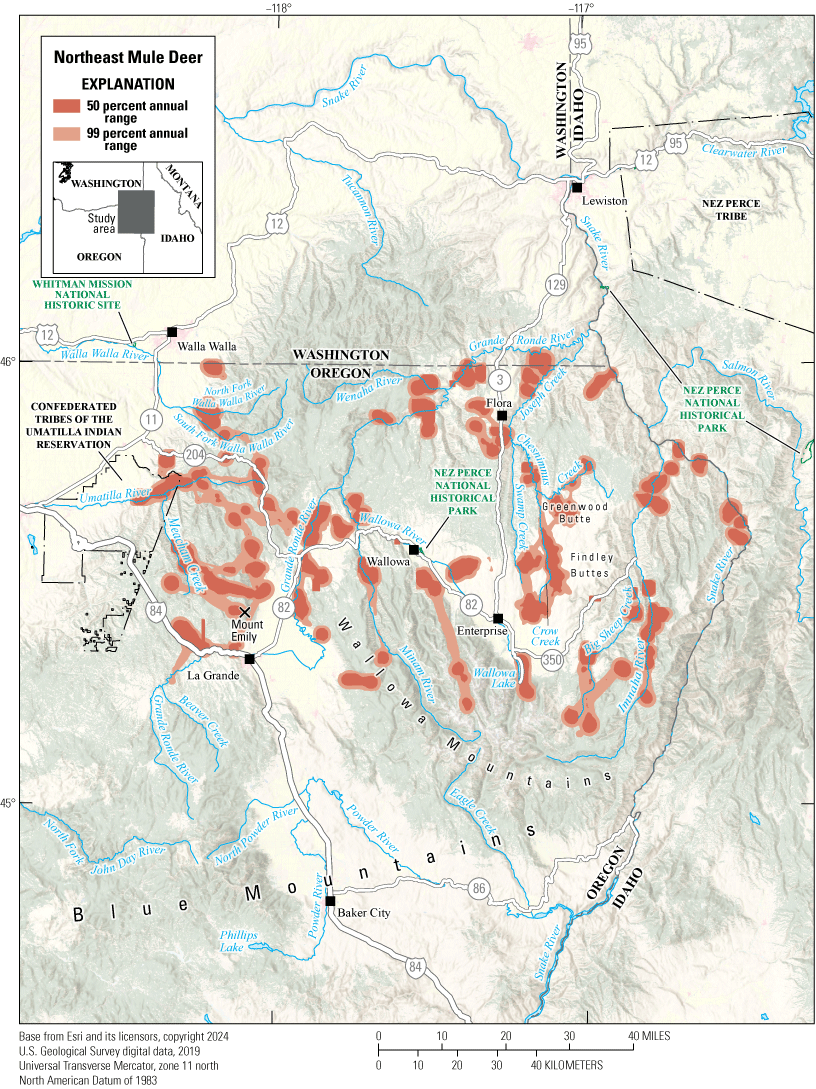
Map showing annual ranges of the Northeast mule deer herd.
Animal Capture and Data Collection
Sample size: 116 adult female mule deer
Relocation frequency: Approximately 0.6−13 hours
Project duration: 2016–19
Data Analysis
Annual range analysis: Brownian bridge movement models (Sawyer and others, 2009)
Models derived from:
Oregon | Mule Deer
Ochoco Mule Deer
The Ochoco mule deer herd has overlapping migration corridors and summer ranges but can be separated into three general subherds on the basis of winter range locations (fig. 23). During spring, mule deer in the northern subherd use winter ranges north of the Maury Mountains, near Crooked River and the Ochoco Reservoir, and either migrate farther to the north to the Ochoco Mountains and Laughlin Table or to the east, past Twelvemile Table to the foothills of Snow Mountain. Mule deer in the central subherd winter to the south of the Maury Mountains and have ranges near Bear Creek, Smoky Butte, and South Fork Crooked River. Some of the central subherd, like the northern subherd, migrate to the east to the base of Snow Mountain, Green Butte, and Juniper Ridge. Others migrate to the south to Sears Canyon, the Paulina Mountains, and the High Desert region. Mule deer in the southern subherd have winter ranges adjacent to U.S. Highway 20 and migrate to the south to summer ranges along Glass Buttes and the edge of the High Desert region. Habitats are similar across the Ochoco herd range, big sagebrush and mountain big sagebrush transition to encroaching western juniper and are followed by stands of ponderosa pine, lodgepole pine, and other mixed-conifer species as elevations increase. However, winter and residential ranges for the southern subherd contain more low sagebrush and agriculture, and the summer ranges are less forested than the summer ranges of the other two subherds.
The Ochoco mule deer herd faces several challenges, including extreme to exceptional droughts that can force mule deer to compete with feral horses for water and high-quality forage. Home ranges and high use migration corridors overlap the Liggett Table HMA and Big Summit Wild Horse Territory; Liggett Table HMA has an estimated 170 feral horses (maximum AML of 25 feral horses) and Big Summit Wild Horse Territory has an estimated 130 feral horses (maximum AML of 57 horses; BLM, 2023b; K. Kern, FS, written commun., 2023). The Ochoco herd also inhabits the Maury and Ochoco WMUs, which were included in the 5-year Mule Deer Initiatives for 2010 and 2015, respectively, to improve conditions for mule deer, primarily through habitat restoration (ODFW, 2015, 2020). Since improvement efforts started in 2010, ODFW, BLM, NRCS, and other State and Federal agencies have worked together to remove 150,931 acres (61,079 ha) of western juniper and treat 5,912 acres (2,392 ha) with prescribed fires. Additionally, these groups funded 26 water development projects and constructed 24.28 mi (39.07 km) of wildlife-friendly fencing to protect riparian areas for mule deer fawning habitat and to improve cattle distributions.
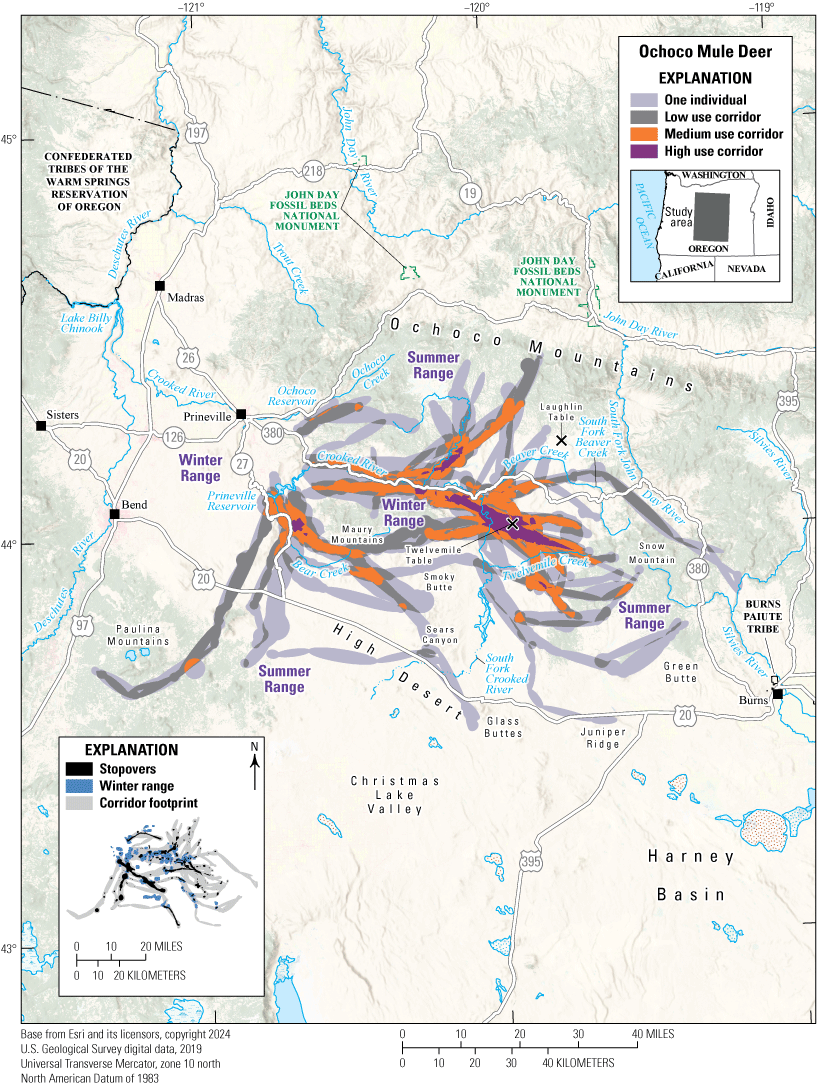
Map showing migration corridors, stopovers, and winter ranges of the Ochoco mule deer herd.
Animal Capture and Data Collection
Sample size: 88 adult female mule deer
Relocation frequency: Approximately 3−13 hours
Project duration: 2015–present (data through June 2023 analyzed for this report)
Data Analysis
Corridor, stopover, and winter range analysis: analysis for the 3-hour and 5-hour duty cycle GPS collars used Brownian bridge movement models (Sawyer and others, 2009) with an 8-hour time lag; analysis for the 13-hour duty cycle GPS collars used Fixed Motion Variance (McKee and others, 2024) with a 48-hour time lag (app. 1).
Delineation of migration periods: Net Squared Displacement (Bunnefeld and others, 2011; app. 1)
Models derived from:
Migration use classifications:Corridor and Stopover Summary
Migration start and end dates (median):
Number of days migrating (mean): Migration corridor length: Migration corridor area:Oregon | Mule Deer
Steens Mountain Mule Deer
The Steens Mountain mule deer herd contains an estimated 3,710 individuals (ODFW, 2023). Most GPS-collared mule deer are either nonmigratory or use an elevational migration route along the Steens Mountain fault block, and Oregon Route 205 bounds the west edge of the herd’s range (fig. 24). Winter ranges for the Steens Mountain mule deer herd surround Steens Mountain at lower elevations. These winter range habitats are diverse and primarily contain sagebrush and early shrub-tree habitat with encroaching western juniper and post-fire native and invasive annual grasslands. Migratory mule deer summer at higher elevations on Steens Mountain in habitats that contain Populus tremuloides (quaking aspen), mountain big sagebrush, mountain shrub, early shrub-tree, western juniper, and post-fire native grassland communities. Mule deer can compete with feral horses during drought years because seasonal ranges and migration corridors overlap four HMAs. The combined Kiger, Riddle Mountain, and Sheepshead/Heath Creek HMAs encompass more than 265,000 acres (107,000 ha); Kiger HMA contains 183 feral horses (more than the maximum AML of 82 horses), Riddle Mountain HMA contains 165 horses (more than the maximum AML of 56 horses), and Sheepshead/Heath Creek HMA contains 224 horses (the maximum AML is 302 horses; BLM, 2023b). To the south, the 280,715-acre (113,601-ha) South Steens HMA contains 606 feral horses, nearly double the maximum AML of 304 horses (BLM, 2023b). To help improve mule deer herds, the Steens Mountain WMU, which incorporates most of the Steens Mountain mule deer herd, was included in the 2015 Mule Deer Initiative (ODFW, 2020). Since 2015, ODFW, BLM, NRCS, and other State and Federal agencies have removed 4,897 acres (1,982 ha) of western juniper, reseeded 35,121 acres (14,213 ha) for native shrubs and grasses, and completed other habitat-enhancement projects. The 170,200-acre (68,877-ha) Steens Mountain Wilderness in the central and eastern part of the herd range is closed to motorized vehicles and cattle grazing throughout the year.
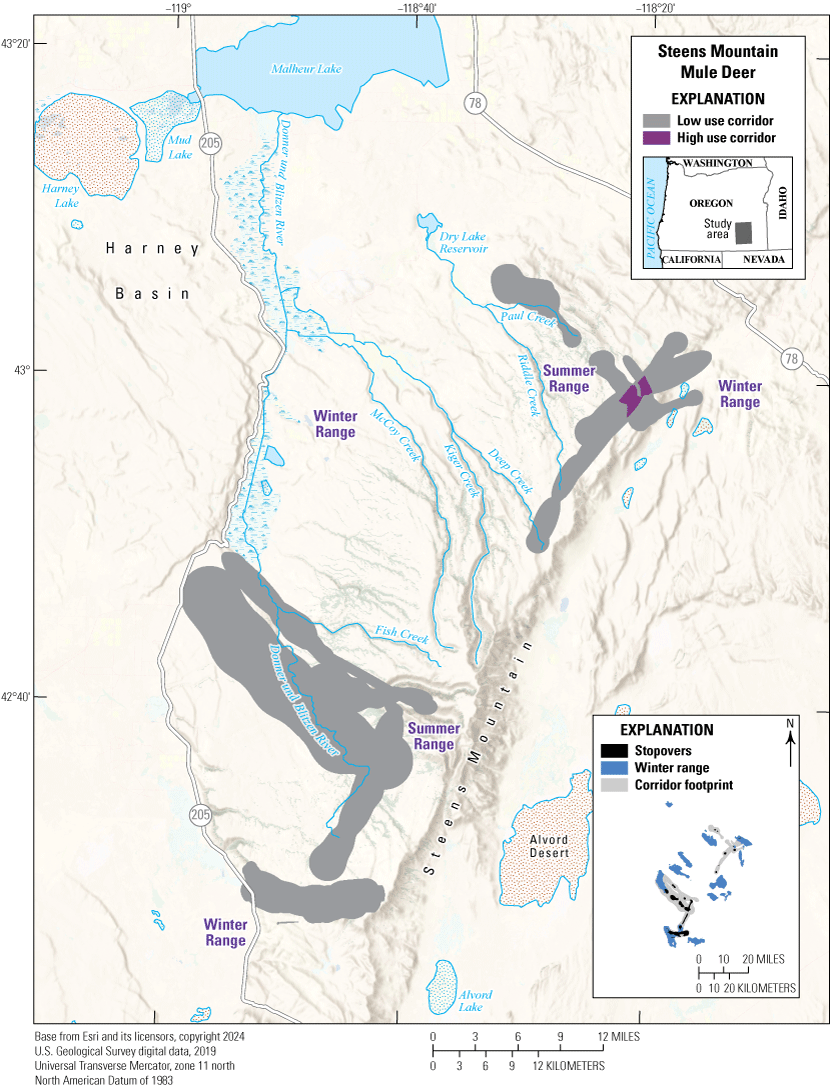
Map showing migration corridors, stopovers, and winter ranges of the Steens Mountain mule deer herd.
Animal Capture and Data Collection
Sample size: 19 adult female mule deer
Relocation frequency: Approximately 5−13 hours
Project duration: 2018–present (data through June 2023 analyzed for this report)
Data Analysis
Corridor, stopover, and winter range analysis: analysis for the 5-hour duty cycle GPS collars used Brownian bridge movement models (Sawyer and others, 2009) with an 8-hour time lag; analysis for the 13-hour duty cycle GPS collars used Fixed Motion Variance (McKee and others, 2024) with a 48-hour time lag (app. 1)
Delineation of migration periods: Net Squared Displacement (Bunnefeld and others, 2011; app. 1)
Models derived from:
Migration use classifications:Corridor and Stopover Summary
Migration start and end dates (median):
Number of days migrating (mean): Migration corridor length: Migration corridor area:Oregon | Mule Deer
Sumpter Mule Deer
Sumpter mule deer winter near Oregon Route 244 and La Grande, Oregon, and migrate to the south to Wolf Creek, Glass Hill, and Elkhorn Ridge in the spring (fig. 25). Although mixed-conifer forest and ponderosa pine dominate seasonal ranges for these mule deer, winter ranges contain more sagebrush grassland, and summer ranges contain more riparian and early shrub-tree habitats. Other mule deer wintering in patches of big sagebrush mixed with conifer, ponderosa pine, western juniper, and quaking aspen forests near North Powder Valley and Powder River also migrate to Elkhorn Ridge for the summer. Some mule deer along Burnt River, where winter ranges contain big sagebrush, western juniper, and grassland, migrate south in the spring to areas with more mixed-conifer forest and invasive annual grasses near Monument Rock and Willow Creek. Other mule deer either migrate to the north or to the west to Oregon Route 7 and Austin, Oregon, where big sagebrush, mountain big sagebrush, mixed-conifer forest, and ponderosa pine are common. Some of these mule deer travel as far north as Elkhorn Ridge and Wolf Creek. In 2015, the Cornet-Windy fire burned 56,766 acres (22,972 ha) of forested summer range near Oregon Route 245 (BLM, 2023a) and improved browse quality but potentially reduced shelter by decreasing canopy cover. In addition, highways are a significant cause of mortality in this area; for example, Interstate 84 had an annual average of 162 DVC (all local deer species) from 2010 to 2022 along a 100-mi (161-km) section (ArcGIS REST Services Directory, undated b). No GPS-collared mule deer successfully crossed Interstate 84, although multiple seasonal ranges and migrations closely bound the highway, which indicates a possible loss of historical migration routes.
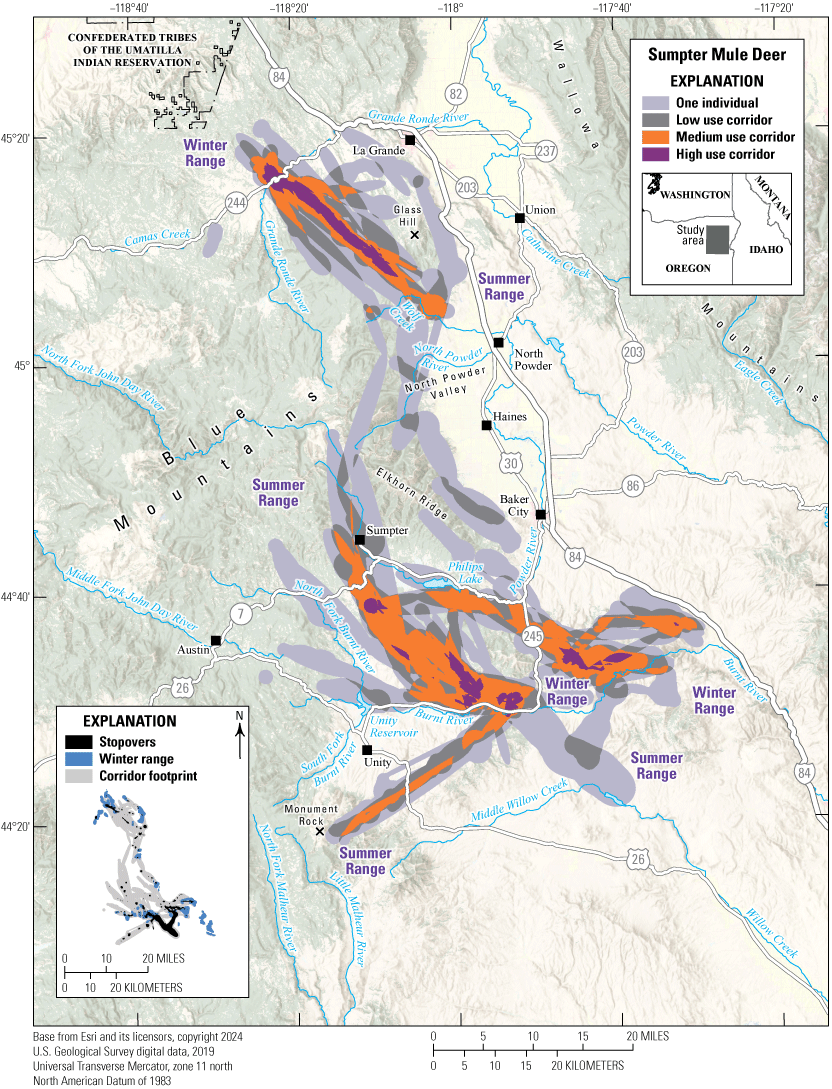
Map showing migration corridors, stopovers, and winter ranges of the Sumpter mule deer herd.
Animal Capture and Data Collection
Sample size: 88 adult female mule deer
Relocation frequency: Approximately 5−13 hours
Project duration: 2015–present (data through June 2023 analyzed for this report)
Data Analysis
Corridor, stopover, and winter range analysis: analysis for the 5-hour duty cycle GPS collars used Brownian bridge movement models (Sawyer and others, 2009) with an 8-hour time lag; analysis for the 13-hour duty cycle GPS collars used Fixed Motion Variance (McKee and others, 2024) with a 48-hour time lag (app. 1)
Delineation of migration periods: Net Squared Displacement (Bunnefeld and others, 2011; app. 1)
Models derived from:
Migration use classifications:Corridor and Stopover Summary
Migration start and end dates (median):
Number of days migrating (mean): Migration corridor length: Migration corridor area:Oregon | Mule Deer
Warner Mule Deer
The Warner mule deer herd uses varying life history strategies, or the patterns and phenology of reproduction and survival, corresponding with multiple migratory and nonmigratory behaviors (fig. 26). Mule deer wintering near Warner Valley and Oregon Route 140 migrate to the west in the spring to Bald Hills and higher elevations in the Warner Mountains, and nonmigratory mule deer reside along U.S. Highway 395. One GPS-collared mule deer migrated to the south from a winter range in Oregon to a summer range to the northwest of Mosquito Valley in northwestern Nevada. Habitats in this area vary; winter and annual ranges largely contain mountain big sagebrush, antelope bitterbrush, Wyoming big sagebrush, low sagebrush, western juniper, and early shrub-tree habitats with patches of nonnative annual grasses. Summer ranges contain mixed-conifer forest or high desert sagebrush-steppe habitats, usually including western juniper, ponderosa pine, and quaking aspen with open areas of mixed sagebrush, wetlands, and early shrub-tree habitat. An individual mule deer wintering near Crump Lake in low sagebrush and Wyoming big sagebrush-dominated habitats migrated to the north to a summer range on Hart Mountain containing mountain big sagebrush, antelope bitterbrush, and quaking aspen. Other mule deer winter to the north, near Lake Abert, where low sagebrush and Wyoming big sagebrush compete with nonnative grasses. These mule deer migrate to the south to the Warner Mountains in the spring and overlap other Warner mule deer on their summer ranges. One mule deer migrated almost 54 mi (87 km)—the longest migration within the herd—along the ridge of the Warner Mountains and passed through these summer ranges to reach Turpin Ridge.
The Warner mule deer herd faces several threats, including annual grass invasion, western juniper encroachment, and changing climate regimes that reduce forage quality and water availability. Predation, diseases such as epizootic hemorrhagic disease, and highways also contribute to mortality. Each year from 2010 to 2022, ODOT recorded on average 78.7 DVC (all local deer species) for a 30-mi (48-km) section of U.S. Highway 395, and an additional 10.7 DVC for a 32-mi (51-km) section of Oregon Route 140 (ArcGIS REST Services Directory, undated b). In 2010, the Mule Deer Initiative included the Warner WMU, and since then, ODFW, BLM, NRCS, and other State and Federal agencies and nongovernmental organizations have removed 49,940 acres (20,210 ha) of western juniper, treated 13,568 acres (5,491 ha) to eliminate invasive plants, and managed prescribed fires on 13,002 acres (5,262 ha), along with other habitat-improvement efforts (ODFW, 2015, 2020). The agencies and organizations also improved 7,018 acres (2,840 ha) of aspen stands by removing conifers, constructing fences to prevent livestock grazing, and using prescribed fires to remove conifer debris.
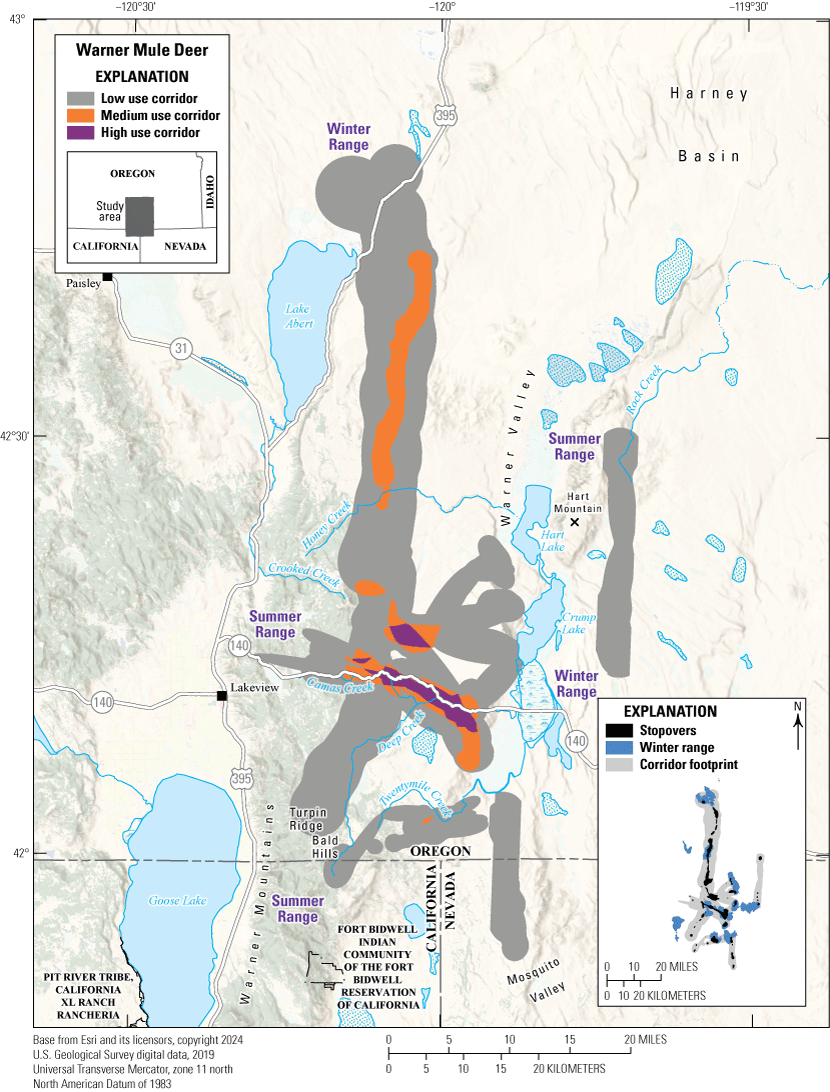
Map showing migration corridors, stopovers, and winter ranges of the Warner mule deer herd.
Animal Capture and Data Collection
Sample size: 32 adult female mule deer
Relocation frequency: Approximately 5−13 hours
Project duration: 2018–present (data through June 2023 analyzed for this report)
Data Analysis
Corridor, stopover, and winter range analysis: analysis for the 5-hour duty cycle GPS collars used Brownian bridge movement models (Sawyer and others, 2009) with an 8-hour time lag; and analysis for the 13-hour duty cycle GPS collars used Fixed Motion Variance (McKee and others, 2024) with a 48-hour time lag (app. 1)
Delineation of migration periods: Net Squared Displacement (Bunnefeld and others, 2011; app. 1)
Models derived from:
Migration use classifications:Corridor and Stopover Summary
Migration start and end dates (median):
Number of days migrating (mean): Migration corridor length: Migration corridor area:Wyoming | Mule Deer
Lake De Smet Mule Deer
The Lake De Smet mule deer herd is one of three subgroups in the larger Powder River herd unit in north-central Wyoming, and they represent the only known migratory segment of the Powder River herd unit (Sawyer and Telander, 2023). Sixty-four percent of the GPS-collared Lake De Smet mule deer migrate 15–20 mi (24–32 km) seasonally from winter ranges to the southeast of U.S. Highway 16 to summer ranges in the rolling foothills to the north of Lake De Smet and Piney Creek (fig. 27). During their migration, these mule deer have to cross U.S. Highway 16, two Wyoming county roads, and many fences. Interstate 90 effectively creates a barrier for the herd and limits summer mule deer movements to the northwest.
Irrigated hay meadows and other agricultural fields are common and interspersed among the rolling foothills and sagebrush draws. White-tailed deer are also abundant in the region and may explain the high prevalence and associated mortality with CWD in the Lake De Smet mule deer herd (Sawyer and Telander, 2023). Together, CWD and WVC along U.S. Highway 16 represent the leading causes of mortality for this mule deer herd (Sawyer and Telander, 2023).
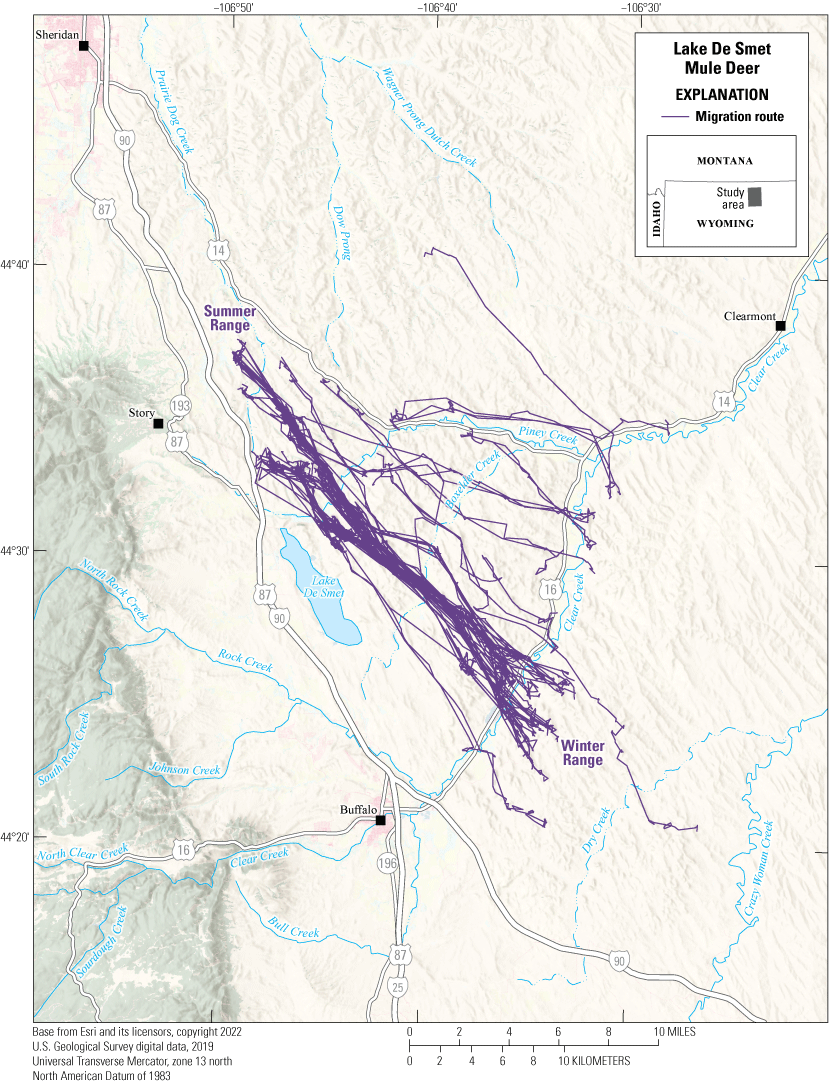
Map showing migration routes of the Lake De Smet mule deer herd.
Animal Capture and Data Collection
Sample size: 30 adult female mule deer
Relocation frequency: Approximately 2 hours
Project duration: 2019–22
Data Analysis
Delineation of migration periods: Net Squared Displacement (Bunnefeld and others, 2011; app. 1)
Models derived from:
Corridor and Stopover Summary
Migration start and end dates (median):
Number of days migrating (mean): Migration corridor length:Wyoming | Mule Deer
North Bighorn Mule Deer
The North Bighorn mule deer herd inhabits the northern half of the Bighorn Mountains in north-central Wyoming (fig. 28). The herd consists of resident mule deer that live year round in lower elevation foothills (approximately 4,265 ft [1,300 m]), primarily on private, Wyoming State trust, or BLM lands, and migratory mule deer that travel from the foothills to the summer ranges at higher elevations (approximately 7,874 ft [2,400 m]) on the Bighorn National Forest. In general, annual precipitation across the mountain range increases with elevation. To the west of the Bighorn Mountains, the Absaroka Range and arid Bighorn Basin, which receives only 7 in. (18 cm) of rain annually, prevents moisture-laden winds from reaching the western slopes of the Bighorn Mountains; therefore, the west side of the Bighorn Mountains generally receives less precipitation than the east side (Nesser, 1986). At lower-elevation (approximately 4,265 ft [1,300 m]) winter ranges, the west side of the mountain range comprises primarily sagebrush-steppe, whereas the east side consists primarily of grassland and agriculture. Mule deer have vastly different migration strategies depending on where they winter; most mule deer that winter on the east side of the mountain range are residents (76 percent), whereas most mule deer that winter on the west side of the mountain range are migratory (97 percent). Summer ranges at high elevations on Bighorn National Forest lands comprise primarily coniferous forest, most commonly lodgepole pine followed by Picea engelmannii (Engelmann spruce) and Abies lasiocarpa (subalpine fir; Witt, 2008). The herd is threatened by competition from increasing elk and white-tailed deer populations and expanding CWD prevalence (Wyoming Game and Fish Department [WGFD], 2022).
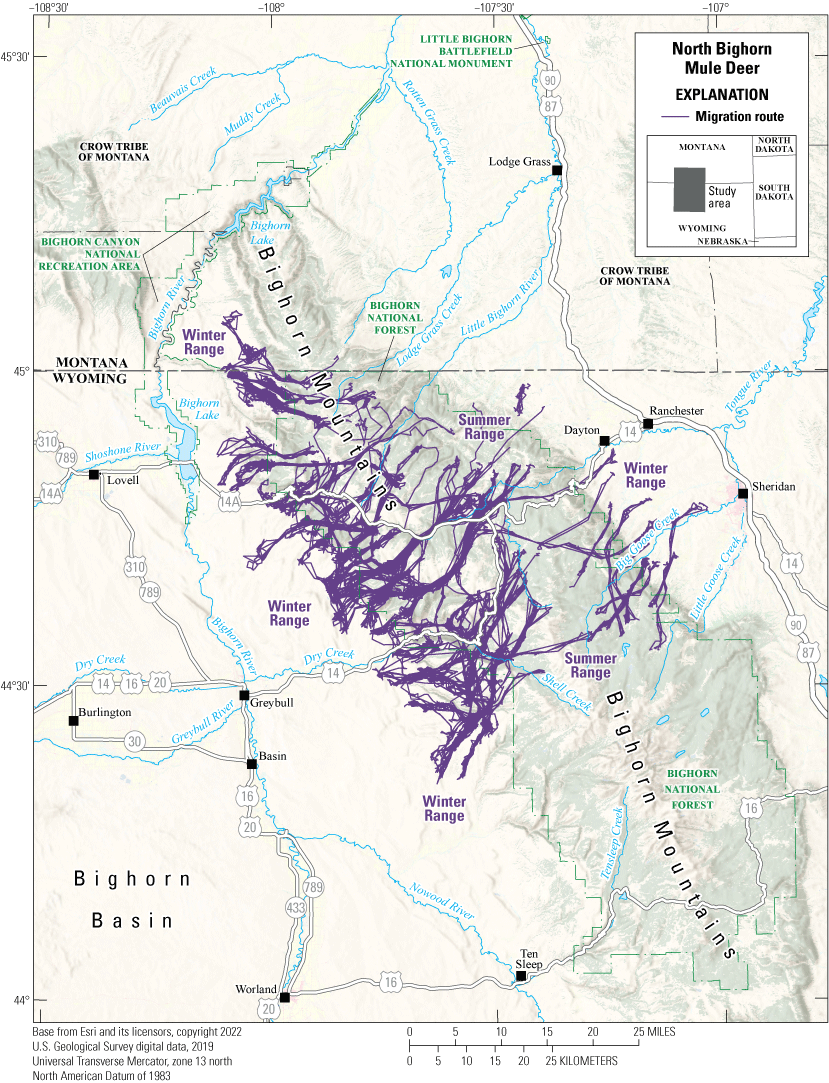
Map showing migration routes of the North Bighorn mule deer herd.
Animal Capture and Data Collection
Sample size: 176 adult mule deer (8 males, 168 females)
Relocation frequency: Approximately 2 hours
Project duration: 2020–23
Data Analysis
Delineation of migration periods: Net Squared Displacement (Bunnefeld and others, 2011; app. 1)
Models derived from:
Corridor and Stopover Summary
Migration start and end dates (median):
Number of days migrating (mean): Migration corridor length:Other Information
Project contacts:
Data analysts:Wyoming | Mule Deer
South Converse Mule Deer
The South Converse mule deer herd primarily occupies habitats within the La Prele Creek drainage surrounding La Prele Reservoir in southern Wyoming. The herd’s range is south of Interstate 25, but South Converse mule deer must cross Wyoming Highway 91 during their seasonal migrations (fig. 29). Mule deer occupy an area of approximately 994 mi2 (2,574 km2), and elevations range from approximately 4,921 ft (1,500 m) to 8,858 ft (2,700 m). Within this area, most mule deer habitats consist of private rangelands, as well as some cultivated meadows and small tracts of public land. Several mule deer migrate to higher elevations in the Laramie Mountains where there are larger tracts of national forest. Cercocarpus montanus (true mountain-mahogany), antelope bitterbrush, mountain and Wyoming big sagebrush, and Rhus aromatica var. pilosissima (skunkbush sumac) dominate the foothills, whereas sagebrush and irrigated hayfields dominate the lowland areas. Mule deer typically winter on steep slopes dominated by true mountain-mahogany or within Populus deltoides ssp. monilifera (plains cottonwood) galleries along riparian areas.
From 2001 to 2009, WGFD recorded an average CWD prevalence of 31 percent from hunter-harvested mule deer in the South Converse herd (DeVivo and others, 2017). The WGFD estimated that the herd had declined by >50 percent during this time, so in 2010, a GPS-collaring study was initiated to understand CWD epidemiology in the region (DeVivo and others, 2017). The 4-year study revealed that CWD was a significant contributor to the herd’s decline from approximately 6,100 mule deer in 2010, to 5,100 mule deer in 2014 (DeVivo and others, 2017). The herd grew modestly after this research concluded because of consecutive years of favorable environmental conditions that improved fawn recruitment and overall survival; however, numbers subsequently declined and have remained low (WGFD, 2021). Since the study ended, CWD prevalence in harvested adult male mule deer stabilized and remains a potentially significant factor affecting the herd’s performance. In addition to disease, periodic severe winters, drought, poor habitat conditions, predation, and an expanding elk herd remain concerns for the South Converse mule deer herd.
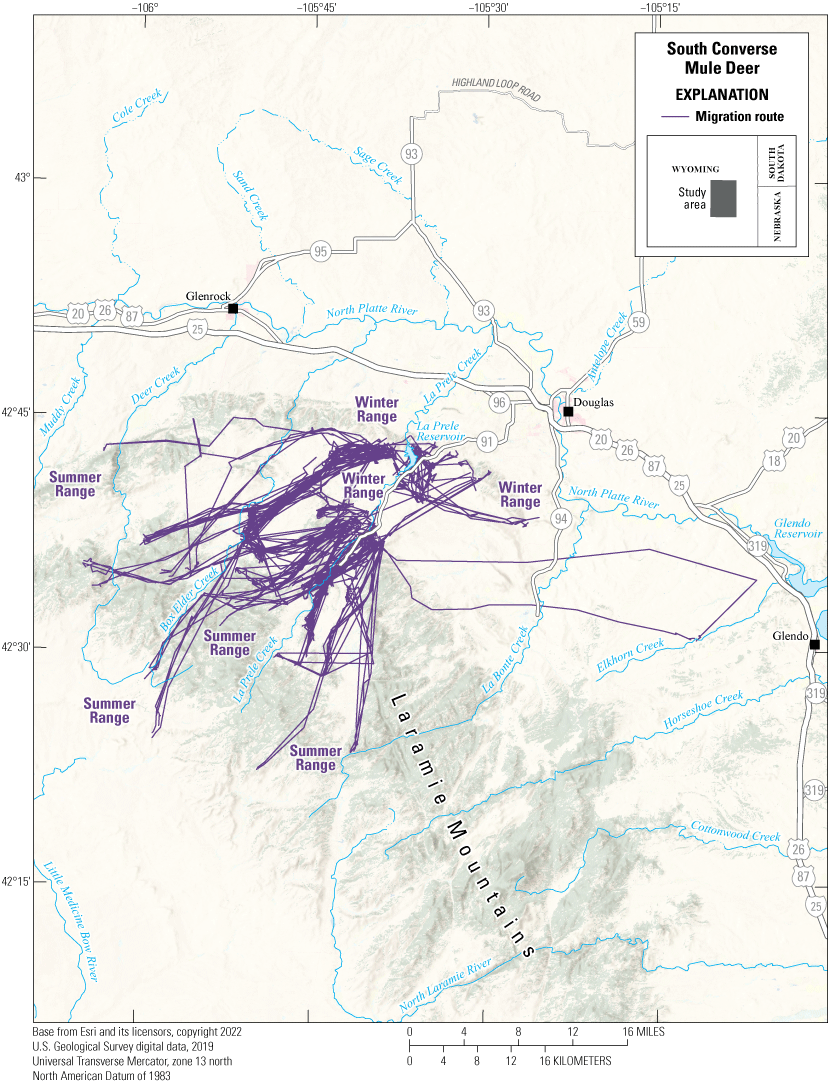
Map showing migration routes of the South Converse mule deer herd.
Animal Capture and Data Collection
Sample size: 116 adult mule deer (21 males, 95 females)
Relocation frequency: Approximately 4−8 hours
Project duration: 2010–14
Data Analysis
Delineation of migration periods: Net Squared Displacement (Bunnefeld and others, 2011; app. 1)
Models derived from:
Corridor and Stopover Summary
Migration start and end dates (median):
Number of days migrating (mean): Migration corridor length:Other Information
Project contacts:
-
• Justin Binfet (justin.binfet@wyo.gov), Wildlife Management Coordinator, Wyoming Game and Fish Department
-
• Melia DeVivo (Melia.Devivo@dfw.wa.gov), Ungulate Research Scientist, Washington Department of Fish and Wildlife
-
• Todd Cornish (tecornish@ucdavis.edu), Pathologist, University of California, Davis School of Veterinary Medicine, California Animal Health and Food Safety Lab
Arizona | Pronghorn
Anderson Mesa Pronghorn
Pronghorn in the Anderson Mesa herd reside in GMUs 5A and 5B, to the southeast of Flagstaff, Arizona. The herd summers at higher elevations (7,326 ft [2,233 m]) on Anderson Mesa and winters at lower elevations (5,577 ft [1,700 m]) in Dog Valley (fig. 30). Summer and winter habitats consist primarily of perennial grasslands and shrubs. The steep mesa, as well as impermeable fencing and pinyon and juniper encroachment, limit pronghorn movement between seasonal ranges. These barriers force the Anderson Mesa herd to follow three distinct migration routes that are separated by Anderson Canyon, Canyon Diablo, and Jacks Canyon.
Approximately 2.50 mi (4.02 km) to the north of the herd’s winter range, Interstate 40 creates a barrier to any substantial northward movement by the Anderson Mesa pronghorn herd. In 1967, high snow levels pushed the Anderson Mesa herd to the Interstate 40 boundary (State Route 66 at the time; White, 1969). The herd’s aversion to barriers and limited access to winter forage caused approximately 77 percent of the herd to die that winter (White, 1969). The Anderson Mesa pronghorn herd continues to recover from the large mortality event, which highlights the importance of maintaining migration corridors for the herd’s seasonal movements.
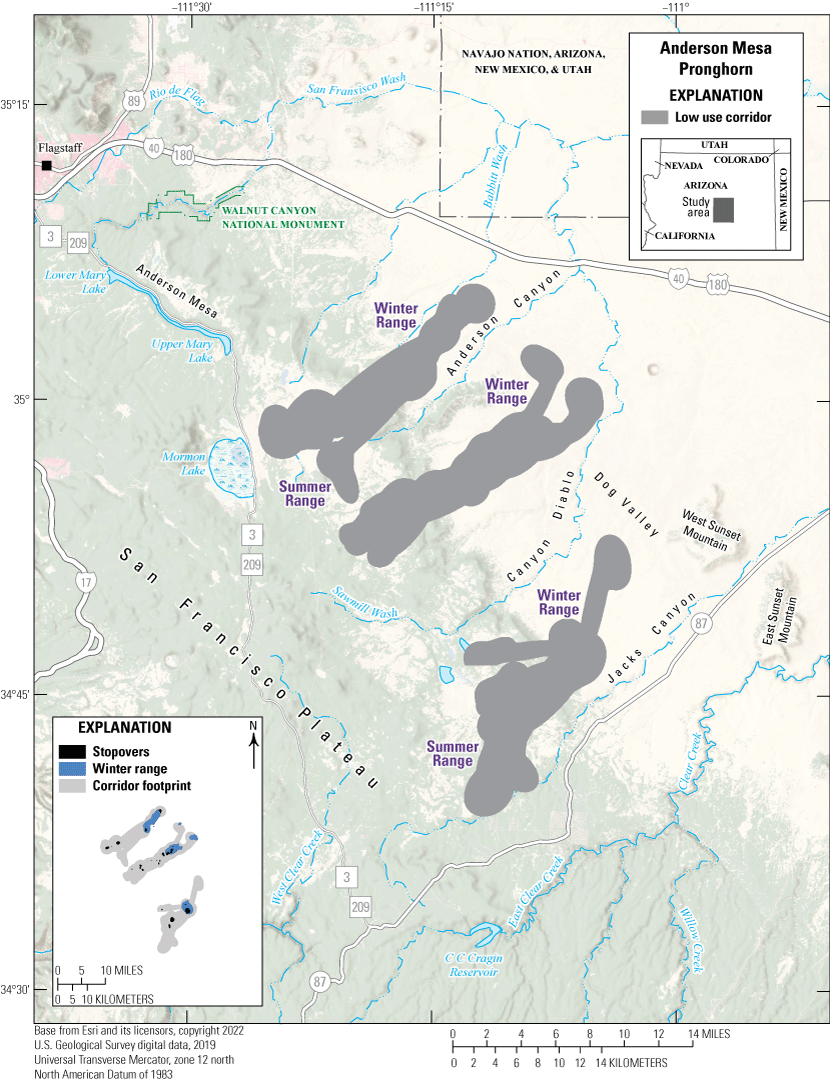
Map showing migration corridors, stopovers, and winter range of the Anderson Mesa pronghorn herd.
Animal Capture and Data Collection
Sample size: 15 adult pronghorn (1 male, 14 females)
Relocation frequency: Approximately 8 hours
Project duration: 2003–06
Data Analysis
Corridor, stopover, and winter range analysis: Fixed Motion Variance (refer to app. 1 for further description)
Delineation of migration periods: Net Squared Displacement (Bunnefeld and others, 2011; app. 1)
Models derived from:
Migration use classifications:Corridor and Stopover Summary
Migration start and end dates (median):
Number of days migrating (mean): Migration corridor length: Migration corridor area:California | Pronghorn
Bodie-Wassuk Pronghorn
The Bodie-Wassuk pronghorn herd contains migrants, but individuals from this herd do not migrate between traditional summer and winter seasonal ranges. Therefore, annual ranges were modeled using year-round data to demarcate high use areas instead of modeling the specific winter ranges commonly found in other ungulate analyses in California (for example, refer to the “Casa Diablo Mule Deer” section of this report). Although the Bodie-Wassuk pronghorn are not traditional migrants, much of the herd has a nomadic migratory tendency and sometimes moves between the Bodie Hills to the east of U.S. Highway 395 in California to a basin to the west of the Wassuk Range between Aurora Crater and Corey Peak in Nevada (fig. 31). A few GPS-collared pronghorn moved as far north as the Gray Hills, staying to the west of the Wassuk Range, and one GPS-collared pronghorn moved as far south as the Alkali Valley. This herd prefers low sagebrush habitat followed by big sagebrush communities. Pronghorn were reintroduced just to the north of Mono Lake beginning in the 1940s and to the Adobe Valley in the 1980s, but low fawn recruitment, a lack of permanent water availability, abundant wildlife exclusion fencing, and the expansion of pinyon-juniper woodlands and invasive cheatgrass into preferred native shrub and forb habitats have prevented population growth. The current (2024) herd estimate is stable at <150 pronghorn (Taylor, 2011). Additional conservation concerns for the herd include human activities, such as off-highway vehicle use and proposed mining, as well as an increasing feral horse population.
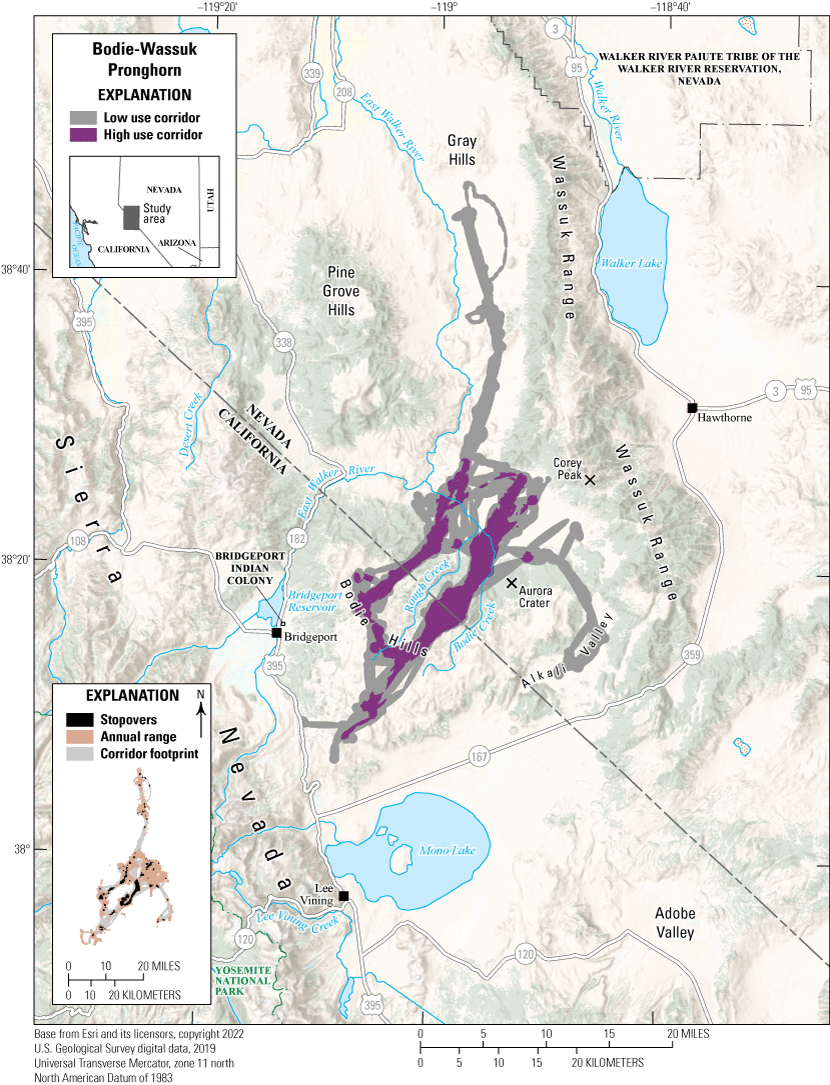
Map showing migration corridors, stopovers, and annual range of the Bodie-Wassuk pronghorn herd.
Animal Capture and Data Collection
Sample size: 20 adult female pronghorn
Relocation frequency: Approximately 4 hours
Project duration: 2014–16
Data Analysis
Corridor, stopover, and annual range analysis: Fixed Motion Variance (refer to app. 1 for further description)
Delineation of migration periods: Net Squared Displacement (Bunnefeld and others, 2011; app. 1)
Models derived from:
Migration use classifications:Wyoming | Pronghorn
Baggs Pronghorn
The Baggs pronghorn herd inhabits south-central Wyoming, to the southwest of Rawlins, Wyoming, bounded by Interstate 80 to the north and the Wyoming–Colorado border to the south (fig. 32). This herd unit includes the Atlantic Rim and the eastern part of the Red Desert Basin, which is an arid to semiarid Wyoming big sagebrush-steppe habitat marked by severe winters. Although the landscape is generally remote, human development, including oil and natural gas infrastructure and cattle and sheep ranching, affects the habitat the herd uses. Therefore, a GPS-collaring study (2013–16) was initiated to evaluate the effects of human-caused and environmental change on pronghorn in the Red Desert Basin (Reinking and others, 2018, 2019). Pronghorn in this herd are semimigratory to nomadic and migrate around the Sierra Madre. In general, pronghorn winter to the west of the Sierra Madre range and near Wyoming Highway 789, and spring migrations expand to the southeast, the east, or the north. However, migration routes are not always consistent, and pronghorn can backtrack across their migration route or remain on winter range year round. Some individuals in this herd seasonally overlap with the Elk Mountain herd (refer to the “Elk Mountain Pronghorn” section in this report). Property boundary or legacy livestock ranching fences remain prevalent in the area, restrict pronghorn movement, and pose a direct mortality risk. Interstate 80, the biggest barrier that Baggs pronghorn encounter, is rarely crossed by pronghorn because the interstate has a high traffic volume, net-wired right-of-way fencing, and part of the Union Pacific Railroad parallels the interstate. Wyoming Highway 789, which runs to the north and to the south and divides this herd, is another barrier. However, pronghorn can cross Wyoming Highway 789 more easily than Interstate 80 (Robb and others, 2022). Beginning in 2009, a series of underpasses were constructed on Wyoming Highway 789, to the north of Baggs, Wyoming, but they are used mostly by mule deer. Baggs pronghorn also share habitat and compete for resources with feral horses in the Adobe Town HMA and potentially the Salt Wells Creek HMA, to the west of Wyoming Highway 789 in the southern Red Desert Basin (Hennig, 2021; Hennig and others, 2021, 2022, 2024). Furthermore, feral horses, pronghorn, and cattle have a high degree of overlap at water sources in the Red Desert Basin (Hennig and others, 2021).
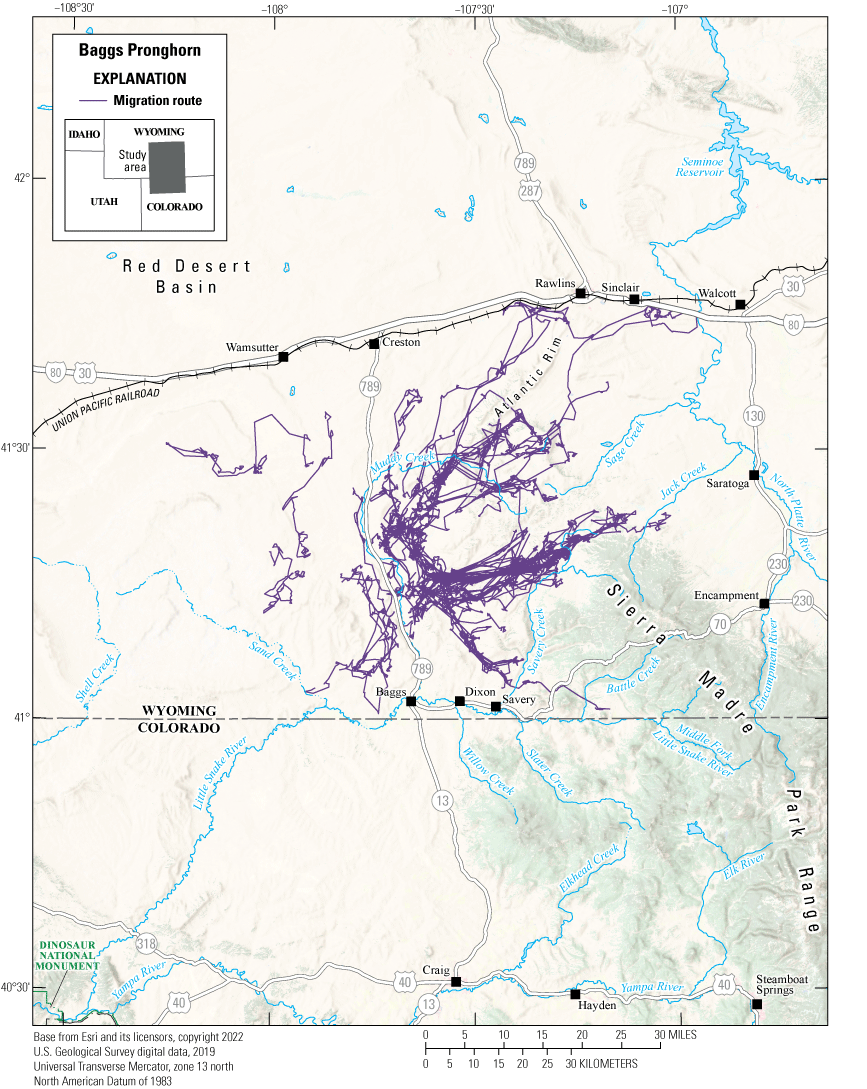
Map showing migration routes of the Baggs pronghorn herd.
Animal Capture and Data Collection
Sample size: 32 adult female pronghorn
Relocation frequency: Approximately 2 hours
Project duration: 2013–16 (data through 2015 analyzed for this report)
Data Analysis
Delineation of migration periods: Net Squared Displacement (Bunnefeld and others, 2011; app. 1)
Models derived from:
Corridor and Stopover Summary
Migration start and end dates (median):
Number of days migrating (mean): Migration corridor length:Other Information
Project contacts:
-
• Jeffrey L. Beck (jlbeck@uwyo.edu), Professor, Department of Ecosystem Science and Management, College of Agriculture, Life Sciences and Natural Resources, University of Wyoming
-
• Adele K. Reinking (Adele.Reinking@colostate.edu), Wildlife Research Biologist and Ph.D. Student, Colorado State University
-
• Reinking, A.K, 2017, Coupling mortality risk and multi-scale resource selection to understand the effects of environmental and anthropogenic change on pronghorn in the Red Desert, Wyoming: Laramie, Wyo., University of Wyoming, M.S. thesis, p. 1–106. [Also available at https://www.uwyo.edu/esm/faculty-and-staff/faculty/beck/_files/docs/theses-dissertations/adelereinking-thesis-010518.pdf.]
Wyoming | Pronghorn
Bitter Creek Pronghorn
The Bitter Creek pronghorn herd inhabits south-central Wyoming, primarily to the south of Interstate 80. This herd unit includes the Great Divide Basin and the Red Desert Basin, characterized primarily by arid to semiarid sagebrush-steppe and harsh winters. Although the herd is generally remote, human development, such as oil and natural gas infrastructure, cattle and sheep ranching, and surface mining, affect pronghorn movement. Additionally, Interstate 80 functions as a large barrier to pronghorn movement, which motivated a GPS-collaring study (2017–20) to better understand the effect of Interstate 80 on pronghorn.
Most pronghorn in this herd are residents, but some individuals have intermittent migrations or seasonal movements to the south in the winter (fig. 33). These migrations do not occur every year and seemingly depend on winter severity (in other words, facultative migrations). Such movements do not necessarily occur between distinct seasonal ranges, so boundaries between seasonal ranges are unclear. Pronghorn can migrate more than 75 mi (121 km), as far south as Sunbeam, Colorado, and the herd spends most of the year near Interstate 80. The GPS-collared pronghorn with the farthest recorded migration remained within 6.2 mi (10 km) of Interstate 80 for 85 percent of its collar life (3.5 years; B. Robb, University of Wyoming, written commun., 2024). However, the high traffic volume of Interstate 80, net-wired right-of-way fencing, and the Union Pacific railroad that partly parallels the interstate deter most pronghorn from crossing the interstate. Only one migratory pronghorn successfully crossed Interstate 80, near mile marker 161, which indicated significant effects of the interstate as a barrier on the Bitter Creek herd. Fencing around oil and natural gas infrastructure also creates barriers to movement and poses a direct mortality risk.
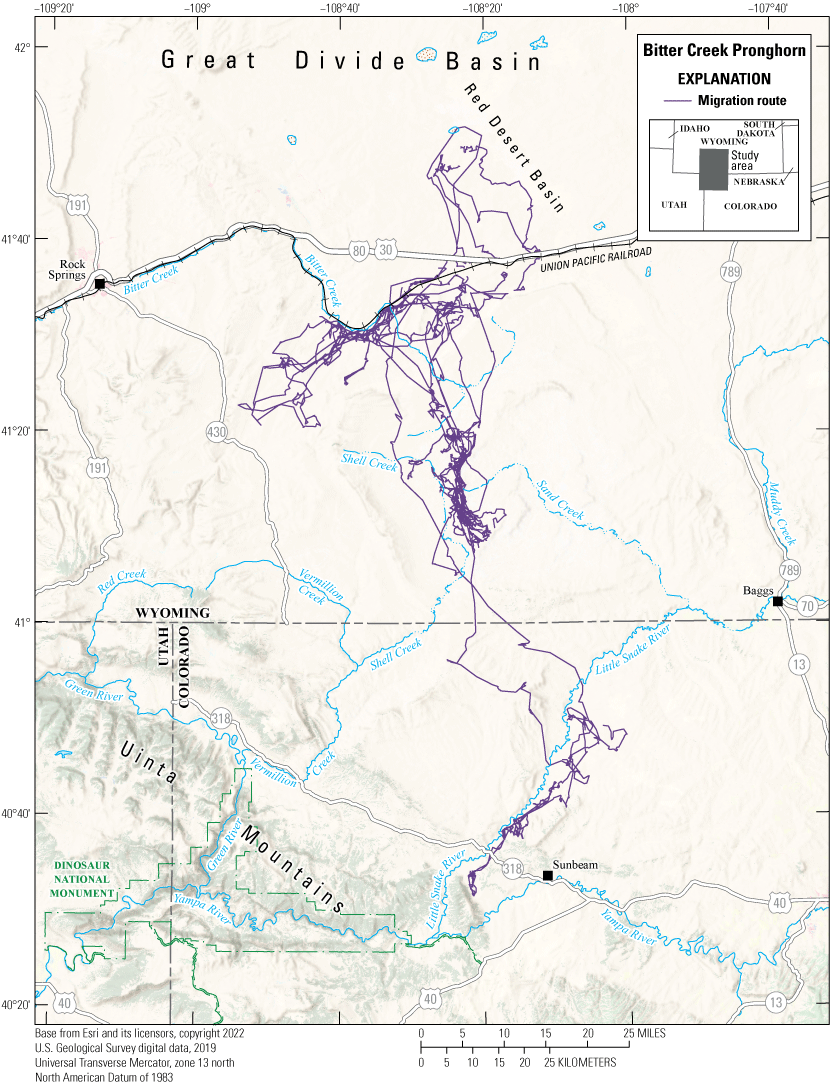
Map showing migration routes of the Bitter Creek pronghorn herd.
Animal Capture and Data Collection
Sample size: 6 adult female pronghorn
Relocation frequency: Approximately 2 hours
Project duration: 2017–20
Data Analysis
Delineation of migration periods: Net Squared Displacement (Bunnefeld and others, 2011; app. 1)
Models derived from:
Corridor and Stopover Summary
Migration start and end dates (median):
Number of days migrating (mean): Migration corridor length:Other Information
Project contacts:
-
• Benjamin Robb (brobb1@uwyo.edu), Research Scientist, Department of Zoology and Physiology, University of Wyoming
-
• Matthew Kauffman (mkauffm1@uwyo.edu), U.S. Geological Survey, Wyoming Cooperative Fish and Wildlife Research Unit, Department of Zoology and Physiology, University of Wyoming
-
• Robb, B.S., 2020, Pronghorn migrations and barriers—Predicting corridors across Wyoming’s Interstate 80 to restore movement: Laramie, Wyo., University of Wyoming, M.S. thesis, p. 1–97. [Also available at https://migrationinitiative.org/wp-content/uploads/2022/12/Pronghorn_Migrations_and_Barri.pdf.]
Wyoming | Pronghorn
Elk Mountain Pronghorn
The Elk Mountain pronghorn herd inhabits south-central Wyoming to the south of Interstate 80, southeast of Rawlins, Wyoming, and north of the Sierra Madre range and Medicine Bow Mountains (fig. 34). This herd unit is dominated by arid to semiarid Wyoming big sagebrush-steppe and characterized by harsh winters. This GPS-collaring project (2010–12) was initiated to serve as a control herd for a wind energy and pronghorn study in the Shirley Basin of Central Wyoming (Taylor, 2014). Pronghorn in this herd are partially migratory and use habitat on the east and west sides of Wyoming Highway 130. They generally winter in a valley to the north of Saratoga, Wyoming, along Wyoming Highway 130 and the North Platte River. During the spring, pronghorn either migrate to the south toward the foothills of the Sierra Madre or to the east toward Elk Mountain. Pronghorn that summer to the east of Elk Mountain migrate either to the south or to the north around the mountain; pronghorn face bottlenecks on each route that are created by Pennock Mountain to the south of Elk Mountain or Interstate 80 to the north of Elk Mountain. Some individual pronghorn in this herd seasonally overlap with the Baggs herd (refer to the “Baggs Pronghorn” section in this report).
The Elk Mountain pronghorn herd faces many threats from human development. Interstate 80 is the most prominent barrier to pronghorn movement (Robb and others, 2022). Pronghorn rarely cross the interstate because of the road’s high traffic volume and associated net-wired right-of-way fencing; additionally, part of the Union Pacific railroad parallels the interstate. Wyoming Highway 130 and associated fencing also limit pronghorn movement, but pronghorn can cross this highway and fencing more easily than Interstate 80 (Robb and others, 2022). Pronghorn also encounter some exurban development near Saratoga and Elk Mountain, Wyoming, as well as cattle ranching and agricultural land, primarily pastures and meadows for hay production.
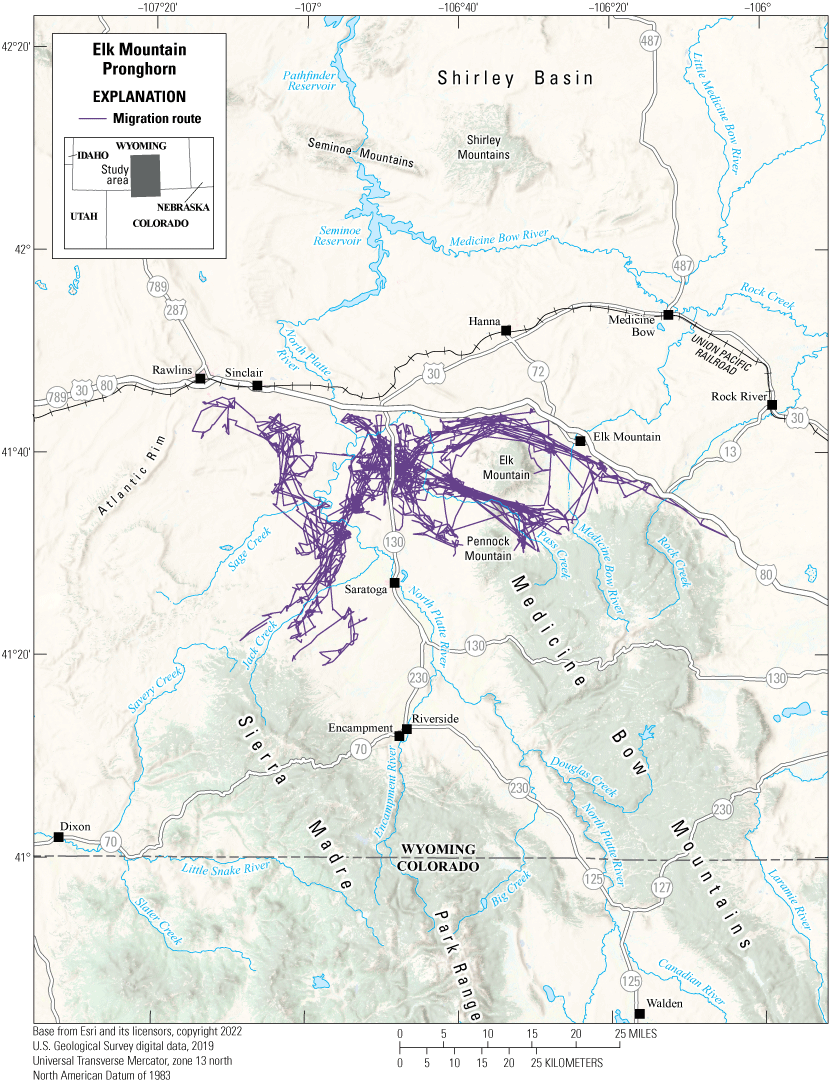
Map showing migration routes of the Elk Mountain pronghorn herd.
Animal Capture and Data Collection
Sample size: 24 adult female pronghorn
Relocation frequency: Approximately 7−11 hours
Project duration: 2010–12
Data Analysis
Delineation of migration periods: Net Squared Displacement (Bunnefeld and others, 2011; app. 1)
Models derived from:
Corridor and Stopover Summary
Migration start and end dates (median):
Number of days migrating (mean): Migration corridor length:Other Information
Project contacts:
-
• Jeffrey L. Beck (jlbeck@uwyo.edu), Professor, Department of Ecosystem Science and Management, College of Agriculture, Life Sciences and Natural Resources, University of Wyoming
-
• Kaitlyn L. Taylor (katie.taylor.360@gmail.com), Department of Ecosystem Science and Management, University of Wyoming
-
• Morrison, T.A., Merkle, J.A., Hopcraft, J.G.C., Aikens, E.O., Beck, J.L., Boone, R.B., Courtemanch, A.B., Dwinnell, S.P., Fairbank, W.S., Griffith, B., Middleton, A.D., Monteith, K.L., Oates, B., Riotte-Lambert, L., Sawyer, H., Smith, K.T., Stabach, J.A., Taylor, K.L., and Kauffman, M.K., 2021, Drivers of site fidelity in ungulates: Journal of Animal Ecology, v. 90, p. 955–966.
-
• Taylor, K.L., 2014, Pronghorn (Antilocapra americana) response to wind energy development on winter range in south-central, Wyoming: Laramie, Wyo., University of Wyoming, M.S. thesis, p. 1–123.
Arizona | Elk
State Route 260 Elk
The State Route 260 elk herd resides to the east of Payson, Arizona, along State Route 260 in GMUs 3C, 4A, 4B, 5A, 22, and 23. The herd winters in a concentrated range around State Route 260 near Kohls Ranch, south of Diamond Rim, and extending to Christopher Mountain and Bearhide Canyon (fig. 35). Most elk summer on the Mogollon Rim, a rugged escarpment at the southern tip of the Colorado Plateau, and descend from the Mogollon Rim in two primary locations—Sharp Creek and Al Fulton Point—to reach the winter range. Other elk summer below the Mogollon Rim, but as winter approaches, they migrate to the south to the winter range.
In 2021, the Average Annual Daily Traffic (AADT) on State Route 260 near the herd’s winter range was 6,557 vehicles (ArcGIS REST Services Directory, undated a). Previous studies suggested that when the AADT exceeds 10,000–15,000 vehicles, elk rarely attempt to cross highways (Gagnon and others, 2007a) unless a designated crossing, such as an underpass, has been established (Gagnon and others, 2007b, 201119; Dodd and others, 2012b). Several underpasses are in place for part of the mapped area. However, as development in Arizona continues to expand, it will become increasingly important to effectively manage traffic and accommodate wildlife crossings along State Route 260.
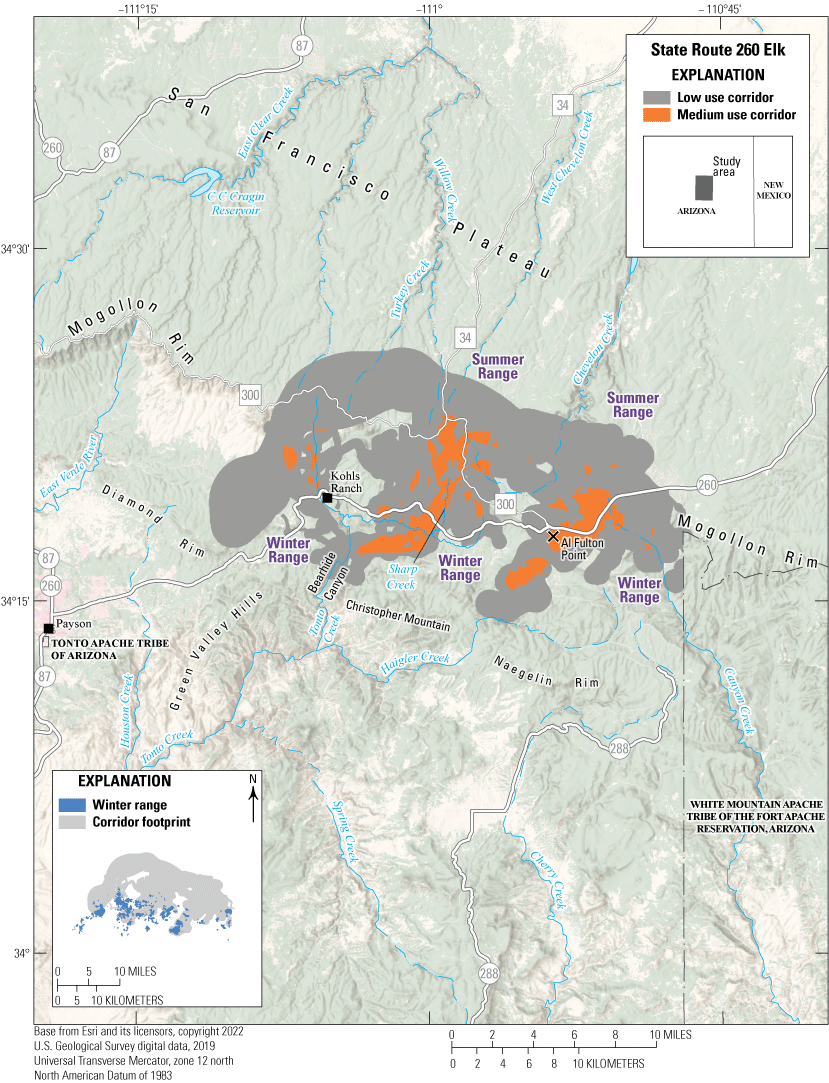
Map showing migration corridors and winter range of the State Route 260 elk herd.
Animal Capture and Data Collection
Sample size: 162 adult elk (34 males, 128 females)
Relocation frequency: Approximately 1−4 hours
Project duration: 2002–08 and 2012–15
Data Analysis
Corridor and winter range analysis: Brownian bridge movement models (Sawyer and others, 2009).
Delineation of migration periods: Net Squared Displacement (Bunnefeld and others, 2011; app. 1)
Models derived from:
Migration use classifications:Corridor and Stopover Summary
Migration start and end dates (median):
Number of days migrating (mean): Migration corridor length: Migration corridor area:Idaho, Nevada, and Shoshone-Paiute Tribes of the Duck Valley Reservation, Nevada | Elk
Bruneau-Diamond A Desert Elk
The Bruneau elk herd comprises part of an Idaho–Nevada metapopulation that uses winter ranges in Idaho and summer ranges in Nevada. Migration patterns separate two subherds comprising the Bruneau-Diamond A Desert herd: the J-P Desert subherd and the Diamond Desert subherd. The two subherds converge on common wintering grounds that are separated by the Bruneau River canyon. The J-P Desert elk depart mountainous regions in Nevada, Idaho, and the Shoshone-Paiute Tribes of the Duck Valley Reservation, Nevada, to winter on desert plateaus in Idaho (fig. 36). The Diamond Desert elk primarily summer in the headwaters of the Bruneau River, which includes the western extent of the Jarbidge Mountains, the Copper Mountains, and the Ichabod Range. Generally, wintering males prefer south-facing slopes in proximity to the summer range; however, large female and calf groups migrate across the Idaho–Nevada border onto Diamond A Desert along the Bruneau River and as far to the north as the confluence with the Jarbidge River, 22 mi (35 km) into Idaho. The Diamond A Desert harbors expansive intact shrublands, including sagebrush and grasslands consisting of various native and nonnative Agropyron spp. (wheatgrass). The J-P Desert elk summer primarily on the Shoshone-Paiute Tribes of the Duck Valley Reservation, Nevada and the Bruneau Range. Females and calves prefer to summer outside of Nevada in southern Idaho and the Shoshone-Paiute Tribes of the Duck Valley Reservation, Nevada.
Tracking of the J-P Desert subherd indicate that they rarely cross into Nevada (T. Allen, Nevada Department of Wildlife, written commun., 2024). Instead, they migrate north onto and across the J-P Desert, generally along the Sheep Creek Canyon. Most winters, elk migrate as far to the north as the Blackstone Desert, approximately 40 mi (63 km) into Idaho, and share a winter range with neighboring Idaho elk herds. Summer range vegetation for both elk subherds is consistent with high-elevation Great Basin communities. Higher elevation habitats include mountain brush communities containing antelope bitterbrush, Amelanchier alnifolia (western serviceberry), and Ceanothus velutinus (snowbush), quaking aspen, mountain-mahogany, Abies spp. (fir), and Pinus spp. (pine). Through coordination among Idaho Fish and Game, Nevada Department of Wildlife, and the Shoshone-Paiute Tribes of the Duck Valley Reservation, Nevada, the Bruneau-Diamond A elk herd remains a stable population.
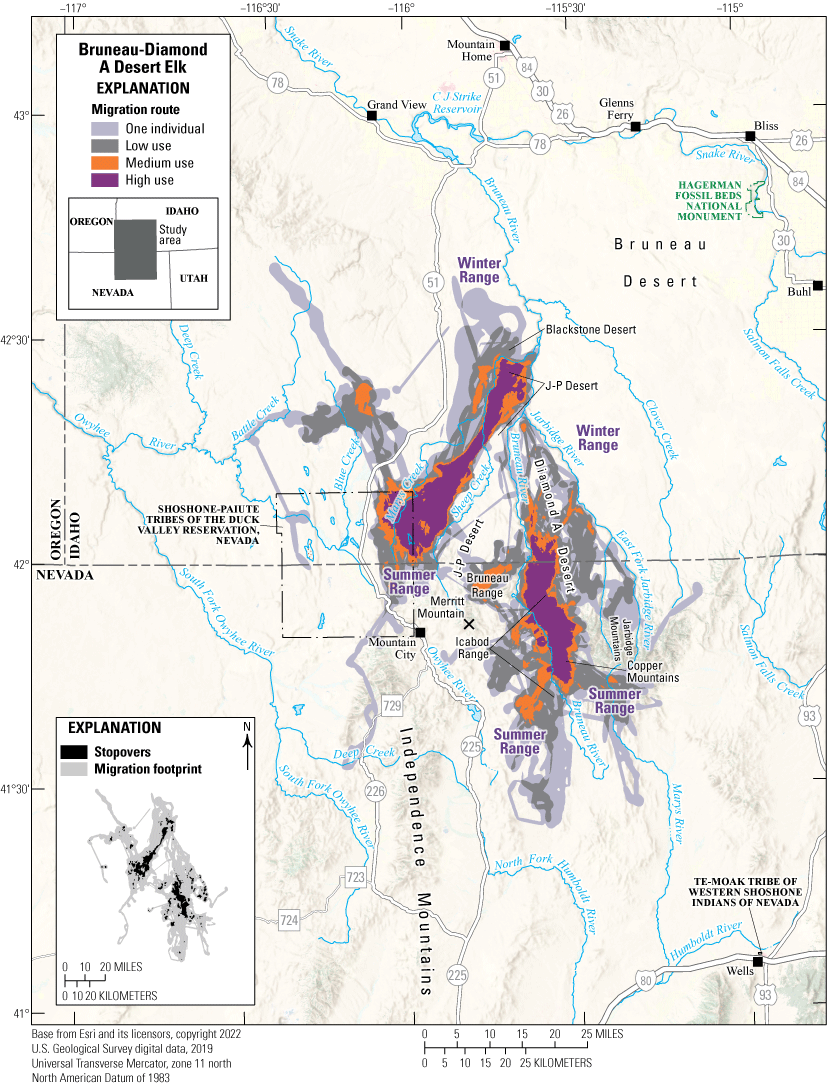
Map showing migration routes and stopovers of the Bruneau-Diamond A Desert elk herd.
Animal Capture and Data Collection
Sample size: 35 adult female elk
Relocation frequency: Approximately 12.5 hours
Project duration: 2015–22
Data Analysis
Migration route and stopover analysis: Brownian bridge movement models (Sawyer and others, 2009) with an 8-hour time lag for 8 migration sequences, Fixed Motion Variance (10,764 ft2 [1,000 m2]; McKee and others, 2024) with a 14-hour time lag (app. 1) for 79 migration sequences, and Fixed Motion Variance (10,764 ft2 [1,000 m2]) with a 27-hour time lag for 51 migration sequences
Delineation of migration periods: Net Squared Displacement (Bunnefeld and others, 2011; app. 1)
Models derived from:
Migration use classifications:Migration Route and Stopover Summary
Migration start and end dates (median):
Number of days migrating (mean): Migration route length: Migration route area:Other Information
Project contacts:
-
• Travis Allen (tallen@ndow.org), Wildlife Biologist, Nevada Department of Wildlife
-
• Jacob Gray (jacob.gray@idfg.idaho.gov), Natural Resources Program Coordinator Habitat and Migration, Idaho Fish and Game
-
• Matt Jeffress (mjeffress@ndow.org), Wildlife Biologist, Nevada Department of Wildlife
-
• Cody McKee (cmckee@ndow.org), Wildlife Staff Specialist, Nevada Department of Wildlife
-
• Matt Mumma (matt.mumma@idfg.idaho.gov), Wildlife Research Manager, Idaho Fish and Game
Idaho and Nevada | Elk
Inside Desert Elk
The Inside Desert elk herd comprises part of an Idaho–Nevada metapopulation that primarily uses winter ranges in Idaho and summer ranges in Nevada (fig. 37). Inside Desert elk migrate from their winter range near the confluence of the Bruneau River and Clover Creek in Idaho, following the west edge of the Inside Desert along the Bruneau and Jarbidge Rivers to their summer range in the Jarbidge Mountains of Nevada. The migration route for part of the Inside Desert elk herd is divided into separate but adjacent routes that generally follow Clover Creek to a summer range near Elk Mountain in Nevada. Elevations range from 4,390 ft (1,338 m) at Lookout Butte in Idaho, to 8,815 ft (2,687 m) at Elk Mountain, and to 9,502 ft (2,896 m) in the Jarbidge Mountains. Winter range comprises a patchy mosaic of intact native shrubland communities consisting of sagebrush, native bunchgrasses like Leymus cinereus (basin wildrye) and Festuca idahoensis (Idaho fescue), and past wildfire scars with extensive establishment of nonnative vegetation like cheatgrass and Brassica spp. (mustard). The summer range consists of high-elevation mountain brush communities including antelope bitterbrush, western serviceberry, snowbush, communities of quaking aspen, mountain-mahogany, and fir. Much of the high-elevation summer range is intact and considered some of the most productive elk habitat in Nevada. Apart from hunter harvest, adult survival is high for Inside Desert elk, and calf recruitment is usually higher than thresholds required for stable population growth (K. Huebner, Nevada Department of Wildlife, written commun., 2023).
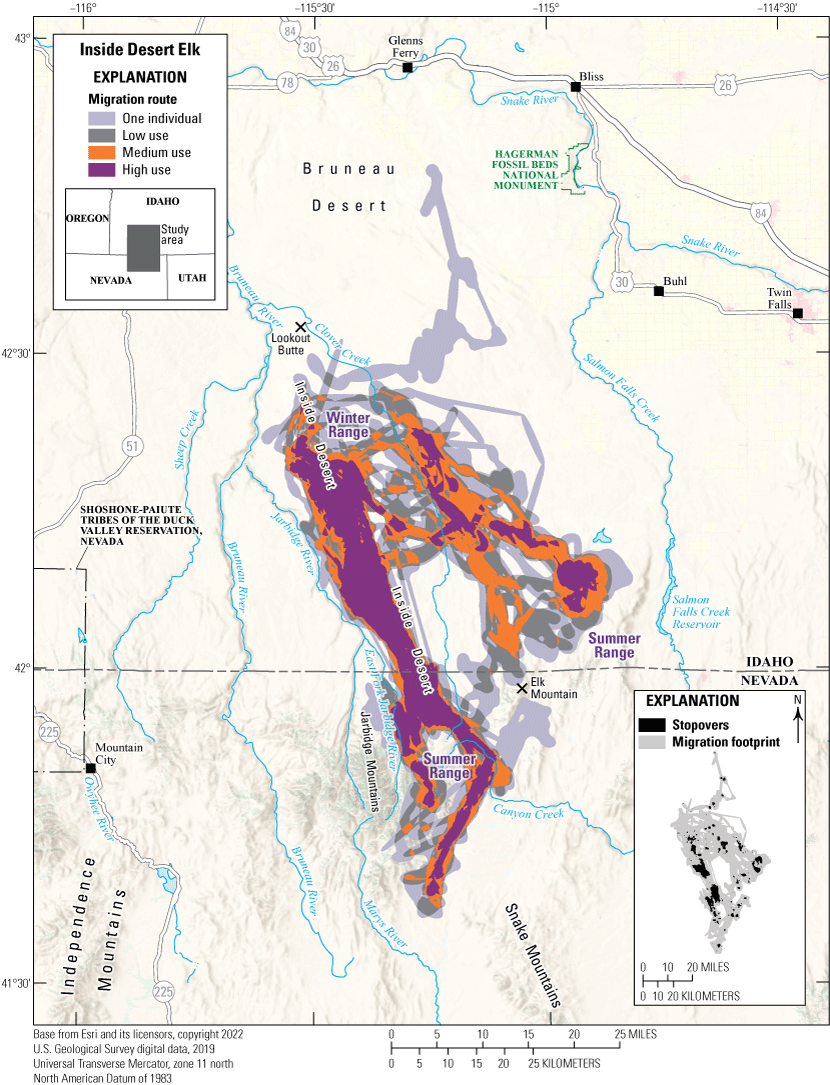
Map showing migration routes and stopovers of the Inside Desert elk herd.
Animal Capture and Data Collection
Sample size: 23 adult female elk
Relocation frequency: Approximately 8−12.5 hours
Project duration: 2017−23
Data Analysis
Migration route and stopover analysis: Brownian bridge movement models (Sawyer and others, 2009) for 3 migration sequences, Fixed Motion Variance (10,764 ft2 [1,000 m2]; McKee and others, 2024) with a 14-hour time lag (app. 1) for 23 migration sequences, Fixed Motion Variance (10,764 ft2 [1,000 m2]) with a 27-hour time lag for 25 migration sequences
Delineation of migration periods: Net Squared Displacement (Bunnefeld and others, 2011; app. 1)
Models derived from:
Migration use classifications:Migration Route and Stopover Summary
Migration start and end dates (median):
Number of days migrating (mean): Migration route length: Migration route area:Other Information
Migration routes are updated and viewable by the respective State agency resources (Idaho Fish and Game, 2024; Nevada Department of Wildlife, 2024). Mapping layers shown for this herd are sensitive but may be made available to researchers upon request by contacting the Idaho Fish and Game (idfgdatarequests@idfg.idaho.gov) for the Idaho part of the migration route and Nevada Department of Wildlife (ndowdata@ndow.org) for the Nevada part of the migration route.
Project contacts:
-
• CJ Ellingwood (cellingwood@ndow.org), Wildlife Biologist, Nevada Department of Wildlife
-
• Jacob Gray (jacob.gray@idfg.idaho.gov), Natural Resources Program Coordinator Habitat and Migration, Idaho Fish and Game
-
• Cody McKee (cmckee@ndow.org), Wildlife Staff Specialist, Nevada Department of Wildlife
-
• Matt Mumma (matt.mumma@idfg.idaho.gov), Wildlife Research Manager, Idaho Fish and Game
-
• Scott Bergen, Senior Wildlife Research Biologist, Idaho Fish and Game
-
• Robert Ritson, Associate Research Scientist, Wyoming Cooperative Fish and Wildlife Research Unit, University of Wyoming
-
• Meints, D., Ward, R., Knetter, J., Miyasaki, H., Oelrich, K., Mosby, C., Ellstrom, M., Roche, E., Elmer, M., Crea, S., Smith, D., Hribik, D., Hickey, C., Berkley, R., McDonald, M., Lockyer, Z., Hendricks, C., Painter, G., and Newman, D., 2020, F19AF00858 statewide surveys and inventory final performance report: Boise, Idaho, Idaho Fish and Game, 20 p. [Also available at https://collaboration.idfg.idaho.gov/WildlifeTechnicalReports/F19AF00858%20Statewide%20Surveys%20%20Inventory%20Final%20Report%20FY20.pdf.]
Idaho, Nevada, and Shoshone-Paiute Tribes of the Duck Valley Reservation, Nevada | Elk
Y P Desert Elk
The Y P Desert elk herd comprises part of an Idaho–Nevada metapopulation that primarily uses a winter range in Idaho and a summer range in Nevada. Y P Desert elk follow an east-to-west migration along the South Fork Owyhee River onto the Y P Desert in Idaho and Nevada during the winter (fig. 38). In Nevada, migration routes for many ungulate herds follow mountain ranges from the north to the south. However, the neighboring Southern Owyhee Desert elk herd in Nevada (refer to the “Southern Owyhee Desert Elk” section in this report), which shares some summer range with Y P Desert elk, also follows a similar east-to-west migration. During the summer, the Y P Desert herd primarily inhabits the Bull Run Mountains of the northern Independence Mountains in Nevada. A large part of seasonal habitat and migration routes is within the Shoshone-Paiute Tribes of the Duck Valley Reservation, Nevada. Elevations range from 4,307 ft (1,313 m) in South Fork Owyhee River canyon basins of Idaho, to the 9,108-ft (2,776-m) Pennsylvania Hill of the Bull Run Mountains in Nevada. Historically, summer habitats included Great Basin communities, where mixed shrublands consisting of sagebrush and Chrysothamnus spp. (rabbitbrush) dominate lower elevations and overlap at higher elevations with mountain brush species, such as antelope bitterbrush, western serviceberry, and snowbush. However, much of the upper elevation summer habitat burned in the South Sugarloaf fire in 2018. Slope aspect may be the primary driver of post-fire recovery because many north-facing slopes are naturally returning to mountain brush communities, and south-facing slopes have primarily converted to a mix of native bunchgrasses and invasive annuals. These higher elevation communities also include quaking aspen, mountain-mahogany, fir, and pine, although large areas of the nonriparian forest species have not yet recovered post-fire. Like many ungulate winter ranges in western Elko County, wildfires also affect the Y P Desert, where cheatgrass, mustard, various Cirsium spp. (thistle) species, and medusahead rye have invaded priority habitat. However, large expanses of sagebrush and native bunch grasses, such as basin wildrye and Idaho fescue, remain on the landscape. Growth for this herd is limited by hunter harvest, which is currently (2024) guided by population objectives outlined in the “Western Elko County Elk Management Sub-Plan” (Western Elko County Elk Management Working Group, 2003).
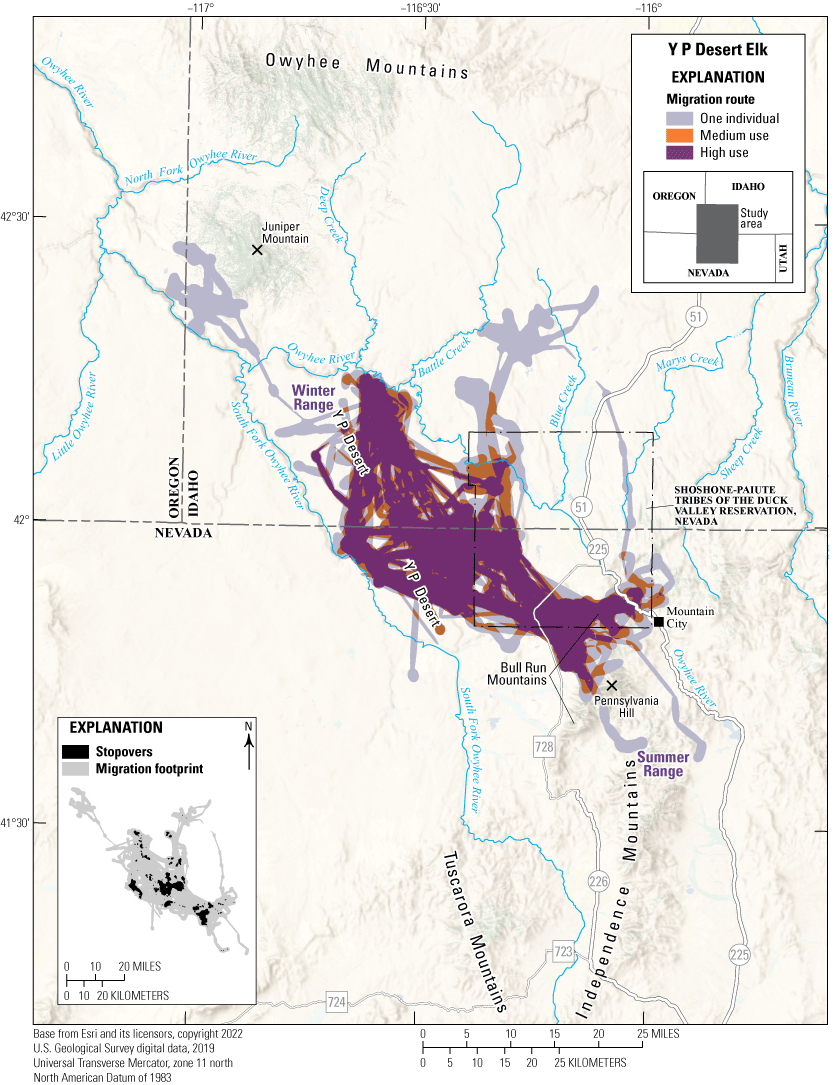
Map showing migration routes and stopovers of the Y P Desert elk herd.
Animal Capture and Data Collection
Sample size: 15 adult female elk
Relocation frequency: Approximately 12.5 hours
Project duration: 2014−20
Data Analysis
Migration route and stopover analysis: Fixed Motion Variance (10,764 ft2 [1,000 m2]; McKee and others, 2024) with a 14-hour time lag (app. 1) for 44 migration sequences and Fixed Motion Variance (10,764 ft2 [1,000 m2]) with a 27-hour time lag for 15 migration sequences
Delineation of migration periods: Net Squared Displacement (Bunnefeld and others, 2011; app. 1)
Models derived from:
Migration use classifications:Migration Route and Stopover Summary
Migration start and end dates (median):
Number of days migrating (mean): Migration route length: Migration route area:Other Information
Project contacts:
-
• Matt Mumma (matt.mumma@idfg.idaho.gov), Wildlife Research Manager, Idaho Fish and Game
-
• Jacob Gray (jacob.gray@idfg.idaho.gov), Natural Resources Program Coordinator Habitat and Migration, Idaho Fish and Game
-
• Cody McKee (cmckee@ndow.org), Wildlife Staff Specialist, Nevada Department of Wildlife
-
• Travis Allen (tallen@ndow.org), Wildlife Biologist, Nevada Department of Wildlife
-
• Matt Jeffress (mjeffress@ndow.org), Wildlife Biologist, Nevada Department of Wildlife
New Mexico | Elk
North San Cristobal Elk
The North San Cristobal elk herd resides in north-central New Mexico, to the south of the Colorado–New Mexico border and to the north of Questa, New Mexico (fig. 39). The herd winters in the sagebrush flats along the west edge of the Sangre de Cristo Mountains. Typically, individuals remain to the east of State Route 522 within and near the Urraca Wildlife Management Area, although occasional crossings to the west, into Sunshine Valley, do occur. The Urraca Wildlife Management Area was established in 1966 to provide 13,304 acres (5,384 ha) of winter range for elk and deer (New Mexico Game & Fish, undated). The Urraca Wildlife Management Area has limited road access and is closed to the public during the winter and elk calving season to reduce wildlife disturbance. The North San Cristobal elk use many corridors and migrate to the east through the foothills of the Sangre de Cristo Mountains approximately 6 mi (9.7 km) through conifer and aspen woodlands toward Costilla Creek. The herd generally spends the summer on the mountain slopes and agricultural fields surrounding Amalia, New Mexico, or migrates to higher elevations (more than 9,000 ft [more than 2,743 m]) farther to the south, near the headwaters of Cordova Creek. Some individuals will travel farther to the east to Engelmann spruce-subalpine fir forests and alpine grasslands at higher elevations by Big Costilla Peak (12,931 ft [3,941 m]). The herd is considered stable and has no known conservation threats. They experience little hunting pressure between their seasonal ranges, and most of their seasonal and transitional ranges are on protected, public, and conservation-oriented privately owned properties with minimal development and plentiful resources.
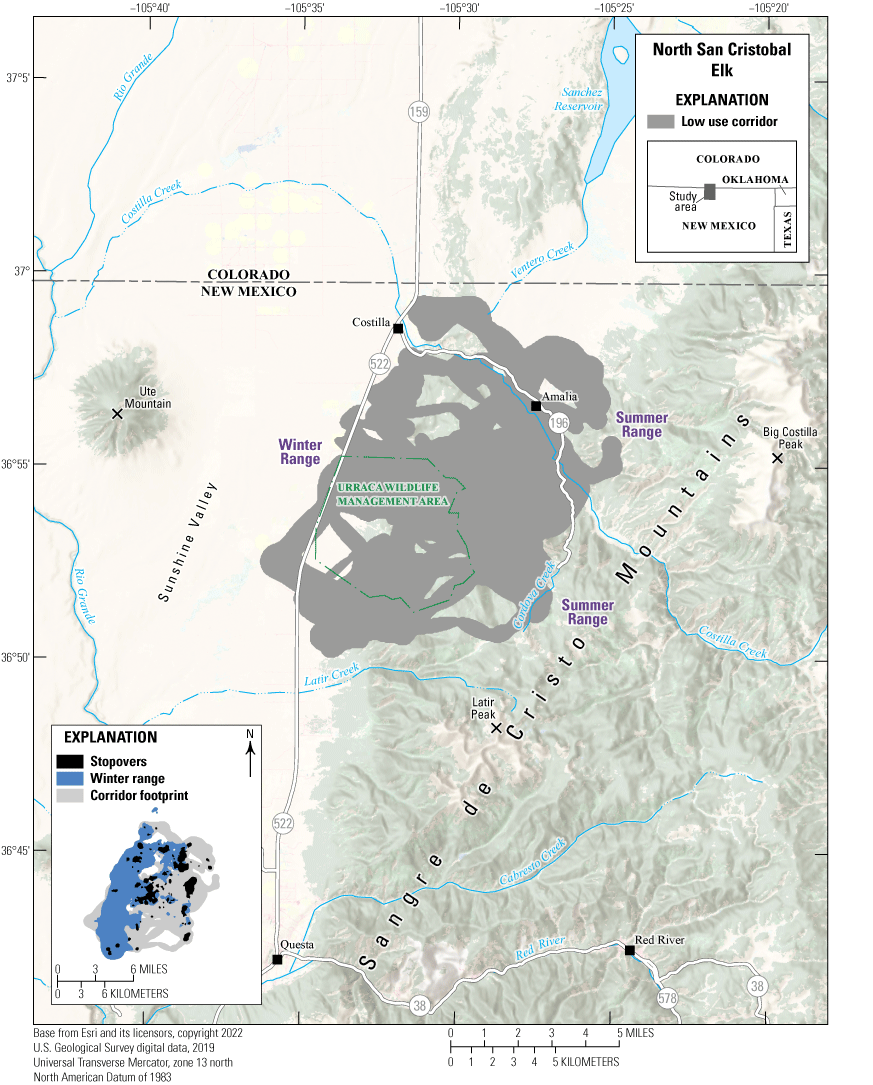
Map showing migration corridors, stopovers, and winter ranges of the North San Cristobal elk herd.
Animal Capture and Data Collection
Sample size: 10 adult female elk
Relocation frequency: Approximately 2 hours
Project duration: 2021–present (data through December 2023 analyzed for this report)
Data Analysis
Corridor, stopover, and winter range analysis: Brownian bridge movement models (Sawyer and others, 2009)
Delineation of migration periods: Net Squared Displacement (Bunnefeld and others, 2011; app. 1)
Models derived from:
Migration use classifications:Corridor and Stopover Summary
Migration start and end dates (median):
Number of days migrating (mean): Migration corridor length: Migration corridor area:Nevada | Elk
Southern Owyhee Desert Elk
The Southern Owyhee Desert elk herd follows an east-to-west migration pattern (fig. 40), which is unique for Nevada, where migration routes for many ungulate herds follow mountain ranges from the north to the south. During the summer, the herd inhabits the northern parts of the Tuscarora and Independence Mountains, which rise from the southeastern part of Owyhee Desert and demarcate the boundary between the Columbia Plateau and the Great Basin desert in northern Nevada. This summer range partially overlaps with the neighboring Y P Desert elk herd, which also has an east-to-west migratory strategy (refer to the “Y P Desert Elk” section in this report). Elevations range from 5,500 ft (1,676 m), where slopes originate at the desert floor, to 8,602 ft (2,622 m) at McCann Creek Mountain in the northern Tuscarora Mountains, and to 10,208 ft (3,111 m) at Jacks Peak in the Independence Mountains. Summer habitats include vegetative communities typical of the Great Basin desert where, historically, mixed shrubland, composed of sagebrush and rabbitbrush, dominates lower elevations and rises into higher elevations, overlapping with mountain brush species such as antelope bitterbrush, western serviceberry, snowbush, communities of quaking aspen, curl-leaf mountain-mahogany, and fir. Although much of the high-elevation vegetative communities remain intact, a long history of wildfires has converted nearly the entire low and midelevation winter ranges in the southern Owyhee Desert from shrublands to herbaceous vegetation communities. Ongoing restoration efforts actively seek to reverse the spread of invasive cheatgrass, stabilize soils, and provide forage to wildlife by seeding sagebrush and native bunch grasses, such as basin wildrye, Idaho fescue, and nonnative, but beneficial, varieties of wheatgrass and Bassia prostrata (forage kochia). Small pockets of intact native shrublands and grasslands still exist on the winter range. The most commonly used winter range is in the southern boundary of the Owyhee Desert, but some individuals migrate longer distances to winter in the Little Humboldt River Wilderness Study Area, which is more varied topographically but has a similar winter range vegetation community.
Overall, conversion of habitat from woody to herbaceous plants has benefitted elk in this herd and elsewhere in Nevada (for example, refer to the “Y P Desert Elk” section in this report). Growth for this herd is limited by an annual pulse in spring mortality, which is approximately 20–40 percent of elk each year (C. McKee, Nevada Department of Wildlife, written commun., 2023). Antlerless elk hunts were stopped in 2022, resulting in stable to slightly increasing population growth (T. Allen, Nevada Department of Wildlife, written commun., 2023).
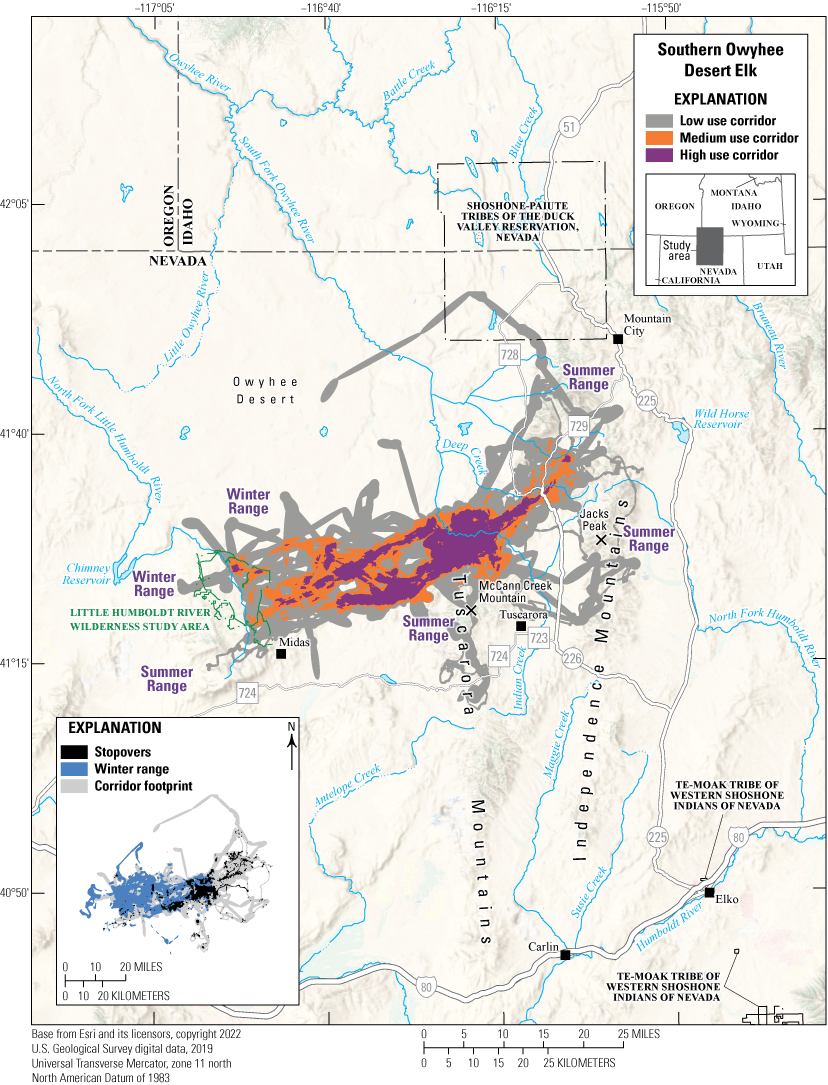
Map showing migration corridors, stopovers, and winter ranges of the Southern Owyhee Desert elk herd.
Animal Capture and Data Collection
Sample size: 45 adult elk (15 males, 30 females)
Relocation frequency: Approximately 1−13 hours
Project duration: 2015–22
Data Analysis
Corridor, stopover, and winter range analysis: Fixed Motion Variance (McKee and others, 2024; app. 1)
Delineation of migration periods: Net Squared Displacement (Bunnefeld and others, 2011; app. 1)
Models derived from:
Migration use classifications:Corridor and Stopover Summary
Migration start and end dates (median):
Number of days migrating (mean): Migration corridor length: Migration corridor area:Other Information
Project contacts:
Data analyst:Idaho | Moose
Sand Creek Moose
The Sand Creek moose herd is the only moose herd in the world that winters in a desert (Idaho Fish and Game, 2020). The area surrounding Sand Creek (this area is regionally known as Sand Creek Desert; fig. 41) is a high-elevation desert (approximately 5,000 ft [1,524 m]) that has large amounts of Prunus virginiana (chokecherry), antelope bitterbrush, California lilac, and other mountain shrubs. During the winter, the Sand Creek moose use lower elevation areas of this sagebrush-steppe desert habitat composed of aspen and mountain brush communities, Douglas fir communities, and sagebrush-chokecherry communities. Moose easily use this area, and some even migrate from Montana, Yellowstone National Park, and the Teton Basin to winter in the Sand Creek Desert; more than 600 moose have been observed in the Sand Creek Desert during winter aerial flights (Idaho Fish and Game, 2020). The main migration routes extend to the northeast from their winter range along the Big Bend Ridge, but some migrate to the south or farther to the north to the Beaverhead National Forest in Montana. The herd’s summer range is likely tied to timbered, higher elevations and other mesic zones, including Yellowstone National Park, the Centennial Mountains, Gravelly Range, and the Teton Basin. Some of these moose migrate shorter distances to Henrys Fork, which provides year-round habitat for moose. Challenges to this herd include WVC, encroachment of aspen habitats by Douglas fir, renewable energy development, mineral resource extraction, and recreational development.
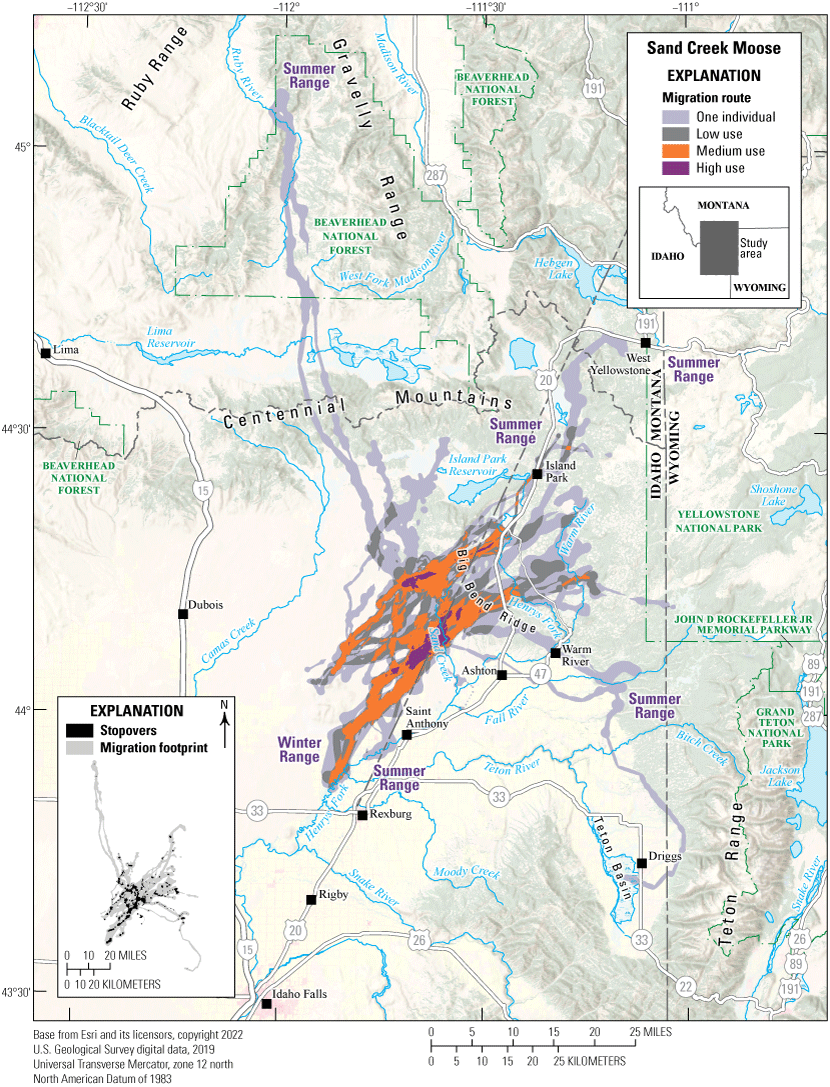
Map showing migration routes and stopovers of the Sand Creek moose herd.
Animal Capture and Data Collection
Sample size: 26 moose (1 male, 25 females)
Relocation frequency: Approximately 1–13 hours
Project duration: 2011–22
Data Analysis
Migration route and stopover analysis: Brownian bridge movement models (Sawyer and others, 2009) with an 8-hour time lag for 30 migration sequences and Fixed Motion Variance (15,069 ft2 [1,400 m2]; McKee and others, 2024) with a 14-hour time lag (app. 1) for 34 migration sequences
Delineation of migration periods: Net Squared Displacement (Bunnefeld and others, 2011; app. 1)
Models derived from:
Migration use classifications:Migration Route and Stopover Summary
Migration start and end dates (median):
Number of days migrating (mean): Migration route length: Migration route area:Other Information
Idaho migration routes are updated and viewable by the Idaho Fish and Game (Idaho Fish and Game, 2024). Mapping layers shown for this herd are sensitive but may be made available to researchers upon request by contacting Idaho Fish and Game (idfgdatarequests@idfg.idaho.gov).
Project contacts:
-
• Matt Mumma (matt.mumma@idfg.idaho.gov), Wildlife Research Manager, Idaho Fish and Game
-
• Curtis Hendricks (curtis.hendricks@idfg.idaho.gov), Regional Wildlife Manager, Idaho Fish and Game
-
• Jacob Gray (jacob.gray@idfg.idaho.gov), Natural Resources Program Coordinator Habitat and Migration, Idaho Fish and Game
-
• Scott Bergen, Senior Wildlife Research Biologist, Idaho Fish and Game
-
• Robert Ritson, Associate Research Scientist, Wyoming Cooperative Fish and Wildlife Research Unit, University of Wyoming
-
• Meints, D., Ward, R., Knetter, J., Miyasaki, H., Oelrich, K., Mosby, C., Ellstrom, M., Roche, E., Elmer, M., Crea, S., Smith, D., Hribik, D., Hickey, C., Berkley, R., McDonald, M., Lockyer, Z., Hendricks, C., Painter, G., and Newman, D., 2020, F19AF00858 statewide surveys and inventory final performance report: Boise, Idaho, Idaho Fish and Game, 20 p. [Also available at https://collaboration.idfg.idaho.gov/WildlifeTechnicalReports/F19AF00858%20Statewide%20Surveys%20%20Inventory%20Final%20Report%20FY20.pdf.]
-
• Roberts, S., and Mumma, M., 2023, F22AF03552 statewide wildlife research final performance report: Boise, Idaho, Idaho Fish and Game, 48 p.
References Cited
Aikens, E.O., Mysterud, A., Merkle, J.A., Cagnacci, F., Rivrud, I.M., Hebblewhite, M., Hurley, M.A., Peters, W., Bergen, S., De Groeve, J., Dwinnell, S.P.H., Gehr, B., Heurich, M., Hewison, A.J.M., Jarnemo, A., Kjellander, P., Kröschel, M., Licoppe, A., Linnell, J.D.C., Merrill, E.H., Middleton, A.D., Morellet, N., Neufeld, L., Ortega, A.C., Parker, K.L., Pedrotti, L., Proffitt, K.M., Saïd, S., Sawyer, H., Scurlock, B.M., Signer, J., Stent, P., Šustr, P., Szkorupa, T., Monteith, K.L., and Kauffman, M.J., 2020, Wave-like patterns of plant phenology determine ungulate movement tactics: Current Biology, v. 30, no. 17, p. 3444–3449.e4. [Also available at https://doi.org/10.1016/j.cub.2020.06.032.]
Aikens, E.O., Wyckoff, T.B., Sawyer, H., and Kauffman, M.J., 2022, Industrial energy development decouples ungulate migration from the green wave: Nature Ecology & Evolution, v. 6, no. 11, p. 1733–1741. [Also available at https://doi.org/10.1038/s41559-022-01887-9.]
ArcGIS REST Services Directory, [undated a], 2021_AADT (FeatureServer) [shapefile]: ArcGIS REST Services Directory database, accessed January 2024 at https://services6.arcgis.com/clPWQMwZfdWn4MQZ/arcgis/rest/services/2021_AADT/FeatureServer. [Current version listed on the Home page is 11.2.]
ArcGIS REST Services Directory, [undated b], data_layers/wildlife_collisions (MapServer) [shapefile]: ArcGIS REST Services Directory database, accessed February 2024 at https://gis.odot.state.or.us/arcgis1006/rest/services/data_layers/wildlife_collisions/MapServer. [Current version listed on the Home page is 10.61.]
Bliss-Ketchum, L., and Parker, C., 2015, Lava Butte wildlife crossing monitoring project: Salem, Oreg., Oregon Department of Transportation, 23 p. [Also available at https://digital.osl.state.or.us/islandora/object/osl%3A8192.]
Bunnefeld, N., Börger, L., van Moorter, B., Rolandsen, C.M., Dettki, H., Solberg, E.J., and Ericsson, G., 2011, A model‐driven approach to quantify migration patterns—Individual, regional and yearly differences: Journal of Animal Ecology, v. 80, no. 2, p. 466–476. [Also available at https://doi.org/10.1111/j.1365-2656.2010.01776.x.]
Bureau of Land Management [BLM], 2023a, BLM OR fire poly hub: Bureau of Land Management, accessed January 23, 2024, at https://gbp-blm-egis.hub.arcgis.com/datasets/2c7e99204e7a4b22bf9180fd96137381_1/explore?location=45.214756%2C-120.427819%2C7.04.
Bureau of Land Management [BLM], 2023b, Herd area and herd management area statistics: Bureau of Land Management, 24 p., accessed January 23, 2024, at https://www.blm.gov/sites/default/files/docs/2023-04/2023_HMA-HA_PopStats_4-3-2023_Final.pdf.
Colorado Parks and Wildlife [CPW], 2023, Final Northwest Colorado mule deer herd management plans: Grand Junction, Colo., Colorado Parks and Wildlife, 320 p. [Also available at https://cpw.state.co.us/Documents/Hunting/BigGame/DAU/Deer/DeerHMP_NW.pdf.]
Colorado Virtual Library, 2022, Wildlife crossings on CO State Highway 9: Colorado Virtual Library Colorado State Publications Blog, February 7, 2022, accessed August 27, 2024, at https://www.coloradovirtuallibrary.org/resource-sharing/state-pubs-blog/wildlife-crossings-2/.
Davies, K.W., and Boyd, C.S., 2019, Ecological effects of free-roaming horses in North American rangelands: BioScience, v. 69, no. 7, p. 558–565. [Also available at https://doi.org/10.1093/biosci/biz060.]
DeVivo, M.T., Edmunds, D.R., Kauffman, M.J., Schumaker, B.A., Binfet, J., Kreeger, T.J., Richards, B.J., Schätzl, H.M., and Cornish, T.E., 2017, Endemic chronic wasting disease causes mule deer population decline in Wyoming: PLoS One, v. 12, no. 10, art. e0186512, 17 p. [Also available at https://doi.org/10.1371/journal.pone.0186512.]
Dodd, N.L., Gagnon, J.W., Sprague, S., Boe, S., and Schweinsburg, R.E., 2012a, Wildlife accident reduction study and monitoring—Arizona State Route 64: Phoenix, Ariz., Arizona Department of Transportation and U.S. Department of Transportation Federal Highway Administration, prepared by Arizona Game and Fish Department, Phoenix, Ariz., 118 p. [Also available at https://apps.azdot.gov/files/ADOTLibrary/publications/project_reports/pdf/az626.pdf.]
Dodd, N.L., Gagnon, J.W., Boe, S., Ogren, K., and Schweinsburg, R.E., 2012b, Wildlife-vehicle collision mitigation for safer wildlife movement across highways—State Route 260: Phoenix, Ariz., Arizona Department of Transportation and U.S. Department of Transportation Federal Highway Administration, prepared by Arizona Game and Fish Department, 134 p. [Also available at https://rosap.ntl.bts.gov/view/dot/25398/dot_25398_DS1.pdf.]
Eacker, D.R., Jakes, A.F., and Jones, P.F., 2023, Spatiotemporal risk factors predict landscape-scale survivorship for a northern ungulate: Ecosphere, v. 14, no. 2, 15 p. [Also available at https://doi.org/10.1002/ecs2.4341.]
Farm Service Agency, 2023, Conservation Reserve Program—Monthly summary—December 2023: Washington, D.C., U.S. Department of Agriculture Farm Service Agency, 29 p. [Also available at https://www.fsa.usda.gov/resources/programs/conservation-reserve-program/statistics.]
Gagnon, J.W., Theimer, T.C., Boe, S., Dodd, N.L., and Schweinsburg, R.E., 2007a, Traffic volume alters elk distribution and highway crossings in Arizona: The Journal of Wildlife Management, v. 71, no. 7, p. 2318–2323. [Also available at https://doi.org/10.2193/2006-224.]
Gagnon, J.W., Theimer, T.C., Dodd, N.L., Manzo, A.L., and Schweinsburg, R.E., 2007b, Effects of traffic on elk use of wildlife underpasses in Arizona: The Journal of Wildlife Management, v. 71, no. 7, p. 2324–2328. [Also available at https://doi.org/10.2193/2006-445.]
Gagnon, J.W., Dodd, N.L., Ogren, K.S., and Schweinsburg, R.E., 2011, Factors associated with use of wildlife underpasses and importance of long-term monitoring: The Journal of Wildlife Management, v. 75, no. 6, p. 1477–1487. [Also available at https://doi.org/10.1002/jwmg.160.]
Gigliotti, L.C., Xu, W., Zuckerman, G.R., Atwood, M.P., Cole, E.K., Courtemanch, A., Dewey, S., Gude, J.A., Hnilicka, P., Hurley, M., Kauffman, M., Kroetz, K., Lawson, A., Leonard, B., MacNulty, D., Maichak, E., McWhirter, D., Mong, T.W., Proffitt, K., Scurlock, B., Stahler, D., and Middleton, A.D., 2022, Wildlife migrations highlight importance of both private lands and protected areas in the Greater Yellowstone Ecosystem: Biological Conservation, v. 275, 9 p. [Also available at https://doi.org/10.1016/j.biocon.2022.109752.]
Gude, P.H., Hansen, A.J., Rasker, R., and Maxwell, B., 2006, Rates and drivers of rural residential development in the Greater Yellowstone: Landscape and Urban Planning, v. 77, no. 1–2, p. 131–151. [Also available at https://doi.org/10.1016/j.landurbplan.2005.02.004.]
Hennig, J.D., 2021, Feral horse movement, habitat selection, and effects on pronghorn and greater sage-grouse habitat in cold-arid-steppe: Laramie, Wyo., University of Wyoming, Ph.D. dissertation, p. 1–154. [Also available at https://www.proquest.com/docview/2544866088?pq-origsite=gscholar&fromopenview=true&sourcetype=Dissertations%20&%20Theses.]
Hennig, J.D., Beck, J.L., Gray, C.J., and Scasta, J.D., 2021, Temporal overlap among feral horses, cattle, and native ungulates at water sources: The Journal of Wildlife Management, v. 85, no. 6, p. 1084–1090. [Also available at https://doi.org/10.1002/jwmg.21959.]
Hennig, J.D., Scasta, J.D., Pratt, A.C., Wanner, C.P., and Beck, J.L., 2022, Habitat selection and space use overlap between feral horses, pronghorn, and greater sage-grouse in cold arid steppe: The Journal of Wildlife Management, v. 87, no. 1, art. e22329, 17 p. [Also available at https://doi.org/10.1002/jwmg.22329.]
Hennig, J.D., Beck, J.L., and Scasta, J.D., 2024, Feral horses and pronghorn—A test of the forage maturation hypothesis in an arid shrubland: Animal Behaviour, v. 210, p. 55–61. [Also available at https://doi.org/10.1016/j.anbehav.2024.01.015.]
Hinz, D., 1981, The Pacific deer herd management plan: Sacramento, Calif., California Department of Fish and Game, 71 p. [Also available at https://relicensing.pcwa.net/documents/Library/PCWA-L-357.pdf.]
Horne, J.S., Garton, E.O., Krone, S.M., and Lewis, J.S., 2007, Analyzing animal movements using Brownian bridges: Ecology, v. 88, no. 9, p. 2354–2363. [Also available at https://doi.org/10.1890/06-0957.1.]
Idaho Fish and Game, 2020, Idaho moose management plan—2020–2025: Boise, Idaho, Idaho Fish and Game, 110 p. [Also available at https://idfg.idaho.gov/sites/default/files/plan-moose.pdf.]
Idaho Fish and Game, 2024, Idaho Department of Fish and Game [documents]: Idaho Fish and Game web page, accessed April 18, 2024, at https://data-idfggis.opendata.arcgis.com/search?collection=document.
Jesmer, B.R., Merkle, J.A., Goheen, J.R., Aikens, E.O., Beck, J.L., Courtemanch, A.B., Hurley, M.A., McWhirter, D.E., Miyasaki, H.M., Monteith, K.L., and Kauffman, M.J., 2018, Is ungulate migration culturally transmitted? Evidence of social learning from translocated animals: Science, v. 361, no. 6406, p. 1023–1025. [Also available at https://doi.org/10.1126/science.aat0985.]
Kauffman, M.J., Copeland, H.E, Berg, J., Bergen, S., Cole, E., Cuzzocreo, M., Dewey, S., Fattebert, J., Gagnon, J., Gelzer, E., Geremia, C., Graves, T., Hersey, K., Hurley, M., Kaiser, R., Meacham, J., Merkle, J., Middleton, A., Nuñez, T., Oates, B., Olson, D., Olson, L., Sawyer, H., Schroeder, C., Sprague, S., Steingisser, A., and Thonhoff, M., 2020a, Ungulate migrations of the Western United States, volume 1 (ver. 1.1, December 2023): U.S. Geological Survey Scientific Investigations Report 2020–5101, 119 p. [Also available at https://doi.org/10.3133/sir20205101.]
Kauffman, M.J., Copeland, H.E., Cole, E., Cuzzocreo, M., Dewey, S., Fattebert, J., Gagnon, J., Gelzer, E., Graves, T.A., Hersey, K., Kaiser, R., Meacham, J., Merkle, J., Middleton, A., Nuñez, T., Oates, B., Olson, D., Olson, L., Sawyer, H., Schroeder, C., Sprague, S., Steingisser, A., and Thonhoff, M., 2020b, Ungulate migrations of the Western United States, volume 1: U.S. Geological Survey data release, https://doi.org/10.5066/P9O2YM6I.
Kauffman, M.J., Aikens, E.O., Esmaeili, S., Kaczensky, P., Middleton, A., Monteith, K.L., Morrison, T.A., Mueller, T., Sawyer, H., and Goheen, J.R., 2021, Causes, consequences, and conservation of ungulate migration: Annual Review of Ecology, Evolution, and Systematics, v. 52, no. 1, p. 453–478.[Also available at https://doi.org/10.1146/annurev-ecolsys-012021-011516.]
Kauffman, M.J., Lowrey, B., Beck, J., Berg, J., Bergen, S., Berger, J., Cain, J., III, Dewey, S., Diamond, J., Duvuvuei, O., Fattebert, J., Gagnon, J., Garcia, J., Greenspan, E., Hall, E., Harper, G., Harter, S., Hersey, K., Hnilicka, P., Hurley, M., Knox, L., Lawson, A., Maichak, E., Meacham, J., Merkle, J., Middleton, A., Olson, D., Olson, L., Reddell, C., Robb, B., Rozman, G., Sawyer, H., Schroeder, C., Scurlock, B., Short, J., Sprague, S., Steingisser, A., and Tatman, N., 2022a, Ungulate migrations of the Western United States, volume 2: U.S. Geological Survey Scientific Investigations Report 2022–5008, 160 p. [Also available at https://doi.org/10.3133/sir20225008.]
Kauffman, M.J., Lowrey, B., Beck, J., Berg, J., Bergen, S., Berger, J., Cain, J., Dewey, S., Diamond, J., Duvuvuei, O., Fattebert, J., Gagnon, J., Garcia, J., Greenspan, E., Hall, E., Harper, G., Harter, S., Hersey, K., Hnilicka, P., Hurley, M., Knox, L., Lawson, A., Maichak, E., Meacham, J., Merkle, J., Middleton, A., Olson, D., Olson, L., Reddell, C., Robb, B., Rozman, G., Sawyer, H., Schroeder, C., Scurlock, B., Short, J., Sprague, S., Steingisser, A., and Tatman, N., 2022b, Ungulate migrations of the Western United States, volume 2: U.S. Geological Survey data release, https://doi.org/10.5066/P9TKA3L8.
Kauffman, M.J., Lowrey, B., Berg, J., Bergen, S., Brimeyer, D., Burke, P., Cufaude, T., Cain, J.W., III, Cole, J., Courtemanch, A., Cowardin, M., Cunningham, J., DeVivo, M., Diamond, J., Duvuvuei, O., Fattebert, J., Ennis, J., Finley, D., Fort, J., Fralick, G., Freeman, E., Gagnon, J., Garcia, J., Gelzer, E., Graham, M., Gray, J., Greenspan, E., Hall, L.E., Hendricks, C., Holland, A., Holms, B., Huggler, K., Hurley, M.A., Jeffreys, E., Johnson, A., Knox, L., Krasnow, K., Lockyer, Z., Manninen, H., McDonald, M., McKee, J.L., Meacham, J., Merkle, J., Moore, B., Mong, T.W., Nielsen, C., Oates, B., Olson, K., Olson, D., Olson, L., Pieron, M., Powell, J., Prince, A., Proffitt, K., Reddell, C., Riginos, C., Ritson, R., Robatcek, S., Roberts, S., Sawyer, H., Schroeder, C., Shapiro, J., Simpson, N., Sprague, S., Steingisser, A., Tatman, N., Turnock, B., Wallace, C., and Wolf, L., 2022c, Ungulate migrations of the Western United States, volume 3: U. S. Geological Survey Scientific Investigations Report 2022–5088, 114 p. [Also available at https://doi.org/10.3133/sir20225088.]
Kauffman, M.J., Lowrey, B., Berg, J., Bergen, S., Brimeyer, D., Burke, P., Cufaude, T., Cain, J.W., III, Cole, J., Courtemanch, A., Cowardin, M., Cunningham, J., DeVivo, M., Diamond, J., Duvuvuei, O., Fattebert, J., Ennis, J., Finley, D., Fort, J., Fralick, G., Freeman, E., Gagnon, J., Garcia, J., Gelzer, E., Graham, M., Gray, J., Greenspan, E., Hall, E., Hendricks, C., Holland, A., Holms, B., Huggler, K., Hurley, M., Jeffreys, E., Johnson, A., Knox, L., Krasnow, K., Lockyer, Z., Manninen, H., McDonald, M., McKee, J.L., Meacham, J., Merkle, J., Moore, B., Mong, T.W., Nielsen, C., Oates, B., Olson, K., Olson, D., Olson, L., Pieron, M., Powell, J., Prince, A., Profitt, K., Reddell, C., Riginos, C., Ritson, R., Robatcek, S., Roberts, S., Sawyer, H., Schroeder, C., Shapiro, J., Simpson, N., Sprague, S., Steingisser, A., Tatman, N., Turnock, B., Wallace, C., and Wolf, L., 2022d, Ungulate migrations of the Western United States, volume 3: U.S. Geological Survey data release, https://doi.org/10.5066/P9LSKEZQ.
Kauffman, M.J., Lowrey, B., Beaupre, C., Bergen, S., Bergh, S., Blecha, K., Bundick, S., Burkett, H., Cain, J.W., III, Carl, P., Casady, D., Class, C., Courtemanch, A., Cowardin, M., Diamond, J., Dugger, K., Duvuvuei, O., Ennis, J.R., Flenner, M., Fort, J., Fralick, G., Freeman, I., Gagnon, J., Garcelon, D., Garrison, K., Gelzer, E., Greenspan, E., Hinojoza-Rood, V., Hnilicka, P., Holland, A., Hudgens, B., Kroger, B., Lawson, A., McKee, C., McKee, J.L., Merkle, J., Mong, T.W., Nelson, H., Oates, B., Poulin, M.-P., Reddell, C., Ritson, R., Sawyer, H., Schroeder, C., Shapiro, J., Sprague, S., Steiner, E., Steingisser, A., Stephens, S., Stringham, B., Swazo-Hinds, P.R., Tatman, N., Wallace, C.F., Whittaker, D., Wise, B., Wittmer, H.U., and Wood, E., 2024a, Ungulate migrations of the Western United States, volume 4: U.S. Geological Survey Scientific Investigations Report 2024–5006, 86 p., 1 pl. [Also available at https://doi.org/10.3133/sir20245006.]
Kauffman, M.J., Lowrey, B., Beaupre, C., Bergen, S., Bergh, S., Blecha, K., Cain, J.W., Carl, P., Casady, D., Class, C., Courtemanch, A., Cowardin, M., Diamond, J., Dugger, K., Duvuvuei, O., Fattebert, J., Ennis, J.R., Flenner, M., Fort, J., Fralick, G., Freeman, I., Gagnon, J., Garcelon, D., Garrison, K., Gelzer, E., Greenspan, E., Hinojoza-Rood, V., Hnilicka, P., Holland, A., Hudgens, B., Kroger, B., Lawson, A., McKee, C., McKee, J.L., Merkle, J., Mong, T.W., Nelson, H., Oates, B., Poulin, M.-P., Reddell, C., Riginos, C., Ritson, R., Sawyer, H., Schroeder, C., Shapiro, J., Sprague, S., Steingisser, A., Stephens, S., Stringham, B., Swazo-Hinds, P.R., Tatman, N., Turnock, B., Wallace, C.F., Whittaker, D., Wise, B., Wittmer, H.U., and Wood, E., 2024b, Ungulate migrations of the Western United States, volume 4: U.S. Geological Survey data release, https://doi.org/10.5066/P9SS9GD9.
Kauffman, M.J., Lowrey, B., McKee, J.L., Allen, T., Beck, J.L., Bergen, S., Binfet, J., Blair, S., Cain, J.W., Carl, P., Cornish, T., Cowardin, M., DeVivo, M., Diamond, J., Dugger, K., Duvuvuei, O., Finely, D., Fort, J., Freeman, I., Gagnon, J., Gelzer, E., Greenspan, E., Hinojoza-Rood, V., Jeffress, M., Kyle, C.A., McKee, C., Merkle, J.A., Merrell, J., Reddell, C., Reinking, A.K., Ritson, R., Robb., B.S., Russo, B., Sawyer, H., Schroeder, C., Slezak, E., Sprague, S., Steiner, E., Steingisser, A., Stephenson, T., Tatman, N., Taylor, K., Whittaker, D., and Zaffarano, T., 2025, Ungulate migrations of the Western United States, volume 5: U.S. Geological Survey data release, https://doi.org/10.5066/P1YJCCQA.
Lowrey, B., McWhirter, D.E., Proffitt, K.M., Monteith, K.L., Courtemanch, A.B., White, P.J., Paterson, J.T., Dewey, S.R., and Garrott, R.A., 2020, Individual variation creates diverse migratory portfolios in native populations of a mountain ungulate: Ecological Applications, v. 30, no. 5, art. e2106, 14 p. [Also available at https://doi.org/10.1002/eap.2106.]
McKee, J.L., Fattebert, J., Aikens, E.O., Berg, J., Bergen, S., Cole, E.K., Copeland, H.E., Courtemanch, A.B., Dewey, S., Hurley, M., Lowrey, B., Merkle, J.A., Middleton, A.D., Nuñez, T.A., Sawyer, H., and Kauffman, M.J., 2024, Estimating ungulate migration corridors from sparse movement data: Ecosphere, v. 15, no. 9, art. e4983, 16 p. [Also available at https://doi.org/10.1002/ecs2.4983.]
Merkle, J.A., Monteith, K.L., Aikens, E.O., Hayes, M.M., Hersey, K.R., Middleton, A.D., Oates, B.A., Sawyer, H., Scurlock, B.M., and Kauffman, M.J., 2016, Large herbivores surf waves of green-up during spring: Proceedings of the Royal Society B—Biological Sciences, v. 283, no. 1833, art. 20160456, 8 p. [Also available at https://doi.org/10.1098/rspb.2016.0456.]
Merkle, J.A., Gage, J., Sawyer, H., Lowrey, B., and Kauffman, M.J., 2022, Migration mapper—Identifying movement corridors and seasonal ranges for large mammal conservation: Methods in Ecology and Evolution, v. 13, no. 11, p. 2397–2403. [Also available at https://doi.org/10.1111/2041-210X.13976.]
National Oceanic and Atmospheric Administration, 2021, U.S. climate normals quick access: National Centers for Environmental Information—U.S. Climate Normals web page, accessed January 23, 2024, at https://www.ncei.noaa.gov/access/us-climate-normals/#dataset=normals-monthly&timeframe=30&location=OR&station=USC00358407. [“Oregon” and “The Dalles” selected in the “Monthly” and “1991–2020” tabs within “Search Instructions.”]
National Park Service [NPS], 2021, Canyon de Chelly National Monument: National Park Service web page. [Also available at https://www.nps.gov/cach/index.htm.]
Natural Resources Conservation Service [NRCS], 2023, USDA migratory big game initiative: U.S. Department of Agriculture Natural Resources Conservation Service web page, accessed March 4, 2024, at https://www.nrcs.usda.gov/programs-initiatives/working-lands-for-wildlife/usda-migratory-big-game-initiative.
Nevada Department of Wildlife, 2024, Documents: Nevada Department of Wildlife web page, accessed October 9, 2024, at https://wildlifeconnectivity-ndow.hub.arcgis.com/.
New Mexico Department of Game & Fish, [undated], Urraca Wildlife Area: New Mexico Department of Game & Fish, accessed October 2024 at https://wildlife.dgf.nm.gov/wp-content/uploads/2014/06/Urraca-GAIN-WMA-NMDGF.pdf.
Nickerson, G., 2019, Managing game on the Wind River Reservation: WyoHistory.org, January 22, 2019, accessed February 9, 2023, at https://www.wyohistory.org/encyclopedia/managing-game-wind-river-reservation.
Oregon Department of Fish and Wildlife [ODFW], 2015, Oregon mule deer initiative—5 year summary 2010–2014: Salem, Oreg., Oregon Department of Fish and Wildlife, 87 p. [Also available at https://www.dfw.state.or.us/resources/hunting/big_game/mule_deer/docs/Oregon%20Mule%20Deer%20Initiative%205%20Year%20Summary%202010%20-%202014%2026Jan 15.pdf.]
Oregon Department of Fish and Wildlife [ODFW], 2020, Oregon mule deer initiative—5 year summary 2015–2019: Salem, Oreg., Oregon Department of Fish and Wildlife, 40 p. [Also available at https://www.dfw.state.or.us/resources/hunting/big_game/mule_deer/docs/Oregon%20Mule%20Deer%20Initiative%2015-19%20July%202021.pdf.]
Oregon Department of Fish and Wildlife [ODFW], 2023, Mule deer population estimates, herd composition, and over-winter fawn survival in Oregon 2019–2023: Salem, Oreg., Oregon Department of Fish and Wildlife, 1 p. [Also available at https://www.dfw.state.or.us/resources/hunting/big_game/controlled_hunts/docs/hunt_statistics/23/Mule%20Deer%20Population%20Estimates,%20Composition,%2 0and%20Over-Winter%20Fawn%20Survival%202019%20-%202023.pdf.]
Rawlings, A., 2023, Mountain town migration—Understanding the impacts of the Covid-19 pandemic on middle neighborhoods in the mountain west: Cambridge, Mass., Joint Center of Housing Studies of Harvard University, 36 p. [Also available at https://www.jchs.harvard.edu/sites/default/files/research/files/harvard_jchs_mountain_town_migration_rawlings_2023.pdf.]
Redsteer, M.H., Kelley, K.B., Francis, H., and Block, D., 2013, Increasing vulnerability of the Navajo people to drought and climate change in the Southwestern United States—Accounts from Tribal elders, in Nakashima, D., Rubis, and Krupnik, eds., Special report on Indigenous people, marginalized populations and climate change: Cambridge, Cambridge University Press, p. 171–187.
Reinking, A.K., Smith, K.T., Monteith, K.L., Mong, T.W., Read, M.J., and Beck, J.L., 2018, Intrinsic, environmental, and anthropogenic factors related to pronghorn summer mortality: The Journal of Wildlife Management, v. 82, no. 3, p. 608–617. [Also available at https://doi.org/10.1002/jwmg.21414.]
Reinking, A.K., Smith, K.T., Mong, T.W., Read, M.J., and Beck, J.L., 2019, Across scales, pronghorn select sagebrush, avoid fences, and show negative responses to anthropogenic features in winter: Ecosphere, v. 10, no. 5, art. e02722, 17 p. [Also available at https://doi.org/10.1002/ecs2.2722.]
Robb, B.S., Merkle, J.A., Sawyer, H., Beck, J.L., and Kauffman, M.J., 2022, Nowhere to run—Semi-permeable barriers affect pronghorn space use: The Journal of Wildlife Management, v. 86, no. 4, art. e22212, 20 p. [Also available at https://doi.org/10.1002/jwmg.22212.]
Sawyer, H., Kauffman, M.J., Middleton, A.D., Morrison, T.A., Nielson, R.M., and Wyckoff, T.B., 2013, A framework for understanding semi-permeable barrier effects on migratory ungulates: Journal of Applied Ecology, v. 50, no. 1, p. 68–78. [Also available at https://doi.org/10.1111/1365-2664.12013.]
Sawyer, H., Kauffman, M.J., and Nielson, R.M., 2009, Influence of well pad activity on winter habitat selection patterns of mule deer: The Journal of Wildlife Management, v. 73, no. 7, p. 1052–1061. [Also available at https://doi.org/10.2193/2008-478.]
Sawyer, H., Korfanta, N.M., Kauffman, M.J., Robb, B.S., Telander, A.C., and Mattson, T., 2022, Trade‐offs between utility‐scale solar development and ungulates on western rangelands: Frontiers in Ecology and the Environment, v. 20, no. 6, p. 345–351. [Also available at https://doi.org/10.1002/fee.2498.]
Sawyer, H., Lambert, M.S., and Merkle, J.A., 2020, Migratory disturbance thresholds with mule deer and energy development: The Journal of Wildlife Management, v. 84, no. 5, p. 930–937. [Also available at https://doi.org/10.1002/jwmg.21847.]
Sawyer, H., LeBeau, C.W., McDonald, T.L., Xu, W., and Middleton, A.D., 2019, All routes are not created equal—An ungulate’s choice of migration route can influence its survival: Journal of Applied Ecology, v. 56, no. 8, p. 1860–1869. [Also available at https://doi.org/10.1111/1365-2664.13445.]
Sawyer, H., and Telander, A., 2023, Powder River/Pumpkin Buttes mule deer study—Final report: Laramie, Wyo., Western EcoSystems Technology, Inc., 22 p. [Also available at https://wyofile.com/wp-content/uploads/2023/12/PowderRiverDeerStudy_Final.pdf.]
Shoshone & Arapaho Tribal Court, 2004, Title XVI fish and game code: Shoshone & Arapaho Tribal Court, 32 p., accessed August 31, 2023, at https://www.wrtribalcourt.com/wp-content/uploads/2022/02/Title-16-Fish-and-Game-Code.pdf.
Taylor, T., 2011, Understanding distribution, movement patterns and seasonal home ranges of Bodie Hills pronghorn: Sacramento, Calif., California Department of Fish and Wildlife, 15 p. [Also available at https://nrm.dfg.ca.gov/FileHandler.ashx?DocumentID=70299.]
U.S. Census Bureau, 2022, Fastest-growing cities are still in the West and South: U.S. Census Bureau Public Information Office press release, May 26, 2022, accessed April 4, 2024, at https://www.census.gov/newsroom/press-releases/2022/fastest-growing-cities-population-estimates.html.
U.S. Department of the Interior, 2018, Improving habitat quality in western big-game winter range and migration corridors: U.S. Department of the Interior, Secretarial Order No. 3362, accessed January 9, 2014, at https://www.doi.gov/sites/doi.gov/files/uploads/so_3362_migration.pdf.
Wallace, Z.P., Nielson, R.M., Stahlecker, D.W., DiDonato, G.T., Ruehmann, M.B., and Cole, J., 2021, An abundance estimate of free-roaming horses on the Navajo Nation: Rangeland Ecology and Management, v. 74, p. 100–109. [Also available at https://doi.org/10.1016/j.rama.2020.10.003.]
Witt, C., 2008, Forest resources of the Bighorn National Forest: Casper, Wyo., U.S. Department of Agriculture Forest Service, Rocky Mountain Research Station, 13 p. [Also available at https://www.fs.usda.gov/rm/pubs/for_res_bighorn_nf.pdf.]
Wyckoff, T.B., Sawyer, H., Albeke, S.E., Garman, S.L., and Kauffman, M.J., 2018, Evaluating the influence of energy and residential development on the migratory behavior of mule deer: Ecosphere, v. 9, no. 2, art. e02113, 13 p. [Also available at https://doi.org/10.1002/ecs2.2113.]
Wyoming Game and Fish Department [WGFD], 2021—JCR [job completion report] evaluation form [mule deer]: Wyoming Game and Fish Department web page, accessed January 31, 2024. [Job completion reports are available at https://wgfd.wyo.gov/hunting-trapping/job-completion-reports.]
Wyoming Wildlife and Roadways Initiative, 2019, Wyoming wildlife and roadways initiative top 10 project briefs, appendix B: State of Wyoming Legislature, 21 p., accessed November 8, 2021, at https://wyoleg.gov/InterimCommittee/2019/08-2019051417-03AppendixBWildlifeRoadways.pdf.
Appendix 1. Methods
Extracting and Mapping Migration Sequences
To identify spring and fall migration start and end dates for each individual in a given year, we visually inspected the Net Squared Displacement (NSD) curve (Bunnefeld and others, 2011; Bastille-Rousseau and others, 2016) alongside digital maps of the individual’s movement trajectory in the Migration Mapper application (Merkle and others, 2022). The NSD curve represents the square of the straight-line distance between any global positioning system (GPS) location of an animal’s movement trajectory and a location in the animal’s winter or summer range. Users defined this location separately for each herd on the basis of the start of a biological year, which ranged between January 1 and March 31. Additionally, for Cervus canadensis (elk) in Arizona, which had variable winter range movements, we used June 1 (in other words, peak calving) as the anchor location when measuring NSD and identifying migration start and end dates.
When an animal stays in a defined home range, the NSD varies little during the year. However, when an animal migrates away from its winter range, the NSD of each successive location increases until the animal settles in its summer range (fig. 1.1A, B, C). The days with clear breakpoints in the NSD curves represent the start and end dates for migration and were used to identify the sequential GPS locations for spring and fall migration (in other words, the migration sequences). Migration routes were mapped by joining successive GPS locations with a straight line in each migration sequence.
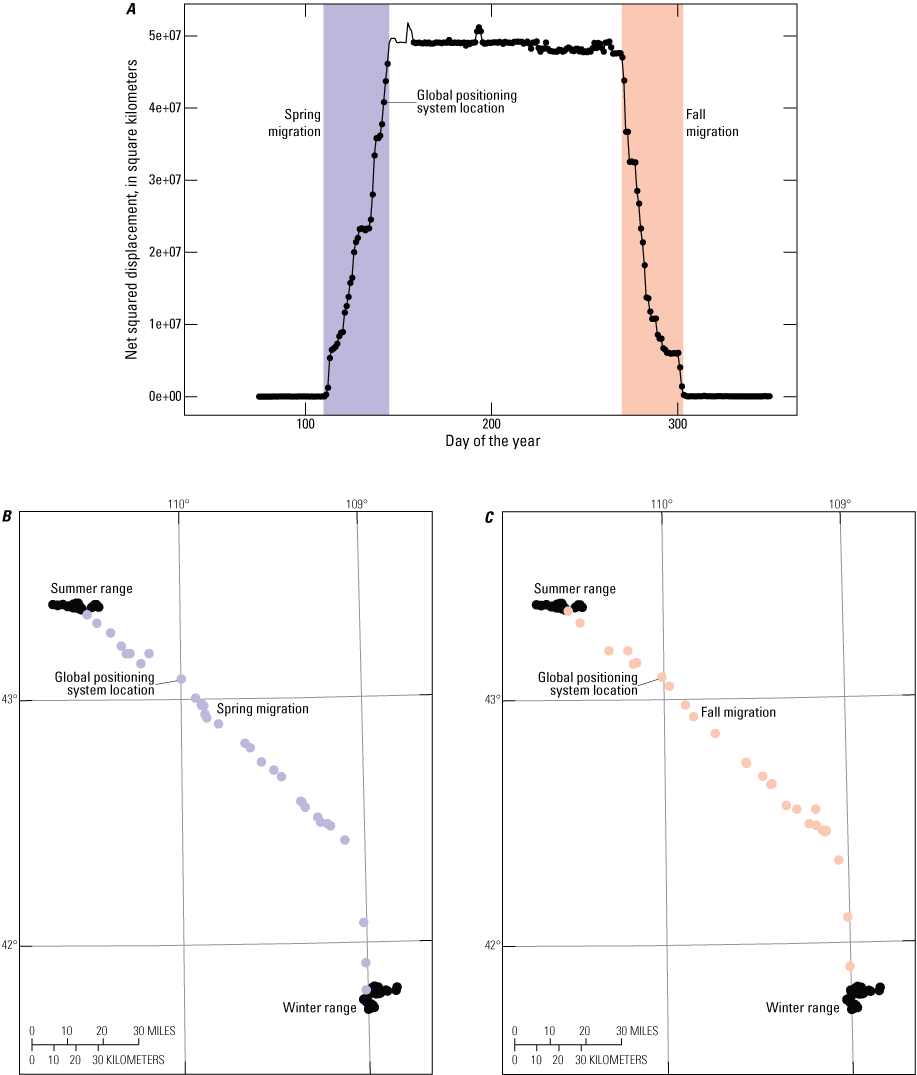
Example of Net Squared Displacement (NSD) analysis to identify migration sequences. A, breakpoints in the NSD curve provide the start and end dates for the spring migration, when an animal migrates from the winter range to the summer range, and the fall migration, when an animal leaves its summer range to return to the winter range; B, the corresponding global positioning system (GPS) locations are highlighted on the map insets for the spring migration; C, the GPS locations are highlighted on the map insets for the fall migration. For ease of readability, only one GPS location per day is shown. [e+, e-notation]
Calculating Probability of Use with Brownian Bridge Movement Models
Once migration sequences were extracted for each individual in a given year, we used a Brownian bridge movement model (BBMM; Horne and others, 2007) to estimate a utilization distribution (UD) representing the probability of use during migration. The UD produced from the BBMM provides a probability surface, or heat map, of the area used in each migration sequence. Additionally, the outer bounds of the UD provide estimated widths of the movement path around the straight line between an animal’s two successive locations. Together, the heat map and boundary of the UD can be used to identify migration corridors (Sawyer and others, 2009) and the stopover sites where animals spend extended time foraging along their migration route (Sawyer and Kauffman, 2011).
To generate the heat map for each migration sequence, we used the BBMM to estimate a UD with a grid resolution of 164 feet (50 meters). When GPS collars failed to record a location at a given time and breaks in the sequential data exceeded an 8–14-hour time lag, we did not build a bridge between the two locations encompassing the break. A key parameter of the BBMM is the Brownian motion variance (BMV), which provides an index of the mobility of the animal under observation (Horne and others, 2007). An empirical estimate of the BMV was obtained for each migration sequence using the methods of Horne and others (2007). We did not include migration sequences with a BMV greater than or equal to 1.98 acres (8,000 square meters [m2]) because large BMV values poorly represented the observed migration trajectory.
Variations of the Brownian Bridge Movement Model Method—Sparse Data and Fixed Motion Variance
When location data are sparse (in other words, when there is a long time interval between GPS locations), the BBMM performs poorly because of the increased uncertainty in the movement path between two successive GPS locations. Such uncertainty tends to overestimate the corridor width and area (Horne and others, 2007; Benhamou, 2011). To facilitate corridor analyses of migration sequences collected with low relocation rates (in other words, fix rates), we used the alternative Fixed Motion Variance method, in which we set the BMV at specific levels when estimating the UDs for each migration sequence (Kauffman and others, 2020; McKee and others, 2024). For herds with sparse sampling data, we set the BMV between 0.15 and 0.40 acres (600 and 1,600 m2, respectively) for elk and Antilocapra americana (pronghorn) and between 0.10 and 0.30 acres (400 and 1,200 m2, respectively) for Odocoileus hemionus (mule deer; McKee and others, 2024).
For most analyses, traditional BBMM methods were used to estimate corridors and stopovers. However, when there were large amounts of missing data in the migration sequences, corridors were calculated using Fixed Motion Variance if they improved delineation as observed through a visual comparison of maps from the two methods. When fix rates were highly variable among individuals in a herd, BBMM and Fixed Motion Variance methods were used to construct individual UDs. In general, by bridging gaps in the probability surface created by missing GPS locations, Fixed Motion Variance provided a modeled corridor that more closely matched data with frequent relocations (for example, a 2-hour fix rate; McKee and others, 2024). In most of these analyses, a 14-hour time lag was allowed; a 27-hour or 48-hour time lag was allowed only when it provided more complete migration corridors compared to using a 14-hour time lag.
In Idaho, a Fixed Motion Variance was calculated for the Sand Creek Alces alces (moose) herd dataset (refer to the “Sand Creek Moose” section of the report) that included 24 individual moose migrations with 13-hour gaps between successive GPS locations. Analysis revealed that the best balance between specificity and sensitivity was 0.35 acres (1,400 m2), so this value was used for the Sand Creek moose migration analysis (S. Bergen, Idaho Fish and Game, unpub. data., 2024).
Calculating Population-Level Corridors and Stopovers
We applied a three-step process to calculate population-level corridors and to identify stopovers; the process generally followed the methods developed by Sawyer and others (2009). First, we averaged the UDs for a given individual’s spring and fall migration sequences across all years to produce a single, individual-level migration UD. We rescaled this mean UD to sum to one. Second, we defined a migration footprint for each individual as the 99-percent isopleth of its UD. We then stacked all the individual footprints for a given population, which provided a raster representing the number of animals that used each grid cell during migration. Next, we defined different levels of corridor use on the basis of the proportion of the collared migrants in the population for a given grid cell. For most herds, we then defined low use corridors as areas traversed by at least one collared individual during migration, medium use corridors as areas used by 10–20 percent of the collared individuals, and high use corridors as areas used by more than 20 percent of the collared individuals in the population. These corridors were converted from a grid-based format to a polygon format, and then isolated-use polygons of less than 4.94 acres (20,000 m2) were removed. Finally, to calculate stopover use, we averaged all the individual-level UDs to produce a single population-level UD, rescaled to sum to one. Stopovers were defined as the areas representing the highest 10 percent of use from the mean population-level UD. We then converted stopovers from a grid-based format to a polygon format, like the corridors, and removed isolated-use polygons of less than 4.94 acres (20,000 m2). The resulting population-level corridors are referred to as “corridors” or “footprints,” depending on the preference of individual States and Tribes.
Variations of the Method to Calculate Population-Level Corridors
The simplest method for delineating migratory corridors was the line buffer approach (Merkle and others, 2023). For this method, we simply buffered the migration lines (lines connecting sequential GPS locations) by a specified distance (for example, 820 feet [250 meters]) and then used the general methods in the “Calculating Population-Level Corridors and Stopovers” section to determine low, medium, and high use areas. The line buffer method serves as a useful alternative to the BBMM methods because it (1) ensures individual routes are the same width and do not vary extensively, (2) ensures population-level routes have full connectivity between seasonal ranges (in other words, no broken segments or overly large areas are produced), (3) easily accommodates variable GPS fix rates, and (4) requires little computing power.
Most maps in this report display low, medium, and high use corridors or routes. However, some individual State and Tribal contributors adapted methods to best suit their management purposes or accommodate the limitations posed by varying sample sizes among herds. The “Data Analysis” section of the page-pair text accompanying each herd provides additional herd-specific details when analysts deviated from the general methods presented herein, for example, when different definitions were used to define the migration corridor or route use levels.
Estimating a Population’s Winter Range
To estimate a population’s winter range, we generally followed the same methods used to calculate migration stopover sites but had some exceptions. First, instead of migration sequences, we isolated winter sequences of GPS locations. For each year, we calculated a standard date for the start and end of winter, and based on the preference of individual States and Tribes, we applied one of three options to calculate winter range dates: (1) for each year, we calculated the start of winter as the 95th percent quantile of the end dates of all fall migrations and the end of winter as the 5th percent quantile of the start dates of all spring migrations, (2) we defined winter as the dates between the end of fall migration and the start of spring migration for each individual, or (3) we defined a fixed date range using local expert knowledge for a given herd (for example, December 15–March 15). We discarded winter sequences that spanned fewer than 30 days. Using the same methods for calculating migration stopovers, we calculated a population-level UD of winter use and identified the core winter range using the 50-percent isopleth. The “Data Analysis” section for the corresponding herd summaries in this report provided additional herd-specific details regarding winter ranges.
Estimating a Population’s Annual Range
To estimate a population’s annual range, we generally followed the same methods used to calculate migration stopover sites or winter range but had some exceptions. First, we isolated annual movement sequences for each individual. These movement sequences were defined as movements longer than 275 days (200 days for California) in a calendar year and began at the time of GPS collar deployment. Start dates were similar because GPS collars were deployed in batches around the same dates. End dates varied depending on individual mortalities. Using the methods for migration corridors, we calculated a population-level UD of annual use and identified the core annual range using isopleth values (for example, 50 and 90 percent contours) selected on the basis of local expert knowledge for a given herd. The “Data Analysis” section for the corresponding herd summaries in this report provided additional herd-specific details regarding annual ranges.
Herd Summary Statistics
In addition to the map for each herd, several summary statistics described the project and associated data. In the “Animal Capture and Data Collection” section for the corresponding herd summaries in this report, sample size was defined as the number of collared individuals (inclusive of residents and migrants), relocation frequency was determined by local researchers and varied within and among herds, and the project duration was defined using the year of the first and last GPS location included in the analyses. In the “Data Analysis” section for the corresponding herd summaries in this report, we provided the number of migration sequences and individuals used in the respective analysis. These numbers accounted for sequences that failed to fit a BBMM and were not included in the delineation of the migration corridor or seasonal range. In the “Corridor and Stopover Summary” section for the corresponding herd summaries in this report, we included the median start and end dates for the spring and fall migrations and the average duration of each migration period in days. Additionally, we defined the migration length as the maximum distance between any two points in a spring or fall migration sequence. These methods helped to avoid overestimating migration distances, which can be inflated when calculated as the sum of all step lengths in a sequence because distances traveled when foraging at a stopover are included. The “Corridor and Stopover Summary” section for the corresponding herd summaries in this report also includes the areas of migration corridors and stopovers.
References Cited
Bastille-Rousseau, G., Potts, J.R., Yackulic, C.B., Frair, J.L., Ellington, E.H., and Blake, S., 2016, Flexible characterization of animal movement pattern using net squared displacement and a latent state model: Movement Ecology, v. 4, no. 1, 12 p. [Also available at https://doi.org/10.1186/s40462-016-0080-y.]
Benhamou, S., 2011, Dynamic approach to space and habitat use based on biased random bridges: PLoS One, v. 6, no. 1, art. e14592, 8 p. [Also available at https://doi.org/10.1371/journal.pone.0014592.]
Bunnefeld, N., Börger, L., van Moorter, B., Rolandsen, C.M., Dettki, H., Solberg, E.J., and Ericsson, G., 2011, A model‐driven approach to quantify migration patterns—Individual, regional and yearly differences: Journal of Animal Ecology, v. 80, no. 2, p. 466–476. [Also available at https://doi.org/10.1111/j.1365-2656.2010.01776.x.]
Horne, J.S., Garton, E.O., Krone, S.M., and Lewis, J.S., 2007, Analyzing animal movements using Brownian bridges: Ecology, v. 88, no. 9, p. 2354–2363. [Also available at https://doi.org/10.1890/06-0957.1.]
Kauffman, M.J., Copeland, H.E., Berg, J., Bergen, S., Cole, E., Cuzzocreo, M., Dewey, S., Fattebert, J., Gagnon, J., Gelzer, E., Geremia, C., Graves, T., Hersey, K., Hurley, M., Kaiser, R., Meacham, J., Merkle, J., Middleton, A., Nuñez, T., Oates, B., Olson, D., Olson, L., Sawyer, H., Schroeder, C., Sprague, S., Steingisser, A., and Thonhoff, M., 2020, Ungulate migrations of the Western United States, volume 1 (ver. 1.1, December 2023): U.S. Geological Survey Scientific Investigations Report 2020–5101, 119 p. [Also available at https://doi.org/10.3133/sir20205101.]
McKee, J.L., Fattebert, J., Aikens, E.O., Berg, J., Bergen, S., Cole, E.K., Copeland, H.E., Courtemanch, A.B., Dewey, S., Hurley, M., Lowrey, B., Merkle, J.A., Middleton, A.D., Nuñez, T.A., Sawyer, H., and Kauffman, M.J., 2024, Estimating ungulate migration corridors from sparse movement data: Ecosphere, v. 15, no. 9, art. e4983, 16 p. [Also available at https://doi.org/10.1002/ecs2.4983.]
Merkle, J.A., Gage, J., Sawyer, H., Lowrey, B., and Kauffman, M.J., 2022, Migration mapper—Identifying movement corridors and seasonal ranges for large mammal conservation: Methods in Ecology and Evolution, v. 13, no. 11, p. 2397–2403. [Also available at https://doi.org/10.1111/2041-210X.13976.]
Merkle, J., Lowrey, B., Wallace, C.F., Hall, L.E., Wilde, L., Kauffman, M.J., and Sawyer, H., 2023, Conserving habitat for migratory ungulates—How wide is a migration corridor?: Journal of Applied Ecology, v. 60, no. 9, p. 1763–1770. [Also available at https://doi.org/10.1111/1365-2664.14473.]
Sawyer, H., and Kauffman, M.J., 2011, Stopover ecology of a migratory ungulate: Journal of Animal Ecology, v. 80, no. 5, p. 1078–1087. [Also available at https://doi.org/10.1111/j.1365-2656.2011.01845.x.]
Sawyer, H., Kauffman, M.J., Nielson, R.M., and Horne, J.S., 2009, Identifying and prioritizing ungulate migration routes for landscape-level conservation: Ecological Applications, v. 19, no. 8, p. 2016–2025. [Also available at https://doi.org/10.1890/08-2034.1.]
Conversion Factors
U.S. customary units to International System of Units
Datum
Vertical coordinate information is referenced to the North American Vertical Datum of 1988 (NAVD 88).
Horizontal coordinate information is referenced to the North American Datum of 1983 (NAD 83).
Abbreviations
<
less than
>
greater than
AADT
average annual daily traffic
AML
appropriate management level
AZGFD
Arizona Game and Fish Department
BBMM
Brownian bridge movement model
BLM
Bureau of Land Management
BMV
Brownian motion variance
CMT
Corridor Mapping Team
CPW
Colorado Parks and Wildlife
CWD
chronic wasting disease
DAU
Data Analysis Unit
DVC
deer-vehicle collisions
FS
U.S. Department of Agriculture Forest Service
GMU
Game Management Unit
GIS
geographic information system
GPS
global positioning system
HMA
herd management area
NPS
National Park Service
NRCS
Natural Resources Conservation Service
NSD
Net Squared Displacement
ODFW
Oregon Department of Fish and Wildlife
ODOT
Oregon Department of Transportation
UD
utilization distribution
USDA
U.S. Department of Agriculture
USGS
U.S. Geological Survey
VHF
very high frequency
WGFD
Wyoming Game and Fish Department
WMU
Wildlife Management Unit
WVC
wildlife-vehicle collisions
Publishing support provided by the Science Publishing Network, Denver and Tacoma Publishing Service Centers
For more information concerning the research in this report, contact the Associate Director Ecosystems Mission Area
U.S. Geological Survey
Mail Stop 300
12201 Sunrise Valley Drive
Reston, VA 20192
Disclaimers
Any use of trade, firm, or product names is for descriptive purposes only and does not imply endorsement by the U.S. Government.
Although this information product, for the most part, is in the public domain, it also may contain copyrighted materials as noted in the text. Permission to reproduce copyrighted items must be secured from the copyright owner.
Suggested Citation
Kauffman, M., Lowrey, B., McKee, J.L., Allen, T., Beaupre, C., Beck, J.L., Bergen, S., Binfet, J., Blair, S., Cain, J.W., III, Carl, P., Cornish, T., Cowardin, M., Curtis, R., DeVivo, M., Diamond, J., Dugger, K.M., Duvuvuei, O., Ellingwood, C.J., Finely, D., Fort, J., Freeman, E., Freeman, I., Gagnon, J., Gelzer, E., Gray, J., Greenspan, E., Hendricks, C., Hinojoza-Rood, V.D., Jeffress, M., Kyle, C.A., Lockyer, Z., McKee, C., Merkle, J.A., Merrell, J., Mumma, M.A., Powell, J., Reddell, C., Reinking, A.K., Ritson, R., Robatcek, S., Robb, B.S., Russo, B.M., Sawyer, H., Schroeder, C., Slezak, E., Sprague, S., Steiner, E., Steingisser, A., Stephenson, T., Tatman, N., Taylor, K.L., Whittaker, D., and Zaffarano, T., 2025, Ungulate migrations of the Western United States, volume 5: U.S. Geological Survey Scientific Investigations Report 2024–5111, 96 p., https://doi.org/10.3133/sir20245111.
ISSN: 2328-0328 (online)
ISSN: 2328-031X (print)
Study Area
| Publication type | Report |
|---|---|
| Publication Subtype | USGS Numbered Series |
| Title | Ungulate migrations of the Western United States, volume 5 |
| Series title | Scientific Investigations Report |
| Series number | 2024-5111 |
| ISBN | 978-1-4113-4594-2 |
| DOI | 10.3133/sir20245111 |
| Publication Date | February 06, 2025 |
| Year Published | 2025 |
| Language | English |
| Publisher | U.S. Geological Survey |
| Publisher location | Reston VA |
| Contributing office(s) | Coop Res Unit Seattle |
| Description | Report: xiii, 96 p.; Data Release |
| State | Arizona, California, Colorado, Idaho, Nevada, New Mexico, Oregon, Utah, Wyoming |
| Other Geospatial | Navajo Nation |
| Online Only (Y/N) | N |