

Perchlorate, Metals, Organic Compounds, and Lead Isotopes in Groundwater, Surface Water, Shallow Groundwater, and Soil Within and Near the Middleton Municipal Airport–Morey Field (C29), Middleton, Wisconsin, 2022
Links
- Document: Report (9.4 MB pdf) , HTML , XML
- Dataset: USGS National Water Information System database - USGS water data for the Nation
- Data Release: USGS data release - Lead concentrations and isotope ratios for selected water and soil samples near Middleton Municipal Airport–Morey Field (C29), Middleton, WI, 2022
- NGMDB Index Page: National Geologic Map Database Index Page (html)
- Download citation as: RIS | Dublin Core
Acknowledgments
The authors would like to thank the homeowners from the Town of Middleton and Town of Springfield for volunteering to have water from their outdoor faucets analyzed and the Middleton Municipal Airport staff for providing access to sampling locations within the airport fencing.
The authors would also like to thank U.S. Geological Survey staff for their assistance with the data collection and field-work components of this study. Jason Smith helped install shallow groundwater wells and collect and process groundwater, shallow groundwater, and soil samples. Robert Rosner and Keegan Johnson installed surface-water monitoring equipment and collected and processed the surface-water samples. David Owens and Paul Reneau also helped to install surface-water monitoring equipment.
Abstract
The Middleton Municipal Airport–Morey Field (C29) is in the City of Middleton and adjacent to the towns of Middleton and Springfield, Wisconsin. Nearby homes in the towns rely on private drinking water wells, and residents are concerned about the potential contamination of groundwater and surface water by airport activities, including flights by small aircraft that use leaded aviation fuel and a fireworks display in July 2021.
The U.S. Geological Survey, in cooperation with the Town of Middleton, completed a study in 2022 to characterize the occurrence and sources of perchlorate, metals (including lead), and organic compounds in samples of groundwater, surface water, shallow groundwater, and soils within and near the airport. Lead isotopes were also measured to determine sources of lead by comparing samples to environmental references.
Magnitudes of concentrations from samples of water and soil collected in 2022, and their spatial patterns across site locations, indicate the fireworks display in July 2021 was a likely source of perchlorate and metals in the airport study area. The highest perchlorate concentration was measured in surface water at the southeastern corner of the airport near the fireworks launch site; the highest concentrations of fireworks-associated metals were measured in shallow groundwater near the same location. Fireworks were not the only possible source of perchlorate and metals in the airport study area because both were also detected upgradient and away from the fireworks launch site.
Ratios of lead isotopes indicate that lead measured in water and soil within the airport study area was primarily sourced from background atmospheric lead deposition or Wisconsin galena lead ore. However, two groundwater samples (one upgradient and one downgradient from the airport; both with concentrations less than 1 microgram per liter) had isotopic signatures matching leaded aviation fuel sold at the airport.
Introduction
The Middleton Municipal Airport–Morey Field (C29) (hereafter referred to as the “airport”) is a regional general aviation facility within the City of Middleton and adjacent to the Town of Middleton, Wisconsin (Mead and Hunt, 2022). Water resources near the airport include a creek called Pheasant Branch, which originates about 3 miles (mi) to the north-northwest of the airport and flows through the 252-acre property. Large areas of the airport are classified as wetlands or contain soils capable of supporting wetland ecology (Mead and Hunt, 2022). The airport is bordered by the Town of Middleton to the west, north, and east and the Town of Springfield to the north (fig. 1), where nearby homes rely on private drinking water wells for their water supply.
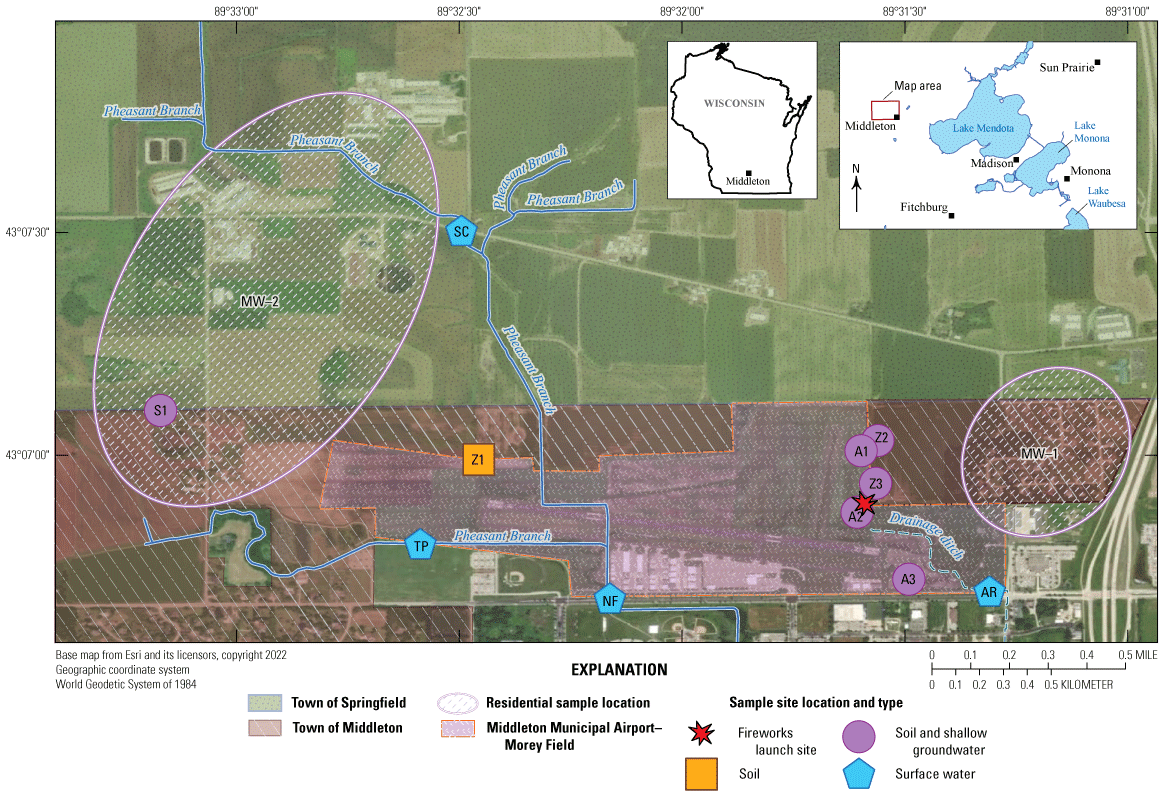
Map showing sampling locations within and near the Middleton Municipal Airport, Middleton, Wisconsin, 2022.
Sources of potential contamination to water resources within and near the airport include emissions from aircraft and other onsite activities. The airport averages 111 flights per day (in the 12-month period ending in July 2023), most by small, piston-driven aircraft using leaded aviation fuel (Avgas 100LL; AirNav, LLC, 2023). Lead contamination in air and soil near airports has been documented previously (National Academies of Sciences, Engineering, and Medicine, 2016; McCumber and Strevett, 2017); however, information about the occurrence of lead and transport to water resources is limited. The airport has hosted an annual fly-in event that featured a fireworks display in July 2021. Recent studies by the U.S. Geological Survey (USGS) and others determined a relation between the presence of perchlorate and selected heavy metals in water resources and soils after fireworks displays (Hoogestraat and Rowe, 2016; Andrews and others, 2021).
To address concerns of potential contamination from these activities, the USGS, in cooperation with the Town of Middleton, completed a study in 2022 to characterize the occurrence and sources of perchlorate and metals (including lead and other metals commonly associated with fireworks) in samples of groundwater, surface water, shallow groundwater, and soils within and near the airport. Samples were also analyzed for gasoline range organics (GRO)—organic hydrocarbon compounds commonly detected in gasoline—and a subset of compounds including benzene, toluene, ethylbenzene, and xylene (BTEX). Concentrations of perchlorate, metals, and GRO and BTEX compounds were analyzed in 60 water samples and 14 soil samples at 23 locations within and near the airport. Lead isotopes were also measured in 24 of the water and soil samples to determine sources of lead.
Perchlorate
Perchlorate is commonly used as a component in explosives such as rocket fuels and fireworks. Several studies have determined perchlorate contamination of groundwater and surface water is linked to repeated fireworks displays (Massachusetts Department of Environmental Protection, 2007; Hoogestraat and Rowe, 2016; Andrews and others, 2021). Other sources of perchlorate in the environment include atmospheric deposition from lightning and the use of fertilizers, particularly those sourced from Chile (Munster and others, 2009; Kalkhoff and others, 2010). Chilean-sourced fertilizers are known to have relatively high levels of perchlorate compared to other inorganic fertilizers, but they have not been used in large quantities in U.S. agriculture in decades (Hoogestraat and Rowe, 2016). Fertilizers commonly used in the United States today are known to contain smaller amounts of perchlorate (Susarla and others, 1999).
Perchlorate is highly soluble in water and is absorbed poorly by most geologic materials, making it mobile in the environment (Sijimol and others, 2015). Perchlorate biodegradation is limited because it requires the presence of perchlorate-degrading bacteria, adequate carbon sources, and anerobic conditions (Tipton and others, 2003). Because perchlorate is persistent and highly mobile in water, it has substantial potential for transport away from a contamination source.
Perchlorate is known to affect human health by disrupting thyroid hormones via inhibition of the uptake of iodine (Agency for Toxic Substances and Disease Registry, 2008). Perchlorate is not currently (2024) regulated in drinking water by the U.S. Environmental Protection Agency (EPA); however, several States, including Wisconsin, have drinking water enforcement standards for perchlorate. The current Wisconsin Department of Natural Resources public health groundwater-quality enforcement standard for perchlorate is 1 microgram per liter (µg/L; Wisconsin Department of Natural Resources, 2023b).
Metals Associated with Fireworks Displays
Metals in water resources and soils within and near the airport are likely derived from geogenic (for example, weathering of local rock) and (or) anthropogenic (for example, agriculture, fireworks) sources. Background literature on metals concentrations in soils and lithology in this area is limited, as is information about anthropogenic sources. The focus for this study was on the metals in fireworks.
A variety of metals are used to impart color in fireworks; for example, lithium and strontium are used to create flashes of red light, barium is used for greens, titanium for silver and white, copper for blue, and so on (Russell, 2000). Although scientific studies on contamination from fireworks have largely focused on particulate metals emissions and their related health concerns, Steinhauser and others (2008) examined metals in snowfall after New Year’s Eve fireworks and detected markedly increased concentrations of barium, strontium, arsenic, potassium, and iron in fireworks-contaminated snowfall. Hoogestraat and Rowe (2016) detected high concentrations of lead and copper in soil near debris from annual fireworks displays at the Mount Rushmore National Memorial. Licudine and others (2012) determined that metals not specifically permitted or prohibited are likely in fireworks; thus, more metals may be associated with fireworks than are recognized in the literature.
Several fireworks-associated metals (aluminum, calcium, magnesium, iron, potassium, sodium, strontium, and zinc) are naturally occurring in soil and water resources. For example, aluminum is a fireworks component but is also the third most abundant metal in the Earth’s crust and is in many soil and rock types (Kabata-Pendias, 2011).
This study examined the potential contribution of metals from a fireworks display to the local water resources and soils because many of these fireworks-associated metals are known to pose substantial risks to human and environmental health if ingested in large quantities or over long periods of time. Ingestion of large quantities of barium can lead to irregular heart rhythms or paralysis (Agency for Toxic Substances and Disease Registry, 2007a), strontium in the diet can weaken bones by displacing calcium (Agency for Toxic Substances and Disease Registry, 2007b), and chronic arsenic exposure is linked to skin, lung, and other cancers (Agency for Toxic Substances and Disease Registry, 2007c).
Organic Compounds
Airports have been determined to be sources of organic compounds to the environment. GRO compounds are hydrocarbons detected in gasolines and oils (Agency for Toxic Substances and Disease Registry, 2017). Leaded aviation fuel (Avgas 100LL) and Jet A fuel contain GRO compounds and are available for purchase at the airport. BTEX compounds, a subset of these GRO compounds, are components of solvents, paint thinners, degreasers, gasolines, oils, and adhesives and have also been detected in airport runoff (U.S. Environmental Protection Agency, 2000).
Exposure to high concentrations of GRO and BTEX compounds over time can cause substantial health risks including neurological impairment, hematological effects, and cancers (Curtis and others, 2023). GRO and BTEX compounds can volatilize into indoor air when contaminated groundwater is used as household water or contaminated soils are in contact with basement materials (Agency for Toxic Substances and Disease Registry, 2004).
Lead and Lead Isotopes
A substantial source of lead contamination in the environment is anthropogenic, mostly from high-temperature industrial activities and combustion of leaded gasoline (Kelly and others, 2009). Coal-fired power plants and metal-processing facilities release lead to the atmosphere that can be circulated in air currents, resulting in dry and wet deposition in rainfall or snowfall (Sherman and others, 2015). Wood burning has also been identified as a historical and modern source of lead to the environment (Graney and others, 1995). Additional atmospheric deposition of lead can be attributed to emissions from the combustion of leaded gasoline in vehicles, which was the predominant source of lead in the air beginning in 1930 and peaking in the early 1970s (Graney and others, 1995). After being banned for use in on-road vehicles in 1996, leaded gasoline was available in smaller amounts for off-road use, such as in farming equipment and aircraft (U.S. Environmental Protection Agency, 1996b). Leaded gasoline is still used in older piston-driven aircraft, such as those flown at the airport, where leaded aviation fuel has been used for decades and is currently (2024) available for purchase as Avgas 100LL.
Lead is also naturally occurring in rock and soils throughout the world. In southwestern Wisconsin, galena lead ore (lead sulfide) was mined extensively in the 19th and 20th centuries for use in products including lead pipes, lead shot, lead-based paint, and lead plates used in the production of batteries (U.S. Environmental Protection Agency, 2024; Wisconsin Geological and Natural History Survey, 2024). Lead-based paints were commonly used until they were banned for residential use in 1978 (Center for Disease Control and Prevention, 2022).
Additional potential sources of lead in the airport study area include fireworks and lead-shot ammunition. Hoogestraat and Rowe (2016) detected high concentrations of lead in soil adjacent to the annual fireworks launch location at the Mount Rushmore National Memorial. Until 2002, the Middleton Sportsmen’s Club—where activities included trap and skeet shooting that used lead shot in the ammunition—was on a parcel of land adjacent to the airport to the southeast (Wisconsin Department of Natural Resources, 2023a).
Environmental exposure to lead is known to affect multiple organ systems, resulting in deficits that may affect someone for life, even after the lead exposure has been eliminated (McFarland and others, 2022). The EPA action level for lead in drinking water is 15 parts per billion (equivalent to micrograms per liter), according to the EPA’s lead and copper rule; however, the EPA nonenforceable maximum contaminant level (MCL) goal for lead in drinking water is 0 parts per billion because the EPA has stated that the best available science determined no level of exposure to lead is safe (U.S. Environmental Protection Agency, 2023).
Ratios of stable isotopes of lead can be compared to references to aid in determining the most likely sources of lead in water and soil samples collected within the airport study area. See the “Lead Isotopes and Concentrations” section for further discussion on lead isotopic signatures in the environment.
Purpose and Scope
This report addresses concerns about the potential for contamination of groundwater and surface water by airport activities including aircraft flights, aircraft maintenance and fueling, and a fireworks display. The airport held a celebration at their annual fly-in event in July 2021, which included performances by acrobatic airplanes and a fireworks display. At the onset of this study, it was understood that the fireworks display would be an annual event; thus, subsequent sampling rounds were planned after the anticipated July 2022 fireworks show. However, the fireworks show was replaced with a laser-light show in 2022; therefore, no additional sampling was done after the initial sampling in May–July 2022.
Concentrations of perchlorate, metals, and GRO and BTEX compounds are presented for 60 water samples (groundwater, surface water, and shallow groundwater) and 14 soil samples collected at 23 locations within and near the airport in May–July 2022. Lead isotopes were also measured in 24 of the water and soil samples to determine lead sources.
Description of Study Area
The Middleton Municipal Airport–Morey Field (designated C29 by the Federal Aviation Administration) is in Dane County in south-central Wisconsin on the northwestern side of the City of Middleton, about 8 mi west-northwest of the City of Madison (fig. 1). The 252-acre airport property is bisected by a creek called Pheasant Branch, which runs from north to south. A USGS streamgage, Pheasant Branch at Airport Road near Middleton, Wis. (station 05427943), is at the southern boundary of the airport. The basin area is 9.6 square miles of primarily agricultural (79 percent of total area, mostly corn and alfalfa to support dairy farming) and developed (14 percent) land (U.S. Department of Agriculture, National Agricultural Statistics Service, 2024). Mean-annual streamflow for 17 years of record (1978–81, 1988, 2012–23) at the USGS streamgage was about 3 cubic feet per second (U.S. Geological Survey, 2023). A small tributary to Pheasant Branch enters the main channel at the southwestern edge of the airport, and an intermittent stream drains the eastern side of the airport, joining the main channel about 0.5 mi to the south. Much of the area around the intermittent stream and some of the land north and west of the north runway are wetlands (Mead and Hunt, 2022).
Subsurface geology near the airport is characterized by shallow soils underlain by a thin glacial aquifer. Below this, a layer of clay-rich lacustrine sediments creates a semiconfining layer above a bedrock aquifer composed of primarily limestone and sandstone (Clayton and Attig, 1997). Because of the presence of the semiconfining lacustrine layer, substantial downward movement of water to the bedrock aquifer is limited in this region. The most probable flow path for water is through the shallow subsurface (vadose zone and glacial aquifer) to surface waterbodies. Regional groundwater flow near the airport is to the east and southeast toward Lake Mendota (Parsen and others, 2016).
Methods
Water and soil samples were collected in May, June, and July 2022 to characterize concentrations and determine potential sources of perchlorate, metals, GRO and BTEX compounds, and lead isotopes (table 1) within and near the airport in Middleton, Wis. Sites sampled for this study (table 2; fig. 1) were selected upgradient and downgradient from the airport to help understand the spatial distributions and magnitudes of constituent concentrations and to determine if airport activities such as aircraft flights, aircraft maintenance and fueling, and fireworks displays were potential sources. The collection and processing of samples, laboratory analyses, and quality-assurance procedures are described in subsequent sections.
Table 1.
Constituents analyzed in water and soil samples collected within and near the Middleton Municipal Airport, Middleton, Wisconsin, 2022.[GW, groundwater; SW, surface water; SWG, shallow groundwater; X, analyzed; --, not analyzed; µS/cm, microsiemens per centimeter at 25 degrees Celsius; mg/L, milligram per liter; CaCO3, calcium carbonate; N, nitrogen; µg/L, microgram per liter; mg/kg, milligram per kilogram; µg/kg, microgram per kilogram; µg/g, microgram per gram]
Table 2.
Sample locations within and near the Middleton Municipal Airport, Middleton, Wisconsin, 2022.[USGS, U.S. Geological Survey; GW, groundwater; SGW, shallow groundwater; Br, branch; Trib, Tributary; Rd, Road; nr, near; WI, Wisconsin; SW, surface water]
| Map identifier (fig. 1) | USGS station number | USGS station name | Site type |
|---|---|---|---|
| MW–1 | 430700089311001 | Highwood Circle MW–1 | Well (GW) |
| MW–1 | 430700089311002 | Highwood Circle MW–2 | Well (GW) |
| MW–1 | 430700089311003 | Highwood Circle MW–3 | Well (GW) |
| MW–1 | 430700089311004 | Highwood Circle MW–4 | Well (GW) |
| MW–1 | 430700089311005 | Highwood Circle MW–5 | Well (GW) |
| MW–1 | 430700089311006 | Highwood Circle MW–6 | Well (GW) |
| MW–1 | 430700089311007 | Highwood Circle MW–7 | Well (GW) |
| MW–1 | 430700089311008 | Highwood Circle MW–8 | Well (GW) |
| MW–1 | 430700089311009 | Highwood Circle MW–9 | Well (GW) |
| MW–1 | 430700089311010 | Highwood Circle MW–10 | Well (GW) |
| MW–2 | 430710089330001 | Capitol View Road MW–S1 | Well (GW) |
| MW–2 | 430740089323001 | Church Road MW–Z1 | Well (GW) |
| S1 | 430802089330201 | Airport Road MW–S1 | Shallow groundwater (SGW) and soil |
| Z1 | 430702089322501 | Airport Road MW–Z1 | Soil |
| Z2 | 430702089313101 | Airport Road MW–Z2 | Shallow groundwater (SGW) and soil |
| Z3 | 430656089312701 | Airport Road MW–Z3 | Shallow groundwater (SGW) and soil |
| A1 | 430701089313601 | Airport Road MW–A1 | Shallow groundwater (SGW) and soil |
| A2 | 430653089313601 | Airport Road MW–A2 | Shallow groundwater (SGW) and soil |
| A3 | 430646089312501 | Airport Road MW–A3 | Shallow groundwater (SGW) and soil |
| AR | 430642089311901 | Pheasant Br Trib at Airport Rd nr Middleton, WI | Stream (SW) |
| TP | 430648089324101 | Pheasant Br Trib at Tallard Park nr Middleton, WI | Stream (SW) |
| SC | 05427940 | Pheasant Branch at Schneider Road nr Ashton, WI | Stream (SW) |
| NF | 05427943 | Pheasant Branch at Airport Road nr Middleton, WI | Stream (SW) |
Sampling Locations
The groundwater flow model for Dane County (Parsen and others, 2016) demonstrates that groundwater in the area near the airport flows generally from northwest to southeast toward Lake Mendota. Thus, samples collected north and west of the airport should represent groundwater unaffected by onsite activities. A total of 12 homeowner groundwater wells were sampled; 10 wells were roughly downgradient from the airport in the Highwood Circle Estates neighborhood (MW–1, fig. 1; table 2), and 2 wells were upgradient (MW–2) from the airport. Highwood Circle Estates is on a hill where the depth to groundwater was between 50 and 100 feet (ft) below ground surface at the time of this study. The two wells upgradient from the airport had depths to groundwater of less than 50 ft. Because of the higher surface elevation of Highwood Circle Estates relative to the upgradient wells, all samples were likely collected from the same groundwater source; thus, similar chemical properties were expected to be observed among all wells. To validate this assumption, open intervals from all available homeowner well-construction reports (7 of the 12) were checked against the layering of the groundwater flow model for Dane County. All wells were determined to terminate in the bedrock Wonewoc Formation, described in the Dane County model report as medium- to fine-grained sandstone that is as much as 200 ft thick, making up an important regional aquifer (Bradbury and others, 2016). Studies within Dane County have documented evidence of potential preferential flow paths for groundwater along fracture features within the sandstone of the Wonewoc Formation (Bradbury and others, 2016).
Three new surface-water sampling stations were established within and near the airport study area. One surface-water sampling station (SC, fig. 1; table 2) was established about 0.7 mi upstream from the primary airport runway on Pheasant Branch at the intersection of Church and Schneider Roads. A second sampling station (TP) was established on the small tributary to Pheasant Branch immediately west of the airport where no contribution from the airport property would be expected. The third station (AR) was established outside of the fence at the southeastern edge of the airport, at the base of a ditch that drains overland runoff from land on the eastern side of the airport, including the July 2021 fireworks launch location. A fourth sampling station (NF) immediately downstream from the airport on Pheasant Branch near Airport Road used the existing USGS streamflow and water-quality station (05427943).
Seven shallow groundwater and soil sampling sites were established within and near the airport. Two of the sites were upgradient from airport activities: one off airport property to the west (S1) and one immediately northwest of airport property (Z1). The remaining five sites were concentrated near where fireworks were launched in July 2021 (fig. 1). One of these sites (A3) was immediately east of the end of the primary runway. Four locations were near the 2021 fireworks launch site; two (A1 and A2) were on airport property, and two (Z2 and Z3) were on adjacent farmland to the east.
Collection and Processing of Samples
Water and soil samples were collected from May 23 to July 19, 2022. In total, 74 samples were collected and processed for analysis. After collection and processing, samples were kept on ice in coolers until being delivered or shipped to the analyzing laboratories (within 2 days of sample collection). Details pertaining to the collection and processing of samples from groundwater, surface water, shallow groundwater, and soil are described in the next section.
Groundwater Samples
Groundwater wells were sampled on May 31 and June 1, 2022, to determine the water-quality characteristics of the underlying aquifer. Water samples were collected from outdoor faucets at private homes because they were easily accessible, and the water supplied there is typically not connected to whole-house water treatment systems and should therefore be representative of groundwater. Before sampling, volunteer homeowners were asked whether their outdoor faucets were treated or untreated, and all responded that the water was untreated to the best of their knowledge. A total of 12 samples collected from groundwater wells were analyzed for physical properties (pH and specific conductance), inorganics (acid neutralizing capacity, nitrate plus nitrite nitrogen [nitrate], and chloride), perchlorate, metals, and GRO and BTEX compounds, and sample-bottle blanks and trip blanks were collected as part of the study (tables 1, 3, 4, 5, and 6; Mueller and others, 2015). Water from 6 of the 12 wells was also analyzed for low-level lead concentrations and lead isotopes (Schachter and Stuntebeck, 2024). The two upgradient wells and four spatially distributed downgradient wells were selected for the additional lead-isotope analysis.
Table 3.
Blank and replicate samples collected within and near the Middleton Municipal Airport, Middleton, Wisconsin, 2022.[USGS, U.S. Geological Survey; µS/cm, microsiemens per centimeter at 25 degrees Celsius; mg/L, milligram per liter; CaCO3, calcium carbonate; µg/L, microgram per liter; GW, groundwater; --, not analyzed; <, less than; SGW, shallow groundwater; Br, branch; Trib, Tributary; Rd, Road; nr, near; WI, Wisconsin; SW, surface water]
Table 4.
Additional blank and replicate samples collected within and near the Middleton Municipal Airport, Middleton, Wisconsin, 2022.[USGS, U.S. Geological Survey; µg/L, microgram per liter; mg/L, milligram per liter; µg/g, microgram per gram; GW, groundwater; --, not analyzed; <, less than; SGW, shallow groundwater; Br, branch; Trib, Tributary; Rd, Road; nr, near; WI, Wisconsin; SW, surface water]
Table 5.
Constituent concentrations and statistical summary of water-quality data for samples collected from groundwater wells near the Middleton Municipal Airport, Middleton, Wisconsin, May 31 and June 1, 2022.[USGS, U.S. Geological Survey; µS/cm, microsiemens per centimeter at 25 degrees Celsius; mg/L, milligram per liter; CaCO3, calcium carbonate; µg/L, microgram per liter; GW, groundwater; <, less than]
Table 6.
Additional constituent concentrations and statistical summary of water-quality data for samples collected from groundwater wells near the Middleton Municipal Airport, Middleton, Wisconsin, May 31 and June 1, 2022.[USGS, U.S. Geological Survey; µg/L, microgram per liter; mg/L, milligram per liter; GW, groundwater; <, less than; --, not analyzed]
USGS National Field Manual (NFM) procedures were used to measure field values and collect groundwater samples (U.S. Geological Survey, variously dated). Upon arriving at each home, an outside faucet was turned on and water was purged through a hose while preparing sampling equipment. Teflon-lined polyethylene sample tubing that was precleaned following NFM procedures was then connected to the outdoor faucet with a threaded, nylon connector while the other end of the tubing was connected to a flowthrough chamber with an attached multiparameter, water-quality sonde (figs. 2 and 3). Water was discharged through the flowthrough chamber at rates ranging between about 2.6 and 7.5 gallons per minute while parameters from the water-quality sonde were recorded (temperature, pH, dissolved oxygen, specific conductance, and turbidity) until the values stabilized. The field manual indicates purging three or more well volumes of standing water before sample collection, but because the wells were presumed to be in use by homeowners every day, parameter stabilization was substituted as the sampling threshold.
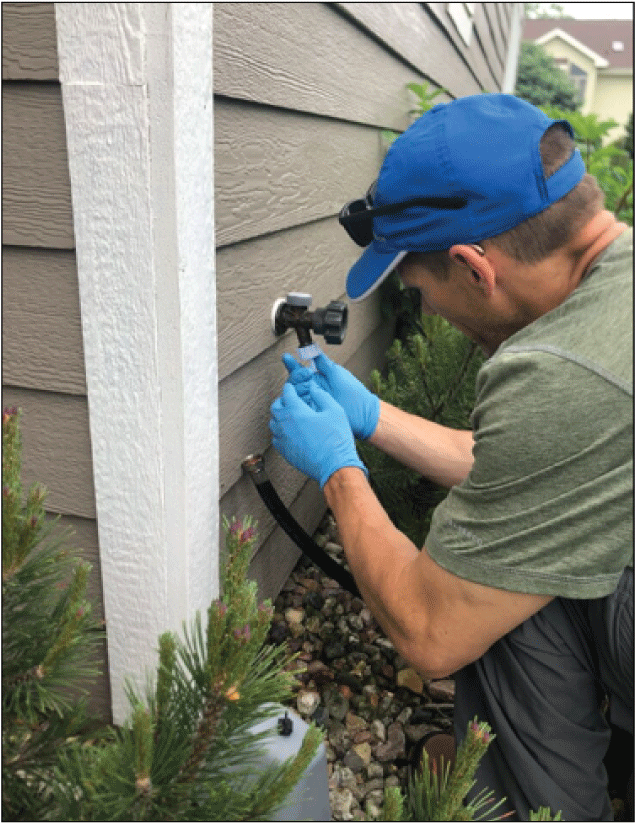
Photograph showing scientist preparing to collect samples of groundwater from a home near the Middleton Municipal Airport, Middleton, Wisconsin, 2022.
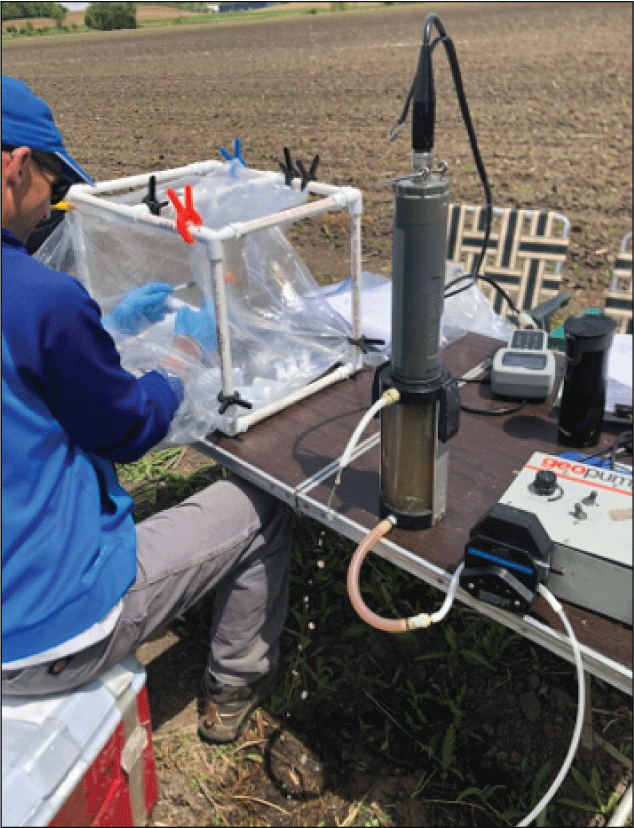
Photograph showing scientist preparing to collect samples of shallow groundwater near the Middleton Municipal Airport, Middleton, Wisconsin, 2022.
After the parameters stabilized, sample tubing was disconnected from the flowthrough chamber and pumped water was dispensed into prelabeled bottles provided by the laboratories inside a clean sample-processing chamber (fig. 3). To avoid environmental contamination, a clean hands/dirty hands sampling technique was used. This sampling technique included using tubing cleaned according to the NFM at every location, new gloves, and a new sample-processing chamber.
Samples analyzed for physical properties and inorganics were collected in 1-quart and 60-milliliter (mL) high-density polyethylene (HDPE) bottles, whereas samples for perchlorate analysis were collected in 200-mL HDPE bottles. Samples for metals analysis were collected in 250-mL HDPE bottles and then acidified in the field with 1.25 mL of 0.5-percent nitric acid. Samples for GRO and BTEX analysis were collected in preacidified (hydrochloric acid), 40-mL, septum-capped glass bottles filled to the top with no air space, per laboratory instructions. Samples analyzed for low-level lead and lead isotopes were collected in 1-liter Teflon bottles. In a clean laboratory environment, concentrated Optima trace-metal-grade nitric acid was added to the low-level lead and lead-isotope sample bottles at about 1 mL per 50 mL of sample water.
Surface-Water Samples
Streamflow samples were collected during base flow conditions and during a rainfall-runoff event to characterize the surface-water resources within and near the airport. Base flow samples were collected on June 13 and July 19, 2022, from three of the four surface-water stations (station AR does not have base flow). On June 8–9, 2022, multiple samples were collected at each of the four monitoring stations during a rainfall-runoff event generated by about 1 inch (in.) of rainfall (U.S. Geological Survey, 2023). A total of 26 samples were analyzed for perchlorate and metals, 22 samples were analyzed for GRO and BTEX compounds, and 11 samples were analyzed for low-level lead concentrations and lead isotopes (tables 7 and 8; app. 1, tables 1.1 and 1.2; Schachter and Stuntebeck, 2024).
Table 7.
Statistical summary of concentrations for surface-water samples collected near Middleton Municipal Airport, Middleton, Wisconsin, June 2022.[USGS, U.S. Geological Survey; µg/L, microgram per liter; mg/L, milligram per liter; nr, near; WI, Wisconsin; SW, surface water; <, less than; Br, branch; Trib, Tributary; Rd, Road]
Table 8.
Statistical summary of additional concentrations for surface-water samples collected near Middleton Municipal Airport, Middleton, Wisconsin, June 2022.[USGS, U.S. Geological Survey; µg/L, microgram per liter; mg/L, milligram per liter; nr, near; WI, Wisconsin; SW, surface water; <, less than; Br, branch; Trib, Tributary; Rd, Road]
Each surface-water monitoring station contained instrumentation to measure the water level in the stream and an automated sampler (fig. 4A) to pump water samples into 350-mL cylindrical glass bottles via Teflon-lined tubing (fig. 4B). Autosampler pumping was triggered either remotely via cellular communications or by rate of water-level change in the stream. The glass sample bottles were collected from the automated samplers within 30 hours of being pumped. Bottles were labeled, placed into a cooler with ice, and transported back to a USGS laboratory facility for processing and preservation.
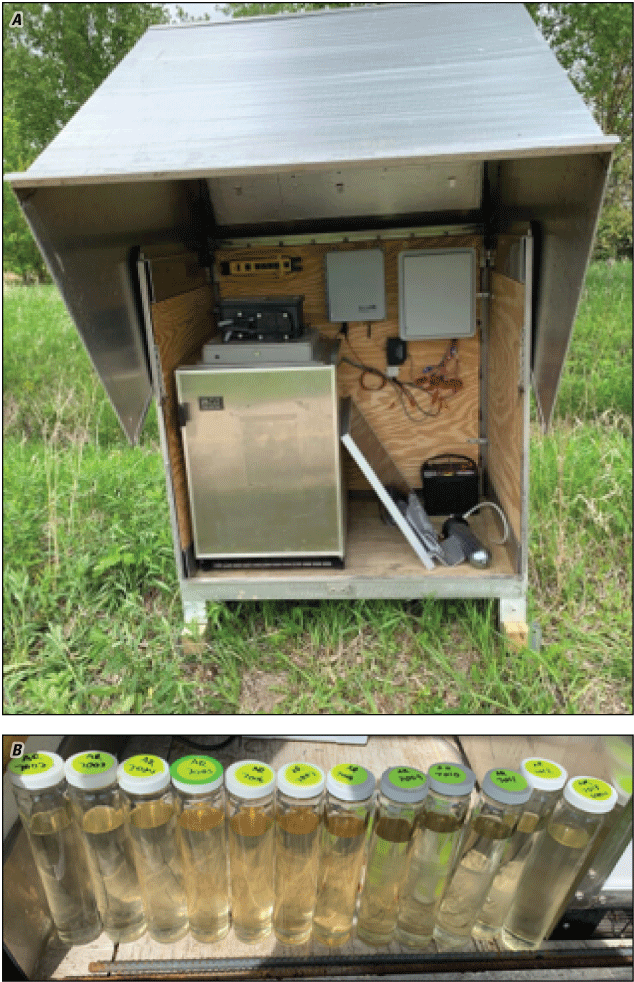
Photographs showing equipment used to collect surface-water samples at monitoring stations near the Middleton Municipal Airport, Middleton, Wisconsin. A, Water-quality monitoring equipment, including an autosampler. B, Water samples collected in glass bottles from an autosampler during a rainfall-runoff event on June 8, 2022. Metals and perchlorate were analyzed from a subset of the samples collected in glass bottles, and gasoline range organics; benzene, toluene, ethylbenzene, and xylene; and lead isotopes were analyzed from manually collected samples.
Samples from the automated sampler were selected for perchlorate and metals analyses from the larger subset of total collected samples to target the rising limb, near peak, and falling limb of the rainfall-runoff hydrograph, resulting in five samples per station. Selected samples were shaken vigorously and poured from the glass bottles into the prepared laboratory bottles described in the “Groundwater Samples” section.
GRO and BTEX compounds can volatilize, so all samples analyzed for GRO and BTEX compounds were manually collected by dipping a 1-liter glass beaker directly into the stream. From this beaker, preacidified, septum-capped bottles supplied by the laboratory were then filled completely and capped, leaving no air space for volatilization. Four samples were collected per station, mostly near the peak and on the falling limb of the rainfall-runoff hydrograph.
Low-level lead and lead-isotope samples were collected during rainfall runoff concurrently with some of the GRO and BTEX samples to represent near-peak and recession limbs of the hydrograph. Samples were collected by dipping a laboratory-cleaned Teflon bottle directly into the stream and then capping and placing it in a cooler with ice to be acidified, as described in the “Groundwater Samples” section, to minimize contamination risk.
Base flow samples were collected for perchlorate and metals analyses by triggering a sample from the automated sampler. Base flow samples for GRO and BTEX compounds, low-level lead concentration, and lead-isotope analysis were collected using the same methods as described previously for rainfall-runoff sample collection.
Shallow Groundwater Samples
Shallow groundwater samples were collected on May 23–24, 2022, from temporary wells installed at seven locations within and near the airport. A rotary hammer was used to drive a 1-ft, stainless-steel (types 304 and 316), wire-wound, screened drive point (0.0001-in. screen spacing) attached to 5-ft sections of 1 1/4-in.-diameter galvanized steel pipe to depths ranging from 5 to 15 ft. The drive point and the galvanized stainless-steel pipes were rated for potable water (ASTM International, 2016, 2023). Depth to water in the temporary wells ranged from 2 to 11 ft. At location Z1, despite its proximity to a flowing intermittent stream, no water was detected, so no water samples were collected. Six shallow groundwater samples were analyzed for physical properties, perchlorate, metals, and GRO and BTEX compounds (tables 9 and 10). Three spatially distributed samples were analyzed for low-level lead concentrations and lead isotopes (Schachter and Stuntebeck, 2024).
Table 9.
Constituent concentrations and statistical summary of water-quality data for samples collected from shallow groundwater wells within and near the Middleton Municipal Airport, Middleton, Wisconsin, May 23–24, 2022.[USGS, U.S. Geological Survey; µS/cm, microsiemens per centimeter at 25 degrees Celsius; mg/L, milligram per liter; CaCO3, calcium carbonate; µg/L, microgram per liter; SGW, shallow groundwater; <, less than]
Table 10.
Additional constituent concentrations and statistical summary of water-quality data for samples collected from shallow groundwater wells within and near the Middleton Municipal Airport, Middleton, Wisconsin, May 23–24, 2022.[USGS, U.S. Geological Survey; µg/L, microgram per liter; SGW, shallow groundwater; <, less than; --, not analyzed]
Methods used to collect shallow groundwater samples followed those for homeowner groundwater wells, except a peristaltic pump was used to extract water from slightly above the bottom of the well pipe into the flowthrough chamber where a multiparameter probe recorded physical properties of temperature, pH, oxygen, conductivity, and turbidity. After three or more well volumes were purged and parameter values had stabilized, pumped water was dispensed into prepared laboratory bottles inside a clean field sample-processing chamber using clean tubing and clean gloves, as described in the “Groundwater Samples” section.
Soil Samples
Soil samples were collected from seven sites on May 23 and 24, 2022, near where the shallow groundwater samples were collected. Samples were collected at two depth horizons—1 and 2 ft deep—by digging a small hole with a metal shovel. In total, 14 soil samples were analyzed for soil moisture content, perchlorate, metals, and GRO and BTEX compounds and 4 spatially distributed samples were analyzed for low-level lead concentrations and lead isotopes (tables 11 and 12; Schachter and Stuntebeck, 2024).
Table 11.
Constituent concentrations and statistical summary of soil samples collected within and near the Middleton Municipal Airport, Middleton, Wisconsin, May 23–24, 2022.[USGS, U.S. Geological Survey; mg/kg, milligram per kilogram; <, less than]
Table 12.
Additional constituent concentrations and statistical summary of soil samples collected within and near the Middleton Municipal Airport, Middleton, Wisconsin, May 23–24, 2022.[USGS, U.S. Geological Survey; mg/kg, milligram per kilogram; µg/kg, microgram per kilogram; <, less than; --, not analyzed]
Soil samples for metals, perchlorate, and low-level lead and lead-isotope analysis were collected with a modified plastic sample bottle to minimize any potential metals contamination from the metal shovel. Soil samples for metals analysis were dispensed into a 250-mL HDPE bottle (about one-fourth full, per laboratory instructions). Soil samples for perchlorate analysis were dispensed into two 150-mL glass jars (one filled amber jar and one half-filled clear jar). Soil samples for low-level lead and lead isotope analysis were dispensed into 30-mL Nalgene polypropylene plastic jars.
Soil samples for GRO and BTEX analysis were collected by inserting a laboratory-provided sampling device horizontally into the soil profile and extracting a 1/2-in. by 3/4-in. cylindrical-shaped core of material. The soil cores were then dispensed into laboratory-prepared 40-mL glass vials containing methanol as a preservative.
Sample Analyses
Water and soil samples were analyzed for perchlorate at SGS Laboratories in Orlando, Florida, using high-performance liquid chromatography-mass spectrometry following EPA method 6850 (U.S. Environmental Protection Agency, 2007). Organic compounds were analyzed at RTI Laboratories in Livonia, Michigan, using EPA methods 8260C and 8015D (U.S. Environmental Protection Agency, 2003, 2006).
Water and soil samples were analyzed for physical properties, metals, low-level lead concentrations, and lead isotopes at the Wisconsin State Laboratory of Hygiene (WSLH) in Madison, Wis. A qualitative scan for total recoverable metals concentrations in water samples used inductively coupled plasma-optical emission spectroscopy following a modified version of EPA method 200.7, revision 5.1, 2001 (U.S. Environmental Protection Agency, 2001). Metals concentrations in soil samples were determined using the same detection method, but soil samples were first prepared for analysis following EPA method SW846, section 3050B (U.S. Environmental Protection Agency, 1996a).
In addition to the qualitative scan, a more precise analysis of a subset of water and soil samples was completed that allowed discrimination between different isotopes of lead and detection of lower concentrations of lead than the qualitative scan. These analyses were completed in a trace-element clean laboratory at WSLH using a high-resolution multicollector with sector-field inductively coupled plasma and mass spectrophotometer following methods described in Scott and others (2022). The low-level analysis allowed the quantification of lead in samples that may have been less than the limit of detection (LOD) for the qualitative scan (5 µg/L), and the isotope analysis was used to determine potential sources of lead.
Isotopic ratios of lead (Pb) can be used to compare samples to environmental references. For this study, ratios of 207Pb/206Pb and 208Pb/206Pb for collected water and soil samples were compared to several environmental sources of lead and their established isotopic ratios, including the following:
-
• Rainfall samples collected in 2021 at the University of Wisconsin-Madison Arboretum, about 6.5 mi southeast of the airport (Schachter and Stuntebeck, 2024);
-
• Wisconsin galena lead ore, mined in southwestern Wisconsin and used in the manufacturing of products (such as lead shot, lead tire weights, and lead pipes; Schachter and Stuntebeck, 2024);
-
• Bituminous coal fly ash Standard Reference Material 1633b (National Institute of Standards and Technology, 2023);
-
• Leaded aviation fuel (Avgas 100LL) collected from the airport (Schachter and Stuntebeck, 2024); and
-
• Lead-based paint (Wang and others, 2022).
These environmental references were used to determine the most likely sources of lead in water and soil samples collected within the airport study area. For this analysis, samples demonstrating lead isotopic signatures matching arboretum rainwater were considered to be derived from background atmospheric lead deposition, which included historical and recent emissions from coal burning, ore smelting, wood burning, and lead-based gasoline combustion (Graney and others, 1995; Sherman and others, 2015).
Quality Assurance and Quality Control
Sample-bottle blanks and trip blanks were collected as part of the study (tables 3 and 4; Mueller and others, 2015). Sample-bottle blanks to be analyzed for physical properties, perchlorate, metals, and GRO and BTEX compounds were collected in the field using nitrogen-purged, volatile organic compound/pesticide-grade water, whereas sample-bottle blanks to be analyzed for low-level lead used ultrapure Type I water (as defined by ASTM International [formerly, the American Society for Testing and Materials]) provided by the WSLH. Trip blanks of bottles provided by RTI Laboratories containing blank water were analyzed for GRO and BTEX compounds.
All blank sample analyses returned concentrations of perchlorate, metals, and GRO and BTEX compounds less than detection levels except for aluminum and strontium in the blank sample at MW–S1. The laboratory chemist noted that laboratory contamination had been previously determined to occasionally affect these two analytes. As a result, concentrations of aluminum and strontium greater than the detection limit and less than five times the maximum observed in the contaminated quality-control samples were qualified in this report (Mueller and others, 2015).
Split replicates for low-level lead and lead-isotope analysis were subdivided from three water samples—one each for groundwater, shallow groundwater, and surface water—and one soil sample (tables 3 and 4; Schachter and Stuntebeck, 2024). Relative percentage difference (RPD) was calculated as the difference in concentration between the environmental sample and replicate sample divided by mean concentration of the 2, multiplied by 100 for each environmental and replicate pair. The RPD for water sample replicates ranged from 0.4 to 4.3 percent, whereas the RPD for the replicate soil sample was 7.0 percent.
A subset of water and soil samples was analyzed for lead concentrations using two laboratory methods (qualitative scan and low level), allowing a comparison to determine discrepancies between analysis methods or field sample collection techniques. Six groundwater samples were analyzed using both methods, but all lead concentrations were less than the qualitative scanning method laboratory LOD, so no direct numerical comparisons were available (table 5). One of three shallow groundwater samples analyzed using both methods had concentrations of lead greater than the LOD for the qualitative scan. The qualitative scanning method resulted in a lead concentration of 54.7 µg/L, whereas the low-level concentration was 46.8 µg/L (tables 9 and 10). This RPD (16 percent) was likely due to the sample collection process because each sample was collected at slightly different times into separate bottles. Four soil samples were analyzed using both laboratory methods. Concentrations were generally similar between methods, averaging 12.3 milligrams per kilogram (mg/kg) for the qualitative scanning method and 10.7 mg/kg for the low-level method; however, the RPD between individual samples ranged from 2 to 78 percent (tables 11 and 12). These differences were likely due to heterogeneity of particles within a soil sample (and thus, heterogeneity of the distribution of lead therein) and the method of collection (two separate, adjacent samples). The differences did not affect the overall interpretation of lead in shallow groundwater or soil samples for the airport study area.
Concentrations of lead in four paired surface-water samples indicated differences between samples analyzed using the qualitative scanning method and those using the low-level method. Although 11 surface-water samples were analyzed for lead using the qualitative scanning and low-level analysis methods, only 4 pairs of concentrations could be compared because concentrations were less than the LOD for the qualitative scanning method for the remaining 7 pairs. Samples with concentrations greater than the LOD for the qualitative scanning method LOD were greater by an order of magnitude, averaging about 6 µg/L compared to an average of about 0.6 µg/L for the low-level method (tables 7 and 8; app. 1, tables 1.1 and 1.2).
The timing of sample collection differed between surface-water samples collected for qualitative scan of lead and those collected for the low-level analysis (app. 1, tables 1.1 and 1.2). Samples analyzed using the qualitative scanning method were collected by an autosampler in which water was periodically pumped from the stream and conveyed into a glass bottle via Teflon-lined sample tubing. Samples analyzed using the low-level analysis method were manually collected by dipping a laboratory-prepared Teflon bottle into the stream. Because the timing of sample collection between the autosamples and the manual samples was not concurrent, samples were selected for comparison with dates and times that most closely matched. Time differences between the autosample and the grab sample ranged from 5 minutes to more than 5 hours.
The difference in collection times between comparison samples could explain some of the differences in concentrations of lead between the two analysis methods, but not all differences. The concentrations of lead in all surface-water samples collected by the autosampler ranged from less than 5.00 to 10.0 µg/L, whereas the samples collected manually ranged from 0.03 to 1.13 µg/L. Assuming that the laboratory analyses and result reporting were correct, this indicates that samples collected by the autosampler may have been contaminated with lead. Sample and bottle blanks were to be collected in late 2022 and again in the second field season in 2023, but these did not happen because of a change in project scope and duration; therefore, the source of lead and method of contamination (sample tubing, sample bottles, and so on) were not determined.
The differences in lead concentrations in surface-water samples analyzed by the qualitative scanning method and the low-level method do not affect interpretations of lead in surface water for this report: stable isotope ratios (and subsequent source attribution) were the primary source of data for interpretations. These differences likely only affect lead concentrations in samples collected by the autosampler. Affected sample concentrations are censored in tables 7 and 8 and appendix 1 (tables 1.1 and 1.2). The concentrations reported by the low-level analysis method are likely the best representation of lead concentrations in surface-water samples in the airport study area, and the lead concentrations from the qualitative scanning method were excluded from the analysis.
Detection of Perchlorate, Metals, and Organic Compounds and Lead-Isotope Ratios Within and Near the Middleton Municipal Airport
Groundwater, surface-water, shallow groundwater, and soil samples were collected from 23 monitoring locations within and near the airport in May, June, and July 2022. The following sections describe sample concentrations of perchlorate, metals, GRO and BTEX compounds, selected inorganics and physical properties, and isotopes of lead in 60 water samples and 14 soil samples. Discrete sample concentrations and statistical summaries for groundwater, shallow groundwater, and soils are listed in tables 5, 6, 9, 10, 11, and 12. A statistical summary of concentrations in surface-water samples is provided in tables 7 and 8, and the complete concentration list is presented in appendix 1 (tables 1.1 and 1.2). Results are also available in the USGS National Water Information System database (U.S. Geological Survey, 2023). Low-level lead concentrations and lead-isotope results are available in the associated data release for this report (Schachter and Stuntebeck, 2024).
Characterizing Groundwater Wells
All groundwater samples were collected from outdoor faucets that, to the best of the knowledge of the homeowners, were untreated and not connected to any whole-house treatment system such as a water softener, iron curtain, or reverse-osmosis filtration system. In addition to the suite of constituents targeted for this study, groundwater samples were also analyzed for nutrients and physical properties to determine if groundwater at household faucets was relatively homogeneous and untreated (tables 5 and 6).
Groundwater sites MW–6 and MW–8 had low calcium concentrations (less than 1 milligram per liter [mg/L]) and magnesium concentrations (less than laboratory levels of detection of 0.2 mg/L), relative to the other 10 sites, which averaged 82 and 43 mg/L, respectively. These two sites also had relatively high sodium concentrations of 315 and 223 mg/L, respectively, whereas all other sites averaged about 11 mg/L. Low concentrations of calcium and magnesium, coupled with high concentrations of sodium, are characteristic of softened water. Calcium and magnesium are the primary ions that contribute to hardness and are removed during the water softening process and replaced with sodium (Minnesota Department of Health and Minnesota Pollution Control Agency, 2019). Thus, samples from MW–6 and MW–8 were likely affected by a water treatment system and are not fully representative of the underlying groundwater.
Of the 12 groundwater wells, 4 had nitrate concentrations greater than the EPA MCL of 10 mg/L (U.S. Environmental Protection Agency, 2009), whereas 5 wells had concentrations less than the LOD (table 5). No correlation was noted between nitrate concentration and well location or casing depth as listed in well-construction reports. One explanation for the variability in nitrate concentrations could be a water treatment system that was connected to the outside faucet where samples were collected. However, installing such a system for an entire house is generally cost prohibitive; usually, these are installed only at the point of use in a kitchen. Therefore—other than the evidence for water softening, as discussed previously—any variations in nitrate and other constituents among the sites are unlikely due to water treatment. An alternative explanation for these variations could be the preferential flow paths within the Wonewoc Formation and, thus, the potential for different contributing areas for each well (Parsen and others, 2016; Hunt and Steuer, 2000). A potential nitrate source could have been from fertilizer or manure applications to upgradient agricultural fields. An additional nitrate source could have been from leaking septic systems because all the homes sampled in this study have septic tanks. Discriminating between different sources of nitrate was beyond the scope of this study.
Several samples had arsenic concentrations greater than the laboratory LOD (7 mg/L), and one sample (MW–8) was greater than the EPA MCL of 10 mg/L (U.S. Environmental Protection Agency, 2009). Arsenic is a known contaminant in many groundwater aquifers across Wisconsin (Schmidt, 2016). Concentrations of arsenic can become elevated when aquifers are depleted and oxygenated (Fienen and Arshad, 2016).
Perchlorate
Groundwater
Perchlorate was detected at concentrations greater than the laboratory reporting limit (0.2 µg/L) in samples from 6 of the 12 groundwater sampling sites; concentrations ranged from less than 0.2 to 1.5 µg/L and the median concentration was about 0.3 µg/L (table 6). Of the six detections, five were in Highwood Circle Estates and one was upgradient from the airport. The highest concentration of 1.5 µg/L measured in Highwood Circle Estates (MW–9) was the only groundwater sample that exceeded the Wisconsin public health enforcement standard of 1 µg/L (Wisconsin Department of Natural Resources, 2023b).
Surface Water
The highest perchlorate concentrations among the four surface-water sampling stations were observed at station AR on the southeastern side of the airport with a maximum of 2.2 µg/L (fig. 5; table 8; app. 1, table 1.2). The laboratory reporting limit was 0.2 µg/L for four samples, but for the other three samples, the reporting limit was 1 µg/L. These varying reporting limits were the result of the laboratory completing a dilution because of sample matrix interference. All five perchlorate concentrations at station AR were higher than every concentration greater than reporting limits at the other three surface-water stations. The highest concentration at station AR was detected just before the peak of the June 8–9, 2022, rainfall-runoff event; conversely, the highest concentrations at station NF were measured during base flow sampling. The lowest reported concentrations were measured at station TP west of the airport.
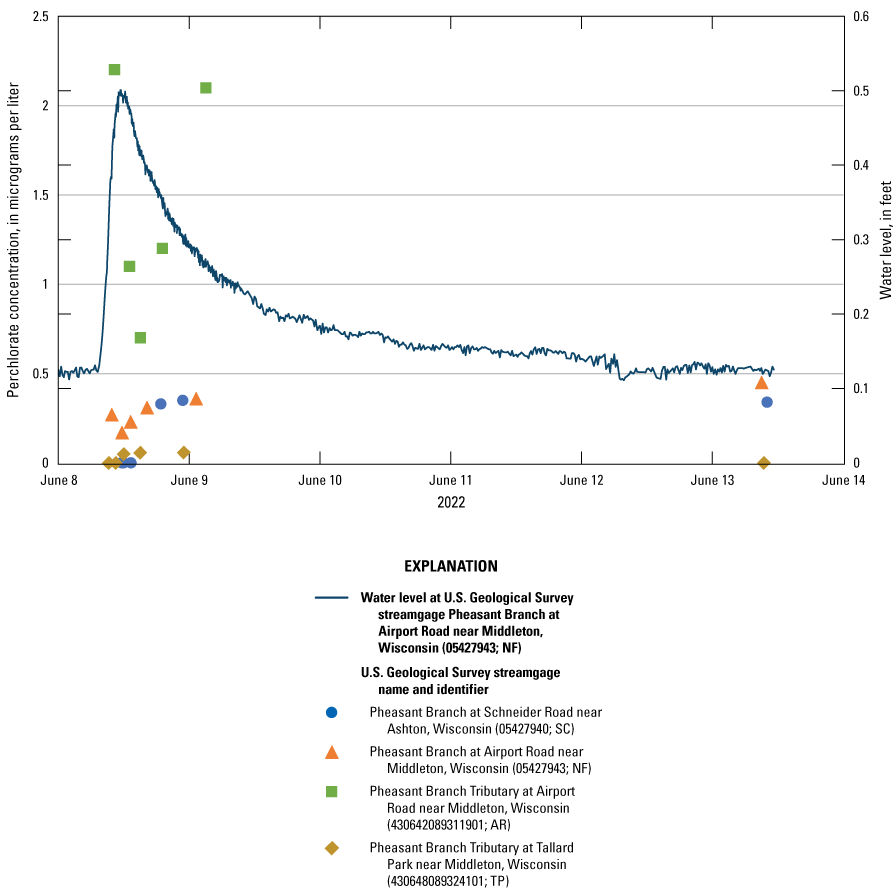
Graph showing perchlorate concentrations in surface-water samples collected during a rainfall-runoff event on June 8, 2022, and during base flow conditions on June 13, 2022, near the Middleton Municipal Airport, Middleton, Wisconsin. Concentrations shown at zero were less than laboratory detection limits. Water levels are presented for the NF station only, but they are representative of water-level changes observed at the other surface-water stations.
Shallow Groundwater and Soil
All six shallow groundwater samples had perchlorate concentrations less than the laboratory reporting limit (table 10). The laboratory reporting limit was 0.2 µg/L for one sample, but for the other five samples, the reporting limit was 1 µg/L. These varying reporting limits were the result of the laboratory completing a dilution because of sample matrix interference. All but 1 of the 14 soil samples had perchlorate levels less than the reporting limit (table 12), which varied from 1.8 micrograms per kilogram (µg/kg) to 2.6 µg/kg because different masses of soil samples were used for each analysis. The shallow soil sample from site Z3 had a reported concentration of 0.7 µg/kg.
Perchlorate Implications
Perchlorate concentrations were greater than the Wisconsin public health enforcement standard of 1 µg/L (Wisconsin Department of Natural Resources, 2023b) for 1 groundwater sample and 4 surface-water samples (of 44 total samples). The highest of these measurements, 2.2 µg/L at surface-water station AR, was about 15 to 100 times lower than those detected in other studies that evaluated the effects of repeated fireworks displays to surrounding water resources. For example, after annual Fourth of July fireworks displays from 1998 to 2009 at Mount Rushmore National Memorial, Hoogestraat and Rowe (2016) detected perchlorate concentrations of as much as 54 µg/L in the nearby surface waters and as much as 38 µg/L in groundwater. Andrews and others (2021) determined that 50 years of annual fireworks displays in Evart, Mich., resulted in a maximum concentration of perchlorate in monitoring wells of 240 µg/L.
Higher concentrations of perchlorate at station AR relative to the other surface-water stations, coupled with the proximity of station AR to the fireworks launched in July 2021 (fig. 1), indicate that fireworks were a likely source of perchlorate in the surface drainage at the southeastern side of the airport. Detectable concentrations 1 year after the fireworks launch were consistent with prior research demonstrating that perchlorate can be persistent in the environment for years (Massachusetts Department of Environmental Protection, 2007).
Concentrations of perchlorate measured at the other three surface-water stations distant from the fireworks launch location and at one groundwater station upgradient from the fireworks launch location indicate that perchlorate sources other than fireworks were in the airport study area. A potential source of perchlorate in the airport study area (other than fireworks) could be from fertilizer. Most of the land use in the Pheasant Branch drainage basin upstream from Schneider Road is used to grow crops to support livestock production (U.S. Department of Agriculture, National Agricultural Statistics Service, 2024). Although research indicates that some amount of perchlorate occurs naturally in the environment, most perchlorate not from rocket fuels or fireworks is sourced from commercial fertilizers derived from rock deposits and minerals (Susarla and others, 1999). Synthetic fertilizers have also been determined to have some amount of perchlorate present, possibly from chemicals used in the manufacturing process (Susarla and others, 1999).
Metals
Groundwater
All metals detected in groundwater samples were less than drinking water enforcement standards, except for arsenic (U.S. Environmental Protection Agency, 2009; Wisconsin Department of Natural Resources 2023b; tables 5 and 6). One sample at groundwater well MW–8 had an arsenic concentration of 10.5 µg/L, greater than the EPA MCL of 10 µg/L. Several metals (beryllium, chromium, molybdenum, selenium, silver, thallium, and titanium), including some that are commonly associated with fireworks, were not detected in any groundwater wells.
No spatial pattern in groundwater concentrations of metals commonly associated with fireworks was discernable. For example, barium was detected in similar concentrations in groundwater wells upgradient from the airport (mean of 63.3 µg/L) and downgradient in Highwood Circle Estates (mean of 47.0 µg/L). Additionally, potassium was detected at all groundwater wells, and the highest potassium concentration (3.28 mg/L at MW–Z1) was detected upgradient from the airport.
Surface Water
Metals concentrations in surface-water samples varied among constituents and collection locations, but some patterns were evident (tables 7 and 8; fig. 6; app. 1, tables 1.1 and 1.2). Beryllium, lithium, selenium, silver, and thallium concentrations were less than laboratory detection levels for all samples. For most other metals, the highest maximum and mean concentrations relative to other surface-water stations were measured at station SC upstream from the airport. The next highest concentrations for most metals were measured at station NF, whereas concentrations at station TP were generally lowest among all surface-water stations.
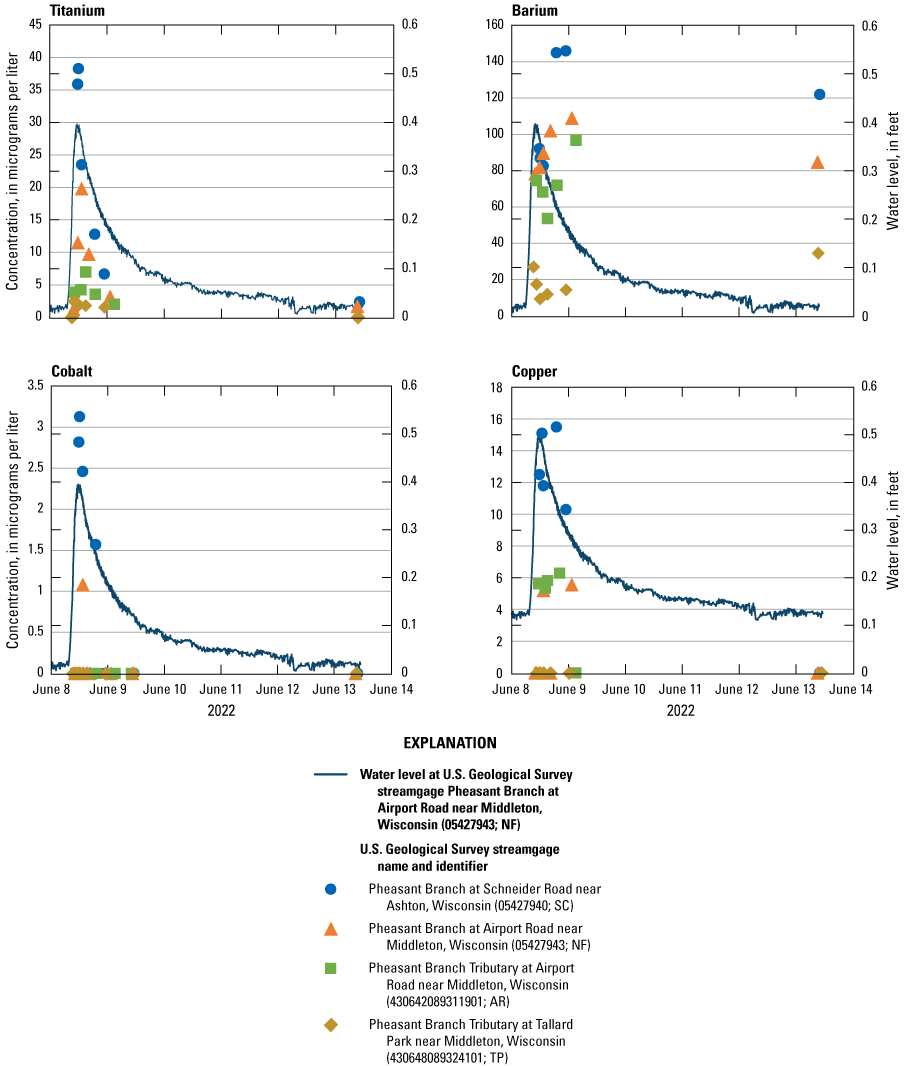
Graphs showing concentrations of selected metals in surface-water samples collected during a rainfall-runoff event on June 8, 2022, and during base flow conditions on June 13, 2022, near the Middleton Municipal Airport, Middleton, Wisconsin. Sample concentrations shown at zero are less than laboratory detection limits. Water levels are presented for the NF station only, but they are representative of water-level changes observed at the other surface-water stations. Some symbols may be overlapping and not visible.
Metals concentrations from station AR were generally more variable than at the other stations. For some metals such as cobalt, iron, manganese, and titanium, median concentrations at station AR were comparatively low and more like those measured at station TP. However, median concentrations at station AR for many of the remaining metals were more like those from station NF.
Shallow Groundwater
Metals in shallow groundwater samples had a distinct pattern with respect to sampling location (tables 9 and 10). Concentrations for 20 of 24 detected metals were highest at two sites, A3 and Z3 (fig. 7). In addition, concentrations of selenium, lead, and lithium were greater than detection limits only at these two shallow groundwater sampling sites. Only arsenic, sodium, potassium, and boron had no distinct pattern with respect to sampling location. Antimony, silver, and thallium were not detected at any shallow groundwater sites.
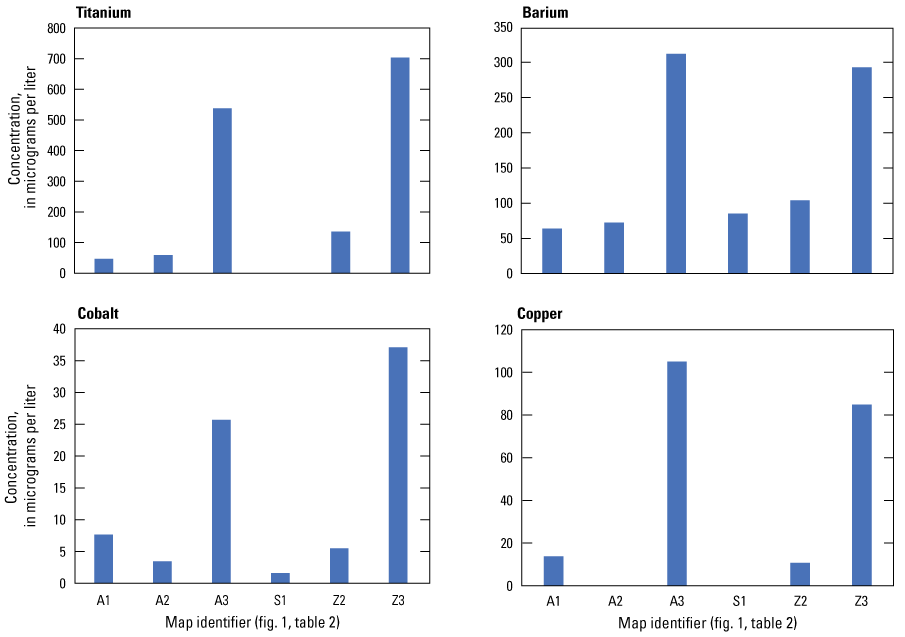
Graphs showing concentrations of selected metals in samples collected from shallow groundwater wells on May 22 and 23, 2022, within and near the Middleton Municipal Airport, Middleton, Wisconsin. Concentrations shown at zero were less than laboratory detection limits.
Use of stainless-steel drive points and galvanized-iron pipes could have contributed to higher concentrations of some of the metals measured in the shallow groundwater samples. Specifically, iron, zinc, nickel, chromium, manganese, and molybdenum are all known to be metallic components of these materials (ASTM International, 2016, 2023). However, the methods used to collect shallow groundwater samples were similar for all sites. Thus, the higher concentrations of these metals detected at sites A3 and Z3 are not fully attributable to the use of these materials. Additionally, higher concentrations of many other metals were also measured at these two shallow groundwater sites.
Soil
All metals analyzed—except selenium and silver—were detected at concentrations greater than the LOD within the soil samples (tables 11 and 12). Overall, metals concentrations between locations had more variability than between the samples collected at 1-ft and 2-ft depths at a single location. For 13 of the 25 metals detected, concentrations were highest at site Z1, on the western side of the airport, more than half a mile away from the 2021 fireworks launch site. Generally, the next highest metals concentrations were detected at sites A3 and Z3, including fireworks-associated metals such as arsenic, copper, and lithium. Metals concentrations for 20 of the 27 metals were lowest at site A1, on the northern side of the airport.
Overall, most metal concentrations in soils within and near the airport were similar to or lower than the global averages reported by Kabata-Pendias (2011). Antimony, arsenic, and thallium did have average concentrations in soil greater than the global average as reported by Kabata-Pendias. Concentrations of lead were less than the global average soil concentration (27 mg/kg), about an order of magnitude lower than what is defined as contaminated soils (Kabata-Pendias, 2011).
Metals Implications
No pattern was detected that would identify the 2021 fireworks display at the airport as a contributing source of fireworks-associated metals to groundwater wells or surface water on and near the airport. Groundwater samples had no discernable spatial pattern in concentrations of metals commonly associated with fireworks, and many metals were detected at or near their highest concentrations at sites upgradient from the airport and the fireworks launch site. Among surface-water stations, the highest metals concentrations were most frequently measured at station SC north of the airport, indicating an alternate source of metals to the surface waters within and near the airport other than the 2021 fireworks show at the airport.
A discernable pattern of metals concentrations was detected in the shallow groundwater samples collected within and near the airport. Concentrations of most metals in shallow groundwater samples were highest at sites A3 and Z3, including those commonly associated with fireworks such as barium, copper, lithium, and titanium. As shown in figure 1, the fireworks were launched near sampling location A2. On the evening of July 23, 2021, at about 9 p.m. central daylight time, wind speed at the airport was reported to be about 5 miles per hour from the south-southwest (National Weather Service, 2021). Assuming the fireworks were launched with a near-vertical alignment, debris could have landed near sampling location Z3 or farther northeast into the agricultural field. Because groundwater and surface water flow generally to the southeast in this area, fireworks debris (and associated metals) landing near Z3 could have been transported via overland runoff or in shallow groundwater flow across the airport property to sampling site A3 in the year between the launch and sample collection.
Surface-water station AR did not demonstrate the same pattern of high fireworks-associated metals concentrations relative to other surface-water stations, despite being the drainage point for the basin where fireworks were launched and landed. Metals, unlike perchlorate, possibly washed away in surface-water runoff or infiltrated to soil or shallow groundwater in the year after the fireworks display. Hoogestraat and Rowe (2016) also detected no increase in metals concentrations at the groundwater and surface-water sites that had high concentrations of perchlorate after annual Fourth of July fireworks displays at Mount Rushmore National Memorial. Fireworks could have contributed some metals to surface-water runoff at station AR, but the signal was not as obvious as in the shallow groundwater.
Organic Compounds
All concentrations of BTEX and GRO compounds in groundwater, shallow groundwater, and soils samples were less than laboratory detection levels (tables 6, 10, and 12). In all surface-water samples, benzene, ethylbenzene, and xylene were also less than detection level (table 8; app. 1, table 1.2). Toluene was detected in three of the four rainfall-runoff samples collected at surface-water station SC and in two of the four rainfall-runoff samples at station NF, and concentrations of all samples at those stations ranged from less than 1 to 3.4 µg/L and from less than 1 to 8.5 µg/L, respectively. GRO compounds were also detected in rainfall-runoff samples at surface-water stations SC (three of four samples), NF (two of four samples), and AR (one of four samples), but no detections were made in base flow samples; however, all detections were flagged as “estimated” by the laboratory because concentrations were less than the reporting limit but greater than the LOD.
Organics Implications
Toluene was the only organic compound measured in this study that had concentrations exceeding laboratory reporting limits. Toluene was only detected in surface water, and only in rainfall-runoff samples at stations SC and NF on Pheasant Branch upstream and downstream from the airport, respectively. Toluene was not detected in base flow samples, indicating that it was washed from the landscape during the rainfall-runoff event rather than contributed to the stream by groundwater. Although no toluene was detected in drinking water wells in this study, for reference, the Wisconsin drinking water standard is 800 µg/L—nearly 100 times greater than the maximum concentration detected in surface water (Wisconsin Department of Natural Resources, 2023b).
The potential spillage (and subsequent washoff during rainfall-runoff events) of aviation fuels and degreasers (Sulej and others, 2012) could be a source of toluene in the airport study area. The highest concentration was measured at station NF downstream from the airport near most of the aircraft support buildings. The nearest airport building was less than 100 ft away from the NF sampling location.
Concentrations of toluene were also detected at station SC upstream from the airport, indicating that airport activities were not the only possible source of toluene. Generalized agriculture and developed (urbanized) land uses were not likely significant sources because the TP basin also had substantial agriculture and development, but measured concentrations of toluene there were all less than laboratory detection limits. Fuels or oils deposited on roads by vehicles were also not a likely significant source: the SC and TP basins contain roads but concentrations were only detected at station SC. Localized activities upstream from the airport involving machinery or maintenance of machinery could be an additional source of toluene measured in the study area.
Lead Isotopes and Concentrations
A more precise analysis of a subset of water and soil samples was completed that allowed discrimination between different isotopes of lead and quantification of lower concentrations of lead than that of the qualitative metals analysis scan. Ratios of stable isotopes of lead were compared to references to aid in determining the most likely sources of lead in water and soil samples collected within the airport study area, whereas low-level lead analyses allowed for quantification of lead concentrations that may have been below the method detection limit for samples analyzed using the qualitative scan.
Groundwater
Of the 12 groundwater samples, 6 were tested for low-level lead concentrations and lead isotopes. Lead was detected at low concentrations in all six samples, ranging from 0.0433 to 0.956 µg/L (table 6; Schachter and Stuntebeck, 2024). No distinct spatial pattern was detected among lead concentrations in groundwater, upgradient or downgradient from the airport. The minimum and maximum concentrations of lead in groundwater were detected at the two wells upgradient from the airport; all lead concentrations in samples from Highwood Circle Estates fell within that range.
Isotopic ratios of lead in groundwater samples revealed a mix of lead sources (fig. 8A). Three groundwater samples had isotopic signatures matching background atmospheric lead deposition, two samples had isotopic signatures similar to Avgas 100LL, and one sample had an intermediate signature between Avgas 100LL and background atmospheric lead deposition (similar to lead-based paint). Of the two samples with signatures close to Avgas 100LL, one was in Highwood Circle Estates and one was upgradient from the airport.
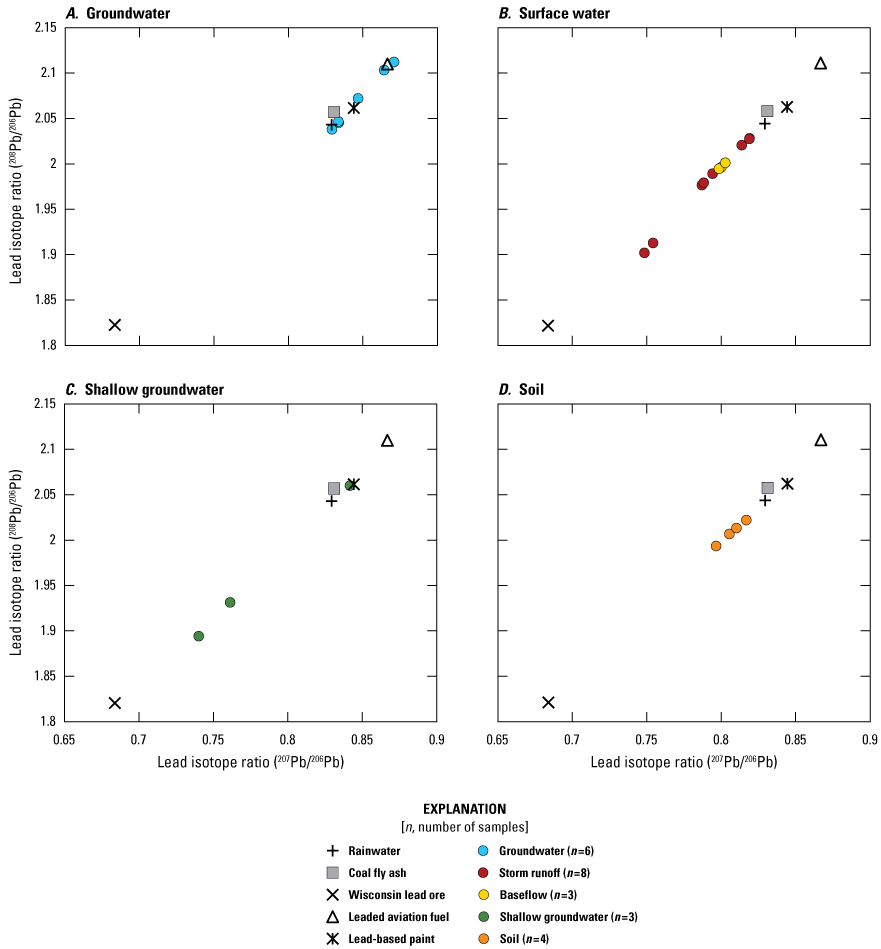
Graphs showing isotopic signatures of lead in samples of (A) groundwater, (B) surface water, (C) shallow groundwater, and (D) soil collected within and near the Middleton Municipal Airport, Middleton, Wisconsin, May and June 2022. Included with sample signatures are reference isotopic signatures of several potential sources of lead including local rainwater, coal fly ash, Wisconsin galena lead ore, leaded aviation fuel, and lead-based paint (Wang and others, 2022; National Institute of Standards and Technology, 2023; Schachter and Stuntebeck, 2024). Samples with isotopic signatures similar to rainwater and coal fly ash were considered background atmospheric lead deposition. Some symbols may be overlapping and not visible.
Surface Water
Of the 26 surface-water samples, 11 were tested for low-level lead and lead isotopes. Similar to the pattern observed with other metals, the highest concentrations of lead were measured at station SC; the median concentration was 0.911 µg/L (table 8; app. 1, table 1.2). Surface-water stations AR and NF had similar concentrations of lead with median concentrations of 0.251 and 0.219 µg/L, respectively, and surface water at station TP had the lowest median concentration of lead of 0.112 µg/L. Lead concentrations were lower during base flow conditions than during the rainfall-runoff event for each of the stations that had base flow (SC, NF, and TP).
The isotopic signatures of lead measured in surface-water samples indicate sourcing from a mixture of background atmospheric lead deposition and Wisconsin galena lead ore (fig. 8B). Most of the lead signatures in surface-water samples were more similar to background atmospheric lead deposition than to Wisconsin galena lead ore, except for two samples taken at station TP during the rainfall-runoff event, which more closely matched Wisconsin galena lead ore.
Shallow Groundwater
Three of the six shallow groundwater samples were tested for low-level lead and lead isotopes. Low-level lead concentrations in shallow groundwater samples were measured to be 0.860 µg/L at site A1, 0.041 µg/L at site S1, and 46.8 µg/L at site A3 (table 10).
Lead-isotope ratios for the sample taken at site S1 (upgradient from the airport) were most similar to background atmospheric lead deposition or lead-based paint, whereas isotope ratios from sites A1 and A3 on airport property seem to be a mix of background atmospheric lead deposition and Wisconsin galena lead ore (fig. 8C). Although the concentration of lead in shallow groundwater at site A3 was relatively high and that site is near the fireworks launch location, the source of lead in this sample could not be directly attributed to fireworks because reference isotopic signatures of any potential lead in fireworks were not available for comparison.
Soil
Of the 14 soil samples, 4 were tested for low-level lead and lead isotopes, with concentrations ranging from 5.42 to 21.3 mg/kg (table 12). Lead concentrations in soil samples were within the expected range of natural soils; the global mean soil lead content has been determined to be about 27 mg/kg (Kabata-Pendias, 2011).
All four soil samples tested had lead-isotope ratio signatures that were a mix of background atmospheric lead deposition and Wisconsin galena lead ore but more similar to background atmospheric lead deposition (fig. 8D). Little was different between soil samples collected on or off airport property with respect to lead-isotope ratios. Although the concentration of lead in the soil at site A3 was relatively high and that site is near the fireworks launch location, the source of lead in this sample could not be directly attributed to fireworks because reference isotopic signatures of any potential lead in fireworks were not available for comparison.
Potential Sources of Lead
Attributing lead in environmental samples to specific sources based on isotopic signatures is complex (Tuccillo and others, 2023). First, each sample is not necessarily homogeneous. For example, a surface-water sample may contain water sourced from base flow and rainfall runoff or a groundwater sample may contain water from varying sources (see “Characterizing Groundwater Wells” section). Each contributing water source could also have multiple sources of lead because of a mixing of lead in the environment. Therefore, each isotopic ratio represents a blend of lead sources; the most abundant source in the sample most strongly affects the resultant ratio. Second, the isotopic signatures for reference samples in figure 8A–D represent an average of several samples, but a relatively wide range of ratios can be identified for some of the sources, and thus, substantial overlap exists in isotopic signatures among some lead sources (Wang and others, 2022). This section describes the most likely sources of lead in water and soil samples collected within and near the airport from the information available within the scope of this study.
Ratios of stable lead isotopes in most water and soil samples collected within the airport study area indicate that lead was primarily sourced from background atmospheric lead deposition or Wisconsin galena lead ore. Of the 24 samples analyzed for lead isotopes, all 11 surface-water samples, all 4 soil samples, 2 of the 3 shallow groundwater samples, and 3 of the 6 groundwater samples had isotopic ratios of lead matching some combination of these sources. These sources are not unique to the airport study area; samples collected from areas distant from the airport (for example, elsewhere in Wisconsin) could have similar source contributions because most lead measured in the environment is from atmospheric deposition of airborne particulate lead or local geologic sources (Sherman and others, 2015; Wisconsin Geological and Natural History Survey, 2024).
The two shallow groundwater samples from sites A1 and A3 had lead-isotope ratios most similar to Wisconsin galena lead ore. One potential source for lead ore in the shallow groundwater on the eastern edge of the airport property is the former Middleton Sportsmen’s Club (Wisconsin Department of Natural Resources, 2023a). Until 2002, activities at the former Middleton Sportsmen’s Club included trap and skeet shooting, where lead shot was dispersed into the environment around the shooting range. However, this site has undergone extensive cleanup under Wisconsin Department of Natural Resources supervision, and the general direction of groundwater flow in this area is away from the airport and toward this property to the southeast of the airport. Thus, it is unlikely that the lead measured in these shallow groundwater samples was sourced from activities at the former Middleton Sportsmen’s Club.
Of the 24 samples, 4 (3 groundwater samples and 1 shallow groundwater sample) had isotopic signatures of lead distinctly different from those described previously. Two groundwater samples (one in Highwood Circle Estates [MW–10] and one upgradient from the airport [MW–Z1]) had isotopic signatures of lead most closely matching the Avgas 100LL used at the airport. Two samples (one groundwater sample [MW–3] and one shallow groundwater sample [S1]) had isotopic signatures most closely matching lead-based paint. The lead in groundwater at site MW–3 could be from an upgradient source of lead-based paint, or it could be sourced from some combination of background atmospheric lead deposition and Avgas 100LL. The lead in the shallow groundwater at site S1 could be sourced from lead-based paint because this sample was collected near an older home.
Summary and Conclusions
The Middleton Municipal Airport–Morey Field (C29) is a regional general aviation facility within the City of Middleton, Wisconsin. The airport is bisected by Pheasant Branch, and nearby homes in the towns of Middleton and Springfield rely on private drinking water wells. The towns are concerned about the potential for contamination of groundwater and surface water from airport activities, such as aircraft flights, aircraft maintenance and fueling, and fireworks displays. The airport averages more than 100 flights per day, most by small, piston-driven aircraft that use leaded aviation fuel available for purchase at the airport. Environmental exposure to lead has been known to affect multiple organ systems, resulting in deficits that may affect someone for life, even after the lead exposure has been eliminated. The airport has also hosted an annual fly-in event that featured a fireworks display in July 2021. Recent studies by the U.S. Geological Survey and others have determined a relation between the presence of perchlorate and selected metals in water resources and soils after fireworks displays. Perchlorate is known to affect human health by disrupting thyroid hormones via inhibition of the uptake of iodine, and many metals are known to pose substantial risks to human and environmental health.
To address these concerns, the U.S. Geological Survey, in cooperation with the Town of Middleton, completed a study in 2022 to characterize the occurrence and sources of perchlorate and metals (including lead and other metals commonly associated with fireworks) in samples of groundwater, surface water, shallow groundwater, and soils within and near the airport. Samples were also analyzed for gasoline range organics (GRO) compounds and benzene, toluene, ethylbenzene, and xylene (BTEX)—constituents commonly detected in gasoline and other solvents. Concentrations of perchlorate, metals, and GRO and BTEX compounds were analyzed in 60 water samples and 14 soil samples at 23 locations within and near the airport. Lead isotopes were also measured in 24 of the water and soil samples to potentially determine sources of lead.
Groundwater samples were collected from the outdoor faucets at 12 homes near the airport (2 upgradient and 10 downgradient). Of these 12 samples, 2 indicated evidence of water softening. With respect to the U.S. Environmental Protection Agency and Wisconsin drinking water standards, four nitrate exceedances, one arsenic exceedance, and one perchlorate exceedance were detected. Concentrations of perchlorate were greater than the laboratory limit of detection in groundwater upgradient and downgradient from the airport, indicating sources of perchlorate (other than fireworks) outside the airport to the groundwater, such as fertilizer. Groundwater samples had no discernable spatial pattern in concentrations of metals commonly associated with fireworks; some metals were detected at or near their highest concentrations at sites upgradient from the airport and distant from the fireworks launch site. No GRO or BTEX compounds were detected in groundwater samples. All lead concentrations in groundwater were less than laboratory method detection limits of a qualitative scan (5 micrograms per liter [µg/L]); further, concentrations of all six samples analyzed for low-level lead were less than 1 µg/L. Lead-isotope analyses determined that three groundwater samples had isotopic signatures indicating lead sourced from background atmospheric lead deposition, two samples (one in Highwood Circle Estates [MW–10] and one upgradient from the airport [MW–Z1]) had isotopic signatures similar to leaded aviation fuel (Avgas 100LL), and one sample had a signature matching lead-based paint.
Four surface-water stations in the airport study area were sampled during a June 2022 rainfall-runoff event, and three of those stations were sampled twice during base flow conditions after the rainfall event. Perchlorate concentrations were highest at station AR (which drains the basin containing the fireworks launch site) during the rainfall-runoff event. Most metals concentrations in surface-water samples were highest at station SC upstream from the airport. The only GRO or BTEX compound detected anywhere in this study was toluene, which was measured at concentrations greater than detection limits only at stations SC and NF; thus, activities on and off the airport contributed to the toluene concentrations measured in surface water. Lead-isotope signatures indicated that Wisconsin galena lead ore and background atmospheric lead deposition were primary lead sources to surface waters within and near the airport.
Within and near airport property, 6 shallow groundwater samples and 14 colocated soil samples were collected. Shallow groundwater samples were collected from 2 to 11 feet (ft) below ground surface, and soil samples were collected at 1-ft and 2-ft depths at each site. For shallow groundwater and soil, no notable concentrations of perchlorate and no GRO or BTEX compounds were detected. Metals such as barium, copper, lithium, and titanium were all detected in shallow groundwater at the southeastern edge of the airport (sites A3 and Z3) in higher concentrations than the rest of the airport study area. Additionally, higher concentrations of lead in shallow groundwater and soil were detected at the southeastern corner of the airport. Lead-isotope analysis indicates that the primary source of lead in the shallow groundwater and soil was a mixture of background atmospheric lead deposition and Wisconsin galena lead ore.
Magnitudes of concentrations from samples of surface water and shallow groundwater collected in May through July 2022, and their spatial patterns across site locations and types, indicate that the fireworks display in July 2021 was a likely source of perchlorate and metals in the airport study area. The highest perchlorate concentration, 2.2 µg/L at surface-water station AR at the southeastern corner of the airport, was about 15 to 25 times lower than those detected in other studies that evaluated the effects of repeated fireworks displays; however, perchlorate concentrations measured in shallow groundwater and soils at the southeastern corner of the airport were not notable relative to the other sites. The highest concentrations of fireworks-associated metals were measured in shallow groundwater sites A3 and Z3 at the eastern and southeastern edges of the airport. The positions of these sites in the landscape relative to the launch location, wind speed and direction the evening of the launch, and general slope of surface runoff and direction of groundwater flow indicate that the fireworks display was a likely source of metals to the shallow groundwater at the eastern and southeastern edges of the airport. Perchlorate could have remained persistent on the ground surface, available for washoff during rainfall-runoff events, whereas metals infiltrated with recharge to the soil and shallow groundwater. Other studies of sites with fireworks displays have shown that concentrations of perchlorate and fireworks-associated metals increase with repeated displays.
Although fireworks were a possible source of perchlorate and metals at the eastern and southeastern sides of the airport, they were not the only source of perchlorate and metals in the airport study area. Perchlorate and metals were also detected upgradient and away from the fireworks launch site. Detectable concentrations of perchlorate were measured at surface-water stations NF, TP, and SC and in one upgradient drinking water well, all distant from the fireworks launch site. Relatively high metals concentrations were measured in surface water at station SC and in soil at site Z1. Potential sources of perchlorate include atmospheric deposition from lightning and agricultural fertilizers. Potential sources of metals other than fireworks include natural weathering of parent rock material and anthropogenic sources including pesticides, fertilizers, and vehicles.
Toluene was the only organic compound measured in this study that had concentrations exceeding laboratory reporting limits. Toluene was only detected in in rainfall runoff at stations SC and NF upstream and downstream from the airport, respectively. Toluene was not detected in base flow samples, indicating that it was washed from the landscape during the rainfall-runoff event rather than contributed to the stream in groundwater. Potential sources of toluene include the spillage of aviation fuels and degreasers on the airport property and localized activities upstream from the airport.
Ratios of lead isotopes in most water and soil samples collected within the airport study area indicate that lead was primarily sourced from background atmospheric lead deposition, Wisconsin galena lead ore, or lead-based paint; however, isotopic signatures of lead matching the leaded aviation fuel (Avgas 100LL) used at the airport were also detected. Of the 24 samples analyzed for lead isotopes, all 11 surface-water samples, all 4 soil samples, all 3 shallow groundwater samples, and 4 of the 6 groundwater samples had isotopic ratios of lead matching background atmospheric lead deposition, Wisconsin galena lead ore, or lead-based paint. Two groundwater samples, one upgradient from the airport and one downgradient from the airport in Highwood Circle Estates, had isotopic signatures similar to leaded aviation fuel.
References Cited
Agency for Toxic Substances and Disease Registry, 2004, Interaction profile for benzene, toluene, ethylbenzene, and xylenes (BTEX): Agency for Toxic Substances and Disease Registry, 137 p., accessed November 29, 2023, at https://www.atsdr.cdc.gov/interactionprofiles/ip-btex/ip05.pdf.
Agency for Toxic Substances and Disease Registry, 2007a, Public health statement, arsenic: Atlanta, Ga., Agency for Toxic Substances and Disease Registry, 10 p., accessed December 4, 2023, at https://www.atsdr.cdc.gov/ToxProfiles/tp2-c1-b.pdf.
Agency for Toxic Substances and Disease Registry, 2007b, Public health statement, barium: Atlanta, Ga., Agency for Toxic Substances and Disease Registry, 6 p., accessed December 4, 2023, at https://www.atsdr.cdc.gov/ToxProfiles/tp24-c1-b.pdf.
Agency for Toxic Substances and Disease Registry, 2007c, Public health statement, strontium: Atlanta, Ga., Agency for Toxic Substances and Disease Registry, 9 p., accessed December 4, 2023, at https://www.atsdr.cdc.gov/ToxProfiles/tp159-c1-b.pdf.
Agency for Toxic Substances and Disease Registry, 2008, Public health statement, perchlorates: Atlanta, Ga., Agency for Toxic Substances and Disease Registry, 10 p., accessed September 22, 2023, at https://www.atsdr.cdc.gov/ToxProfiles/tp162-c1-b.pdf.
Agency for Toxic Substances and Disease Registry, 2017, Toxicological profile for JP-5, JP-8, and Jet A fuels: Atlanta, Ga., Agency for Toxic Substances and Disease Registry, 306 p., accessed September 22, 2023, at https://wwwn.cdc.gov/TSP/ToxProfiles/ToxProfiles.aspx?id=773&tid=150.
AirNav, LLC, 2023, Middleton Municipal Airport-Morey Field [FAA information effective 2 November 2023]: AirNav, LLC, web page, accessed November 28, 2023, at https://www.airnav.com/airport/C29.
Andrews, C.B., Henry, J.C., and Anderson-Vincent, A., 2021, Rapid cleanup of a perchlorate plume from fireworks: Groundwater, v. 59, no. 4, p. 614–620. [Also available at https://doi.org/10.1111/gwat.13082.]
ASTM International, 2016, Standard specification for zinc coating (hot-dip) on iron and steel hardware [A153/A153M−16a]: West Conshohocken, Pa., ASTM International, 5 p. [Also available at https://doi.org/10.1520/A0153_A0153M-16A.]
ASTM International, 2023, Standard specification for stainless steel forgings [A473−23a,]: West Conshohocken, Pa., ASTM International, 6 p. [Also available at https://doi.org/10.1520/A0473-23A.]
Center for Disease Control and Prevention, 2022, About lead in paint: Center for Disease Control and Prevention web page, accessed July 23, 2024, at https://www.cdc.gov/lead-prevention/prevention/paint.html.
Curtis, J., Metheny, E., and Sergent, S.R., 2023, Hydrocarbon toxicity: StatPearls Publishing web page, accessed November 29, 2023, at https://www.ncbi.nlm.nih.gov/books/NBK499883/.
Fienen, M.N., and Arshad, M., 2016, The international scale of the groundwater issue, in Jakeman, A.J., Barreteau, O., Hunt, R.J., Rinaudo, J.D., and Ross, A., eds., Integrated groundwater management: Springer, p. 21–48. [Also available at https://doi.org/10.1007/978-3-319-23576-9_2.]
Graney, J.R., Halliday, A.N., Keeler, G.J., Nriagu, J.O., Robbins, J.A., and Norton, S.A., 1995, Isotopic record of lead pollution in lake sediments from the northeastern United States: Geochimica et Cosmochimica Acta, v. 59, no. 9, p. 1715–1728. [Also available at https://doi.org/10.1016/0016-7037(95)00077-D.]
Hoogestraat, G.K., and Rowe, B.L., 2016, Perchlorate and selected metals in water and soil within Mount Rushmore National Memorial, South Dakota, 2011–15: U.S. Geological Survey Scientific Investigations Report 2016–5030, 28 p., 1 app., accessed September 22, 2023, at https://doi.org/10.3133/sir20165030.
Hunt, R.J., and Steuer, J.J., 2000, Simulation of the recharge area for Frederick Springs, Dane County, Wisconsin: U.S. Geological Survey Water-Resources Investigations Report 2000–4172, 33 p., accessed September 25, 2023, at https://doi.org/10.3133/wri004172.
Kalkhoff, S.J., Stetson, S.J., Lund, K.D., Wanty, R.B., and Linder, G.L., 2010, Perchlorate data for streams and groundwater in selected areas of the United States, 2004: U.S. Geological Survey Data Series 495, 43 p. with appendix. [Also available at https://doi.org/10.3133/ds495.]
Kelly, A.E., Reuer, M.K., Goodkin, N.F., and Boyle, E.A., 2009, Lead concentrations and isotopes in corals and water near Bermuda, 1780–2000: Earth and Planetary Science Letters, v. 283, nos. 1–4, p. 93–100. [Also available at https://doi.org/10.1016/j.epsl.2009.03.045.]
Licudine, J.A., Yee, H., Chang, W.L., and Whelen, A.C., 2012, Hazardous metals in ambient air due to New Year fireworks during 2004–2011 celebrations in Pearl City, Hawaii: Public Health Reports, v. 127, no. 4, p. 440–450. [Also available at https://doi.org/10.1177/003335491212700412.]
Massachusetts Department of Environmental Protection, 2007, Final report—Evaluation of perchlorate contamination at a fireworks display in Dartmouth, Massachusetts: Boston, Mass., Massachusetts Department of Environmental Protection, 33 p., accessed September 22, 2023, at https://www.mass.gov/doc/report-perchlorate-contamination-at-a-fireworks-display-in-dartmouth-massachusetts-0/download.
McCumber, A., and Strevett, K.A., 2017, A geospatial analysis of soil lead concentrations around regional Oklahoma airports: Chemosphere, v. 167, p. 62–70. [Also available at https://doi.org/10.1016/j.chemosphere.2016.09.127.]
McFarland, M.J., Hauer, M.E., and Reuben, A., 2022, Half of US population exposed to adverse lead levels in early childhood: Proceedings of the National Academy of Sciences of the United States of America, v. 119, no. 11, article e2118631119, 7 p., accessed July 23, 2024, at https://doi.org/10.1073/pnas.2118631119.
Mead and Hunt, 2022, Middleton Municipal Airport Morey Field (C29) master plan: City of Middleton web page, accessed November 28, 2023, at https://www.cityofmiddleton.us/AirportMasterPlan.
Minnesota Department of Health and Minnesota Pollution Control Agency, 2019, Home water softening frequently asked questions: St. Paul, Minn., Minnesota Department of Health, 2 p., accessed February 13, 2024, at https://www.health.state.mn.us/communities/environment/water/docs/factsheet/softening.pdf.
Mueller, D.K., Schertz, T.L., Martin, J.D., and Sandstrom, M.W., 2015, Design, analysis, and interpretation of field quality-control data for water-sampling projects: U.S. Geological Survey Techniques and Methods, book 4, chap. C4, 54 p., accessed July 23, 2024, at https://doi.org/10.3133/tm4C4.
Munster, J., Hanson, G.N., Jackson, W.A., and Rajagopalan, S., 2009, The fallout from fireworks—Perchlorate in total deposition: Water, Air, and Soil Pollution, v. 198, nos. 1–4, p. 149–153. [Also available at https://doi.org/10.1007/s11270-008-9833-6.]
National Academies of Sciences, Engineering, and Medicine, 2016, Guidebook for assessing airport lead impacts: Washington, D.C., The National Academies Press, 32 p. [Also available at https://doi.org/10.17226/23625.]
National Institute of Standards and Technology, 2023, Certificate of analysis—Standard Reference Material 1633b—Constituent elements in coal fly ash: National Institute of Standards and Technology, 5 p., accessed September 25, 2023, at https://tsapps.nist.gov/srmext/certificates/archives/1633b.pdf.
National Weather Service, 2021, Time Series Viewer [weather conditions for Middleton Muni—Morey Field, Wisconsin, July 23, 2021]: National Weather Service digital data, accessed February 13, 2024, at https://www.weather.gov/wrh/timeseries?site=KC29&hours=72&units=english&chart=on&headers=on&obs=tabular&hourly=false&pview=standard&history=yes&start= 20210723&end=20210724.
Parsen, M.J., Bradbury, K.R., Hunt, R.J., and Feinstein, D.T., 2016, The 2016 groundwater flow model for Dane County, Wisconsin: Madison, Wis., Wisconsin Geological and Natural History Survey Bulletin 110, 56 p. [Also available at https://water.usgs.gov/GIS/dsdl/gwmodels/WGNHS2016-Dane_County/WGNHS_B110-report.pdf.]
Russell, M.S., 2000, The chemistry of fireworks: Cambridge, U.K., Royal Society of Chemistry, 117 p. [Also available at https://doi.org/10.1039/9781847552037.]
Schachter, L.A., and Stuntebeck, T.D., 2024, Lead concentrations and isotope ratios for selected water and soil samples near Middleton Municipal Airport–Morey Field (C29), Middleton, WI, 2022: U.S. Geological Survey data release, https://doi.org/10.5066/P9IEJULZ.
Schmidt, S., 2016, Wisconsin an ‘arsenic hot spot’: Post Crescent, January 24, 2016, accessed September 25, 2023, at https://www.postcrescent.com/story/news/investigations/2016/01/24/wisconsin-arsenic-hot-spot/79136844/.
Scott, S.R., Dunion, J.P., Olson, M.L., and Gay, D.A., 2022, Lead isotopes in North American precipitation record the presence of Saharan dust: Bulletin of the American Meteorological Society, v. 103, no. 2, p. E281–E292, accessed July 23, 2024, at https://journals.ametsoc.org/view/journals/bams/103/2/BAMS-D-20-0212.1.xml.
Sherman, L.S., Blum, J.D., Dvonch, J.T., Gratz, L.E., and Landis, M.S., 2015, The use of Pb, Sr, and Hg isotopes in Great Lakes precipitation as a tool for pollution source attribution: Science of the Total Environment, v. 502, p. 362–374. [Also available at https://doi.org/10.1016/j.scitotenv.2014.09.034.]
Sijimol, M.R., Jyothy, S., Pradeepkumar, A.P., Shylesh Chandran, M.S., Shabin Ghouse, S., and Mohan, M., 2015, Review on fate, toxicity, and remediation of perchlorate: Environmental Forensics, v. 16, no. 2, p. 125–134. [Also available at https://doi.org/10.1080/15275922.2015.1022914.]
Steinhauser, G., Sterba, J.H., Foster, M., Grass, F., and Bichler, M., 2008, Heavy metals from pyrotechnics in New Years Eve snow: Atmospheric Environment, v. 42, no. 37, p. 8616–8622. [Also available at https://doi.org/10.1016/j.atmosenv.2008.08.023.]
Sulej, A.M., Polkowska, Z., and Namieśnik, J., 2012, Pollutants in airport runoff waters: Critical Reviews in Environmental Science and Technology, v. 42, no. 16, p. 1691–1734. [Also available at https://doi.org/10.1080/10643389.2011.569873.]
Susarla, S., Collette, T.W., Garrison, A.W., Wolfe, N.L., and McCutcheon, S.C., 1999, Perchlorate identification in fertilizers: Environmental Science & Technology, v. 33, no. 19, p. 3469–3472. [Also available at https://doi.org/10.1021/es990577k.]
Tipton, D.K., Rolston, D.E., and Scow, K.M., 2003, Transport and biodegradation of perchlorate in soils: Journal of Environmental Quality, v. 32, no. 1, p. 40–46. [Also available at https://doi.org/10.2134/jeq2003.4000.]
Tuccillo, M.E., Blue, J., Koplos, J., Kelly, J., and Wilkin, R.T., 2023, Complexities in attributing lead contamination to specific sources in an industrial area of Philadelphia, PA: Heliyon, v. 9, no. 5, article e15666, 12 p., accessed July 23, 2024, at https://doi.org/10.1016/j.heliyon.2023.e15666.
U.S. Department of Agriculture, National Agricultural Statistics Service, 2024, CropScape—Cropland Data Layer: U.S. Department of Agriculture, National Agricultural Statistics Service, digital data, accessed July 23, 2024, at https://nassgeodata.gmu.edu/CropScape/.
U.S. Environmental Protection Agency, 1996a, EPA takes final step in phaseout of leaded gasoline: U.S. Environmental Protection Agency press release, January 29, 1996, accessed March 4, 2024, at https://www.epa.gov/archive/epa/aboutepa/epa-takes-final-step-phaseout-leaded-gasoline.html.
U.S. Environmental Protection Agency, 1996b, Method 3050B—Acid digestion of sediments, sludges, and soils: U.S. Environmental Protection Agency, 12 p., accessed December 15, 2023, at https://www.epa.gov/sites/default/files/2015-12/documents/3050b.pdf.
U.S. Environmental Protection Agency, 2001, Method 200.7—Trace elements in water, solids, and biosolids by inductively coupled plasma-atomic emission spectrometry (revision 5.0): Washington, D.C., U.S. Environmental Protection Agency EPA–821–R–01–010, 68 p., accessed September 25, 2023, at https://www.epa.gov/sites/default/files/2015-08/documents/method_200-7_rev_5_2001.pdf.
U.S. Environmental Protection Agency, 2003, Method 8015D—Nonhalogenated organics using GC/FID (revision 4): U.S. Environmental Protection Agency, 37 p., accessed December 15, 2023, at https://www.epa.gov/sites/default/files/2015-12/documents/8015d_r4.pdf.
U.S. Environmental Protection Agency, 2006, Method 8260C—Volatile organic compounds by gas chromatography/mass spectrometry (revision 3): U.S. Environmental Protection Agency, 92 p., accessed December 15, 2023, at https://19january2017snapshot.epa.gov/sites/production/files/2015-07/documents/epa-8260c.pdf.
U.S. Environmental Protection Agency, 2007, Method 6850—Perchlorate in water, soils and solid wastes using higher performance liquid chromatography/electrospray ionization/mass spectrometry: U.S. Environmental Protection Agency, 27 p., accessed September 25, 2023, at https://www.epa.gov/sites/default/files/2015-12/documents/6850.pdf.
U.S. Environmental Protection Agency, 2009, National primary drinking water regulations: U.S. Environmental Protection Agency EPA 816–F–09–004, 7 p., accessed September 25, 2023, at https://www.epa.gov/sites/default/files/2016-06/documents/npwdr_complete_table.pdf.
U.S. Environmental Protection Agency, 2023, Basic information about lead in drinking water: U.S. Environmental Protection Agency web page, accessed September 25, 2023, at https://www.epa.gov/ground-water-and-drinking-water/basic-information-about-lead-drinking-water.
U.S. Environmental Protection Agency, 2000, Preliminary data summary—Airport deicing operations (revised): Washington, D.C., U.S. Environmental Protection Agency, 447 p., accessed March 4, 2024, at https://www.epa.gov/sites/default/files/2015-06/documents/airport-deicing-pds-2000.pdf.
U.S. Environmental Protection Agency, 2024, Learn about lead: U.S. Environmental Protection Agency web page, accessed February 14, 2024, at https://www.epa.gov/lead/learn-about-lead.
U.S. Geological Survey, 2023, USGS 05427948 Pheasant Branch at Middleton, WI, in USGS water data for the Nation: U.S. Geological Survey National Water Information System database, accessed September 25, 2023, at https://doi.org/10.5066/F7P55KJN. [Site information directly accessible at https://waterdata.usgs.gov/nwis/dv?referred_module=sw&site_no=05427948.]
U.S. Geological Survey, [variously dated], National field manual for the collection of water-quality data: U.S. Geological Survey Techniques of Water-Resources Investigations, book 9, chaps. A1–A9, accessed December 12, 2023, at https://www.usgs.gov/mission-areas/water-resources/science/national-field-manual-collection-water-quality-data-nfm.
Wang, Z., Wade, A.M., Richter, D.D., Stapleton, H.M., Kaste, J.M., and Vengosh, A., 2022, Legacy of anthropogenic lead in urban soils—Co-occurrence with metal(loids) and fallout radionuclides, isotopic fingerprinting, and in vitro bioaccessibility: Science of the Total Environment, v. 806, p. 151276–151738. [Also available at https://doi.org/10.1016/j.scitotenv.2021.151276.]
Wisconsin Department of Natural Resources, 2023a, Environmental cleanup & brownfields redevelopment—BRRTS on the web [BRRTS no. 298787, Middleton Sportsmens Club]: Wisconsin Department of Natural Resources digital data, accessed September 25, 2023, at https://apps.dnr.wi.gov/botw/SetUpBasicSearchForm.do.
Wisconsin Department of Natural Resources, 2023b, NR 140.10—Public health related groundwater standards, subchapter II of chap. NR 140—Groundwater quality: Wisconsin State legislature, p. 325–328. [Also available at https://docs.legis.wisconsin.gov/code/admin_code/nr/100/140.pdf#page=3.]
Wisconsin Geological and Natural History Survey, 2024, Galena: Wisconsin Geological and Natural History Survey web page, accessed February 14, 2024, at https://home.wgnhs.wisc.edu/minerals/galena/.
Appendix 1. Constituent Concentrations of Surface-Water Samples Collected Within and Near Middleton Municipal Airport, 2022
Table 1.1.
Constituent concentrations of surface-water samples collected within and near the Middleton Municipal Airport, Middleton, Wisconsin, 2022.[Dates are in month/day/year format. USGS, U.S. Geological Survey; µg/L, microgram per liter; mg/L, milligram per liter; nr, near; WI, Wisconsin; --, not analyzed; <, less than; Br, branch; Trib, Tributary; Rd, Road]
| Map identifier (fig. 1) | USGS station number | USGS station name | Sample date and time | Aluminum (µg/L) | Antimony (µg/L) | Arsenic (µg/L) | Barium (µg/L) | Beryllium (µg/L) | Boron (µg/L) | Cadmium (µg/L) | Calcium (mg/L) | Chromium (µg/L) | Cobalt (µg/L) | Copper (µg/L) | Iron (mg/L) | Lead (µg/L) | Lithium (µg/L) | Magnesium (mg/L) |
|---|---|---|---|---|---|---|---|---|---|---|---|---|---|---|---|---|---|---|
| SC | 05427940 | Pheasant Branch at Schneider Road nr Ashton, WI | 06/08/2022 11:35 | -- | -- | -- | -- | -- | -- | -- | -- | -- | -- | -- | -- | -- | -- | -- |
| SC | 05427940 | Pheasant Branch at Schneider Road nr Ashton, WI | 06/08/2022 11:40 | 988 | 12.8 | <7.00 | 92.1 | <0.500 | 67 | 0.528 | 69.6 | <2.00 | 2.82 | 12.5 | 1.87 | (1) | <9.00 | 29.7 |
| SC | 05427940 | Pheasant Branch at Schneider Road nr Ashton, WI | 06/08/2022 12:00 | 1,120 | 15.1 | <7.00 | 87 | <0.500 | 65 | <0.500 | 65 | <2.00 | 3.13 | 15.1 | 1.93 | (1) | <9.00 | 26.8 |
| SC | 05427940 | Pheasant Branch at Schneider Road nr Ashton, WI | 06/08/2022 13:20 | 657 | <10.0 | <7.00 | 82.7 | <0.500 | 58.6 | 0.576 | 71.4 | <2.00 | 2.46 | 11.8 | 1.13 | (1) | <9.00 | 29.7 |
| SC | 05427940 | Pheasant Branch at Schneider Road nr Ashton, WI | 06/08/2022 13:25 | -- | -- | -- | -- | -- | -- | -- | -- | -- | -- | -- | -- | -- | -- | -- |
| SC | 05427940 | Pheasant Branch at Schneider Road nr Ashton, WI | 06/08/2022 15:20 | -- | -- | -- | -- | -- | -- | -- | -- | -- | -- | -- | -- | -- | -- | -- |
| SC | 05427940 | Pheasant Branch at Schneider Road nr Ashton, WI | 06/08/2022 18:50 | 2310 | 14 | <7.00 | 145 | <0.500 | 56.1 | 0.804 | 102 | <2.00 | 1.57 | 15.5 | 0.749 | (1) | <9.00 | 45.5 |
| SC | 05427940 | Pheasant Branch at Schneider Road nr Ashton, WI | 06/08/2022 22:50 | 2196 | 18.7 | 8.48 | 146 | <0.500 | 51.3 | 0.805 | 110 | <2.00 | <1.00 | 10.3 | 0.569 | (1) | <9.00 | 51.5 |
| SC | 05427940 | Pheasant Branch at Schneider Road nr Ashton, WI | 06/09/2022 11:00 | -- | -- | -- | -- | -- | -- | -- | -- | -- | -- | -- | -- | -- | -- | -- |
| SC | 05427940 | Pheasant Branch at Schneider Road nr Ashton, WI | 06/13/2022 10:00 | 260.6 | <10.0 | <7.00 | 122 | <0.500 | 32.5 | 0.779 | 117 | <2.00 | <1.00 | <5.00 | 0.211 | (1) | <9.00 | 57.8 |
| SC | 05427940 | Pheasant Branch at Schneider Road nr Ashton, WI | 07/19/2022 10:00 | <30.0 | <10.0 | 10.9 | 87.5 | <0.500 | 33.3 | 0.634 | 115 | 3.23 | <1.00 | <5.00 | 0.19 | (1) | <9.00 | 56.3 |
| NF | 05427943 | Pheasant Branch at Airport Road nr Middleton, WI | 06/08/2022 09:45 | <30.0 | 12.1 | <7.00 | 78.3 | <0.500 | 26.3 | 0.742 | 88.9 | <2.00 | <1.00 | <5.00 | 0.482 | (1) | <9.00 | 44.6 |
| NF | 05427943 | Pheasant Branch at Airport Road nr Middleton, WI | 06/08/2022 11:10 | -- | -- | -- | -- | -- | -- | -- | -- | -- | -- | -- | -- | -- | -- | -- |
| NF | 05427943 | Pheasant Branch at Airport Road nr Middleton, WI | 06/08/2022 11:40 | 361 | 15.5 | <7.00 | 81.9 | <0.500 | 22.8 | 0.523 | 68.3 | <2.00 | <1.00 | <5.00 | 1.1 | (1) | <9.00 | 33.3 |
| NF | 05427943 | Pheasant Branch at Airport Road nr Middleton, WI | 06/08/2022 13:05 | -- | -- | -- | -- | -- | -- | -- | -- | -- | -- | -- | -- | -- | -- | -- |
| NF | 05427943 | Pheasant Branch at Airport Road nr Middleton, WI | 06/08/2022 13:15 | 585 | 10.2 | <7.00 | 89.7 | <0.500 | 32 | 0.622 | 69 | <2.00 | 1.08 | 5.2 | 1.21 | (1) | <9.00 | 32.3 |
| NF | 05427943 | Pheasant Branch at Airport Road nr Middleton, WI | 06/08/2022 15:00 | -- | -- | -- | -- | -- | -- | -- | -- | -- | -- | -- | -- | -- | -- | -- |
| NF | 05427943 | Pheasant Branch at Airport Road nr Middleton, WI | 06/08/2022 16:15 | 2296 | 12.9 | <7.00 | 102 | <0.500 | 39.1 | 0.833 | 82.2 | <2.00 | <1.00 | <5.00 | 0.511 | (1) | <9.00 | 39.5 |
| NF | 05427943 | Pheasant Branch at Airport Road nr Middleton, WI | 06/09/2022 01:15 | 2109 | 13.4 | <7.00 | 109 | <0.500 | 34.4 | 0.677 | 102 | <2.00 | <1.00 | 5.56 | 0.275 | (1) | <9.00 | 49.5 |
| NF | 05427943 | Pheasant Branch at Airport Road nr Middleton, WI | 06/09/2022 10:20 | -- | -- | -- | -- | -- | -- | -- | -- | -- | -- | -- | -- | -- | -- | -- |
| NF | 05427943 | Pheasant Branch at Airport Road nr Middleton, WI | 06/13/2022 09:00 | <30.0 | <10.0 | <7.00 | 84.8 | <0.500 | 24.5 | 0.632 | 106 | <2.00 | <1.00 | <5.00 | 0.125 | (1) | <9.00 | 54.8 |
| NF | 05427943 | Pheasant Branch at Airport Road nr Middleton, WI | 07/19/2022 09:00 | 2181 | <10.0 | <7.00 | 78.4 | <0.500 | 39.3 | 0.744 | 97.1 | 2.84 | <1.00 | <5.00 | 0.373 | (1) | <9.00 | 49.7 |
| AR | 430642089311901 | Pheasant Br Trib at Airport Rd nr Middleton, WI | 06/08/2022 10:20 | 2128 | 14.3 | <7.00 | 74.5 | <0.500 | 45.8 | 0.597 | 99 | <2.00 | <1.00 | 5.62 | 0.173 | (1) | <9.00 | 47.4 |
| AR | 430642089311901 | Pheasant Br Trib at Airport Rd nr Middleton, WI | 06/08/2022 10:50 | -- | -- | -- | -- | -- | -- | -- | -- | -- | -- | -- | -- | -- | -- | -- |
| AR | 430642089311901 | Pheasant Br Trib at Airport Rd nr Middleton, WI | 06/08/2022 12:50 | -- | -- | -- | -- | -- | -- | -- | -- | -- | -- | -- | -- | -- | -- | -- |
| AR | 430642089311901 | Pheasant Br Trib at Airport Rd nr Middleton, WI | 06/08/2022 13:05 | 2145 | <10.0 | <7.00 | 68.2 | <0.500 | 34.9 | 0.616 | 68.8 | <2.00 | <1.00 | 5.34 | 0.18 | (1) | <9.00 | 31.5 |
| AR | 430642089311901 | Pheasant Br Trib at Airport Rd nr Middleton, WI | 06/08/2022 15:05 | 2127 | 17.7 | <7.00 | 53.6 | <0.500 | 32.3 | <0.500 | 56.4 | <2.00 | <1.00 | 5.82 | 0.173 | (1) | <9.00 | 24.9 |
| AR | 430642089311901 | Pheasant Br Trib at Airport Rd nr Middleton, WI | 06/08/2022 15:30 | -- | -- | -- | -- | -- | -- | -- | -- | -- | -- | -- | -- | -- | -- | -- |
| AR | 430642089311901 | Pheasant Br Trib at Airport Rd nr Middleton, WI | 06/08/2022 19:05 | 2113 | 14.5 | <7.00 | 71.9 | <0.500 | 37.0 | 0.524 | 72.6 | <2.00 | <1.00 | 6.29 | 0.169 | (1) | <9.00 | 31.8 |
| AR | 430642089311901 | Pheasant Br Trib at Airport Rd nr Middleton, WI | 06/09/2022 03:05 | 266.7 | 11.7 | 8.01 | 96.8 | <0.500 | 47.3 | 0.775 | 109 | <2.00 | <1.00 | <5.00 | 0.099 | (1) | <9.00 | 51.2 |
| AR | 430642089311901 | Pheasant Br Trib at Airport Rd nr Middleton, WI | 06/09/2022 10:00 | -- | -- | -- | -- | -- | -- | -- | -- | -- | -- | -- | -- | -- | -- | -- |
| TP | 430648089324101 | Pheasant Br Trib at Tallard Park nr Middleton, WI | 06/08/2022 09:15 | 242.4 | <10.0 | <7.00 | 26.9 | <0.500 | 18.7 | <0.500 | 24.2 | <2.00 | <1.00 | <5.00 | 0.263 | (1) | <9.00 | 12.1 |
| TP | 430648089324101 | Pheasant Br Trib at Tallard Park nr Middleton, WI | 06/08/2022 10:30 | 2111 | 15.4 | <7.00 | 17.4 | <0.500 | 14.8 | <0.500 | 12.5 | <2.00 | <1.00 | <5.00 | 0.341 | (1) | <9.00 | 5.91 |
| TP | 430648089324101 | Pheasant Br Trib at Tallard Park nr Middleton, WI | 06/08/2022 11:20 | -- | -- | -- | -- | -- | -- | -- | -- | -- | -- | -- | -- | -- | -- | -- |
| TP | 430648089324101 | Pheasant Br Trib at Tallard Park nr Middleton, WI | 06/08/2022 12:00 | 269.5 | 13.5 | <7.00 | 9.36 | <0.500 | 10.0 | <0.500 | 6.1 | <2.00 | <1.00 | <5.00 | 0.16 | (1) | <9.00 | 2.78 |
| TP | 430648089324101 | Pheasant Br Trib at Tallard Park nr Middleton, WI | 06/08/2022 13:15 | -- | -- | -- | -- | -- | -- | -- | -- | -- | -- | -- | -- | -- | -- | -- |
| TP | 430648089324101 | Pheasant Br Trib at Tallard Park nr Middleton, WI | 06/08/2022 15:00 | 268.6 | 13.2 | <7.00 | 11.9 | <0.500 | 10.5 | <0.500 | 8.21 | <2.00 | <1.00 | <5.00 | 0.142 | (1) | <9.00 | 3.75 |
| TP | 430648089324101 | Pheasant Br Trib at Tallard Park nr Middleton, WI | 06/08/2022 15:10 | -- | -- | -- | -- | -- | -- | -- | -- | -- | -- | -- | -- | -- | -- | -- |
| TP | 430648089324101 | Pheasant Br Trib at Tallard Park nr Middleton, WI | 06/08/2022 23:00 | 251.4 | 14 | <7.00 | 14.3 | <0.500 | 12.8 | <0.500 | 11.3 | <2.00 | <1.00 | <5.00 | 0.158 | (1) | <9.00 | 5.22 |
| TP | 430648089324101 | Pheasant Br Trib at Tallard Park nr Middleton, WI | 06/09/2022 10:40 | -- | -- | -- | -- | -- | -- | -- | -- | -- | -- | -- | -- | -- | -- | -- |
| TP | 430648089324101 | Pheasant Br Trib at Tallard Park nr Middleton, WI | 06/13/2022 09:25 | <30.0 | <10.0 | <7.00 | 34.5 | <0.500 | 16.1 | <0.500 | 24.1 | <2.00 | <1.00 | <5.00 | 0.778 | (1) | <9.00 | 11.5 |
| TP | 430648089324101 | Pheasant Br Trib at Tallard Park nr Middleton, WI | 07/13/2022 09:30 | <30.0 | <10.0 | <7.00 | 25.3 | <0.500 | 36.1 | <0.500 | 15.2 | <2.00 | <1.00 | <5.00 | 0.853 | (1) | <9.00 | 6.7 |
Table 1.2.
Additional constituent concentrations of surface-water samples collected within and near the Middleton Municipal Airport, Middleton, Wisconsin, 2022.[Dates are in month/day/year format. USGS, U.S. Geological Survey; µg/L, microgram per liter; mg/L, milligram per liter; nr, near; WI, Wisconsin; --, not analyzed; <, less than; Br, branch; Trib, Tributary; Rd, Road]
| Map identifier (fig. 1) | USGS station number | USGS station name | Sample date and time | Manganese (µg/L) | Molybdenum (µg/L) | Nickel (µg/L) | Potassium (mg/L) | Selenium (µg/L) | Silver (µg/L) | Sodium (mg/L) | Strontium (µg/L) | Thallium (µg/L) | Titanium (µg/L) | Vanadium (µg/L) | Zinc (µg/L) | Benzene (µg/L) | Ethylbenzene (µg/L) | Toluene (µg/L) | Xylene (all isomers) (µg/L) | Gasoline range organic compounds (µg/L) | Perchlorate (µg/L) | Low-level lead (µg/L) |
|---|---|---|---|---|---|---|---|---|---|---|---|---|---|---|---|---|---|---|---|---|---|---|
| SC | 05427940 | Pheasant Branch at Schneider Road nr Ashton, WI | 06/08/2022 11:35 | -- | -- | -- | -- | -- | -- | -- | -- | -- | -- | -- | -- | <1 | <1 | 3.4 | <3 | 17 | -- | 1.13 |
| SC | 05427940 | Pheasant Branch at Schneider Road nr Ashton, WI | 06/08/2022 11:40 | 499 | 10.2 | 7.35 | 53.9 | <30.0 | <5.00 | 12 | 107 | <5.00 | 35.9 | 9.36 | 44.5 | -- | -- | -- | -- | -- | 2<1 | -- |
| SC | 05427940 | Pheasant Branch at Schneider Road nr Ashton, WI | 06/08/2022 12:00 | 455 | <7.00 | 7.37 | 48.1 | <30.0 | <5.00 | 11.7 | 102 | <5.00 | 38.3 | 9.86 | 41.5 | -- | -- | -- | -- | -- | 2<1 | -- |
| SC | 05427940 | Pheasant Branch at Schneider Road nr Ashton, WI | 06/08/2022 13:20 | 403 | 9.5 | 5.8 | 34.6 | <30.0 | <5.00 | 14.4 | 115 | <5.00 | 23.5 | 7.55 | 25.8 | -- | -- | -- | -- | -- | 2<1 | -- |
| SC | 05427940 | Pheasant Branch at Schneider Road nr Ashton, WI | 06/08/2022 13:25 | -- | -- | -- | -- | -- | -- | -- | -- | -- | -- | -- | -- | <1 | <1 | 1.6 | <3 | 12 | -- | 0.911 |
| SC | 05427940 | Pheasant Branch at Schneider Road nr Ashton, WI | 06/08/2022 15:20 | -- | -- | -- | -- | -- | -- | -- | -- | -- | -- | -- | -- | <1 | <1 | 1.1 | <3 | 114 | -- | -- |
| SC | 05427940 | Pheasant Branch at Schneider Road nr Ashton, WI | 06/08/2022 18:50 | 394 | 8.63 | 6.55 | 33 | <30.0 | <5.00 | 29.6 | 183 | <5.00 | 12.8 | 7.1 | 25.3 | -- | -- | -- | -- | -- | 0.33 | -- |
| SC | 05427940 | Pheasant Branch at Schneider Road nr Ashton, WI | 06/08/2022 22:50 | 446 | 8.21 | 5.78 | 28.8 | <30.0 | <5.00 | 31.1 | 197 | <5.00 | 6.66 | 6.37 | 18.9 | -- | -- | -- | -- | -- | 0.35 | -- |
| SC | 05427940 | Pheasant Branch at Schneider Road nr Ashton, WI | 06/09/2022 11:00 | -- | -- | -- | -- | -- | -- | -- | -- | -- | -- | -- | -- | <1 | <1 | <1 | <3 | <100 | -- | -- |
| SC | 05427940 | Pheasant Branch at Schneider Road nr Ashton, WI | 06/13/2022 10:00 | 139 | <7.00 | 2.6 | 8.4 | <30.0 | <5.00 | 24 | 173 | <5.00 | 2.37 | 5.09 | <5.00 | <1 | <1 | <1 | <3 | <100 | 0.34 | 0.099 |
| SC | 05427940 | Pheasant Branch at Schneider Road nr Ashton, WI | 07/19/2022 10:00 | 126 | <7.00 | 2.42 | 8.19 | <30.0 | <5.00 | 25.2 | 148 | <5.00 | <1.00 | 4.65 | 9.82 | <1 | <1 | <1 | <3 | <100 | 0.26 | -- |
| NF | 05427943 | Pheasant Branch at Airport Road nr Middleton, WI | 06/08/2022 09:45 | 856 | <7.00 | 2.14 | 3.09 | <30.0 | <5.00 | 11.5 | 93.5 | <5.00 | 1.22 | 4.49 | 5.34 | -- | -- | -- | -- | -- | 0.27 | -- |
| NF | 05427943 | Pheasant Branch at Airport Road nr Middleton, WI | 06/08/2022 11:10 | -- | -- | -- | -- | -- | -- | -- | -- | -- | -- | -- | -- | <1 | <1 | <1 | <3 | <100 | -- | 0.219 |
| NF | 05427943 | Pheasant Branch at Airport Road nr Middleton, WI | 06/08/2022 11:40 | 578 | <7.00 | <2.00 | 4.01 | <30.0 | <5.00 | 8.36 | 75.1 | <5.00 | 11.5 | 5.91 | 7.93 | -- | -- | -- | -- | -- | 0.17 | -- |
| NF | 05427943 | Pheasant Branch at Airport Road nr Middleton, WI | 06/08/2022 13:05 | -- | -- | -- | -- | -- | -- | -- | -- | -- | -- | -- | -- | <1 | <1 | 8.5 | <3 | 130 | -- | 0.562 |
| NF | 05427943 | Pheasant Branch at Airport Road nr Middleton, WI | 06/08/2022 13:15 | 363 | <7.00 | 4.05 | 10.4 | <30.0 | <5.00 | 10.2 | 82.5 | <5.00 | 19.8 | 7.77 | 15.1 | -- | -- | -- | -- | -- | 0.23 | -- |
| NF | 05427943 | Pheasant Branch at Airport Road nr Middleton, WI | 06/08/2022 15:00 | -- | -- | -- | -- | -- | -- | -- | -- | -- | -- | -- | -- | <1 | <1 | 2.3 | <3 | 126 | -- | -- |
| NF | 05427943 | Pheasant Branch at Airport Road nr Middleton, WI | 06/08/2022 16:15 | 188 | <7.00 | 3.73 | 14.3 | <30.0 | <5.00 | 13 | 103 | <5.00 | 9.72 | 8.45 | 5.18 | -- | -- | -- | -- | -- | 0.31 | -- |
| NF | 05427943 | Pheasant Branch at Airport Road nr Middleton, WI | 06/09/2022 01:15 | 151 | <7.00 | 3.3 | 11.7 | <30.0 | <5.00 | 18.1 | 128 | <5.00 | 3.18 | 6.21 | 6.02 | -- | -- | -- | -- | -- | 0.36 | -- |
| NF | 05427943 | Pheasant Branch at Airport Road nr Middleton, WI | 06/09/2022 10:20 | -- | -- | -- | -- | -- | -- | -- | -- | -- | -- | -- | -- | <1 | <1 | <1 | <3 | <100 | -- | -- |
| NF | 05427943 | Pheasant Branch at Airport Road nr Middleton, WI | 06/13/2022 09:00 | 138 | <7.00 | <2.00 | 2.78 | <30.0 | <5.00 | 15.4 | 115 | <5.00 | 1.66 | 4.84 | <5.00 | <1 | <1 | <1 | <3 | <100 | 0.45 | 0.030 |
| NF | 05427943 | Pheasant Branch at Airport Road nr Middleton, WI | 07/19/2022 09:00 | 259 | <7.00 | <2.00 | 2.96 | <30.0 | <5.00 | 14.7 | 99.1 | <5.00 | 5.13 | 5.66 | 7.43 | <1 | <1 | <1 | <3 | <100 | 0.35 | -- |
| AR | 430642089311901 | Pheasant Br Trib at Airport Rd nr Middleton, WI | 06/08/2022 10:20 | 12.9 | <7.00 | 5.01 | 7.88 | <30.0 | <5.00 | 24.2 | 146 | <5.00 | 3.87 | 8.59 | 6.9 | -- | -- | -- | -- | -- | 2.2 | -- |
| AR | 430642089311901 | Pheasant Br Trib at Airport Rd nr Middleton, WI | 06/08/2022 10:50 | -- | -- | -- | -- | -- | -- | -- | -- | -- | -- | -- | -- | <1 | <1 | <1 | <3 | <100 | -- | 0.253 |
| AR | 430642089311901 | Pheasant Br Trib at Airport Rd nr Middleton, WI | 06/08/2022 12:50 | -- | -- | -- | -- | -- | -- | -- | -- | -- | -- | -- | -- | <1 | <1 | <1 | <3 | 113 | -- | 0.248 |
| AR | 430642089311901 | Pheasant Br Trib at Airport Rd nr Middleton, WI | 06/08/2022 13:05 | 17.2 | <7.00 | 3.64 | 12.8 | <30.0 | <5.00 | 14.3 | 100 | <5.00 | 4.25 | 7.56 | 6.67 | -- | -- | -- | -- | -- | 1.1 | -- |
| AR | 430642089311901 | Pheasant Br Trib at Airport Rd nr Middleton, WI | 06/08/2022 15:05 | 11.3 | <7.00 | 3.76 | 9.81 | <30.0 | <5.00 | 10.7 | 80.1 | <5.00 | 6.98 | 6.19 | 8.48 | -- | -- | -- | -- | -- | 0.70 | -- |
| AR | 430642089311901 | Pheasant Br Trib at Airport Rd nr Middleton, WI | 06/08/2022 15:30 | -- | -- | -- | -- | -- | -- | -- | -- | -- | -- | -- | -- | <1 | <1 | <1 | <3 | <100 | -- | -- |
| AR | 430642089311901 | Pheasant Br Trib at Airport Rd nr Middleton, WI | 06/08/2022 19:05 | 9.62 | <7.00 | 4.32 | 13.2 | <30.0 | <5.00 | 15.7 | 104 | <5.00 | 3.54 | 7.12 | 8.12 | -- | -- | -- | -- | -- | 1.2 | -- |
| AR | 430642089311901 | Pheasant Br Trib at Airport Rd nr Middleton, WI | 06/09/2022 03:05 | 5.85 | 7.51 | 6.58 | 15.1 | <30.0 | <5.00 | 27.5 | 159 | <5.00 | 2.00 | 8.93 | 9.38 | -- | -- | -- | -- | -- | 2.1 | -- |
| AR | 430642089311901 | Pheasant Br Trib at Airport Rd nr Middleton, WI | 06/09/2022 10:00 | -- | -- | -- | -- | -- | -- | -- | -- | -- | -- | -- | -- | <1 | <1 | <1 | <3 | <100 | -- | -- |
| TP | 430648089324101 | Pheasant Br Trib at Tallard Park nr Middleton, WI | 06/08/2022 09:15 | 306 | <7.00 | 2.07 | 3.32 | <30.0 | <5.00 | 2.31 | 33.7 | <5.00 | <1.00 | <1.00 | <5.00 | -- | -- | -- | -- | -- | <0.20 | -- |
| TP | 430648089324101 | Pheasant Br Trib at Tallard Park nr Middleton, WI | 06/08/2022 10:30 | 263 | <7.00 | <2.00 | 1.64 | <30.0 | <5.00 | 1.46 | 20.1 | <5.00 | 2.43 | 1.89 | <5.00 | -- | -- | -- | -- | -- | <0.20 | -- |
| TP | 430648089324101 | Pheasant Br Trib at Tallard Park nr Middleton, WI | 06/08/2022 11:20 | -- | -- | -- | -- | -- | -- | -- | -- | -- | -- | -- | -- | <1 | <1 | <1 | <3 | <100 | -- | 0.155 |
| TP | 430648089324101 | Pheasant Br Trib at Tallard Park nr Middleton, WI | 06/08/2022 12:00 | 81.8 | <7.00 | <2.00 | 1.08 | <30.0 | <5.00 | 0.87 | 9.9 | <5.00 | 1.88 | 2.44 | 5.22 | -- | -- | -- | -- | -- | 0.050 | -- |
| TP | 430648089324101 | Pheasant Br Trib at Tallard Park nr Middleton, WI | 06/08/2022 13:15 | -- | -- | -- | -- | -- | -- | -- | -- | -- | -- | -- | -- | <1 | <1 | <1 | <3 | <100 | -- | 0.112 |
| TP | 430648089324101 | Pheasant Br Trib at Tallard Park nr Middleton, WI | 06/08/2022 15:00 | 50.3 | <7.00 | <2.00 | 1.18 | <30.0 | <5.00 | 1.15 | 13.2 | <5.00 | 1.78 | 2.17 | <5.00 | -- | -- | -- | -- | -- | 0.057 | -- |
| TP | 430648089324101 | Pheasant Br Trib at Tallard Park nr Middleton, WI | 06/08/2022 15:10 | -- | -- | -- | -- | -- | -- | -- | -- | -- | -- | -- | -- | <1 | <1 | <1 | <3 | <100 | -- | -- |
| TP | 430648089324101 | Pheasant Br Trib at Tallard Park nr Middleton, WI | 06/08/2022 23:00 | 78.8 | <7.00 | <2.00 | 1.5 | <30.0 | <5.00 | 1.47 | 18.6 | <5.00 | 1.53 | 1.18 | 5.94 | -- | -- | -- | -- | -- | 0.059 | -- |
| TP | 430648089324101 | Pheasant Br Trib at Tallard Park nr Middleton, WI | 06/09/2022 10:40 | -- | -- | -- | -- | -- | -- | -- | -- | -- | -- | -- | -- | <1 | <1 | <1 | <3 | <100 | -- | -- |
| TP | 430648089324101 | Pheasant Br Trib at Tallard Park nr Middleton, WI | 06/13/2022 09:25 | 1,430 | <7.00 | 5.12 | 4.5 | <30.0 | <5.00 | 1.82 | 32.9 | <5.00 | <1.00 | 1.8 | 11.2 | <1 | <1 | <1 | <3 | <100 | <0.20 | 0.053 |
| TP | 430648089324101 | Pheasant Br Trib at Tallard Park nr Middleton, WI | 07/13/2022 09:30 | 263 | <7.00 | 2.03 | 4.36 | <30.0 | <5.00 | 1.26 | 23.6 | <5.00 | 1.48 | <1.00 | 5.21 | <1 | <1 | <1 | <3 | <100 | <0.20 | -- |
Conversion Factors
U.S. customary units to International System of Units
Supplemental Information
Specific conductance is in microsiemens per centimeter at 25 degrees Celsius (µS/cm at 25 °C).
Concentrations of chemical constituents in water are in either milligrams per liter (mg/L) or micrograms per liter (µg/L).
Abbreviations
BTEX
benzene, toluene, ethylbenzene, and xylene
EPA
U.S. Environmental Protection Agency
GRO
gasoline range organics
HDPE
high-density polyethylene
LOD
limit of detection
MCL
maximum contaminant level
NFM
National Field Manual
Pb
lead
RPD
relative percentage difference
USGS
U.S. Geological Survey
WSLH
Wisconsin State Laboratory of Hygiene
For more information about this publication, contact:
Director, USGS Upper Midwest Water Science Center
1992 Folwell Avenue
St. Paul, MN 55108
763–783–3100
For additional information, visit: https://www.usgs.gov/centers/umid-water
Publishing support provided by the
Rolla Publishing Service Center
Disclaimers
Any use of trade, firm, or product names is for descriptive purposes only and does not imply endorsement by the U.S. Government.
Although this information product, for the most part, is in the public domain, it also may contain copyrighted materials as noted in the text. Permission to reproduce copyrighted items must be secured from the copyright owner.
Suggested Citation
Schachter, L.A., and Stuntebeck, T.D., 2024, Perchlorate, metals, organic compounds, and lead isotopes in groundwater, surface water, shallow groundwater, and soil within and near the Middleton Municipal Airport–Morey Field (C29), Middleton, Wisconsin, 2022: U.S. Geological Survey Scientific Investigations Report 2024–5113, 55 p., https://doi.org/10.3133/sir20245113.
ISSN: 2328-0328 (online)
Study Area
| Publication type | Report |
|---|---|
| Publication Subtype | USGS Numbered Series |
| Title | Perchlorate, metals, organic compounds, and lead isotopes in groundwater, surface water, shallow groundwater, and soil within and near the Middleton Municipal Airport–Morey Field (C29), Middleton, Wisconsin, 2022 |
| Series title | Scientific Investigations Report |
| Series number | 2024-5113 |
| DOI | 10.3133/sir20245113 |
| Publication Date | December 17, 2024 |
| Year Published | 2024 |
| Language | English |
| Publisher | U.S. Geological Survey |
| Publisher location | Reston, VA |
| Contributing office(s) | Upper Midwest Water Science Center |
| Description | Report: viii, 55 p.; Data Release; Dataset |
| Country | United States |
| State | Wisconsin |
| City | Middleton |
| Online Only (Y/N) | Y |
| Additional Online Files (Y/N) | N |