Hydrologic and Hydraulic Analyses of Silver Creek and Selected Tributaries Associated with Scott Air Force Base, Illinois, 2022–24
Links
- Document: Report (97.3 MB pdf) , HTML , XML
- Datasets:
- U.S. Department of Agriculture, Natural Resources Conservation Service database - GeoSpatial data gateway
- USGS National Water Information System database - USGS water data for the Nation
- Data Release: USGS data release - Archive of hydrologic and hydraulic models used in the analyses of Silver Creek Basin and selected tributaries associated with Scott Air Force Base, Illinois, 1992–2050
- NGMDB Index Page: National Geologic Map Database Index Page (html)
- Download citation as: RIS | Dublin Core
Acknowledgments
The authors acknowledge Joseph Weber (Restoration Program Manager) and Graham Hults (Environmental Program Manager) from the Scott Air Force Base for their assistance in collecting information and resources on infrastructure, flooding, and planned development on and near Scott Air Force Base. The authors also acknowledge the Illinois Department of Natural Resources for their continued funding for the operation of the Silver Creek near Troy, Illinois, streamgage, and the U.S. Army Corps of Engineers—St. Louis District for their funding of the Silver Creek near Freeburg, Illinois, streamgage.
The authors also acknowledge U.S. Geological Survey employees Dan Grant, Aaron Walsh, and Josh Keele for field assistance in the installation, surveying, and operation of water-level monitoring equipment used in this study, and the collection of streamflow measurements used in model calibration.
Abstract
A hydrologic model of the Silver Creek Basin in southwest Illinois, and a hydraulic model of a selected reach of Silver Creek and local tributaries on and near Scott Air Force Base, Illinois, were developed to assess the effects of temporal land-use development in the Silver Creek Basin, the potential effects of projected changes based on future precipitation, and the effects of added detention storage in selected tributaries near Scott Air Force Base. The hydrologic model consists of a total of 52 scenarios—24 scenarios for an assessment of basin-wide changes in hydrology, and 28 scenarios for the hydraulic analysis of a focus area of Silver Creek and tributaries on and near Scott Air Force Base. cenarios were run for precipitation events of 2-year through 500-year recurrence intervals (50-percent through 0.2-percent annual exceedance probability) and 24-hour durations..
The effects of detention structures added to Silver Creek tributaries throughout Scott Air Force Base were greater on water-level profiles (about 1 to 3 feet) than the effects of projected (2050) changes in precipitation (about 1 foot or less) in these basins. The results indicated that despite the increases in water-surface elevations resulting from projected increases in precipitation, the detention structures could provide a net reduction in water-surface elevations in the flood-prone western tributaries on the base. The effects of detention structures and projected precipitation also were assessed using the mapped extent of inundation for the simulated probabilistic precipitation scenarios. As an example, limited inundation of a residential area along Ash Creek was evident in the 5-year recurrence interval event for the scenarios without detention storage, whereas the first indications of flooding in the residential area from the scenario with detention storage were in the 50-year recurrence interval event.
Changes in hydrologic conditions followed a spatial pattern similar to that of the changes in land-cover development, with the greatest changes in the downstream one-half of the Silver Creek Basin and most pronounced in subbasins on and surrounding Scott Air Force Base. There was up to an estimated 54.6-percent increase in peak streamflows in subbasins on or near Scott Air Force Base from historical (1992) to current (2019) conditions, but changes in peak streamflows of as much as 144 percent are anticipated under the planned (to about 2050) land cover plus projected (2050) precipitation. The changes in the timing of peak streamflows were towards earlier peaks, with cumulative changes between historical and projected conditions approaching 0.75 hour (45 minutes) for a 2-year recurrence interval event. Results of the percentage change in cumulative event volume were similar to those of percentage change in peak streamflows in terms of magnitude of change and temporal and spatial distribution of changes. The greatest magnitude of percentage change in the assessed hydrologic properties was associated with the 2-year recurrence interval event, and the magnitude of the percentage change decreased with increasing probabilistic event recurrence interval. Subbasins with a substantial change in runoff yield between historical and current conditions were primarily in the downstream one-half of the Silver Creek Basin and most were within or adjacent to Scott Air Force Base. The magnitude of runoff yield changes increased with recurrence interval, and maximum changes were associated with subbasins on base and with the changes between the historical and current conditions.
Introduction
Scott Air Force Base (SAFB), located in St. Clair County in southwest Illinois (fig. 1), is approximately 3,600 acres with easement and right-of-way to another 1,030 acres (Scott Air Force Base, 2020a). The total SAFB community, on- and off-base, is about 40,000 military and civilian personnel and their families (Heartlands Conservancy, 2018) with an economic benefit approaching 3 billion dollars (Scott Air Force Base, 2020a). Flooding has been well documented within the installation, as identified in the “Lower Silver Creek watershed plan” (Heartlands Conservancy, 2018), historical flood insurance studies (Federal Emergency Management Agency, 2003), and environmental assessments for installation development (Science Applications International Corporation, 2007; HDR Incorporated, 2019). Flooding from local tributaries to Silver Creek, compounded by high main-stem streamflows, has been a reoccurring issue on SAFB at several historical flood-prone locations (fig. 1) most recently in July 2024 (Scott Air Force Base, 2024), July 2022, and August 2020 (Scott Air Force Base, 2020b), and affects stakeholders within or near SAFB.
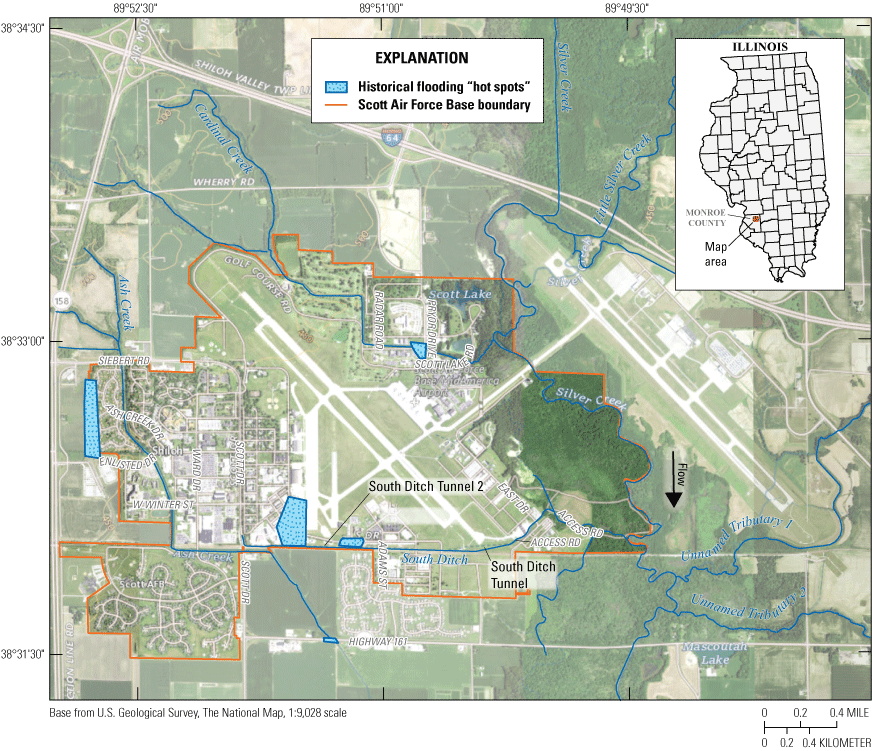
Local hydrography and historical flood-prone locations, Scott Air Force Base, Illinois.
In February 2017, SAFB adopted an Installation Complex Encroachment Management Action Plan (ICEMAP) designed to identify encroachment challenges and the resources required to manage those challenges in a way that is complementary with surrounding communities (Illinois Business Journal, 2017; Heartlands Conservancy, 2018). The ICEMAP is designed to provide tools to minimize the likelihood of future incompatible development surrounding the base and thus address encroachment challenges. One of the “suggested actions for SAFB and local communities to continue encroachment management in the future” in the ICEMAP is to “galvanize support for a regional stormwater management plan, working with regional partners and local communities to support and produce a regional stormwater management plan to address flooding issues throughout the region” (Heartlands Conservancy, 2018, p. 57 in appendix A). Environmental assessments within SAFB have resulted in progressive action ranging from mitigating storage to improvement of drainage systems (Science Applications International Corporation, 2007; HDR Incorporated, 2019). To complement surrounding communities and produce a regional stormwater management plan, analyses on the scale of the Silver Creek Basin along with local analyses detailed to the environmental constraints and future projects more specific to the base, would be beneficial. St. Clair County, where the base is located, has the authority to adopt and enforce floodplain regulations that apply to all buildings, structures, construction, excavation, and fill in the floodplain. The county’s code also allows “management and mitigation of the effects of urbanization on stormwater drainage” by consolidating the existing stormwater management framework into a united countywide plan for the management of natural and man-made drainageways (Heartlands Conservancy, 2018, p. 55 in appendix A). Additionally, the county is a member of the National Flood Insurance Program (NFIP), supporting a Floodplain Manager who coordinates the county’s membership in the Community Rating System, which is a program of the NFIP that incentivizes preemptive action to mitigate flood risk (Federal Emergency Management Agency, 2023).
Prediction and management of water-resource changes including land use and climate change continue to remain a large-scale societal issue (King and others, 2016). Because basin boundaries often extend beyond municipal and installation limits, SAFB, among other local communities, is challenged with developing and maintaining flood resiliency. An evaluation of the larger-scale basin would be of benefit in developing flood resiliency. As a part of the ICEMAP management plan, SAFB continues to evaluate development surrounding and within the installation to address encroachment challenges (Heartlands Conservancy, 2018) with the potential to work toward management of stormwater and flooding issues at a regional scale.
Activities that contribute to hydrologic changes in the basin are generally associated with existing urbanization thus giving some subbasins near SAFB (fig. 2) more importance than others. The potential consequences of basin activities and changing climate in Illinois (Frankson and others, 2022) also can affect the protection and compliance of future development of infrastructure on base. In addition, SAFB could benefit from a plan for future NFIP regulatory compliance and concurrent floodplain management at the installation.
In 2021, the U.S. Geological Survey (USGS) began a study to develop and calibrate hydrologic and hydraulic models of the Silver Creek Basin upstream from the USGS streamgage Silver Creek near Freeburg, Ill. (USGS station 05594800; U.S. Geological Survey, 2021a). The models are used to develop hydrographs and water-surface profiles that can describe the response and effects of varying rainfall magnitudes in the basin at multiple locations. The model results may then be used to estimate the effects of varying types of land cover, detention structures, and projected climate conditions on runoff and water-surface profiles. Such information may provide a better understanding of the conditions contributing to an increase in the susceptibility to flooding at selected locations in the basin and possible management activities to mitigate flooding potential.
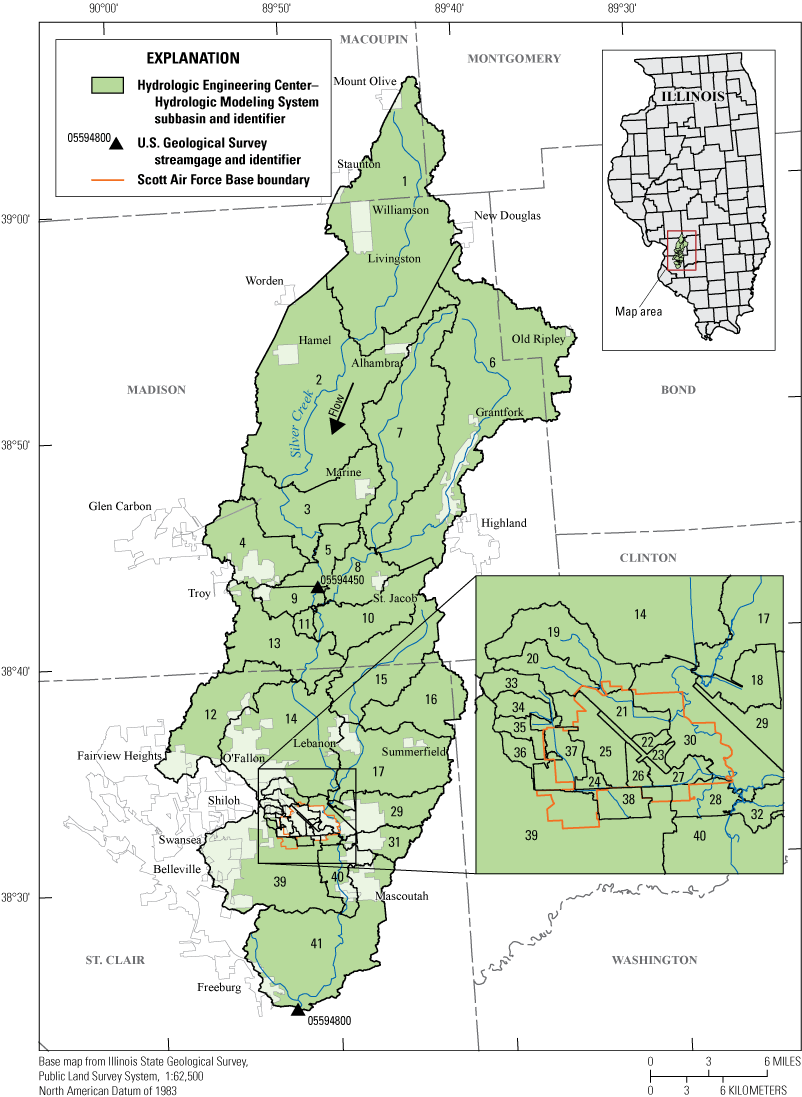
Silver Creek Basin, surrounding counties, municipalities, major streams, and the subbasins delineated for the Hydrologic Engineering Center–Hydrologic Modeling System model framework.
Study Area
The study area includes the Silver Creek Basin, spanning 464 square miles (mi2) upstream from the U.S. Geological Survey streamgage at Freeburg, Ill. (USGS station 05594800; U.S. Geological Survey, 2021a; fig. 2), with localized study emphasis on the Silver Creek main stem and tributaries affecting SAFB. Primary municipalities within the basin include O’Fallon, Shiloh, and Mascoutah (fig. 2). Major streams in the basin include Silver Creek, Little Silver Creek, and notable tributaries in or adjacent to the base—Cardinal Creek, Ash Creek, and South Ditch (fig. 1). Parts of the Silver Creek main stem upstream from SAFB are channelized, and sections downstream from the base are highly affected by log jams. Upstream from the Freeburg streamgage, land cover of the Silver Creek Basin in 2019 was 70.4 percent agriculture, 14.3 percent developed, 10.3 percent forest, 4.2 percent wetlands, and 0.8 percent open water (Dewitz and U.S. Geological Survey, 2021).
Purpose and Scope
This report summarizes an assessment of simulated changes in hydrology and hydraulics on a basin and localized SAFB-scale, that result from land-cover development, added detention, and projected climate conditions in the Silver Creek Basin. The assessment consists of the development, calibration, and sensitivity analysis of a hydrologic model of the Silver Creek Basin upstream from Freeburg, Ill., and a hydraulic model of a localized area within the basin that includes SAFB and the vicinity. The hydrologic model was developed to assess basin-scale changes in hydrology resulting from temporal changes in land cover and projected climate changes. The hydraulic model utilizes output from the hydrologic model to quantify localized changes on and near SAFB to the temporal changes in land cover and climate, and to assess potential mitigating effects of detention storage on flood peaks. The hydrologic model was calibrated and validated using observed historical events at two USGS streamgages in the basin. The hydraulic model was calibrated and validated using water-level data from three high-flow events on base. Sensitivity analyses were used to assess the effects of changes in selected hydrologic and hydraulic model parameters and detention storage modifications on peak streamflow and water-surface elevation at a reference location on base. Model results allow for comparisons of temporal changes in hydrology at the basin scale and the comparison of hydrology and hydraulics at a localized scale on base. Results also indicate potential mitigation effects of detention storage on current (2024) and projected hydrologic conditions.
Specific study objectives included the following:
-
1. Develop a hydrologic model and use it to assess the hydrologic changes (magnitude of peak streamflow, timing of the peak, cumulative volume of runoff) in the Silver Creek Basin upstream from Freeburg, Ill., under historical, current, and planned land cover, and planned land cover plus projected climate conditions for 2-, 10-, 25-, 50-, 100-, and 500-year recurrence interval (RI; 50-, 10-, 4-, 2-, 1-, and 0.2-percent annual exceedance probability [AEP]) precipitation events.
-
2. Develop a hydraulic model and simulate water-surface elevation profiles and inundation mapping extents corresponding to 2-, 5-, 10-, 25-, 50-, 100-, and 500-year RI (50-, 20-, 10-, 4-, 2-, 1-, and 0.2-percent AEP) precipitation events. This simulation is for streams within the SAFB model focus area, under current land-cover and precipitation conditions and projected precipitation conditions in 2050.
-
3. Using the developed hydraulic model, determine the effects of added detention structures on Cardinal Creek, Ash Creek, and South Ditch on the water-surface profiles and inundation extents on streams within the SAFB model focus area for 2-, 5-, 10-, 25-, 50-, 100-, and 500-year RI (50-, 20-, 10-, 4-, 2-, 1-, and 0.2-percent AEP) precipitation events.
Hydrologic and Hydraulic Model Development
A hydrologic model of the Silver Creek Basin upstream from Freeburg, Ill. (fig. 2), and a hydraulic model of the Scott Air Force Base focus area (fig. 3) were developed to assess the effects of planned land cover, projected changes in precipitation, and added runoff storage on peak streamflows of Silver Creek and selected tributaries. Probabilistic precipitation events were used to generate base condition streamflow hydrographs that were then subjected to modifications to represent planned/projected conditions under the noted modifications. Hydrographs developed for basins within the SAFB focus area were imported into the hydraulic model to define relative differences in water-surface elevation profiles in the study reaches under varying scenarios. The developed hydraulic model of the SAFB focus area was then used to estimate changes in peak streamflow and water-surface elevations associated with projected precipitation and runoff storage modifications. Tasks conducted to attain the study objectives included (1) developing a hydrologic model of the Silver Creek study basin and a hydraulic model of the SAFB focus area; (2) obtaining observed precipitation and continuous streamflow and water-surface elevation time series for the Silver Creek Basin; (3) collecting discrete streamflow measurements, water-level measurements, and high-water marks at selected locations within the SAFB focus area during high-flow events during the study; (4) calibrating selected parameters associated with the hydrologic model Hydrologic Engineering Center–Hydrologic Modeling System (HEC–HMS) computer program (U.S. Army Corps of Engineers, 2022a); (5) calibrating energy-loss factors (roughness coefficients) in the stream channel and floodplain associated with the hydraulic model within the Hydrologic Engineering Center–River Analysis System (HEC–RAS) computer program, developed by the U.S. Army Corps of Engineers (U.S. Army Corps of Engineers, 2023); (6) incorporating estimated modifications from historical and planned land cover change and projected precipitation into the calibrated HEC–HMS model for probabilistic precipitation events; (7) inputting selected hydrographs from HEC–HMS into HEC–RAS and computing water-surface profiles and generating inundation maps of simulated conditions with and without added detention storage under current and projected precipitation within the study area; and (8) analyzing differences in hydrologic and hydraulic conditions under the various model scenarios.
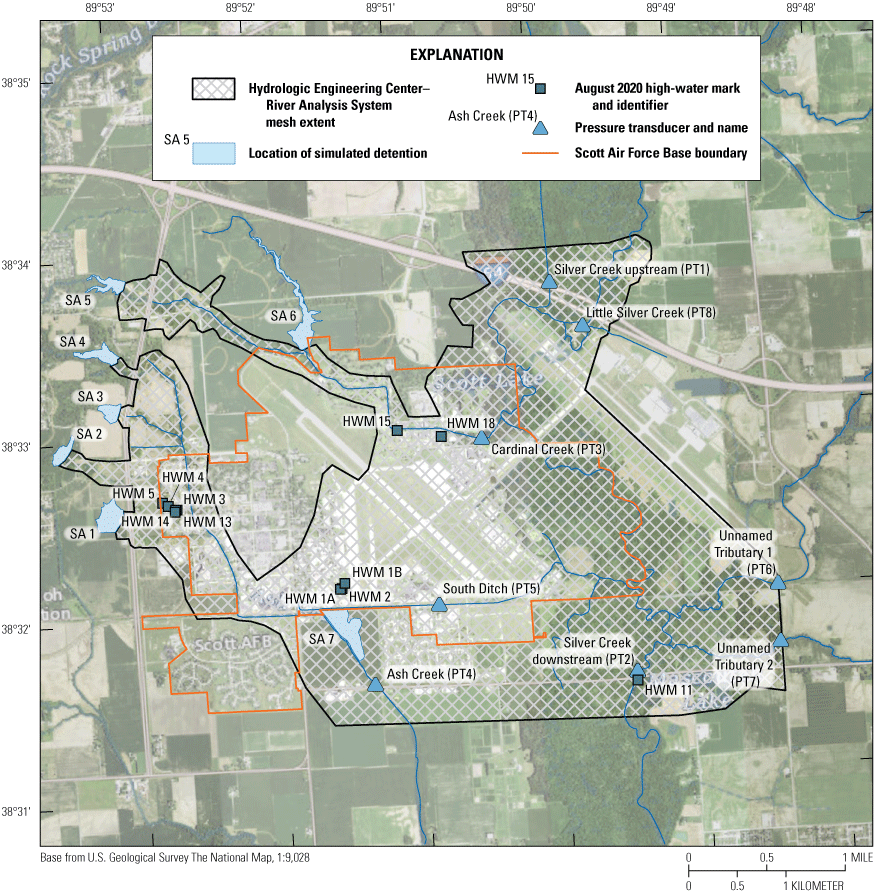
Extent of two-dimensional hydraulic model mesh, high-water marks from the August 2020 flood, and pressure transducer locations at Scott Air Force Base.
Hydrologic Data
Two USGS streamgages located in the Silver Creek Basin were used in the development, calibration, and validation of the hydrologic model used in determining streamflow hydrographs for this study. A precipitation-driven hydrologic model was developed to provide accurate streamflow hydrographs at gaged and ungaged locations within the study area to be used for temporal and spatial analyses of hydrologic characteristics and as input into the hydraulic model.
The two USGS streamgages, Silver Creek near Troy, Ill. (station 05594450; hereafter referred to as the “Troy streamgage”; U.S. Geological Survey, 2021b; table 1, fig. 2) and Silver Creek near Freeburg, Ill. (hereafter referred to as the “Freeburg streamgage”; station 05594800; table 1), were used to provide streamflow data, and eight pressure transducers (PTs) were installed to collect water-level data within the SAFB focus area (table 2; fig. 3). Continuous stage data were collected, and corresponding streamflow values were computed every 15 minutes at the USGS streamgages in accordance with techniques provided in Turnipseed and Sauer (2010). Stages at the PT locations were measured every 5 minutes using a submersible data logger, and data were corrected for atmospheric pressure changes using 5-minute barometric pressure data. The corrected stage data at each pressure transducer location were converted to water-surface elevations referenced to the North American Vertical Datum of 1988 by adding the corresponding vertical datum (table 2). In addition, several high-water marks (HWMs) were defined for the August 12–13, 2020, flood using methods defined in Koenig and others (2016). The time-series data for the PTs and the HWMs used in this study are available in Cigrand and Heimann (2024). Global navigation satellite system procedures corresponding to a level IV survey (Rydlund and Densmore, 2012) were used to acquire reference elevations for PT locations and HWMs in the study reach with a resulting vertical accuracy of reference points within 0.32 foot (ft).
Table 1.
Description of U.S. Geological Survey streamgages in the Silver Creek Basin (U.S. Geological Survey 2021a,b).[USGS, U.S. Geological Survey]
| USGS station name (fig. 1) | USGS station number | Drainage area (square miles) | Latitude (decimal degrees) | Longitude (decimal degrees) | Period of continuous streamflow record (water yeara) |
|---|---|---|---|---|---|
| Silver Creek near Troy, Illinois | 05594450 | 154 | 38.716389 | −89.82917 | 1966–presentb |
| Silver Creek near Freeburg, Illinois | 05594800 | 464 | 38.406111 | −89.87389 | 1970–presentb |
Table 2.
Elevation datums of pressure transducers used in the calibration and validation of the hydraulic model used in this study (Cigrand and Heimann, 2024).[NAVD 88, North American Vertical Datum of 1988]
| Pressure transducer identifier (fig. 3) | Latitude (decimal degrees) | Longitude (decimal degrees) | Associated basin | Elevation of datum (feet above NAVD 88) |
|---|---|---|---|---|
| PT1 | 38.562222 | −89.831944 | Silver Creek upstream | 421.55 |
| PT2 | 38.526111 | −89.824444 | Silver Creek downstream | 414.14 |
| PT3 | 38.548333 | −89.841189 | Cardinal Creek | 420.03 |
| PT4 | 38.526389 | −89.855694 | Ash Creek | 423.31 |
| PT5 | 38.533333 | −89.847500 | South Ditch | 423.69 |
| PT6 | 38.533333 | −89.807083 | Unnamed tributary 1 | 418.92 |
| PT7 | 38.528056 | −89.807222 | Unnamed tributary 2 | 417.35 |
| PT8 | 38.558056 | −89.828333 | Little Silver Creek | 419.92 |
Hydrologic Model Development
A hydrologic model was used to simulate streamflows for subbasins included in the Silver Creek Basin upstream from Freeburg, Ill., using design rainfall representing a range of magnitudes and probabilities of exceedance. The hydrologic model was developed using the U.S. Army Corps of Engineers HEC–HMS (version 4.9; U.S. Army Corps of Engineers, 2022a) and was designed to run for single rainfall events rather than as a continuous simulation. Therefore, the model was calibrated to single peak events or the initial peak of multipeak events.
The hydrologic model was developed to provide information at two scales—a basin scale and SAFB focus-area scale—to meet the study objectives, and subbasins within the model varied to meet the objectives of the two scales. The basin-scale model used subbasins at the hydrologic unit code 12 level (U.S. Department of Agriculture, 2021) corresponding to areas of 5.7 to 57.6 mi2. The SAFB focus area, located within the basin scale model, included small (0.14 to 2.4 mi2) subbasins used to simulate streamflow within selected tributaries on and adjacent to SAFB. A total of 41 subbasins were used in the HEC–HMS model (fig. 2) to represent the 464-mi2 basin. Streamflow routing for the basin-scale model was done within HEC–HMS using the Muskingum-Cunge method (Cunge, 1969), whereas outflows for the subbasins within the SAFB focus area (area covered by the HEC–RAS two-dimensional model) were exported from HEC–HMS and routed using HEC–RAS. The HEC–HMS basin-scale model was calibrated and validated using streamflow time series from the Troy and Freeburg streamgages for six selected high-flow events (table 3). The SAFB focus area subbasins in HEC–HMS were calibrated interactively with the HEC–RAS model using discrete streamflow measurements, high-water marks, and continuous pressure transducer water-level data from eight pressure transducers located on or adjacent to SAFB (fig. 3). The calibrated HEC–HMS model was then used to simulate precipitation runoff from selected probabilistic rainfall amounts over a 24-hour duration to determine effects of changes in land cover and projected climate changes on peak streamflows, peak timing, and hydrograph volumes at each subbasin. In addition, generated flow hydrographs from the HEC–HMS model were used as input in the HEC–RAS model to examine water-surface elevations and inundation under scenarios with and without added detention and projected precipitation.
Table 3.
Simulated high-flow events used in calibrating and validating the hydrologic and hydraulic models used in this study (U.S. Geological Survey, 2021a,b).[USGS, U.S. Geological Survey; ft3/S, cubic foot per second; HEC–HMS, Hydrologic Engineering Center–Hydrologic Modeling System; HEC–RAS, Hydrologic Engineering Center–River Analysis System; site information from U.S. Geological Survey (2021d)]
Model Scenarios
Fifty-two hydrologic and hydraulic model scenarios were developed for this study (table 4). The scenarios included 24 HEC–HMS-only scenarios used in determining hydrologic effects of land cover and projected precipitation on a basin scale. An additional 28 scenarios using HEC–HMS and HEC–RAS were used to determine hydraulic changes within the SAFB focus area resulting from detention and projected precipitation options. The HEC–HMS-only scenarios were run on the Silver Creek Basin upstream from the Freeburg streamgage with precipitation frequencies of 2-, 10-, 25, 50-, 100-, and 500-year recurrence intervals (50-, 10-, 4-, 2-, 1- and 0.2-percent AEP) over a 24-hour duration using the normal antecedent response condition in HEC–HMS (refer to “Loss Method” section in this report). Scenarios were run with historical (1992), current (2019), and planned land cover in addition to scenarios with planned land cover and projected (2050) precipitation. The hydrologic characteristics of the simulations—consisting of peak streamflow magnitude, timing of peak streamflow, and cumulative volumes—were compared against the current condition scenario.
Simulated flows from 2-, 5-, 10-, 25, 50-, 100-, and 500-year recurrence interval (50-, 20-, 10-, 4-, 2-, 1- and 0.2-percent AEP) precipitation events distributed over a 24-hour duration were used for the HEC-HMS with HEC-RAS scenarios. The objectives of these scenarios were to determine differences in hydraulic characteristics (water-surface profiles and inundation extents) of streams within and adjacent to SAFB resulting from added detention and the projected (2050) precipitation condition. The detention storage scenarios were developed to assess the potential effects of a representation of amended storage on the hydrology at a reference location rather than to serve as a prescriptive design for mitigation of peak streamflows. Detention structure components (dam height, outlet culvert diameter) incorporated into the HEC–RAS geometry were designed to maintain a storage pool within a designated open area in the target subbasin, store a 25-year recurrence interval event, and retain a targeted range of 20 to 100 acre-feet (acre-ft) of storage per square mile of drainage area (table 5).
Table 4.
Description of U.S. Army Corps of Engineers Hydrologic Engineering Center-Hydrologic Modeling System and Hydrologic Engineering Center-River Analysis System model scenarios developed in this study.[HEC–RAS, Hydrologic Engineering Center River Analysis System; CNII, curve number II or normal hydrologic response condition; RCP 4.5 2050, representative concentration pathway of 4.5 watts per square meter (vanVuuren and others, 2011) projected to year 2050]
Table 5.
Characteristics of detention structures included in the Silver Creek Hydrologic Engineering Center-River Analysis System with detention scenarios.[NAVD 88, North American Vertical Datum of 1988; mi2, square mile; SA, storage area]
| Site (fig. 3) |
Subbasin (fig. 2) | Drainage area (square miles) | Peak stage of 25-year recurrence event (feet above NAVD 88) |
Storage for 25-year recurrence event (acre-feet) |
Culvert diameter, feet (number of culverts) | Detention storage per mi2 drainage area (acre-feet) |
|---|---|---|---|---|---|---|
| SA1 | 36 | 0.263 | 479.51 | 23.4 | 3.0 (1) | 89.0 |
| SA2 | 35 | 0.281 | 557.50 | 27.2 | 2.5 (1) | 96.8 |
| SA3 | 34 | 0.322 | 514.52 | 26.8 | 4.5 (1) | 83.2 |
| SA4 | 33 | 0.407 | 526.16 | 33.0 | 3.0 (1) | 81.1 |
| SA5 | 20 | 0.674 | 537.12 | 49.7 | 3.0 (1) | 73.7 |
| SA6 | 19 | 1.44 | 462.98 | 50.5 | 5.0 (1); 4.5 (1) | 35.0 |
| SA7 | 24 and 25 | 1.10 | 432.80 | 25.4 | 3 (1)a | 23.1 |
Elevation Data
The elevation data used in the HEC–HMS model were obtained from several 1-meter DEMs derived from light detection and ranging (lidar) data published between November 14, 2017, and April 6, 2022 (U.S. Geological Survey, 2021c). The data were acquired and processed by Merrick-Surdex Joint Venture, LLP and Aerial Services, Inc. As per USGS quality level 2 standards (version 1.2; Heidemann, 2018), lidar data required a nonvegetated vertical accuracy of a maximum 10-centimeter (cm) root mean square error, and a vegetated vertical accuracy of a maximum of 30 cm at the 95th percentile (actual was 9.7 cm at the 95th percentile).
Land-Cover Change
Changes in land cover were determined using information and projected development data from national databases and selected surrounding counties and municipalities. The historical land-cover condition used in the basin corresponded to the 1992 Enhanced National Land Cover dataset (Nakagaki and others, 2007). Current conditions were represented by the 2019 National Land Cover Data (Dewitz and U.S. Geological Survey, 2021). Maps of future planned developments on SAFB and vicinity (University of Illinois, 2006; The Village of Shiloh, 2018; Saint Clair County, 2023) were georectified in ArcGIS Pro 3.1.2 (Esri, 2023) and mosaiced with the 2019 land cover. The differences in land cover translated into differences in model parameter values used for generating runoff for the historical (1992), current (2019), and planned (to about 2050) land-cover hydrologic models. Differences in land-cover development categories are the primary driver of differences in runoff between historical, current, and future/planned conditions. The change in total development categories (sum of developed open areas, low intensity development, medium intensity development, and high intensity development areas) between current and historical conditions indicated that changes in development within most subbasins were small (less than 10 percent). Subbasins with changes in development of more than 30 percent primarily were in model subbasins adjacent to and within SAFB (refer to fig. 4 inset). Notable changes in development were determined for subbasins in the lower Ash Creek, lower Cardinal Creek, lower South Ditch, and lower Little Silver Creek Basins. Additionally, changes in development of 10 to 20 percent also were determined for several subbasins in the upper Silver Creek Basin near the Troy streamgage (fig. 4). Two subbasins had decreases in development between the two periods of 0 to −3.7 percent, and this can be attributed to differences in land-cover classification between areas defined as “developed open areas” and “pasture” in the 1992 (Nakagaki and others, 2007) and 2019 (Dewitz and U.S. Geological Survey, 2021) land-cover classifications.
For those subbasins not included in available future comprehensive plans, the change in planned development was assumed to be equivalent to that documented between the 1992 (Nakagaki and others, 2007) and 2019 (Dewitz and U.S. Geological Survey, 2021) land-cover classifications. The change in development under planned conditions from existing conditions (fig. 5) indicated a similar spatial development pattern to that for current and historical conditions. There was less than a 10-percent change in developed categories in most upper Silver Creek subbasins, and subbasins with more than a 20-percent change in development were located in the lower one-third of the Silver Creek Basin. The maximum change in planned compared to current development was expected to be higher (as much as 61.4 percent) than that determined for current and historical (40.2 percent) development. The greatest change in development on base corresponded to subbasins in Ash Creek and Cardinal Creek, and in a subbasin in a Silver Creek tributary to the east of SAFB (fig. 5).
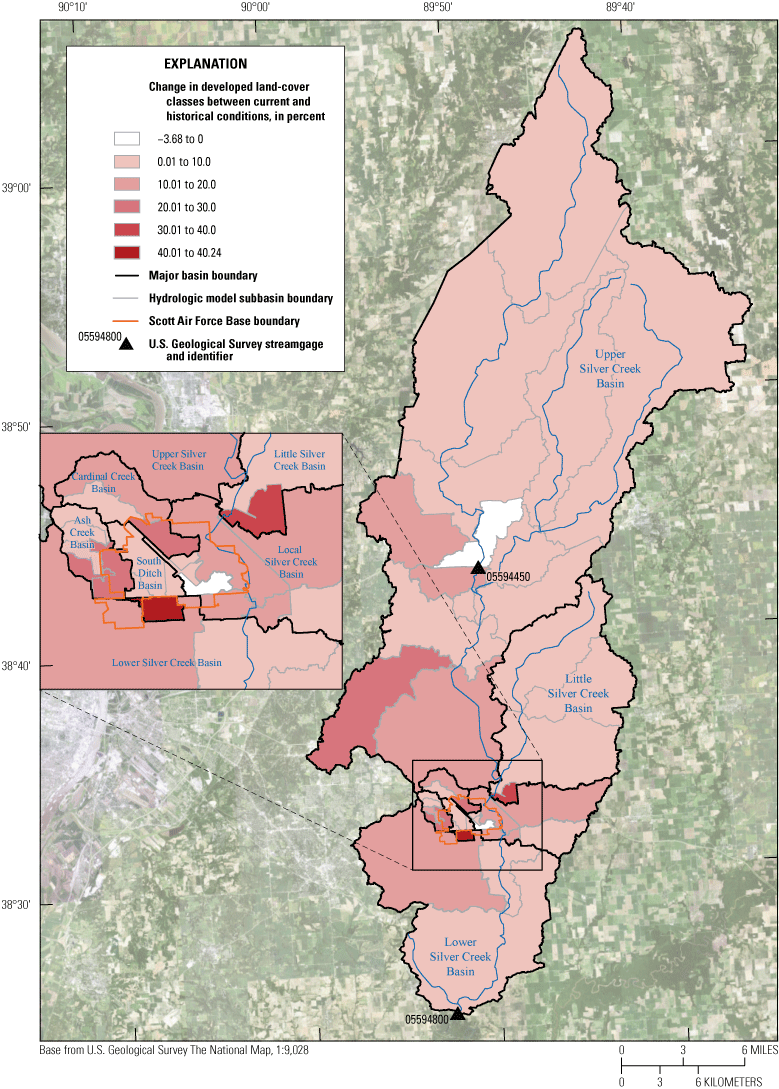
Change in land-cover development, by subbasin, between current (2019) and historical (1992) conditions.
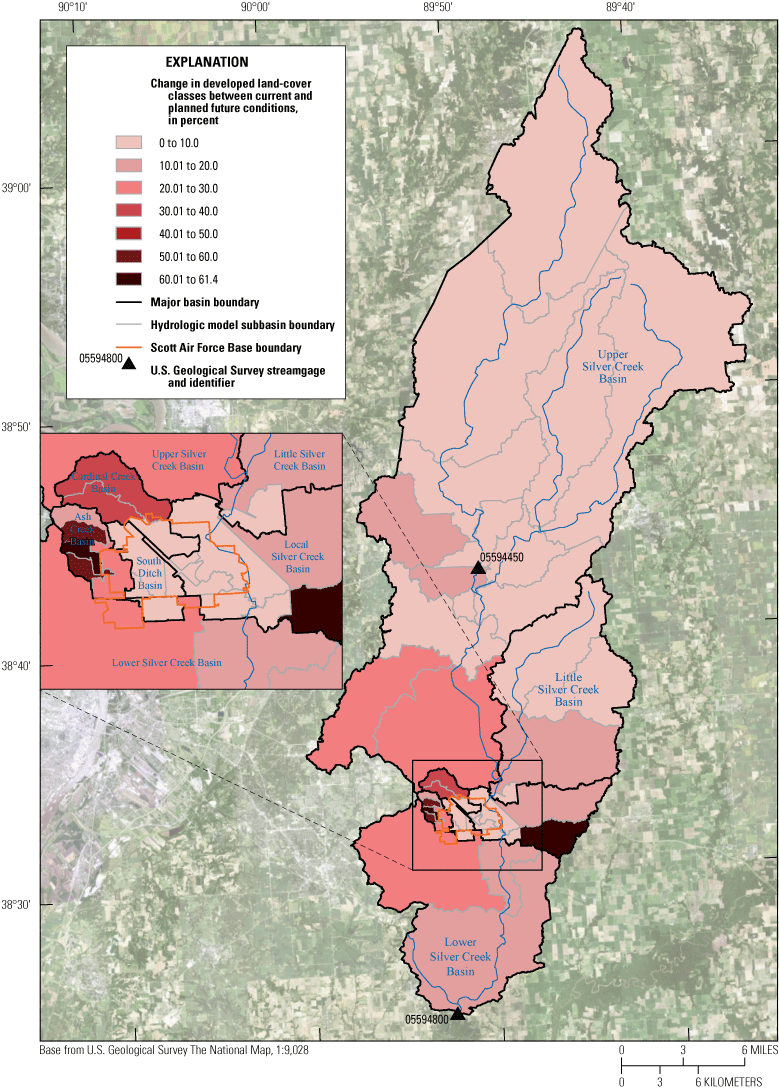
Change in land-cover development, by subbasin, between planned future and current (2019) conditions.
Precipitation Data
Accurate precipitation data are needed as inputs to the hydrologic model to simulate the resulting runoff and streamflow. Required current and historical precipitation data were unavailable for stations within the Silver Creek Basin and, therefore, hourly gridded Multi-Radar Multi-Sensor Q3 estimate (Iowa State University, 2021) precipitation data were used for the calibration and validation events. The 1-square-kilometer gridded Multi-Radar Multi-Sensor precipitation data also accounted for differences in the spatial distribution of precipitation within the Silver Creek Basin.
Precipitation values used as input to the hydrologic model for the 52 modeled scenarios (table 4) were developed from precipitation frequency estimates (Angel and others, 2020) for southwest Illinois. Projected climate condition scenarios included adjustment factors to the precipitation frequency estimates that corresponded to a climate model scenario using the representative concentration pathway of 4.5 watts per square meter (vanVuuren and others, 2011) that was projected to 2050. Precipitation corrections for the projected climate scenarios were processed using the Coupled Model Intercomparison Project climate data processing tool version 2.1 (U.S. Department of Transportation, 2022) using the downscaled Coupled Model Intercomparison Project 5 multimodel ensemble, Localized Constructed Analog dataset from Bureau of Reclamation (2022). The precipitation frequency values represent a total magnitude for a specified duration. Time series of precipitation based on these totals were developed by distributing the precipitation in 5-minute increments over the specified 24-hour duration using the Frequency Storm precipitation distribution feature in HEC–HMS and the incorporated TP40 area reduction curve (Hershfield, 1961) adjustment.
Transformation Method
Precipitation exceeding soil infiltration and storage was transformed into runoff in the developed HEC–HMS model using the Clark (1945) unit-hydrograph method. Two parameters needed to define this unit-hydrograph method are time of concentration (Tc) and a storage coefficient (R) (U.S. Army Corps of Engineers, 2022b). The Tc is the time of travel (in hours) it takes for precipitation runoff to travel from the most distant point in a subbasin to the subbasin outlet. R is a storage coefficient (in hours) used to account for storage within the floodplain such as wetlands, reservoirs, and bridges that can produce flood-wave attenuation. Initial estimates of Tc were calculated using the TR–55 methodology (Soil Conservation Service, 1986) for runoff travel time. The computed Tc estimates were used to compute initial estimates of R using R/(Tc+R)=0.4 corresponding to the approximate mean value for this relation in rural basins in west central Illinois (Graf and others, 1982; Straub and others, 2000), and these parameters were adjusted during model calibration.
Loss Method
The infiltration calculations in HEC–HMS are performed by a loss method for each subbasin (U.S. Army Corps of Engineers, 2022b). The Soil Conservation Service runoff curve number (CN) method was used to simulate infiltration losses from precipitation (Soil Conservation Service, 1986; Natural Resources Conservation Service, 2004). The CN values were applied to each subbasin according to the TR–55 methodology (Soil Conservation Service, 1986), and represent hydrologic soil types, land uses and treatments, and antecedent response conditions. Separate composite CNs at the CNII or “normal” antecedent response condition were determined for each subbasin for the historical land-cover condition, the current land-cover condition, and a planned land-cover condition representing a future condition to about 2050. The historical condition used the Enhanced National Land Cover Data 1992 (Nakagaki and others, 2007), the current condition used the 2019 National Land Cover Data (Dewitz and U.S. Geological Survey, 2021), and the planned (to about 2050) condition incorporated proposed development in the basin, where available, with development in remaining subbasins conservatively estimated as being at a level comparable to land-cover changes between 1992 and 2019. The CN grid development uses soil spatial data from the Soil Survey Geographic Database (Natural Resources Conservation Service, 2021), land-cover information from the corresponding time period (historical, current, planned/future), and a common lookup table of CN values corresponding to soil hydrologic classes and land use (Soil Conservation Service, 1986). The CN grids were developed using QGIS ver. 3.18 (QGIS Development Team, 2021) and procedures provided by Merwade (2021).
Base-Flow Method
The recession base-flow method (Chow and others, 1988) was used to simulate base flow within the basin. For this method, the HEC–HMS model requires three parameters: initial streamflow, a recession constant, and a ratio-to-peak constant (U.S. Army Corps of Engineers, 2022b). The initial streamflow was applied to the subbasin as a ratio of cubic feet per second per square mile. The recession constant represents the rate at which base flow recedes after a rainfall event. The ratio-to-peak constant is a threshold that indicates when to begin base flow on the recession limb of a hydrograph. These parameters were estimated and adjusted during the HEC–HMS model calibration.
Streamflow Routing Method
The Muskingum-Cunge method (Cunge, 1969) of routing was selected within HEC–HMS to accurately represent floodplain storage and peak streamflow attenuation conditions in model reaches incorporating multiple subbasin outflows (U.S. Army Corps of Engineers, 2022b). The Muskingum-Cunge routing method was used for the basin-wide assessment of hydrologic change. Individual HEC–HMS subbasin outflows within the two-dimensional HEC–RAS model footprint were used as inflows in the HEC–RAS model. The exception was the cumulative routed flows for Silver Creek and Little Silver Creek that were output from HEC–HMS and used as inflows to the HEC–RAS SAFB focus area model (fig. 3). The HEC–HMS and HEC–RAS models were run consecutively and iteratively for calibration, validation, and scenario development.
Hydrologic Model Calibration and Validation
The basin-scale hydrologic model (entire area upstream from the Freeburg streamgage) was calibrated and validated to observed streamflow data for six high-flow events between 2015 and 2023. The parameters CN, Tc, R, and base-flow recession were the primary parameters used in calibrating the simulated hydrograph peak and shape. Model parameters were adjusted with a target of matching the simulated hydrograph to the corresponding shape, magnitude, and timing of observed hydrographs at the Troy (fig. 6) and Freeburg (fig. 7) streamgages. Final calibration results indicated similarity in the simulated and observed hydrographs (figs. 6, 7; table 6). The Nash-Sutcliffe efficiency (NSE) coefficient (Nash and Sutcliffe, 1970) and percentage bias (PBIAS; Gupta and others, 1999) statistics were used to assess model fit. Values of NSE can vary from negative infinity (∞) to 1. Values of 1 correspond to a perfect match between simulated and observed time series, whereas values of 0 or less indicate that the mean of the observed values is a better predictor than the simulated values. The NSE values of the four calibration events using the Troy streamgage data ranged from 0.95 to 0.98, and NSE values of the four calibration events for the Freeburg streamgage data ranged from 0.81 to 0.98, indicating a good to excellent model fit (Moriasi and others, 2007; table 6). The PBIAS is a measure of the mean tendency of the simulated data to be larger or smaller than observed values. Values of PBIAS can vary from −∞ to ∞ with an optimum value of 0. The calibrated events at the Troy streamgage yielded PBIAS values of −0.46 to 6.8 percent, whereas those at the Freeburg streamgage were −15.8 to 0.75 percent, indicating a good to excellent model fit. A comparison of relevant hydrograph characteristics also indicates similarities, in general, between simulated and observed peak streamflow and time of peak (table 6).
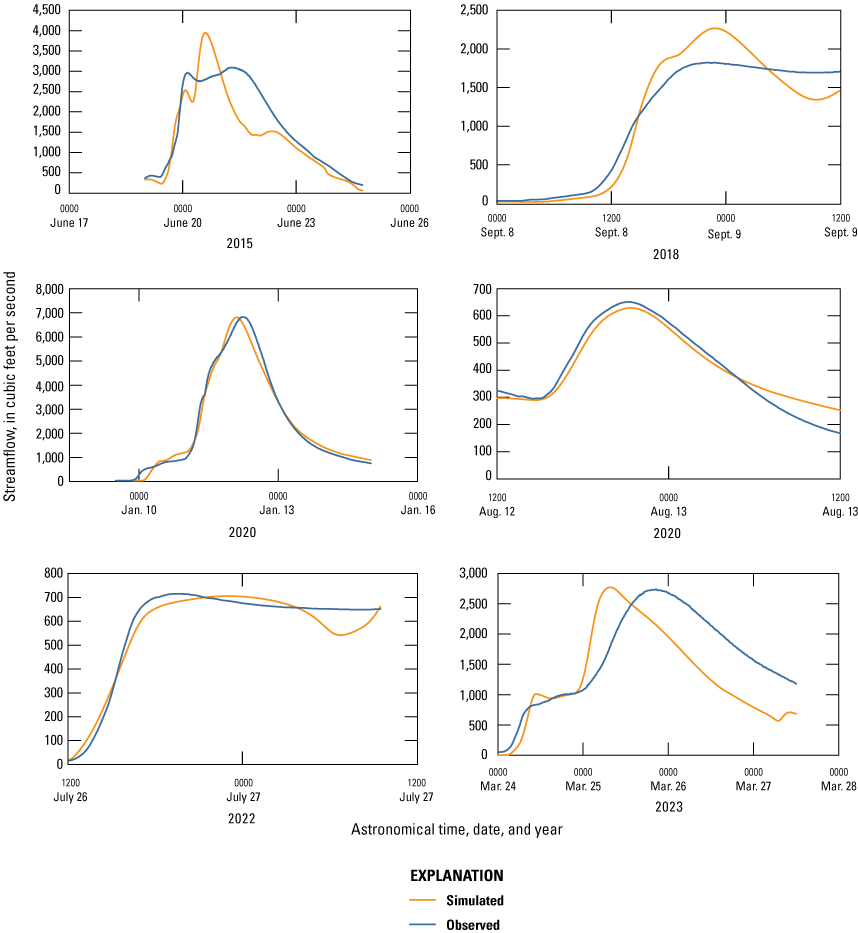
Simulated and observed streamflow hydrographs from selected calibration high-flow events at Silver Creek at Troy, Illinois (U.S. Geological Survey station 05594400). Observed streamflow data from U.S. Geological Survey (2021b).
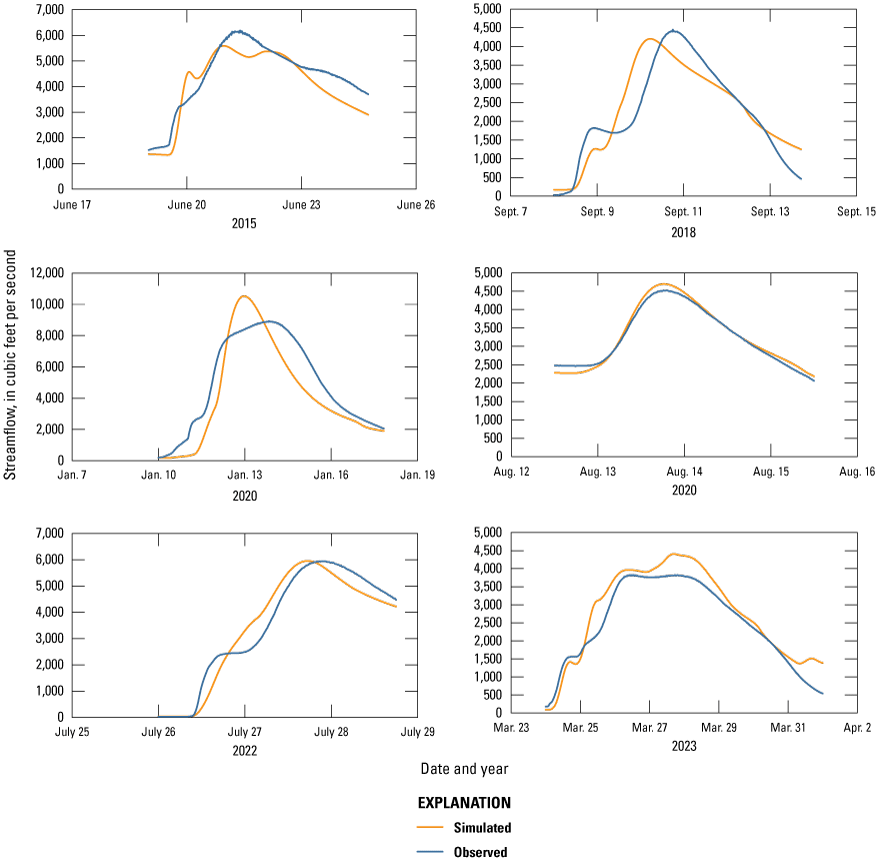
Simulated and observed streamflow hydrographs from selected calibration high-flow events at Silver Creek at Freeburg, Illinois (U.S. Geological Survey station 05594800). Observed streamflow data from U.S. Geological Survey (2021a).
Table 6.
Simulated and observed hydrograph characteristics of the calibration and validation high-water events at the U. S. Geological Survey streamgages Silver Creek at Troy and Silver Creek at Freeburg, Illinois. Observed data from U.S. Geological Survey (2021a,b).[ft3/s, cubic foot per second; dd/mm/yyyy hh:mm, day/month/year hour:minute; NSE, Nash Sutcliffe efficiency; PBIAS, percentage bias]
Two additional independent observed high-water events were used to validate the HEC–HMS calibrated models. The NSE values of the validation events at the Silver Creek at Troy streamgage was 0.73 for each event, whereas those at the Silver Creek at Freeburg streamgage were 0.88 and 0.87 indicating that the simulated values were a fair to good predictor of the independent observed hydrographs. The PBIAS values of the validation runs were −14.7 and −13.4 using Troy streamgage data and −8.5 and 4.2 using Freeburg streamgage data, again indicating a fair to good model fit. The simulated and observed peak streamflows and timing were variable but acceptable for the purposes of assessing future/planned land cover and climate effects (table 6).
Hydrologic Model Sensitivity Analyses
The primary hydrologic model parameters that were modified for calibration were Tc, R, and CN (infiltration), and the primary input data consisted of precipitation values. Model sensitivity was analyzed to determine the relative effect of each of these parameters or input datasets on model results. These analyses were conducted by modifying each of these parameters or datasets by +5 percent and −5 percent and determining the resulting change in peak streamflow and cumulative hydrograph volume at the outlet of a selected subbasin (subbasin 1; fig. 2). All sensitivity analyses used a CNII, 10-year, 24-hour duration runoff event. Results of the 5-percent change in sensitivity values indicated that the generated peak streamflow from the HEC–HMS model was most sensitive to changes in the CN parameter (−13.2- and 16.1-percent change), then to precipitation (−7.20- and 9.08-percent change), with the 5-percent changes in all other factors affecting peak streamflow by less than or equal to an absolute 2.72 percent (table 7). The timing of the generated peak streamflows were most sensitive to Tc (−40 and 45 minutes), with all other parameters affecting the peak timing by 10 minutes or less (table 7). The response of cumulative volume to −5 and +5 percent changes in model parameters or precipitation were similar to that of peak streamflow in that the model was most sensitive to CN (−13.1 and 16.0 percent, respectively) and precipitation (−7.18 and 9.04 percent, respectively). The 5-percent changes in the remaining parameters resulted in absolute changes of 0.16 percent or less in cumulative volumes.
Table 7.
Hydrologic model sensitivity analyses results (Cigrand and Heimann, 2024).[ft3/s, cubic foot per second; hh:mm, hour:minute; --, no value CN, curve number; R, storage; Tc, time of concentration]
Hydraulic Model Development
Hydraulic analyses in this study were conducted using HEC–RAS version 6.4 (U.S. Army Corps of Engineers, 2023), which is a one- or two-dimensional model for simulating water-surface profiles with steady-state (gradually varied) or unsteady-state flow computation options. A two-dimensional HEC–RAS model was developed of Silver Creek and tributaries in and adjacent to SAFB (fig. 3). An unsteady-state flow computation method was used in developing the scenarios for this study.
Topographic and Bathymetric Data
The elevation data used in the HEC–RAS model were obtained from a 1-meter digital elevation model (DEM) derived from lidar data published in May 2020 (Joseph Weber, Scott Air Force Base, written commun, 2021). The data were acquired and processed by Woolpert, Inc. As per USGS quality level 2 standards (version 1.2; Heidemann, 2018), the lidar data had a nonvegetated vertical accuracy of less than 10 cm (actual was 1.7 cm) root mean square error. The positional horizontal accuracy was 10 cm at a 95-percent confidence level. The accuracy specifications for all lidar datasets met or exceeded the U.S. National Map Accuracy Standards for vertical and horizontal accuracy guidelines for 2-ft contours (American Society for Photogrammetry and Remote Sensing, 2023).
Because the lidar data cannot provide ground elevations below water surfaces, channel cross sections for the model stream reaches were surveyed by a USGS field crew in February 2021. Water depths at the cross-section locations were measured by taping down from bridge crossings and kayaks. Water-surface profiles were interpolated by taping down from known bridge elevations on bridges throughout the stream reaches. The measured water depths were subtracted from the interpolated water surfaces at cross-section locations to collect channel topographic elevation points. The bathymetric data were incorporated into the HEC–RAS model, and the RAS Mapper utility in HEC–RAS was used to generate a DEM of channel bathymetry and to merge the bathymetry DEM with the terrain DEM. Bridge and culvert structures were also surveyed by a USGS field crew in January 2021. A level IV survey (Rydlund and Densmore, 2012) procedure was used in acquiring reference elevations with a resulting vertical accuracy of reference points within 0.32 ft.
Structures
A total of 34 hydraulic structures were represented in the hydraulic model of Silver Creek and its tributaries. These structures have the potential to affect water-surface elevations during flooding along the stream. The 34 structures included thirteen 2-lane or railroad bridges and 21 culverts. All bridge-geometry information is available in the hydraulic models used for analyses and provided in Cigrand and Heimann (2024).
Energy-Loss Factors
Hydraulic analyses require the estimation of energy losses that result from frictional resistance exerted by a channel on the flow. These energy losses are quantified by the Manning’s roughness coefficient (n-value; Chow, 1959). Initial (precalibration) n-values were selected based on field observations and high-resolution aerial photographs that were captured with the May 2020 lidar data (Joseph Weber, Scott Air Force Base, written commun., 2022), and by using tabulated (Chow, 1959) and photographic estimates of n-values (Barnes, 1967).
As part of the calibration process, the initial n-values were varied by flow and adjusted until the differences between simulated and observed water-surface elevations at the continuous water-level monitoring locations (fig. 3) along the study reach from the high-flow calibration events were minimized. The final n-values ranged from 0.03 to 0.046 for the main channel and from 0.035 to 0.12 for the overbank areas simulated in this analysis (Cigrand and Heimann, 2024). The lowest channel coefficients were placed in straight, downstream sections of the model reach, and the highest were placed in coarse-material reaches with vegetated banks and substantial coarse-woody debris. The lowest roughness coefficients on the floodplain were placed in barren lands, and the highest roughness coefficients were placed in densely forested and high-intensity developed areas.
Boundary Conditions and Detention Storage
Hydraulic model input consisted of boundary conditions of inflows obtained from the HEC–HMS model and defined outflow boundary conditions of the estimated normal depth slopes. The input hydrographs for the HEC–RAS model scenarios were generated using a range of precipitation frequency-duration events in HEC–HMS, as detailed in the “Hydrologic Data” section. Subcritical (tranquil) flow regime was assumed for the simulations. Normal depth, based on an estimated average water-surface slope of 0.00015, was used as the downstream boundary condition for Silver Creek and a slope of 0.0007 was used for Ash Creek (Cigrand and Heimann, 2024).
The HEC–RAS model was used to simulate the effects of detention storage and projected climate conditions on water-surface profiles and inundation extents within the model domain. Detention structures were incorporated into the model mesh in the headwaters of Ash Creek and Cardinal Creek and within the South Ditch drainage (fig. 3). Detention structures were placed in areas of the lidar with narrow valleys or “pinch-point” locations that were suitable for substantial volumes of water storage with the placement of a dam. No pinch-point location is suitable for the South Ditch detention, so the existing 3-ft (in diameter) overflow culverts that flow into a field were increased in size to 4 ft, and a berm was incorporated to the field to allow detention storage (table 5). The intent of incorporating detention structures was to determine the generalized potential effectiveness of such structures on flood mitigation rather than provide specific design recommendations. The detention structures incorporated in HEC–RAS were, therefore, designed to optimize detention for a mid-ranged recurrence interval precipitation event of 25 years. The optimization for this sized event was achieved iteratively through culvert sizing and dam height to maintain the inundation area within the constraints of the available open area. The hydrologic response condition for the HEC–RAS scenarios, as determined through the CN values used in HEC–HMS, was selected to correspond to the median value of the three HEC–RAS calibration events. This conservatively high antecedent response condition ensured that the events simulated were of potential consequence and likely to result in flooding.
Hydraulic Model Calibration and Validation
The HEC–RAS model, in conjunction with the HEC–HMS model previously described in the “Hydrologic Model Calibration and Validation” section, was calibrated to two observed high-flow events of July 26–28, 2022, and March 23–31, 2023 (fig. 8; table 8). Following calibration, the model was used to simulate peak conditions for an additional validation event on August 12–15, 2020, to confirm model performance (table 9). Model calibration was completed by adjusting n-values until the results of the hydraulic computations closely agreed with the observed water-surface elevations for given flows at the HWM and pressure transducer locations (fig. 3). The differences between observed peak and simulated water-surface elevations of the two high-flow events at the USGS PT locations ranged from −0.97 to 0.55 ft (mean of about −0.04 ft; table 8). The differences between the observed HWM elevations and simulated water-surface elevations for the validation event ranged from −0.27 to 0.30 ft (mean of about 0.04 ft; table 9). The results demonstrate that the model can accurately simulate water levels throughout the reach.
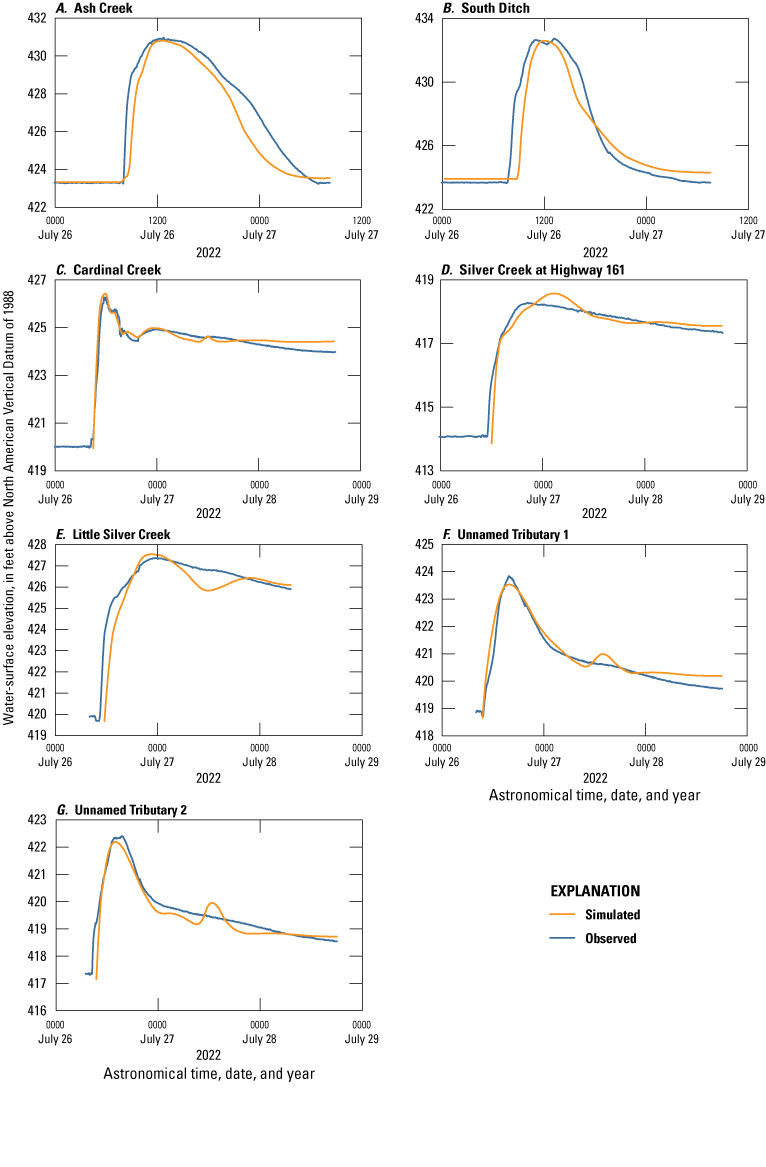
Simulated and observed streamflow hydrographs from selected high-flow events used in the calibration of the hydraulic model at Scott Air Force Base. Data from Cigrand and Heimann (2024). A, Ash Creek. B, South Ditch. C, Cardinal Creek. D, Silver Creek at Highway 161. E, Little Silver Creek. F, Unnamed Tributary 1. G, Unnamed Tributary 2.
Table 8.
Comparison of target and simulated water-surface elevations at continuous pressure transducer locations for the July 26–28, 2022, and March 23–31, 2023, calibration events.[ft, foot; NAVD 88, North American Vertical Datum of 1988; HWM, high-water mark; PT, pressure transducer]
| Water-level recording location (fig. 3) | Target water-surface elevation (ft, NAVD 88) |
Simulated water-surface elevation (ft, NAVD 88) |
Difference in elevation (ft) |
|---|---|---|---|
| PT2 | 418.28 | 418.57 | 0.29 |
| PT3 | 426.27 | 426.42 | 0.15 |
| PT4 | 430.97 | 430.81 | −0.16 |
| PT5 | 432.74 | 432.59 | −0.15 |
| PT6 | 423.86 | 423.55 | −0.31 |
| PT7 | 422.41 | 422.20 | −0.21 |
| PT8 | 427.37 | 427.55 | 0.18 |
| PT1a | 427.19 | 427.27 | 0.08 |
| PT2 | 417.66 | 417.88 | 0.22 |
| PT3 | 424.72 | 424.57 | −0.15 |
| PT4 | 427.37 | 426.40 | −0.97 |
| PT5 | 426.14 | 426.25 | 0.11 |
| PT6 | 420.53 | 420.54 | 0.01 |
| PT7 | 419.16 | 418.97 | −0.19 |
| PT8 | 426.48 | 427.03 | 0.55 |
Table 9.
Comparison of surveyed high-water marks and simulated peak water-surface elevations for the August 12–15, 2020, validation event.[ft, foot; NAVD 88, North American Vertical Datum of 1988; HWM, high-water mark]
Hydraulic Model Sensitivity Analyses
The sensitivity of the hydraulic model was assessed using changes in Manning’s n-values and change in detention basin culvert diameter sizing. The Manning’s n-values were modified by +5 and −5 percent, and the culvert diameters used in the detention scenario were modified by +0.5 and −0.5 ft. Sensitivity analyses were used to provide an example of the effects of modification for a basin containing added detention using results from the Ash Creek Basin at Scott Drive (fig. 1). The analyses were run using a 10-year RI, 24-hour duration precipitation and the resulting effects on peak streamflow (determined as the percent difference in peak streamflow) and difference between the maximum water-surface elevation from the existing scenario maximum water-surface elevation were quantified (table 10).
Results indicate that simulated peak streamflows were highly sensitive to the incremental change in culvert size (−12.03- to 29.06-percent change in peak streamflows) and less sensitive to the incremental change in Manning’s n-values (−0.30 to 0.15 percent). The incremental change in culvert size resulted in changes of −0.13 to 0.17 ft in water-surface elevation at the reference location, whereas the small incremental change in Manning’s n still resulted in changes of −0.05 to 0.09 ft.
Table 10.
Hydraulic model sensitivity analyses results (Cigrand and Heimann, 2024).[ft3/s, cubic foot per second; ft, foot; --, no value; n, Manning’s n roughness coefficient]
Basin-Scale Assessment of the Effects of Projected Land-Cover Change and Projected Climate Conditions
The calibrated HEC–HMS model was used to assess the effects of land-cover change and projected climate conditions on the hydrology of all subbasins within the Silver Creek Basin. Analyses included the determination of the percentage change in peak streamflow, the change in the timing of the peak streamflow, and the change in total runoff volume. Analyses were conducted for probabilistic precipitation values for 2-, 10-, 25-, 50-, 100-, and 500-year RI events (50-, 10-, 4-, 2-, 1-, and 0.2-percent AEP). Comparisons were made to determine the magnitude of change between current conditions and those of historical, planned/future land cover, and planned/future land cover plus projected changes in probabilistic precipitation magnitudes (hereafter referred to as current, historical, future, and future+ scenarios). Selected results for the 2- and 100-year RI and 24-hour duration precipitation events are presented in the following sections. The results for all RI conditions are available in Cigrand and Heimann (2024).
Most of the subbasins in the assessment of change in peak streamflows between the historical and current condition 2-year RI results indicated a change of less than 5 percent (fig. 9A). These low-change condition subbasins primarily were distributed in the uppermost Silver Creek Basin but also included subbasins within Little Silver Creek, lower Silver Creek, and local tributaries to SAFB. The greatest changes (as much as –54.6 percent) in peak streamflows were in subbasins located on SAFB, indicating substantially lower peak streamflows under historical conditions compared to current conditions (fig. 9A). Additional subbasins with changes of 0 to −10 percent (Cigrand and Heimann, 2024) were located adjacent to SAFB and the middle part of the upper Silver Creek Basin. The one subbasin in upper Cardinal Creek with a positive change (6.38 percent) in peak streamflows (fig. 9A), indicating a higher peak streamflow under historical condition, was classified as barren land in 1992 and forested in 2019, thus resulting in a higher CN and a higher peak streamflow under the historical condition. A few of the subbasins with changes in peak streamflow greater than 5 percent also generally corresponded to those with a greater than 10-percent change in developed land-use categories between the historical and current conditions (fig. 4).
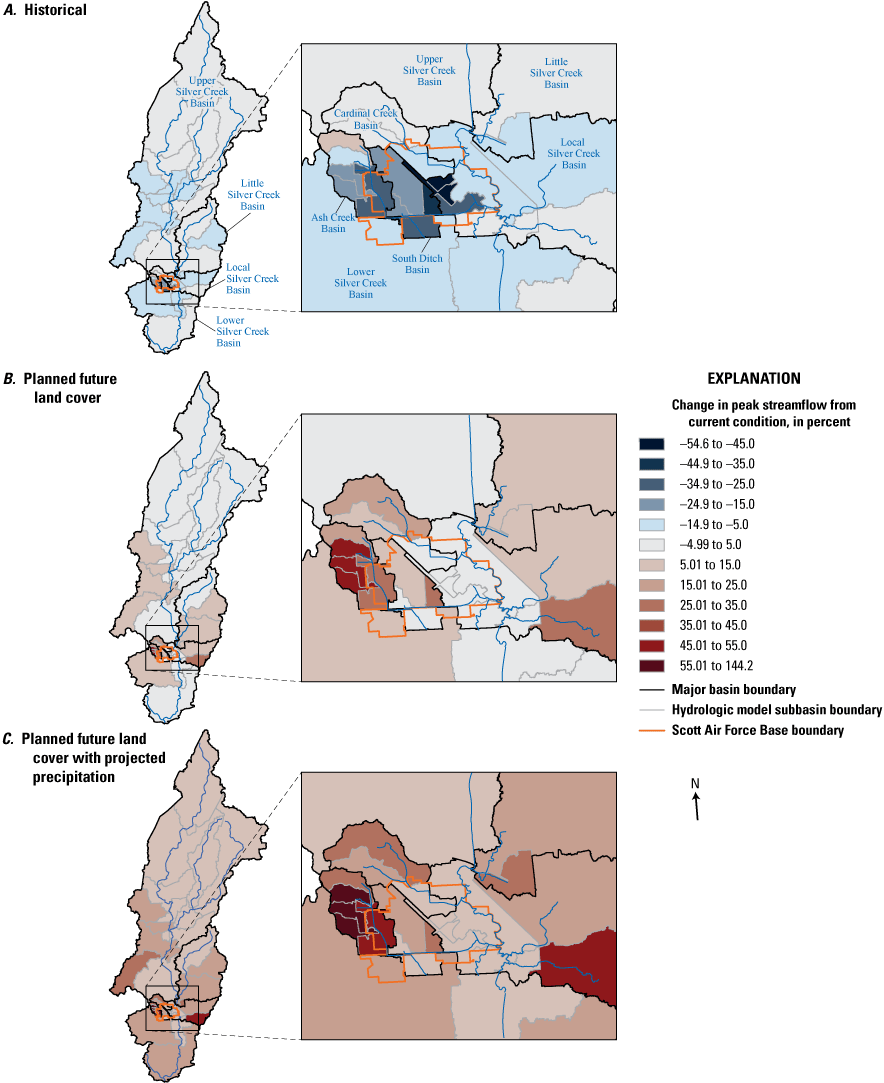
Simulated changes in the 2-year recurrence interval peak streamflow magnitudes relative to the current (2019) conditions for the Silver Creek Basin, Illinois.
The changes in peak streamflow under the higher 100-year RI condition between historical and current conditions indicated a greater number of subbasins with less than 5 percent change than the 2-year RI scenario (fig. 10A). Fewer subbasins also had a change exceeding 5 percent compared to the 2-year RI event, and the maximum change was −30.0 percent (fig. 10A). The lower percentage change in peak streamflow for the higher RI (100-year) compared to the 2-year RI event likely was the result of a smaller percentage of the peak streamflow being contributed by direct runoff from impervious surfaces for the 100-year RI and a greater percentage of the peak streamflow being contributed from runoff from saturated soils of nonimpervious areas. That is, the relative contribution of direct runoff from impervious surfaces decreases as the magnitude of the event increases and remaining saturated areas contribute a larger part of total runoff.
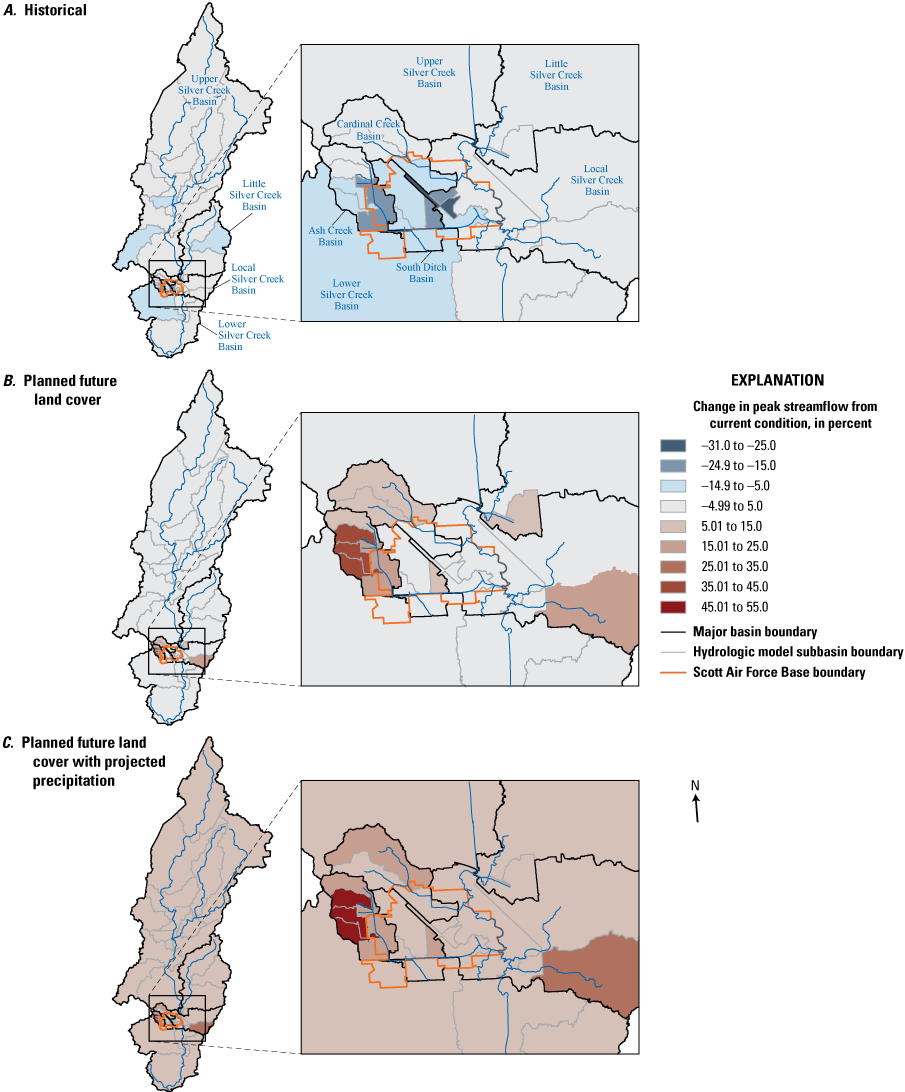
Simulated changes in the 100-year recurrence interval peak streamflow magnitude relative to the current (2019) conditions for the Silver Creek Basin, Illinois.
The changes in peak streamflow under the future conditions for the 2-year RI simulation indicate increases in peak streamflows relative to current conditions, and the subbasins with the most substantial increases were similar to those with the greatest change between historical and current conditions (fig. 9B). Most of the subbasins had a change in peak streamflow of less than 5 percent. The greatest change (122 percent) again was indicated for subbasins on SAFB and within the Ash Creek Basin. For the 100-year RI scenario under future conditions, the magnitude of change was substantially less (41.7 percent) than that for the 2-year RI event (122 percent; fig. 10B). Only 10 subbasins indicated changes in peak streamflow of greater than 5 percent for the future 100-year RI event, and these were restricted to local Silver Creek tributaries on SAFB and particularly the Ash Creek subbasins.
Simulated future+ conditions for the 2-year RI event resulted in increases in peak streamflow relative to current conditions of greater than 5 percent for all subbasins (fig. 9C). Increases generally were between 5 and 15 percent but the changes in peak streamflows were additive in those subbasins identified with increases in the future condition scenario, with maximum increases of 144 percent in the Ash Creek subbasins in the 2-year RI simulation (fig. 9C) and 52.3 percent in the 100-year RI simulation (fig. 10C).
In addition to change in the magnitude of peak streamflows, the assessment of land-cover change in the Silver Creek Basin also was used to determine changes in the timing of peak streamflows under varying land cover and probabilistic precipitation conditions. Most subbasins in the 2-year RI event did not show more than a 0.05-hour (3-minute) change in the timing of historical peak streamflow in the basin compared to current conditions. Those subbasins with a change of greater than 0.05 hour indicate a longer time to peak under historical compared to current conditions (fig. 11A). The maximum change was 0.42 hour (25 minutes) in subbasins on and adjacent to SAFB, indicating peaks under historical conditions for the same event would occur later than under current conditions. One subbasin in the upper Ash Creek Basin on SAFB had a longer time to peak under current conditions compared to historical, which can be attributed to land classified as herbaceous in the historical land-cover dataset being reclassified as forest in the current land-cover dataset. Subbasins with positive (greater than 0.05 hour) changes in peak timing (fig. 11A) generally corresponded to those with substantial changes in peak streamflow magnitude (fig. 9A), indicating the multiple hydrologic effects from land-cover change. The number, magnitude, and location of subbasins with substantial change in timing between historical and current conditions differed for the 100-year RI event (fig. 12A) compared to the 2-year RI condition. Fewer subbasins were affected in the 100-year RI scenario, including only two in the upper Silver Creek Basin, and maximum change was +0.25 hour, indicating the timing of the streamflow peak under the current condition is 15 minutes earlier than under historical condition.
The temporal changes in land-cover condition were represented in the model using a simplified method of modification of CN values only. From the HEC–HMS sensitivity analyses it was evident that the timing of peak streamflows was insensitive to this model parameter. These results, therefore, represent conservatively low representations of changes in the timing of peak streamflow.
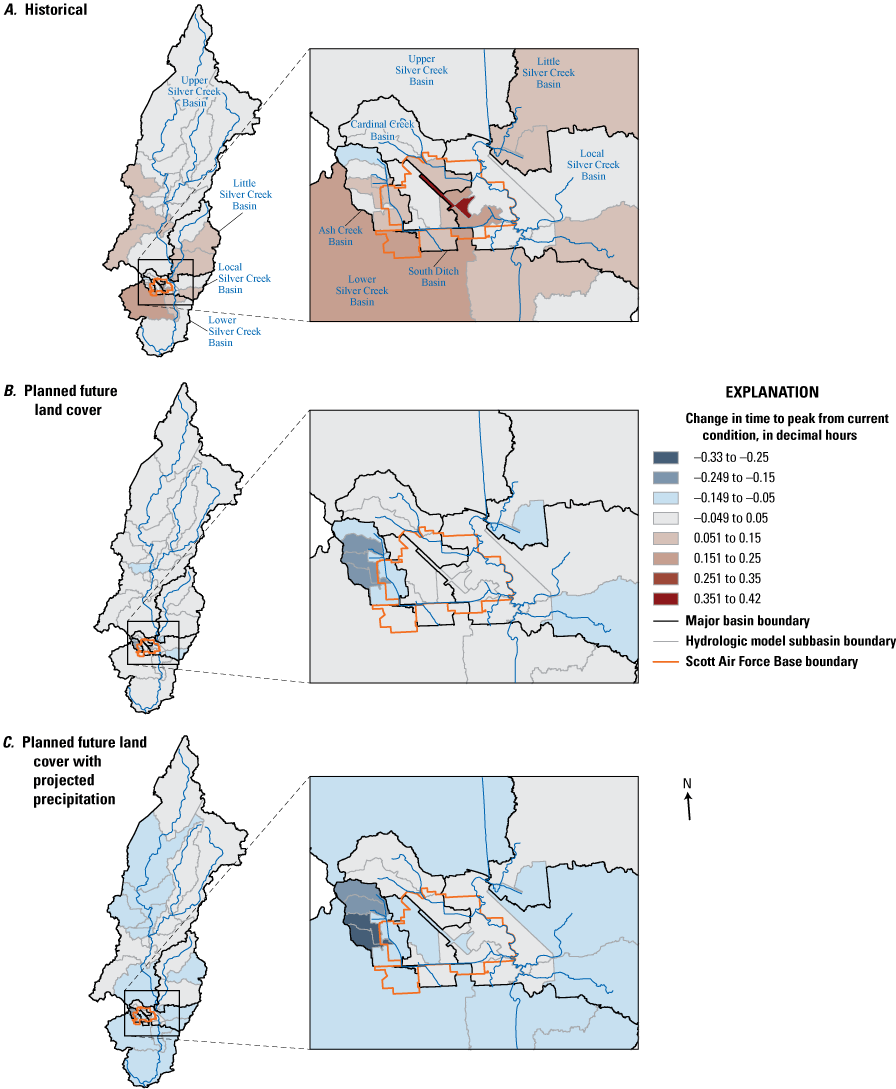
Simulated change in 2-year recurrence interval peak streamflow timing relative to current (2019) conditions for the Silver Creek Basin, Illinois.
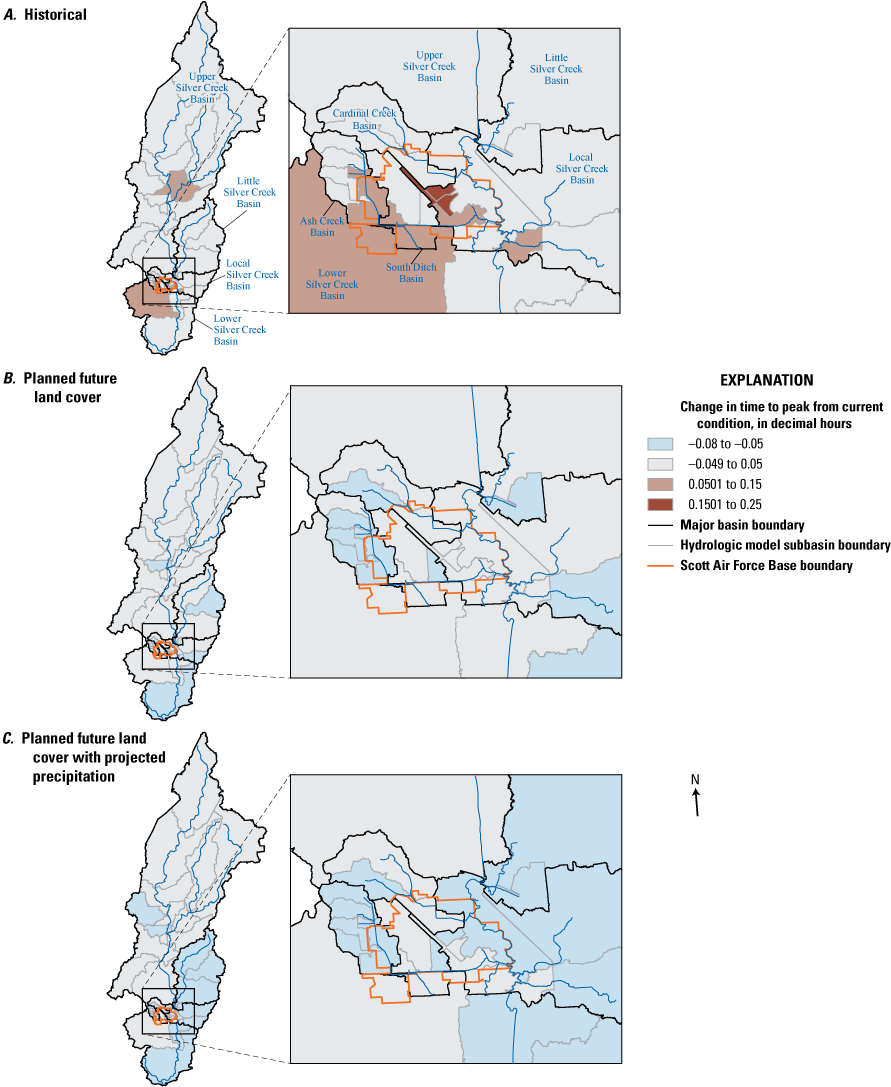
Simulated change in 100-year recurrence interval peak streamflow timing relative to current (2019) conditions for the Silver Creek Basin, Illinois.
Fewer subbasins had quantifiable changes in the timing of peak streamflow under the 2-year RI future scenario compared to the number of subbasins with changes in the magnitude of peak streamflow (figs. 9A, 11A). Most of the subbasins had changes of less than 0.05 hour (3 minutes) and the maximum change in timing for the 2-year RI future event compared with current conditions was −0.25 hour, or 15 minutes earlier, under future scenarios (fig. 11B) compared to current conditions. The maximum change was −0.08 hour (5 minutes earlier) for the 100-year RI future event (fig. 12B) compared to current conditions. A greater number of subbasins had quantifiable changes in the timing of peak streamflow under future+ scenarios than under future conditions. The number of subbasins with quantifiable changes in timing for 2-year RI and 100-year RI events, however, was less than the number affected by changes in the magnitude of peak streamflows under both probabilistic events. The maximum change in timing under future+ was −0.33 hour (20 minutes earlier) for the 2-year RI event (fig. 11C) and −0.08 hour (5 minutes earlier) for the 100-year RI event (fig. 12C), indicating that the greatest change again was for the lower RI and higher frequency events. Results indicate that the greatest change in timing of peak streamflows for the 2-year and 100-year RI occurred between the historical and current conditions compared to current and future conditions and that the cumulative change in peak streamflows is expected to be about 0.75 hour (45 minutes) to 0.33 hour (20 minutes) earlier between future and historical conditions for these probabilistic events.
The change in cumulative volume of storm events by subbasin under the varying land cover and precipitation conditions also was assessed (figs. 13–14). These results generally were similar to those of peak streamflow magnitude in terms of the relative percent magnitude of change and spatial distribution of change by subbasin under all simulated conditions. Most of the subbasins did not have a change that exceeded 5 percent under historical and current or current and future conditions for the 2-year RI and 100-year RI events. The maximum change in cumulative volume between historical and current conditions for the 2-year RI event was −51.4 percent (volume under current condition is 51.4 percent greater than historical) and −30.2 for the 100-year RI event and was for subbasins on SAFB (figs. 13A, 14A). Under future conditions the cumulative volumes increased by 93.5 percent for the 2-year RI and 38.9 percent under 100-year RI compared to current conditions (fig. 13B, 14B). Lastly, under future+ scenarios the change in volume increased 111 percent for 2-year RI and 49.0 percent for 100-year RI compared to current conditions (fig. 13C, 14C).
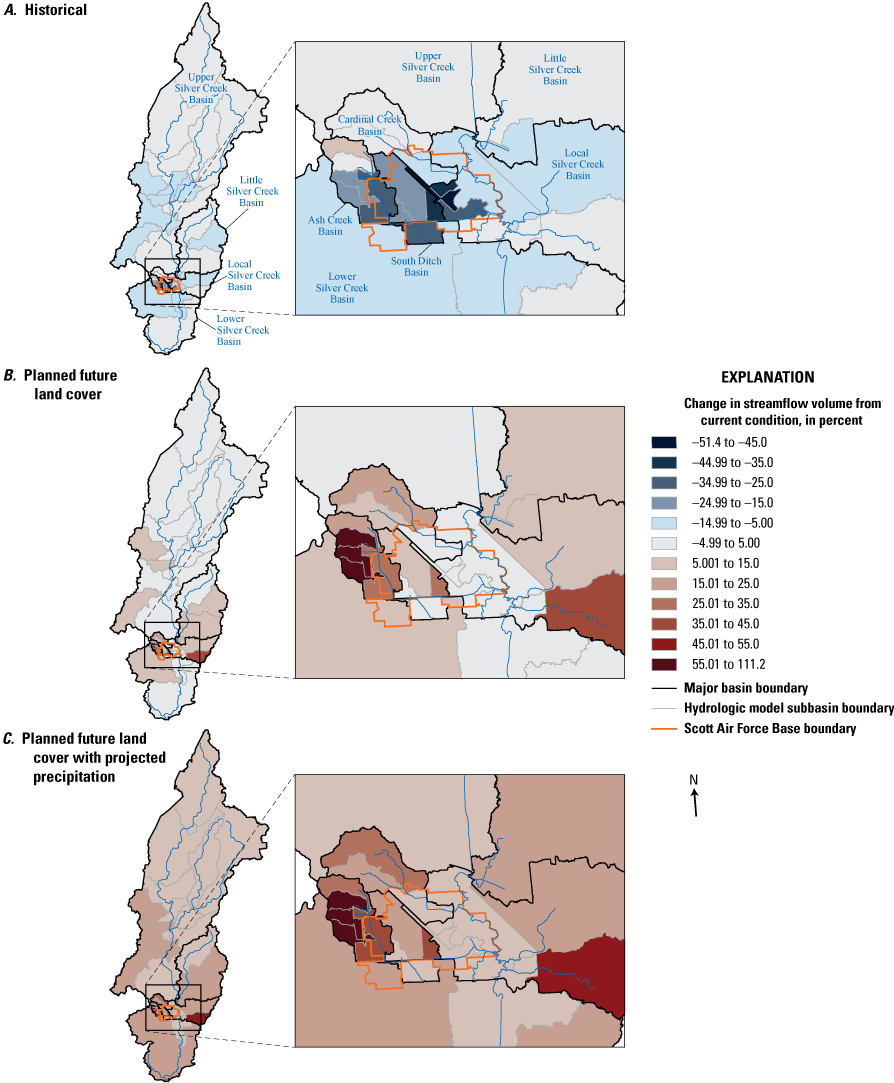
Simulated change in 2-year recurrence interval event volume relative to current (2019) conditions for the Silver Creek Basin, Illinois.
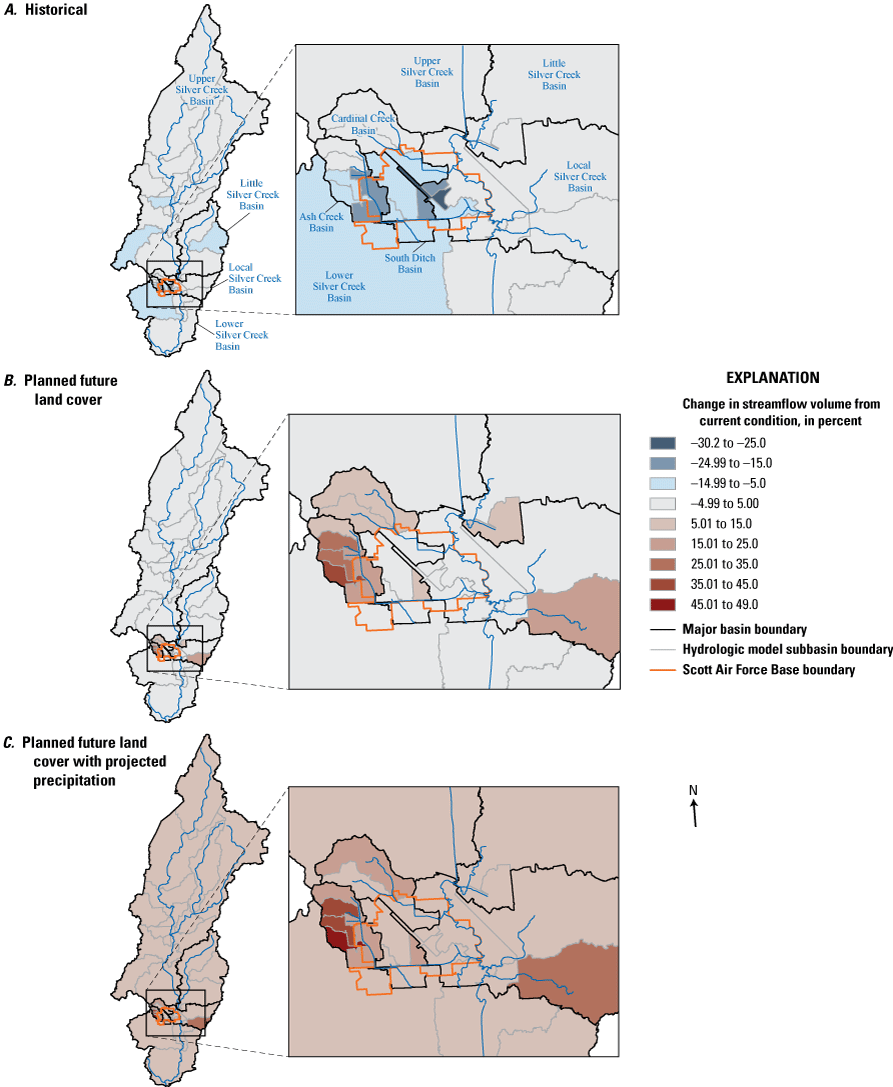
Simulated change in 100-year recurrence interval event volume relative to current (2019) conditions for the Silver Creek Basin, Illinois.
The results in the change in hydrologic properties presented thus far do not account for the substantial differences in subbasin drainage areas included in the hydrologic model. The relative change in cumulative event runoff volume, therefore, was normalized to drainage area to indicate relative change in subbasin runoff yields. Results of the comparison of 2-year RI event runoff yield indicated similarities in the spatial distribution of change to that of the percentage change in cumulative volume (figs. 13, 15). Subbasins with a substantial change in runoff yield between historical and current conditions were primarily in the downstream one-half of the Silver Creek Basin and most were within or adjacent to SAFB. Most of the Silver Creek Basin had a change in runoff yield between historical and current conditions of less than 10 acre-feet per square miles (acre-ft/mi2) for the 2-year RI and the maximum change in runoff yield of –63.6 acre-ft/mi2 was in a subbasin on SAFB (fig. 15A). This similarity in the spatial distribution of subbasins with substantial change between the differing runoff volume characteristics also is evident in the future and future+ results compared to the current conditions (figs. 13, 15). The maximum change under projected future conditions was 47.3 acre-ft/mi2 in subbasins on or near SAFB (fig. 15). Although the percentage change in event runoff decreased with increase in RI, the magnitude of runoff yield will naturally increase with higher RI. As with the 2-year RI results, the spatial distribution of the results of the 100-year RI change in runoff yield were similar to those for percentage change in runoff volume (figs. 14, 16). Most of the subbasins did not have a change in runoff yield of more than 10 acre-ft/mi2 between the historical and current condition and the maximum was –119.4 acre-ft/mi2 in a subbasin on SAFB (fig. 16A). Although most subbasins had a change of runoff yield of less than 10 acre-ft/mi2 for the future condition (fig. 16B), all subbasins had at least a 10-acre-ft/mi2 change for the future+ condition with a maximum change under the future+ condition of greater than 90 acre-ft/mi2 (fig. 16C) in subbasins on or near SAFB.
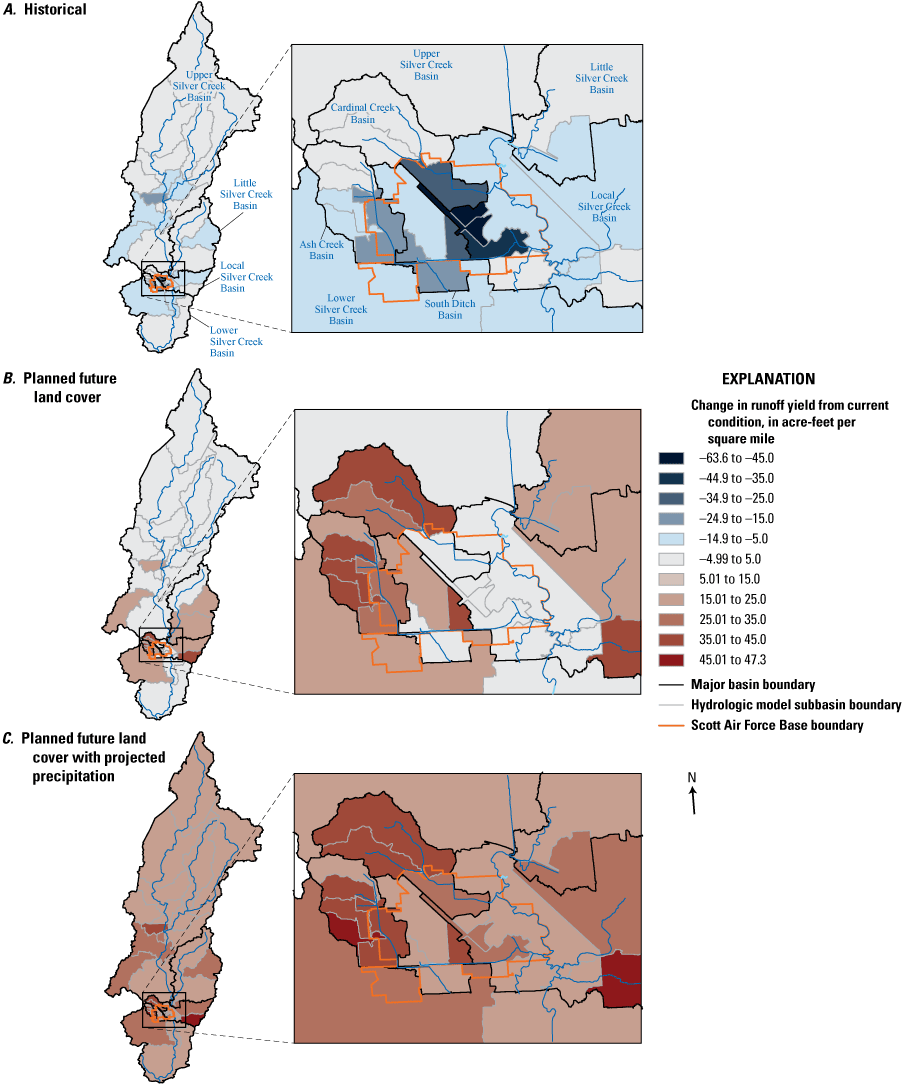
Simulated change in 2-year recurrence interval runoff yield relative to current (2019) conditions for the Silver Creek Basin, Illinois.
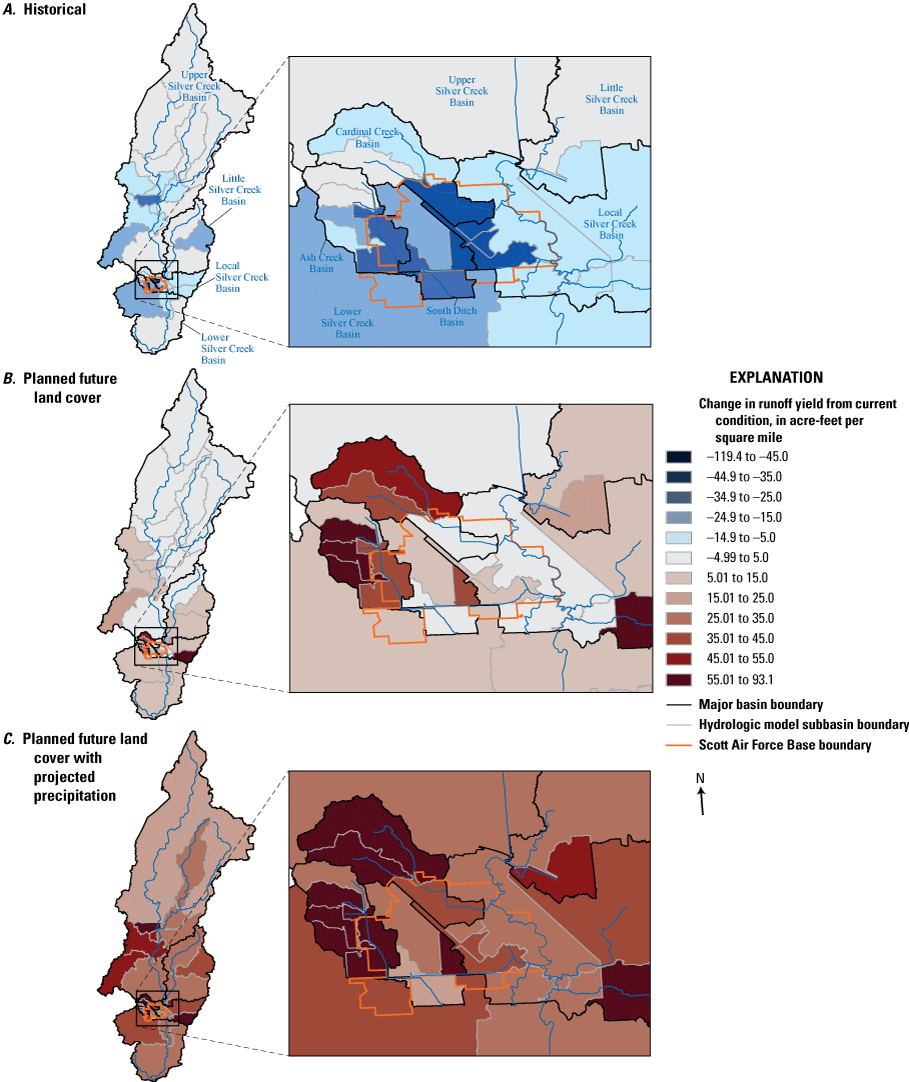
Simulated change in 100-year recurrence interval runoff yield relative to current (2019) conditions for the Silver Creek Basin, Illinois.
Assessment of Hydraulic Effects of Added Detention Storage and Projected Climate Conditions
The effects of detention and projected climate conditions were assessed using the calibrated hydraulic model on the focus area that included SAFB and adjacent inflow areas. Results are presented through water-surface elevation profiles and inundation extent maps for Silver Creek and contributing tributaries within the focus area. The water-surface elevation profiles of the model stream reaches were used to determine which simulated events overtopped road crossings that are labeled in the profiles. All areas of roads and developed areas affected by floodwaters were determined with the inundation maps. The effects of detention structures, located on along Ash Creek, South Ditch, and Cardinal Creek within or adjacent to SAFB (fig. 3), were simulated for 2-, 5-, 10-, 25-, 50-, 100-, and 500-year RI precipitation events under existing and projected climate conditions. The inundation extents associated with each probabilistic precipitation event, detention (referred to as without detention and with detention), and precipitation scenarios (referred to as current and projected precipitation) also were mapped for Ash Creek, South Ditch, Cardinal Creek, and Silver Creek including eastern tributaries to show the extent and consequences of flooding related to each scenario.
Ash Creek
The simulated water-surface elevation profiles for the Ash Creek Basin indicated that the simulated detention storage had a greater effect on water levels than did the effects of projected changes in precipitation for all scenarios (figs. 17–20). That is, the differences in water levels between the with detention and without detention scenarios were greater (less than 1 ft to greater than 2 ft) than those of the current and projected precipitation conditions (less than 1 ft). Detention, therefore, could be an effective mitigation practice to reduce peak streamflow conditions during flooding under current and projected climate conditions. The greatest reduction of water-surface elevations as a result of simulated detention occurred at the upstream end of the profile (upstream from Seibert Road; fig. 1) and between stationing of about 2,500 and 10,500 ft (figs. 17–20; included crossings with Enlisted Drive, West Winters Street, Ward Drive, and Scott Drive). The beneficial effects of added detention storage were minimal downstream from station 11,000 ft where Ash Creek flows into a low-lying broad floodplain. However, beneficial results were farther downstream at the Highway 161 crossing (station 12,600). The Highway 161 crossing is overtopped with the 25-year RI condition without added detention (fig. 18) but is not overtopped until the 50-year RI for the with detention scenario (fig. 19).
Ash Creek is channelized through much of the SAFB reaches; therefore, flows are contained within the stream in the 2-, 5-, and 10-year RI scenarios with detention (figs. 21–23). Ash Creek transitions to a low-laying broad floodplain immediately south of SAFB and north of Highway 161. Immediately east of the Ash Creek box culverts on Highway 161 is a low-lying section of road that was not within the extent of inundation until the 25-year RI for the with detention condition (fig. 24) but was overtopped beginning with the 5-year RI condition without the added detention (fig. 22). Some inundation of a residential area along Greenfield Circle was evident in the 5-year event for the without detention scenarios (refer to inset 1 in fig. 22). The inundation in the residential area along Greenfield Circle was more extensive in the 10- and 25-year RI results for the without detention scenarios encroaching along Ash Creek Drive and side streets (refer to inset 1 in figs. 23–24). The first indications of flooding in the residential area adjacent to Ash Creek in the detention scenarios were evident in the 50-year RI with-detention scenario with future precipitation (fig. 25), and the first indications of flooding in the residential area from the with detention scenario with current precipitation is in the 100-year RI event (fig. 26). Flooding magnitude under all scenarios increased in the residential area in the 500-year RI event (fig. 27).
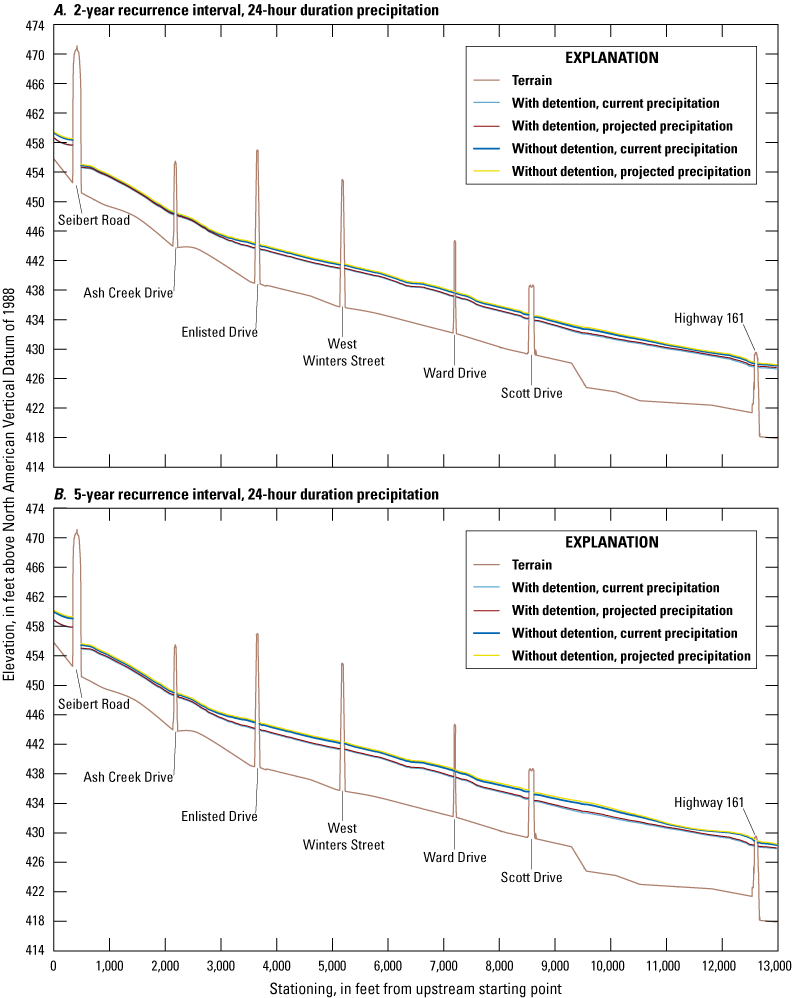
Simulated water-surface elevation profiles for Ash Creek, Scott Air Force Base, Illinois. A, 2-year recurrence interval scenarios. B, 5-year recurrence interval scenarios.
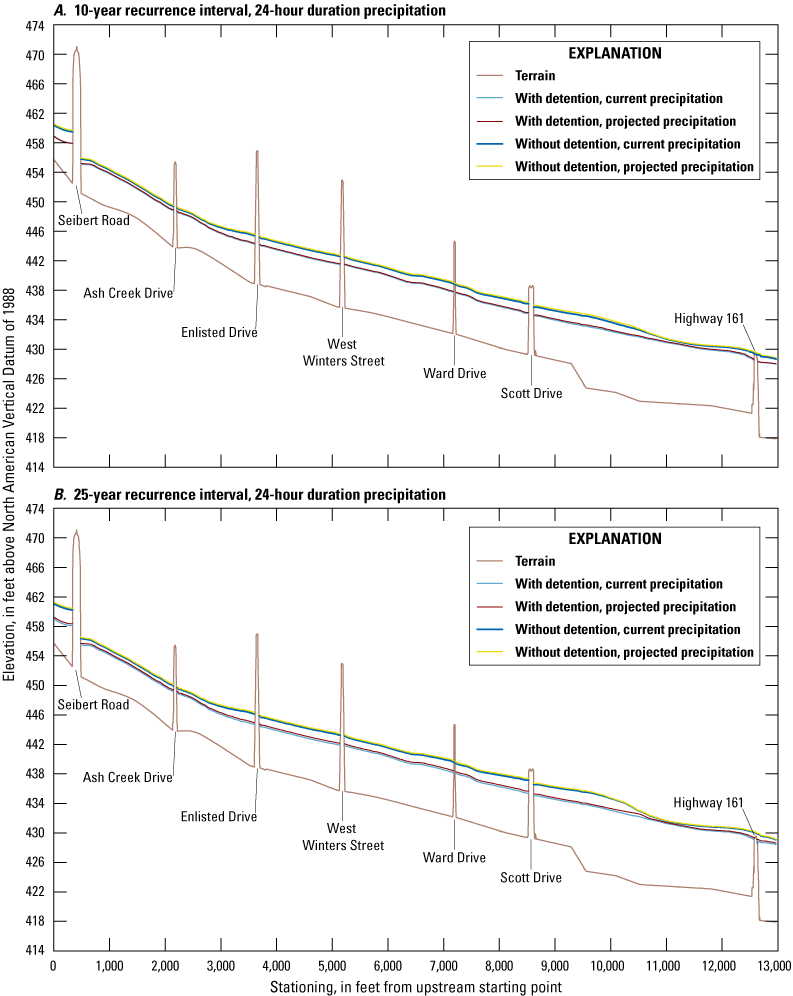
Simulated water-surface elevation profiles for Ash Creek, Scott Air Force Base, Illinois. A, 10-year recurrence interval scenarios. B, 25-year recurrence interval scenarios.
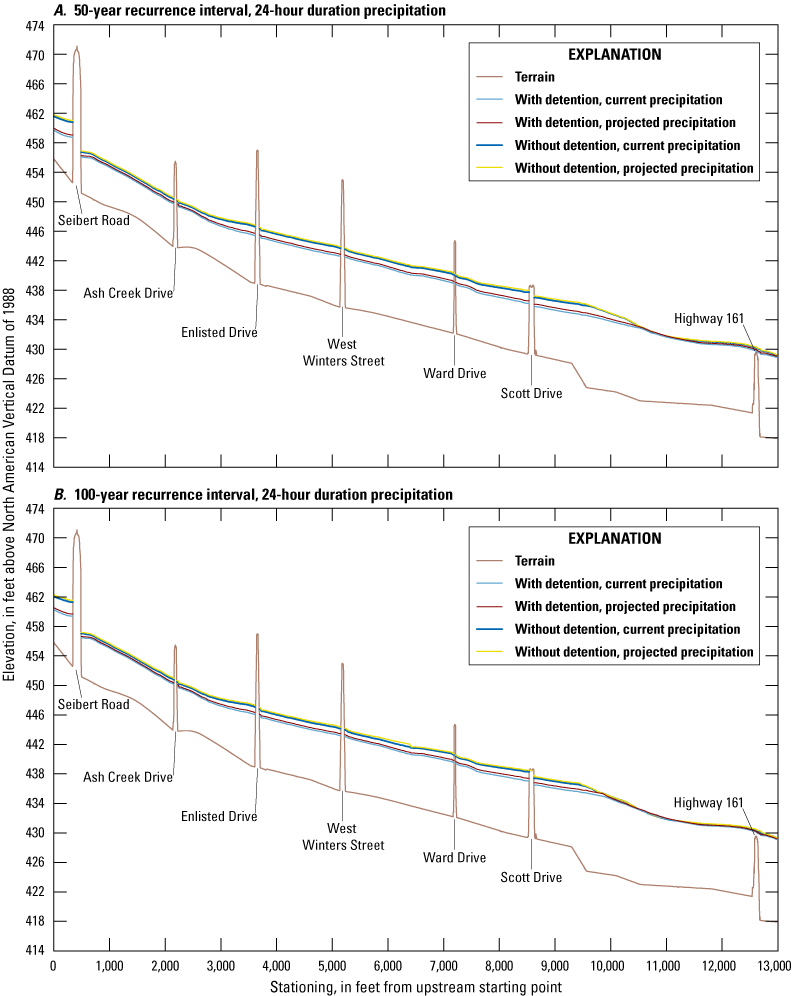
Simulated water-surface elevation profiles for Ash Creek, Scott Air Force Base, Illinois. A, 50-year recurrence interval scenarios. B, 100-year recurrence interval scenarios.
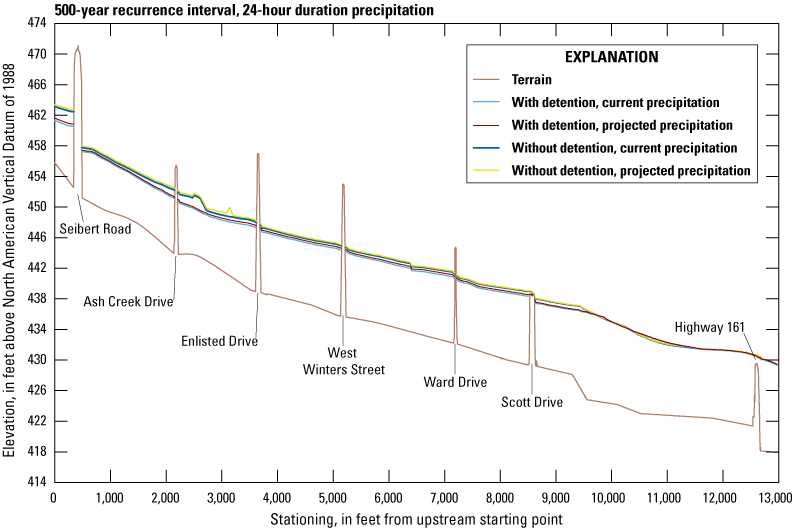
Water-surface elevation profiles for Ash Creek, Scott Air Force Base, Illinois, for 500-year recurrence interval scenarios.
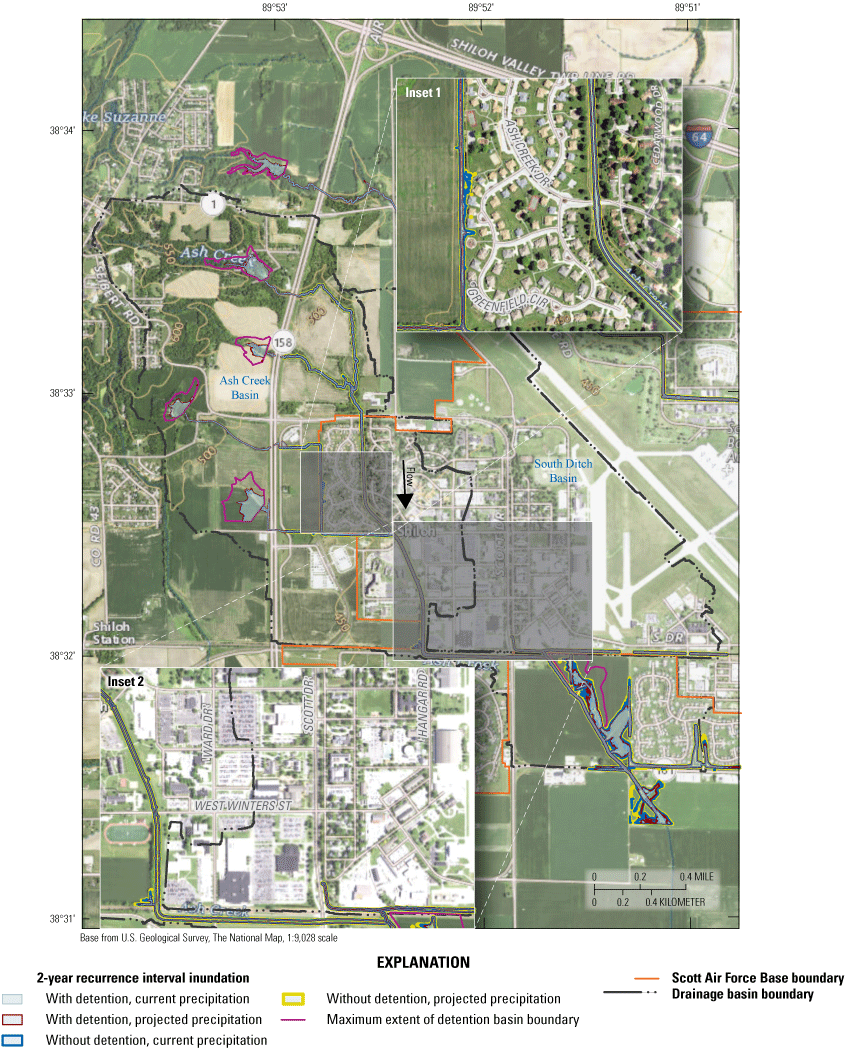
Inundation extents along Ash Creek and South Ditch at Scott Air Force Base, Illinois, for 2-year recurrence interval 24-hour duration precipitation scenarios.
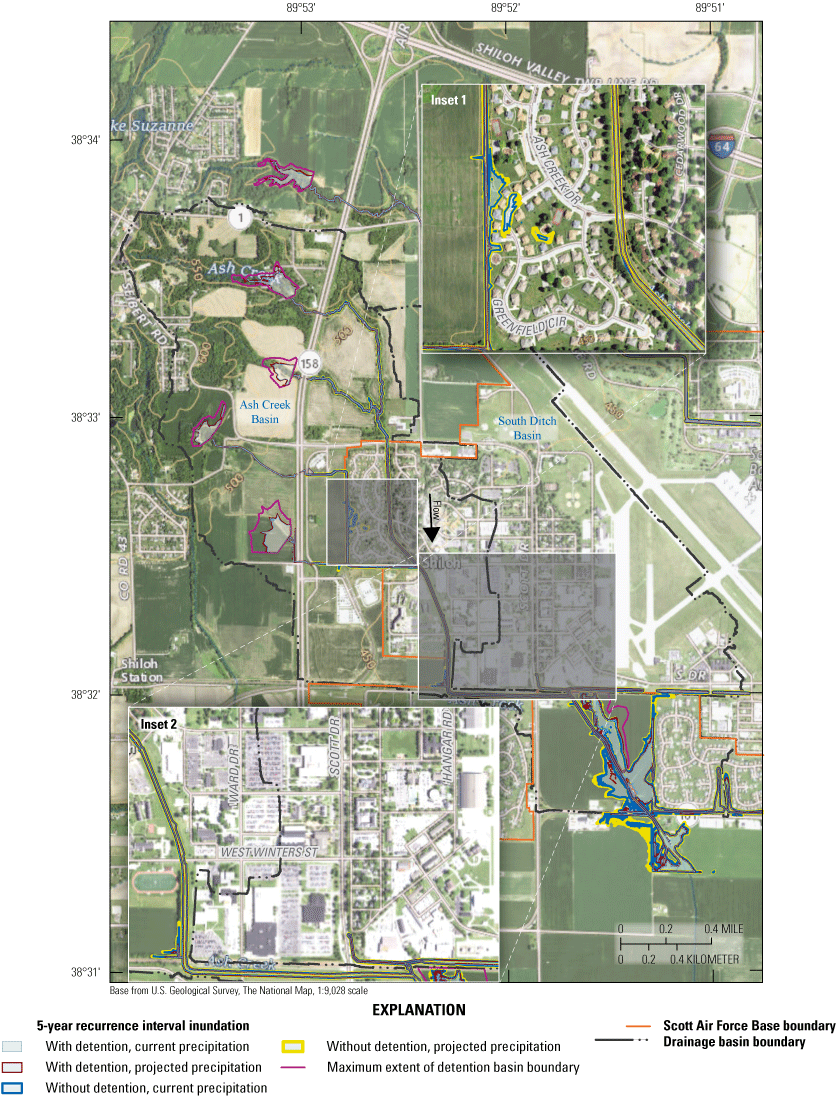
Inundation extents along Ash Creek and South Ditch at Scott Air Force Base, Illinois, for 5-year recurrence interval 24-hour duration precipitation scenarios.
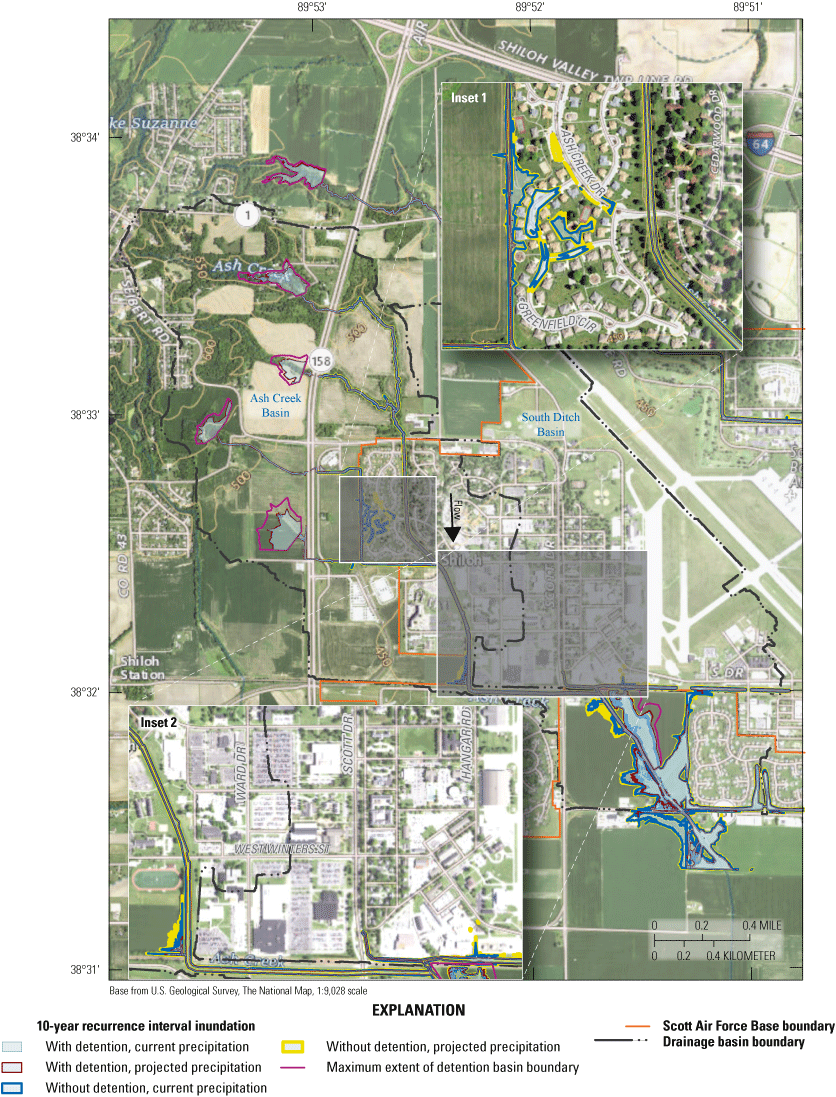
Inundation extents along Ash Creek and South Ditch at Scott Air Force Base, Illinois, for 10-year recurrence interval 24-hour duration precipitation scenarios.
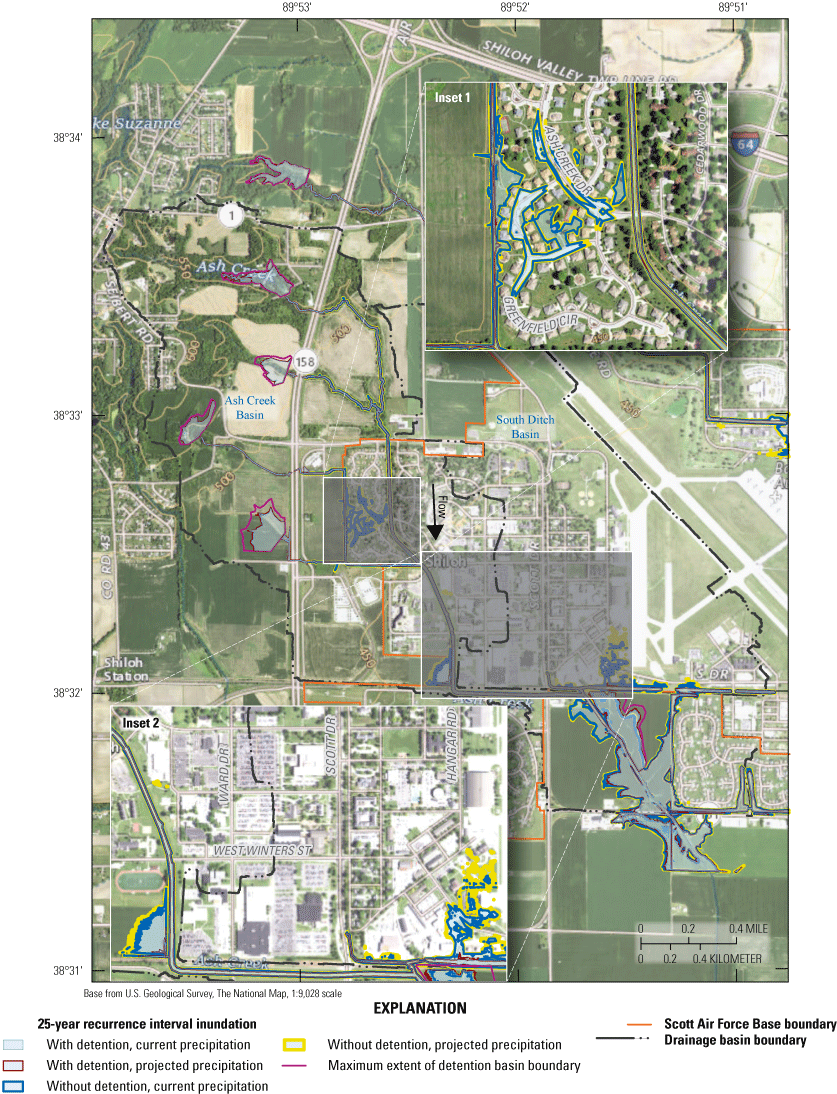
Inundation extents along Ash Creek and South Ditch at Scott Air Force Base, Illinois, for 25-year recurrence interval, 24-hour duration precipitation scenarios.
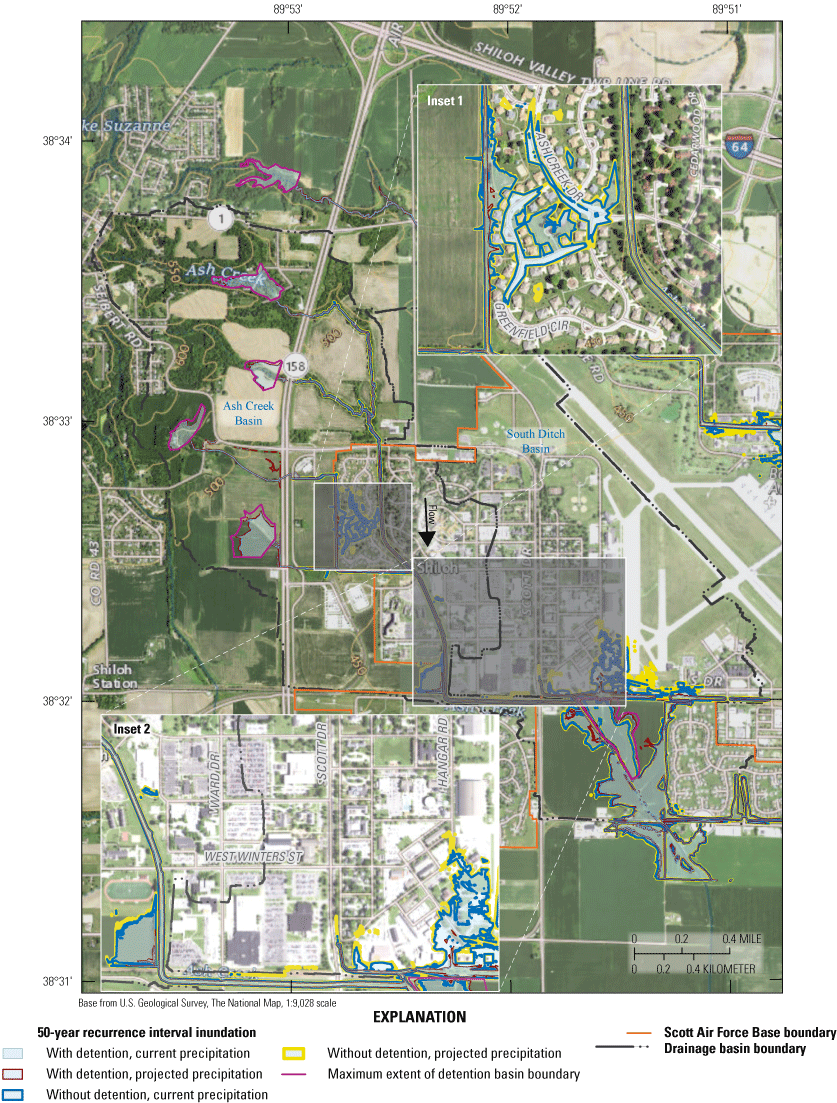
Inundation extents along Ash Creek and South Ditch at Scott Air Force Base, Illinois, for 50-year recurrence interval, 24-hour duration precipitation scenarios.
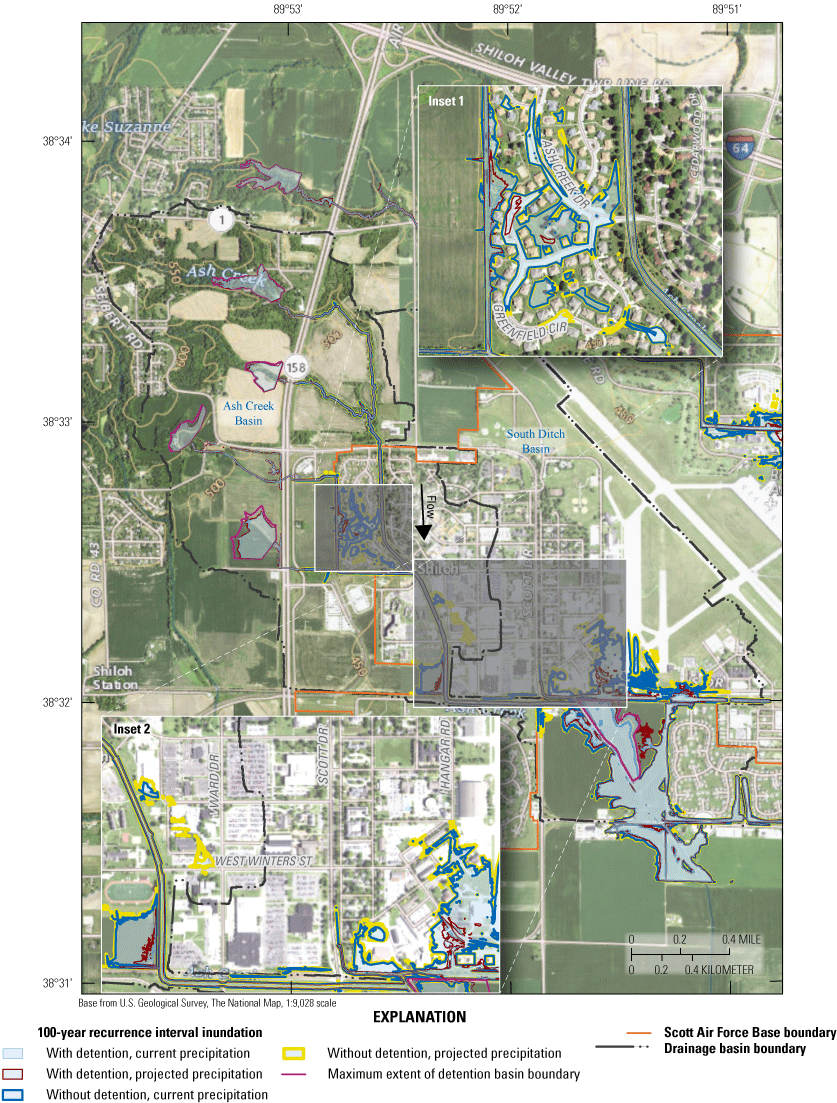
Inundation extents along Ash Creek and South Ditch at Scott Air Force Base, Illinois, for 100-year recurrence interval 24-hour duration precipitation scenarios.
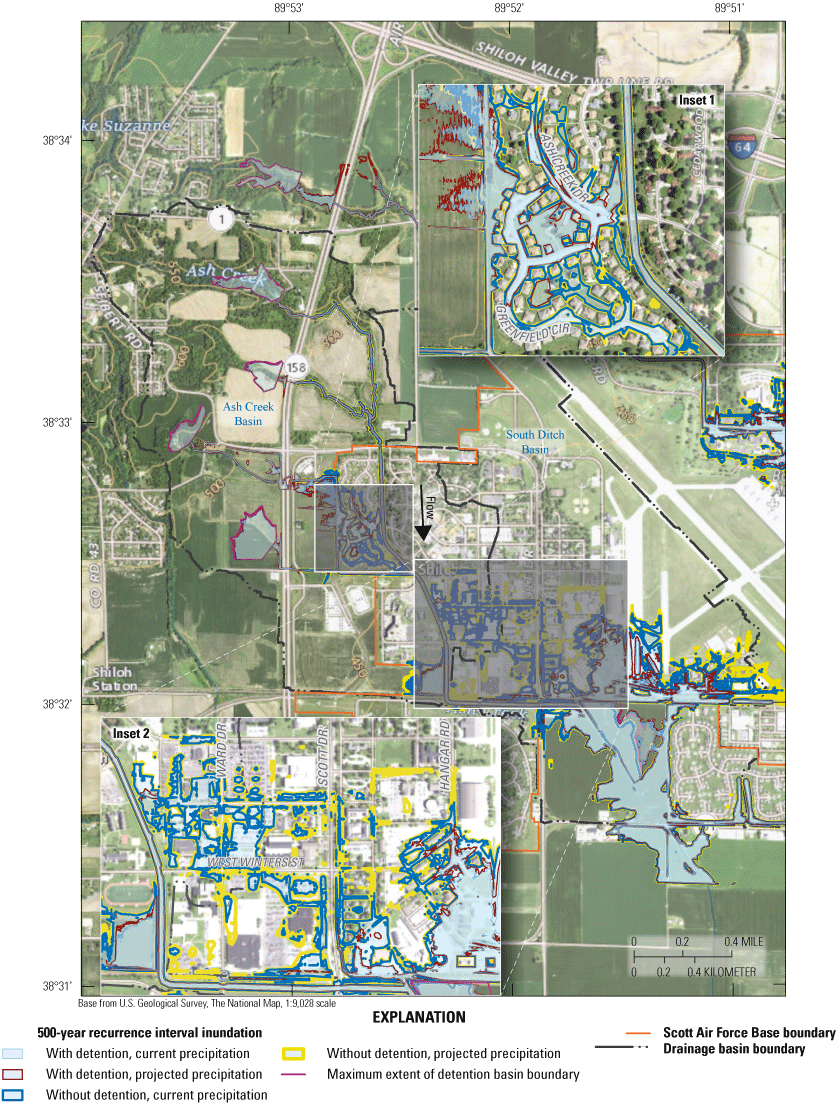
Inundation extents along Ash Creek and South Ditch at Scott Air Force Base, Illinois, for 500-year recurrence interval 24-hour duration precipitation scenarios.
South Ditch
The water-surface profiles developed for South Ditch indicated that the effects of an added detention structure in this basin generally exceeded the anticipated effects of projected changes in precipitation. Differences in water-surface profiles for with detention and without detention scenarios ranged from less than 1 ft to about 2 ft, whereas differences in the profiles resulting from projected precipitation were less than 1 ft (figs. 28–31). The differences resulting from added detention and projected precipitation varied longitudinally along the profile and were greatest upstream from South Ditch tunnel 2 and were greater, in general, upstream from South Ditch tunnel 1 than downstream from this tunnel. Effects of Silver Creek on the downstream end of the water-surface profiles were evident as the water-surface slopes flattened and the effects of detention were no longer evident. The effects of projected precipitation were greater in this area than the effects of detention because of the effect of Silver Creek. The unnamed access road crossing to the landfill was overtopped for events of 10-year RI and greater for the without detention scenarios (fig. 29) and for all scenarios for events of 25-year RI or greater (figs. 29–31). South Ditch tunnel 2 was overtopped for without detention scenarios of RIs of 50 years or greater but only the 500-year RI profile for the scenarios with detention indicated overtopping of tunnel 2 (figs. 30, 31). Of the seven total structure crossings in the profile extent, only tunnel 2 and the unnamed landfill access road crossing were overtopped in the 500-year RI profile (fig. 31).
South Ditch also is channelized through much of the SAFB reaches; therefore, flows were contained within the stream in the 2-, 5-, and 10-year RI scenarios with detention (figs. 21–23). Flood inundation began along South Ditch in the 25-year RI without detention scenarios west of the runways and east of Scott Drive (fig. 24). Flooding is extensive in the residential area adjacent to Ash Creek and along South Ditch and Hangar Road (refer to inset 2 in figs. 21–27) in the 50-year RI event for without detention scenarios (fig. 25). All scenarios for the 100-year RI event indicated that South Ditch and Hangar Road were within the inundation extent, but the inundation extent was substantially smaller for the scenarios with detention and many of the structures near Hangar Road were not affected by flooding (refer to inset 2 in fig. 26). Flooding was extensive across the southwest part of SAFB from Ash Creek and South Ditch in all 500-year RI scenarios (fig. 27). These results demonstrated the substantial protection from flooding afforded by the added detention in addition to the increase of the overflow culvert size (refer to table 5).
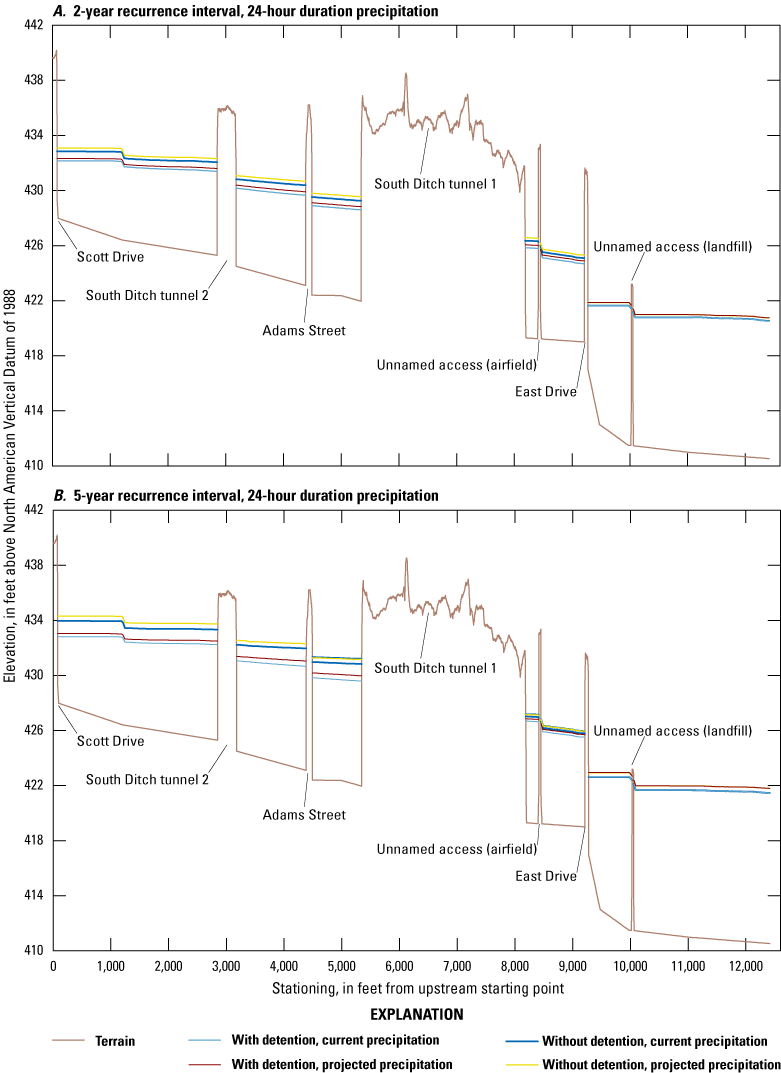
Simulated water-surface elevation profiles for South Ditch, Scott Air Force Base, Illinois. A, 2-year recurrence interval scenarios. B, 5-year recurrence interval scenarios.
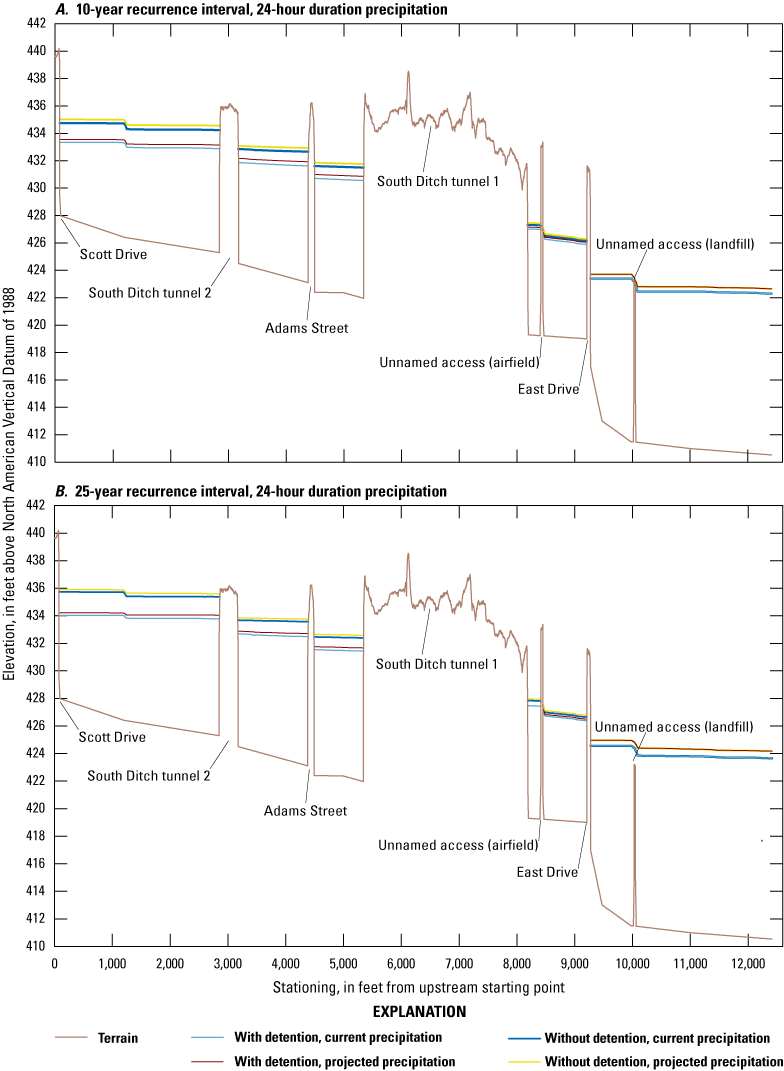
Simulated water-surface elevation profiles for South Ditch, Scott Air Force Base, Illinois. A, 10-year recurrence interval scenarios. B, 25-year recurrence interval scenarios.
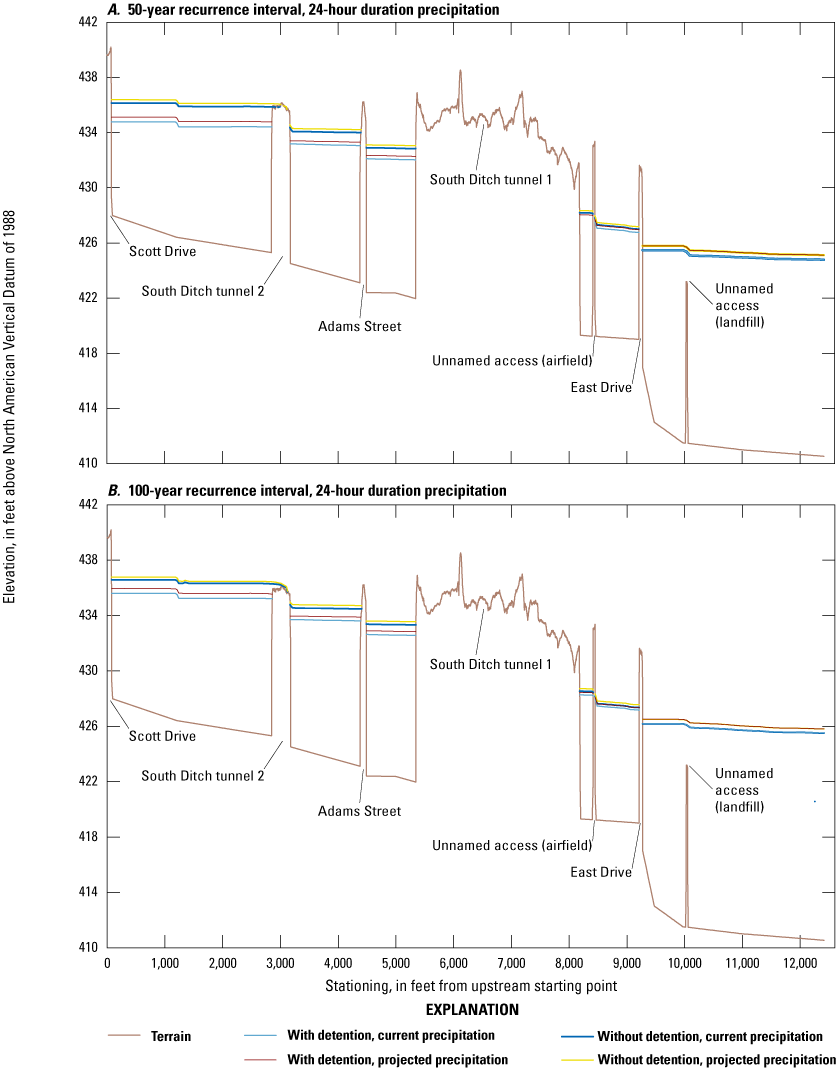
Simulated water-surface elevation profiles for South Ditch, Scott Air Force Base, Illinois. A, 50-year recurrence interval scenarios. B, 100-year recurrence interval scenarios.
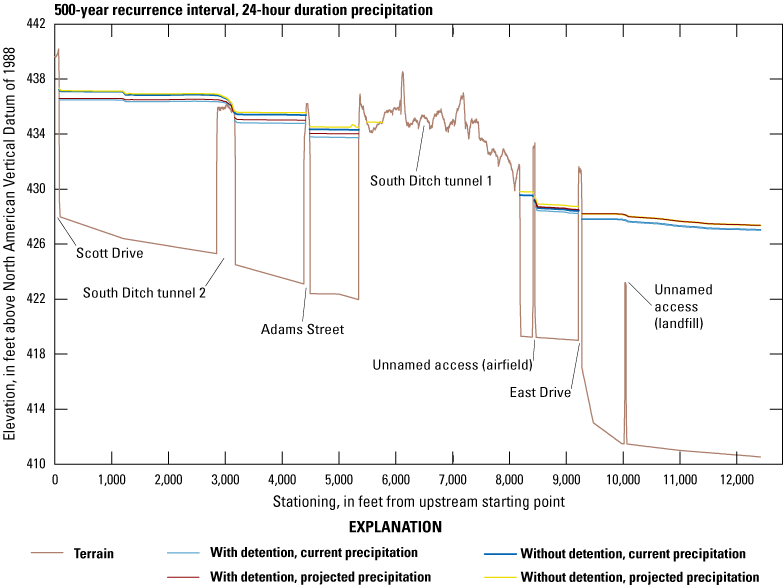
Simulated water-surface elevation profiles for South Ditch, Scott Air Force Base, Illinois, for 500-year recurrence interval scenarios.
Cardinal Creek
Similar to the results from Ash Creek and South Ditch water-surface elevation profile comparisons, the results from the Cardinal Creek profile comparisons also indicated that the differences resulting from detention generally exceeded the differences resulting from projected precipitation (figs. 32–35). The differences in the water-surface profiles in the with and without detention scenarios ranged from less than 1 ft to about 3 ft, whereas the differences as a result of projected precipitation were consistently less than 1 ft. The effects of added detention were greatest in the upper sections of the profiles (station 0–3,000 ft in the 2- and 5-year RI profiles) and were well sustained through much of the longitudinal profile to Pryor Drive (figs. 32, 33). The reduction in the effects of detention and relatively minor slope downstream from Pryor Drive in all RI results were attributable to the effect of inundation from Silver Creek. Scott Lake Road crossing at the downstream end of the profile was inundated in all scenarios beginning with the 5-year RI event (figs. 32–35), which, again, can be attributed to backwater from Silver Creek rather than to headwater flooding from Cardinal Creek. The Pryor Drive crossing was overtopped for the without detention scenarios beginning with the 25-year RI event (figs. 33–35). This crossing was overtopped at the 100-year RI event for the projected precipitation scenario with detention (fig. 34), and for the 500-year RI event under all scenario conditions (fig. 35). Radar Road was overtopped for scenarios without detention beginning with the 50-year RI event and for scenarios with detention only for the 500-year RI event. Results indicate that added detention storage in the Cardinal Creek Basin, optimized for 25-year RI event flows, was still effective at preventing road overtopping for 2 of 3 road crossings for all but the 500-year RI events under existing condition precipitation.
Cardinal Creek also is channelized upon entering SAFB, and flows were essentially contained within the channel in all the 2-year, 5-year, and 10-year RI events (figs. 36–38). Flooding of roads was evident beginning with the 25-year RI event without detention scenarios (fig. 39), and Pryor Drive and surrounding areas were within the inundation extent for the without detention scenarios. The upstream Radar Road intersection was within the inundation extent of the 50-year RI event along with much of Air Guard Way that parallels Gunn Street to the south (fig. 40). Flooding was evident from the detention scenarios beginning with the 100-year RI event (fig. 41) and encroachment of Silver Creek is evident, which exacerbates flooding through the 500-year RI event (fig. 42), covering several blocks on either side of the Pryor Drive and Gunn Street south along Golf Course Road and East Drive.
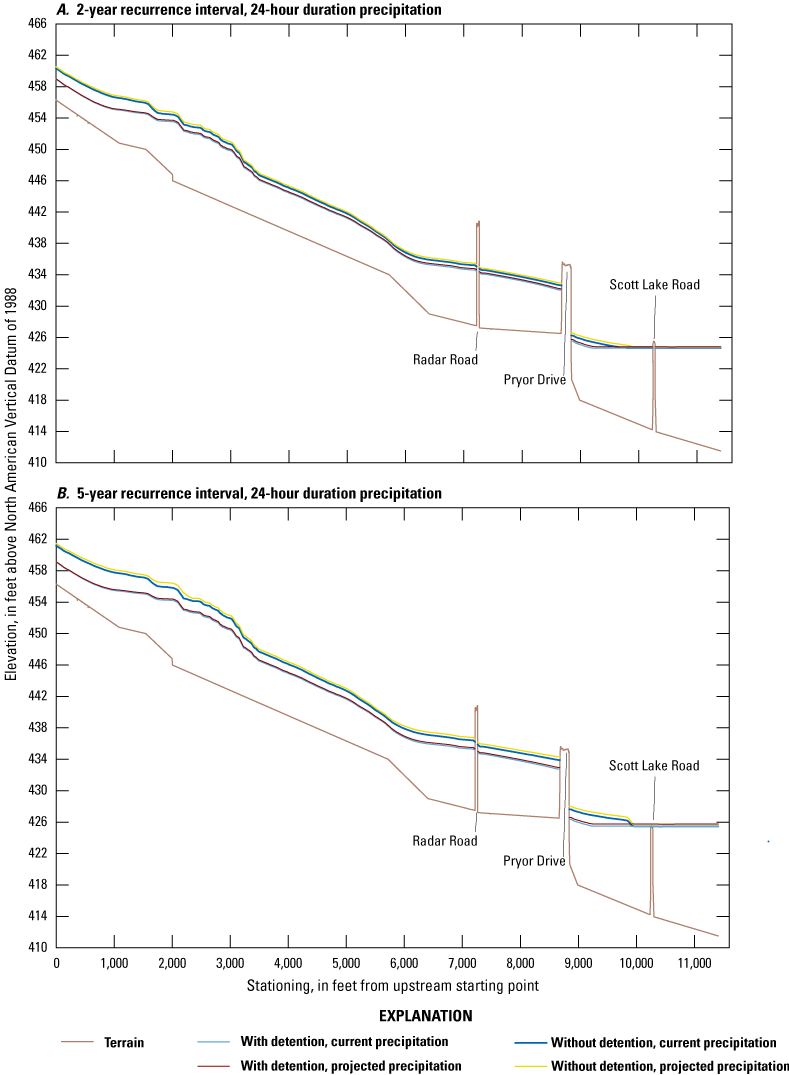
Simulated water-surface elevation profiles for Cardinal Creek, Scott Air Force Base, Illinois. A, 2-year recurrence interval scenarios. B, 5-year recurrence interval scenarios.
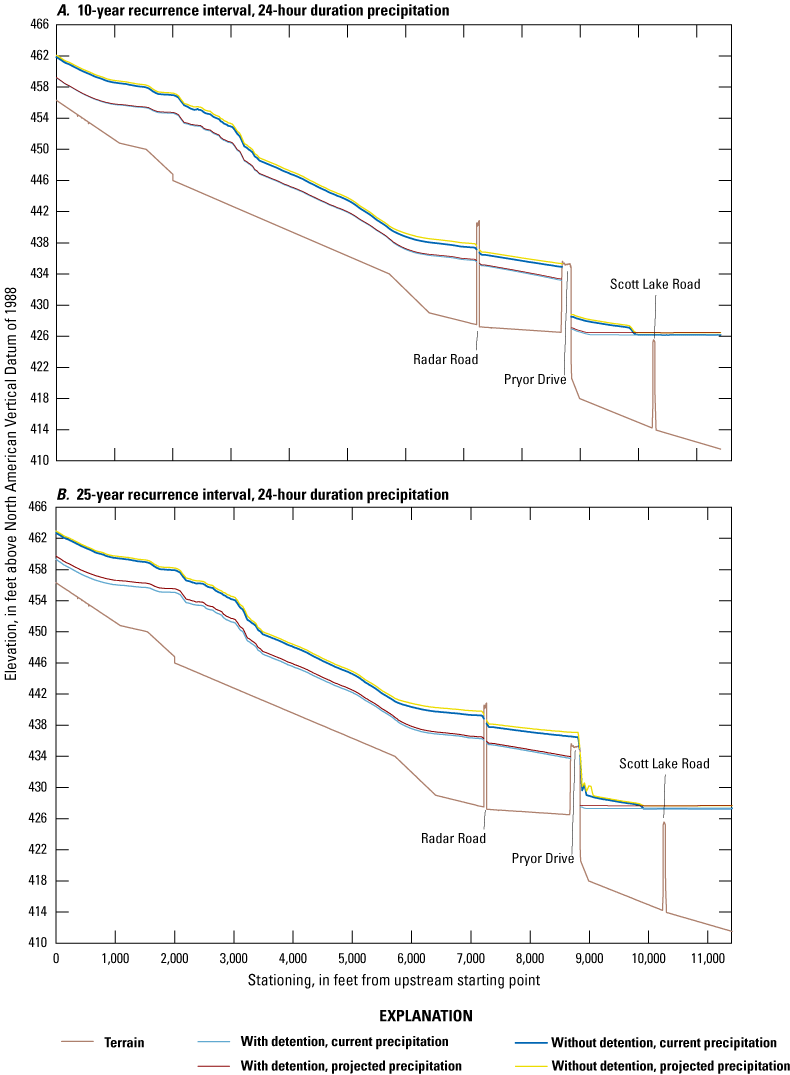
Simulated water-surface elevation profiles for Cardinal Creek, Scott Air Force Base, Illinois. A, 10-year recurrence interval scenarios. B, 25-year recurrence interval scenarios.
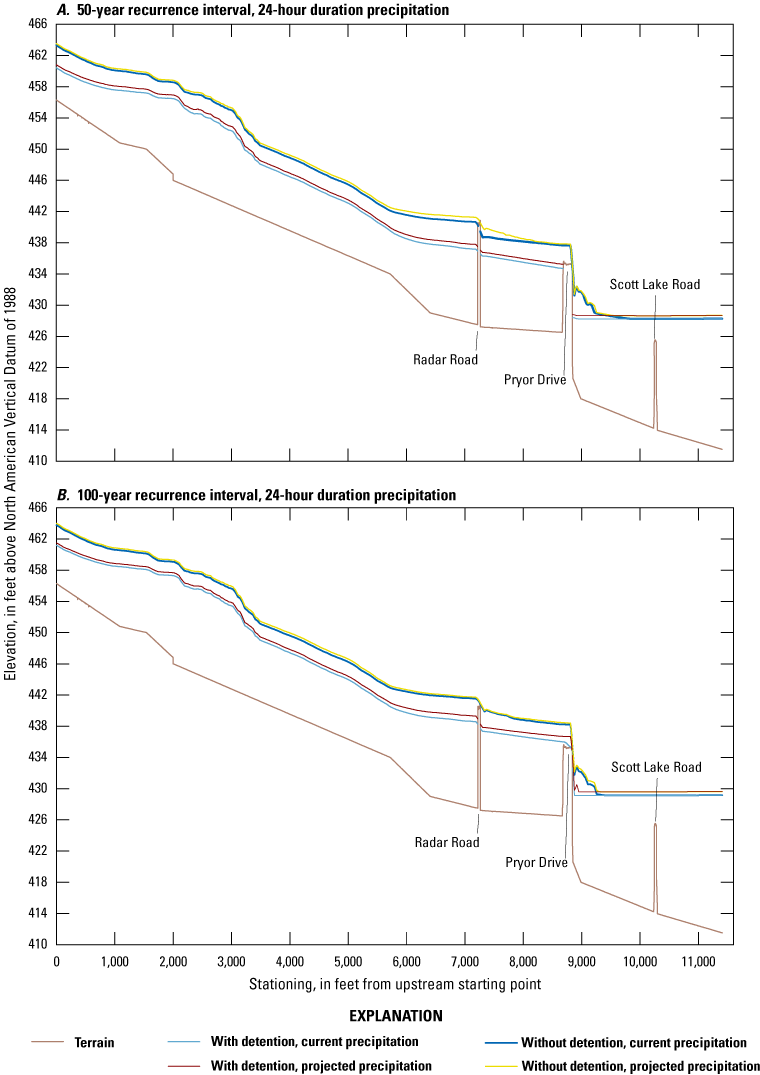
Simulated water-surface elevation profiles for Cardinal Creek, Scott Air Force Base, Illinois. A, 50-year recurrence interval scenarios. B, 100-year recurrence interval scenarios.
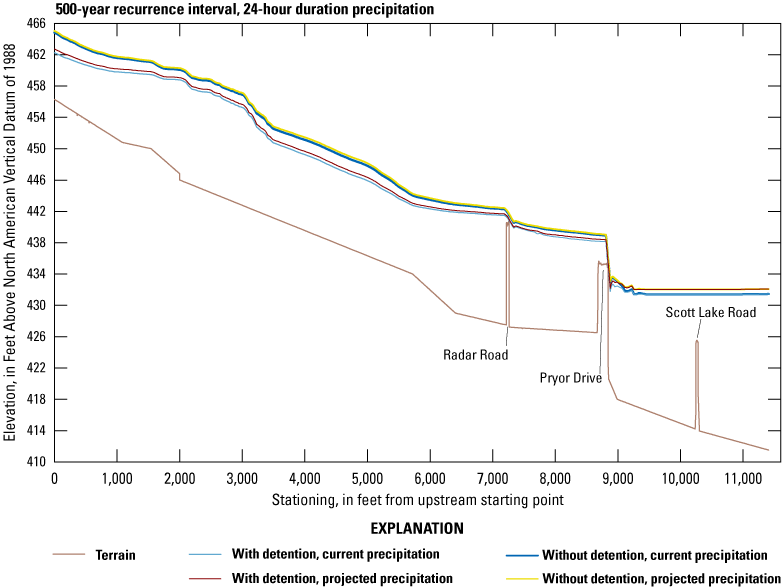
Water-surface elevation profiles for Cardinal Creek, Scott Air Force Base, Illinois, for 500-year recurrence interval scenarios.
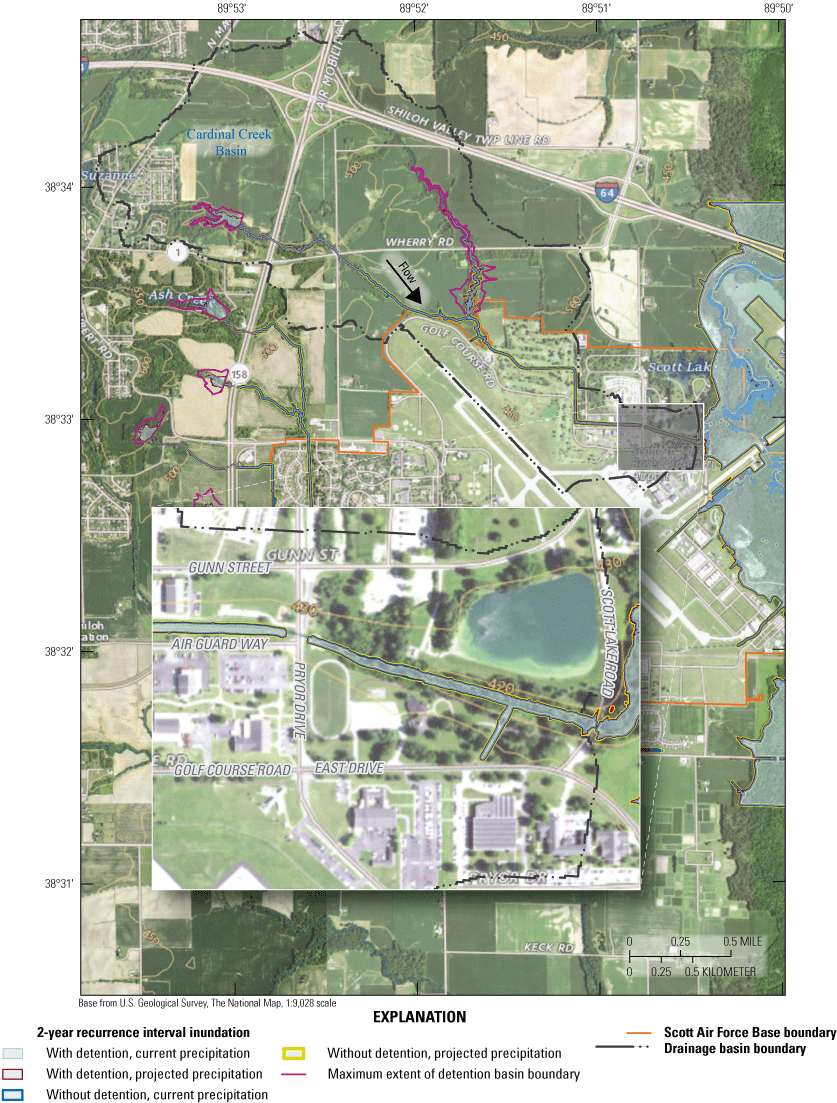
Inundation extents along Cardinal Creek at Scott Air Force Base, Illinois, for 2-year recurrence interval 24-hour duration precipitation scenarios.
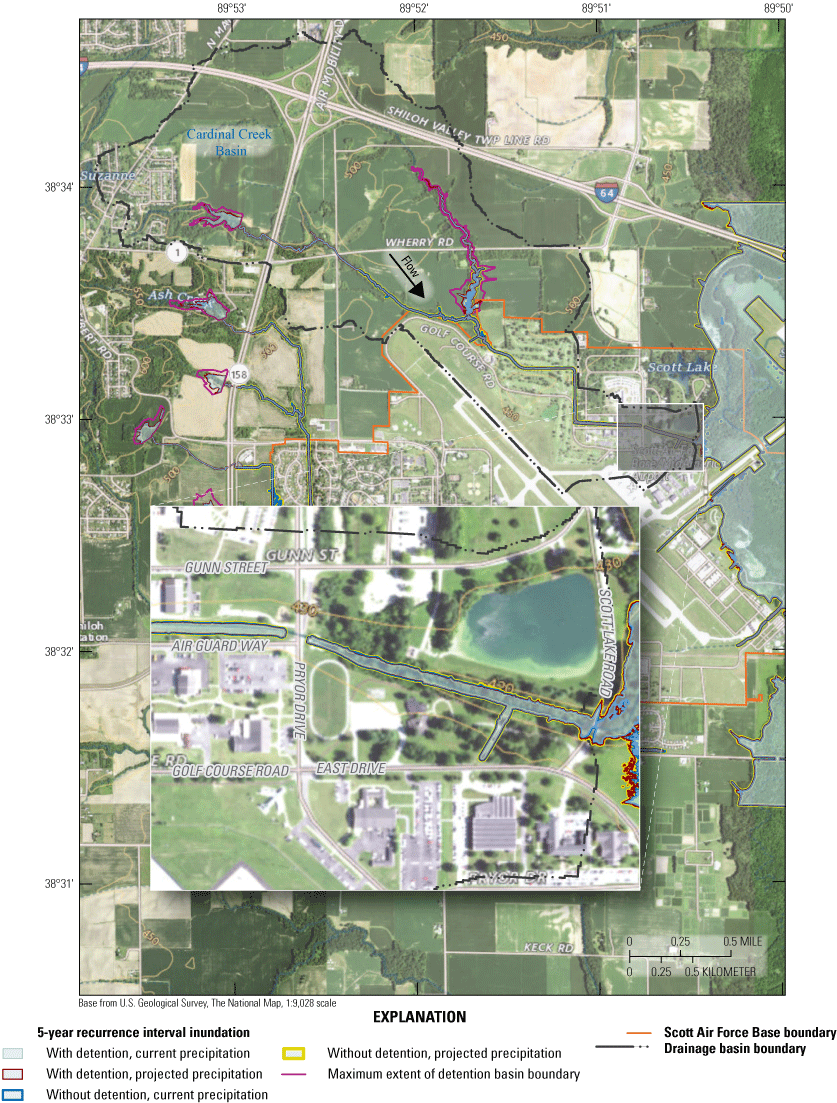
Inundation extents along Cardinal Creek at Scott Air Force Base, Illinois, for 5-year recurrence interval 24-hour duration precipitation scenarios.

Inundation extents along Cardinal Creek at Scott Air Force Base, Illinois, for 10-year recurrence interval 24-hour duration precipitation scenarios.
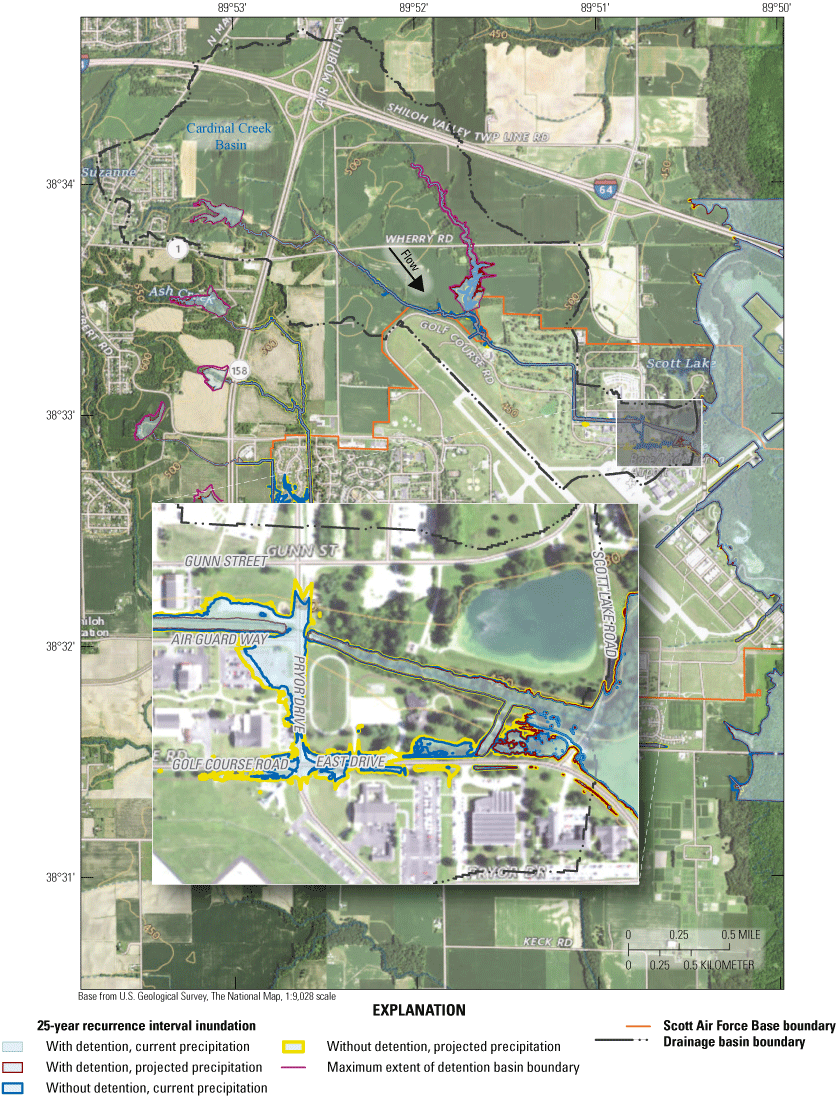
Inundation extents along Cardinal Creek at Scott Air Force Base, Illinois, for 25-year recurrence interval 24-hour duration precipitation scenarios.
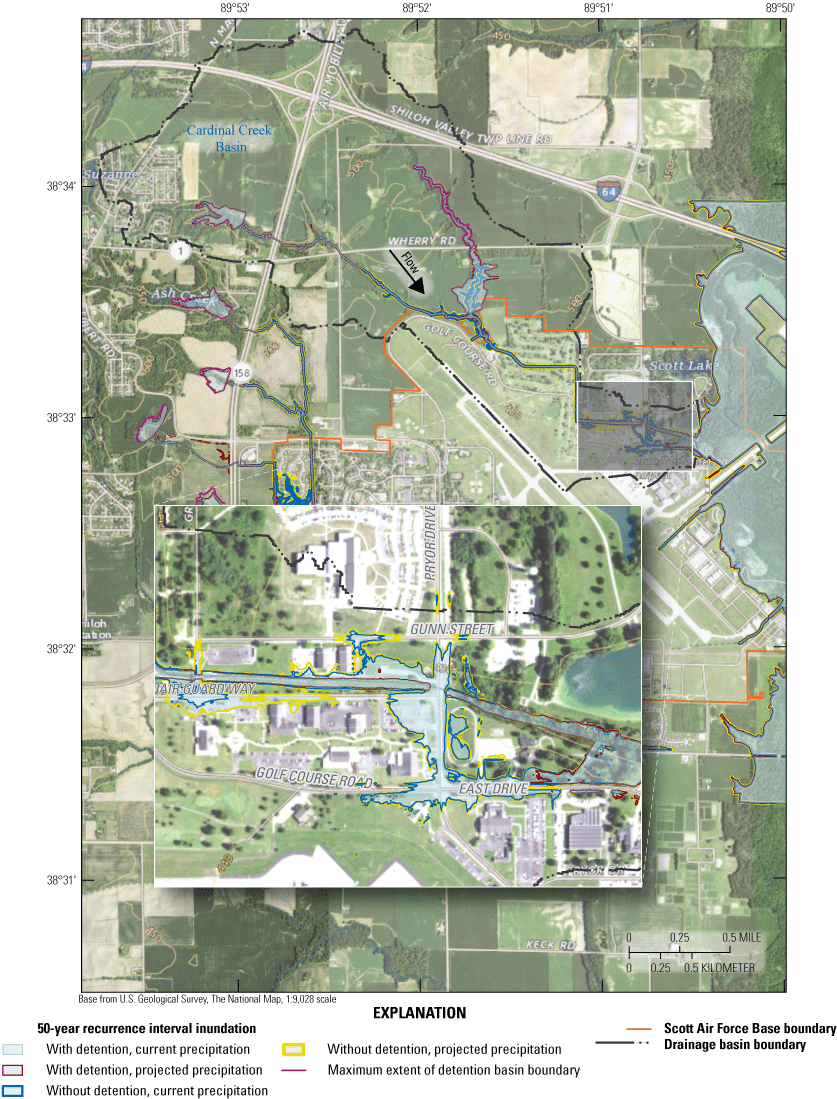
Inundation extents along Cardinal Creek at Scott Air Force Base, Illinois, for 50-year recurrence interval 24-hour duration precipitation scenarios.
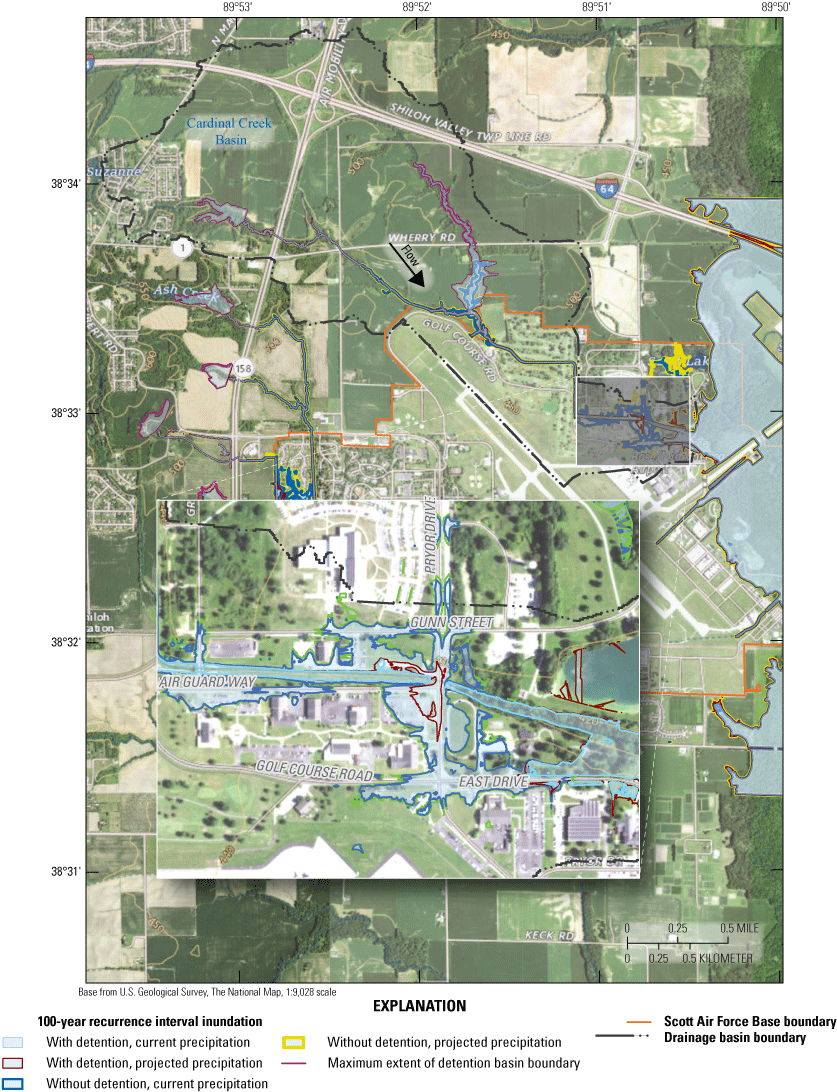
Inundation extents along Cardinal Creek at Scott Air Force Base, Illinois, for 100-year recurrence interval 24-hour duration precipitation scenarios.
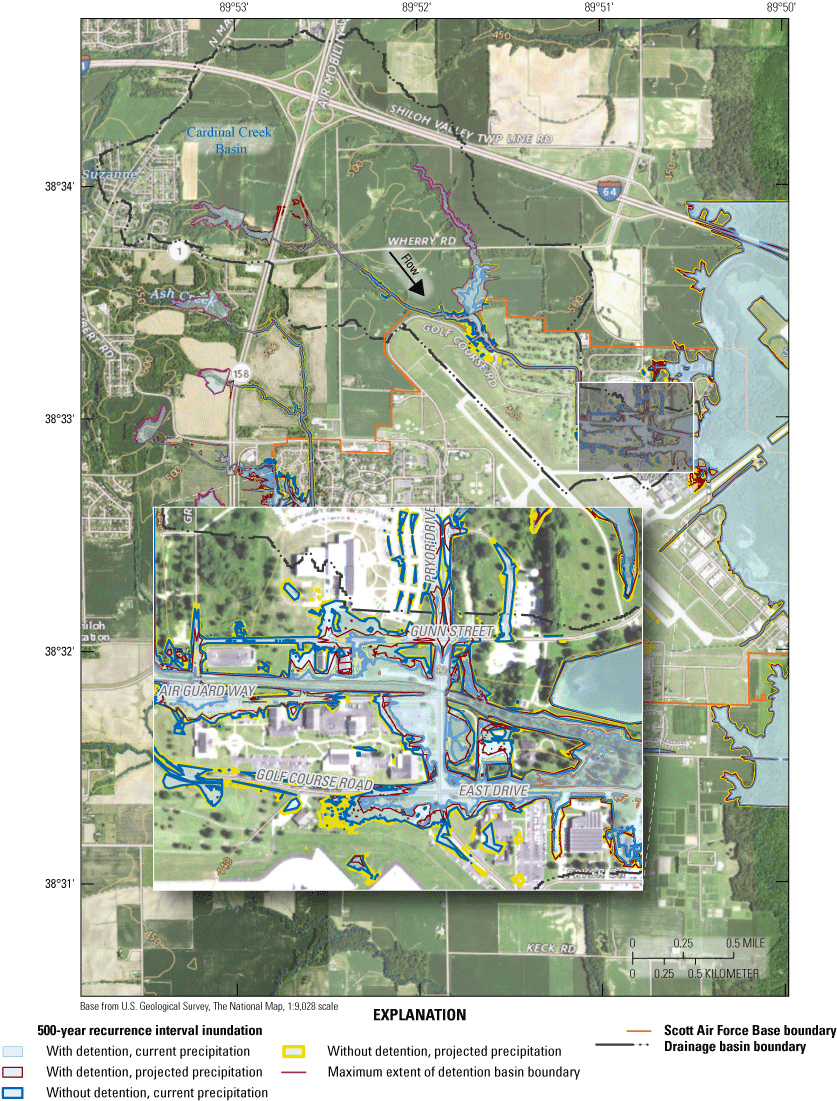
Inundation extents along Cardinal Creek in Scott Air Force Base, Illinois, for 500-year recurrence interval 24-hour duration precipitation scenarios.
Silver Creek and East Tributaries
Detention storage was not added in the Silver Creek, Little Silver Creek, and unnamed tributaries 1 and 2 Basins; therefore, differences as result of projected precipitation were greater than differences resulting from added detention (figs. 1.1–1.16). The minor streamflow contributions of Cardinal Creek and South Ditch (two tributaries with added detention) to Silver Creek were not large enough to evoke a response in the Silver Creek water-surface elevation profiles. As a result of projected changes in precipitation, differences in water-surface elevation profiles in Silver Creek, Little Silver, and unnamed tributaries 1 and 2 generally were less than 1 ft except for the 500-year RI profile for Silver Creek in which the differences approached 1 ft (fig. 1.4).
The inundation extent of Silver Creek and eastern tributaries of Little Silver Creek, and unnamed tributaries 1 and 2 covers the extensive bottomland area adjacent to Silver Creek beginning with the 2-year event scenarios (figs. 43–49). The downstream reaches of the eastern tributaries included in the mapping extent are within the influence of Silver Creek backwater effects. The direct effects of Silver Creek flooding of infrastructure on SAFB was primarily associated with the lower Cardinal Creek Basin. It is likely that in local tributaries, including Cardinal Creek, initial flooding associated with headwater sources in the tributaries is followed hours later by flood effects resulting from the Silver Creek main stem. For example, during the July 27, 2022, calibration event, observed water levels on Cardinal Creek, Ash Creek, and South Ditch peaked about 8–9 hours before the water level of Silver Creek at Highway 161 (fig. 8). Flooding of infrastructure by Silver Creek in the lower reaches of the tributaries primarily was associated with the 100-year and 500-year RI events (figs. 48–49).
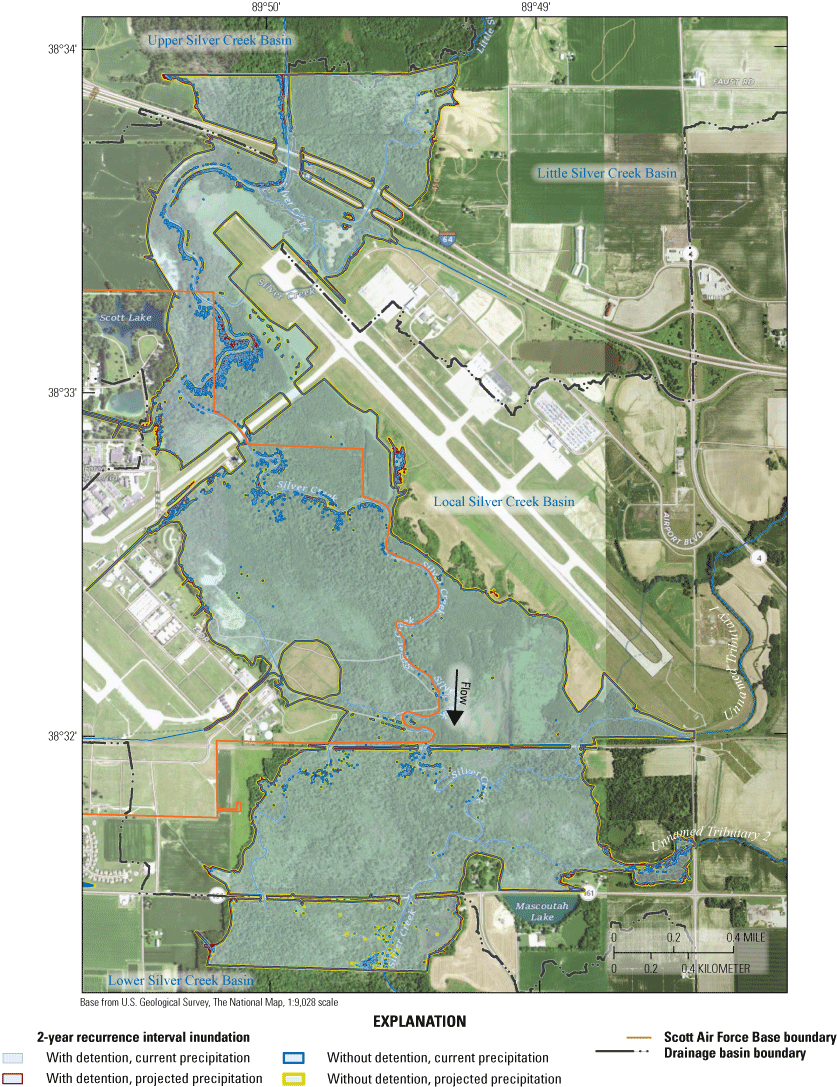
Inundation extents along Silver Creek, Little Silver Creek, Unnamed Tributary 1 and 2 at Scott Air Force Base, Illinois, for 2-year recurrence interval 24-hour duration precipitation scenarios.
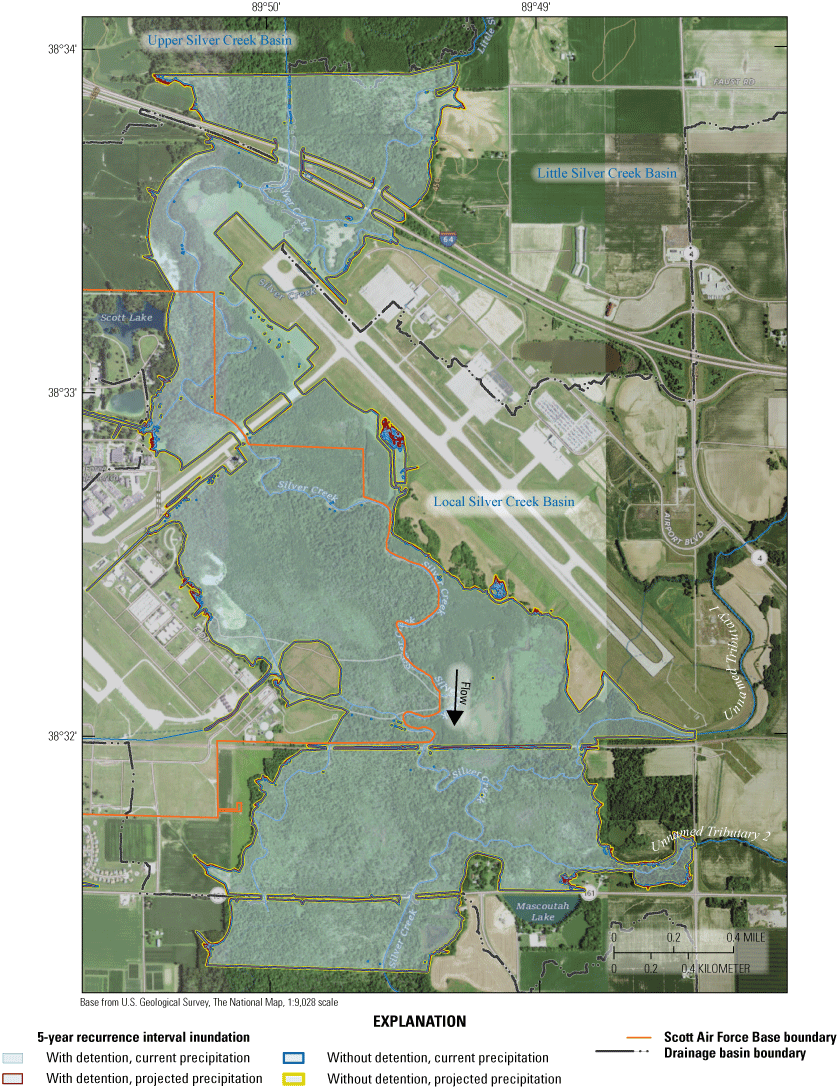
Inundation extents along Silver Creek, Little Silver Creek, Unnamed Tributary 1 and 2 at Scott Air Force Base, Illinois, for 5-year recurrence interval 24-hour duration precipitation scenarios.
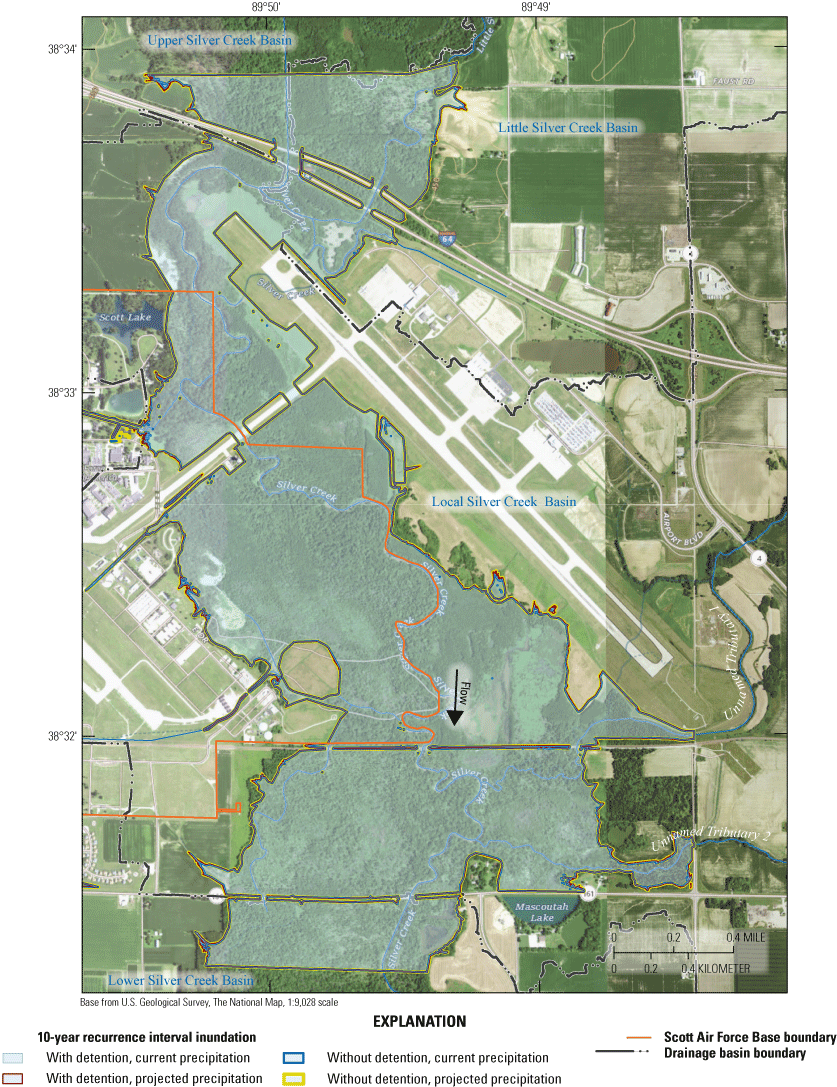
Inundation extents along Silver Creek, Little Silver Creek, Unnamed Tributary 1 and 2 at Scott Air Force Base, Illinois, for 10-year recurrence interval 24-hour duration precipitation scenarios.
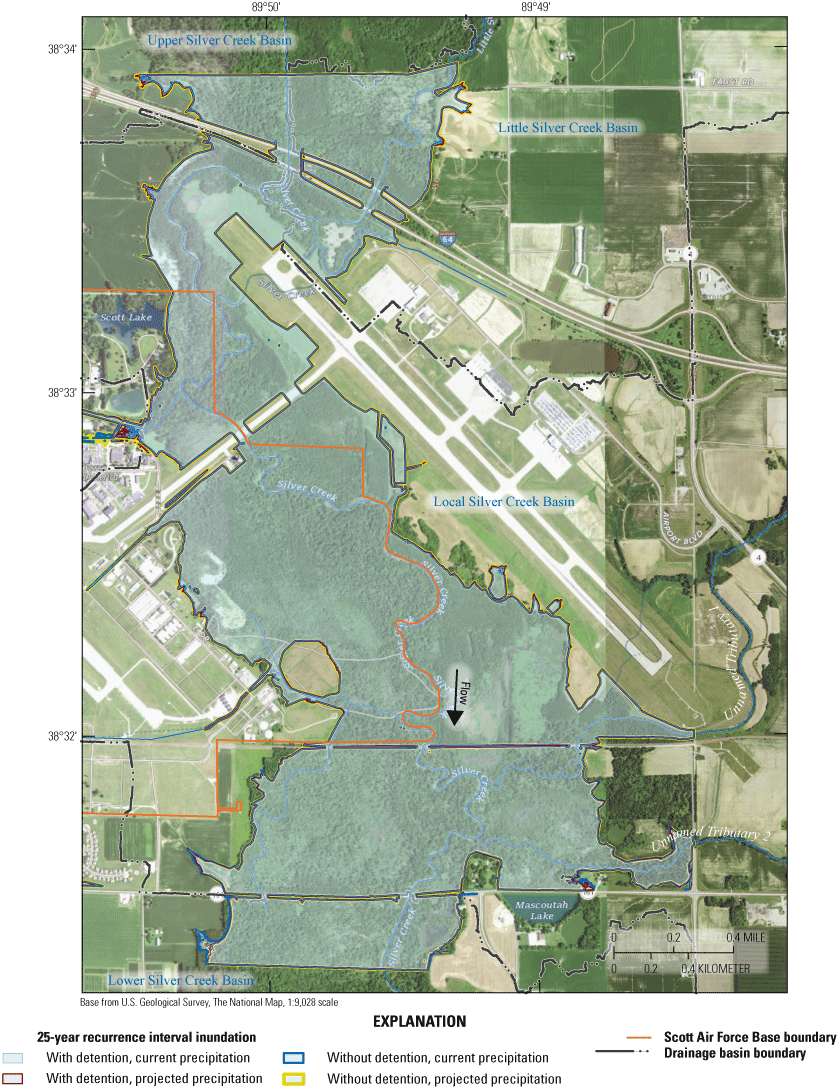
Inundation extents along Silver Creek, Little Silver Creek, Unnamed Tributary 1 and 2 at Scott Air Force Base, Illinois, for 25-year recurrence interval 24-hour duration precipitation scenarios.
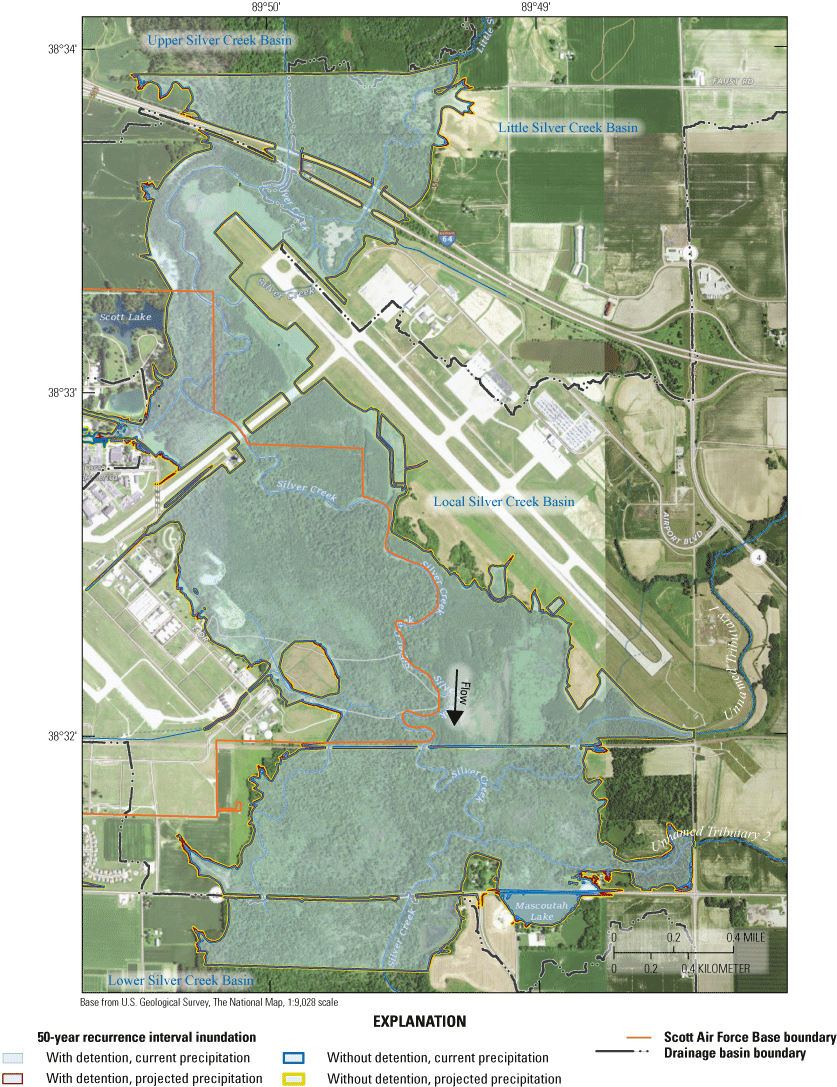
Inundation extents along Silver Creek, Little Silver Creek, Unnamed Tributary 1 and 2 at Scott Air Force Base, Illinois, for 50-year recurrence interval 24-hour duration precipitation scenarios.
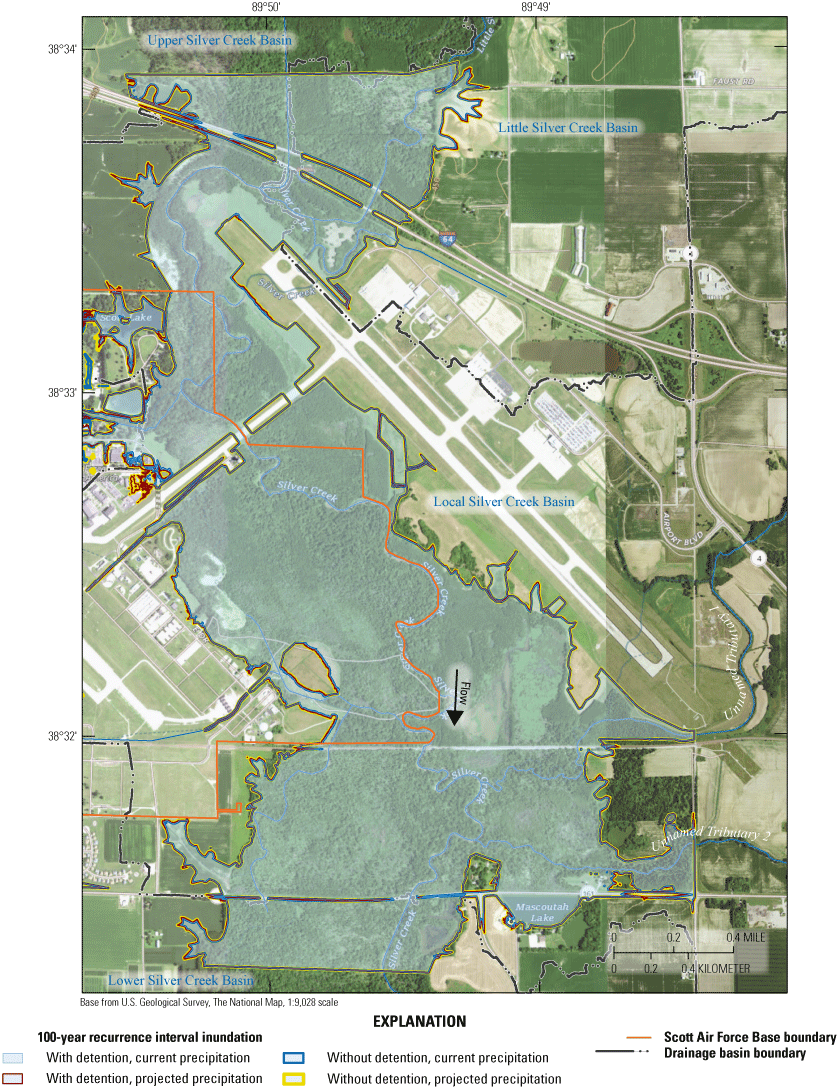
Inundation extents along Silver Creek, Little Silver Creek, Unnamed Tributary 1 and 2 at Scott Air Force Base, Illinois, for 100-year recurrence interval 24-hour duration precipitation scenarios.
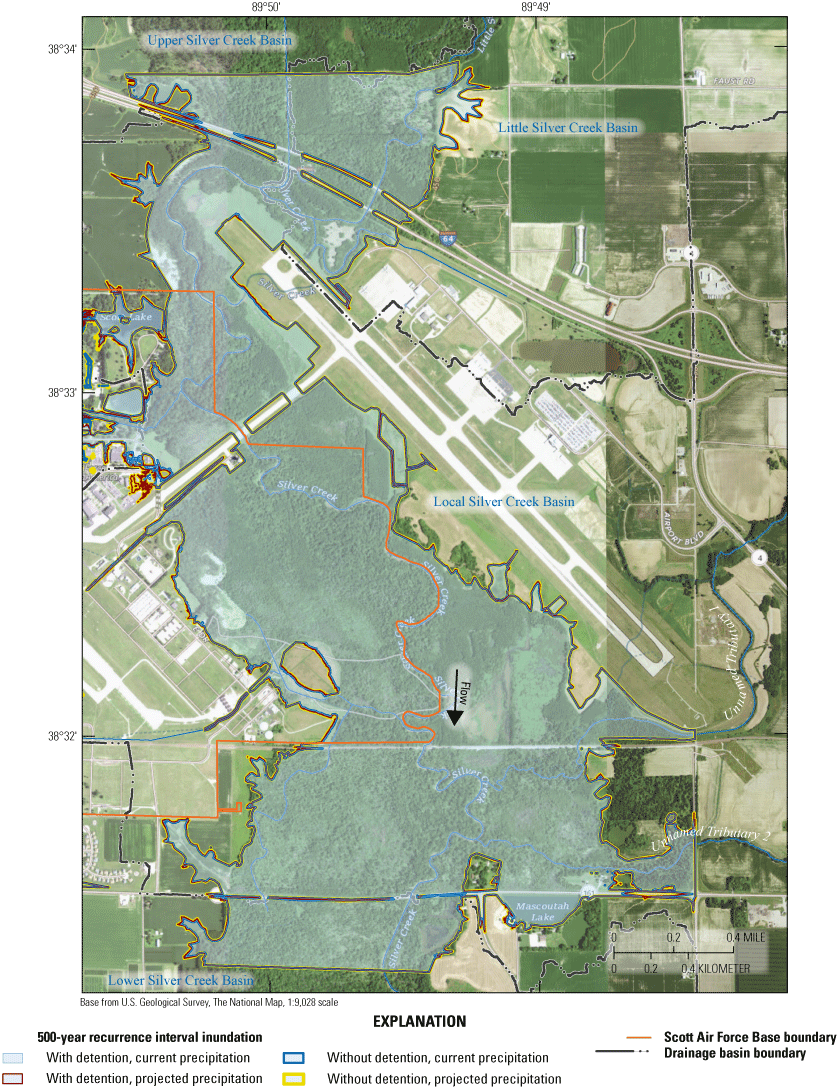
Inundation extents along Silver Creek, Little Silver Creek, Unnamed Tributary 1 and 2 at Scott Air Force Base, Illinois, for 500-year recurrence interval 24-hour duration precipitation scenarios.
Uncertainties and Limitations Regarding Use of Hydrologic and Hydraulic Model Results
Although the generated flood profiles and flood-inundation maps represent the water elevations and boundaries of inundated areas with a distinct line, some uncertainty is associated with these maps. The flood boundaries shown were estimated based on water stages at a selected reference location based on the hydrologic response from selected precipitation magnitudes and 24-hour duration. Water-surface elevations along the stream reach were estimated by unsteady-state hydraulic modeling, assumed unobstructed flow, and used streamflows and hydrologic conditions anticipated at the Silver Creek main stem and tributaries. The hydraulic model reflects the land-cover characteristics and any bridge, culvert, levee, or other hydraulic structures existing as of July 2022. Unique meteorological factors (timing and distribution of precipitation) may cause actual streamflows along the modeled reach to vary from those assumed during a flood, which may lead to deviations in the water-surface elevations and inundation boundaries shown. Additional areas may be flooded because of unanticipated conditions such as changes in the streambed elevation or roughness, backwater into major tributaries along a river main stem, or backwater from localized debris or ice jams. The accuracy of the water-elevation profiles and floodwater extent portrayed on these maps also will vary with the accuracy of the DEM used to simulate the land surface.
Additional uncertainties may be inherent or factored into the simulation of flood peaks generated from rainfall-runoff simulations. A hydrologic model was used to simulate flood peaks associated with various probabilistic precipitation amounts. The precipitation was assumed to follow a defined temporal distribution over the duration of the event and an even spatial distribution over the basin. The actual temporal and spatial distribution of precipitation may vary, thereby affecting the timing and magnitude of the predicted flood peak in the main stem or tributary. A single “simple” storm was simulated with a near-base-flow starting condition. For multiple compounding precipitation events, the starting streamflow condition may be considerably higher than base flow and, therefore, the peak condition also will be higher than simulated conditions. Other sources of uncertainty will arise from the selection of the appropriate antecedent runoff condition and the occurrence of atypical precipitation events including rainfall on frozen ground or on a substantial existing snowpack, all of which may affect the timing and magnitude of the predicted flood peak. Although the projected precipitation adjustments for 2050 are based on results from 32 climate models (U.S. Department of Transportation, 2022), these estimates also include uncertainty. The simplified representation of temporal changes in land cover through modification of the HEC–HMS CN loss parameter alone provides uncertainty to the full effect of the changes in the timing of peak streamflows because timing is relatively insensitive to changes in this parameter.
Summary
This report describes the development of a hydrologic model of the Silver Creek Basin upstream from the U.S. Geological Survey streamgage near Freeburg, Illinois, and a hydraulic model of Silver Creek and local tributaries on and near Scott Air Force Base (SAFB), Illinois. The models were used to assess the effects of temporal and spatial changes in land cover and corresponding hydrologic characteristics within the Silver Creek Basin, the potential effects of projected changes in future precipitation at the basin and local SAFB scale, and the effects of added detention storage in selected tributaries near SAFB. The hydrologic model was developed using Hydrologic Engineering Center–Hydrologic Modeling System (version 4.9) and the hydraulic model was developed using the Hydrologic Engineering Center–River Analysis System (version 6.4). The hydrologic model was calibrated and validated using observed streamflow and water-surface elevation data from six events between June 2015 and July 2022, whereas the hydraulic model was calibrated and validated using observed high-water marks from the August 12–13, 2020; July 26–27, 2022; and March 23–31, 2023 events.
Sensitivity analyses for the hydrologic model were conducted with +5 and –5 percent changes in surface runoff parameters, an infiltration parameter, and precipitation values, and indicated the model was most sensitive to changes in the infiltration parameter (−13.2- and 16.1-percent change) followed by precipitation (−7.20- and 9.08-percent change) for generated peak streamflows and cumulative volume. The timing of the generated peak streamflows were most sensitive to a runoff parameter (−40 and 45 minutes). Sensitivity analyses for the hydraulic model were conducted with +5 and –5 percent changes in Manning’s n-values and the culvert diameters used in the detention scenario were modified by +0.5 and –0.5 feet. Simulated peak streamflows were more sensitive to the incremental change in culvert size (−12.03- to 29.06-percent change in peak streamflow) than by the incremental change in Manning’s n-values (−0.30 to 0.15 percent). The incremental change in culvert size resulted in changes of −0.13 to 0.17 feet in water-surface elevation, and the change in Manning’s n-values resulted in changes of less than 0.10 foot.
A total of 52 scenarios were developed with the hydrologic model, including 24 scenarios developed for assessment of basin-wide changes in hydrology and 28 developed for assessment of hydraulic analyses associated with added detention and projected precipitation on and near SAFB. The 24 basin-wide scenarios were conducted for 2-, 10-, 25-, 50, 100-, and 500-year recurrence interval (50-, 10-, 4-, 2-, 1-, and 0.2-percent annual exceedance probability), 24-hour duration events. The change in peak streamflow, peak timing, and event volume and runoff yield resulting from development and projected precipitation were determined for each of 41 model subbasins. The remaining 28 scenarios were conducted for a focus area of Silver Creek and tributaries in and near SAFB and included existing and projected precipitation conditions with and without added detention. These scenarios were conducted for 2-, 5-, 10, 25-, 50-, 100-, and 500-year recurrence interval (50-, 20-, 10-, 4-, 2-, 1-, and 0.2-percent annual exceedance probability), 24-hour events, and assessments were done through comparisons of water-surface elevation profiles and inundation extents.
The change in the land-cover area classified as development, which is the primary land-cover factor affecting hydrologic change, between existing (2019) and historical (1992) conditions indicated that changes in most subbasins in the Silver Creek Basin were small and less than 10 percent. The greatest change in development occurred in subbasins in the downstream one-half of the Silver Creek Basin and predominantly in model subbasins adjacent to and within SAFB. The change in development under planned conditions from current conditions indicated a similar spatial development pattern to that for current and historical conditions. The maximum change in subbasin development under planned/future conditions was expected to be higher (up to 61.4 percent) than that determined between current and historical (40.2 percent) conditions. The greatest change in planned development on SAFB corresponded to subbasins in Ash Creek and Cardinal Creek Basins, and in a subbasin of a Silver Creek tributary to the east of SAFB.
The changes in hydrologic characteristics of model subbasins under the temporal analysis periods of historical, future land cover, and future land cover with projected precipitation relative to current conditions were assessed using probabilistic rainfall events. Change in hydrologic conditions followed a spatial pattern similar to that of the change in land-cover development, with the greatest hydrologic changes located in subbasins in the downstream one-half of the Silver Creek Basin and most pronounced in subbasins in and surrounding SAFB. The results indicated that the change in simulated peak streamflows was greater under future conditions than between historical and current conditions. There was as much as an estimated 54.6-percent increase in peak streamflows in subbasins on or near SAFB from historical to current conditions but a change of as much as 144 percent was anticipated under the future land cover with incorporated projected precipitation. The changes in the timing of peak streamflows was towards earlier peaks and maximum change was less than 0.5 hour (30 minutes) at subbasins on SAFB for the 2-year recurrence interval event. Results of the change in cumulative volume were similar to those of peak streamflow in terms of magnitude of change and temporal and spatial distribution of changes. The greatest magnitude of change in the assessed hydrologic properties was associated with the 2-year recurrence interval event, and the magnitude of the percentage change decreased with increasing event recurrence interval.
The relative change in cumulative event runoff volume also was normalized by subbasin drainage area to indicate the change in runoff yields. Results of the comparison of 2-year and 100-year recurrence interval event runoff yields indicated similarities in the spatial distribution of change to that of the percentage change in cumulative volume. Subbasins with a substantial change in runoff yield between historical and current conditions were primarily in the downstream one-half of the Silver Creek Basin and most were within or adjacent to SAFB. The magnitude of runoff yield changes increased with recurrence interval, and maximum changes were associated with subbasins on base and with the changes between the historical and current conditions.
The effects of added detention storage and projected climate conditions were assessed using a hydraulic model of a focus area that included SAFB and adjacent tributary inflows. The effects of the detention structures, which were located along Ash Creek, South Ditch, and Cardinal Creek, had a greater effect in these basins on water levels than did the effects of projected changes in precipitation for all scenarios. Reductions in water-surface profile elevations were most pronounced for the 25-year recurrence interval event (detention structure sizing was optimized for this mid-range event) but the effects of detention on reducing profile water levels were present for the 2-year through 500-year recurrence interval events. Maximum reductions of water-surface elevations of about 2 feet were determined in the Ash Creek and South Ditch Basins and 3 feet in the Cardinal Creek Basin associated with detention structures. Because the added detention was restricted to three small tributaries on the west side of the base, these effects of detention were not apparent in the larger Silver Creek main-stem reach or remaining eastern tributaries on base. The effects of projected precipitation were increases in the water-surface profiles of less than 1 foot to about 1 foot, with the lower range associated with the tributaries and the upper range associated with the Silver Creek main stem. The results indicated that despite the increases in water-surface elevations resulting from projected increases in precipitation, the added detention structures provided a net reduction in water-surface profiles in the flood-prone western tributaries of the base.
The effects of detention structures and projected precipitation also were assessed using the mapped extent of flood inundation for the simulated probabilistic precipitation scenarios. For example, minor inundation of a residential area along Ash Creek was evident in the 5-year event for without detention scenarios, whereas the first indications of flooding in the Ash Creek residential area from the with detention scenario with current precipitation were in the 50-year recurrence interval event. As another example, a major road crossing along Cardinal Creek was overtopped for the without detention scenarios beginning with the 25-year recurrence event. This crossing, however, was not overtopped until the 100-year recurrence interval event for the projected precipitation scenario with detention and not until the 500-year recurrence interval event for the current precipitation with detention condition. The downstream reaches of the eastern tributaries on and near SAFB are within the influence of Silver Creek backwater effects. The direct effects of Silver Creek flooding of infrastructure on SAFB were primarily associated with the lower Cardinal Creek Basin. It is likely that in local tributaries, including Cardinal Creek, initial flooding associated with headwater sources in the tributaries was followed hours later by flood effects resulting from the Silver Creek main stem as evidenced from calibration event results. Flooding of infrastructure by Silver Creek in the lower reaches of the tributaries is primarily associated with the 100-year and 500-year recurrence interval events.
References Cited
American Society for Photogrammetry and Remote Sensing (ASPRS), 2023, ASPRS positional accuracy standards for digital geospatial data—Edition 2, version 1: American Society for Photogrammetry and Remote Sensing, 25 p., accessed May 30, 2024, at https://publicdocuments.asprs.org/PositionalAccuracyStd-Ed2-V1.
Angel, J.R., Markus, M., Wang, K.A., Kerschner, B.M., and Singh, S., 2020, Precipitation frequency study for Illinois: University of Illinois at Urbana–Champaign, Illinois State Water Survey Bulletin 75, 130 p. [Also available at https://www.ideals.illinois.edu/handle/2142/106653.]
Barnes, H.H., Jr., 1967, Roughness characteristics of natural channels: U.S. Geological Survey Water-Supply Paper 1849, 219 p. [Also available at https://doi.org/10.3133/wsp1849.]
Bureau of Reclamation, 2022, Downscaled CMIP5 Climate and Hydrology Projections (DCHP): accessed October 1, 2022, at https://gdo-dcp.ucllnl.org/downscaled_cmip_projections.
Cigrand, C.V., and Heimann, D.C., 2024, Archive of the hydrologic and hydraulic models used in the analyses of the Silver Creek Basin and selected tributaries associated with Scott Air Force Base, Illinois, 1992–2050: U.S. Geological Survey data release, accessed November 2024 at https://doi.org/10.5066/P9GBYP2K.
Clark, C.O., 1945, Storage and the unit hydrograph: Transactions of the American Society of Civil Engineers, v. 110, no. 1, p. 1419–1446. [Also available at https://doi.org/10.1061/TACEAT.0005800.]
Cunge, J.A., 1969, On the subject of a flood propagation computation method (Muskingum method): Journal of Hydraulic Research, v. 7, no. 2, p. 205–230. [Also available at https://doi.org/10.1080/00221686909500264.]
Dewitz, J., and U.S. Geological Survey, 2021, National Land Cover Database (NLCD) 2019 Products (ver. 2.0, June 2021): U.S. Geological Survey data release, accessed August 5, 2021, at https://doi.org/10.5066/P9KZCM54.
Esri, 2023, ArcGIS Pro (version 3.1.2): Esri software release, accessed May 2023, at https://www.esri.com/en-us/arcgis/products/arcgis-pro/overview.
Federal Emergency Management Agency, 2003, Flood insurance study St. Clair County Illinois and incorporated areas: Federal Emergency Management Agency flood insurance study number 1716CM000A, 43 p., accessed February 6, 2021, at https://map1.msc.fema.gov/data/17/S/PDF/17163CV000A.pdf?LOC=b11f5c69d7440356538e46b9b7850fcd.
Federal Emergency Management Agency, 2023, Community rating system: Federal Emergency Management Agency, accessed March 14, 2023, at https://www.fema.gov/floodplain-management/community-rating-system.
Frankson, R., Kunkel, K.E., Champion, S., and Steward, B.C., 2022, Illinois State climate summary: National Oceanic and Atmospheric Administration, Technical Report 150-IL, 6 p., accessed November 17, 2023, at https://statesummaries.ncics.org/downloads/Illinois-StateClimateSummary2022.pdf.
Graf, J.B., Garklavs, G., and Oberg, K.A., 1982, Time of concentration and storage coefficient values for Illinois streams: U.S. Geological Survey Water-Resources Investigations Report 82–13, 35 p. [Also available at https://doi.org/10.3133/wri8213.]
Gupta, H.V., Sorooshian, S., and Yapo, P.O., 1999, Status of automatic calibration for hydrologic models—Comparison with multilevel expert calibration: Journal of Hydrologic Engineering, v. 4, no. 2, p. 135–143. [Also available at https://doi.org/10.1061/(ASCE)1084-0699(1999)4:2(135).]
HDR Incorporated, 2019, Environmental assessment for installation development at Scott Air Force Base, Illinois: HDR Incorporated, 278 p. [Also available at https://www.scott.af.mil/Portals/28/Required%20PDFs/Environmental%20Assessment%20(July%202019).pdf?ver=2019-08-06-154624-293.]
Heartlands Conservancy, 2018, Lower Silver Creek watershed plan—A guide to restoring and protecting watershed health: Heartlands Conservancy, 137 p. [Also available at https://heartlandsconservancy.org/wp-content/uploads/2021/05/executive-summary-final.pdf.]
Heidemann, H.K., 2018, Lidar base specification (ver. 1.3, February 2018): U.S. Geological Survey Techniques and Methods, book 11, chap. B4, 101 p., accessed February 7, 2020, at https://doi.org/10.3133/tm11B4.
Hershfield, D.M., 1961, Rainfall frequency atlas of the United States: U.S. Department of Agriculture, Technical Paper No. 40, accessed February 2023, at https://reduceflooding.com/wp-content/uploads/2018/09/TechnicalPaper_No40.pdf.
Illinois Business Journal, 2017, Woolpert, Scott AFB worked together to provide support for key tenants: Illinois Business Journal, accessed February 7, 2021, at https://www.ibjonline.com/2017/03/05/woolpert-scott-afb-worked-together-to-provide-support-for-key-tenants/.
Iowa State University, 2021, Iowa Environmental Mesonet—Missouri ASOS Network, LRY Harrisonville: Iowa State University digital data, accessed January 19, 2021, at https://mesonet.agron.iastate.edu/sites/obhistory.php?station=LRY&network=MO_ASOS.
King, D., Gurtner, Y., Firdaus, A., Harwood, S., and Cottrell, A., 2016, Land use planning for disaster risk reduction and climate change adaptation—Operationalizing policy and legislation at local levels: International Journal of Disaster Resilience in the Built Environment, v. 7, no. 2, p. 158–172. [Also available at https://doi.org/10.1108/IJDRBE-03-2015-0009.]
Koenig, T.A., Bruce, J.L., O’Connor, J.E., McGee, B.D., Holmes, R.R., Jr., Hollins, R., Forbes, B.T., Kohn, M.S., Schellekens, M.F., Martin, Z.W., and Peppler, M.C., 2016, Identifying and preserving high-water mark data: U.S. Geological Survey Techniques and Methods, book 3, chap. A24, 47 p. [Also available at https://doi.org/10.3133/tm3A24.]
Merwade, V., 2021, Creating CN grid in QGIS from NLCD landuse and SSURGO soil data: Lyles School of Civil Engineering, Purdue University, 14 p., accessed February 18, 2021, at https://web.ics.purdue.edu/~vmerwade/education/qcngrid.pdf.
Moriasi, D.N., Arnold, J.G., Van Liew, M.W., Binger, R.L., Harmel, R.D., and Veith, T.L., 2007, Model evaluation guidelines for systematic quantification of accuracy in watershed simulations: Transactions of the American Society of Agricultural and Biological Engineers, v. 50, no. 3, p. 885–900. [Also available at https://doi.org/10.13031/2013.23153.]
Nakagaki, N., Price, C.V., Falcone, J.A., Hitt, K.J., and Ruddy, B.C., 2007, Enhanced National Land Cover Data 1992 (NLCDe 92): U.S. Geological Survey data release, accessed September 2023, at https://doi.org/10.5066/P9ZB8A60.
Nash, J.E., and Sutcliffe, J.V., 1970, River flow forecasting through conceptual models part 1—A discussion of principles: Journal of Hydrology, v. 10, no. 3, p. 282–290. [Also available at https://doi.org/10.1016/0022-1694(70)90255-6.]
Natural Resources Conservation Service, 2004, Estimation of direct runoff from storm rainfall—Part 630 hydrology—National engineering handbook: Washington, D.C., U.S. Department of Agriculture, [variously paged]. [Also available at https://www.hydrocad.net/neh.htm.]
Natural Resources Conservation Service, 2021, Web soil survey: U.S. Department of Agriculture, accessed April 8, 2021, at https://websoilsurvey.sc.egov.usda.gov/App/HomePage.htm.
QGIS Development Team, 2021, QGIS—A free and open source geographic information system: Open Source Geospatial Foundation, accessed February 19, 2021, at http://qgis.org.
Rydlund, P.H., Jr., and Densmore, B.K., 2012, Methods of practice and guidelines for using survey-grade global navigation satellite systems (GNSS) to establish vertical datum in the United States Geological Survey: U.S. Geological Survey Techniques and Methods, book 11, chap. D1, 102 p. with appendixes. [Also available at https://doi.org/10.3133/tm11D1.]
Saint Clair County, 2023, St. Clair County zoning map viewer: St. Clair County geographic information system, accessed January 4, 2023, at https://stclairco.maps.arcgis.com/apps/webappviewer/index.html?id=642f8d1cc8df4ec6b8f524c7fc9b3991.
Science Applications International Corporation, 2007, Installation development environmental assessment at Scott Air Force Base, Illinois: St. Louis, Mo., Science Applications International Corporation, 158 p. [Also available at https://apps.dtic.mil/sti/citations/ADA636245.]
Scott Air Force Base, 2020a, Scott Air Force Base Overview: Scott Air Force Base, accessed August 2020, at https://www.scott.af.mil/About-Us/Contact-Us/Questions-and-Information/.
Scott Air Force Base, 2020b, Scott AFB personnel responds to flash floods: Senior Airman Miranda Simpson, 375th Air Mobility Wing Public Affairs, accessed August 2020 at https://www.af.mil/News/Article-Display/Article/2315816/scott-afb-personnel-responds-to-flash-floods/.
Scott Air Force Base, 2024, Scott AFB responds to flash flooding: Staff Sgt. Stephanie Henry, 375th Air Mobility Wing Public Affairs Office, accessed July 2024 at https://www.scott.af.mil/News/Article/3844404/scott-afb-responds-to-flash-flooding/.
Soil Conservation Service, 1986, Urban hydrology for small watersheds—TR–55: Washington, D.C., U.S. Department of Agriculture, 98 p. [Also available at https://www.nrc.gov/docs/ML1421/ML14219A437.pdf.]
Straub, T.D., Melching, C.S., and Kocher, K.E., 2000, Equations for estimating Clark unit-hydrograph parameters for small rural watersheds in Illinois: U.S. Geological Survey Water-Resources Investigations Report 2000–4184, 30 p. [Also available at https://doi.org/10.3133/wri004184.]
The Village of Shiloh, 2018, Shiloh Comprehensive Plan: The Village of Shiloh, 86 p., accessed March 2, 2023, at https://shilohil.org/wp-content/uploads/6-4-18-Shiloh-Comp-FINAL.pdf.
Turnipseed, D.P., and Sauer, V.B., 2010, Discharge measurements at gaging stations: U.S. Geological Survey Techniques and Methods, book 3, chap. A8, 87 p. [Also available at https://doi.org/10.3133/tm3A8.]
U.S. Army Corps of Engineers, 2022a, Hydrologic Engineering Center–Hydrologic Modeling System (HEC–HMS 4.9): U.S. Army Corps of Engineers software release, accessed February 22, 2022, at https://www.hec.usace.army.mil/software/hec-hms/downloads.aspx.
U.S. Army Corps of Engineers, 2022b, Hydrologic Engineering Center–Hydrologic Modeling System (HEC–HMS 4.9) user’s manual: U.S. Army Corps of Engineers software release, accessed February 22, 2022, at https://www.hec.usace.army.mil/confluence/hmsdocs/hmsum/4.9.
U.S. Army Corps of Engineers, 2023, HEC–RAS—River analysis system version 6.4: U.S. Army Corps of Engineers software release, accessed October 15, 2022, at https://www.hec.usace.army.mil/software/hec-ras/download.aspx.
U.S. Department of Agriculture, 2021, GeoSpatial data gateway: U.S. Department of Agriculture, Natural Resources Conservation Service, accessed November 3, 2021, at https://datagateway.nrcs.usda.gov/GDGOrder.aspx.
U.S. Department of Transportation, 2022, CMIP Processing Tool Version 2.1: U.S. Department of Transportation Federal Highway Administration, accessed on February 2, 2022 at https://www.fhwa.dot.gov/engineering/hydraulics/software/cmip_processing_tool_version2.cfm.
U.S. Geological Survey, 2021a, USGS 05594800 Silver Creek near Freeburg, Illinois, in USGS water data for the Nation: U.S. Geological Survey National Water Information System database, accessed October 4, 2021, at https://doi.org/10.5066/F7P55KJN. [Site information directly accessible at https://waterdata.usgs.gov/monitoring-location/05594800/#parameterCode=00065&period=P7D.]
U.S. Geological Survey, 2021b, USGS 05594450 Silver Creek near Troy, Illinois, in USGS water data for the Nation: U.S. Geological Survey National Water Information System database, accessed October 4, 2021, at https://doi.org/10.5066/F7P55KJN. [Site information directly accessible at https://waterdata.usgs.gov/monitoring-location/05594450/#parameterCode=00065&period=P7D.
U.S. Geological Survey, 2021c, 3DEP LidarExplorer: U.S. Geological Survey, accessed on November 4, 2021, at https://apps.nationalmap.gov/lidar-explorer/#/.
U.S. Geological Survey, 2021d, USGS surface-water data for the Nation, in USGS water data for the Nation: U.S. Geological Survey National Water Information System database, accessed October 4, 2021, at https://doi.org/10.5066/F7P55KJN. [Surface-water data directly accessible at https://waterdata.usgs.gov/nwis/sw.]
University of Illinois, 2006, Scott Air Force Base—Results of LEAM simulations: University of Illinois, Landuse Evolution and impact Assessment Model (LEAM) Laboratory, 24 p., accessed May 30, 2024, at http://plone.rehearsal.uiuc.edu/gLEAM/workshops/SAFB/scottjan06.pdf.
vanVuuren, D.P., Edmonds, J., Kainuma, M., Riahi, K., Thomson, A., Hibbard, K., Hurtt, G.C., Kram, T., Krey, V., Lamarque, J.-F., Masui, T., Meinshausen, M., Nakicenovic, N., Smith, S.J., and Rose, S.K., 2011, The representative concentration pathways—An overview: Climatic Change, v. 109, no. 5, p. 5–31. [Also available at https://doi.org/10.1007/s10584-011-0148-z.]
Appendix 1. Water-Surface Elevation Profiles of Silver Creek, Little Silver Creek, Unnamed Tributary 1, and Unnamed Tributary 2
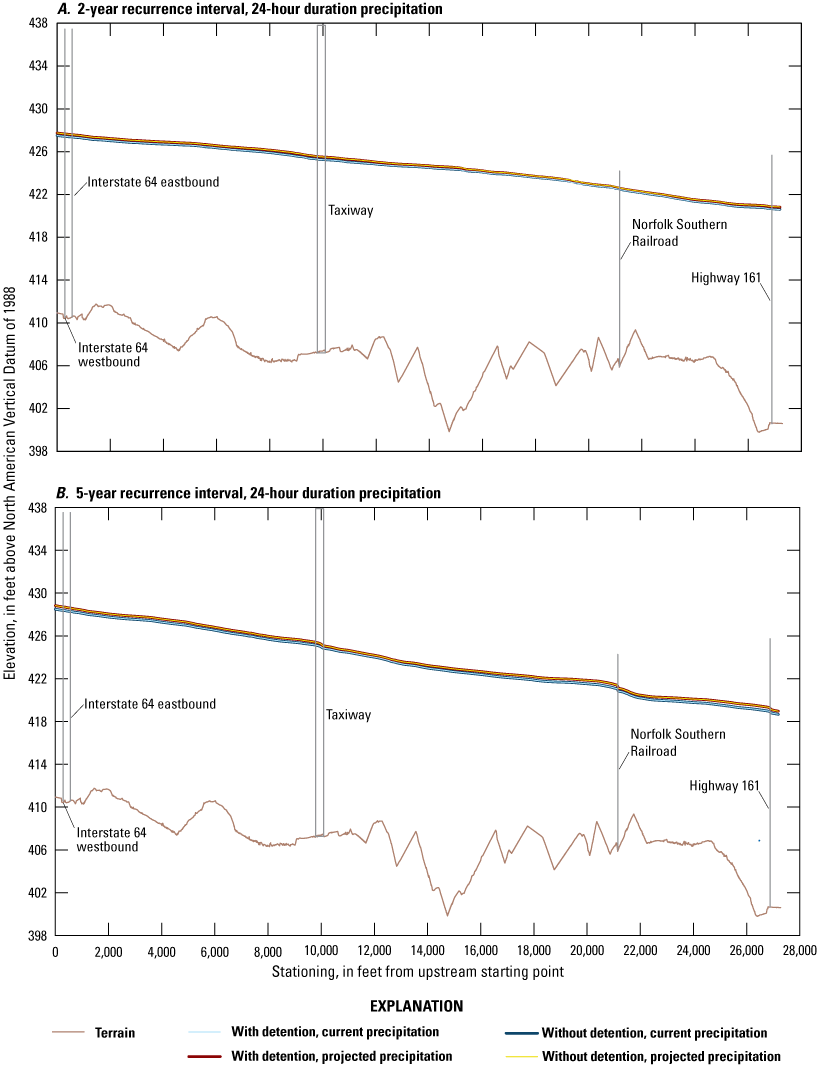
Water-surface elevation profiles for Silver Creek, Scott Air Force Base, Illinois. A, 2-year recurrence interval scenarios. B, 5-year recurrence interval scenarios.
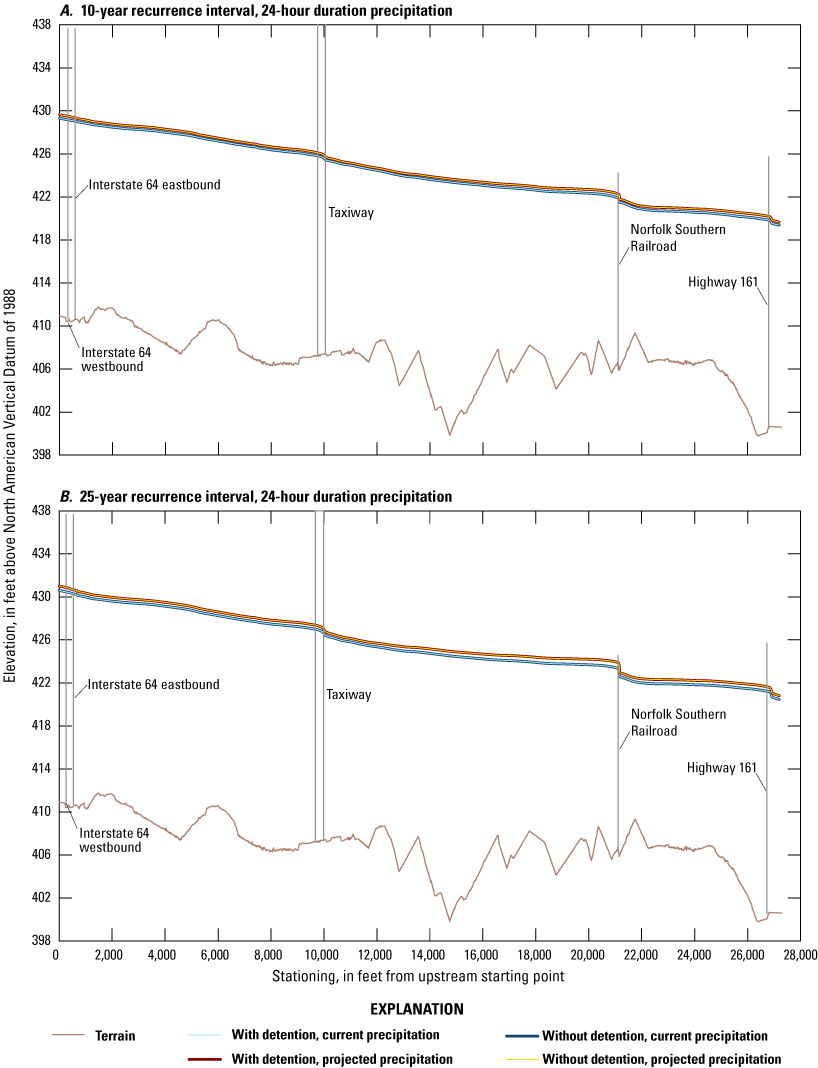
Water-surface elevation profiles for Silver Creek, Scott Air Force Base, Illinois. A, 10-year recurrence interval scenarios B, 25-year recurrence interval scenarios.
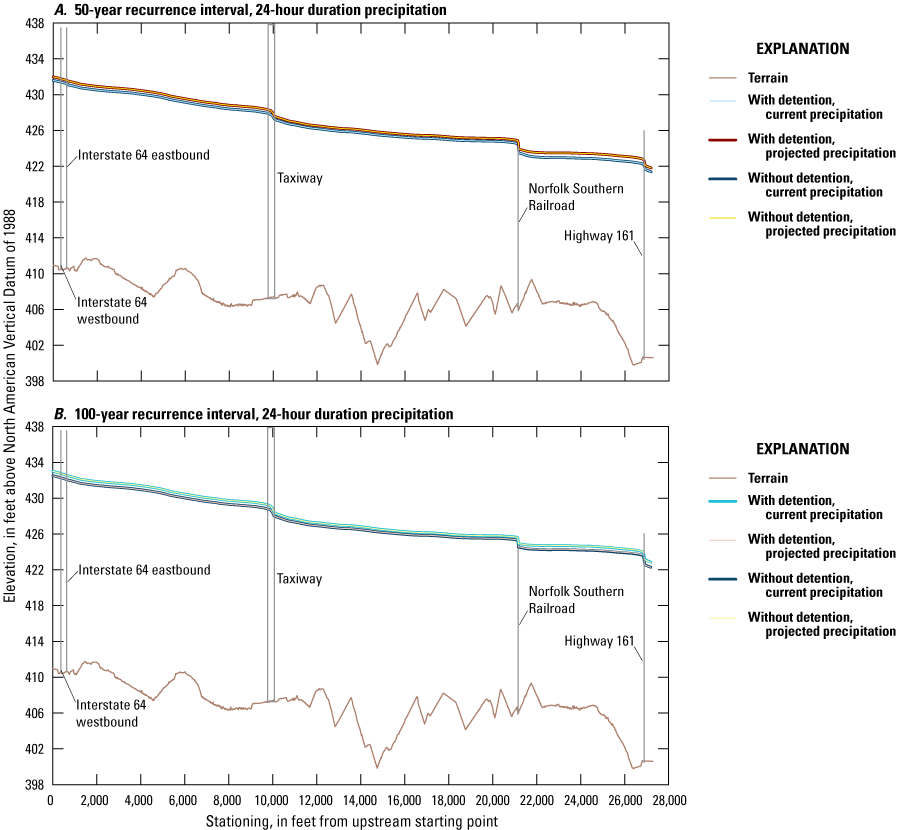
Water-surface elevation profiles for Silver Creek, Scott Air Force Base, Illinois. A, 50-year recurrence interval scenarios B, 100-year recurrence interval scenarios.
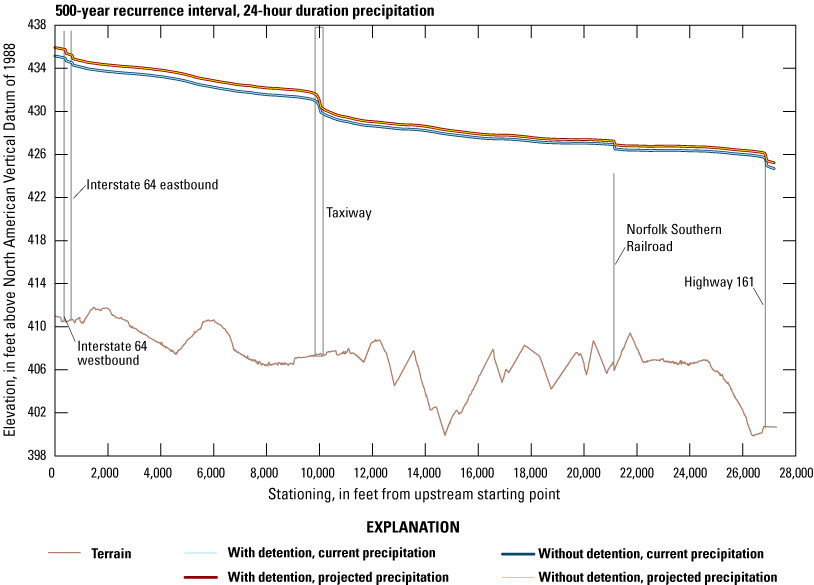
Water-surface elevation profiles for Silver Creek, Scott Air Force Base, Illinois, for 500-year recurrence interval scenarios.
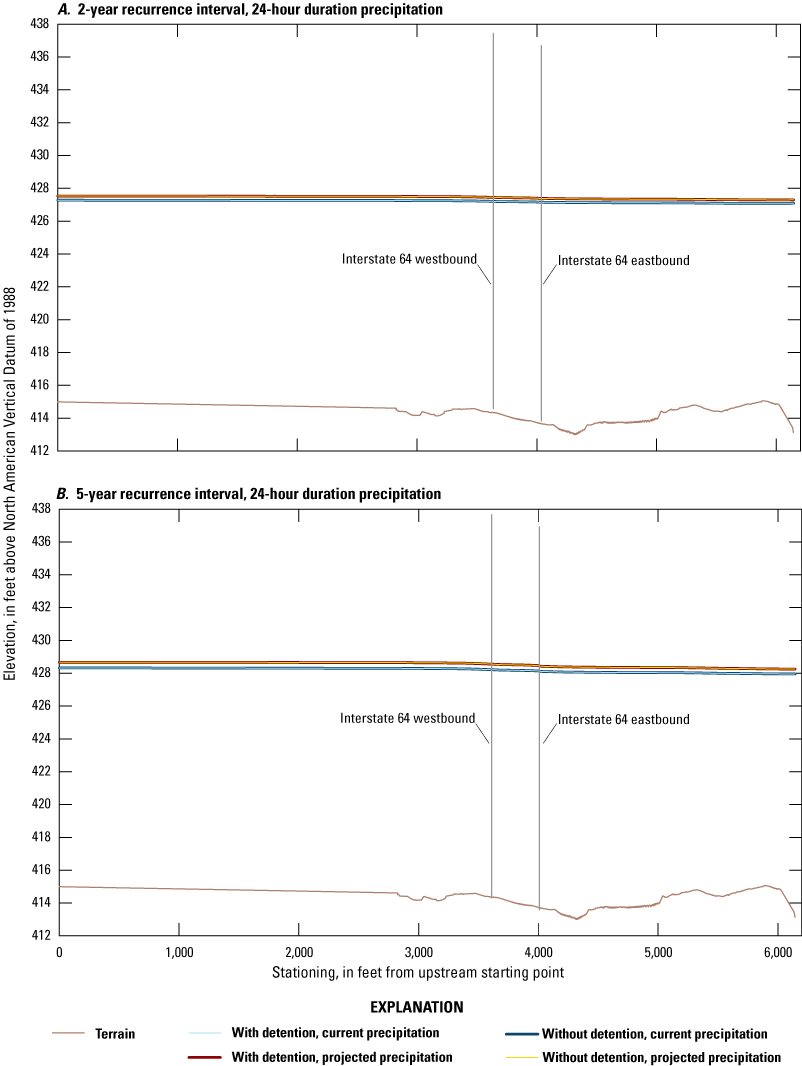
Water-surface elevation profiles for Little Silver Creek, Scott Air Force Base, Illinois. A, 2-year recurrence interval scenarios B, 5-year recurrence interval scenarios.
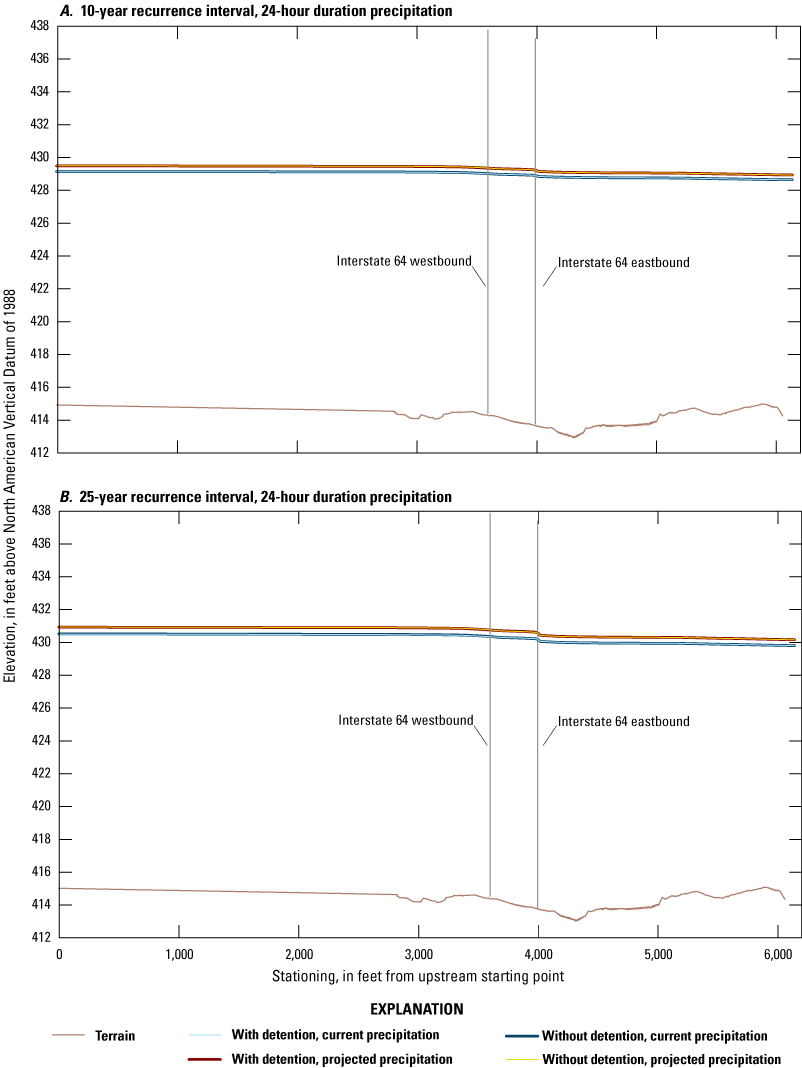
Water-surface elevation profiles for Little Silver Creek, Scott Air Force Base, Illinois. A, 10-year recurrence interval scenarios B, 25-year recurrence interval scenarios.
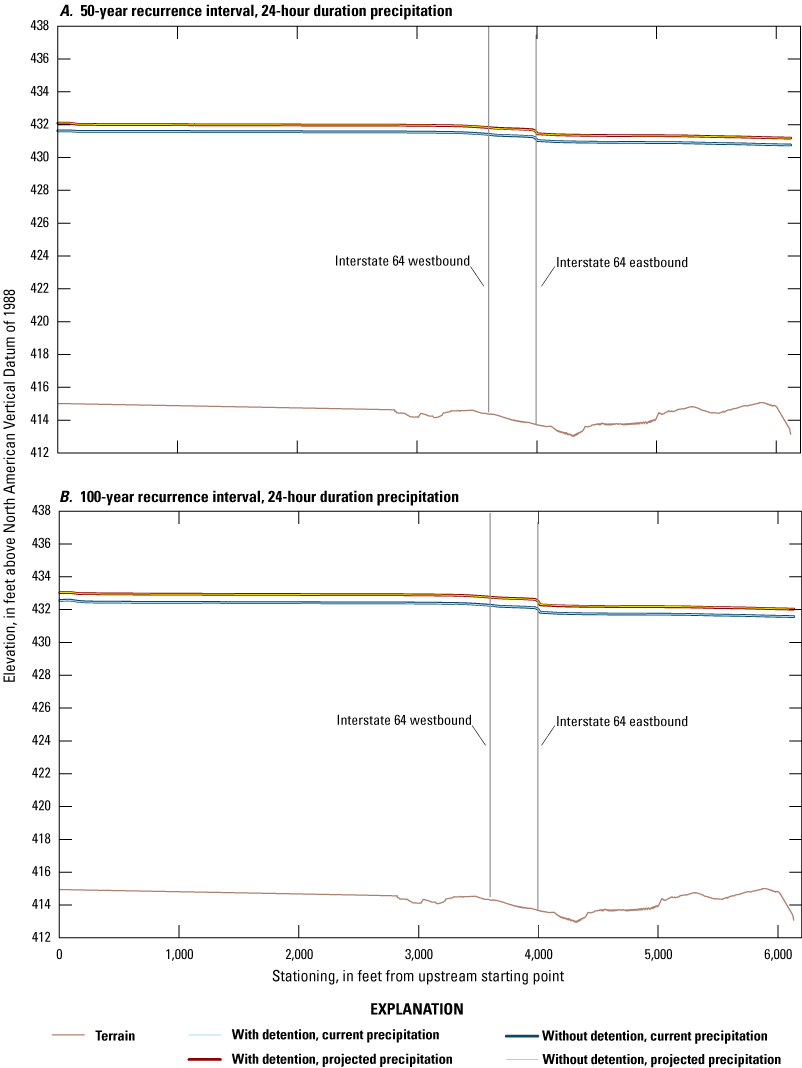
Water-surface elevation profiles for Little Silver Creek, Scott Air Force Base, Illinois. A, 50-year recurrence interval scenarios B, 100-year recurrence interval scenarios.
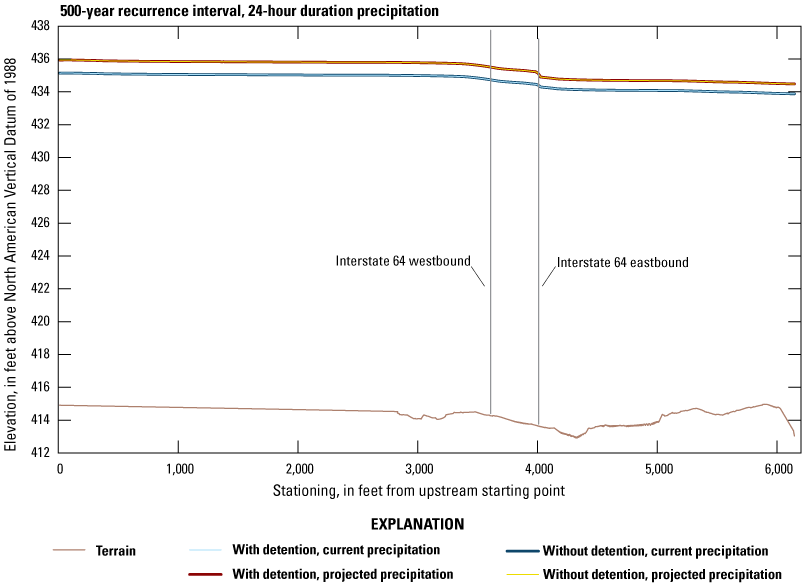
Water-surface elevation profiles for Little Silver Creek, Scott Air Force Base, Illinois, for 500-year recurrence interval scenarios.
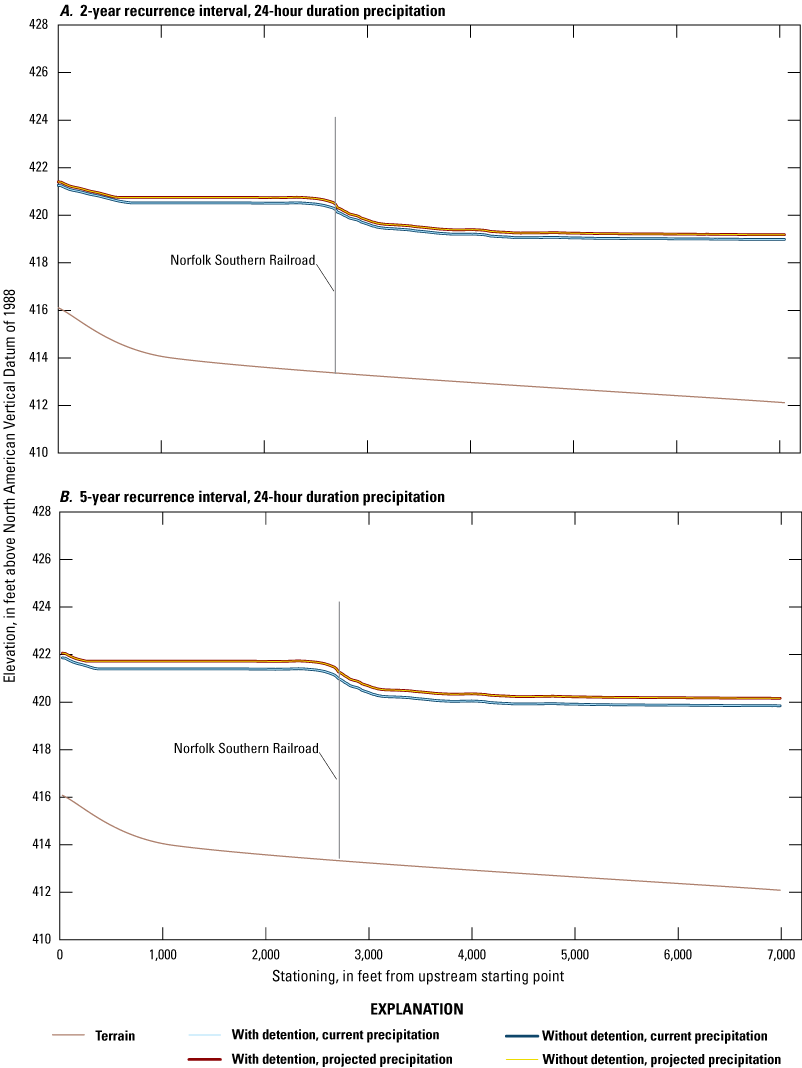
Water-surface elevation profiles for Unnamed Tributary 1, Scott Air Force Base, Illinois. A, 2-year recurrence interval scenarios B, 5-year recurrence interval scenarios.
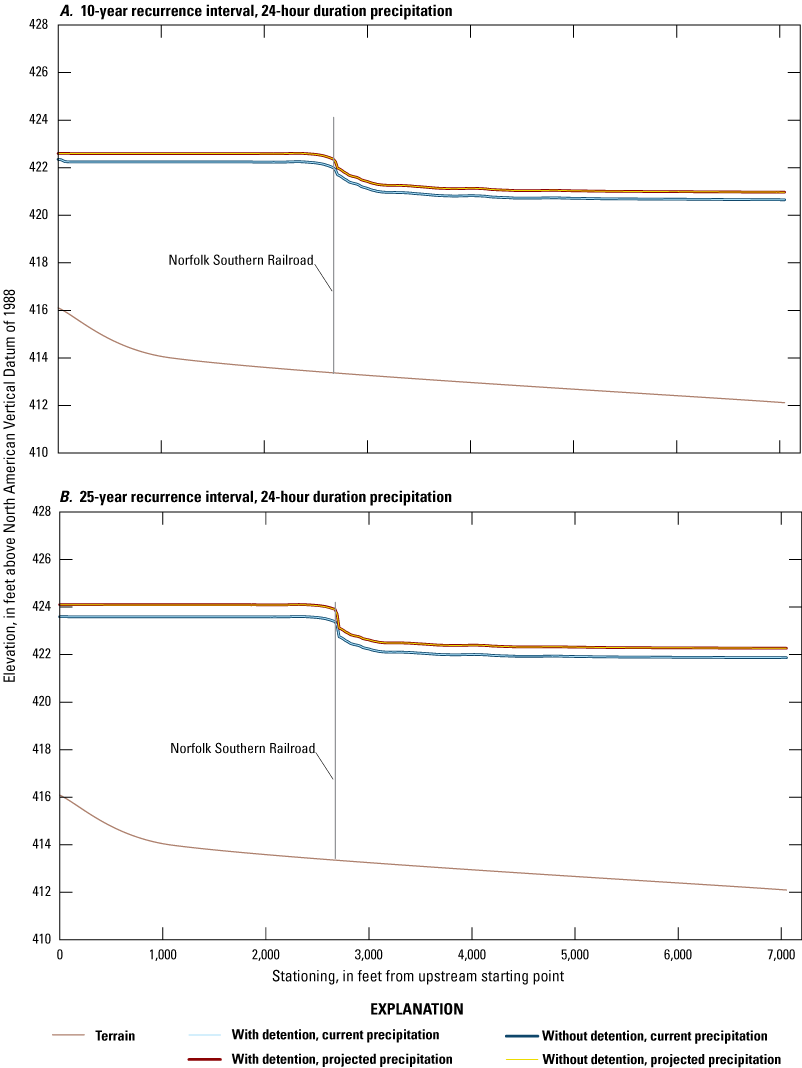
Water-surface elevation profiles for Unnamed Tributary 1, Scott Air Force Base, Illinois. A, 10-year recurrence interval scenarios B, 25-year recurrence interval scenarios.
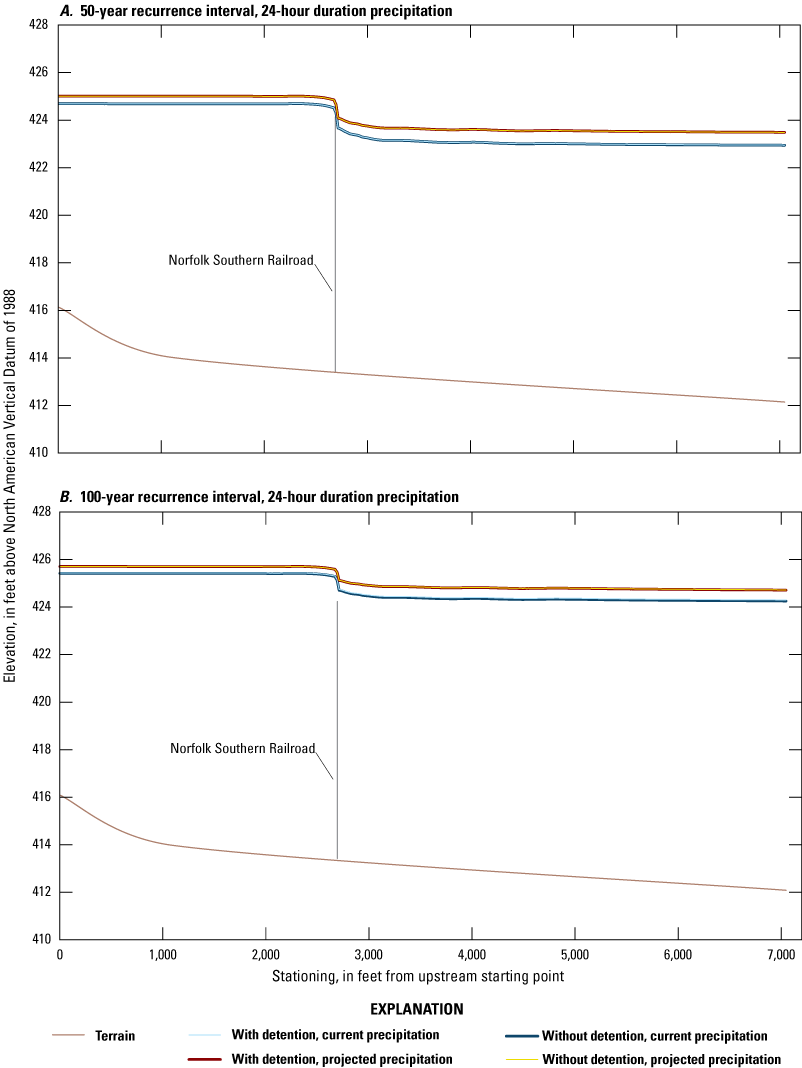
Water-surface elevation profiles for Unnamed Tributary 1, Scott Air Force Base, Illinois. A, 50-year recurrence interval scenarios B, 100-year recurrence interval scenarios.
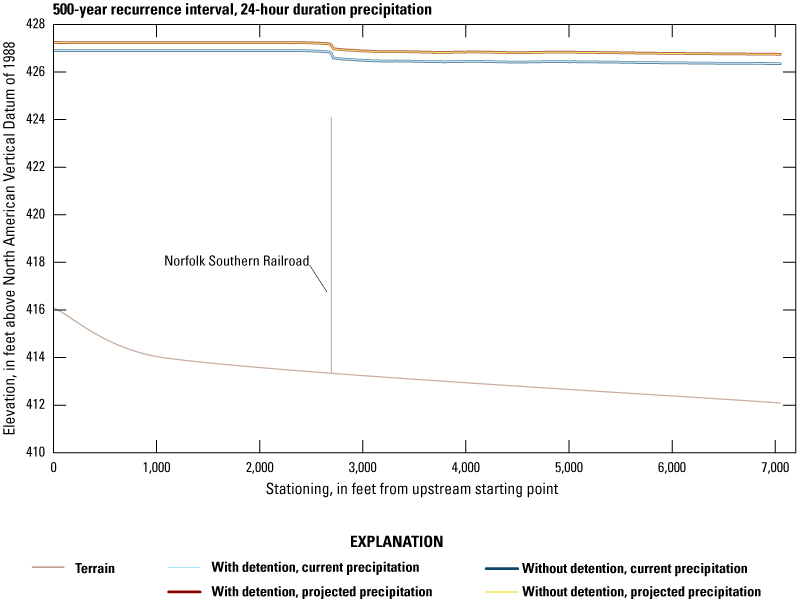
Water-surface elevation profiles for Unnamed Tributary 1, Scott Air Force Base, Illinois, for 500-year recurrence interval scenarios.
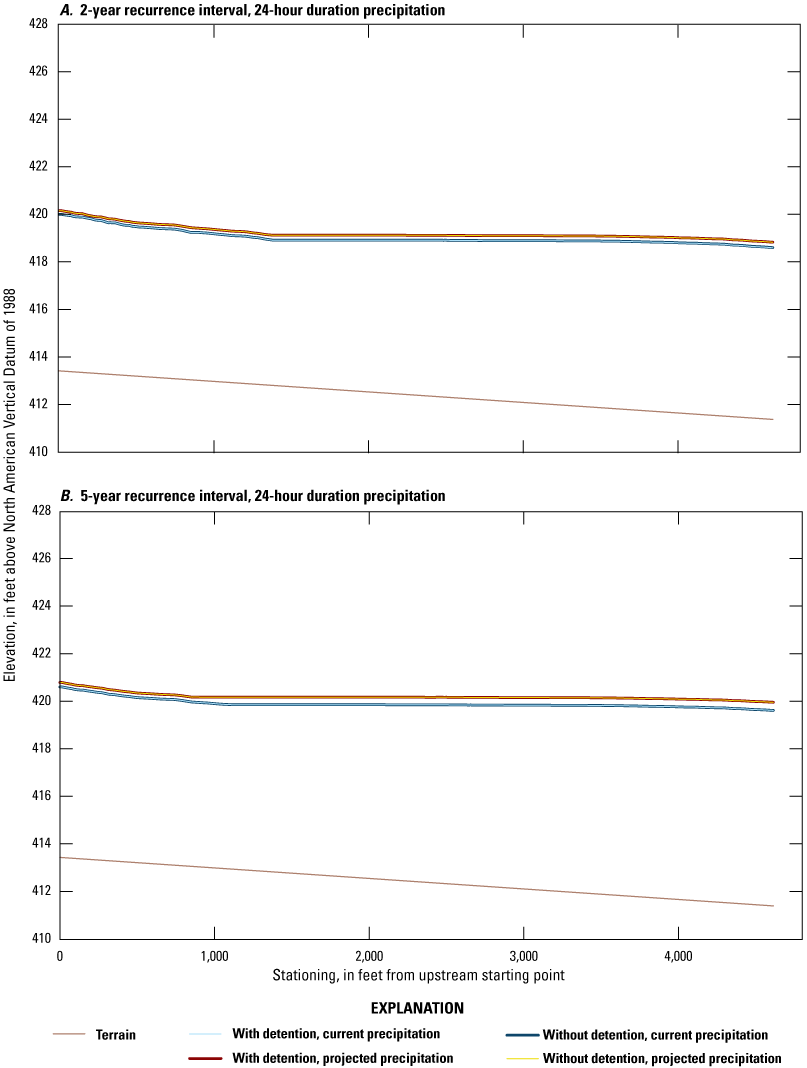
Water-surface elevation profiles for Unnamed Tributary 2, Scott Air Force Base, Illinois. A, 2-year recurrence interval scenarios B, 5-year recurrence interval scenarios.
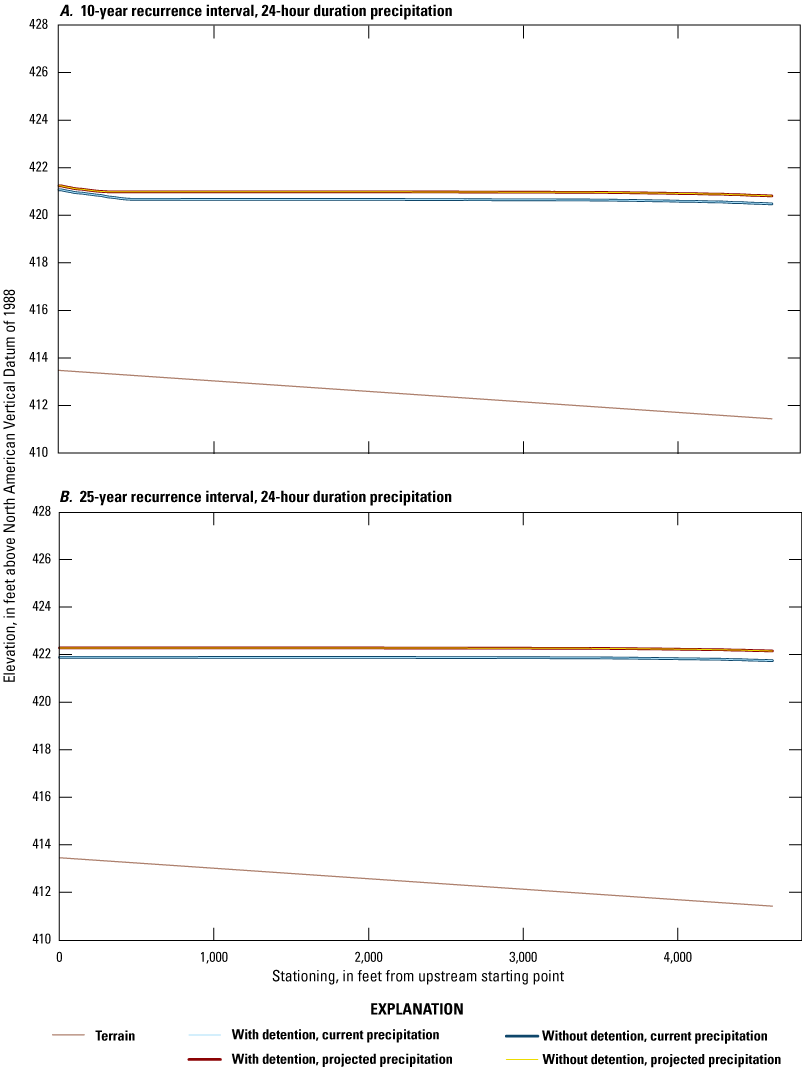
Water-surface elevation profiles for Unnamed Tributary 2, Scott Air Force Base, Illinois. A, 10-year recurrence interval scenarios B, 25-year recurrence interval scenarios.
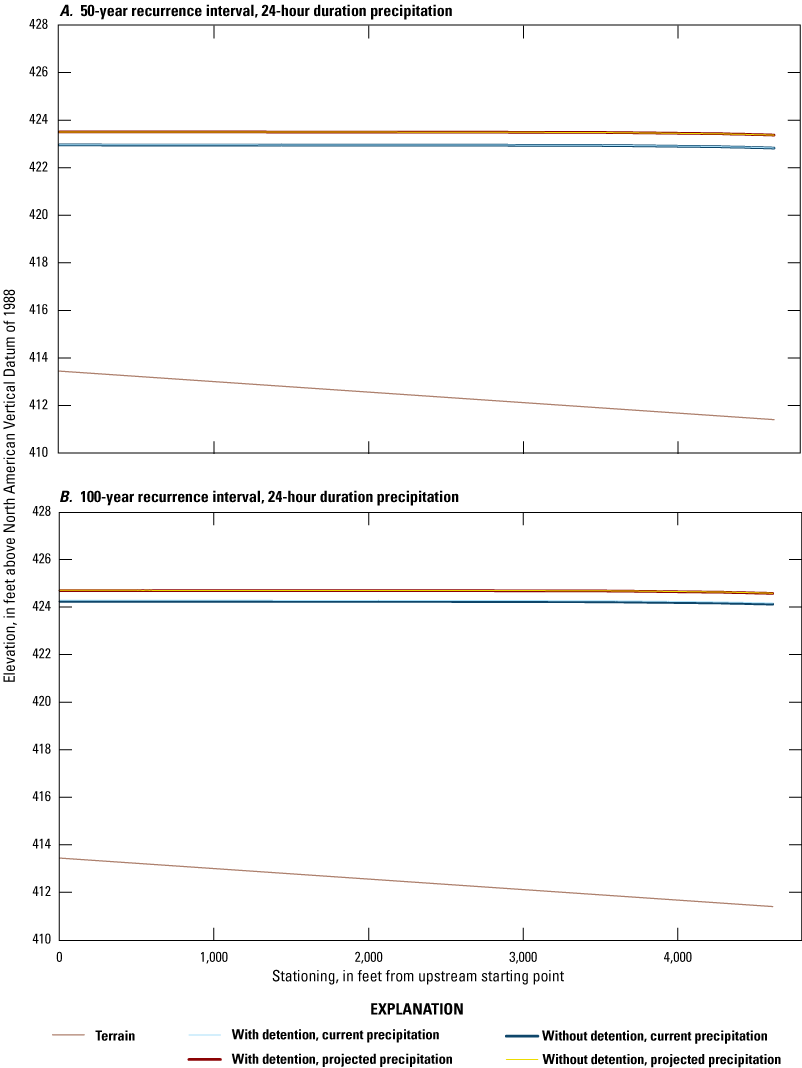
Water-surface elevation profiles for Unnamed Tributary 2, Scott Air Force Base, Illinois. A, 50-year recurrence interval scenarios B, 100-year recurrence interval scenarios.
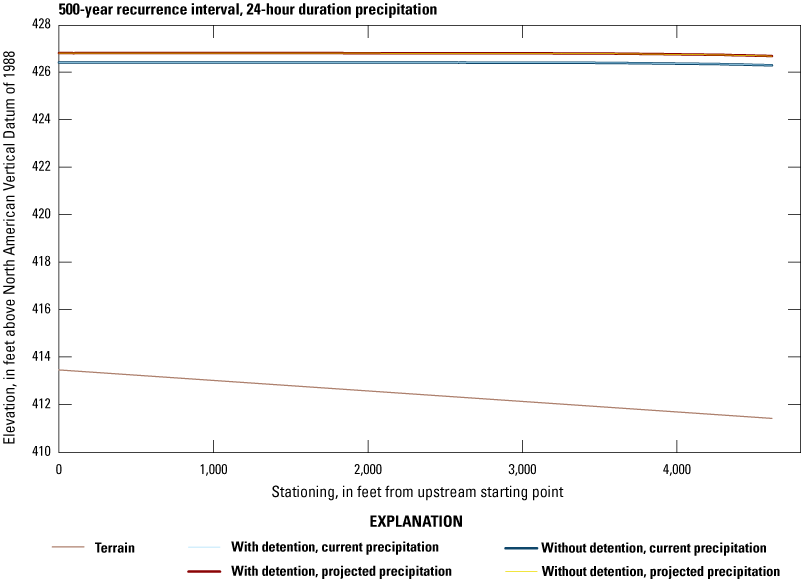
Water-surface elevation profiles for Unnamed Tributary 2, Scott Air Force Base, Illinois, for 500-year recurrence interval scenarios.
Conversion Factors
U.S. customary units to International System of Units
Datums
Vertical coordinate information is referenced to the North American Vertical Datum of 1988 (NAVD 88).
Horizontal coordinate information is referenced to the North American Datum of 1983 (NAD 83).
Elevation, as used in this report, refers to distance above the vertical datum.
Abbreviations
∞
infinity
AEP
annual exceedance probability
CN
Soil Conservation Service runoff curve number
CNII
Soil Conservation Service runoff curve number representing a normal antecedent runoff condition
DEM
digital elevation model
HEC–HMS
Hydrologic Engineering Center-Hydrologic Modeling System
HEC–RAS
Hydrologic Engineering Center-River Analysis System
HWM
high-water mark
ICEMAP
Installation Complex Encroachment Management Action Plan
lidar
light detection and ranging
n-value
Manning’s roughness coefficient
NFIP
National Flood Insurance Program
NSE
Nash-Sutcliffe efficiency
PBIAS
percentage bias
PT
pressure transducer
R
storage coefficient
RI
recurrence interval
SAFB
Scott Air Force Base
Tc
time of concentration
USGS
U.S. Geological Survey
For more information about this publication, contact:
Director, USGS Central Midwest Water Science Center
400 South Clinton Street, Suite 269
Iowa City, IA 52240
319–337–4191
For additional information, visit: https://www.usgs.gov/centers/cm-water
Publishing support provided by the
Rolla Publishing Service Center
Disclaimers
Any use of trade, firm, or product names is for descriptive purposes only and does not imply endorsement by the U.S. Government.
Although this information product, for the most part, is in the public domain, it also may contain copyrighted materials as noted in the text. Permission to reproduce copyrighted items must be secured from the copyright owner.
Suggested Citation
Cigrand, C.V., Heimann, D.C., and Rydlund, P.H., Jr., 2024, Hydrologic and hydraulic analyses of Silver Creek and selected tributaries associated with Scott Air Force Base, Illinois, 2022–24: U.S. Geological Survey Scientific Investigations Report 2024–5117, 87 p., https://doi.org/10.3133/sir20245117.
ISSN: 2328-0328 (online)
Study Area
| Publication type | Report |
|---|---|
| Publication Subtype | USGS Numbered Series |
| Title | Hydrologic and hydraulic analyses of Silver Creek and selected tributaries associated with Scott Air Force Base, Illinois, 2022–24 |
| Series title | Scientific Investigations Report |
| Series number | 2024-5117 |
| DOI | 10.3133/sir20245117 |
| Publication Date | December 20, 2024 |
| Year Published | 2024 |
| Language | English |
| Publisher | U.S. Geological Survey |
| Publisher location | Reston, VA |
| Contributing office(s) | Central Midwest Water Science Center |
| Description | Report: x, 87 p.; Data Release; 2 Datasets |
| Country | United States |
| State | Illinois |
| Other Geospatial | Scott Air Force Base, Silver Creek |
| Online Only (Y/N) | Y |
| Additional Online Files (Y/N) | N |


