

Predictions of Elk and Chronic Wasting Disease Dynamics in the National Elk Refuge in Jackson, Wyoming, and Surrounding Areas
Links
- Document: Report (4.18 MB pdf) , HTML , XML
- Larger Work: This publication is Chapter B of Decision analysis in support of the National Elk Refuge bison and elk management plan
- Software Release: USGS software release - CWD software code for simulating elk and chronic wasting disease dynamics on the National Elk Refuge (version 0.1.0)
- Superseding Publications:
- Download citation as: RIS | Dublin Core
Acknowledgments
We thank the Wyoming Game and Fish Department, U.S. Fish and Wildlife Service, U.S. Department of Agriculture, and National Park Service for sharing data in support of the analyses and providing their expertise on the wildlife subject matter team. We thank G. Cotterill, E. Merrill, and K. Manlove for reviewing previous versions of the document and computer code. Evelyn Hampton and Bree McCloskey assisted with the editorial review. Trisha Zalesak assisted with the report’s figures. Elk population data from the Wyoming Game and Fish Department come from sources as cited. At the time of writing, not all Wyoming Game and Fish Department reports were available online; for elk population data from non-public documents, contact the Wyoming Game and Fish Department.
Abstract
The U.S. Fish and Wildlife Service National Elk Refuge (NER) in Jackson, Wyoming, supplementally feeds Cervus elaphus canadensis (Erxleben, 1777; elk) and Bison bison (Linnaeus, 1758; American bison) during winter months, but the costs and benefits of this management strategy are being reevaluated considering the potential effects of chronic wasting disease (CWD) on elk. U.S. Geological Survey scientists worked with the U.S. Fish and Wildlife Service on a structured decision-making process that considered five alternative feeding strategies and their effects on bison, elk, and humans. This chapter focuses on elk population dynamics and CWD using computer models. Our modeling results highlight a short- versus long-term tradeoff between the continue feeding and no feeding alternatives. Management alternatives associated with a cessation of supplemental feeding were assumed to make elk more susceptible to severe winters, resulting in initially lower population sizes and less CWD transmission. The increased CWD prevalence and transmission associated with the continue feeding alternative resulted in lower elk population sizes by year 20 (mean=6,700, standard deviation=1,600 in the analysis area) in 70 percent of simulations compared to no feeding (mean=8,400, standard deviation=1,500). No feeding alternatives resulted in higher elk populations than the continue feeding alternative between years 7 and 13 when CWD prevalence exceeded 20 percent in the Jackson elk herd. The increased harvest alternative minimized CWD and natural mortality in 83 out of 100 simulations compared to the continue feeding alternative.
Introduction
The National Elk Refuge (NER) in Jackson, Wyoming (fig. B1), is managed by the U.S. Fish and Wildlife Service. The NER has been supplementally feeding Cervus elaphus canadensis (Erxleben, 1777; elk) during the winter for over a century (16 U.S.C. §673, Wyoming Elk Reserve). Supplemental feeding was intended to mitigate elk mortality during severe winters and reduce private-property damage in and around Jackson, Wyoming, but aggregates thousands of elk in the NER, which may increase the transmission of pathogens such as chronic wasting disease (CWD). Chronic wasting disease was detected in elk at Grand Teton National Park for the first time in 2020 and has the potential to alter the costs and benefits of the NER supplemental feeding program.
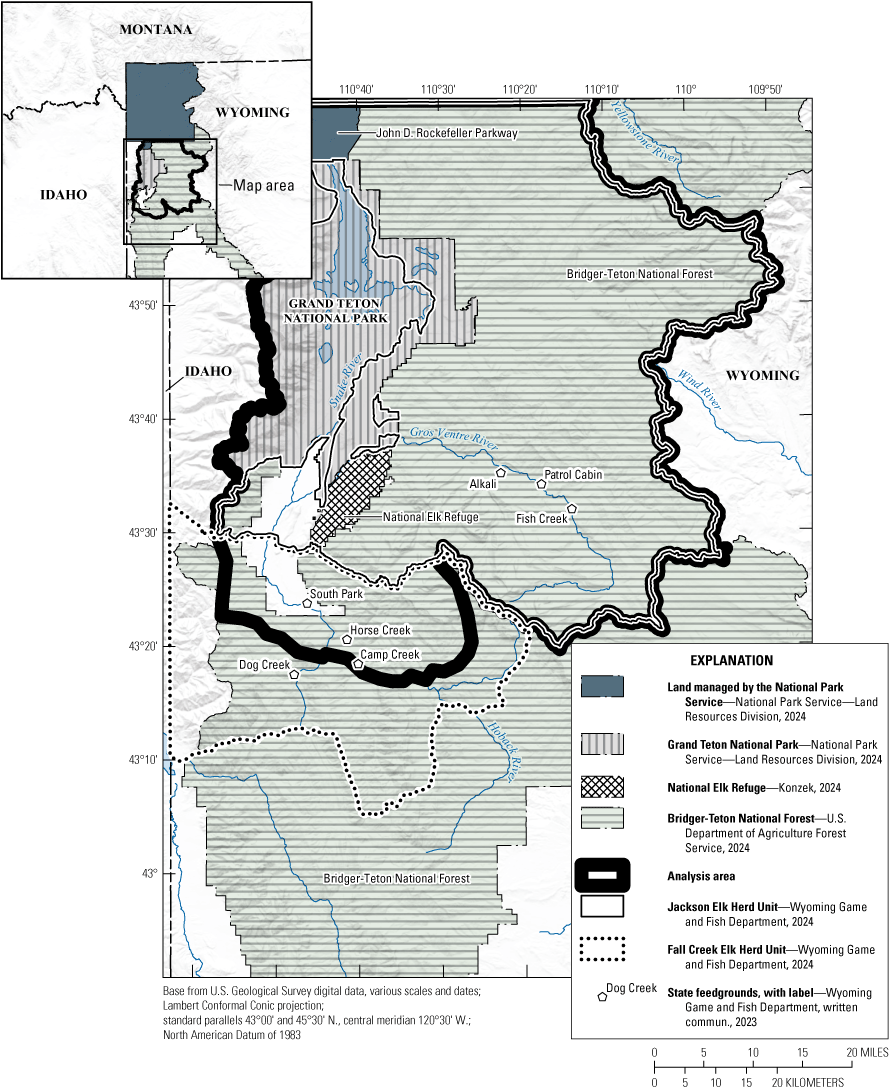
Map showing the location of the National Elk Refuge, Grand Teton National Park, Jackson Elk Herd Unit, Fall Creek Elk Herd Unit, and feedgrounds within the study analysis area.
Chronic wasting disease is spread through direct contact with an infectious individual and by way of environmental contamination with prions, which can persist for years in the environment (Miller and others, 2004). Chronic wasting disease prevalence has been observed as much as 29 percent in free-ranging elk of Wind Cave National Park (Sargeant and others, 2021). Galloway and others (2021) predicted that a CWD prevalence of more than 7 percent would lead to elk population declines in the Jackson elk herd even without a harvest. The predicted sensitivity of the Jackson elk herd to CWD is due, in part, to the low recruitment rates of elk calves that are observed in the region (Foley and others, 2015).
Previous studies of free-ranging Odocoileus virginianus (Zimmerman, 1780; white-tailed deer) suggest that CWD transmission is not strongly correlated with regional measures of host density (Storm and others, 2013) likely because broad-scale changes in population size may not correlate with changes in local measures of density or group size (Cross and others, 2009). The discovery of CWD on captive Cervidae (Goldfuss, 1820; cervid) farms typically results in immediate quarantine of the premises and herd depopulation (Haley and others, 2021). The few available studies of affected cervid farms show higher CWD prevalence in captive populations compared to free-ranging populations but typically lack data on how long the disease was present prior to sampling. Keane and others (2008) found a CWD prevalence of 79 percent in a captive white-tailed deer population. Peters and others (2000) found that 67 percent of the 17 elk (average age 2.6 years) tested in a captive facility were infected. Haley and others (2021) found a CWD prevalence of over 37 percent in a captive elk herd (approximately 450 elk in a 14 square kilometer [km2] facility [32 elk per km2]) and over 60 percent in some genotypes. Williams and others (2014) noted that 37 out of 39 elk died from CWD in their study of captive elk at the Tom Thorne/Beth Williams Wildlife Habitat Management Area in Wheatland, Wyoming. The median lifetime of the captive elk in the Williams and others (2014) study was 4.1 years for methionine-methionine at codon 132 in the prion protein gene and 7.1 years for methionine-leucine or leucine-leucine genotypes. These observations from captive populations suggest that local host densities may enhance CWD transmission in a high-density feedground. Previous studies of elk suggest that contact rates among elk on feedgrounds can be many times higher than among individuals overwintering on native winter ranges (Creech and others, 2012; Cross and others, 2013; Janousek and others, 2021). These higher rates are likely because of short-term densities on feedgrounds, such as the NER, reaching as high as 1,089 elk per km2 (Graves and others, 2022). The repeated visitation of the same areas and the potential for the long-term persistence of CWD prions in the environment may also increase transmission. Therefore, CWD could reach higher prevalence and have a larger effect on the Jackson elk herd than has been observed in other free-ranging elk herds if the herd continues to be supplementally fed.
Chapter A of this volume provides context on the NER, CWD, and the structured decision-making process used to develop the management alternatives, objectives, and metrics for the supplemental winter feeding of Bison bison (Linnaeus, 1758; American bison) and elk (this volume, Cook and others, 2025). The structured decision-making process identified five management alternatives: (1) continue feeding, (2) no feeding, (3) increase elk harvest for five years and then stop winter feeding (increase elk harvest), (4) reduce the amount of feed for five years and then stop winter feeding (reduce feeding), and (5) phase out feeding after 3 percent CWD prevalence. In this chapter, we develop a computer-simulation model to assess the potential effects of these alternatives on future CWD dynamics and the Jackson elk herd over the next 20 years. We first describe the overall model structure (in the “General Model Structure” subsection of the “Methods” section) and how the model structure represents the five management alternatives (refer to the “Modeling Management Alternatives” subsection of the “Methods” section). The model’s temporal predictions of elk numbers and CWD prevalence were used to inform the elk space-use metrics in chapter C (this volume, Cotterill and others, 2025) and some of the socioeconomic metrics in chapter E (this volume, McEachran and others, 2025). The CWD model was developed in consultation with the NER Environmental Impact Statement wildlife subject matter expert team.
Methods
The CWD model was developed to simulate elk and CWD dynamics over time based on several previously published papers (Cross and Almberg, 2019; Brandell and others, 2022; Rogers and others, 2022; and Cook and others, 2023). The model included an environmental transmission component, as in Cook and others (2023), and multiple interacting populations within an elk herd unit. The model is written in R (version 4.4.0; R Core Team, 2024) and is available online (Cross and Cook, 2024).
General Model Structure
The CWD model tracks elk according to their age, winter location, sex, and disease status—susceptible or infectious. The CWD model is stochastic with a discrete monthly timestep, and all simulations begin in May. The model assumes that all births occur in June and hunting occurs only in November. The CWD model has the following order of operations: births and aging individuals, direct CWD transmission, indirect CWD transmission, natural mortality, severe winter mortality, hunting mortality, and disease-induced mortality. Disease transmission and deaths occur in every monthly iteration of the model, but hunting, births, and increasing the age of individuals occur once per year.
Within the model, the category of infectious elk is divided into 10 subcategories of disease progression. We assumed elk would die of CWD when individuals exit the 10th infectious subcategory but not beforehand. Infectious elk that are hunted or died from natural causes are not considered CWD deaths. By assuming individuals progress through multiple stages of infection before dying of disease, substructuring infected categories allows the time for disease-induced death to have an initial delay and then peak later (Wearing and others, 2005). Multiple infectious categories result in a gamma distribution for the time to disease-induced death. As in Cook and others (2023), the probability of progressing to later stages of infection was assumed to be 28 percent such that the time from infection to CWD-induced death was, on average, 2.8 years (standard deviation [SD]=5.29). Twelve age classes were grouped into 5 categories (i) that had similar vital rates: calves (0–1 year, i=1), male yearlings (1–2 years, i=2), female yearlings (1–2 years, i=3), male adults (>2 years, i=4), and female adults (>2 years, i=5). Elk transitioned between stages according to sex- and age-specific vital rates as defined in Cook and others (2023) unless otherwise noted (app. B1, table B1.1).
The CWD model was structured into k winter subpopulations within two different herd units—the Jackson Elk Herd Unit (JHU) and Fall Creek Elk Herd Unit (FCHU; this volume, chap. A, fig. A1 of Cook and others, 2025). State Highway 22 in Wyoming forms the boundary of these herd units and has historically been a strong barrier to elk movement. The wildlife subject matter expert team believed that if feeding were stopped or reduced in the NER, more elk would relocate from the JHU to the FCHU. We used an expert elicitation process to estimate those potential movement rates (app. B2). The JHU was divided into three groups: elk that winter in the NER (k=1); elk that are fed in the Gros Ventre River drainage (Patrol Cabin, Fish Creek, and the now-closed Alkali feedgrounds [k=2]); and elk that are unfed in the JHU (k=3). The FCHU was divided into four groups: fed and unfed elk that are inside and outside of the analysis area. Within the analysis area were elk fed at South Park, Horse Creek, or Camp Creek feedgrounds [k=4] and an unfed FCHU elk subpopulation (k=5). Outside the analysis area were elk fed at Dog Creek (k=6) and an unfed elk subpopulation (k=7). We assumed the proportion of unfed elk in the FCHU that were in the analysis area was the same as the proportion of the FCHU area that was within the analysis area (36 percent). We summed subpopulations k≤5 to provide results for the analysis area and k≤3 for just the JHU.
In developing our model, we assumed elk could be infected through direct contact with infectious individuals and indirectly through contact with a prion-contaminated environment. These transmission parameters were estimated by an expert panel and reported in Cook and others (2023). As in Cook and others (2023), there were two scenarios for the transmission of CWD among fed and unfed elk subpopulations, and both scenarios were included in the model with equal likelihood by combining an equal number of simulations from each scenario. The first scenario was that elk could transmit CWD between fed and unfed subpopulations within a herd unit during the summer months. In this scenario, fed elk had a higher direct CWD transmission rate during winter months than unfed elk, and the direct CWD transmission rate during the summer months was calculated as the average of fed and unfed elk weighted by the population sizes at the start of the simulation. The second scenario assumed that CWD transmission occurred only within a subpopulation and not among subpopulations. Thus, fed elk would have higher rates of transmission year-round compared to unfed elk. Indirect transmission was assumed to increase linearly during the 20 years of the simulation for fed and unfed elk, where the maximum indirect transmission rate was provided by expert elicitation (Cook and others, 2023). For further modeling details on disease transmission, refer to Cook and others (2023).
The model includes two density-dependent mechanisms to avoid exponential growth or decline of the elk populations. First, calf survival (ϕ1) depends on the previous year’s annual population size in each herd unit, and declines from a maximum of 0.6 to a minimum of 0.05 when the population size is at the herd unit carrying capacity (KHU, app. B1), given by the following equation:
whereϕ1
is the annual calf survival rate in the herd unit;
c
is the proportion reduction when population was at carrying capacity;
Nj−1
is the January population size for the previous year in the herd unit;
K
is a parameter related to the carrying capacity of fed and native winter range elk in each herd unit;
δ
controls the shape of density dependence;
ϕmax
is the maximum calf survival rate; and
ϕmin
is the minimum calf survival rate.
Parameters c and δ were drawn from uniform distributions ([0.5, 0.8] and [2, 4], respectively) each year. Carrying capacity, K, was set to 1.3 times the population objective of the herd unit so that the population equilibrated at the population objective in the absence of CWD. These parameters resulted in a ratio of calves per adult female at the end of the winter (calf:cow) that ranged from a maximum of 0.6 when populations were less than 5,000 to between 0.3 and 0.5 when the population was at the population objective. The emergent calf:cow ratio in the model was in rough agreement with the maximum calf:cow ratio observed in other Wyoming elk herds. The Northern Bighorn Herd Unit in Wyoming is an example of an increasing elk herd and had a calf:cow ratio of 0.58 in 2015. The elk population of the Clark’s Fork Herd Unit has been stable to slightly decreasing from 2010 to 2020 and had a minimum observed calf:cow ratio of 0.11 (Wyoming Game and Fish Department, written commun., 2010–19; Wyoming Game and Fish Department, 2020). For a visual representation of calf survival expressed as a function of herd unit population size, refer to figure B1.1 in appendix B1.
While tuning the CWD model to the JHU information, the harvest rates were set to match the percentage of different age and sex categories hunted in the JHU from 2016 through 2021, which were approximately 7 percent for female elk and 28 percent for adult male elk (Wyoming Game and Fish Department, written commun., 2016–19; Wyoming Game and Fish Department, 2020, 2021b48), and the parameters controlling calf survival (eq. B1) were modified to result in the low calf:cow ratio observed in the Jackson herd (mean=22:100; Wyoming Game and Fish Department, written commun., 2000–19; Wyoming Game and Fish Department, 2021a). This parameter combination, along with the other vital rates set to the values in table B1.1 (app. B1), resulted in a declining population size, which suggests that there may be biases in observed data or some of the vital rates in table B1.1 (app. B1) were not representative of elk in the JHU. The parameter sets used in the CWD model prioritized matching the model results to the elk harvest rates instead of the calf:cow ratios because the elk harvest rates are used by McEachran and others (2025, this volume, chap. E) for some of the economic assessments of the feeding decision. Therefore, the yearling male and adult female harvest rates (app. B1) were matched to observed values, but the density-dependent calf survival rate was allowed to result in a calf:cow ratio that is higher than the ratio that is commonly observed. Yearling females were assumed to be harvested at the same rate as adult female elk. The bull harvest rate was reduced from the observed 28 percent to 8 percent because bulls are commonly in smaller groups that tend to be undercounted.
We assumed that the percentage of female elk harvested annually would decline linearly from a maximum when the elk population was equal to or more than the population objective to zero when the population was at 80 percent of the population objective. The changes to the female harvest rate occurred annually but were based on the previous 3-year average population size in February. This approximates the Wyoming Game and Fish Department harvest setting process (Wyoming Game and Fish Department, oral commun., 2023). Bull harvest rates were assumed to be constant for the duration of each simulation.
One hundred simulations for each management alternative started with elk population sizes drawn from a normal distribution with a coefficient of variation of 0.05, which matches the 2016–21 variation in the JHU. Simulations began with a stable age and sex structure, which we calculated from a Leslie matrix with annual rates using the popbio package (Stubben and Milligan, 2007) in R version 4.4.0 (R Core Team, 2024). We then simulated 5 years of burn-in to reach a stable age and sex structure using the monthly survival rates and seasonal pulses of reproduction and hunting before introducing CWD and recording the results for the subsequent 20 years. The average starting population sizes of fed elk equaled the 2016, 2018, 2019, 2020, and 2021 observed averages. The 2017–18 winter was excluded from these averages because it was a nonfeeding year for the NER and not representative of typical feeding year counts. The starting population size of the unfed elk subpopulations (k ∈ {3, 5, 7}) was multiplied by 1.48 to account for the likely undercounting of native winter-range elk (Lubow and Smith, 2004).
All simulations began with a starting CWD prevalence of 1 percent. Setting the prevalence of the modeling analyses modestly higher than current levels was a deliberate choice intended to account for the delay between the completion of analyses, finalization of the Environmental Impact Statement, and any future implementation of management alternatives. Preliminary analyses suggested that model results were not sensitive to starting prevalence because of our assumptions about how indirect transmission of CWD from the environment was modeled as a constantly increasing risk of infection starting at year 1 (Cook and others, 2023).
The effects of severe winters were included in the model to account for the potential demographic effects of not feeding on elk survival. Hobbs and others (2003) estimated elk mortality during different winter conditions based on forage availability in the JHU and across a variety of population sizes. We extrapolated those results across a broader distribution of population sizes (app. B1, fig. B1.2). To use these relationships in the FCHU, the population sizes in each herd unit were converted to the winter range elk density based on the total area of available native winter range (calculated in Cook and others, 2023). In the model, severe winters were included as a random draw with probability ω, which resulted in additional mortality beyond all other causes of death in unfed elk subpopulations (k ∈ {3, 5, 7}).
The probability ω of severe winters in the model determined the demographic penalty associated with not feeding in the absence of CWD. Severe winters also affect the spatial distribution of elk (this volume, chap. C, Cotterill and others, 2025). Winter calf mortality in the NER exceeded 5 percent in 4 of the last 15 years (27 percent) when direct measures of snow in the NER were available (fig. B2). In addition, a visual inspection suggested that 5 of 19 years were severe in terms of constraining the movements of elk in the NER (this volume, chap. C, Cotterill and others, 2025). For the model, we assumed that severe winters occurred with an annual probability of 25 percent.
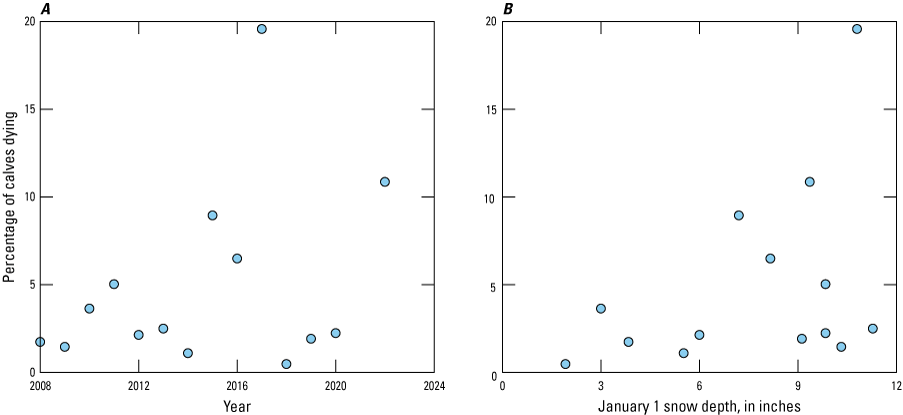
Scatterplots of the percentage of elk calves dying on the National Elk Refuge, Jackson, Wyoming. A, during the winter from 2008 to 2022 or, B, as a function of snow depth on January 1.
Modeling Management Alternatives
The NER managers defined the following five management alternatives for the elk and bison feeding program (this volume, chap. A, Cook and others, 2025): continue feeding; no feeding; increase elk harvest, then stop feeding (increase harvest alternative); reduce feeding, then stop feeding (reduce feeding alternative); and phase out feeding after a 3 percent CWD prevalence (disease threshold alternative). This section describes how the CWD model incorporated these management alternatives; for a more thorough description of the alternatives, refer to chapter A of this volume (Cook and others, 2025).
Continue Feeding Alternative
In this management alternative, supplemental feeding continues without any changes for 20 years. It was assumed that elk remained in the fed or unfed subpopulations they originated from and did not move across herd unit boundaries. Unfed elk populations were subjected to the demographic effects of severe winters with a probability of 0.25 per year, but supplementally fed subpopulations were unaffected by severe winters.
No Feeding Alternative
In the no feeding alternative, the wildlife subject matter expert team expected that elk would redistribute to other areas if the NER stopped feeding elk. To quantify this expectation, we invited a panel of eight experts with specific and localized knowledge about elk behavior and movement dynamics in this ecosystem. We developed a series of questions (app. B2) to inform necessary parameters of the model and used the panel’s expert judgment to estimate the percentage of elk that may move from the NER to Gros Ventre feedgrounds (k=2); other areas of the JHU (k=3); and South Park, Horse, or Camp Creek feedgrounds in the FCHU (k=4). We also asked the panel for their estimates of the proportion of elk that would continue to come to the NER even when supplemental feed was not provisioned (app. B2).
A modified Delphi method (Hanea and others, 2017) and four-point Speirs-Bridge elicitation protocol were used to develop estimates (Speirs-Bridge and others, 2010). The four-point estimates were an expert’s low, high, and best estimates of a parameter and their confidence that the actual value would fall within the low and high values (figs. B2.1 and B2.2). Each expert’s quantiles (based on the expert’s four-point estimates) were used to fit a probability distribution by finding the parameters for a beta distribution, which minimized the sum of square differences between the elicited and fitted quantiles. Individual expert distributions were then aggregated by fitting a single Dirichlet distribution, which ensured that the sum of each estimated beta distribution included the upper limit of 1 for the proportional data we elicited (Conroy and Peterson, 2013).
In the no feeding alternative, NER elk were assumed to move to other subpopulations (k ∈ {2, 3, 4}) according to the expert panel estimates prior to the start of the simulation. Those elk that we assumed would return to the NER, even though there was no feeding, were treated as unfed elk with lower CWD transmission rates but were exposed to the effects of severe winters.
Increase Harvest Alternative
In the increase harvest alternative, the NER managers’ objective was to lower the number of elk using the NER (k=1) to 5,000 within 5 years through increased harvest. The NER would then discontinue the feeding program after those 5 years. To accomplish this in the model, the harvest rate of all age and sex classes was increased by 2.5 times for the NER group compared to the rates in table B1.1 (app. B1). It was assumed that after year 5, the NER would no longer feed elk and elk would redistribute to other subpopulations (k ∈ {2, 3, 4}) according to the expert panel estimates (app. B2). Unfed elk at the NER were subjected to the effects of severe winters if they did not move to an alternate feedground where they were fed. After year 5, harvest rates were assumed to return to previous levels, which depended on the herd unit population size relative to the population objective. After year 5, elk that returned to the NER were assumed to have CWD transmission rates of unfed elk.
Reduce Feeding Alternative
In the reduce feeding alternative, the amount of feed provided to elk in the NER was reduced during the first 5 years and discontinued after year 5. We assumed that the reduced feed would be sufficient to mitigate the effects of severe winters on adult elk but that calves would access less food and would, therefore, be exposed to the effects of severe winters. After year 5 of the simulation, the NER halted all feeding. Elk were then redistributed to the other subpopulations (k ∈ {2, 3, 4}) as defined by the expert elicitation process (app. B2). After year 5, the elk returning to the NER were assumed to have the CWD transmission rates of unfed elk (table B1.1 of app. B1).
Disease Threshold Alternative
Finally, we modeled an alternative in which feeding in the NER stopped after CWD prevalence reached a disease threshold of 3 percent in the Jackson herd elk. Chronic wasting disease prevalence was estimated based on 400 randomly sampled hunted elk across the JHU, which was approximately the number tested per year from 2020 to 2022 (Wyoming Game and Fish Department, 2020, 2021b, 2022b)4850. If CWD prevalence exceeded 0.03 in that sample, then feeding was halted in the subsequent winter and elk were redistributed to the other subpopulations (k ∈ {2, 3, 4}) as defined by the expert elicitation process (app. B2).
Results
The expert panel estimated that 50 percent (SD=8 percent) of the elk fed at the NER would continue to spend their winters in the NER even when no supplemental feed is provided (k=1; app. B2; fig. B3). Eighteen percent (SD=7 percent) of the elk fed at the NER were predicted to move to the Gros Ventre feedgrounds and be fed there (Fish Creek or Patrol Cabin, k=2), and 19 percent (SD=6 percent) would spend winter in other areas of the JHU (k=3; fig. B3). Fourteen percent of the elk from the NER were predicted to move to feedgrounds in the FCHU (k=4) with the South Park feedground being the most likely destination.
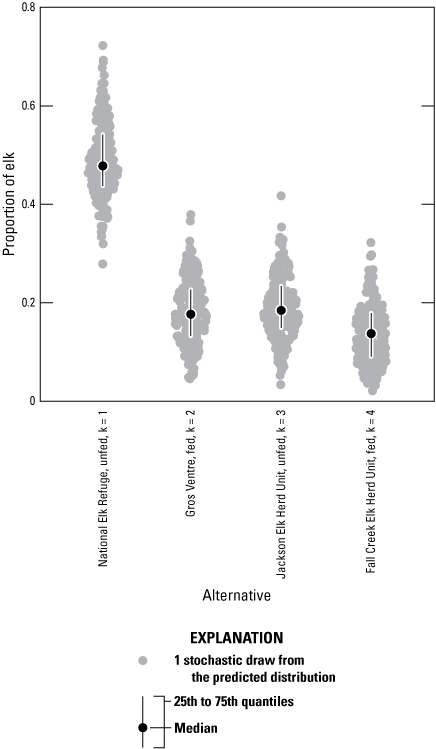
Simulated distributions of the expert elicitation results of how elk may redistribute themselves to other areas if supplemental feeding in the National Elk Refuge (NER) in Jackson, Wyoming, is discontinued. On average, 50 percent of the elk were expected to continue using the NER during the winter (subpopulation [k]=1). The remaining elk were expected to move to the Gros Ventre feedgrounds (k=2), native winter ranges within the Jackson Elk Herd Unit (k=3), or feedgrounds in the Fall Creek Elk Herd Unit (k=4). No elk were expected to move to the unfed elk population of the Fall Creek Elk Herd Unit (k=5).
Model Checks
To assess the demographic effects associated with severe winters when elk were not being fed, the model was run without disease by setting CWD transmission parameters to zero and evaluating three scenarios. In the first scenario (fig. B4A), we assumed continued feeding and that the fed populations would be unaffected by severe winter effects. This scenario established that the model parameters result in a stable population size in the absence of CWD. In the second scenario (fig. B4B), we assumed no feeding with severe winters and female elk hunting rates that declined linearly to zero as the population declined from the initial population size to 80 percent of the population objective of 11,000 elk. In the third scenario (fig. B4C), we assumed no feeding with severe winters and hunting rates for both sexes that remained at a constant proportion of animals. For demonstration purposes, these scenarios were run for just those elk that visit the NER in winter (k=1) and did not include displacement to other regions.
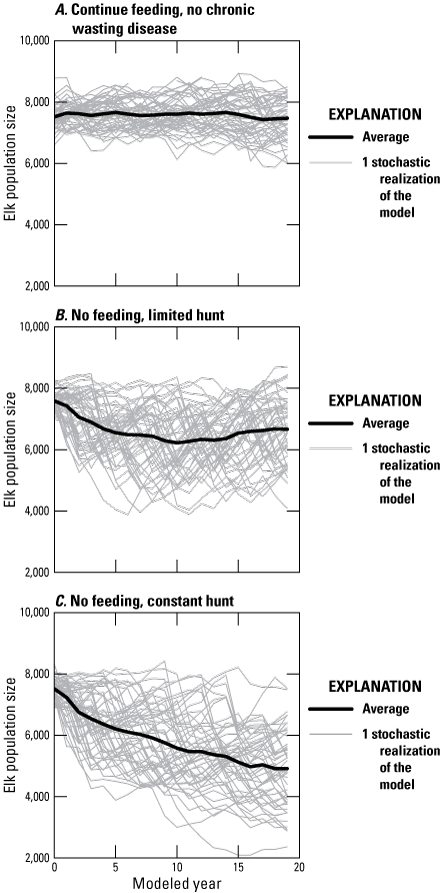
Line graphs showing scenarios describing the demographic effect of severe winters on elk population size over 20 years in the absence of chronic wasting disease (CWD): A, severe winters are not included; B, severe winters occur with a probability of 0.25, but hunting rates of female elk decline with population size; and, C, hunting rates are held constant and severe winters occur with a probability of 0.25. In this example, only a single population starting at 7,500 elk was modeled.
Simulations with severe winters showed some years when elk populations declined sharply, followed by an increase in calf survival (figs. B4B, C) and reduced hunting (fig. B4B), which led to some population recovery after severe winters. The effect of no feeding reduced the NER elk population by about 14 percent in the absence of CWD when harvest pressure was also reduced in response to the population decline. The elk population in the NER declined by, on average, 38 percent when there was no feeding and harvest rates across both sexes were constant. When a similar analysis was made across all regions and allowed for displacement to other regions according to figure B3, we found that the elk population within the analysis area (k≤5) declined by an average of 21 percent. The effects of severe winters were applied to all elk that were not fed during the winter in the JHU and FCHU.
Model Predictions with Chronic Wasting Disease
Figure B5 shows the results of the increase harvest alternative in which elk are hunted aggressively in the first 5 years to reach an objective of 5,000 elk in the NER in winter. Increasing the harvest rate 2.5 times resulted in an average population size of 5,170 (SD=500) by year 5. The average predicted female elk harvest was 840 in the first year, declining to 570 by year 5. The number of female elk hunted in the entire JHU averaged 450 from 2016–21 and 850 from 2000–2004 (Wyoming Game and Fish Department, written commun., 2000–2004; Wyoming Game and Fish Department, 2020, 2021b48). Feeding was halted after year 5, and the NER elk were redistributed to other areas of the JHU (fig. B5) or to feedgrounds in the FCHU (not shown). A fraction of elk was assumed to continue their use of the NER after feeding stopped in year 5, but CWD prevalence and transmission remain lower there than on the Gros Ventre feedgrounds, where elk continue to be fed (fig. B5).
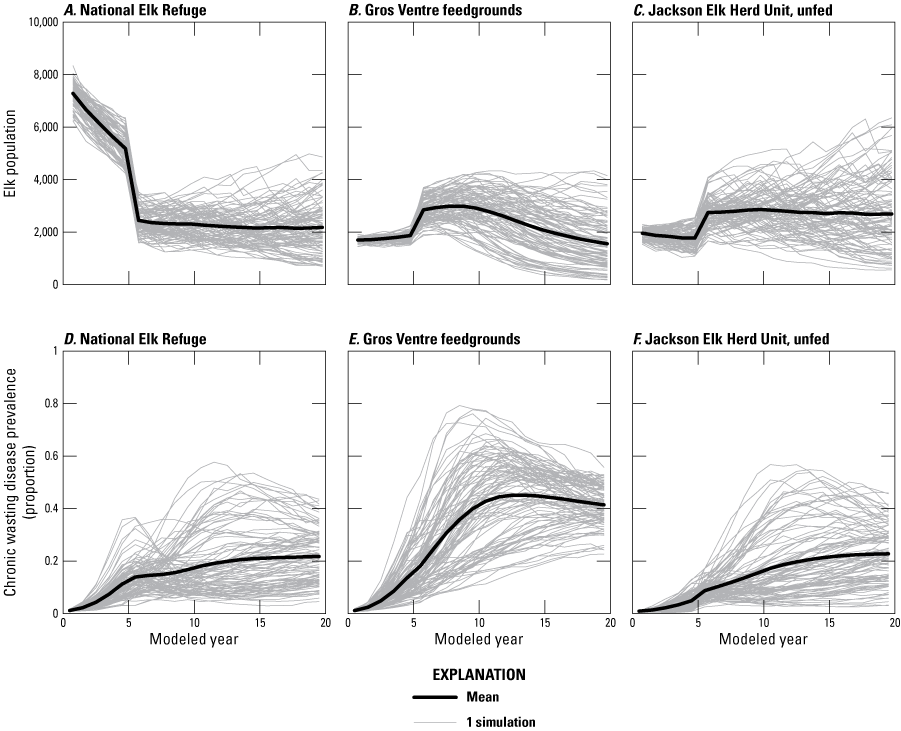
Line graphs showing predicted elk population sizes for, A, the National Elk Refuge (NER), B, Gros Ventre feedgrounds, and, C, Jackson Elk Herd Unit (JHU); and chronic wasting disease prevalence for , D, the NER, E, the Gros Ventre feedgrounds, and, F, the JHU during the 20 modeled years for the three subpopulations within the JHU (subpopulation [k] = {1, 2, 3}) with the increase harvest alternative. At year 5, elk move to other areas of the JHU (k = {2, 3}) and Fall Creek Elk Herd Unit (k=4), and the disease transmission in the NER is assumed to be reduced thereafter to levels commensurate with unfed elk populations.
Overall, predicted elk population sizes for the JHU and the analysis area declined across all five management alternatives (table B1; fig. B6). In the JHU, the continue feeding alternative resulted in an average decline of 53 percent in population size to 5,200 and a median CWD prevalence of 0.35 (SD=6 percent; fig. B6).
Table B1.
Summary of elk and chronic wasting disease performance metrics for the Jackson Elk Herd Unit and the analysis area in western Wyoming.[CWD, chronic wasting disease; SD, standard deviation; %, percent; SQ, status quo; —, not applicable]
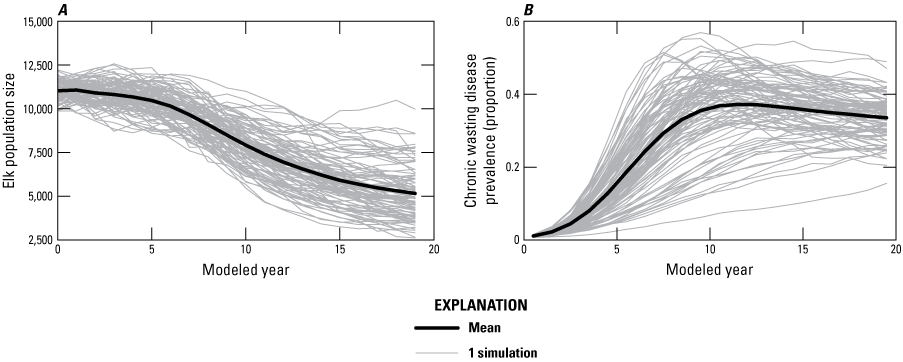
Line graphs of, A, predicted elk population size and, B, chronic wasting disease prevalence through 20 years for the three populations of the Jackson Elk Herd Unit (subpopulation [k] = {1, 2, and 3}) assuming continued feeding.
By year 20, the no feeding and disease threshold alternatives resulted in larger populations in the JHU and the larger analysis area (fig. B7A, B). The no feeding alternative started at a lower population size in the JHU than other alternatives because we assumed that elk were already redistributed to the larger analysis area at the start of each simulation of this alternative (fig. B7A). Given the starting CWD prevalence of 1 percent and prior estimates of potential CWD transmission on feedgrounds (Cook and others, 2023), the simulated population in the disease threshold alternative reached 3 percent or greater within the first several years, at which time feeding was stopped. The no feeding and disease threshold alternatives resulted in similar elk and CWD dynamics after the phaseout of NER feeding (figs. B7A–C). The no feeding alternative resulted in an average population size at year 20 of 6,700 (SD=1,600, fig. B7A) and an average CWD prevalence of 24 percent (SD=8 percent, fig. B7C).
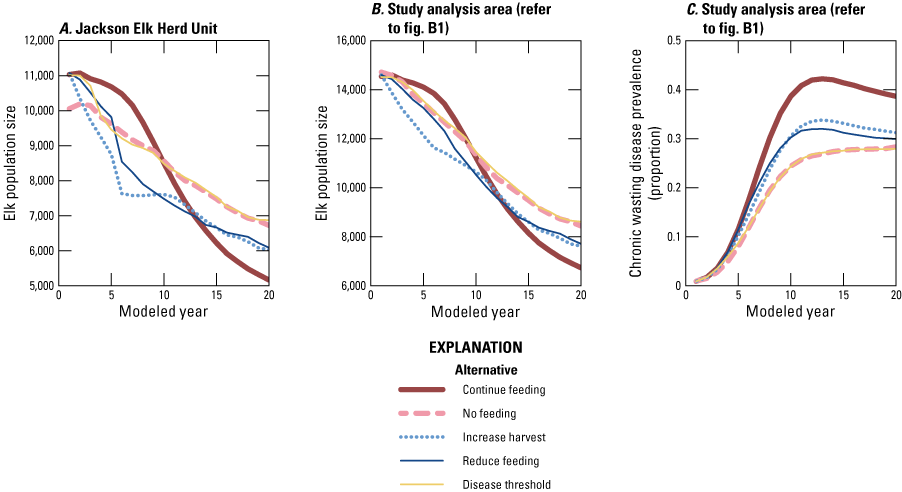
Line graphs of average elk population size in, A, the Jackson Elk Herd Unit and, B, analysis area; and, C, average chronic wasting disease prevalence in the study analysis area for 20 years for the five management alternatives and all simulations.
The continue feeding alternative usually resulted in lower population sizes and higher CWD prevalence than the other alternatives by year 20 (figs. B7 and B8). Although the model produced a variety of outcomes, the no feeding alternative resulted in lower CWD prevalence than the continue feeding alternative in 86 percent of the simulations (table B1; fig. B8B). In addition, the elk population size in the analysis area was larger in year 20 for the no feeding alternative in 70 percent of simulations compared to the continue feeding alternative (table B1; fig. B8A). The other alternatives can be grouped according to how quickly feeding is ceased, whereby the increase harvest and reduce feeding alternatives resulted in a phaseout of feeding at year 5 whereas the no feeding and 3 percent disease threshold alternatives had earlier phaseouts, which corresponded to differences in year 20 elk population sizes and CWD prevalence (figs. B7 and B8).
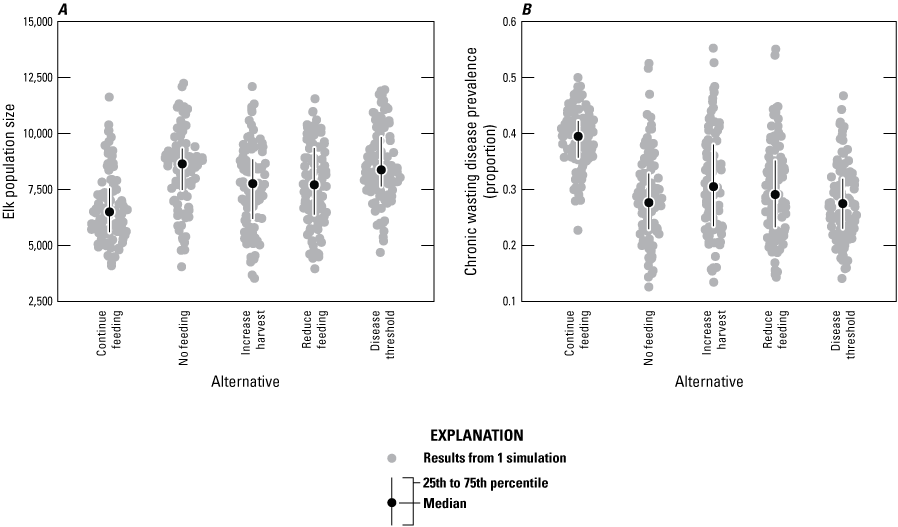
Graphs of the distribution of, A, elk population size across five management alternatives, and, B, chronic wasting disease prevalence at modeled year 20 for the analysis area (subpopulation [k]≤5).
The NER managers were also interested in minimizing winter elk mortality and CWD deaths during the first 5 years (this volume, chap. A, Cook and others, 2025). The number and types of elk deaths were tallied across all ages and sexes during the winter months of November through March to exclude baseline summer calf mortality and highlight those deaths that are more likely to be observed by the public. As expected, the increase harvest alternative resulted in higher hunting mortality and lower natural mortality than the other alternatives (fig. B9). The increase harvest and no feeding alternatives tended to have fewer CWD mortalities than the other management alternatives. For CWD and natural deaths, the increase harvest alternative resulted in fewer deaths than the continue feeding alternative in 83 percent of simulations across the analysis area, whereas the other alternatives were approximately equivalent to the continue feeding alternative (table B1).
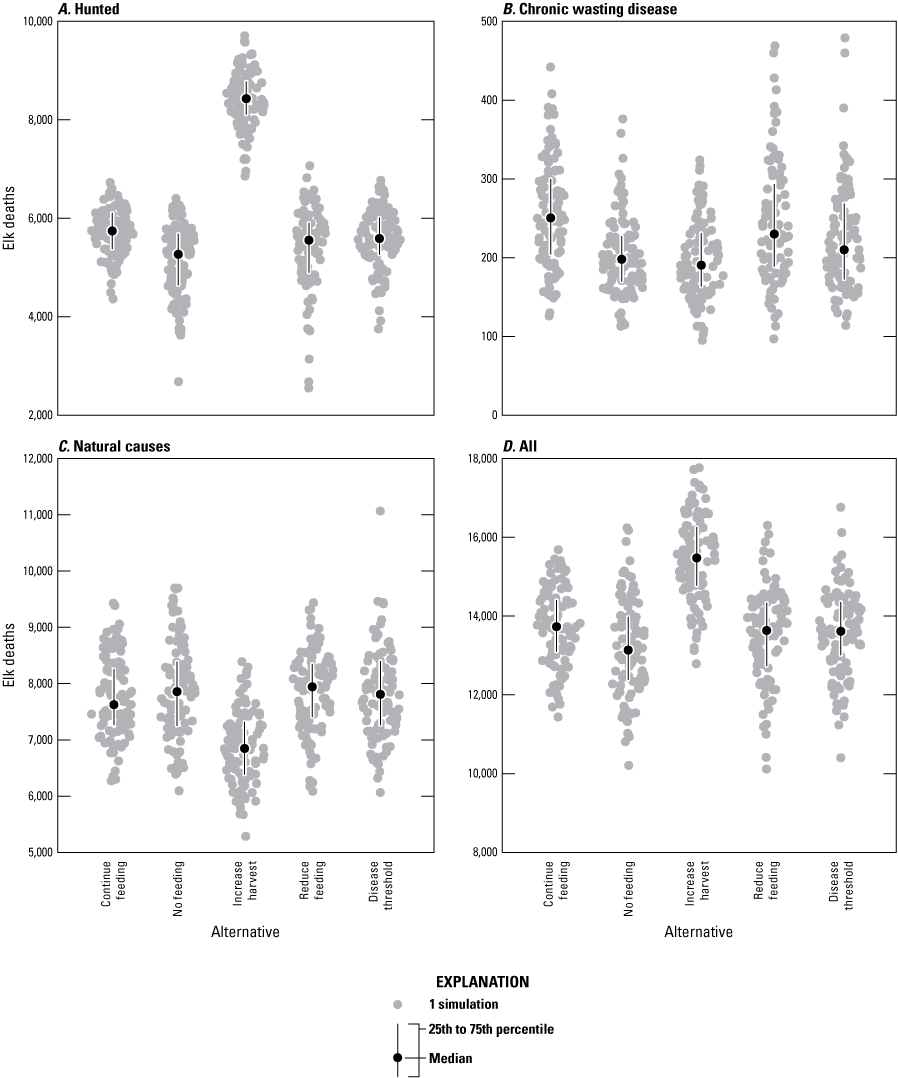
Graphs of the distribution of cumulative elk deaths for the first 5 modeled years by type: A, hunting, B, chronic wasting disease (CWD), C, natural causes, and, D, all deaths for the five management alternatives in the analysis area (subpopulation [k]≤5).
Figure B10 shows elk mortalities from November through March of every year due to different causes (CWD, fig. B10A; natural, fig. B10B; and hunting, fig. B10C) shifting over time. Model predictions suggested that the number of elk harvested would decline through time for all alternatives. By year 20, the elk harvest was predicted to be about a quarter of 2022 levels and similar in magnitude to the number of CWD deaths from November to April every year (figs. B9A, C). The higher CWD deaths in the continue feeding alternative coincide with lower harvests by year 20 on average compared to other management alternatives (figs. B10A, C).
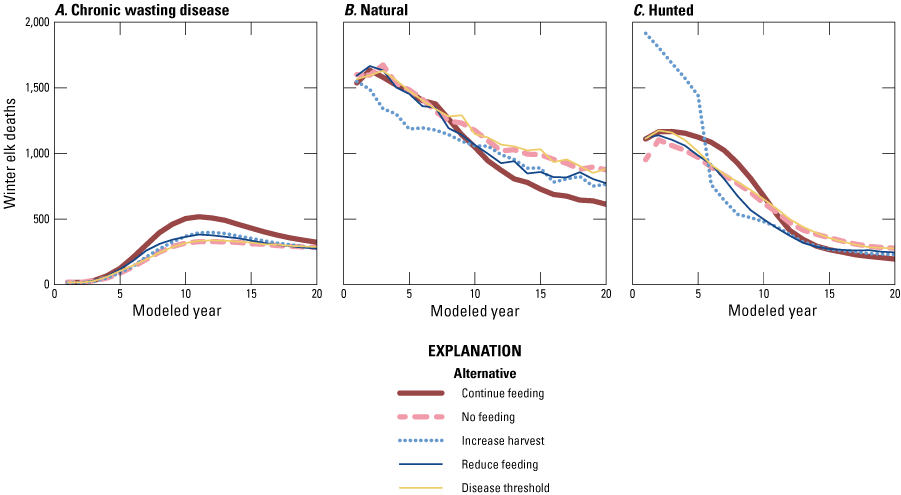
Line graphs showing the average number of elk deaths attributable to, A, late-stage chronic wasting disease, B, natural causes, or, C, hunting, from November through March during the modeled years for the five management alternatives.
Discussion
We incorporated empirical evidence and formal expert elicitation into our mathematical models of elk and CWD dynamics in Jackson, Wyoming. We then tailored the CWD model to the five supplemental feeding management alternatives identified by the National Elk Refuge managers. The predicted elk population size decreased through time by 42–54 percent for all management alternatives, and the number of elk harvested declined by approximately 75 percent (figs. B7 and B10). The management alternatives associated with cessation of supplemental feeding resulted in lower elk population sizes during the first 5–10 years but higher population sizes by year 20 compared to the continue feeding alternative (figs. B7A, B). The prevalence and effects of CWD were predicted to increase during the 20 years that were modeled, resulting in lower elk population sizes. The predicted elk population size in the analysis area (subpopulations k≤5) declined by 54 percent, on average, by year 20 in the continue feeding alternative and was lower than the no feeding alternative in 70 percent of the simulations (table B1). The crossover point, when the no feeding or phase-out alternatives resulted in higher populations than the continue feeding alternative, occurred between years 7 and 13 (fig. B7C). The predicted CWD prevalence in year 20 was higher in the continue feeding alternative, 35 percent on average in the JHU, compared to all other alternatives in 80–90 percent of the simulations (table B1). The other management alternatives resulted in an average CWD prevalence of 23 and 27 percent CWD by year 20 (table B1), which is high compared to some free-ranging elk populations (Monello and others, 2017). This high predicted CWD prevalence in the JHU is due, in part, to the assumption that 2,000–3,000 elk would continue to be fed at the Gros Ventre feedgrounds (fig. B5).
Several lines of evidence support the high predicted CWD prevalence and large population declines predicted by the CWD model. First, supplemental feeding results in elk contact rates that are 2–4 times higher than when they are not being fed in winter (Cross and others, 2013; Janousek and others, 2021), which is of similar magnitude to the estimates of increased CWD transmission due to feeding by a panel of experts (Cook and others, 2023). Second, previous work on a free-ranging elk population in Wind Cave National Park in South Dakota estimated an overall CWD prevalence of 18 percent, but as much as 30 percent in some areas (Sargeant and others, 2021). Third, captive cervid farm data suggest that CWD can reach more than 60 percent prevalence when elk are artificially aggregated (Peters and others, 2000; Haley and others, 2021; Williams and others, 2014). Williams and others (2014) noted that 37 out of 39 elk died from CWD in their study of captive elk. In that study, the median elk lifetimes were 4–7 years depending on the elk’s genotype, in the absence of predation, starvation, or hunting mortality, whereas MacNulty and others (2020) found that the average age of adult female elk killed by wolves in Yellowstone National Park was 13–16 from 1995–2016.
The CWD model included several important assumptions. First, the demographic penalty for not feeding elk depends on the frequency of severe winters, which reduces the survival of unfed elk in the model. These winter impacts were intended to capture the multiple ways that elk mortality may increase (for example, by vehicle accidents or additional hunts on private lands) if feeding ends so that these mechanisms did not have to be built into the model independently. Wyoming herd units with feedgrounds have higher densities of elk on winter range than the herd units without feedgrounds (Cook and others, 2023), but the evidence that feedgrounds increase elk productivity in Wyoming is mixed (Foley and others, 2015). The no feeding penalty during severe winters in our model resulted in a median decline in elk populations in the NER of 38 percent in the absence of CWD, movement to other feedgrounds, and constant hunting (fig. B4A, C). This penalty is higher than the 23 percent no-feeding penalty predicted in Cook and others (2023), which was based on the average difference in winter elk densities in fed and unfed herd units of western Wyoming. The increase from 23 percent to 38 percent may be appropriate given the much higher number of elk that use the NER and the proximity of human development compared to other Wyoming feedgrounds. Nevertheless, the effects of stopping NER supplemental feeding on elk survival rates is an important source of uncertainty in the model.
The second important assumption was that model simulations started with a CWD prevalence of 1 percent across all sex and age classes because this matched the conditions and model given to the panel of experts (Cook and others, 2023) to predict transmission rates for a fed elk population. However, only one elk has been documented as CWD positive out of the 1,209 elk tested from 2020 to 2022 in the JHU (0.1 percent, 95-percent confidence interval=[0.002 percent, 0.5 percent]; Wyoming Game and Fish Department, 2020, 2021a, 2022a4749). The 1 percent CWD prevalence that was previously used in Cook and others (2023) was deliberately maintained to account for the delay between the completion of analyses, finalization of the Environmental Impact Statement, and any future implementation of management alternatives. We explored the sensitivity of our model results to starting at 0.1 percent CWD prevalence instead of 1 percent. The results at 0.1 percent prevalence were not noticeably different than the results at 1 percent prevalence because of the assumption that environmental transmission linearly increases as a function of time and does not depend on the starting prevalence (Cross and Cook, 2024). If CWD transmission from the environment grows exponentially rather than linearly, then it would take a similar amount of time for CWD to increase from 0.1 percent to 1 percent as it does from 1 percent to 10 percent, which was about 4–10 years for fed elk in this model. Our model predictions are for the 20 years after reaching a prevalence of 1 percent, which may not occur for several more years.
Our third assumption was that both the female elk harvest rate and the elk calf survival rate would change depending on the elk population size in the herd unit. The CWD model resulted in higher elk recruitment rates (as indexed by the number of elk calves per adult female) than what has been observed in the JHU. From 2000 to 2021 the proportion of adult female elk with calves (calf:cow) averaged 0.22 (minimum=0.18 and maximum=0.29), whereas our model without the effects of CWD and a stable elk population had a calf:cow ratio of approximately 0.4 (minimum 0.25; maximum 0.5). This difference in elk recruitment may be due to observational biases in classification surveys or other discrepancies between modeled and actual elk vital rates in the JHU. Our modeled calf:cow ratio increased to 0.5 as the elk population declined due to CWD; this is similar to the calf:cow ratios in the Northern Bighorn Herd Unit of Wyoming when that population was growing rapidly from 2005 to 2015 (Wyoming Game and Fish Department, written commun., 2005–15). Due to the high calf:cow ratios, the CWD model predicted that the elk population could remain stable even when CWD prevalence reached 20 percent, whereas Galloway and others (2021) predicted that the NER elk would begin to decline when CWD prevalence reached 7 percent using a model with a constant low elk recruitment rate.
There are several other factors, in addition to supplemental feeding and CWD, likely to affect elk during the next 20 years in the JHU and that we did not include in our analyses. Climate change may increase the frequency and intensity of summer droughts, thus reducing the quality of summer forage (Rickbeil and others, 2019) and reducing snowpack in winter (Hostetler and others 2021), which may reduce the duration of supplemental feeding (Cross and others, 2007). In addition, our modeling approach did not account for the effect of predators on CWD (Miller and others, 2008; Wild and others, 2011; Brandell and others, 2022) or evolutionary changes to either elk (Monello and others, 2017) or CWD prions (Velásquez and others, 2020). Uncertainties remain on all these issues that were beyond what could be addressed in this report. Future work could assess the value of reducing these uncertainties (for example, Maxwell and others, 2015).
Summary
Modeling results for 20 years indicated a short- versus long-term tradeoff between the continue feeding and no feeding alternatives for elk in the National Elk Refuge and Jackson Elk Herd Unit. Continuing to supplementally feed elk at the National Elk Refuge was predicted to result in a chronic wasting disease (CWD) prevalence of 35 percent and a coincident decline in the elk population of 54 percent on average by year 20 of the model. The cessation of elk supplemental feeding was predicted to result in early declines in elk populations during the first 5–10 years but more stable elk populations thereafter coincident with a lower CWD prevalence than the continue feeding alternative. The no feeding alternative for the National Elk Refuge still resulted in a CWD prevalence of, on average, 24 percent due, in part, to supplemental feeding on other feedgrounds in the Jackson Elk Herd Unit. Given the predicted decline in the elk population, elk harvest was also predicted to decline by approximately 75 percent across all management alternatives. The model predicted that by year 20, CWD-induced deaths in winter would be approximately equal to the number of elk harvested.
References Cited
Brandell, E.E., Cross, P.C., Smith, D.W., Rogers, W., Galloway, N.L., MacNulty, D.R., Stahler, D.R., Treanor, J., and Hudson, P.J., 2022, Examination of the interaction between age-specific predation and chronic disease in the Greater Yellowstone Ecosystem: Journal of Animal Ecology, v. 91, p. 1373–1384, accessed July 8, 2024, at https://doi.org/10.1111/1365-2656.13661.
Conroy, M.J., and Peterson, J.T., 2013, Decision making in natural resource management—A structured, adaptive approach: Hoboken, N.J., John Wiley and Sons, Ltd., 456 p. [Also available at https://doi.org/10.1002/9781118506196.]
Cook, J.D., Cotterill, G.G., McEachran, M.C., Graves, T.A., Cole, E.K., and Cross, P.C., 2025, Decision framing overview and performance of management alternatives for bison and elk feedground management on the National Elk Refuge in Jackson, Wyoming, chap. A of Decision analysis in support of the National Elk Refuge bison and elk management plan: U.S. Geological Survey Scientific Investigations Report 2024–5119, 19 p., https://doi.org/10.3133/sir20245119A.
Cook, J.D., Cross, P.C., Tomaszewski, E.M., Cole, E.K., Grant, E.H.C., Wilder, J., and Runge, M.C., 2023, Evaluating management alternatives for Wyoming elk feedgrounds in consideration of chronic wasting disease (ver. 2.0, November 2023): U.S. Geological Survey Open-File Report 2023–1015, 50 p., accessed July 8, 2024, at https://pubs.usgs.gov/publication/ofr20231015.
Cotterill, G.G., Cross, P.C., Cole, E.K., Cook, J.D., McEachran, M.C., and Graves, T.A., 2025, Evaluating elk space-use and conflict under proposed management alternatives at the National Elk Refuge in Jackson, Wyoming, chap. C of Decision analysis in support of the National Elk Refuge bison and elk management plan: U.S. Geological Survey Scientific Investigations Report 2024–5119, 32 p., https://doi.org/10.3133/sir20245119C.
Cotterill, G.G., Cross, P.C., Middleton, A.D., Rogerson, J.D., Scurlock, B.M., and du Toit, J.T., 2018, Hidden cost of disease in a free-ranging ungulate—Brucellosis reduces mid-winter pregnancy in elk: Ecology and Evolution, v. 8, no. 22, p. 10733–10742, accessed July 8, 2024, at https://doi.org/10.1002/ece3.4521.
Creech, T.G., Cross, P.C., Scurlock, B.M., Maichak, E.J., Rogerson, J.D., Henningsen, J.C., and Creel, S., 2012, Effects of low-density feeding on elk-fetus contact rates on Wyoming feedgrounds: Journal of Wildlife Management, v. 76, no. 5, p. 877–886, accessed July 8, 2024, at https://doi.org/10.1002/jwmg.331.
Cross, P.C., and Almberg, E.S., 2019, CWDsims—An R package for simulating chronic wasting disease scenarios, accessed May 17, 2024, at https://doi.org/10.5066/P9QZTTLY.
Cross, P.C., and Cook, J.D., 2024, CWD software code for simulating elk and chronic wasting disease dynamics on the National Elk Refuge (version 0.1.0): U.S. Geological Survey webpage, accessed October 5, 2024, at https://doi.org/10.5066/P14EPY3U.
Cross, P.C., Creech, T.G., Ebinger, M.R., Manlove, K., Irvine, K., Henningsen, J., Rogerson, J., Scurlock, B.M., and Creel, S., 2013, Female elk contacts are neither frequency nor density dependent: Ecology, v. 94, no. 9, p. 2076–2086, accessed May 18, 2024, at https://doi.org/10.1890/12-2086.1.
Cross, P.C., Drewe, J., Patrek, V., Pearce, G., Samuel, M.D., and Delahay, R.J., 2009, Wildlife population structure and parasite transmission—Implications for disease management, in Delahay, R.J., Smith, G.C., and Hutchings, M.R., eds., Management of Disease in Wild Mammals: Tokyo, Springer, p. 9–29. [Also available at https://doi.org/10.1007/978-4-431-77134-0_2.]
Cross, P.C.,Edwards, W.H., Scurlock, B.M., Maichak, E.J., and Rogerson, J.D., 2007, Effects of management and climate on elk brucellosis in the Greater Yellowstone Ecosystem: Ecological Applications, vol. 17, no. 4, p. 957–964, accessed October 5, 2024, at https://doi.org/10.1890/06-1603.
Foley, A.M., Cross, P.C., Christianson, D.A., Scurlock, B.M., and Creel, S., 2015, Influences of supplemental feeding on winter elk calf:cow ratios in the southern Greater Yellowstone Ecosystem: Journal of Wildlife Management, v. 79, no. 6, p. 887–897. [Also available at https://doi.org/10.1002/jwmg.908.]
Galloway, N.L., Monello, R.J., Brimeyer, D., Cole, E.K., and Hobbs, N.T., 2021, Supporting adaptive management with ecological forecasting—Chronic wasting disease in the Jackson Elk Herd: Ecosphere, v. 12, no. 10, 14 p., accessed April 30, 2024, at https://doi.org/10.1002/ecs2.3776.
Graves, T.A., Yarnall, M.J., Johnston, A.N., Preston, T.M., Chong, G.W., Cole, E.K., Janousek, W.M., and Cross, P.C., 2022, Eyes on the herd—Quantifying ungulate density from satellite, unmanned aerial systems, and GPS collar data: Ecological Applications, v. 32, no. 5, 16 p., accessed May 18, 2024, at https://doi.org/10.1002/eap.2600.
Haley, N.J., Donner, R., Merrett, K., Miller, M., and Senior, K., 2021, Selective breeding for disease-resistant PRNP variants to manage chronic wasting disease in farmed whitetail deer: Genes (Basel), v. 12, no. 9, 16 p., accessed October 4, 2024, at https://doi.org/10.3390/genes12091396.
Haley, N.J., Henderson, D.M., Donner, R., Wyckoff, S., Merrett, K., Tennant, J., Hoover, E.A., Love, D., Kline, D., Lehmkuhl, A.D., and Thomsen, B.V., 2020, Management of chronic wasting disease in ranched elk—Conclusions from a longitudinal three-year study: Prion, v. 14, no. 1, p. 76–87, accessed October 4, 2024, at https://doi.org/10.3390/genes12091396.
Hanea, A.M., McBride, M.F., Burgman, M.A., Wintle, B.C., Fidler, F., Flander, L., Twardy, C.R., Manning, B., and Mascaro, S., 2017, I nvestigate D iscuss E stimate A ggregate for structured expert judgement: International Journal of Forecasting, v. 33, no. 1, p. 267–279. [Also available at https://doi.org/10.1016/j.ijforecast.2016.02.008.]
Hobbs, N.T., Wockner, G., and Singer, F.J., 2003, Assessing management alternatives for ungulates in the Greater Teton Ecosystem using simulation modeling: Fort Collins, Colo., Colorado State University, Natural Resource Ecology Lab, 63 p., accessed May 18, 2024, at https://www2.nrel.colostate.edu/projects/teton/TBISON10.pdf.
Hostetler, S., Whitlock, C., Shuman, B., Liefert, D., Drimal, C.W., and Bischke, S., 2021, Greater Yellowstone climate assessment—past, present, and future climate change in greater Yellowstone watersheds: Bozeman, Mont., Montana State University, Institute on Ecosystems, 260 p., accessed October 5, 2024, at https://scholarworks.montana.edu/items/f1d98481-7491-4242-b3a6-8899c173b8ef.
Janousek, W.M., Graves, T.A., Berman, E.E., Chong, G.E.W., Cole, E.K., Dewey, S.R., Johnston, A.N., and Cross, P.C., 2021, Human activities and weather drive contact rates of wintering elk: Journal of Applied Ecology, v. 58, no. 3, p. 667–676, accessed May 18, 2024, at https://doi.org/10.1111/1365-2664.13818.
Keane, D.P., Barr, D.J., Bochsler, P.N., Hall, S.M., Gidlewski, T., O’Rourke, K.I., Spraker, T.R., and Samuel, M.D., 2008, Chronic wasting disease in a Wisconsin white-tailed deer farm: Journal of Veterinary Diagnostic Investigation, v. 20, no. 5, p. 698–703, accessed October 4, 2024, at https://doi.org/10.1177/104063870802000534.
Konzek, D., 2024, FWS National realty tracts simplified: U.S. Fish and Wildlife Service, accessed January 4, 2024, at https://gis-fws.opendata.arcgis.com/datasets/fws::fws-national-realty-tracts-simplified/explore?showTable=true.
Lubow, B.C., and Smith, B.L., 2004, Population dynamics of the Jackson elk herd: Journal of Wildlife Management, v. 68, no. 4, p. 810–829, accessed May 18, 2024, at https://doi.org/10.2193/0022-541X(2004)068[0810:PDOTJE]2.0.CO;2.
MacNulty, D.R., Stahler, D.R., Wyman, T., Ruprecht, J., Smith, L.M., Kohl, M.T., and Smith, D., 2020, Population dynamics of northern Yellowstone elk after wolf reintroduction, chap. 14 of Smith, D.W., Stahler, D.R., and MacNulty, D.R., eds., Yellowstone wolves—Science and discovery in the world’s first national park: The University of Chicago Press, p. 184–199, accessed October 5, 2024, at https://qcnr.usu.edu/labs/macnulty-lab/files/macnulty-et-al-2020_ch14.pdf.
Maxwell, S.L., Rhodes, J.R., Runge, M.C., Possingham, H.P., Ng, C.F., and McDonald-Madden, E., 2015, How much is new information worth? Evaluating the financial benefit of resolving management uncertainty: Journal of Applied Ecology, v. 52, no. 1, p. 12–20, accessed May 18, 2024, at https://doi.org/10.1111/1365-2664.12373.
McEachran, M.C., Don Carlos, A., Cotterill, G.G., Cole, E.K., and Cook, J.D., 2025, Estimating the social and economic consequences of proposed management alternatives at the National Elk Refuge in Jackson, Wyoming, chap. E of Decision analysis in support of the National Elk Refuge bison and elk management plan: U.S. Geological Survey Scientific Investigations Report 2024–5119, 11 p., https://doi.org/10.3133/sir20245119E.
Miller, M.W., Swanson, H.M., Wolfe, L.L., Quartarone, F.G., Huwer, S.L., Southwick, C.H., and Lukacs, P.M., 2008, Lions and prions and deer demise: PLoS ONE, v. 3, no. 12, 7 p., accessed May 18, 2024, at https://doi.org/10.1371/journal.pone.0004019.
Miller, M.W., Williams, E.S., Hobbs, N.T., and Wolfe, L.L., 2004, Environmental sources of prion transmission in mule deer: Emerging Infectious Diseases, v. 10, no. 6, p. 1003–1006, accessed May 18, 2024, at https://doi.org/10.3201/eid1006.040010.
Monello, R.J., Galloway, N.L., Powers, J.G., Madsen-Bouterse, S.A., Edwards, W.H., Wood, M.E., O’Rourke, K.I., and Wild, M.A., 2017, Pathogen-mediated selection in free-ranging elk populations infected by chronic wasting disease: Proceedings of the National Academy of Sciences of the United States of America, vol. 114, p. 12208–12212, accessed October 5, 2024, at https://doi.org/10.1073/pnas.1707807114.
National Park Service Land Resources Division, 2024, Administrative boundaries of National Park System units—National geospatial data asset (NGDA) NPS National parks dataset: National Park Service, accessed January 4, 2024, at https://irma.nps.gov/DataStore/Reference/Profile/2224545?lnv=True.
Peters, J., Miller, J.M., Jenny, A.L., Peterson, T.L., and Carmichael, K.P., 2000, Immunohistochemical diagnosis of chronic wasting disease in preclinically affected elk from a captive herd: Journal of Veterinary Diagnostic Investigation, vol. 12, no. 6, p. 579–582, accessed October 5, 2024, at https://pubmed.ncbi.nlm.nih.gov/11108464/.
Raithel, J.D., Kauffman, M.J., and Pletscher, D.H., 2007, Impact of spatial and temporal variation in calf survival on the growth of elk populations: Journal of Wildlife Management, v. 71, no. 3, p. 795–803, accessed May 18, 2024, at https://doi.org/10.2193/2005-608.
R Core Team, 2024, R—A language and environment for statistical computing: Vienna, Austria, R Foundation for Statistical Computing (version 4.3.3), accessed May 17, 2024, at https://www.r-project.org/.
Rickbeil, G.J.M., Merkle, J.A., Anderson, G., Atwood, M.P., Beckmann, J.P., Cole, E.K., Courtemanch, A.B., Dewey, S., Gustine, D.D., Kauffman, M.J., McWhirter, D.E., Mong, T., Proffitt, K., White, P.J., and Middleton, A.D., 2019, Plasticity in elk migration timing is a response to changing environmental conditions: Global Change Biology, v. 25, no. 7, p. 2368–2381, accessed May 17, 2024, at https://doi.org/10.1111/gcb.14629.
Rogers, W., Brandell, E.E., and Cross, P.C., 2022, Epidemiological differences between sexes affect management efficacy in simulated chronic wasting disease systems: Journal of Applied Ecology, v. 59, no. 4, p. 1122–1133, accessed May 17, 2024, at https://doi.org/10.1111/1365-2664.14125.
Sargeant, G.A., Wild, M.A., Schroeder, G.M., Powers, J.G., and Galloway, N.L., 2021, Spatial network clustering reveals elk population structure and local variation in prevalence of chronic wasting disease: Ecosphere, v. 12, no. 12, 16 p., accessed October 4, 2024, at https://doi.org/10.1002/ecs2.3781.
Speirs-Bridge, A., Fidler, F., McBride, M., Flander, L., Cumming, G., and Burgman, M., 2010, Reducing overconfidence in the interval judgments of experts: Risk Analysis, v. 30, no. 3, p. 512–523, accessed May 17, 2024, at https://doi.org/10.1111/j.1539-6924.2009.01337.x.
Storm, D.J., Samuel, M.D., Rolley, R.E., Shelton, P., Keuler, N.S., Richards, B.J., and Van Deelen, T.R., 2013, Deer density and disease prevalence influence transmission of chronic wasting disease in white-tailed deer: Ecosphere, v. 4, no. 1, p. 1–14, accessed May 17, 2024, at https://doi.org/10.1890/ES12-00141.1.
Stubben, C.J., and Milligan, B.G., 2007, Estimating and analyzing demographic models using the popbio package in R: Journal of Statistical Software, v. 22, no. 11, p. 1–23, accessed May 17, 2024, at https://doi.org/10.18637/jss.v022.i11.
U.S. Department of Agriculture Forest Service, 2024, Surface ownership parcels: Forest Service web page, accessed February 7, 2024, at https://apps.fs.usda.gov/arcx/rest/services/EDW/EDW_BasicOwnership_01/MapServer.
Velásquez, C.D., Kim, C., Haldiman, T., Kim, C., Herbst, A., Aiken, J., Safar, J.G., and McKenzie, D., 2020, Chronic wasting disease (CWD) prion strains evolve via adaptive diversification of conformers in hosts expressing prion protein polymorphisms: The Journal of Biological Chemistry, vol. 295, no. 15, p. 4985–5001, accessed October 5, 2024, at https://doi.org/10.1074/jbc.ra120.012546.
Wearing, H.J., Rohani, P., and Keeling, M.J., 2005, Appropriate models for the management of infectious diseases: PLOS Medicine, vol. 2, no. 8, article e320, 8 p., accessed October 5, 2024, at https://doi.org/10.1371/journal.pmed.0020320.
Wild, M.A., Hobbs, N.T., Graham, M.S., and Miller, M.W., 2011, The role of predation in disease control—A comparison of selective and nonselective removal on prion disease dynamics in deer: Journal of Wildlife Diseases, v. 47, no. 1, p. 78–93, accessed October 4, 2024, at https://doi.org/10.7589/0090-3558-47.1.78.
Williams, A.L., Kreeger, T.J., and Schumaker, B.A., 2014, Chronic wasting disease model of genetic selection favoring prolonged survival in Rocky Mountain elk (Cervus elaphus): Ecosphere, vol. 5, no. 5, 10 p., accessed October 3, 2024, at https://doi.org/10.1890/ES14-00013.1.
Wyoming Game and Fish Department, 2020, Harvest reports & surveys, elk: Cheyenne, Wyo., Wyoming Game and Fish Department, accessed May 17, 2024, at https://wgfd.wyo.gov/hunting-trapping/harvest-reports-surveys.
Wyoming Game and Fish Department, 2021a, Annual big game herd unit job completion reports: Cheyenne, Wyo., Wyoming Game and Fish Department, accessed May 17, 2024, at https://wgfd.wyo.gov/hunting-trapping/job-completion-reports.
Wyoming Game and Fish Department, 2021b, Harvest reports & surveys, elk: Cheyenne, Wyo., Wyoming Game and Fish Department, accessed May 17, 2024, at https://wgfd.wyo.gov/hunting-trapping/harvest-reports-surveys.
Wyoming Game and Fish Department, 2022a, Annual big game herd unit job completion reports: Cheyenne, Wyo., Wyoming Game and Fish Department, accessed May 17, 2024, at https://wgfd.wyo.gov/hunting-trapping/job-completion-reports.
Wyoming Game and Fish Department, 2022b, Harvest reports & surveys, elk: Cheyenne, Wyo., Wyoming Game and Fish Department, accessed May 17, 2024, at https://wgfd.wyo.gov/hunting-trapping/harvest-reports-surveys.
Wyoming Game and Fish Department, 2024, Elk herd units: Wyoming Game and Fish Open Data, accessed February 7, 2024, at https://wyoming-wgfd.opendata.arcgis.com/datasets/88c1b49a064e45b78b1abb5437440a41_0/explore?location=0.020356%2C72.446016%2C0.00.
Appendix B1. Additional Model Details
Table B1.1.
Elk vital and harvest rate estimates used in the elk chronic wasting disease model.[Parameter notation relates to the model code in Cross and Cook (2024) and the model developed by Cook and others (2023). SD, standard deviation; ϕ, phi; γ, gamma; h, harvest]
Data were approximated from Galloway and others (2021).
Data were approximated from Raithel and others (2007).
Data were approximated from Cotterill and others (2018).
Data were approximated from the Jackson Elk Herd Unit from 1993 to 2020 (Wyoming Game and Fish Department, 2021b, and references therein).
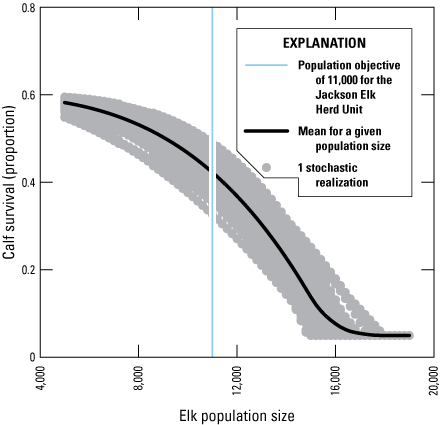
Line graph showing the assumed annual calf survival as a function of the Jackson Elk Herd Unit (JHU) population size (table 4 of Cook and others, 2023; Wyoming Game and Fish Department, 2021a).
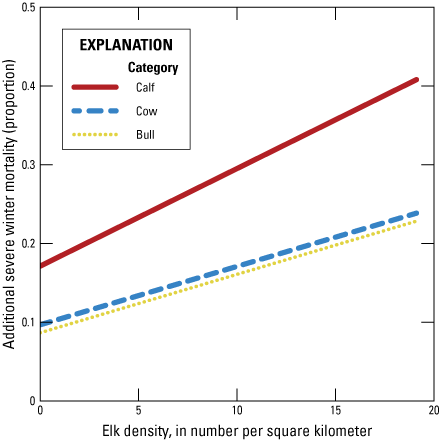
Line graph showing the modeled effects of severe winter on the mortality of elk in different age and sex classes beyond natural and hunting mortality as a function of elk population size in the Jackson Elk Herd Unit. These relationships were derived from Hobbs and others (2003).
References Cited
Cook, J.D., Cross, P.C., Tomaszewski, E.M., Cole, E.K., Grant, E.H.C., Wilder, J., and Runge, M.C., 2023, Evaluating management alternatives for Wyoming elk feedgrounds in consideration of chronic wasting disease (ver. 2.0, November 2023): U.S. Geological Survey Open-File Report 2023–1015, 50 p., accessed July 8, 2024, at https://pubs.usgs.gov/publication/ofr20231015.
Cotterill, G.G., Cross, P.C., Middleton, A.D., Rogerson, J.D., Scurlock, B.M., and du Toit, J.T., 2018, Hidden cost of disease in a free-ranging ungulate—Brucellosis reduces mid-winter pregnancy in elk: Ecology and Evolution, v. 8, no. 22, p. 10733–10742, accessed July 8, 2024, at https://doi.org/10.1002/ece3.4521.
Cross, P.C., and Cook, J.D., 2024, CWD software code for simulating elk and chronic wasting disease dynamics on the National Elk Refuge (version 0.1.0): U.S. Geological Survey webpage, https://code.usgs.gov/usgs/norock/cross_p/cwd-ner.
Galloway, N.L., Monello, R.J., Brimeyer, D., Cole, E.K., and Hobbs, N.T., 2021, Supporting adaptive management with ecological forecasting—Chronic wasting disease in the Jackson Elk Herd: Ecosphere, v. 12, no. 10, 14 p., accessed April 30, 2024, at https://doi.org/10.1002/ecs2.3776.
Hobbs, N.T., Wockner, G., and Singer, F.J., 2003, Assessing management alternatives for ungulates in the Greater Teton Ecosystem using simulation modeling: Fort Collins, Colo., Colorado State University, Natural Resource Ecology Lab, 63 p., accessed May 18, 2024, at https://www2.nrel.colostate.edu/projects/teton/TBISON10.pdf.
Raithel, J.D., Kauffman, M.J., and Pletscher, D.H., 2007, Impact of spatial and temporal variation in calf survival on the growth of elk populations: Journal of Wildlife Management, v. 71, no. 3, p. 795–803, accessed May 18, 2024, at https://doi.org/10.2193/2005-608.
Wyoming Game and Fish Department, 2021a, Annual big game herd unit job completion reports: Cheyenne, Wyo., Wyoming Game and Fish Department, accessed May 17, 2024, at https://wgfd.wyo.gov/hunting-trapping/job-completion-reports.
Wyoming Game and Fish Department, 2021b, Harvest reports & surveys, elk: Cheyenne, Wyo., Wyoming Game and Fish Department, accessed May 17, 2024, at https://wgfd.wyo.gov/hunting-trapping/harvest-reports-surveys.
Appendix B2. Expert Elicitation
Elk Spatial Transitions Without National Elk Refuge Feeding
For each of the questions about elk redistribution during immediate transition from feeding, assume an average snowfall year in duration of season and sustained snow depths. Also, assume that elk that are the focus of these questions may have learned behavioral responses to feeding that were acquired under normal feeding operations. This includes the annual return of individuals to the NER with an expectation that supplemental food will be provisioned when forage becomes scarce.
Assuming the NER no longer provisions food to elk on the Refuge, the specific questions were:
-
1. What proportion of the NER feedground elk will hold on native winter range in the same year that the NER does not provision supplemental feed? (Fig. B2.1A; questions 1, 2, 3, 4, and 5 are linked together such that central and (or) best guess estimates should sum to approximately 1.)
-
1a. Of the NER elk that do not transition to State feedgrounds, what proportion will hold on native winter range in the NER when the Refuge does not provision supplemental feed? (Questions 1a and 1b are linked so that central estimates should sum to 1.)
-
1b. Of the NER elk that do not transition to State feedgrounds, what proportion will transition to private lands conflict areas and winter range off the Refuge when the NER does not provision supplemental feed? (Questions 1a and 1b are linked so that central estimates should sum to 1.)
-
-
2. What proportion of the NER feedground elk will relocate to Gros Ventre feedgrounds (Patrol Cabin and Fish Creek) in the same year that the NER does not provision supplemental feed? (Fig. B2.1B; questions 1, 2, 3, 4, and 5 are linked together such that central and (or) best guess estimates should sum to approximately 1.)
-
3. What proportion of the NER feedground elk will relocate to South Park feedground in the same year that the NER does not provision supplemental feed? (Fig. B2.1C; questions 1, 2, 3, 4, and 5 are linked together such that central and (or) best guess estimates should sum to approximately 1.)
-
4. What proportion of the NER feedground elk will relocate to Horse Creek feedground in the same year that the NER does not provision supplemental feed? (Fig. B2.1D; questions 1, 2, 3, 4, and 5 are linked together such that central and (or) best guess estimates should sum to approximately 1.)
-
5. What proportion of the NER feedground elk will relocate to Camp Creek feedground in the same year that the NER does not provision supplemental feed? (Fig. B2.1E; questions 1, 2, 3, 4, and 5 are linked together such that central and (or) best guess estimates should sum to approximately 1.)
Expert Panel Responses
The results of each expert’s answers to the questions above are shown in figures B2.1 and B2.2. (Expert 6 did not respond to questions 1a and 1b.) The four-point estimates were an expert’s low, high, and best estimates of a parameter and their confidence that the actual value would fall within the low and high values. The individual expert estimates were aggregated to provide the prediction in figure B2. Distributions were then aggregated by fitting a single Dirichlet distribution, which ensured that the sum of each estimated beta distribution included the upper limit of one for the proportional data we elicited (Conroy and Peterson, 2013).

Charts showing raw expert responses to questions 1–5 related to elk redistribution between the National Elk Refuge (NER) and other feedgrounds. A, results of question 1, B, results of question 2, C, results of question 3, D, results of question 4, and, E, results of question 5.
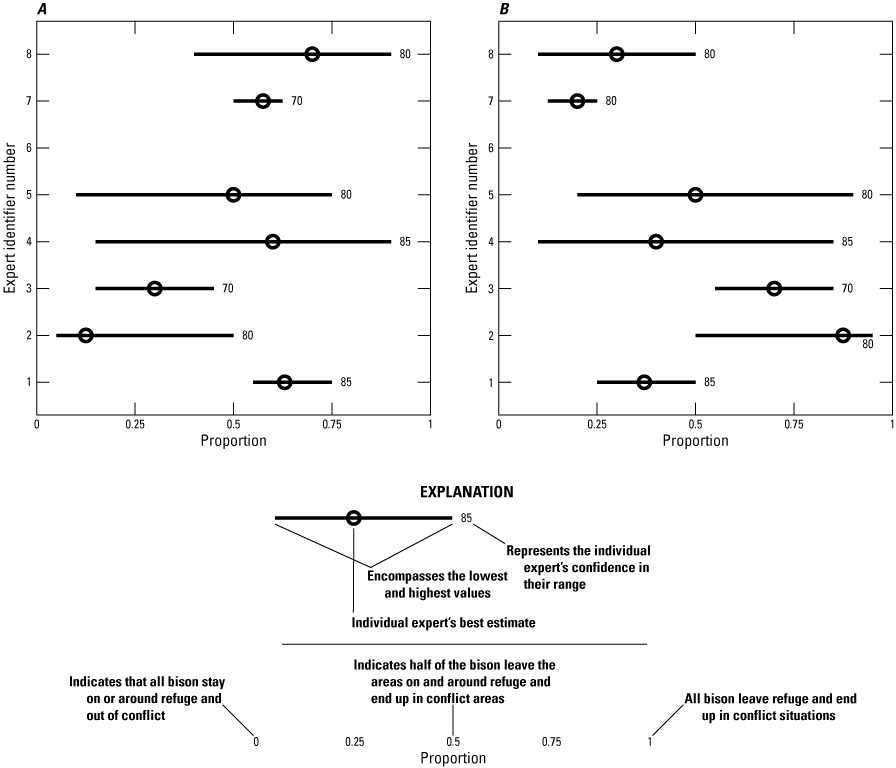
Chart showing raw expert panel responses to questions 1a and 1b related to elk redistribution between National Elk Refuge (NER) and conflict areas: A, results of question 1a: Of the NER elk that do not transition to State feedgrounds, what proportion will hold on native winter range in the NER when the refuge does not provision supplemental feed?; B, results of question 1b: Of the NER elk that do not transition to State feedgrounds, what proportion will transition to private lands conflict areas and winter range off the refuge when the NER does not provision supplemental feed?
Reference Cited
Conroy, M.J., and Peterson, J.T., 2013, Decision making in natural resource management—A structured, adaptive approach: Hoboken, N.J., John Wiley and Sons, Ltd., 456 p. [Also available at https://doi.org/10.1002/9781118506196.]
For more information concerning the research in this report, contact:
Disclaimers
Any use of trade, firm, or product names is for descriptive purposes only and does not imply endorsement by the U.S. Government.
Although this information product, for the most part, is in the public domain, it also may contain copyrighted materials as noted in the text. Permission to reproduce copyrighted items must be secured from the copyright owner.
Suggested Citation
Cross, P.C., Cook, J.D., and Cole, E.K., 2025, Predictions of elk and chronic wasting disease dynamics at the National Elk Refuge in Jackson, Wyoming, and surrounding areas, chap. B of Cook, J.D., and Cross, P.C., eds., Decision analysis in support of the National Elk Refuge bison and elk management plan: U.S. Geological Survey Scientific Investigations Report 2024–5119, 22 p., https://doi.org/10.3133/sir20245119B.
ISSN: 2328-0328 (online)
Study Area
| Publication type | Report |
|---|---|
| Publication Subtype | USGS Numbered Series |
| Title | Predictions of elk and chronic wasting disease dynamics at the National Elk Refuge in Jackson, Wyoming, and surrounding areas |
| Series title | Scientific Investigations Report |
| Series number | 2024-5119 |
| Chapter | B |
| DOI | 10.3133/sir20245119B |
| Publication Date | January 08, 2025 |
| Year Published | 2025 |
| Language | English |
| Publisher | U.S. Geological Survey |
| Publisher location | Reston, VA |
| Contributing office(s) | Northern Rocky Mountain Science Center |
| Description | Report: vi, 22 p.; Software Release |
| Country | United States |
| State | Wyoming |
| City | Jackson |
| Other Geospatial | National Elk Refuge |
| Online Only (Y/N) | Y |
| Additional Online Files (Y/N) | N |