Evaluating Elk Distribution and Conflict Under Proposed Management Alternatives at the National Elk Refuge in Jackson, Wyoming
Links
- Document: Report (6.58 MB pdf) , HTML , XML
- Larger Work: This publication is Chapter C of Decision analysis in support of the National Elk Refuge bison and elk management plan
- Software Release: USGS software release - Supporting code for—Evaluating elk distribution and conflict under proposed management alternatives at the National Elk Refuge in Jackson, Wyoming
- Superseding Publications:
- Download citation as: RIS | Dublin Core
Acknowledgments
We thank the National Park Service and Wyoming Game and Fish Department staff who served as members of the Wildlife Subject Matter Expert Team and the Sensitive Habitat Identification team. The work by Margaret McEachran was done while serving as a visiting scientist with the U.S. Geological Survey.
Abstract
We evaluated measurable attributes describing the current and future distribution of Cervus elaphus canadensis (elk) across a region surrounding Jackson, Wyoming, for five feedground management alternatives proposed by the U.S. Fish and Wildlife Service as a revision to the 2007 “Bison and Elk Management Plan” of the National Elk Refuge. A resource selection function evaluated measurable attributes of interest to managers, including elk use of private property and sensitive habitat types at monthly timesteps and varying winter conditions. The study area boundaries were created through an expert elicitation process and consist of the Jackson Elk Herd Unit, Grand Teton National Park, the National Elk Refuge, and the northern third of the Fall Creek Elk Herd Unit. For each of the five alternatives, we distributed monthly elk numbers calculated in a concurrent analysis that simulated chronic wasting disease dynamics in this system for 20 years. Measurable attributes representing potential elk use of (1) private property, (2) cattle properties as an index of Brucella abortus risk, and sensitive habitats consisting of (3) Populus tremuloides Michx. (quaking aspen), (4) Populus angustifolia E. James (narrowleaf cottonwood), and (5) Salix L. (willow) in core winter use areas all closely followed the declines of elk abundance projected by the elk chronic wasting disease model. After 20 years, the continue feeding alternative ranked most favorably in terms of limiting elk days on private property and reducing brucellosis risk from elk to cattle because this alternative concentrated elk on the National Elk Refuge and resulted in the lowest elk population sizes. However, other management alternatives, including increase harvest and reduce feeding, tended to limit elk use of sensitive quaking aspen, narrowleaf cottonwood, and willow habitats during winter (December–April).
Introduction
This analysis provides scientific support for the U.S. Fish and Wildlife Service (FWS) regarding management decisions at the National Elk Refuge (NER) in Jackson, Wyoming. The NER has fed most of the Jackson elk herd for part of the winter for more than a century. Cervus elaphus canadensis (Erxleben, 1777; elk) abundance has changed over time, but the average number fed at the NER each winter during 2017–22 was approximately 7,500 elk, 70 percent of the Jackson elk herd (Wyoming Game and Fish Department [WGFD], 2022b). Previous research has shown that winter feeding operations create large, dense aggregations of animals that facilitate the transmission of multiple pathogens, including Brucella abortus (which causes brucellosis; Cross and others, 2007), Psoroptes spp. (scabies species; Samuel and others, 1991), and Pasteurella multocida (which causes pasteurellosis; Franson and Smith, 1988). Chronic wasting disease (CWD), which is always fatal to hosts, affects ungulates (including elk, Alces alces [Linnaeus, 1758; moose], and deer) and can lead to population declines (Edmunds and others, 2016). In 2020, the first CWD-positive elk was detected in Grand Teton National Park. In Wind Cave National Park, CWD has reached prevalence as high as 18–29 percent in elk (Sargeant and others, 2021). Chronic wasting disease is spread directly through animal-to-animal contact and indirectly through environmental exposure to prions, the malformed PrP proteins that are the infectious agent of CWD (Miller and others, 2004). Prions can persist for years, if not decades in the environment. Accordingly, CWD could have a larger effect on the Jackson elk herd than that observed in other populations because feeding at the NER greatly increases elk contact rates and elk densities (Galloway and others, 2017; Janousek and others, 2021).
The FWS is writing an environmental impact statement and revising its Bison and Elk Management Plan (U.S. Fish and Wildlife Service and National Park Service, 2007) in consideration of the disease risk to the herd. A structured decision-making (SDM) process, facilitated by the U.S. Geological Survey, provides scientific support for this revision (this volume, chap. A, Cook and others, 2025). Briefly, the management alternatives under consideration include (1) continue feeding, (2) immediate cessation of feeding (hereafter referred to as no feeding), (3) increase elk harvest for a 5-year period to reduce the NER winter elk population to 5,000 animals, followed by feed cessation (hereafter referred to as increase harvest), (4) attempt to lower the number of elk to 5,000 by reducing the feed provisioned to elk at the NER for a 5-year period, followed by feed cessation (hereafter referred to as reduce feeding), and (5) continue feeding until CWD prevalence in the Jackson elk herd is estimated to be 3 percent, followed by feed cessation (hereafter referred to as disease threshold).
This analysis predicted future elk space-use (the areas that elk will occupy) during a 20-year period in the vicinity of Jackson, Wyoming, under the proposed alternatives. The overall approach closely followed previous research in the Bridger-Teton National Forest (Cook and others, 2023), wherein a resource selection function (RSF) was fit to elk global positioning system (GPS) collar data. The RSFs were used to estimate the per capita probability of use across the study area for various population segments of elk at monthly timesteps (Cotterill and Graves, 2024). Elk abundance estimates were derived from a dynamic population and disease simulation model (hereafter, elk CWD model) under the management alternatives (this volume, chap. B, Cross and others, 2025) and projected across the study area using the RSFs. The elk CWD model, in conjunction with the RSFs, formed the basis for the calculation of what we refer to as our measurable attributes, the metrics of interest to decision-makers defined during the SDM process (this volume, chap. A, Cook and others, 2025).
Most of the future alternatives under consideration included novel conditions for which scant or no relevant elk GPS collar data exist. For example, winter feeding operations at the NER have never been experimentally discontinued to allow researchers to observe elk behavior and population dynamics in the absence of feeding. However, decades of research in this study area provided insights into the potential future behavior of elk under the no feeding alternative. Relevant situations included (1) a mild winter with substantial forage resources during which no feeding occurred at the NER, (2) attempts to reduce the duration of feeding by initiating feeding later in the season and ending feeding earlier in the season, and (3) one occasion where underestimating the number of elk in the NER caused elk to be fed reduced rations (Janousek and others, 2021; FWS, 2019). We used a formal expert-elicitation process to collate these insights to parameterize the elk space-use models. Expert judgment is a quantitative expression of an expert’s belief, based on relevant system knowledge, and when elicited by a formal process designed to minimize cognitive biases, can result in reliable predictions when empirical information is impossible or infeasible to collect (Adams-Hosking and others, 2016; Martin and others, 2012; O’Hagan and others, 2006; Runge and others, 2011; Speirs-Bridge and others, 2010). The resulting models integrated the expert-provided information from the Wildlife Subject Matter Expert Team (WSMET; this volume, chap. A, Cook and others, 2025) with elk collar data such that model predictions closely matched expected outcomes from the expert elicitation process.
The analysis area under consideration was delineated by the WSMET and consists of two contiguous regions, the Jackson Elk Herd Unit (JHU) and the Northern Fall Creek Elk Herd Unit (NFCHU). Refer to appendix C1 for a map of the analysis area (fig. C1.2). The JHU matches the Jackson Elk Herd Unit as designated by the Wyoming Game and Fish Department and generally extends north from State Highway 22 and Jackson to encompass Grand Teton National Park, the National Elk Refuge, and other lands up to the southern Yellowstone National Park boundary and east to the Continental Divide (WGFD, 2022a). The NFCHU is the northern third of the Fall Creek Elk Herd Unit (WGFD designation; WGFD, 2022a; refer to this volume, chap. A, fig. A1 in Cook and others, 2025). The WSMET included the NFCHU to consider potential effects from elk movements under alternatives with reduced feeding. Public entities, including the U.S. Department of Agriculture Forest Service, the National Park Service, the FWS, and the State of Wyoming, manage much of the analysis area. However, in addition to the NER, other low-elevation areas that ungulates use in winter tend to be private property, mostly developed for agricultural or residential purposes. Of immediate concern was the potential conflict resulting from negative effects elk could have on private property, livestock, and sensitive vegetation communities if the NER were to cease winter feeding operations. The measurable attributes evaluating these negative effects consisted of the estimated elk use of private property, the Brucella abortus transmission risk from elk to cattle on private property, and elk use of core Populus tremuloides Michx. (quaking aspen), Populus angustifolia E. James (narrowleaf cottonwood), and Salix L. (willow) sensitive vegetation communities.
Methods
The NER has never experimentally discontinued feeding, and therefore, we could not fit models to the full suite of conditions that characterized the management alternatives. Yet, a primary goal of this work was to make quantitative predictions of elk redistribution if the NER ceases feeding elk in winter. To bridge this knowledge gap, a hybrid approach of fitting a resource selection function to data was used where possible, and then predictions were adjusted under the alternatives based on information about current and future elk movements from the expert-elicitation process.
An RSF was first estimated based on a use-availability design (Johnson and others, 2006), which measures where an animal has been compared to where an animal could have been. This RSF predicted space-use patterns that closely matched recent conditions and expert knowledge using data for two elk subpopulations: (1) elk fed during winter and (2) elk not fed in winter. To match the structure of the elk CWD model, monthly probability of use was predicted based on elk GPS collar locations. Fed and unfed population segments were pooled for May through November because the WSMET believed summer range selection patterns were not significantly different for these population segments. Winter was defined as December through April, and we further differentiated between average and severe winters. Severe winters were characterized as winters during which snowfall patterns concentrated more elk on feedgrounds (locations where wildlife agencies feed elk in winter), the NER had to provision larger amounts of feed to elk, and winter elk calf mortality exceeded 5 percent even with additional feed. These criteria were met in approximately 25 percent of recent observed years (this volume, chap. B, Cross and others, 2025). These combinations of variables created 27 monthly elk location datasets, consisting of 7 summer month (May–November) datasets and 20 winter month datasets (December–April). Each of the 5 winter months had fed and unfed population segments and both average and severe winter conditions (5[months]×2[fed, unfed]×2[average, severe winter]=20 datasets). The RSFs were fit to each dataset of elk locations separately to produce 27 predictive maps, each representing the study area as a grid of 1,020 by 1,020-meter (m) cells with values corresponding to the broad-scale RSFs’ per capita probability of use. Thus, the values of the cells in a predictive map sum to one. We estimated the number of elk in each cell by multiplying the number of elk from the elk CWD model (this volume, chap. B, Cross and others, 2025) by the matching predictive map. To express monthly elk use in daily figures, we calculated elk days by multiplying the number of elk estimated to use a given area by the number of days in each month. For alternatives that included feed cessation at the NER, we developed a set of rules for modifying the predictive maps once feeding stopped to match the elk CWD model assumptions and expert judgment (this volume, chap. B, Cross and others, 2025).
The overarching goal of the analysis was to calculate how elk distribution changes influenced measurable attributes, indicating issues of concern to managers. The measurable attributes, identified during the SDM process, can be used to evaluate the performance of the alternatives against one another. Most attributes reflected concerns at the scale of the study area. The reduce feeding alternative included a provision that elk exclosures (fenced areas that exclude elk) be built in the NER to protect sensitive areas—vegetation communities, including quaking aspen, narrowleaf cottonwood, and willow—during winter. The NER is significantly smaller than the full study area, and the proposed exclosures were small relative to the resolution of the broad-scale RSF across the full study area. To evaluate the local effects of exclosures on the quaking aspen, narrowleaf cottonwood, and willow species in the NER, a second (fine-scale) RSF was estimated at a 30 by 30 m resolution for the NER during winter. The broad-scale RSF projected the numbers of elk in the NER, and the fine-scale RSF distributed the numbers of elk across the NER.
Implementation of the Alternatives
The effects of the feedground management alternatives were accounted for through three avenues: (1) alternatives changed elk-population sizes for categories representing herd units and fed or unfed elk status, as detailed in “Predictions of elk and chronic wasting disease dynamics on the National Elk Refuge and surrounding areas in Jackson, Wyoming—Chapter B of National Elk Refuge Feedground Management Alternatives” (this volume, Cross and others, 2025), (2) when feeding stopped on the NER, some elk from the NER moved to the Gros Ventre River drainage north and east of the NER or to non-feedground areas based on expert elicitation results, and (3) for the reduce feeding alternative, predicted elk space-use that fell within the boundaries of proposed elk exclosures in the NER was subtracted when calculating sensitive area measurable attributes.
The elk CWD model accounted for elk redistribution in the absence of feeding by transitioning elk to other herd units or changing their status from fed to unfed. Based on the expert-elicitation process, the elk CWD model assumes that roughly 50 percent of previously fed elk become unfed elk that still used the NER extensively. The remainder of the previously fed elk either became unfed elk that overwinter on native winter range—land away from the feedgrounds—or moved to other State feedgrounds in the Jackson or Fall Creek Elk Herd Units and became fed elk there (roughly in equal proportion; this volume, chap. B, Cross and others, 2025). Additionally, the elk CWD model used random draws in each year of every simulation to determine whether the winter was characterized as severe or average. The combination of population segment, winter condition, and time of year dictated which of the 27 predictive maps (corresponding to the datasets) was used to distribute elk numbers across the study area.
We assumed that our RSFs did not change during the 20 years of simulations for non-winter months and for unfed elk during winter. However, during the winter months of December through April, predicted fed elk space-use was adjusted to match expert-elicited predictions and the elk CWD model assumptions for broad-scale movements in the absence of feeding (this volume, chap. B, Cross and others, 2025).
Lastly, predicted elk space-use falling within proposed elk exclosures on the NER was subtracted from the calculations pertaining to sensitive vegetation community effects under the reduce feeding alternative. Predicted elk use inside the exclosures was not removed from the NER, but we assumed that these elk did not affect sensitive areas outside the exclosures.
Measurable Attributes
A total of five measurable attributes were determined for each of the management alternatives: (1) the number of elk days on private property, (2) the risk of Brucella abortus transmission from elk to cattle, expressed as the number of Brucella-caused elk abortions on private properties in the region where cattle could overwinter and (3–5) the number of elk days on sensitive vegetation communities during winter. The cumulative number of elk days on sensitive vegetation communities was further divided to capture specific effects on (3) quaking aspen, (4) narrowleaf cottonwood, and (5) willow species vegetation communities. Each of the sensitive vegetation calculations was restricted to winter months and to the portion of the study area that was defined as highly used wintering elk habitat based on expert judgment (refer to app. C1). Under the reduce feeding alternative, which included building the proposed elk exclosures, the elk days in sensitive vegetation communities (measurable attributes 3–5) were recalculated across the NER using the fine-scale NER winter RSF. Predicted elk space-use falling within proposed exclosures was subtracted from the total. This approach assumed that exclosures were designed to avoid displacing elk onto unprotected sensitive quaking aspen, narrowleaf cottonwood, or willow vegetation communities within the NER. The elk CWD model performed 100 simulations for each alternative. The elk spatial measurable attributes were calculated for each simulation and the summarized distributions of these results are presented in this chapter.
Publicly available private property data were obtained from Teton County (Teton County, Wyoming, 2023) and included the winter cattle properties contributing to the brucellosis risk measurable attribute. Winter cattle properties were defined through personal communication with WGFD personnel. Sensitive areas (quaking aspen, narrowleaf cottonwood, and willow vegetation communities) were defined based on vegetation types included in map layers from Grand Teton National Park (Cogan and others, 2005), the NER (FWS, written commun., 2023), Teton County (Cogan and Johnson, 2013), and Bridger-Teton National Forest (Forest Service, written commun., 2023). These sensitive vegetation layers were verified, and the assessment scales were identified using input from the National Park Service, FWS, and WGFD staff.
Brucella abortus is transmitted among hosts through direct contact with the products of Brucella-induced abortions. Elk primarily abort during the spring (Cross and others, 2015). To estimate brucellosis risk from elk to cattle, we used the same methods as in Cook and others (2023): the predicted number of Brucella-caused abortions in elk on properties used for overwintering cattle was calculated by multiplying the number of female elk on the identified cattle properties in each month by the monthly brucellosis abortion hazard for elk (Cross and others, 2015), assuming a constant pregnancy rate of 80 percent in sexually mature females and an average brucellosis seroprevalence (the percentage of sampled elk with detectable antibodies) of 30 percent.
Elk Global Positioning System (GPS) Data
The elk GPS collar data within the study area were provided by the FWS, Grand Teton National Park, and WGFD (FWS, written commun., 2024; National Park Service, written commun., 2024; WGFD, written commun., 2024). Observations from GPS were collected between 2006–23 with most individuals being collared at the NER in winter months between 2016–22. The total number of observations exceeded 2.2 million (table C1).
Table C1.
The number of adult female Cervus elaphus canadensis (Erxleben, 1777; elk) and the number of elk-years with global positioning system (GPS) locations from 2006 to 2023 data in Jackson, Wyoming, that contributed to estimating habitat selection across spatial and seasonal categories in our models.[An elk-year is defined as any time that an individual elk had a working GPS collar during the corresponding seasons, regardless of whether the full period was observed. Retention of data in the models estimating habitat selection was not conditional on being observed for full monthly or seasonal periods. Winters are defined as December through April, summers are May through November. Severe winters were characterized as winters during which snowfall patterns concentrated more elk on feedgrounds, the National Elk Refuge had to provision larger amounts of feed to elk, and winter elk calf mortality exceeded 5 percent even with additional feed. Winters not meeting these criteria were defined as average. NA, not applicable]
Broad-Scale Resource Selection Function
State Highway 22 likely creates a partial barrier to elk movement between the two regions of our study area (the Jackson and Fall Creek Elk Herd Units). Elk rarely crossed this highway in the GPS dataset; however, there were limited data available for elk in the Fall Creek Elk Herd Unit, and the WSMET agreed that more elk are likely to move across this boundary if the NER stops feeding. The elk CWD model accounted for this movement between regions (this volume, chap. B, Cross and others, 2025). The spatial models in this chapter subsequently used the projected number of elk in each region in all simulations of the alternatives from Cross and others (this volume, chap. B, 2025) and assumed that elk remained within those herd units. The habitat covariates used by Cook and others (2023) from Maloney and others (2020) were also used in this study, namely the annual integrated Normalized Difference Vegetation Index, elevation, density of roads within a 2.5 kilometers (km) buffer of the location, maximum snow water equivalent, and the percentage of forest and percentage of native herbaceous cover within a 2.5 km buffer of the location (Cross and others, 2023; Maloney, 2020). Other habitat covariates included the distance to feedgrounds, calculated as the distance from the centroids of the four feeding areas on the NER and State feedgrounds in the JHU and NFCHU. With feedback from the WSMET, two continuous variables for aspect were added, where northness was the cosine-transformed radians and eastness was the sine-transformed radians. Other variables added based on WSMET feedback included the location’s distance to water (Dewitz and U.S. Geological Survey, 2021; Yan and others, 2019); distance to grass and distance to barren ground (Dewitz and U.S. Geological Survey, 2021); distance to agriculture (Forest Service, written commun., 2023; Cook, 2005; Teton County, Wyoming, 2023); and average minimum January temperature (Thornton and others, 2022). For fed elk in winter months, covariates included a binary feedground raster map for the NER; all raster maps were created at or resampled to a 1,020-m resolution (Cotterill and Graves, 2024). This resolution required fewer modifications to the original GIS data, was computationally practical, and was deemed appropriately precise considering multiple sources of uncertainty in the elk CWD model and our spatial analysis.
Elk habitat selection coefficients, , were estimated by employing a use-availability design and logistic regression. For each cell, l, we computed the resource selection probability function (Johnson and others, 2006), w, as the following equation:
wherex
is a vector of mean values of each environmental variable within each cell,
j
is the month, and
k
is an indicator variable for fed (k=1) or unfed elk (k=2).
For measurable attributes associated with the number of elk days in a particular location, the number of elk estimated in each cell was multiplied by the number of days in the month.
Because the NFCHU region had limited data (from as few as three elk; table C1), we assumed elk in both regions respond similarly to habitat and supplemental feed availability and estimated habitat selection coefficients using data combined across the regions. Each monthly elk GPS dataset contributing to these models was randomly thinned to 6,072 locations, the smallest number of locations in any dataset, because the number of GPS locations varied greatly across datasets, and the total number of cells in the study area was only 6,000 at the 1,020-m resolution. Standardizing the sample size across datasets provided comparable estimates across models in terms of effect magnitude, because the ratio of used-to-available points influences model intercepts. Next, within each region, the per capita probability of elk space-use map was estimated using equation C3:
where One of the covariates in x, the binary raster map of the NER only exists in the JHU, but we reasoned that the three State feedgrounds in the NFCHU hold a similar level of attraction for fed elk during winter. Therefore, in the per capita probability of elk use calculations for winter-fed elk in the NFCHU, the NER covariate was replaced with a binary raster map representing South Park, Horse Creek, and Camp Creek feedgrounds. Further information supporting this assumption can be found in appendix C2.Defining available habitat for RSF studies is fraught even under ideal circumstances (Northrup and others, 2013; Warton and Shepherd, 2010), but frequently employed methods include defining availability according to seasonal elk space-use based on home-range or kernel-density estimator methods (Manly and others, 2002). In our case, the GPS dataset likely does not include a representative sample of unfed elk in the system, particularly when divided into monthly timesteps and differing levels of winter severity. As a result, following those conventions could omit habitats occupied by segments of the elk population in our study area, a factor that was considered when the expert elicitation process defined the study area (this volume, chap. A, Cook and others, 2025). Another common convention in use-availability RSF designs is to sample availability at 10 times the number of used locations (Lowrey and others, 2021), but this convention is inadequate when the resolution of the considered areas is coarse (in other words, areas have fewer cells to sample). Most of these concerns are motivated by ensuring accurate estimation of specific habitat selection coefficients and reducing bias from autocorrelated habitat features (Northrup and others, 2013), some of which can be improved through even sampling (for example, a census) of the landscape to represent the full availability of habitats (Benson, 2013). In this analysis, no inference is based on individual selection coefficients, nor is there an inference to habitat selection of elk outside of our study system. The primary goal of the RSF was to predict elk space-use that closely matched observed elk selection patterns and expert judgment in the study area or in segments of the elk population where no comparable observational data existed. To fully represent the available conditions, one available point per cell was sampled in the study area (number of cells in the study area and number of available locations used in the model [n]=6,000).
Experts predicted that once the NER stops feeding elk, NER fed-elk will (1) move to State feedgrounds in the Gros Ventre River drainage, (2) become unfed-elk, or (3) move to the NFCHU. The elk CWD model moves elk to separate population segments to match the proportions of elk that experts identified as likely to transition to each segment (refer to this volume, chap. B, Cross and others, 2025). No further adjustments to the RSF were needed to accommodate the transition of NER elk to the NFCHU because this area had separate predictive maps. To implement the remaining changes for elk-space use predictions, we adjusted the probability of elk use in the NER and two transition areas. The following are cells identified to include in transition areas: (1) areas in the Gros Ventre River drainage surrounding State feedgrounds predicted to be used by fed elk and (2) other winter range areas away from feedgrounds predicted to be used by unfed elk (Native Winter Range Transition Area; NWRTA). The Gros Ventre Transition Area (GVTA) consisted of cells with greater than 0.0001 per capita probability of use for fed elk in February in the Gros Ventre River drainage and comprised 82.2 square km. The NWRTA consisted of cells with greater than 0.0001 per capita probability of use for unfed elk in February. The NWRTA included areas in the Gros Ventre River drainage farther from feedgrounds, private property in the area around Jackson, Wyoming, and other areas near the NER (encompassing 131 square km), excluding the GVTA and NER (app. C3). The RSF initially overestimated elk space-use in the GVTA and underestimated NER elk space-use compared to the elk CWD model. Because of these over and underestimations, a portion of GVTA elk was moved to the NER during winter months. Then, under the alternatives where feeding on the NER was discontinued, portions of predicted fed elk space-use in the NER were transitioned to the GVTA or NWRTA in accordance with expert judgment and the elk CWD model once feeding stopped (fig. C1). As feeding stoppage varied by alternative, this transition was made at various time points according to the alternative: (1) under the no feeding alternative, the NER elk transitioned to the GVTA or NWRTA in the first year; (2) under the increase harvest and reduce feeding alternatives, the elk transitioned at the beginning of the sixth year; (3) under the disease threshold alternative, the elk transitioned at the beginning of the third year because this year was when most elk CWD model simulations predicted that the 3 percent prevalence threshold of CWD in the Jackson elk herd was met. The proportions of fed elk being assigned onto or away from the NER during winter did not change according to winter severity. However, the average and severe winter RSFs made different predictions for the initial distributions of elk in the winter months before the relocation.
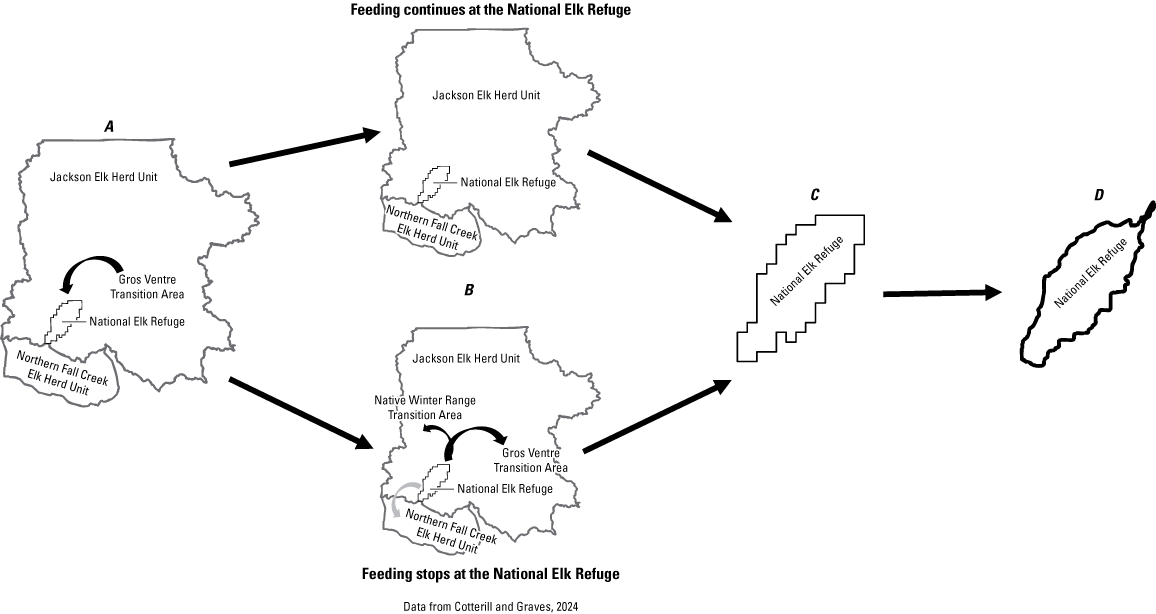
Flowcharts of the modifications to predicted fed-Cervus elaphus canadensis (Erxleben, 1777; elk) distributions during the winter months (December through April) and how winter elk space-use was projected across the National Elk Refuge (NER) in Jackson, Wyoming. A, a portion of fed elk was moved from the cells encompassing Gros Ventre Transition Area (GVTA) to the NER. B, under the continue feeding alternative, no further changes were made, but under other alternatives and years where the NER did not feed elk, fed elk predicted to be in the NER by the resource selection function (RSF) were relocated to the GVTA and non-feedground cells (Native Winter Range Transition Area, NWRTA). The elk chronic wasting disease model also moved a portion of those elk to the Northern Fall Creek Elk Herd Unit (NFCHU). C, the adjusted predictive maps from the broad-scale RSF in B estimated the number of elk in the NER in the winter months. D, the estimated numbers of elk in the NER from C were reprojected across a 30-meter resolution NER winter RSF to calculate the effects of elk on sensitive vegetation communities in the NER.
Fine-Scale National Elk Refuge Winter Resource Selection Function
To evaluate the measurable attributes pertaining to elk use of sensitive areas in the NER, including evaluating the effects of proposed elk exclosures under the reduce feeding alternative, winter elk space-use in the NER was modeled at a fine-scale resolution (30-m cells). We followed the same use-availability design described in the “Broad-Scale Resource Selection Function” section, fitting models only to data falling within the NER boundary between December and April (the winter months). Fitting models to these data excluded most of the unfed elk data previously used in the broad-scale RSF. However, during the unprecedentedly mild winter of 2017–18, feeding was never initiated in the NER. Therefore, in fitting this RSF, the unfed elk datasets were augmented with the GPS observations collected on any elk in the NER that winter. This augmentation precluded the possibility of modeling differences in elk space-use according to winter severity because of inadequate data. The fine-scale NER RSF featured fewer covariates than the broad-scale study area RSF. The unfed-elk RSF model included continuous aspect variables (northness and eastness), distance to grass, elevation, and slope at 30-m resolution (National Aeronautics and Space Administration Jet Propulsion Laboratory [NASA JPL], 2013). The fed-elk model included all covariates of the unfed-elk model and a distance to feeding area covariate, which was calculated using the four designated feeding areas in the NER. The number of used locations was randomly thinned to equal the dataset with the least number of observations (n=8,018), and 1 available point was sampled per cell (n=112,988). As with the broad-scale RSF, monthly per capita predicted elk use maps were generated for fed and unfed elk (5 months×2 population segments=10 maps).
Calculating the measurable attributes for the NER in winter was a multistep process based on the 100 simulations of abundances by population segment output by the elk CWD model (this volume, chap. B, Cross and others, 2025). First, the broad-scale RSF, in conjunction with abundances from the elk CWD model, was used to predict the number of fed and unfed elk in the NER at every winter monthly timestep in the simulations. Next, the numbers of elk in the NER were projected according to the selection coefficients of the fine-scale RSF (fig. C1). Finally, the per capita probability of elk use was calculated using equation C1, where the NER boundary defined the area available. Under the reduce feeding alternative, zero elk days were assumed to fall within elk exclosure boundaries.
Results
The broad-scale RSF predicted more fed elk in the NER and State feedgrounds in midwinter compared to December and April when more animals are moving toward or away from feedgrounds in the JHU (fig. C2) and NFCHU (fig. C3) portions of the study area. Predicted elk space-use of the NER by fed and unfed Jackson elk closely matched the GPS locations (fig. C4). Predicted elk using the NER, State feedgrounds located in the Gros Ventre River drainage, and native winter range closely matched numbers from the elk CWD model during the 20 years of simulations across alternatives (figs. C5, C3.2, C3.3). Information about the summer RSF predictions can be found in appendix C4 (figs. C4.1, C4.2).
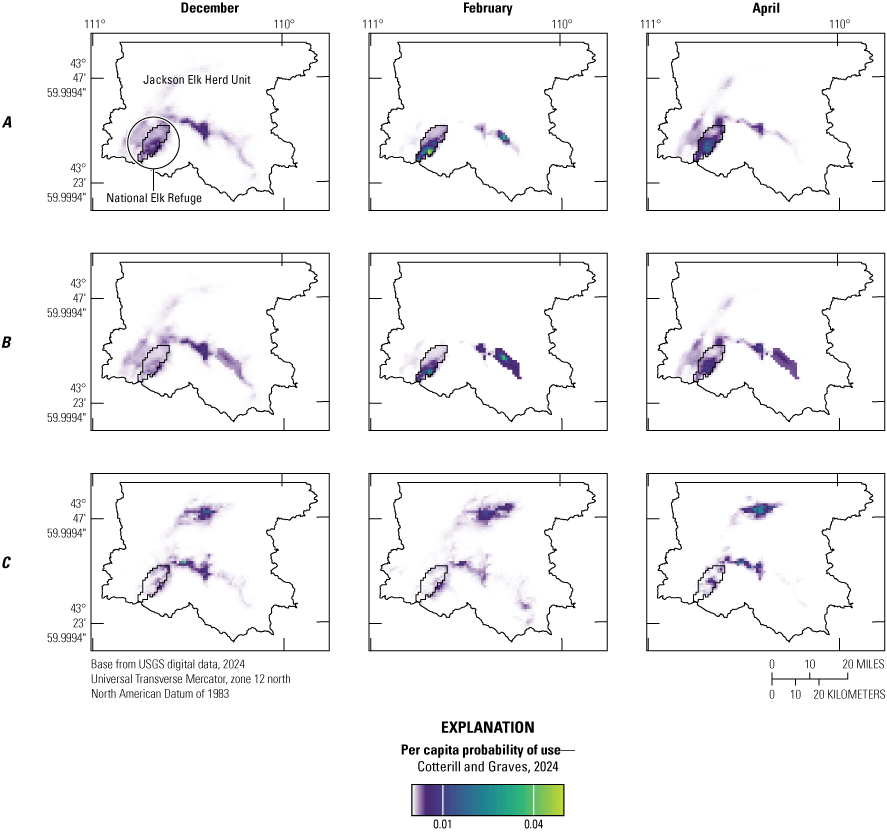
Maps showing the predicted monthly per capita probability of use within the Jackson Elk Herd Unit region of the study area for 3 months during average winter (December–April) conditions for, A, fed Cervus elaphus canadensis (Erxleben, 1777; elk) when feeding occurs on the National Elk Refuge (NER); B, fed elk when feeding on the NER is halted; and, C, unfed elk. The northern portion of the Jackson Elk Herd Unit had nearly zero predicted elk space-use during these months and is not shown.
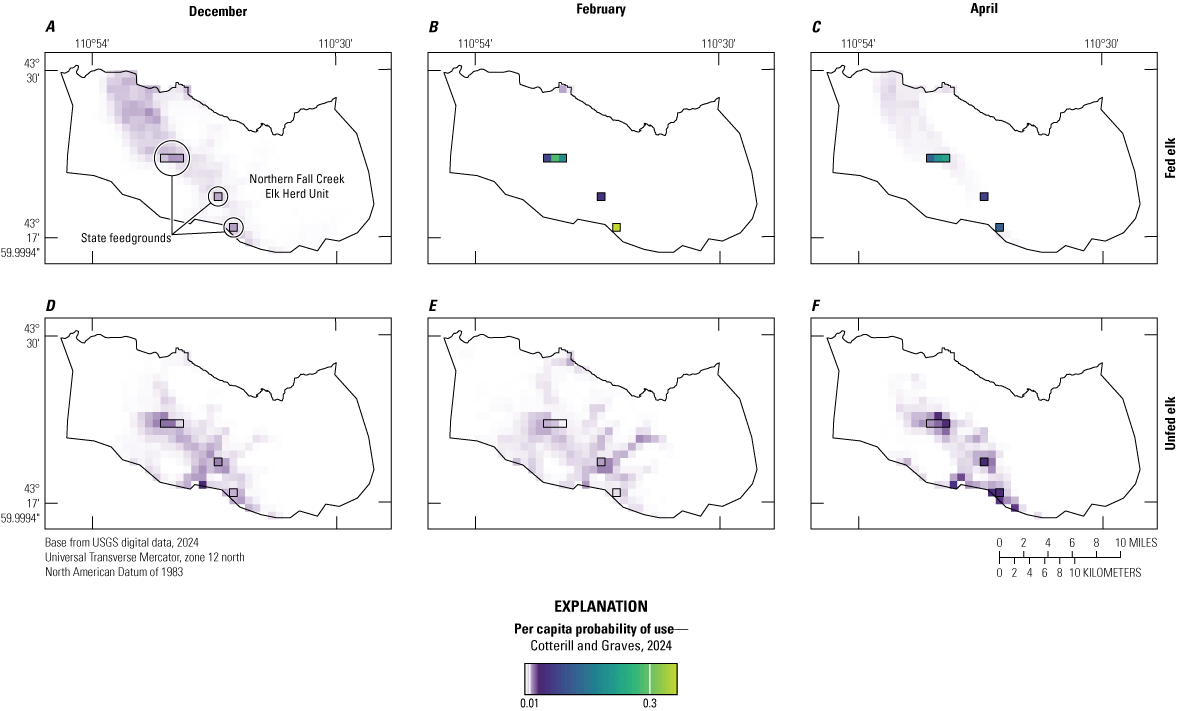
Maps showing the predicted monthly per capita probability of use for fed and unfed Northern Fall Creek Elk Herd Unit Cervus elaphus canadensis (Erxleben, 1777; elk) within the study area for 3 months during average winter conditions. A, fed elk in December. B, fed elk in February. C, fed elk in April. D, unfed elk in December. E, unfed elk in February. F, unfed elk in April.
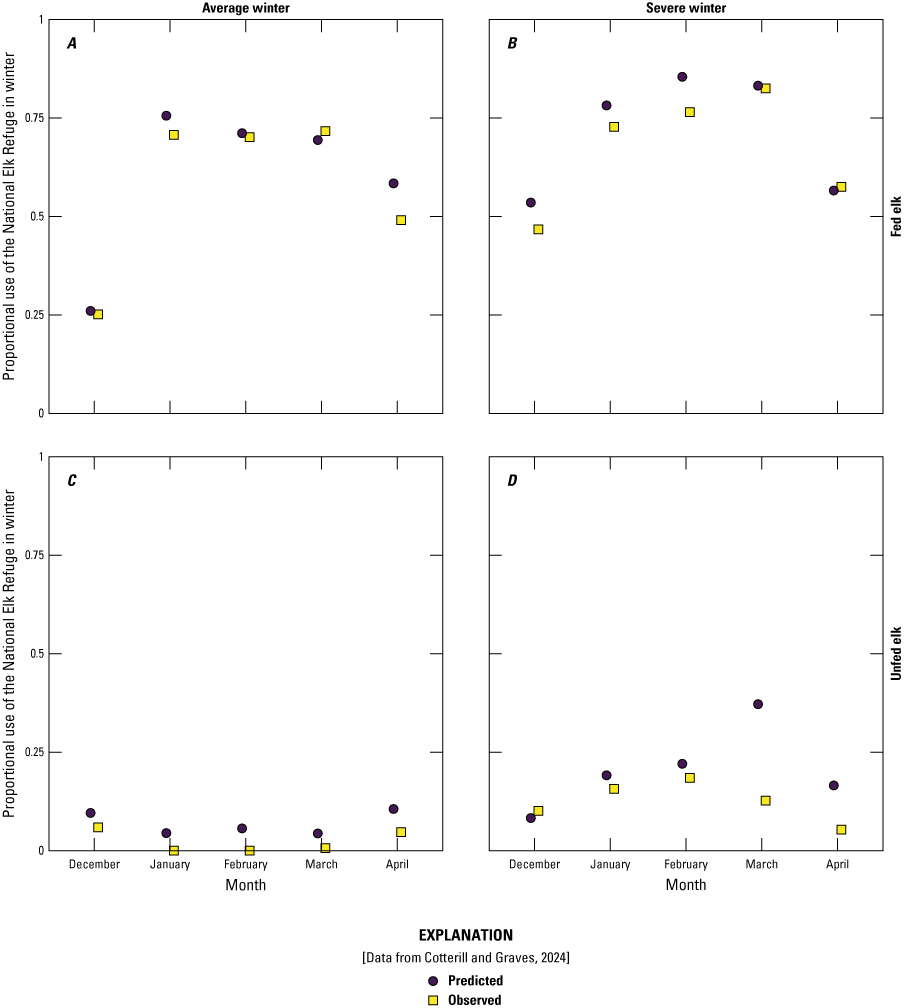
Symbol graphs showing the proportional use of the National Elk Refuge (NER) in Jackson, Wyoming, by Jackson Elk Herd Unit Cervus elaphus canadensis (Erxleben, 1777; elk) during winter months (December through April) under average winter conditions for, A, fed elk and, C, unfed elk, and under severe winter conditions for, B, fed elk and, D, unfed elk. The predicted use was calculated from the resource selection function (after reassignment of elk from the Gros Ventre Transition Area to the National Elk Refuge), and the observed use was calculated using global positioning system (GPS) collar data.
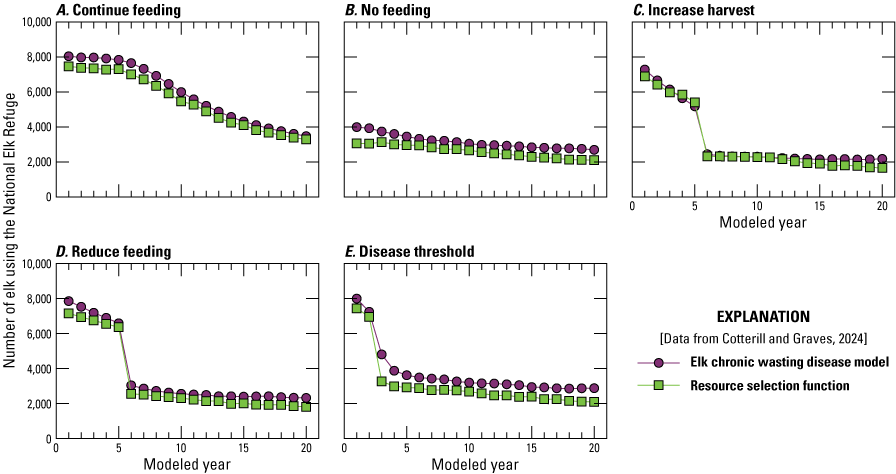
Line graphs comparing the predicted number of Cervus elaphus canadensis (Erxleben, 1777; elk) using the National Elk Refuge (NER) in Jackson, Wyoming, in February, during 20 modeled years under the following feedground management alternatives: A, continue feeding, B, no feeding, C, increase harvest, D, reduce feeding, and, E, disease threshold. Elk chronic wasting disease model (Elk CWD model) values represent the mean values from 100 simulations. The resource selection function (RSF) predicts the average numbers of all elk in the NER.
During the 20 years of simulations, the number of elk days on private property and sensitive vegetation communities reflected the changes in abundance projected in chapter B (this volume, Cross and others, 2025). However, the relative performance of alternatives varied among measurable attributes. The continue feeding alternative produced median estimates with the fewest cumulative elk days on private property and the least brucellosis risk from elk to cattle, although the interquartile ranges from 100 simulations overlapped across most alternatives, especially the increase harvest and reduce feeding alternatives (fig. C6). The no feeding and disease threshold alternatives produced the highest median estimates for these two measurable attributes. In terms of elk days in sensitive vegetation communities, the continue feeding alternative ranked well for narrowleaf cottonwood and willow when calculated with the broad-scale RSF but poorly for quaking aspen (fig. C7). The four alternatives that featured feeding cessation on the NER projected less impact on quaking aspen, narrowleaf cottonwood, and willow in the NER than the continue feeding alternative. Following feed cessation, the fine-scale winter RSF for the NER predicted lower elk densities in the National Elk Refuge. Further information can be found in appendix C5 (fig. C5.1).
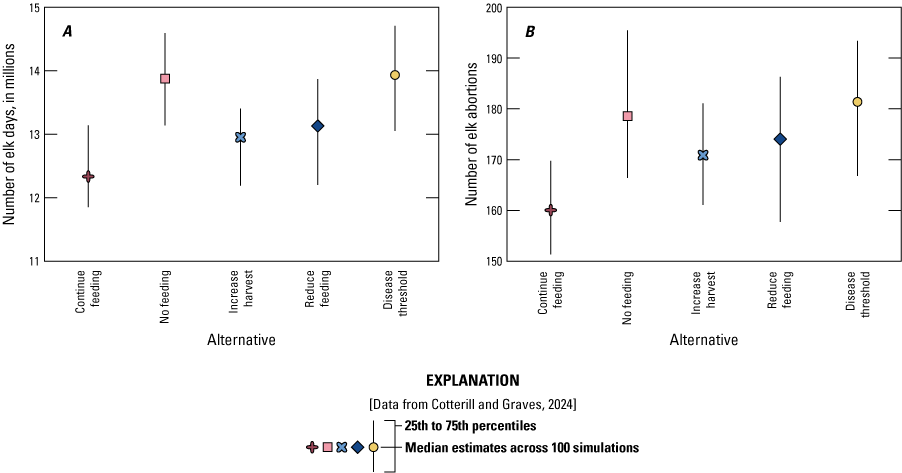
Error bar charts showing the cumulative sums for, A, the predicted number of Cervus elaphus canadensis (Erxleben, 1777; elk) days on private properties, and, B, the predicted number of abortions on winter cattle properties at the end of the 20-year simulations for five feedground management alternatives based on the broad-scale resource selection function (RSF).
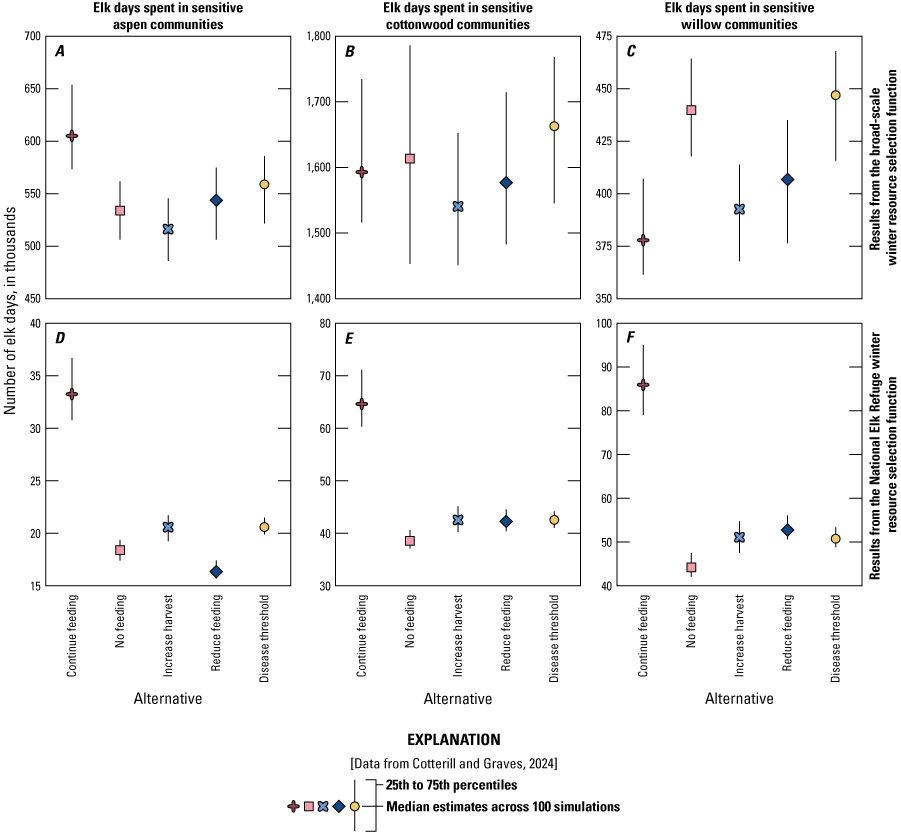
Error bar charts showing the cumulative sums for the number of Cervus elaphus canadensis (Erxleben, 1777; elk) days in sensitive vegetation communities at the end of the 20-year simulations for five feedground management alternatives for the winter (December–April) using the broad-scale resource selection functions (RSF) for the full study area (on communities of, A, Populus tremuloides Michx. [quaking aspen], B, Populus angustifolia E. James [narrowleaf cottonwood], and, C, Salix L. [willow]) and the fine-scale RSF for the National Elk Refuge (NER) in Jackson, Wyoming (on communities of, D, quaking aspen, E, narrowleaf cottonwood, and, F, willow). The reduce feeding alternative includes a provision for building additional elk exclosures in the NER, which would primarily benefit quaking aspen.
There was substantial variation in the projected measurable attributes throughout the 100 simulations of each alternative. In terms of limiting the cumulative year-round elk space-use of private property, the continue feeding alternative ranked highest in 64–83 percent of simulations across the other alternatives, although the increase harvest and reduce feeding alternatives out-performed the continue feeding alternative in 36 and 35 percent of simulations, respectively (fig. C8). Similarly, although the continue feeding alternative ranked highest in limiting brucellosis transmission risk from elk to cattle (expressed as the number of Brucella-caused abortions on private properties used for overwintering cattle), some of the alternatives outperformed the continue feeding alternative in a substantial proportion of simulations, including the reduce feeding alternative (better in 39 percent of simulations), the increase harvest alternative (33 percent), and even the no feeding alternative (25 percent; fig. C8).
When summed through the end of the first five years of implementation, the increase harvest and reduce feeding alternatives (the alternatives that reduce NER elk abundance) outperformed the continue feeding alternative in terms of private property use by elk and were similar to continue feeding in terms of brucellosis risk (refer to app. C6 for more information).
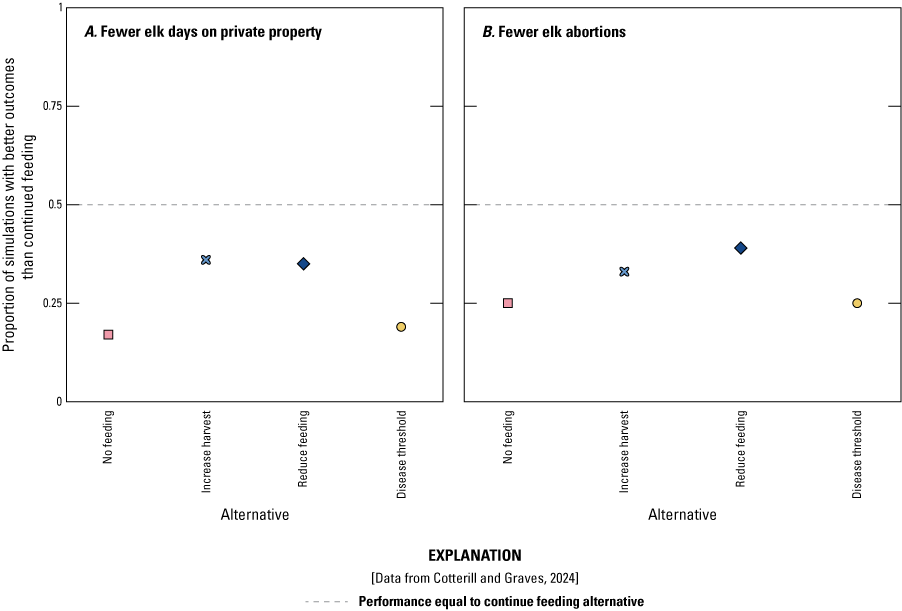
Plots showing the proportion of 100 simulations in which the other feedground management alternatives were projected to yield better outcomes than the continue feeding alternative in Jackson, Wyoming, for, A, the predicted number of Cervus elaphus canadensis (Erxleben, 1777; elk) days on private property, and, B, the predicted number of Brucella-caused elk abortions on winter cattle properties. Higher values indicate better outcomes.
In the matter of elk negatively affecting sensitive vegetation communities in winter, the continue feeding alternative frequently performed worst (fig. C9). Across core quaking aspen, narrowleaf cottonwood, and willow areas, the increase harvest alternative outperformed the continue feeding alternative in 98, 52, and 42 percent of simulations, respectively, across the full study area. Within the NER boundary, the continue feeding alternative performance was the worst in nearly all cases. The 5-year rankings of the sensitive area measurable attributes supported all other alternatives compared to continue feeding, particularly for the NER (refer to fig. C6.2).
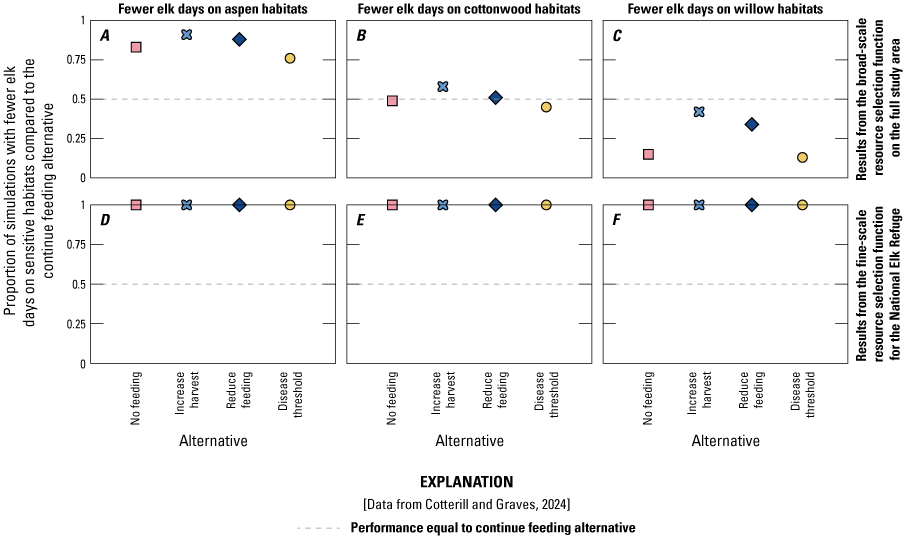
Plots showing the proportion of 100 simulations in which the other feedground management alternatives were projected to yield better outcomes than the continued feeding alternative for Cervus elaphus canadensis (Erxleben, 1777; elk) days on sensitive vegetation communities in winter (December–April) using the broad-scale resource selection function (RSF) for the full study area (elk days on communities of, A, Populus tremuloides Michx. [quaking aspen], B, Populus angustifolia E. James [narrowleaf cottonwood], and, C, Salix L. [willow]), and the fine-scale RSF for the National Elk Refuge (NER), Jackson, Wyoming, only (elk days on communities of, D, quaking aspen, E, narrowleaf cottonwood, and, F, willow). Higher values indicate better outcomes.
Lastly, we summarized the mean annual sums of these measurable attributes in the first and last years of the simulations to provide some additional context (table C2).
Table C2.
The mean sums and standard deviations of the five measurable attributes throughout the full study area in Jackson, Wyoming, in the first (year 1) and last (year 20) years of 100 simulations across the five feedground management alternatives.[“Number of abortions” are given in absolute values. All of the other metrics are reported in thousands of Cervus elaphus canadensis (Erxleben, 1777; elk) days. Sensitive vegetation communities consist of communities of Populus tremuloides Michx. (quaking aspen), Populus angustifolia E. James (narrowleaf cottonwood), and Salix L. (willow). The standard deviation is shown in parentheses after the mean sum for each metric. A higher standard deviation indicates greater variation across simulations, while a lower standard deviation indicates more similarity across simulations]
There was substantial variation among the 100 simulations when viewed at any given timestep across each alternative. However, an overall pattern was clear: measurable attributes associated with elk space-use decreased in time across all alternatives because of the projected declines in elk abundance from Cross and others (this volume, chap. B, 2025).
Summary
Cervus elaphus canadensis (Erxleben, 1777; elk) abundance was projected to decline during the 20-year period across the alternatives, including the continue feeding alternative. Depending on the alternative, most abundance changes resulted from disease effects, management actions taken to reduce feeding or elk abundance directly, or a combination of those factors (this volume, chap. A, Cook and others, 2025). The measurable attributes reflected human-elk conflicts on private property, including prospective elk-to-cattle brucellosis spillover risk and effects on sensitive vegetation communities in winter (December–April). These effects were projected to decrease when abundance declined, and in general, the magnitude of these effects in year 20 was roughly half of what was estimated in year 1. However, the exact numbers depend on the alternative. On average, the continue feeding alternative predicted the smallest elk population at the end of year 20 because of the high chronic wasting disease (CWD) mortality (this volume, chap. B, Cross and others, 2025). Continue feeding is also predicted to concentrate more elk at the National Elk Refuge (NER) compared to other alternatives, and the NER contained a relatively large proportion of core Populus tremuloides Michx. (quaking aspen) areas. As a result, continue feeding is projected to result in fewer elk days on private property and reduced brucellosis spillover risk to cattle, but more elk days on quaking aspen areas across the full study area and more elk days on sensitive vegetation communities in the NER. Although the continue feeding alternative had the lowest projection for cumulative risk of brucellosis transmission from elk to cattle, fully contextualizing this risk is difficult without putting the risk into economic terms, which required information that was unavailable at the time of this study; estimates of the cost of brucellosis spillover events to cattle producers in the Jackson Elk Herd Unit have not been documented. We predict differences among the alternatives of about 19–20 elk abortions on cattle properties over the full 20-year simulation period. However, brucellosis risk decreased over time under all alternatives (by roughly half) because elk numbers decreased. A constant seroprevalence rate was assumed, but if elk densities decrease as elk abundance decreases, then brucellosis seroprevalence may also be expected to decline. The total number of predicted elk abortions on winter cattle properties across the alternatives may be less than or nearly equal to historical elk abortion numbers, which did not result in reported cattle Brucella infections in the Jackson Elk Herd Unit.
A fraction of the Jackson elk herd migrates beyond the extent of the study area as defined in this analysis, typically onto adjacent public lands including Yellowstone National Park. Between May and November, 7–12 percent of the global positioning system (GPS) locations in our dataset fell outside the study area. These areas are beyond the authority of the cooperating agencies that contributed to the structured decision-making process, and for the purposes of calculating the measurable attributes in this analysis, only the number of elk days on private properties was likely affected by this decision. Whereas the number of elk days on private property was calculated across all months of the year, other attributes were limited to winter months. Calculation of the sensitive vegetation community measurable attributes was also spatially constrained to core elk winter range. By restricting the summer range, the summer use of private property inside the Jackson Elk Herd Unit was potentially overestimated, although this effect could be similar across alternatives. Thus, although the absolute numbers would change if the study area expanded, this change should not affect the relative ranking of the alternatives against one another.
The GPS data used in this modeling effort were originally collected for a variety of purposes and included mostly female elk captured on feedgrounds. Thus, incorporating expert knowledge was important in developing an appropriate and useful resource selection function (RSF), wherein the numbers of elk predicted in important areas generally match expert knowledge. We accommodated shifts in forage resources using monthly predictions, but forage may decline quickly in some areas where large numbers of elk transition, particularly in low forage years, potentially yielding subsequent movements. Although small areas in these monthly RSFs differ from known use patterns, these differences are consistent across alternatives and should minimally affect rankings across alternatives.
We incorporated as much model complexity as was allowable given our dataset. One limitation was the paucity of unfed-elk collar data, which is not surprising in a region where approximately 90 percent of the elk are fed during the winter (Wyoming Game and Fish Department [WGFD], 2022b) but also makes it challenging to predict what will happen without any feeding. Another limitation was the lack of feedback among models that approximated space-use and elk numbers. The elk CWD model informed our space-use models, but the results from the space-use models did not inform the elk CWD model. If the NER stops feeding elk and Bison bison (Linnaeus, 1758; bison) in winter, some redistribution of animals is expected. The details of that redistribution likely depend on factors not considered in the RSF, including the fidelity of individuals to seasonal ranges and shifting predator densities. For instance, an implicit assumption of habitat selection modeling is that future elk space-use will look like past elk space-use. Yet, the proportion of long-distance migrants in the Jackson elk herd decreased by approximately 40 percent over the 34-year period ending in 2012 (Cole and others, 2015). If this trend continues, we may be underestimating elk use of private properties across the 20-year simulations, and it is unclear how the feedground management alternatives may impact this declining trend in migration.
This chapter presents results based on all available GPS data from 287 female elk from 2006–23. From those GPS data, resource selection functions were estimated for fed and unfed elk across different management alternatives under severe and average winters at a 1,020-meter resolution on a monthly basis over 20 years (27 different predictive maps). We also did this on a 30-meter basis for NER-specific measurable attributes. Formal expert elicitation was used for those aspects that were not predictable given the available data and merged those with quantitative models while accounting for uncertainties. Finally, we summarized the results according to five measurable attributes representing the objectives of the NER. While there are areas for future improvement, these maps provide the best available information to decision-makers on this difficult management decision.
References Cited
Adams-Hosking, C., McBride, M.F., Baxter, G., Burgman, M., de Villiers, D., Kavanagh, R., Lawler, I., Lunney, D., Melzer, A., Menkhorst, P., Molsher, R., Moore, B.D., Phalen, D., Rhodes, J.R., Todd, C., Whisson, D., and McAlpine, C.A., 2016, Use of expert knowledge to elicit population trends for the koala (Phascolarctos cinereus): Diversity and Distributions, v. 22, no. 3, p. 249–262, accessed May 07, 2024, at https://doi.org/10.1111/ddi.12400.
Benson, J.F., 2013, Improving rigour [sic] and efficiency of use-availability habitat selection analyses with systematic estimation of availability: Methods in Ecology and Evolution, v. 4, no. 3, p. 244–251, accessed May 13, 2024, at https://doi.org/10.1111/2041-210x.12006.
Cogan, D., and Johnson, S., 2013, Final Report—Vegetation and non-vegetation cover type mapping for Teton County: Teton County Planning and Development Department website, accessed May 17, 2024, at https://jacksontetonplan.com/DocumentCenter/View/840/Cogan-D-and-S-Johnson-2013-Final-Report---Vegetation-Non-Vegetation-Cover-Type-Mapping-PDF.
Cogan, D., Varga, K., Kittel G., McCloskey K., Abendroth D., Gremer, J., and Bolen, C., 2005, Grand Teton National Park 2002–2005 Vegetation Mapping Project—Final Report: USGS-NPS Vegetation Mapping Program Technical Memorandum 8260-06–02, U.S. Department of the Interior Bureau of Reclamation, 87 p., accessed May 17, 2024, at https://irma.nps.gov/DataStore/DownloadFile/424496.
Cole, E.K., Foley, A.M., Warren, J.M., Smith, B.L., Dewey, S.R., Brimeyer, D.G., Fairbanks, W.S., Sawyer, H., and Cross, P.C., 2015, Changing migratory patterns in the Jackson elk herd: The Journal of Wildlife Management: v. 79, no. 6, p. 877–886, accessed July 18, 2023, at https://doi.org/10.1002/jwmg.917.
Cook, J.D., Cotterill, G.G., McEachran, M.C., Graves, T.A., Cole, E.K., and Cross, P.C., 2025, Decision framing overview and performance of management alternatives for bison and elk feedground management at the National Elk Refuge in Jackson, Wyoming, chap. A of Cook, J.D., and Cross, P.C., eds., Decision analysis in support of the National Elk Refuge bison and elk management plan: U.S. Geological Survey Scientific Investigations Report 2024–5119, 19 p., https://doi.org/10.3133/sir20245119A.
Cook, J.D., Cross, P.C., Tomaszewski, E.M., Cole, E.K., Grant, E.H.C., Wilder, J.M., and Runge, M.C., 2023, Evaluating management alternatives for Wyoming elk feedgrounds in consideration of chronic wasting disease (ver. 2.0, November 2023): U.S. Geological Survey Open-File Report 2023-1015, 50 p., accessed November 27, 2023, at https://doi.org/10.3133/ofr20231015.
Cook, T.L., 2005, Vegetation Mapping Inventory Project for Grand Teton National Park, 2003–2007: National Park Service, accessed November 15, 2023, at https://irma.nps.gov/DataStore/Reference/Profile/1047715.
Cotterill, G.G., and Graves, T.A., 2024, Supporting code for—Evaluating elk distribution and conflict under proposed management alternatives at the National Elk Refuge in Jackson, Wyoming: U.S. Geological Survey software release, at https://doi.org/10.5066/P14FF6E6.
Cross, P.C., Cook, J.D., and Cole, E.K., 2025, Predictions of elk and chronic wasting disease dynamics at the National Elk Refuge and surrounding areas in Jackson, Wyoming, and surrounding areas—chap. B of Cook, J.D., and Cross, P.C., eds., Decision analysis in support of the National Elk Refuge bison and elk management plan: U.S. Geological Survey Scientific Investigations Report 2024–5119, 22 p., https://doi.org/10.3133/sir20245119B.
Cross, P.C., Edwards, W.H., Scurlock, B.M., Maichak, E.J., and Rogerson, J.D., 2007, Effects of management and climate on elk brucellosis in the Greater Yellowstone Ecosystem: Ecological Applications, v. 17, no. 4, p. 957–964, accessed October 27, 2023, at https://doi.org/10.1890/06-1603.
Cross, P.C., Maichak, E.J., Rogerson, J.D., Irvine, K.M., Jones, J.D., Heisey, D.M., Edwards, W.H., and Scurlock, B.M., 2015, Estimating the phenology of elk brucellosis transmission with hierarchical models of cause-specific and baseline hazards: The Journal of Wildlife Management, v. 79, no. 5, p. 739–748, accessed March 6, 2024, at https://doi.org/10.1002/jwmg.883.
Cross, P.C., Tomaszewski, E.M., and Cook, J.D., 2023, Simulating chronic wasting disease on Wyoming elk feedgrounds (ver. 2.0): U.S. Geological Survey software release, accessed May 14, 2024, at https://doi.org/10.5066/P9R7XWO1.
Dewitz, J., and U.S. Geological Survey, 2021, National Land Cover Database (NLCD) 2019 Products (ver. 2.0, June 2021): U.S. Geological Survey data release, accessed May 14, 2024, at https://doi.org/10.5066/P9KZCM54.
Edmunds, D.R., Kauffman, M.J., Schumaker, B.A., Lindzey, F.G., Cook, W.E., Kreeger, T.J., Grogan, R.G., and Cornish, T.E., 2016, Chronic wasting disease drives population decline of white-tailed deer: PLoS One, v. 11, no. 8, article e0161127, 19 p., accessed December 29, 2022, at https://doi.org/10.1371/journal.pone.0161127.
Franson, J.C., and Smith, B.L., 1988, Septicemic pasteurellosis in elk (Cervus elaphus) on the United States National Elk Refuge, Wyoming: Journal of Wildlife Diseases, v. 24, no. 4, p. 715–717, accessed April 30, 2024, at https://doi.org/10.7589/0090-3558-24.4.715.
Galloway, N.L., Monello, R.J., Brimeyer, D., Cole, E.K., and Hobbs, N.T., (2017). Model forecasting of the impacts of chronic wasting disease on the Jackson elk herd: U.S. Fish and Wildlife Service Technical Report, 32 p., accessed March 1, 2023, at https://doi.org/10.13140/RG.2.2.20082.91842.
Janousek, W.M., Graves, T.A., Berman, E.E., Chong, G.W., Cole, E.K., Dewey, S.R., Johnston, A.N., and Cross, P.C., 2021, Human activities and weather drive contact rates of wintering elk: Journal of Applied Ecology, v. 58, no. 3, p. 667–676, accessed January 13, 2023, at https://doi.org/10.1111/1365-2664.13818.
Johnson, C.J., Nielsen, S.E., Merrill, E.H., McDonald, T.L., and Boyce, M.S., 2006, Resource selection functions based on use-availability data—Theoretical motivation and evaluation methods: The Journal of Wildlife Management, v. 70, no. 2, p. 347–357, accessed January 22, 2024, at https://doi.org/10.2193/0022-541X(2006)70[347:RSFBOU]2.0.CO;2.
Lowrey, B., DeVoe, J.D., Proffitt, K.M., and Garrott, R.A., 2021, Behavior-specific habitat models as a tool to inform ungulate restoration: Ecosphere, v. 12, no. 8, article e03687, 21 p., accessed May 13, 2024, at https://doi.org/10.1002/ecs2.3687.
Maloney, M., 2020, Simulation input files: figshare, accessed December 7, 2023, at https://doi.org/10.6084/m9.figshare.11862810.v1.
Maloney, M., Merkle, J.A., Aadland, D., Peck, D., Horan, R.D., Monteith, K.L., Winslow, T., Logan, J., Finnoff, D., Sims, C., and Schumaker, B., 2020, Chronic wasting disease undermines efforts to control the spread of brucellosis in the Greater Yellowstone Ecosystem: Ecological Applications, v. 30, no. 6, article e02129, 13 p., accessed December 7, 2023, at https://doi.org/10.1002/eap.2129.
Martin, T.G., Burgman, M.A., Fidler, F., Kuhnert, P.M., Low-Choy, S., McBride, M., and Mengersen, K., 2012, Eliciting expert knowledge in conservation science: Conservation Biology, v. 26, no. 1, p. 29–38, accessed May 7, 2024, at https://doi.org/10.1111/j.1523-1739.2011.01806.x.
Miller, M.W., Williams, E.S., Hobbs, N.T., and Wolfe, L.L., 2004, Environmental sources of prion transmission in mule deer: Emerging Infectious Diseases, v. 10, no. 6, p. 1003–1006, accessed April 30, 2024, at https://doi.org/10.3201/eid1006.040010.
National Aeronautics and Space Administration Jet Propulsion Laboratory [NASA JPL], 2013, NASA shuttle radar topography mission global 1 arc second: NASA EOSDIS Land Processes Distributed Active Archive Center [dataset], accessed May 14, 2024, at https://doi.org/10.5067/MEASURES/SRTM/SRTMGL1.003.
U.S. Fish and Wildlife Service [FWS], 2019, Bison and Elk Management Step-down Plan—A structured framework for reducing reliance on supplemental winter feeding, National Elk Refuge, Grand Teton National Park, Wyoming: U.S. Department of the Interior, U.S. Fish and Wildlife Service, National Park Service, 46 p., accessed May 13, 2024, at https://www.fws.gov/media/step-down-plan-and-addendum-30-national-elk-refuge.
U.S. Fish and Wildlife Service and National Park Service, 2007, Bison and Elk Management Plan—National Elk Refuge, Grand Teton National Park: U.S. Fish and Wildlife Service Plan and Environmental Impact Statement, 238 p. [Also available at https://www.fws.gov/sites/default/files/documents/NER_BEMP_2007.pdf.]
Northrup, J.M., Hooten, M.B., Anderson, C.R., Jr., and Wittemyer, G., 2013, Practical guidance on characterizing availability in resource selection functions under a use–availability design: Ecology, v. 94, no. 7, p. 1456–1463, accessed January 29, 2024, at https://doi.org/10.1890/12-1688.1.
O’Hagan, A., Buck, C.E., Daneshkhah, A., Eiser, J.R., Garthwaite, P.H., Jenkinson, D.J., Oakley, J.E., and Rakow, T., 2006, Uncertain judgements—Eliciting experts’ probabilities: John Wiley & Sons, Ltd, accessed May 7, 2024, at https://doi.org/10.1002/0470033312.
Runge, M.C., Converse, S.J., and Lyons, J.E., 2011, Which uncertainty? Using expert elicitation and expected value of information to design an adaptive program: Biological Conservation, v. 144, no. 4, p. 1214–1223, accessed May 7, 2024, at https://doi.org/10.1016/j.biocon.2010.12.020.
Samuel, W.M., Welch, D.A., and Smith, B.L., 1991, Ectoparasites from elk (Cervus elaphus nelsoni) from Wyoming: Journal of Wildlife Diseases, v. 27, no. 3, p. 446–451, accessed April 30, 2024, at https://doi.org/10.7589/0090-3558-27.3.446.
Sargeant, G.A., Wild, M.A., Schroeder, G.M., Powers, J.G., and Galloway, N.L., 2021, Spatial network clustering reveals elk population structure and local variation in prevalence of chronic wasting disease: Ecosphere, v. 12, no. 12, article e03781, 16 p., accessed August 20, 2024, at https://doi.org/10.1002/ecs2.3781.
Speirs-Bridge, A., Fidler, F., McBride, M., Flander, L., Cumming, G., and Burgman, M., 2010, Reducing overconfidence in the interval judgments of experts: Risk Analysis, v. 30, no. 3, p. 512–523, accessed May 7, 2024, at https://doi.org/10.1111/j.1539-6924.2009.01337.x.
Teton County, Wyoming, 2023, Teton County GIS Hub [ownership]: Teton County GIS Hub website, accessed October 6, 2023, at https://gis.tetoncountywy.gov/portal/apps/sites/#/teton-county-gis-hub.
Thornton, M.M., Shrestha, R., Wei, Y., Thornton, P.E., and Kao, S-C., 2022, Daymet—Daily surface weather data on a 1-km grid for North America (version 4 R1) [Minimum air temperature, 2016–2023, minimum January values]: Oak Ridge, Tennessee, ORNL DAAC, accessed May 14, 2024, at https://doi.org/10.3334/ORNLDAAC/2129.
Warton, D.I., and Shepherd, L.C., 2010, Poisson point process models solve the “pseudo-absence problem” for presence-only data in ecology: The Annals of Applied Statistics, v. 4, no. 3, p. 1383–1402, accessed May 13, 2024, at https://doi.org/10.1214/10-AOAS331.
Wyoming Game and Fish Department [WGFD], 2022a, 2022 antelope, deer, and elk hunting regulations: Wyoming Game and Fish Department, accessed November 13, 2024, at https://www.nxtbook.com/wyominggame/Regulations/2021Regs/index.php.
Wyoming Game and Fish Department [WGFD], 2022b, Big game job completion report—2022 Jackson region report: Wyoming Game and Fish Department website, accessed May 8, 2024, at https://wgfd.wyo.gov/media/29386/download?inline.
Yan, D., Wang, K., Qin, T., Weng, B., Wang, H., Bi, W., Li, X., Li, M., Lv, Z., Liu, F., He, S., Ma, J., Shen, Z., Wang, J., Bai, H., Man, Z., Sun, C., Liu, M., Shi, X., Jing, L., Sun, R., Cao, S., Hao, C., Wang, L., Pei, M., Dorjsuren, B., Gedefaw, M., Girma, A., and Abiyu, A., 2019, A data set of global river networks and corresponding water resources zones divisions: Scientific Data, v. 6, no. 219, 11 p., accessed September 11, 2023, at https://doi.org/10.1038/s41597-019-0243-y.
Appendix C1. Core Elk Winter Areas Defined by the Expert Panel
-
1. Of the elk that transition off [the] NER and onto a mix of conflict private land areas and winter range, we are interested to know what the “core area” of use is. We define core area as the area where 50 percent of the elk that transition off [the NER] will go (not to include State feedgrounds).
-
2. How confident are you that the polygon includes the core areas used by elk and excludes areas that are not used in years where feed is not provisioned?
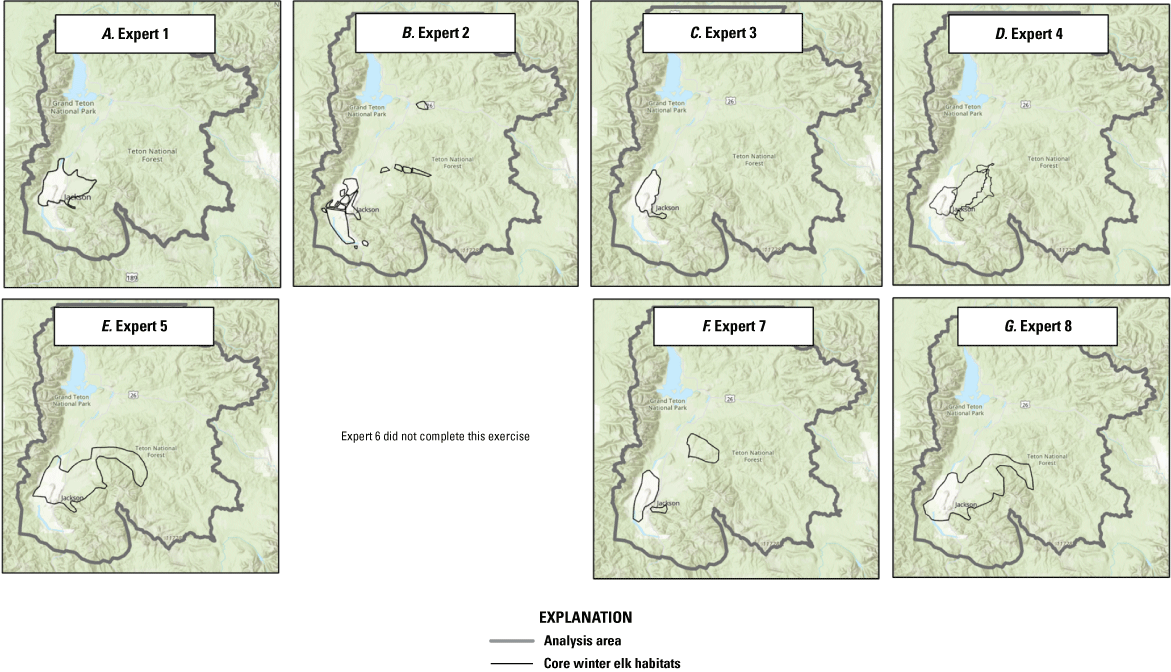
Maps showing the raw polygons drawn by experts depicting core winter Cervus elaphus canadensis (Erxleben, 1777; elk) habitats in the study area in Jackson, Wyoming, under no-feeding conditions (excluding a response from Expert 6, who did not complete the exercise).
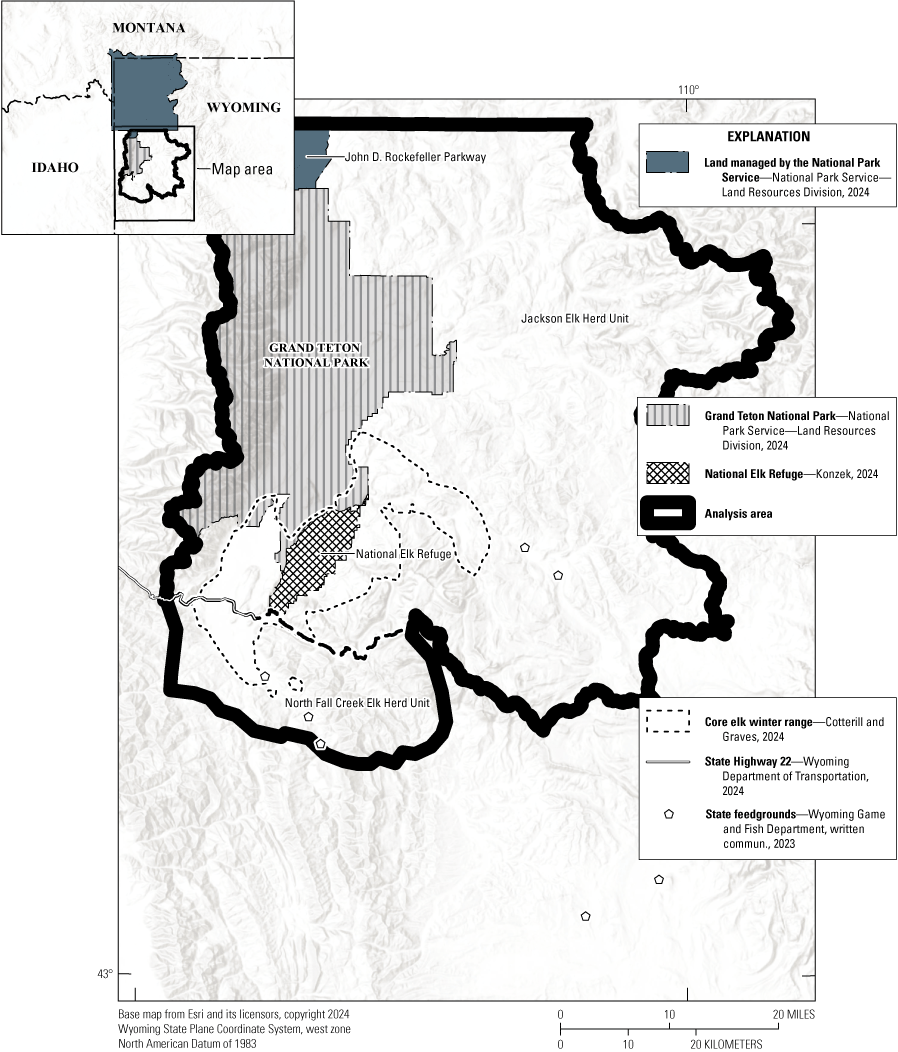
A map of the full study area that consists of two regions divided by State Highway 22: the Jackson Elk Herd Unit to the north and the Northern Fall Creek Elk Herd Unit to the south. The National Elk Refuge and State feedgrounds are shown in addition to the core Cervus elaphus canadensis (Erxleben, 1777; elk) winter range identified by experts as the core elk winter habitat.
References Cited
Cotterill, G.G., and Graves, T.A., 2024, Supporting code for—Evaluating elk distribution and conflict under proposed management alternatives at the National Elk Refuge in Jackson, Wyoming: U.S. Geological Survey software release, at https://doi.org/10.5066/P14FF6E6.
Konzek, D., 2024, FWS National realty tracts simplified: U.S. Fish and Wildlife Service, accessed August, 13, 2024, at https://gis-fws.opendata.arcgis.com/datasets/fws:fws-national-realty-tracts-simplified/about.
National Park Service—Land Resources Division, 2024, Administrative boundaries of National park system units—National geospatial data asset (NGDA) NPS National parks dataset: National Park Service, accessed August 13, 2024, at https://irma.nps.gov/DataStore/Reference/Profile/2224545?lnv=True.
Wyoming Department of Transportation, 2024, WYDOT roadway names SHP: Wyoming Department of Transportation web page, accessed February 7, 2024, at https://gis.wyoroad.info/data/.
Appendix C2. Predicted Elk Use of Winter Feedgrounds in the Northern Fall Creek Elk Herd Unit
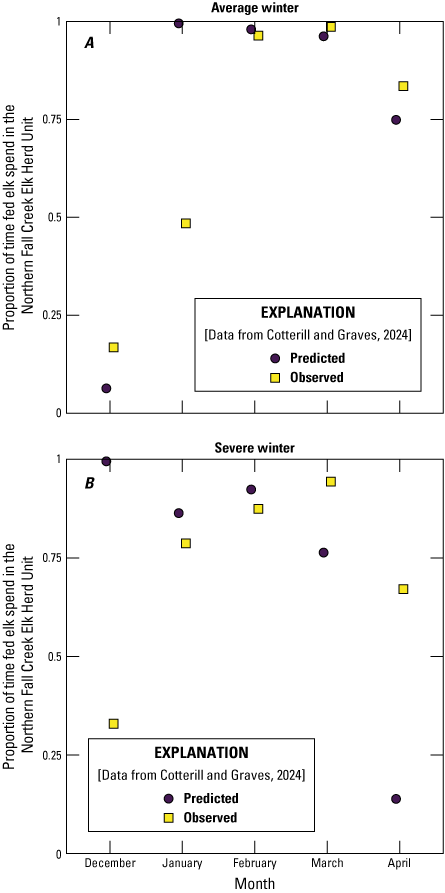
Symbol graphs showing the predicted and observed proportional use by fed Cervus elaphus canadensis (Erxleben, 1777; elk) for three State-run feedgrounds in the Northern Fall Creek Elk Herd Unit (NFCHU) during, A, average winters, and, B, severe winters. Winters are defined as December through April. Predicted values were the proportion of the NFCHU resource selection function probability of use occurring on feedgrounds, and observed values were the proportion of global positioning system (GPS) observations occurring on feedgrounds.
References Cited
Cotterill, G.G., and Graves, T.A., 2024, Supporting code for—Evaluating elk distribution and conflict under proposed management alternatives at the National Elk Refuge in Jackson, Wyoming: U.S. Geological Survey software release, at https://doi.org/10.5066/P14FF6E6.
Cross, P.C., Cook, J.D., and Cole, E.K., 2025, Predictions of elk and chronic wasting disease dynamics at the National Elk Refuge and surrounding areas in Jackson, Wyoming, and surrounding areas—chap. B of Cook, J.D., and Cross, P.C., eds., Decision analysis in support of the National Elk Refuge bison and elk management plan: U.S. Geological Survey Scientific Investigations Report 2024–5119, 22 p., https://doi.org/10.3133/sir20245119B.
Appendix C3. Adjusted Use Predictions for Jackson Elk Attending State-Run Feedgrounds in the Gros Ventre River Drainage or in the Native Winter Range
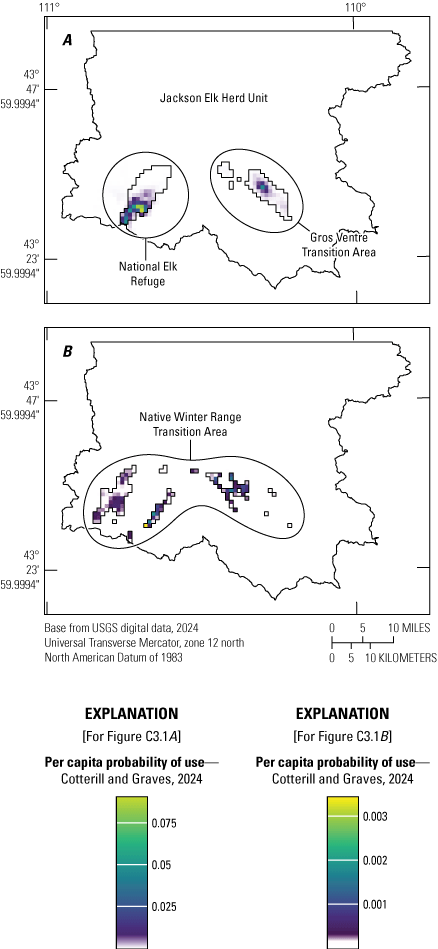
Maps showing areas of likely February Cervus elaphus canadensis (Erxleben, 1777; elk) space-use identified through the resource selection function for transitioning fed elk off the National Elk Refuge (NER) according to expert predictions under no-feeding conditions at the NER. Areas of likely elk space-use include, A, the NER and Gros Ventre Transition Area, or, B, the Native Winter Range Transition Area. Original values for the per capita probability of use from the resource selection function are shown.
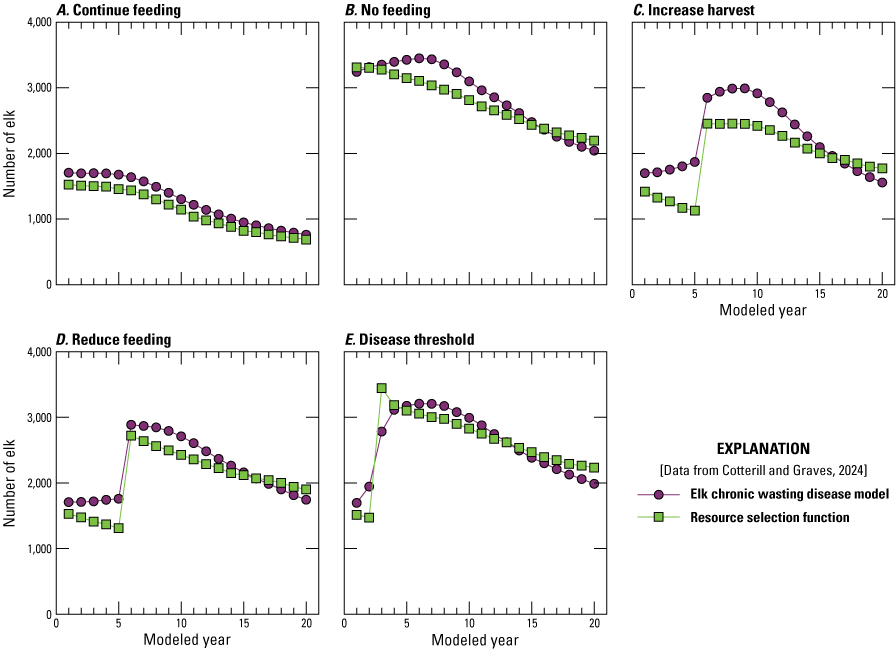
Line graphs comparing the numbers of Cervus elaphus canadensis (Erxleben, 1777; elk) using the State-run feedgrounds in the Gros Ventre River drainage in February during 20 modeled years under the following feedground management alternatives: A, continue feeding, B, no feeding, C, increase harvest, D, reduce feeding, and, E, disease threshold. The disease simulation model for elk chronic wasting disease (CWD) predicts the average February numbers for Gros Ventre elk (a population segment of the Jackson elk herd in Cross and others [this volume, chap. B, 2025]) across all simulations. The resource selection function (RSF) numbers predict the average February numbers of elk inside the Gros Ventre Transition Area. Average February numbers are calculated from 100 simulations for each year, but figure C3.2 also shows 20 years of predictions for each alternative.
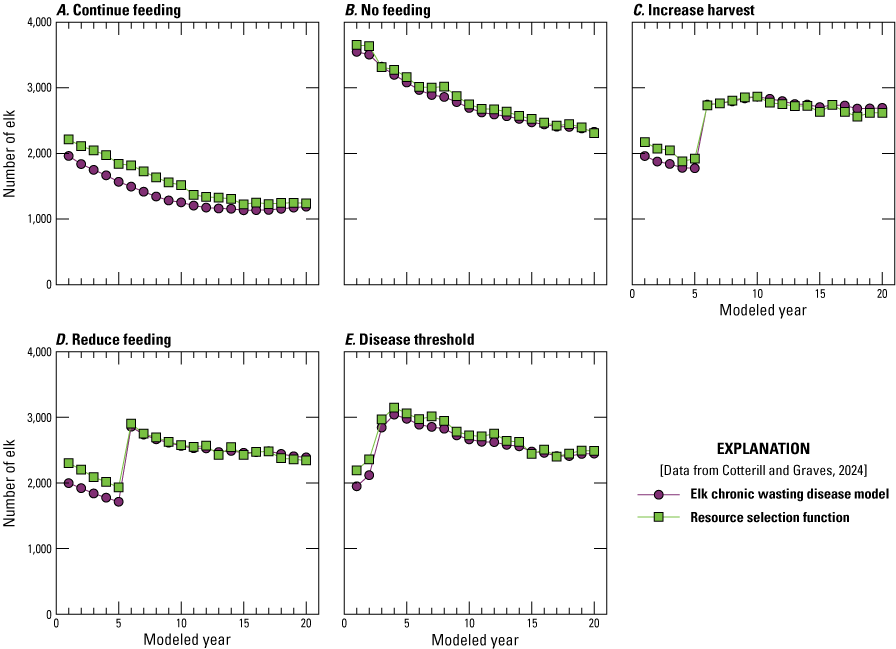
Line graphs comparing the predicted numbers of Cervus elaphus canadensis (Erxleben, 1777; elk) inside the Jackson Elk Herd Unit using all areas outside of the National Elk Refuge (NER) and the Gros Ventre Transition Area (GVTA) in February across 20 modeled years under the following feedground management alternatives: A, continue feeding, B, no feeding, C, increase harvest, D, reduce feeding, and, E, disease threshold. The disease simulation model for elk chronic wasting disease (CWD) predicts the average February numbers for the unfed portion of the Jackson elk herd across all simulations, and the resource selection function (RSF) numbers predict the average February numbers of Jackson Elk Herd Unit elk outside of the NER and the GVTA. Average February numbers are calculated from 100 simulations for each year, but figure C3.3 also shows 20 years of predictions for each alternative.
References Cited
Cotterill, G.G., and Graves, T.A., 2024, Supporting code for—Evaluating elk distribution and conflict under proposed management alternatives at the National Elk Refuge in Jackson, Wyoming: U.S. Geological Survey software release, at https://doi.org/10.5066/P14FF6E6.
Cross, P.C., Cook, J.D., and Cole, E.K., 2025, Predictions of elk and chronic wasting disease dynamics at the National Elk Refuge and surrounding areas in Jackson, Wyoming, and surrounding areas—chap. B of Cook, J.D., and Cross, P.C., eds., Decision analysis in support of the National Elk Refuge bison and elk management plan: U.S. Geological Survey Scientific Investigations Report 2024–5119, 22 p., https://doi.org/10.3133/sir20245119B.
Appendix C4. Elk Summer Predictive Maps from the Broad-Scale Resource Selection Function
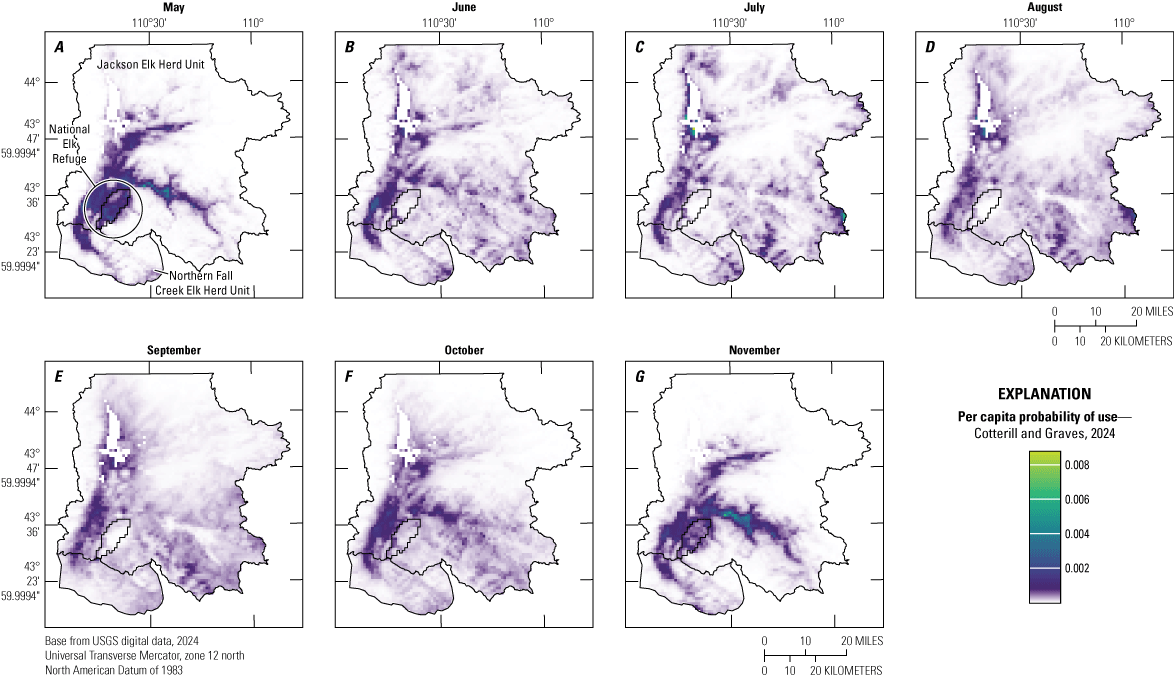
Maps showing the per capita probability of use by Cervus elaphus canadensis (Erxleben, 1777; elk) in the study area during summer months (May–November). The study area comprises two regions divided by State Highway 22. These regions are the Jackson Elk Herd Unit to the north and the Northern Fall Creek Elk Herd Unit to the south.
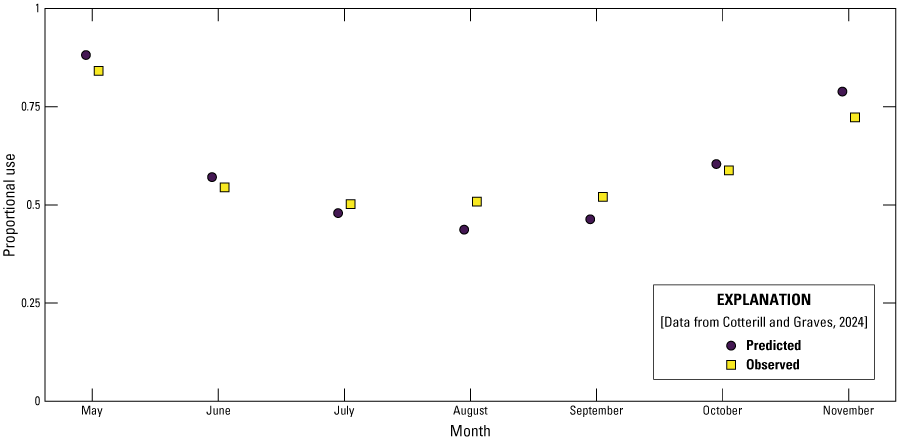
Symbol graph showing the proportions of Cervus elaphus canadensis (Erxleben, 1777; elk) using areas below 2,400 meters (7,874 feet) in elevation across the study area between May and November. The predicted proportions are calculated from the broad-scale resource selection function (RSF), and the observed proportions are calculated from the elk global positioning system collar data.
Reference Cited
Cotterill, G.G., and Graves, T.A., 2024, Supporting code for—Evaluating elk distribution and conflict under proposed management alternatives at the National Elk Refuge in Jackson, Wyoming: U.S. Geological Survey software release, at https://doi.org/10.5066/P14FF6E6.
Appendix C5. Elk Predictive Maps from the National Elk Refuge Winter Resource Selection Function
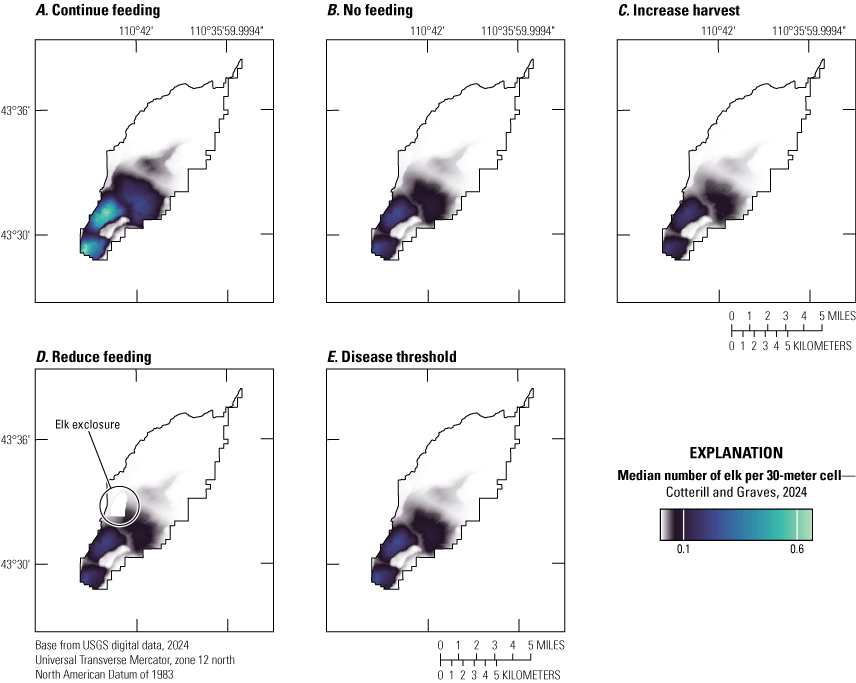
Maps showing the median number of Cervus elaphus canadensis (Erxleben, 1777; elk) predicted per 30-meter cell on the National Elk Refuge in February of the sixth simulation year (the first year after feed-cessation under the increase harvest and reduce feeding alternatives) for the following feedground management alternatives: A, continue feeding, B, no feeding, C, increase harvest, D, reduce feeding, and, E, disease threshold. The reduce feeding alternative also included proposed elk exclosures.
Reference Cited
Cotterill, G.G., and Graves, T.A., 2024, Supporting code for—Evaluating elk distribution and conflict under proposed management alternatives at the National Elk Refuge in Jackson, Wyoming: U.S. Geological Survey software release, at https://doi.org/10.5066/P14FF6E6.
Appendix C6. Near-Term Rankings (5 years) of Measurable Attributes
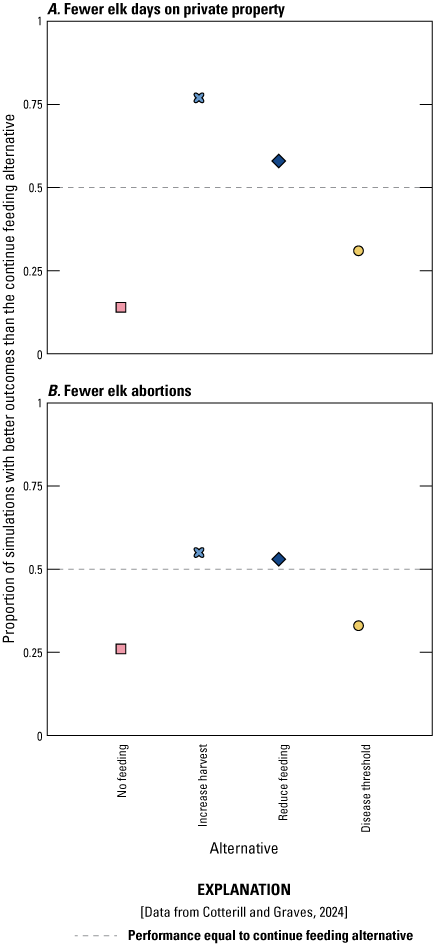
Plots showing the proportion of 100 simulations in which the other feedground management alternatives were projected to yield better outcomes compared to the continue feeding alternative in terms of, A, the projected number of Cervus elaphus canadensis (Erxleben, 1777; elk) days on private property and, B, the brucellosis risk to cattle during the first 5 years following implementation of the feedground management alternatives. Higher values indicate better outcomes.
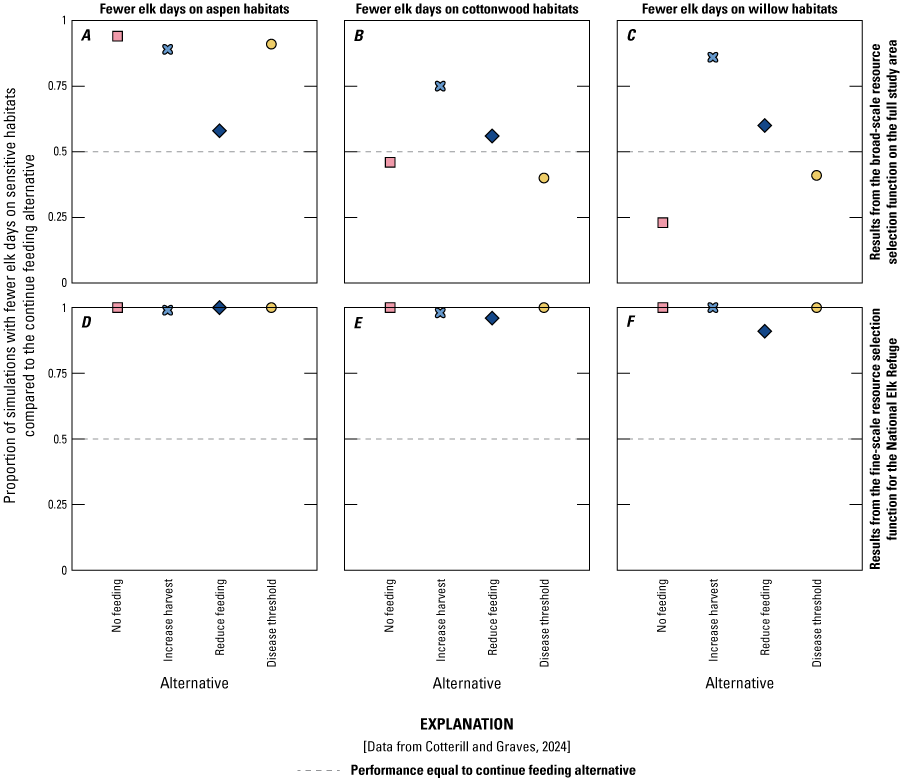
Plots showing the proportion of 100 simulations in which the other feedground management alternatives were projected to yield better outcomes compared to the continue feeding alternative in terms of Cervus elaphus canadensis (Erxleben, 1777; elk) affecting sensitive vegetation communities December–April using, A, the broad-scale resource selection function (RSF) for the full study area (elk days on communities of, A, Populus tremuloides Michx. [quaking aspen]; B, Populus angustifolia E. James [narrowleaf cottonwood]; and, C, Salix L. [willow]) and the fine-scale RSF for the National Elk Refuge (NER) in Jackson, Wyoming, only (elk days on communities of, D, quaking aspen, E, narrowleaf cottonwood, and, F, willow). These projections are for the first 5 years following implementation of the feedground management alternatives. Higher values indicate better outcomes.
Reference Cited
Cotterill, G.G., and Graves, T.A., 2024, Supporting code for—Evaluating elk distribution and conflict under proposed management alternatives at the National Elk Refuge in Jackson, Wyoming: U.S. Geological Survey software release, at https://doi.org/10.5066/P14FF6E6.
Datums
Vertical coordinate information is referenced to the North American Vertical Datum of 1988 (NAVD 88).
Horizontal coordinate information is referenced to the North American Datum of 1983 (NAD 83).
Supplemental Information
Elk global positioning system (GPS) collar data from the National Park Service, U.S. Fish and Wildlife Service, and Wyoming Game and Fish Department come from sources as cited. At the time of writing, not all reports from these agencies were available online; for elk GPS collar data from nonpublic documents, contact the respective agency. Likewise, not all vegetation type data from the U.S. Fish and Wildlife Services and U.S. Department of Agriculture Forest Service were available online; for vegetation type data from nonpublic documents, contact the respective agency.
Abbreviations
CWD
chronic wasting disease
FWS
U.S. Fish and Wildlife Service
GIS
geographic information system
GPS
global positioning system
GVTA
Gros Ventre Transition Area
JHU
Jackson Elk Herd Unit
NER
National Elk Refuge
NFCHU
Northern Fall Creek Elk Herd Unit
NWRTA
Native Winter Range Transition Area
RSF
resource selection function
SDM
structured decision-making
WGFD
Wyoming Game and Fish Department
WSMET
Wildlife Subject Matter Expert Team
For more information concerning the research in this report, contact:
Center Director, USGS Northern Rocky Mountain Science Center
2327 University Way, Suite 2
Bozeman, MT 59715
Or visit the Northern Rocky Mountain Science Center website at
Publishing support provided by the Science Publishing Network,
Denver and Baltimore Publishing Service Centers.
Disclaimers
Any use of trade, firm, or product names is for descriptive purposes only and does not imply endorsement by the U.S. Government.
Although this information product, for the most part, is in the public domain, it also may contain copyrighted materials as noted in the text. Permission to reproduce copyrighted items must be secured from the copyright owner.
Suggested Citation
Cotterill, G.G., Cross, P.C., Cole, E.K., Cook, J.D., McEachran, M.C., and Graves, T.A., 2025, Evaluating elk distribution and conflict under proposed management alternatives at the National Elk Refuge in Jackson, Wyoming, chap. C of Cook, J.D., and Cross, P.C., eds., Decision analysis in support of the National Elk Refuge bison and elk management plan: U.S. Geological Survey Scientific Investigations Report 2024–5119, 32 p., https://doi.org/10.3133/sir20245119C.
ISSN: 2328-0328 (online)
Study Area
| Publication type | Report |
|---|---|
| Publication Subtype | USGS Numbered Series |
| Title | Evaluating elk distribution and conflict under proposed management alternatives at the National Elk Refuge in Jackson, Wyoming |
| Series title | Scientific Investigations Report |
| Series number | 2024-5119 |
| Chapter | C |
| DOI | 10.3133/sir20245119C |
| Publication Date | January 08, 2025 |
| Year Published | 2025 |
| Language | English |
| Publisher | U.S. Geological Survey |
| Publisher location | Reston, VA |
| Contributing office(s) | Northern Rocky Mountain Science Center |
| Description | Report: vii, 32 p.; Software Release |
| Country | United States |
| State | Wyoming |
| City | Jackson |
| Other Geospatial | National Elk Refuge |
| Online Only (Y/N) | Y |
| Additional Online Files (Y/N) | N |


