

Bison Population Dynamics, Harvest, and Human Conflict Potential Under Feedground Management Alternatives at the National Elk Refuge in Jackson, Wyoming
Links
- Document: Report (5.02 MB pdf) , HTML , XML
- Larger Work: This publication is Chapter D of Decision analysis in support of the National Elk Refuge bison and elk management plan
- Software Release: USGS software release - Jackson bison population projections
- Superseding Publications:
- Download citation as: RIS | Dublin Core
Acknowledgments
We thank the National Park Service, U.S. Fish and Wildlife Service, and Wyoming Game and Fish Department for sharing data, expertise, and time in developing the models described in this work. Additional thanks to a team of expert panelists from the National Park Service, U.S. Fish and Wildlife Service, and Wyoming Game and Fish Department who provided their expert judgment on questions surrounding bison survival and distribution under unfed management alternatives. This manuscript and supporting software were greatly improved because of reviews by Graziella DiRenzo, Matthew Gonnerman, and Jeffrey Hostetler prior to publication. The work by Margaret McEachran was done while serving as a visiting scientist with the U.S. Geological Survey.
Abstract
Bison bison (Linnaeus, 1758; American bison) were once abundant across North America but declined due to overharvesting in the late 1800s. The reintroduced population in and around Jackson, Wyoming has averaged 485 individuals between 2018–2023 and is the subject of a planning process to inform management strategies that will guide the U.S. Fish and Wildlife’s next “Bison and Elk Management Plan” for the National Elk Refuge. This small population may benefit from historical winter-feeding operations on the National Elk Refuge because those operations may increase overwinter survival and limit human-bison conflicts, which are the number of individual bison that engage in nuisance, damaging, or otherwise aggressive behaviors with humans and livestock, that may lead to culling and other sources of mortality (for example, vehicle collisions). To inform the next “Bison and Elk Management Plan,” the U.S. Geological Survey used a population model to evaluate five management alternatives for bison and Cervus elaphus canadensis (Erxleben, 1777; elk) feedground operations that included continuing the elk and bison feeding program, immediately stopping the feeding program, and three other alternatives that would phase out the feeding program after a period of time. The results indicate that the bison population would be expected to decline over the next 20 years under all alternatives that stop feeding bison on the refuge. Further, this decline would lead to an associated reduction in bison harvest opportunities for resident, nonresident, and Tribal hunters. Finally, human-bison conflicts would also be expected to increase under the no feeding alternatives because bison may venture onto private lands in greater numbers if feed is not provisioned during winter months. In combination, these results suggest that feeding may lead to better outcomes for bison over the next 20 years; however, these effects may be traded off against other downsides of the feedground program, such as increased rates of animal-to-animal contact on feedgrounds that can lead to disease transmission.
Introduction
Bison bison (Linnaeus, 1758; American bison) were once abundant and widespread across large extents of North America (Jones and others, 2020). The population that inhabited areas in and around Yellowstone National Park (fig. D1) was nearly extirpated by the mid-1880s and was lost from Jackson Hole, Wyoming. Bison were subsequently reintroduced into the Jackson region when 20 individuals were relocated from Yellowstone to an enclosure at Jackson Hole Wildlife Park in 1948 (U.S. Fish and Wildlife Service [FWS], 2019). The enclosed bison were supplemented with other bison from Theodore Roosevelt National Park after the discovery of brucellosis led to culling of the original herd. Then, in 1968 11 adults and 4–5 calves escaped and began ranging freely throughout the region, including seasonal movements to habitats on Grand Teton National Park (GTNP), the National Elk Refuge (NER), and other surrounding public and private lands. The escaped bison founded a free-ranging herd that initially remained at low abundance (less than 40 individuals). However, following the discovery of supplemental food provisioned to Cervus elaphus canadensis (Erxleben, 1777; elk) on the NER, the population grew by 10–14 percent annually starting in the 1980s (FWS and National Park Service [NPS], 2007). Winter counts in 2007 estimated a population high of 1,059 individuals; a more recent mid-winter count in 2023 estimated 514 individuals (WGFD, 2023).
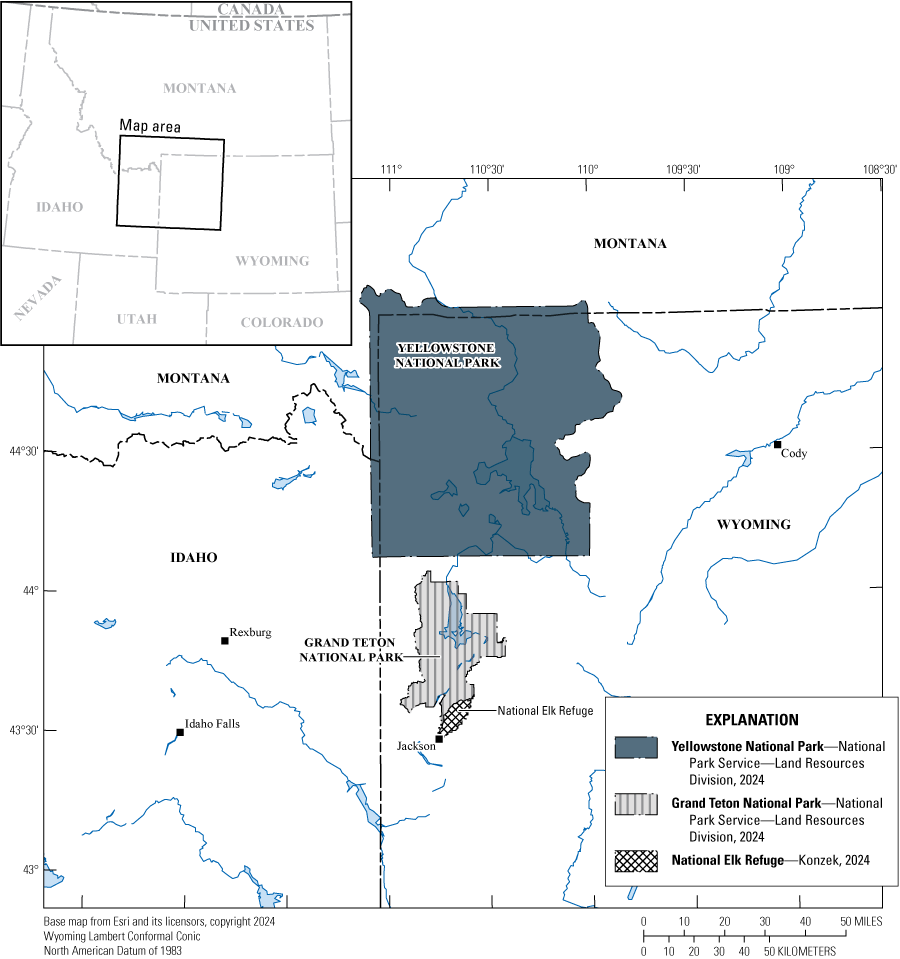
Map showing the boundaries of Yellowstone National Park, Grand Teton National Park, and the National Elk Refuge—the areas used by bison in the Greater Yellowstone Ecosystem, Wyoming.
While the larger population size has conveyed certain advantages to the Jackson bison herd, it has also led to some negative aspects related to human-bison conflicts and overgrazing on sensitive habitats. For example, larger bison populations are more resilient to random events and genetic effects, including bottlenecks (drastic population reduction) and drift (random gene variant fluctuations) that are a concern for bison in this population because of their low genetic diversity (Hartway and others, 2020). Larger populations likewise increase opportunities for wildlife viewing and photography, harvest by resident and nonresident Wyoming hunters, and Tribal ceremonial and subsistence take. However, this larger bison population has damaged native grasslands and other habitats from overgrazing, competed with elk for critical resources, elevated disease transmission risk from bison to domestic livestock, and increased costs to natural resource agencies associated with bison management. Thus, successful bison management may require balancing the positive aspects of larger populations while limiting the effects of overabundance on sensitive habitats and human-bison conflicts.
Managing bison and associated conflicts falls under the authority of land management agencies, FWS, NPS, and state agencies tasked with managing wildlife and livestock, including the Wyoming Game and Fish Department (WGFD) and the Wyoming Livestock Board. Under their management authority, FWS is evaluating a range of management alternatives for bison and elk on the NER as part of their next “Bison and Elk Management Plan.” Currently, FWS provisions supplemental food to bison and elk during winter months to increase individual survival and reduce the potential for bison-elk and human-bison conflicts (FWS, 2019). The feeding program mainly operates between January and April of each year, depending on forage production and availability, and is guided by the “Step-Down Bison and Elk Management Plan” (FWS, 2019), which intends to reduce the reliance of bison and elk on winter feeding.
The alternatives under consideration for the next “Bison and Elk Management Plan” for the NER could alter feedground operations and replace the existing management (FWS and NPS, 2007) and step-down (FWS, 2019) plans. The alternatives were developed by FWS to evaluate changes to elk winter feeding in response to a recent detection of chronic wasting disease (CWD) in elk and concern that CWD could spread faster in elk in feedground settings (Cook and others, 2023). While bison are not susceptible to CWD, changes to winter feeding activities could change bison abundance, bison harvest, and the location and number of human-bison conflicts. This report details the development of a sex- and age-structured matrix model that uses empirical data and expert judgment to evaluate a set of proposed management alternatives and provide numeric estimates for objectives associated with bison abundance, bison harvest, and human-bison conflict potential over time and after 20 years of implementation (Cook and others, 2025b, this volume, chap. D). The results will inform an Environmental Impact Statement and assist managers in selecting an alternative that best meets management priorities and mandates on the NER.
Methods
We adapted an existing sex- and age-structured matrix model that was previously used to model other ungulate population dynamics and used it to evaluate alternatives in support of the NER “Bison and Elk Management Plan” (Cross and Almberg, 2019; Cook and others, 2023; Cross and others, 2023). The work to adapt the model proceeded in close collaboration with a wildlife subject matter expert team (WSMET) of 13 individuals with expertise in bison ecology and wildlife management principles. The team helped describe the expected changes to bison space use and population dynamics, the potential response of management agencies to bison populations, and also provided data that were then developed into quantitative relationships. To inform parameter values, published literature and expert elicitation were used to estimate vital (population change) rates, harvest statistics, and other parameters. For expert elicitation, we used a modified Delphi and IDEA (“Investigate, Discuss, Estimate, Aggregate”) protocol with six science expert panelists who hold specialized knowledge about the parameters of interest (Hanea and others 2017); this group (herein referred to as ‘experts', ‘expert panel’, or ‘expert panelist(s)’) was considered separate from the WSMET but did include five common members.
To initiate the model, historical bison herd counts and simulated bison population performance were incorporated with relevant sources of structural and parametric uncertainty identified by a scientific expert panel. For each alternative, we ran 1,000 projections while randomly sampling from the parametric uncertainty defined by the distribution for each parameter in each simulation. We then used the model to predict abundance, harvest, and winter movement dynamics of bison on and off the NER and under the management alternatives. In the following sections, we describe our methods, including the model structure, incorporation of alternatives, parameter estimation methods, and initial conditions.
Model Structure
The matrix model included five distinct sex and age classes chosen to represent demographic groupings that experience different vital and harvest rates within the Jackson bison herd. Those classes included (1) calves (0–1 years old) of both sexes, (2) male yearlings (1–2 years old), (3) female yearlings, (4) adult (more than 2 years old) males, and (5) adult females. The maximum age that an individual could reach was 15 years of age, and we assumed that reproduction began at age 2. The model transitioned those sex and age classes through monthly time steps and important life history events, including births in the spring, harvest in the fall, and monthly natural survival.
In addition to these monthly transitions, we included the following three dynamics that affect population performance: (1) calf mortality as a function of winter feeding and winter conditions, (2) mortality for all sex and age classes in human-bison conflict situations (for example, bison vehicle collisions, bison on cattle lands), and (3) an adaptive harvest rate-setting process as a function of the overall population size during February counts.
For calf mortality in severe winters and under unfed conditions, we allowed for increased mortality from January to April. The increased mortality was a result of a lack of available forage and increased expenditure of fat reserves during times of high snowpack. The reduction in survival was only applied to the calf class based on conversations with the WSMET and only in a proportion of modeled years (oral commun., 2024). We assumed that each year had a 0.25 probability of being severe enough to cause excess calf mortality.
The other source of mortality, human-bison conflict, also occurred in winter months. To determine how many bison would experience conflict and mortality in the winter, we randomly assigned individual bison to one of the three following segments: (1) NER feedground, (2) native winter range, and (3) conflict bison population segments. The NER feedground bison were bison individuals that overwinter on NER, whereas the native winter range and conflict bison population segments overwinter off of NER either in areas with low conflict potential (native winter range segment), or in areas with high conflict potential (conflict segment). The conflict bison were expected to have increased use of private lands where negative interactions with local residents, livestock, and vehicles would occur, thus, we assumed that this segment was subjected to a higher monthly mortality rate. We determined the proportion of bison in each segment based on expert judgment and historical winter counts of bison on the NER and winter range. The feedground segment represented those individuals that overwinter on the NER (January–April in the model) in an average year and received most of their daily caloric intake by consuming provisioned food resources. The winter range segment consisted of individuals who did not overwinter on the NER feedgrounds but instead spent winter months on native winter ranges, including the northern and eastern areas of the GTNP (WSMET, oral commun., 2024). The final group, conflict bison, was assumed to either be at a low number when feedgrounds were operational or at a high number when feedground operations ceased (WSMET, oral commun., 2024). Under these unfed conditions, we assumed that the proportion of bison that used the NER (and expected to be fed) would split onto private lands if food were not provisioned. Further, we assumed that conflicts would be higher under severe winter conditions. Additional details on calf and conflict mortality are in the “Incorporating Alternatives” section.
For adaptive harvest, we allowed harvest rates of each sex and age class to be set annually according to the relationship between the February count and the Jackson bison herd objective of 500 total animals. The WGFD manages ungulates in Wyoming according to population objectives (± 20 percent), which consider available habitat, sustainable harvest opportunities, human-wildlife conflict, disease, and other factors. Population objectives are recommended by WGFD wildlife managers using biological and social considerations, undergo a public input process, and are decided by the Wyoming Game and Fish Commission (WGFD, 2024). The WGFD conducts population surveys annually and sets annual hunting seasons based on those surveys. The functional relationship of the adaptive harvest within the model, therefore, allowed for higher annual harvest rates in years when bison populations were large relative to the objective and lower rates when populations were small relative to the objective. If populations fell 20 percent below the objective (for example, February counts below 400 individuals), then the harvest rate was set to 0.01 to approximate only the continuation of Tribal harvests during those years. In the past, five bison per year have been harvested by the Shoshone-Bannock Tribes of Eastern Idaho, but recently, the Eastern Shoshone Tribe of the Wind River Reservation has also participated. We calibrated the relationship between the harvest and the objective based on historical data from the WGFD (unpub. data, 2024; calibrated data shown in app. D1).
Incorporating Alternatives
The specific set of management alternatives considered here was described by FWS and included these five options (for full details, including the connection with elk population size, please refer to Cook and others, 2025a, this volume, chap. A):
-
1. Continue feeding.—The NER will continue to provision food to bison and elk during winter months based on forage availability and number of conflicts.
-
2. No feeding.—The NER will immediately stop provisioning food to bison and elk during winter months.
-
3. Increased elk harvest, then stop feeding.—The NER will continue to provision food to bison and elk during winter months for the next 5 years, during which time the NER will work with the WGFD to increase elk harvest and attempt to reduce elk population size to 5,000.
-
4. Reduce feeding, then stop feeding altogether.—The NER will provision a reduced ration to elk during winter months for the next 5 years to reduce the elk population size to 5,000 prior to feedground closures. Exclosures will be designed to protect aspen stands in the south region of the NER and for willow and cottonwood north of the NER.
-
5. Feeding phaseout after 3 percent chronic wasting disease (CWD) prevalence.—The NER will continue to provision food to bison and elk during winter months until CWD sampling reveals 3 percent prevalence in the Jackson elk herd, at which point all feeding activities will cease on the NER. The timing of the 3 percent trigger (for example, years of feeding until this 3 percent disease threshold was reached) was informed based on estimates from Cross and others (2025, this volume, chap. B).
The performance metrics, or the measures that were used to evaluate the performance of each alternative on bison, were (1) the population size of bison in year 20, (2) the cumulative number of bison harvested across 20 years, and (3) the cumulative number of bison involved in human-bison conflict across 20 years. The FWS selected the 20-year projection period to match the typical plan implementation period before revisions are considered.
To project each of the alternatives, the model was altered to include the anticipated management strategy changes. For the continue feeding alternative, the basic structure of the population model was used, using historical data to split a single herd into two segments between the NER feedground and winter range segment during winter months. The adaptive harvest was also included to approximate the continue feeding harvest rate-setting process. The study assumed that under all alternatives the NER feedground and winter range segments experienced the same birth and natural mortality rates regardless of winter year type (that is, no excess mortality in severe winters during the years when feeding occurs on the NER). We expected that, under continue feeding, bison would locate supplemental food or other sources of forage even in severe winters because of the small population size in the Jackson region. Further, while harvest rates are likely different between NER and winter range segments, we only allowed for a single adaptive harvest rate to affect the entire population because of data limitations and challenges in including additional model complexities.
The proportion of bison in each population segment for a given year was estimated by fitting a beta distribution to the proportion of the bison population observed on the NER feedground in February from 2014–23 (table D1). The proportion of winter range bison was taken as one minus the proportion of bison counted on the feedground (table D1). In addition to the NER feedground and winter range segments, a low probability (0.015) of bison from either segment coming into human conflict each year was included after being approximated from Wyoming Department of Transportation Highway Safety Crash data (Wyoming Department of Transportation, written commun., 2023). This estimate is likely higher in reality because it does not include data collected in the GTNP. Further, the GTNP works to reduce human-bison conflicts by actively moving bison off of roadways during winter months.
Table D1.
Bison population counts, proportion fed, and harvest totals from 2014 through 2023 in the Jackson, Wyoming region.[Counts include bison on and off the NER feedground, summed total of the raw counts conducted in February, adjusted counts that account for the imperfect sightability of bison in unfed settings, the percent of bison on feed, and total harvest. — data were not yet available]
The four other alternatives that included variations on feed cessation on the NER were incorporated by adapting the model to include their respective mechanisms of change associated with winter habitat use changes of unfed elk and conflict potential. The adaptations were essentially the same across alternatives and primarily varied according to the timing of implementation. Under the no feeding alternative, model adaptations were triggered immediately (in other words, all modeled years), whereas under the increased harvest and reduced feeding alternatives, the changes occurred starting at the 5-year mark or after the disease threshold was met under the disease threshold alternative (in other words, 3 percent CWD prevalence detected in elk; Cross and others 2025, this volume, chap. B). Once feeding stopped (under no feeding, disease threshold, increased harvest, and reduced feeding alternatives), the changes to the model included the following conditions:
-
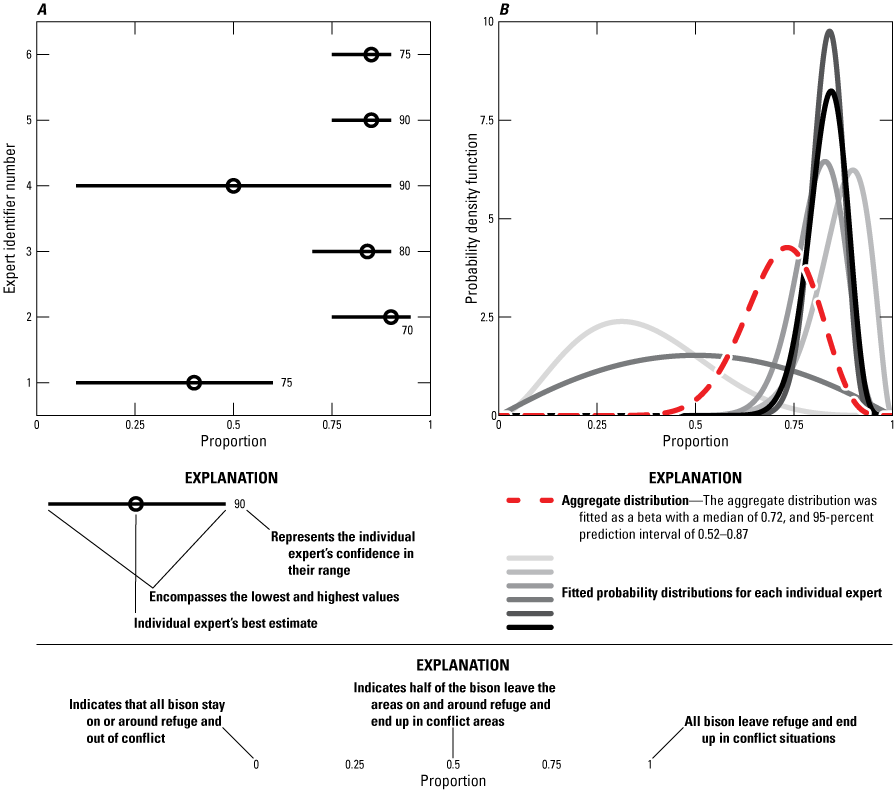
1. A larger proportion of the bison population transitioned to conflict situations during unfed winter months. This conflict population segment came from the proportion of bison that transitioned to the NER feedgrounds but were then not provisioned any food. On average, in the first year after the feedground program ended and in an average winter, 21 percent (95-percent prediction interval, 4 to 50 percent) of bison that returned to the NER for winter food provisions were expected to transition to conflict situations, whereas 79 percent of those bison would avoid conflict. The previously described winter range segment remained in place as part of the four no feeding alternatives.
-
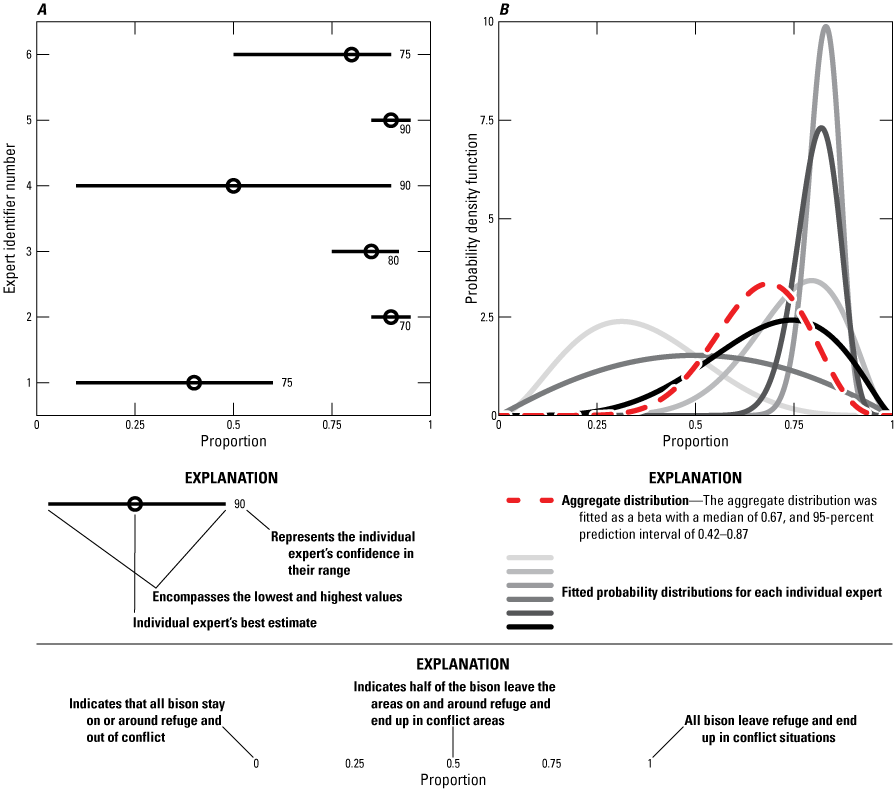
2. We estimated that more previously fed bison would transition to conflict situations during severe winter conditions. In contrast to the percentage of conflict bison in the first year of no feeding in an average winter (21 percent, on average), the aggregate estimate for conflict bison in severe winters was 48 percent (95-percent prediction interval, 19 to 79 percent). We defined severe winters in a manner consistent with Cotterill and others (2025, this volume, chap. C) and thus treated it as a random variable with an annual probability of occurrence of 25 percent.
-
3. Conflict bison had lower overwinter survival compared to bison that stayed on the NER and winter range. We estimated the reduction in survival using expert judgment (app. D2) and expected mortality to occur from various sources, including bison vehicle collisions and culling on private lands.
-
4. In addition to increases in the proportion of bison that experienced conflict, the WSMET (oral commun., 2024) expressed uncertainty about how human-bison conflict may play out over time, especially under a prolonged lack of supplemental feeding on the NER and given any other changes that occur to mitigate acute bison conflicts (for example, private landowners erect fencing to protect haystacks). As a result, we worked with the WSMET to develop two competing hypotheses. The first was that the proportion of the bison population that ends up in conflict remains the same year after year, and the second was that the proportion of bison that end up in conflict changes over time. We used expert judgment to elicit weights on each hypothesis as well as the trend in the second. More details on the hypotheses and elicitation can be found in appendixes D2 and D3.
Parameter Estimation
Limited information is available for the Jackson bison herd to estimate vital and harvest rates under the management alternatives. For survival rates, we used data from Yellowstone bison, including information published in annual bison status reports that estimate mean survival and year-to-year variation (Geremia and others, 2019). We used Geremia and others (2019) estimates from 2000–19 for adult female, adult male, and calf annual survival (table D2). Calf annual survival estimates were then applied to our yearling age class as well (ages 1–2 years old; table D2). We further reduced calf survival in severe winters by first performing a repeated and random Bernoulli draw {0, 1} in each simulation year that functioned as an indicator of winter severity, where 0 indicated average winter survival and 1 indicated a severe winter. The annual probability of a severe winter was set to 0.25 based on the NER data and Cross and others (2025, this volume, chap. B). Then, based on whether it was a severe winter, either the baseline survival was applied as described above or monthly calf survival was 95 percent of baseline winter survival to approximate calf mortality during harsh winters. The reduced survival was derived by reviewing research on ungulate response to severe winter conditions (e.g., mule deer survival during the 2016–17 and 2018–19 severe winters was reduced from 0.9 to 0.65–0.7; LaSharr and others, 2023) and adjusting those effects relative to expectations about bison.
For birth rates, we used annual progress reports from a multi-year bison study (1997–2004) in the GTNP that focused on the reproduction and demography effects of brucellosis infection (Cain and others, 1997; 2004). The reports include annual data on collared and aged female bison, including pregnancy checks and monitoring for births. In other herds, brucellosis seropositivity, a bacterial infection, has been shown to reduce bison birth rates (Fuller and others, 2007). In this study, all pregnancy and birth rate data, from both seropositive and seronegative bison, were used to estimate the overall adult female reproduction rate because of the uncertainty in how brucellosis trends might change over time under the alternatives (table D2). Finally, based on WGFD harvest data (WGFD, unpub. data, 2024), harvest rates were estimated, and then a sex and age class-specific maximum harvest rate was calculated by dividing the total annual harvest by the total February counts of the NER and native winter range bison (table D2). Maximum harvest rates informed our estimates for annual harvest as a function of population size (app. D1).
Table D2.
Vital rates of bison in the Greater Yellowstone Ecosystem, including herds in Yellowstone National Park and the Jackson, Wyoming region.[SD=standard deviation]
Approximated from Geremia and others, 2019.
Approximated from Cain and others, 1997; 1998; 1999; 2000; 2001; 2002; 2004.
Winter bison distribution was informed by winter counts from 2018–23 (table D1). Bison have been counted at the NER and on the winter range since the 1940s. Prior to 2018, the majority overwintered on and around the NER. More recently, the proportion using feedgrounds has decreased (NPS, written commun., 2023). Therefore, we used 2018–23 data to assign bison to the NER feedgrounds and winter range. Under the no feeding alternatives, the individual four-point estimates (that is, low, high, central estimate, as well as a measure of uncertainty) from each science expert panel was used to generate random aggregate distributions that further split the NER bison into those that are expected to stay on the refuge and those that transition to conflict (app. D2). The aggregate distributions were generated by first fitting a distribution that matched the support of the parameter of interest (for example, beta distribution for vital rate parameters) to the quantiles provided by the experts. Then each distribution was aggregated using the Vincent average method (Howerton and others, 2023).
Initial Conditions
Starting values for the population size in models were randomly selected at the start of each simulation using data from 2018–23 and adjusted for imperfect detection of winter range bison (table D1). Our adjusted counts assumed that sightability was perfect on the NER but was biased low for counts of bison on winter ranges. Hess (2002) estimated bison count error during ground and aerial surveys in summer and winter. The probability of detection estimates ranged from 0.919 (95-percent confidence interval, 0.819 to 0.955) during winter aerial counts when bison were distributed in smaller groups in denser cover to a probability of detection of 0.975 (95-percent confidence interval, 0.959 to 0.983) during summer ground counts while bison were in larger groups but still distributed across the landscape in ways that challenged observation. Based on conversations with WSMET (oral commun., 2024) and given the landscape conditions in the region, we assumed that sightability was high and used the higher sightability estimate of 0.975 unit. We further assumed that bison counts for fed bison occurred without error because of the smaller and denser population of the NER bison compared to Hess (2002). Thus, we fit the Hess (2002) sightability estimates to a beta distribution and assumed the true count of bison from the February counts to be given by equation D1:
whereis the sightability estimate for animals on the winter range that may be observed imperfectly;
is the February population count for bison on the NER feedground;
is the February population count for winter range bison;
is the sightability-adjusted estimate for the total bison population size.
In addition to accounting for observational error, we also treated the starting population size as a random variable to account for interannual variability in count data. Overall, bison counts have had a declining trend over recent years with 786 individuals counted in 2014 but 432 in 2023 (table D1). To avoid sampling from this declining trend, we used a subset of annual count data (2019–23) and randomly drew from these counts to initialize each model projection (modeled year, y, where y=0 for the initial population size).
Results
The Jackson bison herd was projected to remain stable under the continue feeding alternative with a final median population size of 541 individuals in year 20 (table D3). Under the no feeding, disease threshold, increased elk harvest, and reduced feeding alternatives, we projected smaller population sizes of 469, 470, 472, and 473 individuals, respectively. Thus, the difference between the continue feeding and alternatives that called for the cessation of feeding were 13 percent smaller population sizes at year 20 (table D3). In terms of population projections over time for the no feeding, disease threshold, increased harvest, and reduced feeding alternatives, we projected a gradual decrease in populations starting in the years immediately following any change in feeding operations on the NER (fig. D2).
Table D3.
Median population size in year 20, median cumulative harvest over 20 years, and median cumulative number of conflict bison over 20 years under the 5 alternatives in the Jackson, Wyoming region.[SD, standard deviation]
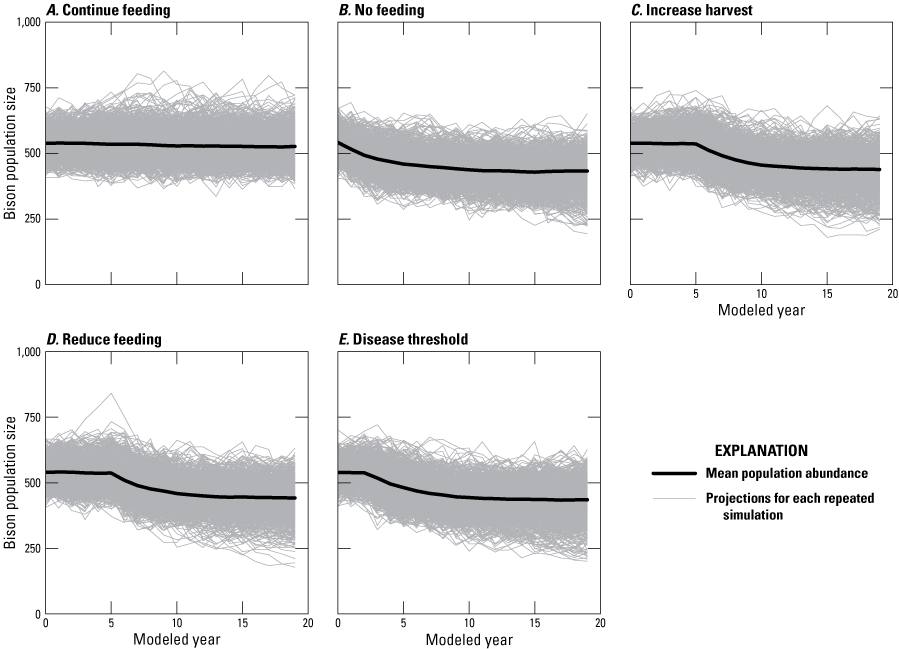
Graphs showing the projected bison population size in the Jackson, Wyoming region over time under the five alternatives: A, continue feeding, B, no feeding, C, increase harvest, D, reduce feeding, and, E, disease threshold.
For harvest projections, the 20-year cumulative number of bison harvested was 1,879 under the continue feeding alternative and between 371 to 587 fewer animals than in the other four alternatives that stopped feeding. The no feeding alternative resulted in 1,292 bison harvested over the next 20 years, compared to 1,387 under the disease threshold, 1,496 under increased harvest, and 1,508 under reduced feeding alternatives. On an annual basis, these resulted in an average of 95 harvested bison in the first year and 93 harvested in year 20 under continue feeding management. For the rest of the alternatives that call for the cessation of feeding, there was a declining trend in average annual harvest. Under no feeding, the average annual harvest was 94 in year 1 and 56 in year 20; increased harvest alternative had an average harvest of 97 in year 1 and 59 in year 20; reduced feeding had averages of 97 in year 1 and 60 in year 20; and, finally, the disease threshold averaged 97 in year 1 and 57 in year 20 (fig. D3).
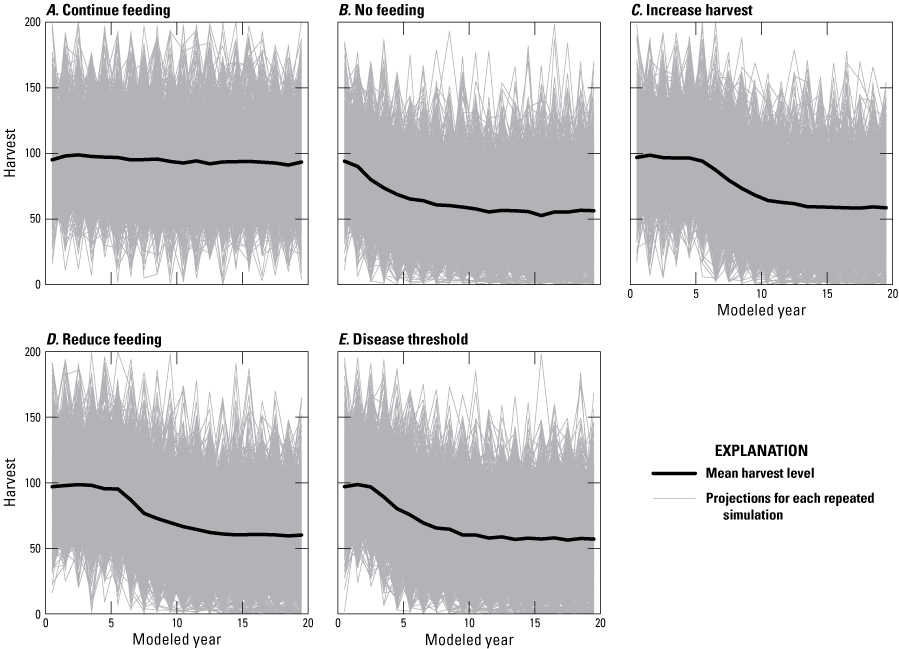
Graphs showing the projected bison harvest in the Jackson, Wyoming region over time under the five alternatives: A, continue feeding, B, no feeding, C, increase harvest, D, reduce feeding, and, E, disease threshold.
For the projections of the number of conflict bison, most of the experts believed that bison behavior would change over time in response to feed cessation. This study incorporated the two hypotheses about these temporal trends in conflict. The first hypothesis, that there was no trend in bison conflicts over time (for example, bison do not learn new behaviors that might lead to increased or decreased conflict), had an overall average belief weight of 0.19, whereas the other hypothesis, that bison conflict would either increase or decrease over time, had an overall average belief weight of 0.81. These results indicate that the expert panel believed it to be approximately 4 times more likely that bison conflict dynamics will change over time (app. D3). However, despite this general agreement, there was less agreement about the direction of that change (for example, whether conflicts would increase or decrease over time). One out of five experts believed that conflict would increase over time, but four out of five believed that conflict would decrease over time. As a result, we developed a mixed distribution that drew from either an increasing (one-fifth of the weight) or decreasing (four-fifths of the weight) proportion of the NER bison population as ending up in conflict situations.
Overall, after incorporating the structural uncertainty about future human-bison conflicts and parametric uncertainty about the proportion of bison that will redistribute into areas of conflict, we found that the continue feeding alternative had the lowest median value for the number of conflict bison (143 cumulative across 20 years; fig. D4A; table D3) and the no feeding alternative had the highest number of conflict bison (1,077 cumulative across 20 years; fig. D4B; table D3). The other three alternatives had intermediate values of conflict bison with 756 increased harvest, 756 reduced feeding, and 905 disease threshold (fig. D4C, D, and E; table D3). In general, incorporating the two hypotheses surrounding changes in human-bison conflict over time led to a high degree of uncertainty around these median values and a declining trend in conflict once feeding on the NER was stopped.
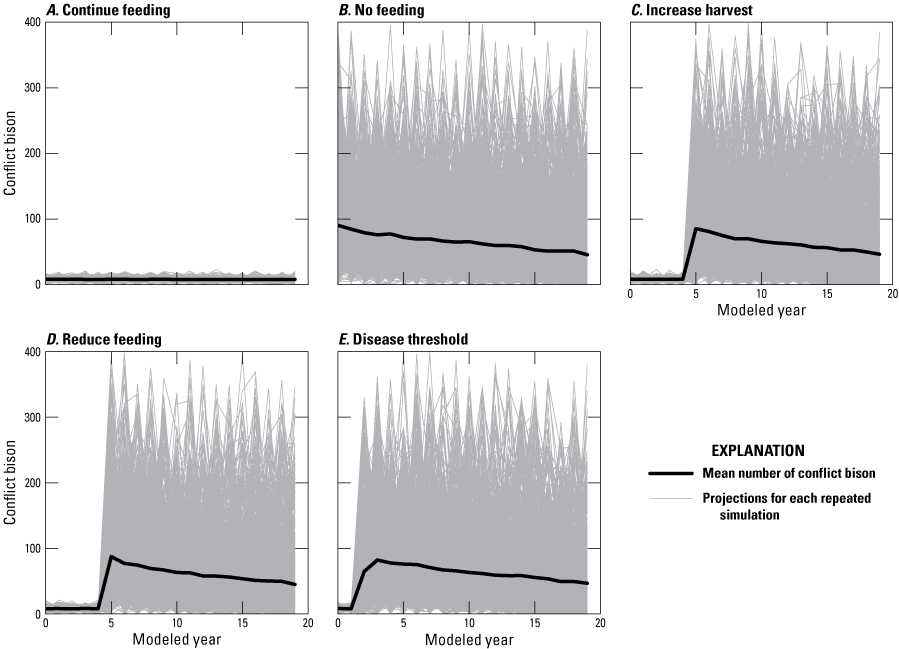
Graphs showing the projected human-bison conflicts in the Jackson, Wyoming region over time under the five alternatives: A, continue feeding, B, no feeding, C, increase harvest, D, reduce feeding, and, E, disease threshold.
Across the three metrics (bison abundance, harvest, and conflicts), the continue feeding alternative performed the best in the near-term (3–5 years) as well as in the long-term (20 years; fig. D5). However, the other four alternatives ranked comparably at year 20, with a reduced number of bison and harvest, as well as a higher but declining conflict potential compared to continue feeding. Nevertheless, how those changes occurred over time was slightly variable and depended on when feedground operations were ceased. For example, under the no feeding alternative, the decline in bison abundance and harvest and the increase in conflict started to happen in the first year, whereas, under the phaseout alternatives (reduced ration and aggressive harvest), this decline did not begin until year 5. The disease trigger alternative was intermediate in the performance of all metrics and depended on detecting CWD within elk before feeding is stopped.
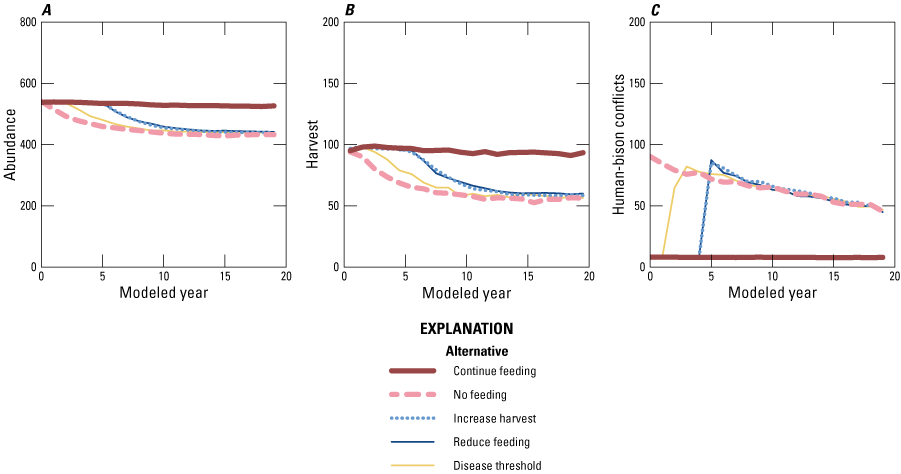
Graphs showing the projected effects of the alternative on the performance metrics over time under the five alternatives: A, abundance, B, harvest, and, C, human-bison conflicts.
Summary
This study projected the consequences of five potential management alternatives on three indicators for the Jackson, Wyoming, Bison bison (Linnaeus, 1758; American bison) herd over the next 20 years. The alternatives included one that maintained the National Elk Refuge feedground program and four others that stopped feeding over different time spans; the performance metrics used to evaluate the alternatives included bison abundance in year 20, as well as the cumulative harvest and number of conflict bison over that same period. In terms of performance, the continue feeding alternative was estimated to perform the best across all three metrics. For abundance, continuing the feedground program resulted in a stable population over time; the 20-year estimate of 541 individuals was 68–72 individuals larger than the four alternatives that stop feeding activities on the National Elk Refuge. Similarly, this study found that continuing to feed bison led to higher harvest and fewer conflicts when compared against the alternatives that stop overwinter feeding.
Several assumptions were made in this modeling work that affected the overall results. First, we assumed that the Wyoming Game and Fish Department would continue to manage the Jackson bison herd in relation to the existing population objective of 500 individuals. This assumption had a strong effect on abundance and harvest projections. For example, under the continue feeding management alternative, the adaptive harvest rate setting process limited the potential growth of the bison herd by increasing harvest within years with higher population sizes and over the 20-year projections. On an annual basis, this led to an average of approximately 95 bison being harvested in each year in our continue feeding projections compared to an average of 97 harvested annually between 2018–23 (WGFD, unpub. data, 2024). While the comparisons between observed and simulated results match well for the continue feeding alternative, no comparable data are available to make these comparisons under the four alternatives that stop feeding on National Elk Refuge.
In contrast to the continue feeding alternative and the stable population of around 500 bison under this alternative, the four alternatives that stop feeding resulted in reductions in average population size and annual harvest. This was primarily a result of an increase in human-bison conflict and the associated reduction in survival that is expected by experts in conflict situations. The expert panel, which informed the transition of bison to conflict without feeding and the associated survival of conflict bison, estimated that survival would be reduced by between 3–25 percent, depending on the sex and age of the individual (table D1, app. D2). This reduction dramatically reduces the available bison harvest, particularly as the population approaches 400 individuals and the adaptive harvest relationship in the simulation model reduces the harvest rate closer to zero under these conditions.
This study assumed that fed and unfed bison have experienced, and will continue to experience, vital rates similar to the much larger bison population that inhabits Yellowstone National Park and surrounding areas. Most of the vital rate information, except for birth rates, drawn from the Yellowstone herd, was used to make assumptions about the productivity of the Jackson herd, should the National Elk Refuge select an alternative that required the cessation of feeding. Further, we assumed that there would be excess mortality in 25 percent of years that lowered the monthly survival of calves in severe winters. Lastly, we assumed the success rate of bison hunters to remain the same over time; however, if bison no longer return to areas where they are currently vulnerable to harvest, it is conceivable that bison harvest dynamics change over the next 20 years in ways that are unpredictable. In total, none of these assumptions can be tested prior to a management decision on the feedground program; however, the results for the continue feeding alternative tend to align well with observations of the Jackson herd over the past six February counts in terms of harvest and overall abundance.
We assumed that there is no relationship between bison density and brucellosis seropositivity. Brucellosis seropositivity affects the birth rates of bison (for example, higher rates of brucellosis result in lower birth rates) and thus, any changes to disease dynamics may affect the productivity of this herd and the resulting estimates of population size, harvest, and conflict potential. Furthermore, we assumed no relationship between elk and bison, and the potential for predators to switch prey in future scenarios in which elk numbers decline.
Finally, our projections indicate that the continuation of the feedground program has the potential to lead to more bison and harvest, as well as fewer conflicts when compared to the no feeding, disease threshold, reduced feeding, and increased elk harvest alternatives. However, the continue threat of elevated transmission of bison and elk diseases makes decisions on whether and how to feed these herds a difficult one.
References Cited
Cook, J.D., Cotterill, G.G., McEachran, M.C., Graves, T.A., Cole, E.K., and Cross, P.C., 2025a, Decision framing overview and performance of management alternatives for bison and elk feedground management on the National Elk Refuge in Jackson, Wyoming, chap. A of Decision analysis in support of the National Elk Refuge: U.S. Geological Survey Scientific Investigations Report 2024–5119, 19 p., https://doi.org/10.3133/sir20245119A.
Cook, J.D., Cross, P.C., Tomaszewski, E.M., Cole, E.K., Campbell Grant, E.H., Wilder, J.M., and Runge, M.C., 2023, Evaluating management alternatives for Wyoming Elk feedgrounds in consideration of chronic wasting disease (ver. 2.0, November 2023): U.S. Geological Survey Open-File Report 2023–1015, 50 p., accessed April 11, 2024, at https://doi.org/10.3133/ofr20231015.
Cook, J.D., McEachran, M.C., Cotterill, G.G., and Graves, T.A., 2025b, Bison population dynamics, harvest, and conflict potential under feedground management alternatives on the National Elk Refuge in Jackson, Wyoming, chap. D of Decision analysis in support of the National Elk Refuge: U.S. Geological Survey Scientific Investigations Report 2024–5119, 24 p., https://doi.org/10.3133/sir20245119D.
Cotterill, G.G., Cross, P.C., Cole, E.K., Cook, J.D., McEachran, M.C., and Graves, T.A., 2025, Evaluating elk space-use and conflict under proposed management alternatives at the National Elk Refuge in Jackson, Wyoming, chap. C of Decision analysis in support of the National Elk Refuge: U.S. Geological Survey Scientific Investigations Report 2024–5119, 32 p., https://doi.org/10.3133/sir20245119C.
Cross, P.C., and Almberg, E.S., 2019, CWDsims—An R package for simulating chronic wasting disease scenarios, version 0.1.1: U.S. Geological Survey software release, accessed October 2022 at https://doi.org/10.5066/P9QZTTLY.
Cross, P. C., Cook, J. D., and Cole, E. K., 2025, Predictions of elk and chronic wasting disease dynamics the National Elk Refuge and surrounding areas in Jackson, Wyoming, chap. B of Decision analysis in support of the National Elk Refuge: U.S. Geological Survey Scientific Investigations Report 2024–5119-B, 22 p., https://doi.org/10.3133/sir20245119B.
Cross, P.C., Tomaszewski, E.M., and Cook, J.D., 2023. Simulating chronic wasting disease on Wyoming elk feedgrounds (version 2.0): U.S. Geological Survey software release, accessed November 17, 2023, at https://doi.org/10.5066/P9R7XWO1.
Fuller, J.A., Garrott, R.A., White, P.J., Aune, K.E., Roff, T.J., Rhyan, J.C., 2007, Reproduction and survival of Yellowstone bison. Journal of Wildlife Management, v. 71, no.7, p. 2365-2372, accessed April 22, 2024, at https://doi.org/10.2193/2006-201.
Hanea, A.M., McBride, M.F., Burgman, M.A., Wintle, B.C., Fidler, F., Flander, L., Twardy, C.R., Manning, B., and Mascaro, S., 2017, I nvestigate D iscuss E stimate A ggregate for structured expert judgement: International Journal of Forecasting, v. 33, no. 1, p. 267–279, accessed May 19, 2020, at https://doi.org/10.1016/j.ijforecast.2016.02.008.
Hartway, C., Hardy, A., Jones, L., Moynahan, B., Traylor-Holzer, K., McCann, B., Aune, K., Plumb, G., 2020, Long-term viability of Department of the Interior bison under current management and potential metapopulation management strategies—Natural Resource Report NPS/NRSS/BRD—2020/2097: Fort Collins, Colorado, National Park Service, 115 p., accessed April 22, 2024, at https://irma.nps.gov/DataStore/DownloadFile/639528.
Howerton, E., Runge, M.C., Bogich, T.L., Borchering, R.K., Inamine, H., Lessler, J., Mullany, L.C., Probert, W.J.M., Smith, C.P., Truelove, S., Viboud, C., and Shea, K., 2023, Context-dependent representation of within and between-model uncertainty—Aggregating probabilistic predictions in infectious disease epidemiology: Journal of the Royal Society, Interface, v. 20, no. 198, p. 20220659, accessed April 22, 2024, at https://doi.org/10.1098/rsif.2022.0659.
Jones, L.C., Powers, J.G., and Sweeney, S.J., 2020, Department of the Interior—History and status of bison health, natural resource report NPS/NRSS/BRD/NRR—2020/2201: Fort Collins, Colorado, National Park Service, accessed April 22, 2024, at https://doi.org/10.36967/nrr-2280100.
Konzek, D., 2024, FWS National realty tracts simplified: U.S. Fish and Wildlife Service, accessed August 13, 2024, at https://gis-fws.opendata.arcgis.com/datasets/fws::fws-national-realty-tracts-simplified/about.
LaSharr, T.N., Dwinnell, S.P.H., Wagler, B.L., Sawyer, H., Jakopak, R.P., Ortega, A.C., Wilde, L.R., Kauffman, M.J., Huggler, K.S., Burke, P.W., Valdez, M., Lionberger, P., Brimeyer, D.G., Scurlock, B., Randall, J., Kaiser, R.C., Thonhoff, M., Fralick, G.L., Monteith, K.L., 2023, Evaluating risks associated with mule deer capture and handling for individual-based, long-term research: Journal of Wildlife Management v. 87, no. 1. article e22333, accessed April 22, 2024, at https://doi.org/10.1002/jwmg.22333.
National Park Service—Land Resources Division, 2024, Administrative boundaries of National park system units—National geospatial data asset (NGDA) NPS National parks dataset: National Park Service, accessed August 13, 2024, at https://irma.nps.gov/DataStore/Reference/Profile/2224545?lnv=True.
Wyoming Game & Fish Department [WGFD], 2022, Annual big game herd unit job completion reports website, accessed April 22, 2024, at https://wgfd.wyo.gov/hunting-trapping/job-completion-reports. [Each region available as an individual download under the 2022 dropdown menu.]
Wyoming Game & Fish Department [WGFD], 2023, Annual big game herd unit job completion reports website, accessed August 8, 2024, at https://wgfd.wyo.gov/hunting-trapping/job-completion-reports. [Each region available as an individual download under the 2022 dropdown menu.]
Wyoming Game & Fish Department [WGFD], 2024, Wyoming elk feedgrounds management plan: Wyoming Game & Fish Department, accessed July 17, 2024, at https://wgfd.wyo.gov/media/29388/download?inline.
Appendix D1. Adaptive Harvest
is the harvest rate by age (a) and model year (y);
is the total February population size from the current simulation year (y);
Objective
is the population objective (500) for the Jackson bison herd;
c
is the proportion reduction when population was at carrying capacity;
δ
controls the shape of the density-dependence; and,
hmaxa,s
is the maximum harvest rate by age class (a) and sex (s).
Table D1.1.
Number of active hunting licenses in Wyoming and total bison harvest for juveniles, males, and females from years 2013 through 2022. Data from Tribal harvest not included.[Each hunter can only harvest one bison per license. Data are from the Wyoming Game and Fish Department (2022)]
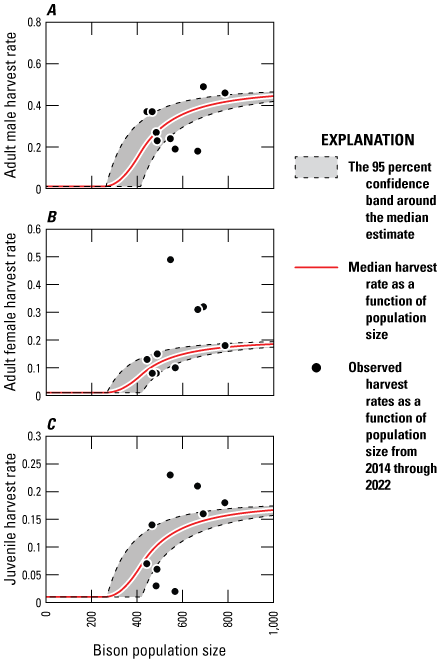
Graph showing the modeled relationship between bison herd population size and harvest rate: A, adult male data, B, adult female data, and, C, juvenile data.
References Cited
Cook, J.D., Cross, P.C., Tomaszewski, E.M., Cole, E.K., Campbell Grant, E.H., Wilder, J.M., and Runge, M.C., 2023, Evaluating management alternatives for Wyoming Elk feedgrounds in consideration of chronic wasting disease (ver. 2.0, November 2023): U.S. Geological Survey Open-File Report 2023–1015, 50 p., accessed April 22, 2024, at https://doi.org/10.3133/ofr20231015.
Wyoming Game & Fish Department [WGFD], 2022, Annual big game herd unit job completion reports website, accessed April 15, 2024, at https://wgfd.wyo.gov/hunting-trapping/job-completion-reports. [Each region available as an individual download under the 2022 dropdown menu.]
Appendix D2. Expert Elicitation
Uncertainty About Bison Vital Rates and Redistribution
The expert panel’s responses to Question 1—“Under current feeding operations, some bison spend at least part of the winter months overwintering on the NER in most years. In an average winter, what proportion of bison that overwinter on the NER would relocate to high conflict locations if the NER stopped provisioning supplemental feed?”—can be found in figure D2.1.
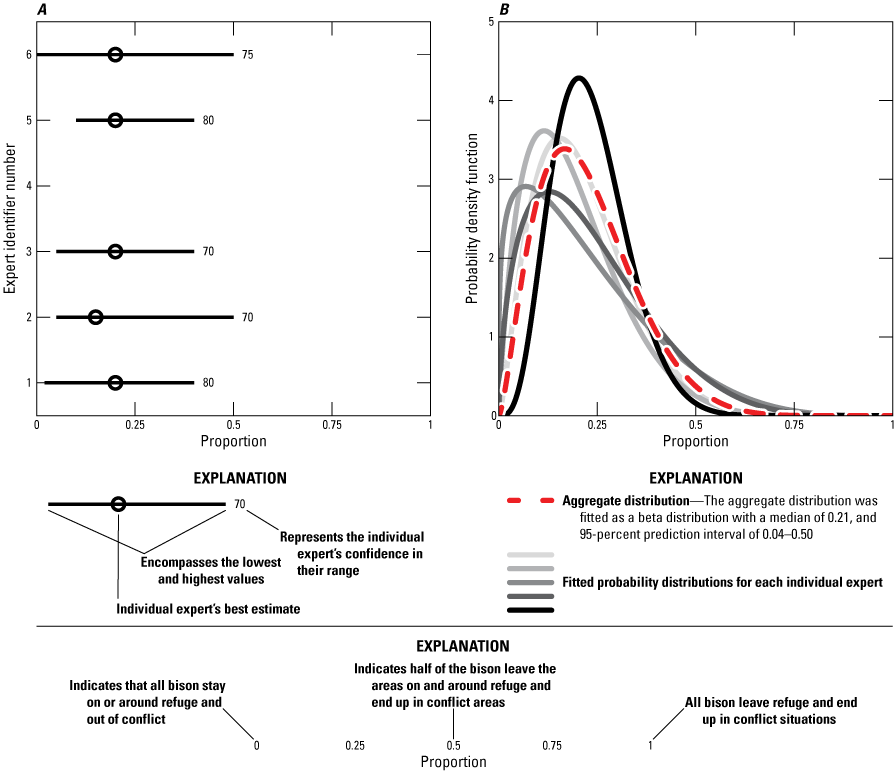
Graphs showing, A, the raw, four-point estimates of each of the five experts, and, B, the fitted probability distributions for each individual expert and the aggregate distribution for Question 1.
The expert panel responses to Question 2—"Under current feeding operations, some bison spend at least part of the winter months overwintering on the NER in most years. In a severe winter, what proportion of bison that overwinter on the NER would relocate to high conflict locations if the NER stopped provisioning supplemental feed?”—can be found in figure D2.2.
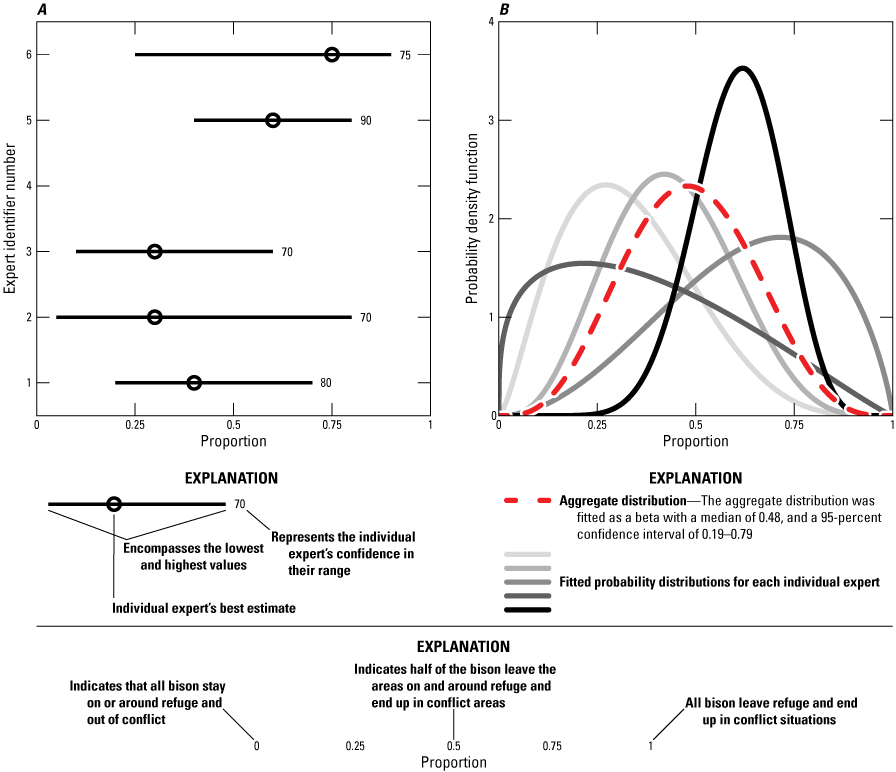
Graphs showing, A, the raw, four-point estimates of each of the five experts, and, B, the fitted probability distributions for each individual expert and the aggregate distribution for Question 2.
The expert panel responses to Question 3—“Assume that there were 100 human-bison conflicts in the first year after the NER stopped provisioning food, how many bison would you expect to be in conflict situations in year 20 after the NER stopped feeding (that is, no feeding for the past 20 years)?”—can be found in figure D2.3. The panel was instructed to assume that years 1 and 20 were exactly the same in terms of winter conditions, habitat and landscape composition and configuration, and management response to bison movements. And to also assume that the overall population of bison remains the same, including the movements between the NER and other seasonal ranges (fig. D2.3).
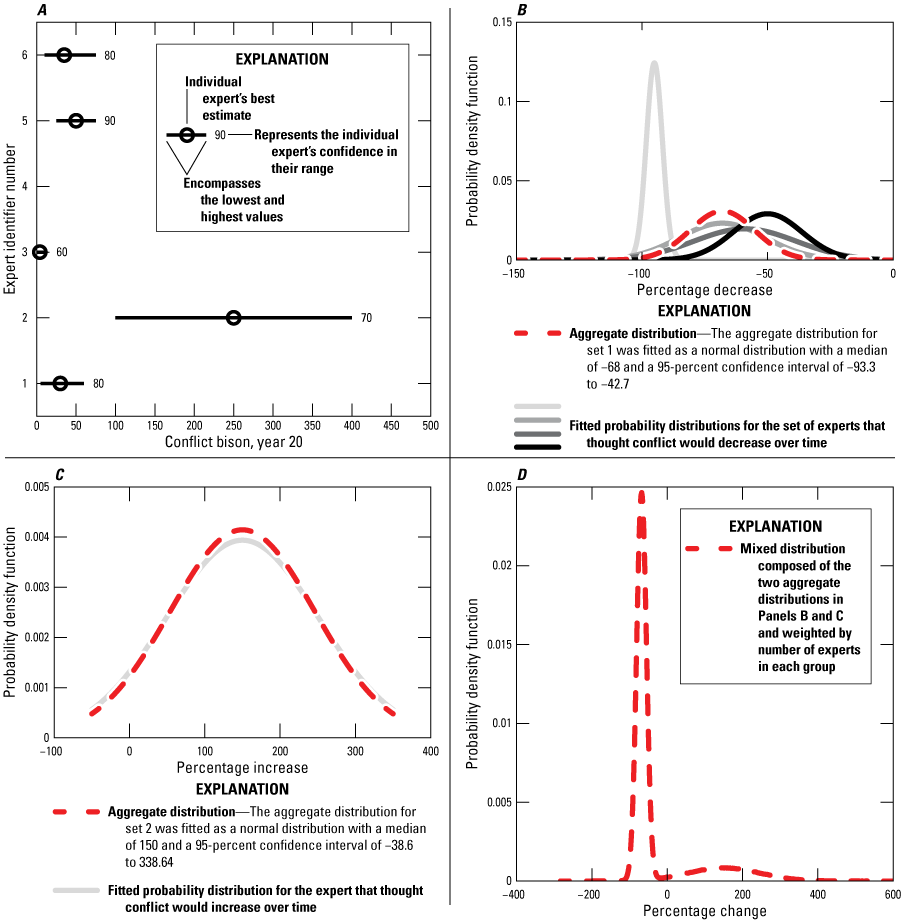
Graphs showing, A, the raw, four-point estimates of each of the five experts. One set of experts (n=4) estimated that conflict would decrease over time. Another expert (n=1) estimated that conflict would increase over time; B, the fitted probability distributions for the set of experts that thought conflict would decrease over time and their aggregate distribution; C, the fitted probability distributions for the expert that thought conflict would increase over time and their aggregate distribution; and, D, the mixed distribution that includes expert set 1 and set 2. Expert 4 participated in other questions about the distribution and survival of bison but did not complete the question about belief in the two hypotheses.
The expert panel responses to Question 4—“For bison groups that overwinter on areas of high conflict potential, how many adult female bison would survive out of 100 annually?”—can be found in figure D2.4. The panel was instructed to assume that, on average, 95 out of 100 adult female bison survive annually in feedground areas and other locations of low human-bison conflict potential.
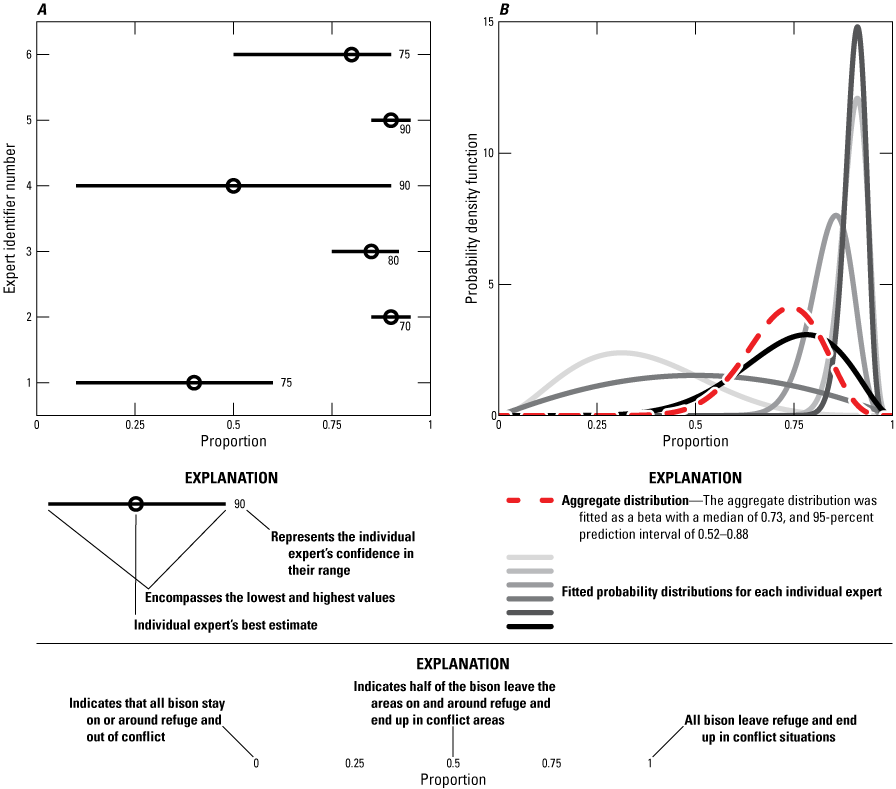
Graphs showing, A, the raw, four-point estimates of each of the six experts, and, B, the fitted probability distributions for each individual expert and the aggregate distribution for Question 4.
The expert panel responses to Question 5—"For bison groups that overwinter on areas of high conflict potential, how many juvenile female bison would survive out of 100, annually?”—can be found in figure D2.5. The panel was instructed to assume that, on average, 95 out of 100 juvenile female bison survive annually in feedground areas and other locations of low human-bison conflict potential.
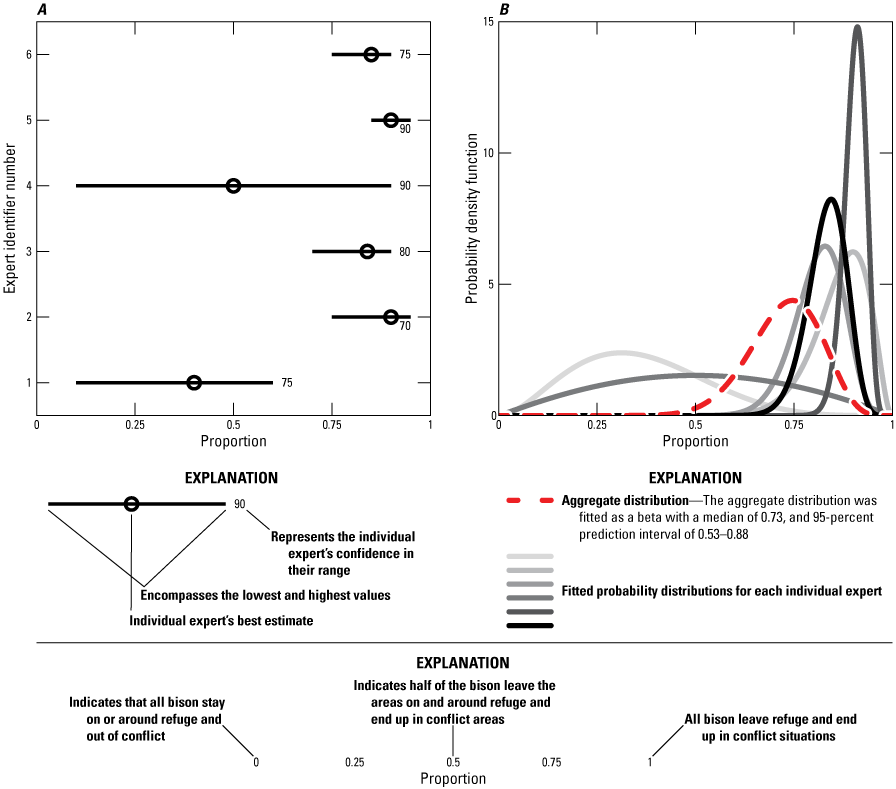
Graph showing, A, the raw, four-point estimates of each of the six experts, and, B, the fitted probability distributions for each individual expert and the aggregate distribution for Question 5.
The expert panel responses to Question 6— “For bison groups that overwinter on areas of high conflict potential, how many adult male bison would survive out of 100, annually?”—can be found in figure D2.6. The panel was instructed to assume that, on average, 95 out of 100 adult male bison survive annually in feedground areas and other locations of low human-bison conflict potential.
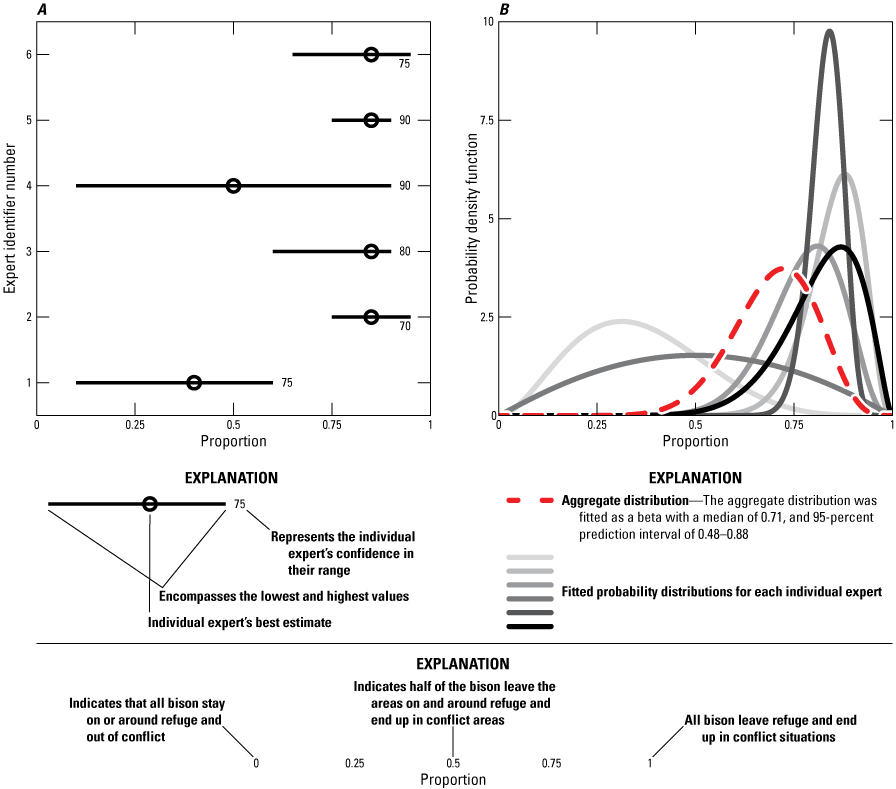
Graphs showing, A, the raw, four-point estimates of each of the six experts, and, B, the fitted probability distributions for each individual expert and the aggregate distribution for Question 6.
The expert panel responses to Question 7—"For bison groups that overwinter on areas of high conflict potential, how many juvenile male bison would survive out of 100, annually?”— can be found in figure D2.7. The panel was instructed to assume that, on average, 95 out of 100 juvenile male bison survive annually in feedground areas and other locations of low human-bison conflict potential.
Graphs showing, A, the raw, four-point estimates of each of the six experts, and, B, the fitted probability distributions for each individual expert and the aggregate distribution for Question 7.
The expert panel responses to Question 8— For bison groups that overwinter on areas of high conflict potential, how many bison calves would survive out of 100, annually?—can be found in figure D2.8. The panel was instructed to assume that, on average, 90 out of 100 bison calves survive annually in feedground areas and other locations of low human-bison conflict potential.
Graphs showing, A, the raw, four-point estimates of each of the six experts, and, B, the fitted probability distributions for each individual expert and the aggregate distribution for Question 8.
References Cited
Hanea, A.M., McBride, M.F., Burgman, M.A., Wintle, B.C., Fidler, F., Flander, L., Twardy, C.R., Manning, B., and Mascaro, S., 2017, I nvestigate D iscuss E stimate A ggregate for structured expert judgement: International Journal of Forecasting, v. 33, no. 1, p. 267–279, accessed May 19, 2020, at https://doi.org/10.1016/j.ijforecast.2016.02.008.
Morgan, M.G., 2014, Use (and abuse) of expert elicitation in support of decision making for public policy: Proceedings of the National Academy of Sciences of the United States of America, v. 111, no. 20, p. 7176–7184, accessed May 19, 2020, at https://doi.org/10.1073/pnas.1319946111.
Speirs-Bridge, A., Fidler, F., McBride, M., Flander, L., Cumming, G., and Burgman, M.A., 2010, Reducing overconfidence in the interval judgments of experts: Risk Analysis, v. 30, no. 3, p. 512–523, accessed May 19, 2020, at https://doi.org/10.1111/j.1539-6924.2009.01337.x.
Sutherland, W.J., and Burgman, M., 2015, Policy advice—Use experts wisely: Nature, v. 526, p. 317–318, accessed May 19, 2020, at https://doi.org/10.1038/526317a.
Appendix D3. Incorporating Structural Uncertainty in Human-bison Conflict Potential
-
Hypothesis 1. Human-bison conflict will remain relatively stable over time such that the proportion of bison that transition from winter range habitat on and around the National Elk Refuge to conflict situations will remain the same over time (fig. D3.1); and,
-
Hypothesis 2. Human-bison conflict will have an increasing or decreasing trend over time as a result of a multitude of potential mechanisms, including actions by agencies or the public that prevent conflict better over time, or from learned behaviors of bison that lead to avoidance of these areas (fig. D3.1).
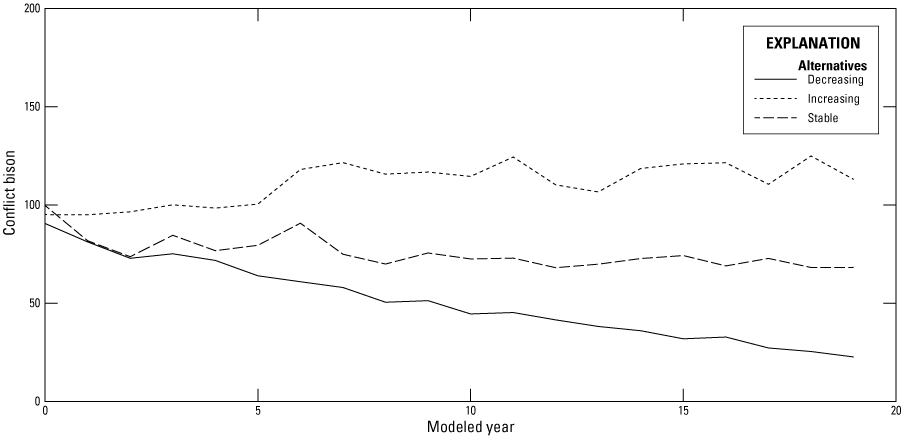
Plot representing the structural uncertainty in the relationship between human-bison conflicts in the Jackson, Wyoming region and the underlying hypotheses for how conflict might change over time.
Table D3.1.
Expert belief in hypotheses 1 and 2.[Hypothesis 1 is that human-bison conflict will remain relatively stable over time such that the proportion of bison that transition from winter range habitat on and around the National Elk Refuge to conflict situations will remain the same over time. Hypothesis 2 is that human-bison conflict will have an increasing or decreasing trend over time as a result of a multitude of potential mechanisms, including actions by agencies or the public that prevent conflict better over time or from learned behaviors of bison that lead to avoidance of these areas. Expert 4 participated in other questions about the distribution and survival of bison but did not complete the question about belief in the two hypotheses. —, no response]
For more information concerning the research in this report, contact:
Center Director, USGS Eastern Ecological Science Center
U.S. Geological Survey
12100 Beech Forest Rd., Ste 4039
Laurel, MD 20708-4039
Or visit the Eastern Ecological Science Center website at
https://www.usgs.gov/centers/eesc
Publishing support provided by the Baltimore Publishing Service Center.
Disclaimers
Any use of trade, firm, or product names is for descriptive purposes only and does not imply endorsement by the U.S. Government.
Although this information product, for the most part, is in the public domain, it also may contain copyrighted materials as noted in the text. Permission to reproduce copyrighted items must be secured from the copyright owner.
Suggested Citation
Cook, J.D., McEachran, M.C., Cotterill, G.G., and Cole, E.K., 2025, Bison population dynamics, harvest, and conflict potential under feedground management alternatives at the National Elk Refuge in Jackson, Wyoming, chap. D of Cook, J.D., and Cross, P.C., eds., Decision analysis in support of the National Elk Refuge bison and elk management plan: U.S. Geological Survey Scientific Investigations Report 2024–5119, 24 p., https://doi.org/10.3133/sir20245119D.
ISSN: 2328-0328 (online)
Study Area
| Publication type | Report |
|---|---|
| Publication Subtype | USGS Numbered Series |
| Title | Bison population dynamics, harvest, and conflict potential under feedground management alternatives at the National Elk Refuge in Jackson, Wyoming |
| Series title | Scientific Investigations Report |
| Series number | 2024-5119 |
| Chapter | D |
| DOI | 10.3133/sir20245119D |
| Publication Date | January 08, 2025 |
| Year Published | 2025 |
| Language | English |
| Publisher | U.S. Geological Survey |
| Publisher location | Reston, VA |
| Contributing office(s) | Eastern Ecological Science Center |
| Description | Report: vi, 24 p.; Software Release |
| Country | United States |
| State | Wyoming |
| City | Jackson |
| Other Geospatial | National Elk Refuge |
| Online Only (Y/N) | Y |
| Additional Online Files (Y/N) | N |