

Groundwater-Level Elevations in the Denver Basin Bedrock Aquifers and Upper Black Squirrel Creek Alluvial Aquifer, El Paso County, Colorado, 2021–24
Links
- Document: Report (9.24 MB pdf) , HTML , XML
- Database: U.S. Geological Survey, 2024, USGS water data for the Nation U.S. Geological Survey National Water Information System database, accessed June 15, 2024
- NGMDB Index Page: National Geologic Map Database Index Page (html)
- Download citation as: RIS | Dublin Core
Acknowledgments
The authors would like to thank the residents of the Upper Black Squirrel Creek Designated Groundwater Basin, especially the well owners who allowed access to their property. The authors also acknowledge the participation of the Upper Black Squirrel Creek Ground Water Management District, who assisted in the site selection and data collection. The groundwater-level monitoring network established for this study is dedicated to Bob Longenbaugh, former Assistant State Engineer of Colorado, Colorado State University faculty member and alumnus, and advocate of water-resource research.
The authors also acknowledge U.S. Geological Survey colleagues Kelli Palko and Brandon Forbes for assistance with collecting, processing, and presenting data related to this study. Thank you to Helen Malenda and Suzanne Paschke for their help in establishing the network for this study in 2020. Thank you to Andy Creighton and Andre Ritchie for their thorough reviews.
Abstract
El Paso County is the second-most populous county in Colorado and is projected to grow another 15 percent by 2030. Within El Paso County is the Upper Black Squirrel Creek Designated Groundwater Basin (Black Squirrel Basin), an area where surface water is scarce and water users rely primarily on groundwater from five different aquifers (the Upper Black Squirrel Creek alluvial aquifer and four bedrock aquifers within the Denver Basin aquifer system: the lower Dawson, Denver, Arapahoe, and Laramie-Fox Hills aquifers) to meet their needs. Currently (2024), land within the Upper Black Squirrel Creek Basin is primarily used for rural grazing and agriculture; however, municipal development is ongoing.
In 2021, the U.S. Geological Survey, in cooperation with the Upper Black Squirrel Creek Ground Water Management District, began a study to establish a baseline dataset and assess the groundwater resources of the aquifers within the Black Squirrel Basin. A network of 39 wells was established in 2021; discrete groundwater-level measurements were made bimonthly. Nine of the 39 wells were equipped with pressure transducers to record hourly groundwater-level data. Seven wells had statistically significant seasonal trends, and trends at 3 wells were negative. For the discrete data, 16 wells had a significant trend for the study period, and 4 wells had negative trends. For the time-series data, 8 wells had significant trends, and 3 wells had negative trends.
Potentiometric surface maps were created for this study using discrete, static groundwater levels measured in April 2023. These maps showed the estimated groundwater flow direction from the north-northwest to the south-southeast in the alluvial aquifer and from the northwest to the east-southeast for the lower Dawson and Denver aquifer wells.
This study indicates the potential benefit of monitoring wells in the areas near municipal pumping. Additional monitoring could lead to a better understanding of connectivity between aquifers and be an important tool for assessing long-term sustainability of groundwater use.
Introduction
The population in El Paso County, Colorado, has nearly doubled, from 397,890 in 1990 to 731,800 in 2020, and is projected to grow by another 15 percent by 2030 (Colorado State Demography Office, 2020). Development is planned for the areas in and around Falcon, Colorado, on both sides of U.S. Highway 24 between Falcon and Peyton, and along Colorado Highway 94 near Ellicott within the Upper Black Squirrel Creek Designated Groundwater Basin (Black Squirrel Basin; fig. 1; Koger and others, 2019).
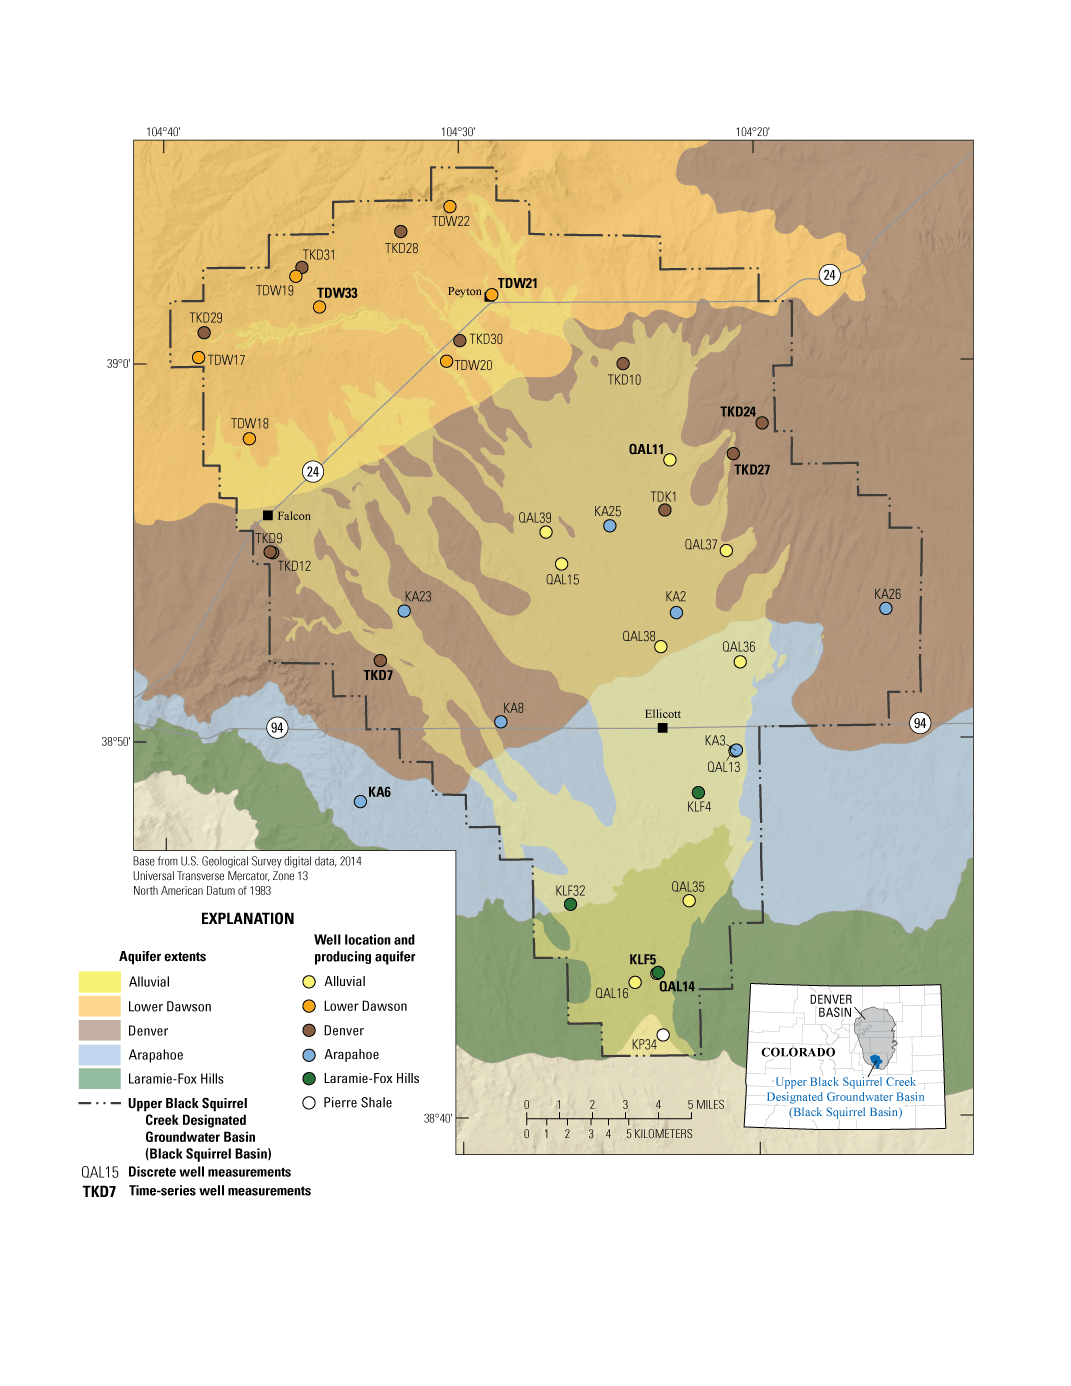
Map showing the location of groundwater-level monitoring network wells and producing aquifers, Upper Black Squirrel Creek Designated Groundwater Basin in El Paso County, Colorado. Modified from Penn and Everett, 2019, figure 1. Refer to table 2 for well names, locations, and site numbers. QAL, Upper Black Squirrel Creek alluvial aquifer well; TDW, lower Dawson aquifer well; TKD, Denver aquifer well; KA, Arapahoe aquifer well; KLF, Laramie-Fox Hills aquifer well; KP, Pierre Shale well.
Designated groundwater basins are, by definition, areas where surface water is scarce, and water users primarily rely on groundwater to meet their water needs (Colorado Division of Water Resources [CDWR], 2023). The Upper Black Squirrel Creek Ground Water Management District (District, herein) was formed in 1979 to administer and manage groundwater resources within the delineated Upper Black Squirrel Creek Basin (fig. 1), pursuant to Colorado Revised Statute (C.R.S.) 37–90–118. The District is responsible for adopting and enforcing regulations for using, controlling, conserving, and protecting the quality and quantity of groundwater in the Black Squirrel Basin. Additionally, the District may use research related to groundwater resources within the Upper Black Squirrel Creek Basin to develop comprehensive plans for the most efficient use of the groundwater (Upper Black Squirrel Creek Ground Water Management District, 2023).
Meeting the water needs of an increasing population in El Paso County has been a concern since the early 1970s (Emmons, 1977). Since then, multiple studies have investigated the effects of pumping on alluvial aquifer storage and depletion. Groundwater-level changes (representing simulated groundwater-level declines of 0–60 feet [ft]) between 1880 and 2003 were substantial in Upper Black Squirrel Creek alluvial aquifer, with the greatest simulated declines near Ellicott (fig. 1; Paschke, 2011). These decline-rate estimates were corroborated by field observations from the 1950s through the 2010s (Emmons, 1977; Buckles and Watts, 1988; Flor, 2023a, b).
In response to alluvial aquifer storage depletion concerns, Watts (1995) combined field groundwater-level data, water-quality data, and aquifer-test results to develop a groundwater-flow model specific to the interactions between the alluvial aquifer and the underlying Denver Basin bedrock aquifers within the Upper Black Squirrel Creek Basin (fig. 2). The model’s groundwater-flow simulations indicated if the 1989–90 rates of withdrawals from the Upper Black Squirrel Creek alluvial aquifer continued, the result would be continued groundwater-level declines, and development of the underlying bedrock aquifers would induce downward flow from the alluvial aquifer to the bedrock aquifers and cause decline in alluvial aquifer groundwater levels (Watts, 1995).
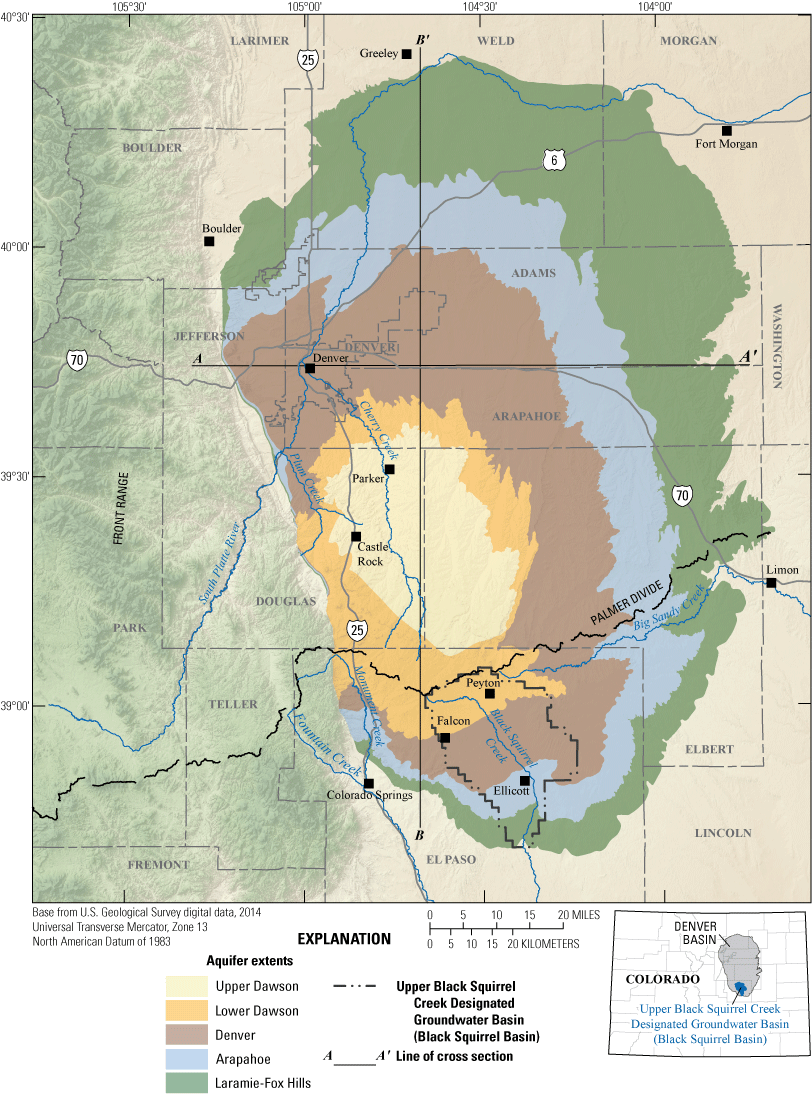
Map showing the location of the Denver Basin aquifer system and geologic lines of cross sections A, A–A' and B, B–B' near El Paso County, Colorado. Modified from Paschke (2011) and Malenda and Penn (2020).
Since the mid-to-late 1990s, all the bedrock aquifers underlying the Upper Black Squirrel Creek alluvial aquifer have been further developed through the addition of domestic wells and about 50 municipal wells, mostly completed in the Arapahoe and the Laramie-Fox Hills aquifers (Colorado Water Conservation Board and CDWR, 2023a). Groundwater levels in the Upper Black Squirrel Creek Basin are currently (2024) monitored by the CDWR and measured annually at selected locations. The CDWR monitoring network in the Upper Black Squirrel Creek Basin consists of 17 Denver Basin bedrock aquifer wells (Flor, 2023a) and 34 alluvial aquifer wells (Flor, 2023b). Data from the CDWR monitoring network are published online (Colorado Water Conservation Board and CDWR, 2023b) and in annual data reports (Flor, 2023a, b). The data help provide an annual assessment of groundwater levels in the Black Squirrel Basin; however, the data may not be sufficient for analyzing seasonal changes or long-term spatial trends, particularly in the bedrock aquifers. The U.S. Geological Survey (USGS) has periodically measured groundwater levels at selected locations in the Black Squirrel Basin, but similar to the data from the CDWR network, the data are not sufficient for analyzing seasonal changes or long-term trends, because they represent groundwater-level conditions at selected locations and for discrete time periods (USGS, 2024).
In 2021, the USGS, in cooperation with the District, began a study to establish a baseline dataset and assess the groundwater resources of the producing aquifers within the Black Squirrel Basin. The goals of this study were to establish a groundwater-level monitoring network throughout the Black Squirrel Basin, make routine measurements of groundwater levels, and assess changes in groundwater-level elevations during the study period. Continuing the monitoring network could aid in the long-term planning of water resources for the alluvial and bedrock aquifers in the Black Squirrel Basin, particularly around areas of increasing municipal development.
Purpose and Scope
This report provides results of groundwater-level elevations measured in the Upper Black Squirrel Creek Basin in El Paso County, Colo., during the study period from April 2021 through February 2024. This report presents data from a network of 39 groundwater wells where discrete measurements of groundwater levels were made every other month. The study included a minimum of three wells screened in each of the producing Denver Basin bedrock aquifers. The purpose of this report is to summarize groundwater levels measured during the study period and provide results from a trend analysis of changes in groundwater-level elevations through time in the Denver Basin bedrock aquifers and the alluvial aquifer in the Upper Black Squirrel Creek Basin in El Paso County. Throughout the study period, wells were added to and discontinued from the monitoring network in phases, so the start dates of the well records are asynchronous. Of the wells added to the monitoring network, nine wells were equipped with pressure transducers that measure and record groundwater-level data on an hourly basis, herein referred to as time-series well measurements (fig. 1). Time-series well measurements were made in addition to discrete measurements, which were made every other month, to assess the aquifers more robustly.
Description of Study Area
The Upper Black Squirrel Creek Basin encompasses approximately 350 square miles in the east-central part of El Paso County, Colo. (fig. 2). El Paso County is the second-most populous county in Colorado and includes the State’s second-most populous city, Colorado Springs. The predominant land usage in the Upper Black Squirrel Creek Basin is rural grazing and agriculture, although the area is experiencing rapid residential and commercial development, expanding outward from the Colorado Springs metropolitan area (Wellman and Rupert, 2016; Koger and others, 2019).
Within the Upper Black Squirrel Creek Basin, there are five aquifer units relevant to this study. Alluvial deposits of variable thickness, which make up the Upper Black Squirrel Creek alluvial aquifer, are present along the main stem and tributaries of the ephemeral Upper Black Squirrel Creek and cover approximately 120 square miles (Topper, 2008). The unconsolidated material consists primarily of Pleistocene clay, silt, sand, and gravel and is more permeable than the underlying bedrock aquifers (McGovern and Jenkins, 1966). The Upper Black Squirrel Creek alluvial aquifer supplies most of the water for irrigation in the Black Squirrel Basin, and, since 1964, supplies water for export to the Colorado Springs area (Buckles and Watts, 1988). McGovern and Jenkins (1966) estimated that the amount of water in storage in the main channels of the alluvial aquifer was approximately 400,000 acre-feet. In 2024, there are 22 municipal wells screened in the Upper Black Squirrel Creek alluvial aquifer; most water pumped from these wells is exported out of the Upper Black Squirrel Creek Basin (Colorado Water Conservation Board and CDWR, 2023a).
The physical properties of the alluvial aquifer of the Upper Black Squirrel Creek Basin have been extensively studied (McGovern and Jenkins, 1966; Buckles and Watts, 1988; Topper, 2008) as has the water quality within the alluvial aquifer (Buckles and Watts, 1988; Brendle, 1997; Topper and Horn, 2011; Wellman and Rupert, 2016; Kisfalusi and others, 2022). The Upper Black Squirrel Creek Basin topography, climate, and land usage have been characterized by Buckles and Watts (1988) and by Wellman and Rupert (2016).
The southernmost part of the Denver Basin aquifer system underlies the Upper Black Squirrel Creek Basin and consists of the bottom four aquifer units present within the Upper Black Squirrel Creek Basin (fig. 2; refer to the section of this report titled “Description of Denver Basin Aquifer System”). Additionally, the Denver Basin aquifer system has been studied in the Upper Black Squirrel Creek Basin (Robson, 1987; Banta, 1989; Watts, 1995).
Description of Denver Basin Aquifer System
The Denver Basin aquifer system borders the base of the Colorado Front Range and extends into the eastern plains of Colorado, covering an area of approximately 7,000 square miles (Bauch and others, 2014; Penn and Everett, 2019), and is a critical water resource for the Front Range urban corridor (Paschke, 2011; fig. 2). The Denver Basin aquifer system extends from near Greeley in Weld County to the north and ends southeast of Colorado Springs in El Paso County, underlying the Upper Black Squirrel Creek Basin (figs. 1 and 2). The bedrock aquifers in the Denver Basin aquifer system have a synorogenic, bowl-like structure composed of Late Cretaceous to Tertiary sandstone bedrock separated by unnamed claystone confining units (Fenneman, 1931; Robson, 1987; Paschke, 2011) and bounded at the base by the Cretaceous Pierre Shale (fig. 3; table 1).
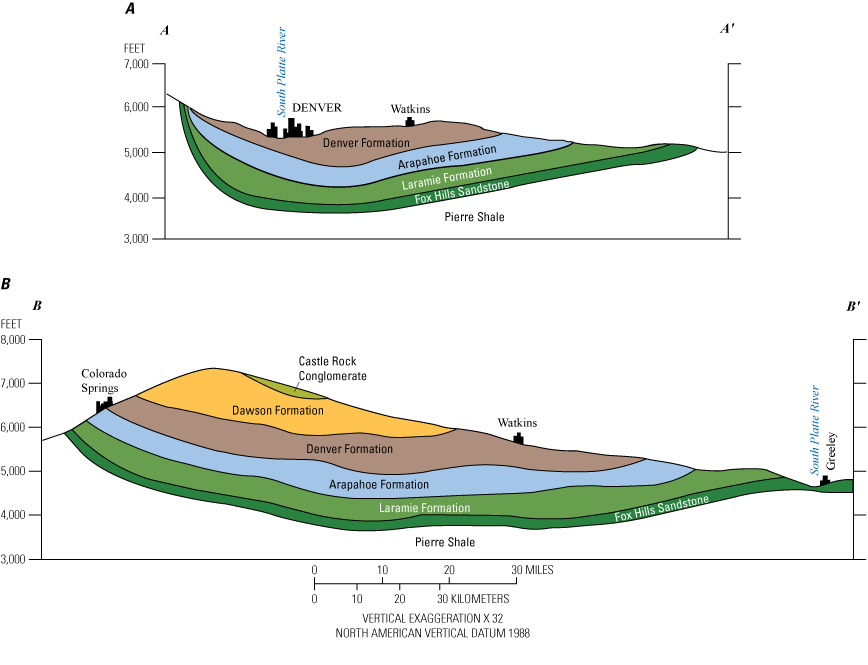
Simplified Denver Basin aquifer system cross sections A, A–A', west to east and B, B–B', south to north. Modified from Robson (1987), Penn and Everett (2019), and Malenda and Penn (2020). Refer to figure 2 for cross section locations and table 1 for bedrock aquifer descriptions.
Table 1.
Physical characteristics of bedrock aquifers in the Denver Basin aquifer system within the Upper Black Squirrel Creek Designated Groundwater Basin.[Refer to figure 1 for extent and location of aquifers and extent and location of El Paso County. mi2, square mile; ft, foot; N/A, not applicable]
Romero, 1976; Robson and others, 1981b; Robson, 1987; Watts, 1995; Raynolds and others, 2001; Raynolds, 2002; Paschke, 2011.
Romero, 1976; Kirkham and Ladwig, 1979; Robson and others, 1981b; Robson, 1987; Crifasi, 1992; Watts, 1995; Raynolds and others, 2001; Raynolds, 2002; Paschke, 2011.
The five primary bedrock aquifers of the Denver Basin are, from youngest (shallowest) to oldest (deepest): the upper Dawson, the lower Dawson, the Denver, the Arapahoe, and the Laramie-Fox Hills aquifer in the Laramie Formation and Fox Hills Sandstone (figs. 2 and 3). The physical characteristics of the Denver Basin aquifer system are summarized in table 1; source information was acquired from Romero (1976), Kirkham and Ladwig (1979), Schneider (1980), Robson and others (1981a), Robson and others (1981b), Robson (1987), Crifasi (1992), Watts (1995), Raynolds and others (2001), Raynolds (2002), and Paschke (2011). The consolidated sediments that compose these aquifers were deposited during different periods of mountain building and have differing physical properties (sediment grain size, porosity, specific yield, and hydraulic conductivity) among aquifers and across the Denver Basin; refer to Everett (2014) for a synopsis of the work completed by the aforementioned authors and descriptions of the hydrostratigraphy and depositional conditions of the aquifers.
All the Denver Basin bedrock aquifers, except the upper Dawson, are in the Upper Black Squirrel Creek Basin (figs. 1 and 2; table 1), and their physical structures and geographic extents have affected the spatial and temporal development of water resources (Paschke, 2011). Because of the bowl-shaped structure of the Denver Basin, bedrock units crop out in a ring pattern. The oldest rocks are around the outer margins of the Denver Basin and the youngest rocks are near the center of the basin (Paschke, 2011). The lower Dawson aquifer underlies the northern part of the Black Squirrel Basin, with outcrops of the Denver, Arapahoe, and Laramie-Fox Hills aquifers toward the southeast (fig. 1). In general, unconfined (water-table) aquifer conditions are encountered frequently in outcrop areas, and confined aquifer conditions are found in the bedrock aquifers where they are overlain by younger units (Paschke, 2011).
Hydrogeologic characterization of the Denver Basin aquifer system began in the 1970s as part of the nontributary groundwater rules established by Colorado Senate Bill 213 (Graham and Van Slyke, 2004). The CDWR and USGS collaborated through the 1970s and 1980s by mapping and characterizing the primary aquifers of the Denver Basin aquifer system. These studies, listed or summarized in Wireman and Romero (1989) and Paschke (2011), were crucial to the development of a groundwater flow model (Robson, 1987) and a fully three-dimensional MODFLOW-2000 groundwater flow model (Paschke, 2011) of the Denver Basin aquifer system. During the 2010s, similar groundwater monitoring programs were completed in Douglas County (Everett, 2014; Malenda and Penn, 2020) and Elbert County (Penn and Everett, 2019). Historically, monitoring of groundwater levels in the Denver Basin aquifer system has been intermittent (McCluskey and others, 2006), with contributions from several agencies—the USGS (McGovern and Jenkins, 1966), the Colorado Water Conservation Board (McConaghy and others, 1964), and the CDWR (Pottorff and Horn, 2013; Flor, 2023a). Water quality has also been investigated in the Arapahoe aquifer (Hillier and others, 1978) and the Denver Basin aquifer system (Bauch and others, 2014).
Study Methods
All discrete and time-series groundwater-level measurements summarized in this report are publicly available through the National Water Information System (NWIS) database (USGS, 2024) by using the site identification numbers in table 2. The NWIS database website provides an interface for accessing site information and data measured by the USGS and is regularly updated to reflect the most current data. Users of the interface can retrieve USGS data by category, region, site number, or many other criteria, and can produce tables and graphs for web viewing or export. Data accessible from NWIS can be downloaded in the R statistical software, version 4.1.3, (R Core Team, 2018) using the USGS dataRetrieval package (De Cicco and others, 2023) or in Python (Van Rossum and Drake, 2009) using the USGS dataretrieval package (Hodson and others, 2023).
Table 2.
Well identification, location information, and a summary of discrete groundwater-level measurements, April 2021 through February 2024, Upper Black Squirrel Creek Designated Groundwater Basin, El Paso County, Colorado.[Well data can be downloaded using the site identification number in the U.S. Geological Survey National Water Information System (NWIS) database (https://doi.org/10.5066/F7P55KJN; USGS, 2024). Refer to figure 1 for well locations. NAD 83, North American Datum of 1983; LSD, land-surface datum; ft, foot; NAVD 88, North American Vertical Datum of 1988; bls, below land surface; “1,” static measurement; “P,” pumping affected; QAL, Upper Black Squirrel Creek alluvial aquifer well; TDW, lower Dawson aquifer well; TKD, Denver aquifer well; KA, Arapahoe aquifer well; KLF, Laramie-Fox Hills aquifer well; KP, Pierre Shale well]
The Upper Black Squirrel Creek Basin groundwater monitoring network, described in this study, was established in 2021. No new wells were drilled for this study. Existing wells (domestic, decommissioned irrigation, and monitoring wells) were selected for inclusion in the groundwater-level monitoring program on the basis of their geographic location, screened aquifer, aquifer conditions (confined or unconfined), previous monitoring activities, and permitted use (fig. 1). Priority was placed on wells that were previously monitored for groundwater levels or water quality as previous monitoring activities indicate potentially reliable site access and offer historical data. Previously monitored wells were not selected if their construction or lithologic information was incomplete; if they were used for municipal, commercial, irrigation (active), or industrial uses; or if there was a more adequate well nearby that provided similar data. In parts of the study area, there was a lack of suitable candidate wells screened in the aquifer(s) of interest.
During the initial site visits, the wellhead, access point, measuring point (MP), and surrounding areas were photographed, and the well location and elevation of the wellhead and MP were measured using a high-precision Global Navigation System Survey unit and referenced to North American Vertical Datum of 1988 (NAVD 88; Rydlund and Densmore, 2012). All survey data were measured with a common coordinate system, geoid, ellipsoid, and datum. The coordinate system used was Universal Transverse Mercator, zone 13 north, using the horizontal datum North American Datum of 1983 (NAD 83), and the vertical datum NAVD 88, Geoid 03, ellipsoid World Geodetic System.
An MP was marked on the casing of each well as a consistent point from which to make measurements, as depicted in appendix 1 (fig 1.1). The height of each MP above the land surface was manually measured. The land surface datum (LSD) of each well was calculated by subtracting the manually measured well MP height from the MP elevation, which was determined when surveyed. The horizontal coordinates and elevation of LSD for each well are listed in table 2. By using consistent horizontal and vertical datums, groundwater-level elevations can be calculated and accurately compared across the Black Squirrel Basin. In this report, groundwater-level elevation is calculated from depth to groundwater below LSD according to equation 1:
whereGroundwater level-elevation
is groundwater elevation in ft above NAVD 88;
LSD
is the land-surface datum in ft above NAVD 88; and
Depth to groundwater below LSD
is the measured depth to groundwater below land-surface datum in ft.
Groundwater-Level Measurements and Groundwater-Level Elevations
Groundwater levels are presented as depth to groundwater in feet below LSD, and calculated groundwater-level elevations are presented in feet above NAVD 88. This report presents data from 39 wells in the Black Squirrel Basin, with at least 3 wells screened in each of the Denver Basin bedrock aquifers and 1 well finished in the Pierre Shale (table 2). Well common names include the following aquifer abbreviations and a number assigned to complete each well name: Upper Black Squirrel Creek alluvial aquifer well, QAL; lower Dawson aquifer well, TDW; Denver aquifer well, TKD; Arapahoe aquifer well, KA; Laramie-Fox Hills aquifer well, KLF; Pierre Shale well, KP.
Discrete Groundwater-Level Measurements and Groundwater-Level Elevations
Manual depth to groundwater (discrete groundwater level) measurements were made bimonthly (February, April, June, August, October, and December) similar to the method of Penn and Everett (2019) except when well access was temporarily restricted or delayed because of weather or property access. All discrete measurements were made using a calibrated electric water-level tape, and measurement methods were in accordance with Cunningham and Schalk (2011). For each discrete measurement, the depth to groundwater from the MP was recorded to the nearest 0.01 ft and corrected for the height of the MP above LSD to calculate a depth to groundwater below LSD. As a quality-control measure, a second check measurement was made 1–3 minutes after the first measurement. This was done to check if the first measurement represented a static groundwater level, or if the groundwater level was in a state of recovery or pumping. Measurements within 0.02 ft of the first measurement were considered reliable static measurements (Cunningham and Schalk, 2011).
When the second check measurement was not within 0.02 ft of the first, additional measurements were made to determine the reason for a nonstatic condition. If consecutive measurements indicated a rising groundwater level or decreasing depth to water, the well was considered to be in recovery from recent pumping. If consecutive measurements indicated a falling groundwater level or increasing depth to water, the well was affected by active pumping. Measurements were made until either a static measurement was recorded (two consecutive measurements within 0.02 ft of each other), or the collector determined that achieving a static measurement was not possible in a practical amount of time (30–45 minutes). In some circumstances, a nonstatic condition was because the pump turned on while measurements were being made. A static measurement was assigned the status of 1, a measurement that was affected by pumping actively or recently was assigned the status of P, and a measurement that was obstructed and could not be taken was assigned the status of O. Typical reasons for recently or actively pumping wells include common domestic water uses: lawn irrigation, home appliances, sewage, and filling pressure tanks. If possible, the well owners were asked to temporarily limit water use during the field visit so a static measurement could be made. Static measurements are highly beneficial for assessing changes and estimating temporal trends in groundwater levels, as they are the best representation of the water table (or potentiometric surface in a confined aquifer; Taylor and Alley, 2001). During this study, static groundwater-level measurements were achieved approximately 85 percent of the time (table 2). Mean depth to groundwater below LSD and mean groundwater-level elevation were calculated for the study period (table 2).
Time-Series Groundwater-Level Measurements and Groundwater-Level Elevations
Time-series data were measured by a pressure transducer equipped with an internal data logger. Eight Level Troll 500 pressure transducers (In-Situ, Inc., 2023) were installed at 9 of the 39 well locations; each transducer recorded a depth to groundwater level below MP on an hourly basis. (There were two exceptions: TDW17 had a transducer installed for less than 6 months so was not used in the time-series analysis, and TKD24 replaced TKD27, which was discontinued in early 2023.) Level Troll 500 transducers are vented and rated at a 69-ft range in a freshwater water column, with a manufacturer accuracy of plus or minus (±) 0.05 percent (0.03 ft) at 59 degrees Fahrenheit (15 degrees Celsius), and temperature is measured with a manufacturer accuracy of ±0.005 percent from −5 to 50 degrees Celsius (In-Situ, Inc., 2023). Wells completed in the Denver aquifer had 231-ft range transducers deployed with a manufacturer accuracy of ±0.05 percent (0.12 ft) at 59 degrees Fahrenheit (15 degrees Celsius; In-Situ, Inc., 2023).
Transducers were suspended in selected wells using a communication cable that allowed data to be downloaded without removing the transducer. Internal data loggers were programmed to record depth to groundwater below MP every hour. Time-series data were useful for identifying pumping periods within a well and for understanding the effects of pumping. Wells were selected for transducer installation on the basis of well-screen interval (that is, the depth within a well where the solid casing is open to groundwater flow), well access, primary use, frequency of use, pump placement, and well-owner interest.
During each site visit, transducers were downloaded, serviced, and calibrated. Transducers were calibrated by measuring a concurrent groundwater level using a calibrated electric water-level tape following the methods described in Cunningham and Schalk (2011). If the transducer was not measuring within 0.04 ft of a concurrent static measurement, the transducer was reset to match the discrete value for depth to groundwater. If the discrete measurements were not static, no attempt was made to reset the transducer. Time-series data were uploaded to NWIS (USGS, 2024) and processed following USGS guidelines (Freeman and others, 2004). To account for instrument drift, time-series groundwater-level data were corrected to match concurrent discrete groundwater-level measurements. Every discrete groundwater-level measurement and associated time-series data were evaluated by analyzing calibrations, correcting for drift, analyzing the full dataset, and approving the measurement through an internal review process. To compare data from different wells more accurately, discrete and time-series groundwater-level measurements were converted to groundwater-level elevations using equation 1. Daily median, minimum, and maximum groundwater-level elevations were computed from the hourly groundwater-level elevation values for each time-series well dataset.
Groundwater-Level Elevation Temporal Trend Analysis and Mapping
Hydrographs (app. 2) provide a graphical representation of groundwater-level elevations through time. The groundwater-level elevations are denoted by measurement status (static or affected by pumping) and can be used as an interpretative aid. For the time-series data, daily median and minimum groundwater-level elevations may have been affected by periods of pumping and thus may not reflect static groundwater-level conditions; therefore, the daily maximum groundwater-level elevations were used for reporting and trend analysis (Penn and Everett, 2019).
Temporal, monotonic trends in the discrete and time-series groundwater-level elevation data were evaluated using nonparametric methods. This study used a Mann-Kendall (M-K) test, similar to the method used by Malenda and Penn (2020), a seasonal Mann-Kendall (sM-K) test (Helsel and others, 2020), and a regional Mann-Kendall (rM-K) test (Helsel and Frans, 2006). These trend analyses were completed using the R statistical software, version 4.1.3, (R Core Team, 2018), the smwrStats package (Lorenz, 2014), and the EnvStats package (Millard, 2013). The calculated trend estimates, in feet per year, were quantified using the Theil-Sen slope estimate (Sen, 1968; Hirsch and others, 1982; app. 3) with the smwrStats package (Lorenz, 2014). Trends were deemed statistically significant if the p value was less than or equal to the defined alpha of 0.1.
The M-K test (Mann, 1945; Kendall, 1975; Helsel and others, 2020) was applied to discrete and time-series data for the entire period of record (app. 3). For the analysis of the discrete data, only static measurements were used to negate the effect of pumping. However, at well TKD31, there was an insufficient number of static discrete measurements (that is, fewer than the minimum of three throughout the period of data collection); therefore, both static measurements and measurements affected by pumping were used in the M-K test. Statistical results for wells with measurements affected by pumping may have a greater uncertainty than wells with all static water-level data. An outlier at well KA26 (August 2022; app. 2, fig. 2.35) was excluded from the dataset for analysis because of the large effect it had on the monotonic trend and its comparatively large decrease in elevation from the mean measured groundwater-level elevation (table 2); this outlier was even lower in elevation than other previous measurements that were affected by pumping. A negative trend indicates generally declining groundwater-level elevations in the well through time, and a positive trend indicates generally rising groundwater-level elevations in the well through time.
The sM-K test (Hirsch and others, 1982; Helsel and others, 2020; app. 3) was used to account for seasonal variability in groundwater levels by a monthly defined temporal correlation from one year to the next. The sM-K test was applied to discrete data comparing the groundwater-level elevations from one year to other years (for example, April data from one year are only compared to April data from the following years) with at least 2 years of data available at all wells. The seasonal trend analysis at five wells (TDW18, TKD27, TKD31, KA23, and KA26) included all discrete measurements, including those measurements affected by pumping due to an insufficient number of static measurements. For the time-series analyses, monthly mean values of the daily maxima were used for seasonal trend analysis. Wells TDW33, TKD24, and TKD27 did not have the minimum two-year data collection needed to complete an sM-K test for the time-series analysis. The sM-K test approach was also used to complete a rM-K test (Helsel and Frans, 2006) on each aquifer unit using the EnvStats package (Millard, 2013). Each aquifer was tested using only static measurements from April 2021 through February 2024 to calculate an aquifer trend.
Maps of the groundwater-level elevation, or potentiometric-surface maps, were created to show the hydraulic head distributions for the aquifers within the basin. Measurements that were not static, marked as P, pumping, in NWIS (USGS, 2024) and pumping in appendix 2, were not used to create potentiometric-surface maps. Nonstatic measurements do not represent the actual conditions of the water table in the alluvial aquifer, or potentiometric surface in the Denver Basin bedrock aquifers. The topo to raster and contour geoprocessing tools in ArcGIS Pro, version 3.2.2 (Esri, Inc., variously dated) were used with default settings to derive the hydrologic head distribution and contour lines of equal hydraulic head on the basis of groundwater-level elevation in feet above NAVD 88 for April 2023 measurements.
Groundwater-Level Elevations in Aquifers in the Upper Black Squirrel Creek Designated Groundwater Basin
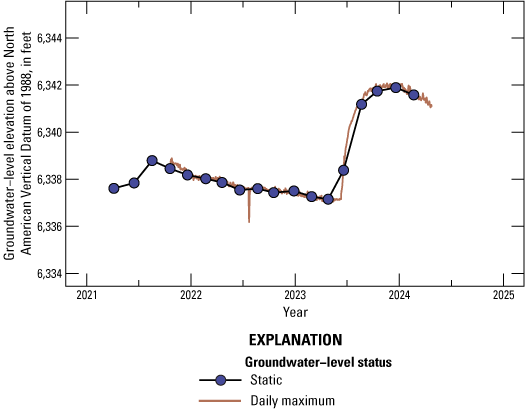
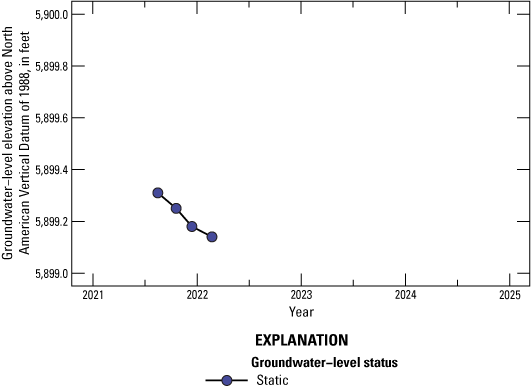
From April 2021 through February 2024, more than 500 discrete and 150,000 time-series groundwater-level measurements were made in the Upper Black Squirrel Creek Basin groundwater monitoring network. Hydrographs showing groundwater-level elevations for discrete and time-series measurements through time for each well in the network are provided in appendix 2 (figs. 2.1–2.39).
Seasonal Patterns and Trends in Discrete and Time-Series Groundwater-Level Elevations
Groundwater-level elevations derived from discrete measurements and pressure-transducer time-series measurements generally followed a seasonal pattern of low elevations during the summer and fall and higher elevations in the winter and early spring (app. 2, figs. 2.1–2.39). Increased agricultural irrigation during the spring and summer growing seasons and pumping had a marked effect on the seasonal variations of the groundwater-level elevations and a higher likelihood of a downward pattern. Seasonal variations are also caused by natural processes, including precipitation and evapotranspiration in aquifer zones connected to the land surface and timing of aquifer recharge in confined aquifer zones (Paschke, 2011). Although seasonal patterns were more noticeable in time-series wells, they were also evident in many of the discrete measurement wells. The magnitude of this seasonal pattern varied from well to well. Wells such as TDW17, TKD1, TKD28, TKD30, KA8, KA25, and KLF4 showed seasonal variations of several feet (app. 2). However, other wells such as QAL16, TDW19, TDW22, KA6, and KP34 had seasonal fluctuations of less than two feet (app. 2). This pattern is consistent with what was noted by Malenda and Penn (2020) for selected Douglas County, Colo., wells screened in the Denver Basin bedrock aquifers.
Of the 27 discrete wells monitored during the study period that had sufficient data for the sM-K trend test, seven wells (TDW21, TKD7, TKD30, KA2, KA6, KA8, and KP34) had statistically significant trends (table 3). The Upper Black Squirrel Creek alluvial aquifer and the Laramie-Fox Hills aquifer did not have any wells with significant sM-K trends. Each of the wells with a significant seasonal trend also had a significant trend in the same direction and similar magnitude for the entire study period (table 3; fig. 4). Of the seven wells with significant seasonal trends, TKD7, KA2, and KA6 had a negative seasonal trend, and all other wells had a positive seasonal trend (table 3). The seasonal trend at well KA8, 38.46 feet per year (ft/yr), was likely affected by electrical issues with the pump that were noted by the landowner in late 2021–early 2022 before being resolved soon afterwards.
Table 3.
Trend analysis summary of discrete groundwater-level elevation data, April 2021 through February 2024, Upper Black Squirrel Creek Designated Groundwater Basin, El Paso County, Colorado.[Refer to table 2 and figure 1 for well locations. The discrete data record analyzed was from April 2021 through February 2024 (USGS, 2024). Only static measurements were used in the discrete dataset, unless noted otherwise. Mann-Kendall trend tests (Mann, 1945; Kendall, 1975; Helsel and others, 2020) and the Theil-Sen slope estimator (Sen, 1968; Hirsch and others, 1982) were used to calculate trends. Trends are considered statistically significant if the p value is less than or equal to the defined alpha of 0.1. Tau, rank correlation coefficient, also known as “Kendall's tau” (Kendall, 1975); p value, probability value; ft/yr, foot per year; QAL, Upper Black Squirrel Creek alluvial aquifer well; --, not calculated because of insufficient data; TDW, Lower Dawson aquifer well; TKD, Denver aquifer well; KA, Arapahoe aquifer well; KLF, Laramie-Fox Hills aquifer well; KP, Pierre Shale well]
| Well common name | Hydrograph appendix 2 figure number | Discrete data | |||||
|---|---|---|---|---|---|---|---|
| Mann-Kendall trend test | Theil-Sen slope estimator | Seasonal Mann-Kendall trend test | Seasonal Theil-Sen slope estimator | ||||
| Tau | P value | Trend (ft/yr) | Tau | P value | Trend (ft/yr) | ||
| QAL11 | 2.1 | 0.10 | 0.60 | 0.35 | 0.22 | 0.52 | 0.55 |
| QAL14 | 2.3 | 0.31c | 0.08c | 0.74c | 0.33 | 0.29 | 0.62 |
| QAL15 | 2.4 | 0.02 | 0.94 | 0.07 | 0.11 | 0.83 | 1.39 |
| QAL16 | 2.5 | 0.29 | 0.39 | 1.86 | -- | -- | -- |
| QAL35 | 2.6 | 0.93c | 0.01c | 0.46c | -- | -- | -- |
| QAL36 | 2.7 | 0.68c | 0.05c | 0.41c | -- | -- | -- |
| QAL37 | 2.8 | −0.85c | 0.01c | −0.27c | -- | -- | -- |
| QAL38 | 2.9 | 0.71c | 0.04c | 1.59c | -- | -- | -- |
| QAL39 | 2.10 | 0.87c | 0.02c | 1.60c | -- | -- | -- |
| TDW17 | 2.11 | 0.16 | 0.43 | 0.70 | 0.00 | 1.00 | −0.02 |
| TDW18a | 2.12 | 0.00 | 1.00 | −2.79 | −0.38 | 0.26 | −8.08 |
| TDW19 | 2.13 | 0.18 | 0.37 | 0.29 | 0.14 | 0.77 | 0.00 |
| TDW20 | 2.14 | 0.22 | 0.26 | 0.97 | 0.29 | 0.46 | 0.88 |
| TDW21 | 2.15 | 0.47c | 0.01c | 1.50c | 0.64c | 0.04c | 1.46c |
| TDW22 | 2.16 | 0.19 | 0.29 | 0.14 | 0.39 | 0.17 | 0.15 |
| TDW33 | 2.17 | 0.10 | 0.59 | 0.24 | 0.06 | 1.00 | 0.04 |
| TKD1 | 2.18 | 0.03 | 0.90 | 0.08 | 0.13 | 0.82 | 0.19 |
| TKD7 | 2.19 | −0.65c | 0.001c | −0.45c | −0.80c | 0.04c | −0.74c |
| TKD10 | 2.21 | 0.23 | 0.24 | 0.80 | 0.21 | 0.61 | 0.58 |
| TKD12 | 2.22 | 0.39c | 0.09c | 5.45c | -- | -- | -- |
| TKD24 | 2.23 | 0.24 | 0.55 | 0.67 | -- | -- | -- |
| TKD27a | 2.24 | −0.20 | 0.65 | −0.44 | 0.67 | 0.22 | 2.34 |
| TKD28 | 2.25 | 0.34c | 0.10c | 1.33c | 0.60 | 0.14 | 0.97 |
| TKD30 | 2.27 | 0.37c | 0.05c | 2.44c | 0.57c | 0.09c | 1.82c |
| TKD31b | 2.28 | 0.33 | 0.15 | 6.93 | 0.67 | 0.22 | 9.10 |
| KA2 | 2.29 | −0.42c | 0.02c | −0.85c | −0.56c | 0.06c | −0.94c |
| KA6 | 2.31 | −0.75c | <0.001c | −0.67c | −0.88c | 0.003c | −0.65c |
| KA8 | 2.32 | 0.58c | 0.01c | 17.51c | 1.00c | 0.04c | 38.46c |
| KA23a | 2.33 | −0.33 | 0.45 | −13.48 | −0.67 | 0.22 | −17.47 |
| KA25 | 2.34 | −0.05 | 0.85 | −0.38 | 0.00 | 1.00 | 0.15 |
| KA26a | 2.35 | 0.67 | 0.31 | 10.86 | −0.33 | 0.42 | −5.00 |
| KLF4 | 2.36 | 0.15 | 0.44 | 4.15 | 0.14 | 0.81 | 1.23 |
| KLF5 | 2.37 | 0.31c | 0.08c | 0.68c | 0.33 | 0.29 | 0.59 |
| KLF32 | 2.38 | −0.12 | 0.56 | −0.17 | −0.50 | 0.13 | −0.20 |
| KP34 | 2.39 | 0.66c | <0.001c | 0.31c | 0.61c | 0.03c | 0.20c |
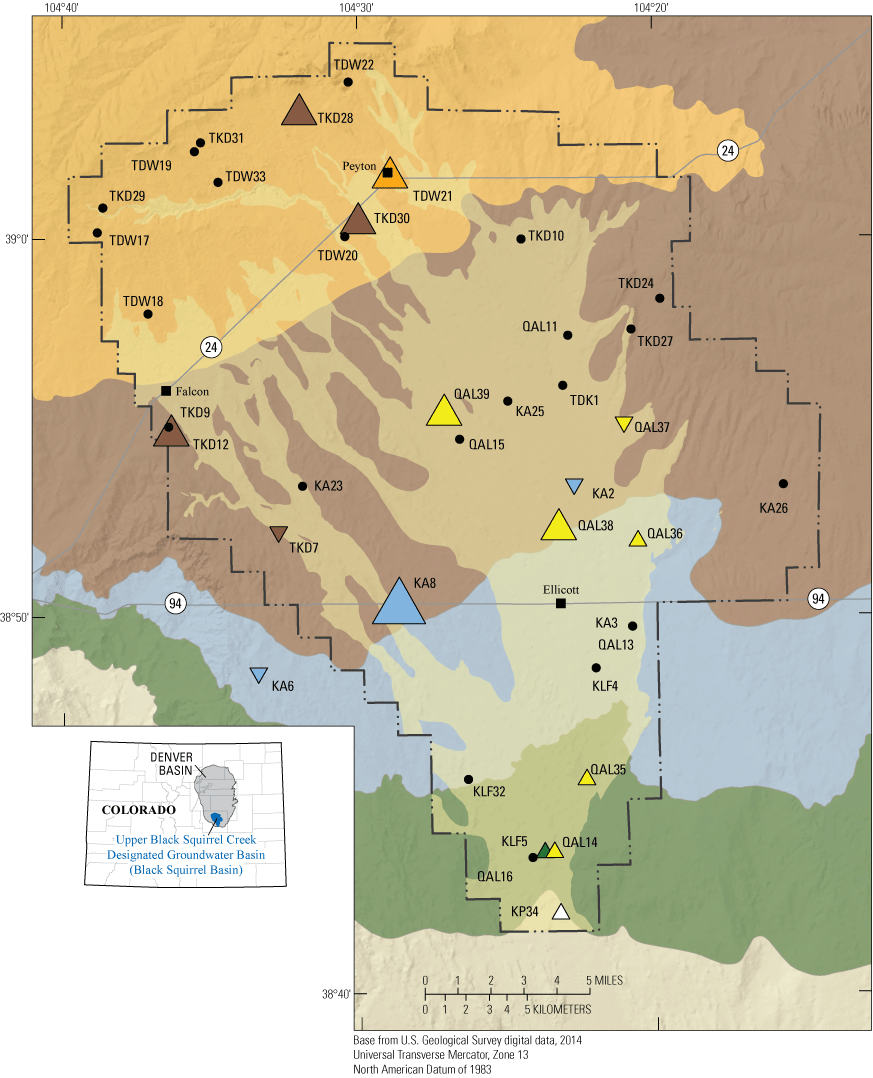
Map showing the distribution of significant trends in discrete groundwater-level elevation, by aquifer, for wells in the Upper Black Squirrel Creek Designated Groundwater Basin, El Paso County, Colorado. QAL, Upper Black Squirrel Creek alluvial aquifer well; TDW, lower Dawson aquifer well; TKD, Denver aquifer well; KA, Arapahoe aquifer well; KLF, Laramie-Fox Hills aquifer well; KP, Pierre Shale well.
Of the 6 wells (QAL11, QAL14, TDW21, TKD7, KA6, and KLF5) with sufficient time-series data (greater than two years) to complete a sM-K trend test on the dataset, 3 wells had statistically significant trends: QAL14 (1.23 ft/yr), KA6 (−0.53 ft/yr), and KLF5 (1.26 ft/yr; table 4). Other time-series wells showed a lack of consistent seasonal pattern from one year to the next possibly because of either the effect of pumping or increases in recharge in 2023 (app. 2, figs. 2.1, 2.15, and 2.17). Continued monitoring at the wells where trends were not significant or could not be calculated could increase the likelihood of significant trends being observed at those wells in the future.
Table 4.
Trend analysis summary of time-series groundwater-level elevation data, October 2021 through February 2024, Upper Black Squirrel Creek Designated Groundwater Basin, El Paso County, Colorado.[Refer to table 2 and figure 1 for well locations. The time-series data analyzed were from October 2021 through February 2024 (USGS, 2024). Mann-Kendall trend tests (Mann, 1945; Kendall, 1975; Helsel and others, 2020) and the Theil-Sen slope estimator (Sen, 1968; Hirsch and others, 1982) were used to calculate trends. Trends are considered statistically significant if the p value is less than or equal to the defined alpha of 0.1. Tau, rank correlation coefficient, also known as “Kendall’s tau” (Kendall, 1975); p value, probability value; ft/yr, foot per year; QAL, Upper Black Squirrel Creek alluvial aquifer well; TDW, Lower Dawson aquifer well; --, not calculated because of insufficient data; TKD, Denver aquifer well; KA, Arapahoe aquifer well; KLF, Laramie-Fox Hills aquifer well]
| Well common name | Hydrograph appendix 2 figure number | Time-series data | |||||
|---|---|---|---|---|---|---|---|
| Mann-Kendall trend test | Theil-Sen slope estimator | Seasonal Mann-Kendall trend test | Seasonal Theil-Sen slope estimator | ||||
| Tau | P value | Trend (ft/yr) | Tau | P value | Trend (ft/yr) | ||
| QAL11 | 2.1 | 0.03 | 0.25 | 0.23 | 0.27 | 0.32 | 1.74 |
| QAL14 | 2.3 | 0.48a | <0.001a | 1.50a | 0.59a | 0.01a | 1.23a |
| TDW21 | 2.15 | 0.27a | <0.001a | 1.19a | 0.27 | 0.32 | 0.88 |
| TDW33 | 2.17 | 0.52a | <0.001a | 0.80a | -- | -- | -- |
| TKD7 | 2.19 | −0.10a | <0.001a | −0.12a | −0.14 | 0.67 | −0.13 |
| TKD24 | 2.23 | 0.35a | <0.001a | 3.65a | -- | -- | -- |
| TKD27 | 2.24 | −0.24a | <0.001a | −0.63a | -- | -- | -- |
| KA6 | 2.31 | −0.62a | <0.001a | −0.65a | −0.93a | 0.001a | −0.53a |
| KLF5 | 2.37 | 0.49a | <0.001a | 1.42a | 0.59a | 0.01a | 1.26a |
Long-Term Trends in Discrete Groundwater-Level Elevations
Of the 39 wells monitored in the study period, 16 wells (QAL14, QAL35, QAL36, QAL37, QAL38, QAL39, TDW21, TKD7, TKD12, TKD28, TKD30, KA2, KA6, KA8, KLF5, and KP34) had statistically significant trends in groundwater-level elevations using the M-K test. For each of the 16 wells, trend estimates were calculated using the Theil-Sen slope estimator (table 3). Only wells TKD12, TKD30, and KA8 had a statistically significant positive trend larger than ±2 ft/yr of groundwater-level elevation (table 3; fig. 4). However, a large overall decrease in groundwater-level elevation at well KA8 during 2021 was observed and was likely due to an electrical problem causing the well pump to frequently fill up the associated pressure tank. The decline in groundwater-level elevation at well KA8 in 2021 without a seasonal increase is not observed in subsequent years (app. 2, fig. 2.32), thus not affecting the positive long-term trend at the well. The significant trends calculated at wells QAL35, QAL36, QAL38, and QAL39 were potentially inflated by the effects of the monsoon precipitation of early-to-mid June 2023 (Colorado Climate Center, 2023) on the small dataset (April 2023 to February 2024; app. 2, figs. 2.6–2.10; fig. 4). Wells QAL11 and QAL15 had large increases in groundwater elevations from April 2023 to June 2023 (5 and 8 ft, respectively) from the precipitation aforementioned; however, these wells did not have significant monotonic trends (app. 2, figs. 2.1 and 2.4; table 3). Discrete groundwater-level elevations at QAL15 show a steady decline since June 2023 as the groundwater-level elevation approaches the groundwater-level elevations in 2021 and 2022.
Wells TKD7 and KA6, near the western edge of the Upper Black Squirrel Creek Basin and new developments surrounding Colorado Highway 94 (fig. 4), show a significant negative trend in groundwater-level elevation. Also, there is an area of negative groundwater elevations near wells QAL37 and KA2, in the eastern-central part of the study area. These four wells (TKD7, KA6, QAL37, and KA2) are the only wells with a significant negative trend throughout the Upper Black Squirrel Creek Basin (table 3; fig. 4).
Four wells, QAL13, TKD9, TKD29, and KA3 (table 2), had an insufficient number of measurements to ascertain whether a significant trend existed and were thus not analyzed. Continued monitoring and more static measurements at these network wells could provide a better understanding of the trends in the Black Squirrel Basin. More data collection could also improve the ability to calculate the statistically significant trends in discrete groundwater-level elevation datasets.
Regional M-K tests were done on data from each aquifer by taking all static measurements from each well finished within an aquifer. Any data affected by pumping was left out of the analysis, as were the data from well KP34; this is the only well finished in the Pierre Shale, so it is impossible to run an rM-K test without more wells in the Pierre Shale. None of the aquifers had a statistically significant trend from April 2021 through February 2024 (table 5). The localized nature of pumping conditions and high variability of water use makes analyzing basinwide trends in each aquifer and for the system more nuanced than the monotonic trends calculated.
Table 5.
Regional trend analysis summary of discrete groundwater-level elevation data in each aquifer, April 2021 through February 2024, Upper Black Squirrel Creek Designated Groundwater Basin, El Paso County, Colorado.[The discrete data record analyzed was from April 2021 through February 2024 (USGS, 2024). Only static measurements were used in the discrete dataset. Mann-Kendall trend tests (Mann, 1945; Kendall, 1975; Helsel and others, 2020) and the Sen slope estimator (Sen, 1968; Hirsch and others, 1982) were used to calculate the trends. Trends are considered statistically significant if the p value is less than or equal to the defined alpha of 0.1. Tau, rank correlation coefficient, also known as “Kendall's tau” (Kendall, 1975); p value, probability value; ft/yr, foot per year]
Long-Term Trends in Time-Series Groundwater-Level Elevations
Hydrographs of time-series groundwater-level elevations from the nine equipped wells agreed with discrete groundwater-level elevations measured at the same wells (refer to the hydrograph figure number [app. 2] listed in table 4). The M-K test results of the 9 time-series groundwater-level elevations (table 4) show 8 of the 9 wells have a statistically significant monotonic trend. Well QAL11 does not show a monotonic trend, likely because of the large increase in groundwater-level elevation observed after June 2023 with a slow recession toward the previous elevations prior to June 2023 (app. 2, fig. 2.1).
Significant trends in the time-series groundwater-level elevation data agreed with the significant trends’ directions and magnitudes calculated from discrete data at wells QAL14, TDW21, TKD7, KA6, and KLF5 (tables 3 and 4). Three wells (TDW33, TKD24, and TKD27) had significant trends in the time-series data but not the discrete data (tables 3 and 4). This study demonstrates how time-series data can be more robust for calculating significant trends than discrete measurements (wells TDW33, TKD24, and TKD27), indicating that every-other month visits may not be as representative of true aquifer conditions as time-series data.
Wells QAL14, TDW21, TDW33, TKD24, and KLF5 show a positive trend in groundwater-level elevation (ft/yr) through the study period (table 4). Wells QAL14, KLF5, and TDW33 had a positive trend ranging from 1.19 to 1.50 ft/yr. Wells QAL14 and KLF5 are paired wells near the southern end of the Denver Basin aquifer system (fig. 1) away from the areas of development along U.S. Highway 24 and Colorado Highway 94. These wells are also downgradient from recharge infiltration basins that bring treated wastewater into the alluvial aquifer (Kisfalusi and others, 2022). The trend observed at well TKD24 could be affected by the insufficient dataset with less than a year’s worth of data to assess long-term trends using the M-K test (app. 2; tables 2, 3, and 4). The other wells (TKD7, TKD27, and KA6) had a significant negative trend in groundwater-level elevation through time (table 4).
Potentiometric-Surface Maps
Maps of the groundwater-level elevation, also known as water-table maps in unconfined aquifers or potentiometric-surface maps in confined aquifers, were derived from static discrete groundwater levels measured in April 2023 in the Upper Black Squirrel Creek alluvial aquifer (fig. 5), lower Dawson aquifer (fig. 6), and Denver aquifer (fig. 7). April 2023 had the most static measurements across all aquifer units throughout the study period. The potentiometric surface can be used to show the general direction of groundwater flow. Groundwater flows from areas of high hydraulic head (higher groundwater-level elevation) to areas of low hydraulic head (lower groundwater-level elevation); flow direction is assumed to be generally perpendicular to the contours. The April 2023 water-table map and potentiometric surfaces for the three aquifers are displayed using 100-ft contour intervals.
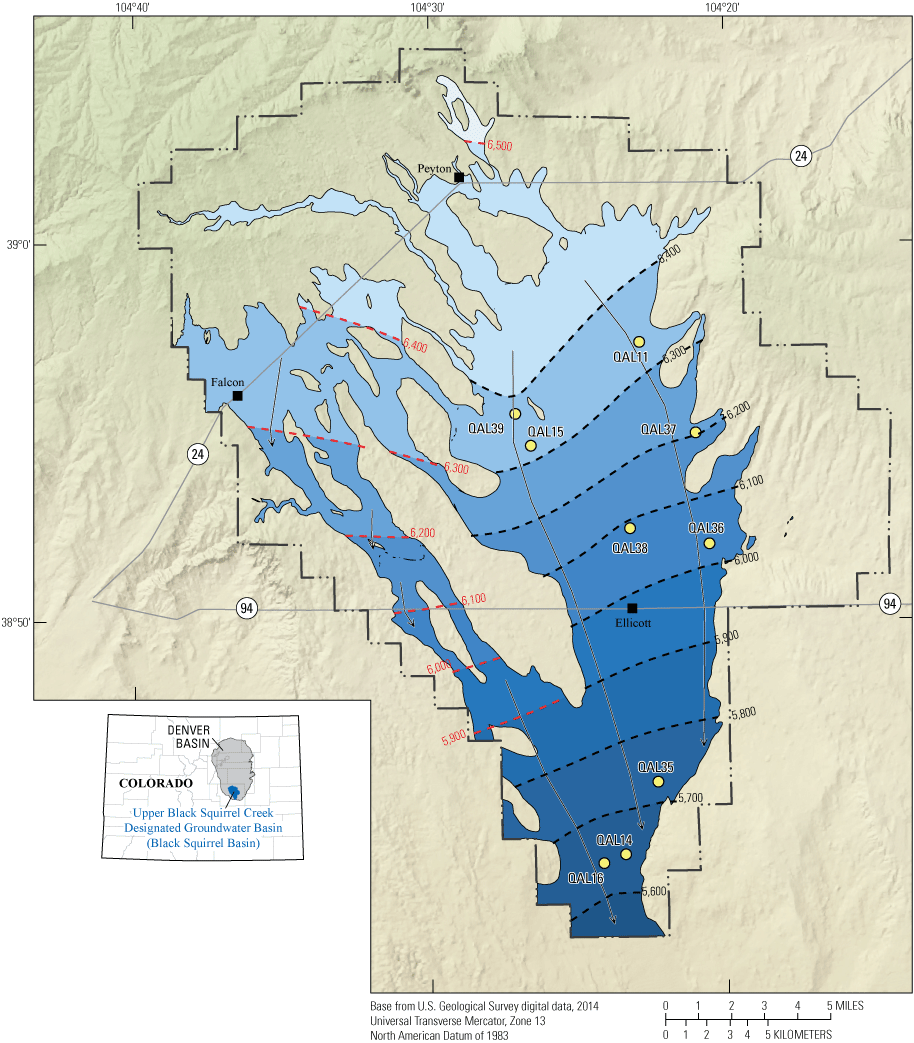
Map showing estimates of groundwater-level elevations for the alluvial aquifer in April 2023, Upper Black Squirrel Creek Designated Groundwater Basin, El Paso County, Colorado. QAL, Upper Black Squirrel Creek alluvial aquifer.
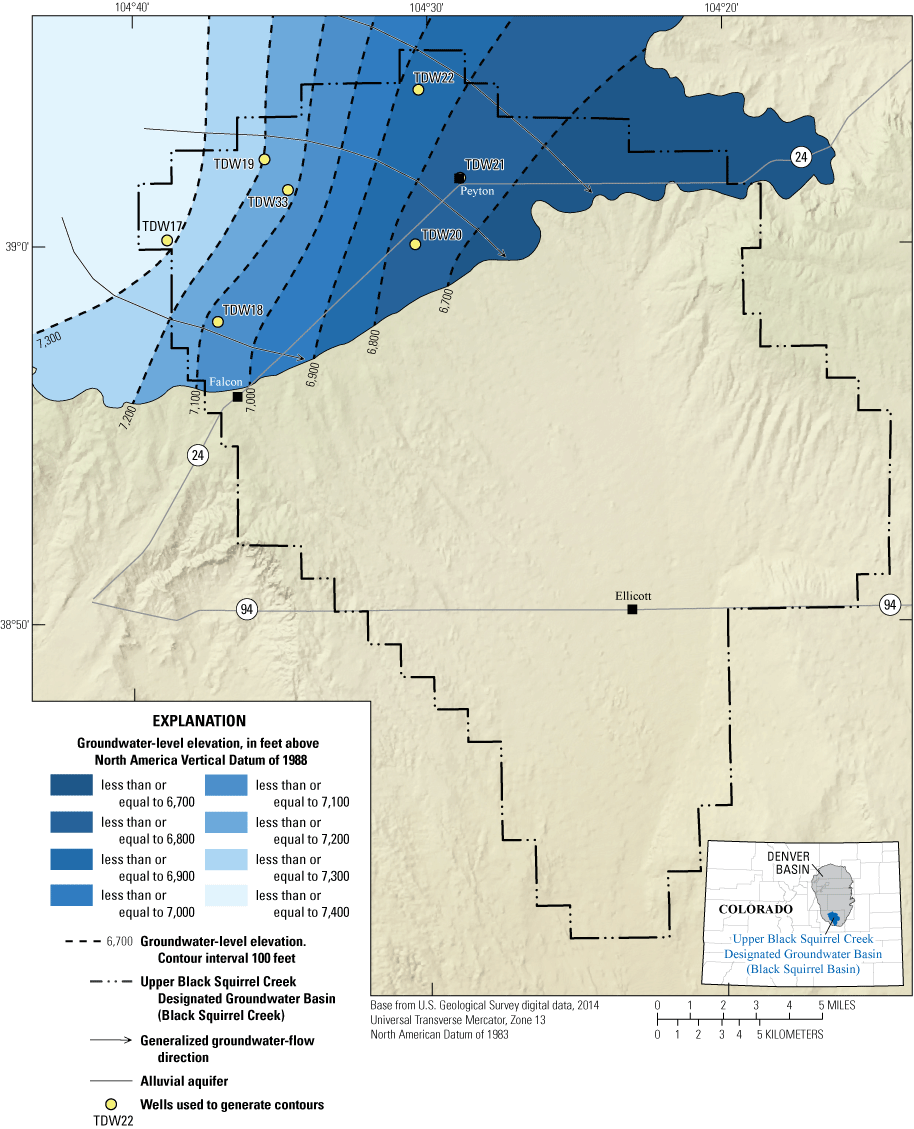
Map showing estimates of groundwater-level elevations for the lower Dawson aquifer in April 2023, Upper Black Squirrel Creek Designated Groundwater Basin, El Paso County, Colorado. TDW, lower Dawson aquifer
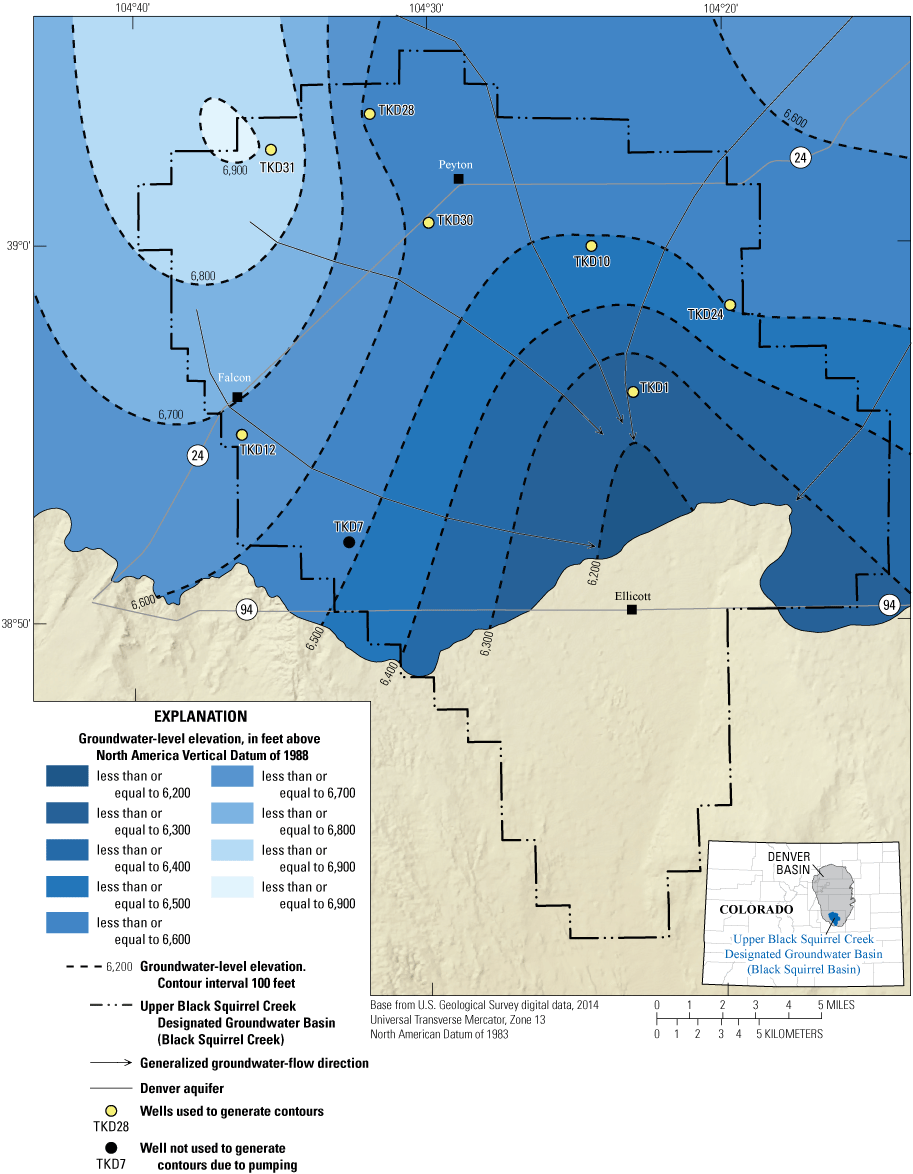
Map showing estimates of groundwater-level elevations for the Denver aquifer in April 2023, Upper Black Squirrel Creek Designated Groundwater Basin, El Paso County, Colorado. TKD, Denver aquifer
The general direction of the groundwater flow in the Upper Black Squirrel Creek alluvial aquifer is from north to south following topography (fig. 5). These results are consistent with findings of Topper (2008) and Wellman and Rupert (2016) with the water table dropping nearly 800 ft from around Falcon and Peyton and to the south of Ellicott at the southern boundary of the Upper Black Squirrel Creek Basin (fig. 1). The extent of the map (fig. 5) was limited by the lack of alluvial wells in the western limbs and northern part of the alluvial aquifer in comparison to findings from Topper (2008) and Wellman and Rupert (2016).
The direction of the groundwater flow in both the lower Dawson and Denver aquifers is from the far northwestern part of the Upper Black Squirrel Creek Basin to the east-southeast (figs. 6 and 7); this is consistent with groundwater-flow model results from Paschke (2011). Generally, the groundwater-level elevations decrease in the Denver aquifer as the aquifer transitions from a confined to an unconfined setting after the lower Dawson aquifer pinches out around Falcon and Peyton (figs. 1 and 2).
The potentiometric surface of the Arapahoe aquifer is difficult to fully interpret with the small number of static measurements and number of wells. More wells in this aquifer, farther to the north and northwest, could be helpful to better understand the groundwater-flow paths in the Black Squirrel Basin. The Laramie-Fox Hills aquifer and Pierre Shale did not have enough wells in the network to create a potentiometric-surface map.
Additional Research
Results from this study could be used as the foundation for planning additional monitoring efforts and represent an important tool that could aid local water resource managers with decisions on water use within the Upper Black Squirrel Creek Basin and El Paso County.
Continued monitoring and analyses could confirm trends observed during this study and identify changing conditions in groundwater-level elevations. Continued monitoring (that is, more static measurements) at wells in this study showing no significant trend could lead to significant trends by providing more data points as inputs to the M-K test and the sM-K test. Equipping more existing wells with pressure transducers, or collecting more time-series data, could provide a more robust record of patterns in groundwater-level elevations between discrete measurements for a potentially better assessment of significant trends. Additional monitoring efforts could include soliciting more landowners for well access, measuring groundwater levels in all CDWR wells, instrumenting all CDWR wells, and (or) installing new nested monitoring wells in the areas of residential development and municipal pumping. Nested wells, along with aquifer pump testing, could be used to better assess aquifer connectivity in the same geographic area. Geophysical techniques also could be used for assessing aquifer properties. Specific geophysical techniques could include relative-gravity surveys and borehole magnetic resonance sounding to obtain hydraulic conductivity, transmissivity, and storage.
Watts (1995) concluded the alluvial aquifer is recharged by flow from the Denver and Arapahoe aquifers but recharges the Laramie-Fox Hills aquifer in the southern part of the Black Squirrel Basin. The Watts (1995) assessment predates the installation of the recharge infiltration basins added to the southern part of the Upper Black Squirrel Creek Basin in 2012 (Upper Black Squirrel Creek Ground Water Management District, written commun., 2023). Bedrock aquifers contribute about 7 percent of the recharge to the alluvial aquifer, but the net vertical flow was simulated to decrease from pre-1949 to 1990 (Watts, 1995). Current (2024) hydrogeologic conditions in the aquifers of the Black Squirrel Basin, including effects from increased public water supply withdrawals, could be quantified using the U.S. Environmental Protection Agency’s Wellhead Analytic Element Model (Haitjema Software LLC, 2018) or similar methods. Continued groundwater monitoring could be highly beneficial to understanding the effects of former and future water use on aquifer response, recovery, and long-term sustainability (Ruybal and others, 2019a, b) with the aid of an analytical element model.
A regional study and analysis that includes groundwater-level data from other monitoring networks in the Denver Basin aquifer system, such as groundwater networks in Elbert County (Penn and Everett, 2019) and Douglas County (Everett, 2014; Malenda and Penn, 2020), could provide a better understanding of how groundwater levels are changing beyond the Upper Black Squirrel Creek Basin and how those changes could affect groundwater resources in east-central El Paso County. Both Douglas (Malenda and Penn, 2020) and Elbert (Penn and Everett, 2019) Counties have had a recent increase in development and have rural areas where residents rely on domestic wells in the Denver Basin aquifer system similar to the landowners and water users in the Black Squirrel Basin. A regional study could produce regional groundwater-level elevation trend maps and regional potentiometric surface and hydraulic-head difference maps, which could provide additional model calibration data to update and possibly improve the Denver Basin groundwater-flow model (Paschke, 2011).
Summary
The Upper Black Squirrel Creek Designated Ground Water Basin (Black Squirrel Basin) is a part of the growing El Paso County. As a designated basin, the area has meager surface water, and water users primarily rely on groundwater to meet their water resource needs. Groundwater within the Upper Black Squirrel Creek Basin is pumped from four bedrock aquifers in the Denver Basin aquifer system (lower Dawson aquifer; Denver aquifer; Arapahoe aquifer; and Laramie-Fox Hills aquifer) and the unconsolidated Upper Black Squirrel Creek alluvial aquifer. The U.S. Geological Survey, in cooperation with the Upper Black Squirrel Creek Ground Water Management District, began a study in 2021 to establish a baseline dataset and assess the groundwater resources of the aquifers within the Black Squirrel Basin. A network of 39 wells was established in 2021, and discrete groundwater-level measurements were made on a bimonthly interval. The start dates of the well data records were noncontemporaneous, with wells being removed and added throughout the study period. Nine of the 39 wells in the study were equipped with pressure transducers to record hourly groundwater-level data.
The purpose of this report was to measure and analyze groundwater-level elevation changes and monotonic trends throughout the network from April 2021 through February 2024. Trends in static discrete groundwater-level elevations measured during each site visit and monthly mean values of daily maximum groundwater-level elevations in time-series data were tested for significance using the nonparametric Mann-Kendall (M-K) trend test and seasonal Mann-Kendall (sM-K) trend test, respectively. A regional Mann-Kendall (rM-K) trend test was also used to calculate basinwide trends in each aquifer. Trends were calculated in feet per year using the nonparametric Theil-Sen slope estimate. Maps of the groundwater-level elevation, also known as water-table maps (unconfined aquifers) or potentiometric-surface maps (confined aquifers), were derived from static discrete groundwater levels measured in April 2023 in the Upper Black Squirrel Creek alluvial, lower Dawson, and Denver aquifers.
Statistically significant seasonal trends were observed in seven wells (TDW21, TKD7, TKD30, KA2, KA6, KA8, and KP34) of the 26 discrete measured wells monitored during the study period with sufficient data for the sM-K trend test. Of the six wells with sufficient time-series data for a sM-K trend test, wells QAL14, KA6, and KLF5 had a statistically significant trend. Other time-series wells had a lack of a consistent seasonal pattern from one year to the next possibly because of either the effect of pumping or increases in recharge in 2023. The rM-K trend test did not show any aquifer with multiple wells to have a statistically significant trend.
All five aquifers (Upper Black Squirrel Creek alluvial aquifer, lower Dawson aquifer, Denver aquifer, Arapahoe aquifer, and Laramie-Fox Hills aquifer), along with the well finished in the Pierre Shale, had a statistically significant long-term trend in at least one well using the M-K trend test on the discrete data. A negative trend was calculated at wells TDK7, KA2, and KA6. A longer study period and more static measurements could increase the frequency of significant trends by providing more data.
All the time-series wells, minus well QAL11, had a statistically significant trend during the study period using the M-K trend test. Wells TKD7 and KA6 were the only wells with a statistically significant negative trend for the discrete measurements and the time-series groundwater-level elevations. Wells QAL14, KLF5, and TDW33 had a positive trend ranging from 1.19 to 1.50 feet per year.
The direction of groundwater flow in the Upper Black Squirrel Creek alluvial aquifer was generally from north to south following topography and past interpretations. Potentiometric-surface maps of the lower Dawson and Denver aquifers for April 2023 indicate groundwater flow is generally from northwest to east-southeast in each aquifer. The dataset of the Arapahoe aquifer, with the small number of static measurements and wells in the network, made the potentiometric-surface map difficult to fully interpret. The Laramie-Fox Hills aquifer and Pierre Shale did not have enough wells in the network to make a potentiometric-surface map.
The results of this study could guide additional groundwater monitoring in the Upper Black Squirrel Creek Basin and El Paso County and aid in long-term planning of water resources. This study indicates the potential benefit of adding wells in areas of development and municipal pumping; new nested monitoring wells could help provide a better understanding of trends and connections between the aquifers. Aquifer testing, geophysical surveys, and an analytical element model are tools that could be used to better understand the hydrogeology of the Black Squirrel Basin, including connectivity between aquifer units. These tools could be used in areas of interest, possibly those affected by growth in development. The results of this study could also be used as part of a regional study of groundwater-level elevations in the Denver Basin aquifer system to provide additional calibration data for the Denver Basin groundwater-flow model.
References Cited
Banta, E.R., 1989, Hydrologic effects of pumpage from the Denver Basin bedrock aquifers of northern El Paso County, Colorado: U.S. Geological Survey Water-Resources Investigations Report 88–4033, 81 p., accessed March 24, 2024, at https://doi.org/10.3133/wri884033.
Bauch, N.J., Musgrove, M., Mahler, B.J., and Paschke, S.S., 2014, The quality of our Nation’s waters—Water quality in the Denver Basin aquifer system, Colorado, 2003–05: U.S. Geological Survey Circular 1357, 100 p., accessed November 2023 at https://doi.org/10.3133/cir1357.
Brendle, D.L., 1997, Have nitrate concentrations changed in the alluvial aquifer of the Upper Black Squirrel Creek Basin since 1984?: U.S. Geological Survey Fact Sheet 072–97, 4 p., accessed February 24, 2024, at https://doi.org/10.3133/fs07297.
Buckles, D.R., and Watts, K.R., 1988, Geohydrology, water quality, and preliminary simulations of ground‐water flow of the alluvial aquifer in the Upper Black Squirrel Creek Basin, El Paso County, Colorado: U.S. Geological Survey Water‐Resources Investigations Report 88–4017, 49 p., accessed December 2023 at https://doi.org/10.3133/wri884017.
Colorado Climate Center, 2023, North American monsoon: Colorado State University, accessed September 11, 2024, at https://climate.colostate.edu/co_nam.html.
Colorado Division of Water Resources [CDWR], 2023, Designated basins: Colorado Division of Water Resources webpage, accessed December 12, 2023, at https://dwr.colorado.gov/services/well-permitting/designated-basins#:~:text=Designated%20Groundwater%20Basins%20(Designated%20Basins,outside%20of%20th e%20Designated%20Basins.
Colorado State Demography Office, 2020, Colorado State Demography Office population statistics: Colorado Department of Local Affairs website, accessed November 10, 2020, at https://demography.dola.colorado.gov/.
Colorado Water Conservation Board and Colorado Division of Water Resources [CDWR], 2023a, Colorado’s Decision Support Systems—Well permits: Colorado Division of Water Resources website, accessed December 12, 2023, at https://dwr.state.co.us/Tools/WellPermits.
Colorado Water Conservation Board and Colorado Division of Water Resources [CDWR], 2023b, Colorado’s Decision Support Systems—Groundwater—Water levels data: Colorado Division of Water Resources website, accessed December 12, 2023, at https://dwr.state.co.us/Tools/GroundWater/WaterLevels.
Cunningham, W.L., and Schalk, C.W., 2011, Groundwater technical procedures of the U.S. Geological Survey: U.S. Geological Survey Techniques and Methods, book 1, chap. A1, 151 p., accessed November 2023 at https://doi.org/10.3133/tm1A1.
De Cicco, L.A., Hirsch, R.M., Lorenz, D., and Johnson, M., 2023, dataRetrieval—R packages for discovering and retrieving water data available from U.S. Federal hydrologic web services: U.S. Geological Survey, v. 2.7.12, accessed February 27, 2023, at https://doi.org/10.5066/P9X4L3GE.
Emmons, P.J., 1977, Artificial-recharge tests in Upper Black Squirrel Creek Basin, Jimmy Camp Valley, and Fountain Valley, El Paso County, Colorado: U.S. Geological Survey Water-Resources Investigations Report 77–11, 49 p., accessed December 2023 at https://doi.org/10.3133/wri7711.
Everett, R.R., 2014, Groundwater levels in the Denver Basin bedrock aquifers of Douglas County, Colorado, 2011–2013: U.S. Geological Survey Scientific Investigations Report 2014–5172, 45 p., accessed December 2023 at https://doi.org/10.3133/sir20145172.
Flor, A.D., 2023a, Groundwater levels in the Denver Basin bedrock aquifers: Colorado Division of Water Resources, Colorado Department of Natural Resources, 277 p., accessed December 12, 2023, at https://dnrweblink.state.co.us/dwr/ElectronicFile.aspx?docid=4177552&dbid=0.
Flor, A.D., 2023b, Groundwater levels in the Upper Black Squirrel designated groundwater Basin: Colorado Division of Water Resources, Colorado Department of Natural Resources, 39 p., accessed December 12, 2023, at https://dnrweblink.state.co.us/dwr/ElectronicFile.aspx?docid=4049479&dbid=0.
Freeman, L.A., Carpenter, M.C., Rosenberry, D.O., Rousseau, J.P., Unger, R., and McLean, J.S., 2004, Use of submersible pressure transducers in water-resources investigations: U.S. Geological Survey Techniques of Water-Resources Investigations book 8, chap. A3, 52 p., accessed October 2021 at https://doi.org/10.3133/twri08A3.
Haitjema Software LLC, 2018, Wellhead analytic element model (WhAEM), version 3.3.2: Washington, D.C., U.S. Environmental Protection Agency software release, accessed December 2023 at https://www.epa.gov/hydrowq/wellhead-analytic-element-model-whaem. [Program documentation for the wellhead analytic element model.]
Helsel, D.R., and Frans, L.M., 2006, Regional Kendall test for trend: Environmental Science & Technology, v. 40, no. 13, p. 4066–4073, accessed March 3, 2024, at https://doi.org/10.1021/es051650b.
Helsel, D.R., Hirsch, R.M., Ryberg, K.R., Archfield, S.A., and Gilroy, E.J., 2020, Statistical methods in water resources: U.S. Geological Survey Techniques and Methods, book 4, chapter A3, 458 p., accessed June 2020 at https://doi.org/10.3133/tm4A3. [Supersedes USGS Techniques of Water-Resources Investigations, book 4, chapter A3, version 1.1.]
Hillier, D.E., Brogden, R.E., and Schneider, P.A., Jr., 1978, Hydrology of the Arapahoe aquifer in the Englewood-Castle Rock area south of Denver, Denver Basin, Colorado: U.S. Geological Survey Miscellaneous Investigations Series, Map I–1043, 2 pl., accessed September 2019 at https://doi.org/10.3133/i1043.
Hirsch, R.M., Slack, J.R., and Smith, R.A., 1982, Techniques of trend analysis for monthly water quality data: Water Resources Research, v. 18, no. 1, p. 107–121, accessed November 2023 at https://doi.org/10.1029/WR018i001p00107.
Hodson, T.O., Hariharan, J.A., Black, S., and Horsburgh, J.S., 2023, Dataretrieval (Python)—A Python package for discovering and retrieving water data available from U.S. Federal hydrologic web services: U.S. Geological Survey software release, https://doi.org/10.5066/P94I5TX3.
In-Situ, Inc., 2023, Level TROLL® 400, 500 & 700 Data Loggers spec sheet: Fort Collins, Colo., In-Situ, Inc., 2 p., accessed November 20, 2023, at https://in-situ.com/pub/media/support/documents/LevelTROLL_Spec-Sheet_ltr_en_0723.pdf.
Kisfalusi, Z.D., Bauch, N.J., and Bern, C.R., 2022, Characterization of and temporal changes in groundwater quality of the Upper Black Squirrel Creek Basin, El Paso County, Colorado, 2018–20: U.S. Geological Survey Scientific Investigations Report 2022–5061, 43 p., accessed October 2023 at https://doi.org/10.3133/sir20225061.
Koger, W., Moore, J., Brown, J., Antonio, A., and Woodward, E., 2019, Water Master Plan: Colorado Springs, Colo., El Paso County Planning and Community Development Department, prepared by Forsgren Associates, Inc., Salt Lake City, Utah, 272 p., accessed November 7, 2020, at https://epc-assets.elpasoco.com/wp-content/uploads/sites/12/WaterMasterPlan2018/Water-Master-Plan-2018-A-Copy.pdf.
Lorenz, D.L., 2014, General tools for hydrologic data and trend analysis: U.S. Geological Survey, accessed February 25, 2023, at https://code.usgs.gov/water/analysis-tools/smwrQW.
Malenda, H.F., and Penn, C.A., 2020, Groundwater levels in the Denver Basin bedrock aquifers of Douglas County, Colorado, 2011–19: U.S. Geological Survey Scientific Investigations Report 2020–5076, 44 p., accessed November 2023 at https://doi.org/10.3133/sir20205076.
Mann, H.B., 1945, Nonparametric tests against trend: Econometrica, v. 13, no. 3, p. 245–259, accessed February 25, 2023, at https://doi.org/10.2307/1907187.
McCluskey, M., Poceta, J., Smith, N., and McCurry, G., 2006, South Platte Decision Support System phase 3, task 44.2—Denver Basin region water level technical memorandum—Final: Colorado Water Conservation Board Division of Water Resources, prepared by CDM Smith, Boston, Mass., 65 p., accessed April 2, 2020, at https://dnrftp.state.co.us/DWR/HydroGeology/Denver_Basin_Atlases_Complete/SPDSS/spdss44-2_20061128.pdf.
McConaghy, J.A., Chase, G.H., and Boettcher, A., 1964, Hydrogeologic data of the Denver Basin, Colorado: Colorado Water Conservation Board Basic Data Report Number 15, 224 p., accessed February 25, 2024, at https://api.semanticscholar.org/CorpusID:126825202.
McGovern, H.E., and Jenkins, E.D., 1966, Ground water in Black Squirrel Creek Valley, El Paso County, Colorado: U.S. Geological Survey Hydrologic Atlas 236, 1 sheet, scale 1:62,500, accessed January 22, 2021, at https://doi.org/10.3133/ha236.
Millard, S.P., 2013, EnvStats—An R package for environmental statistics: Springer, New York, 291 p., accessed May 2, 2024, at https://link.springer.com/book/10.1007/978-1-4614-8456-1.
Paschke, S.S., ed., 2011, Groundwater availability of the Denver Basin aquifer system, Colorado: U.S. Geological Survey Professional Paper 1770, 274 p., accessed December 2023 at https://doi.org/10.3133/pp1770.
Penn, C.A., and Everett, R.R., 2019, Groundwater-level elevations in the Denver Basin bedrock aquifers of Elbert County, Colorado, 2015–18, U.S. Geological Survey Scientific Investigations Report 2019–5014, 50 p., accessed December 2023 at https://doi.org/10.3133/sir20195014.
Pottorff, E.T., and Horn, A., 2013, Groundwater levels in the Denver Basin bedrock aquifers, 2013: Colorado Division of Water Resources, 198 p, accessed June 2, 2020, at https://dnrweblink.state.co.us/dwr/ElectronicFile.aspx?docid=2769885&dbid=0.
R Core Team, 2018, R—A language and environment for statistical computing (version 4.1.3): Vienna, Austria, R Foundation for Statistical Computing, accessed March 1, 2023, at https://www.R-project.org/.
Raynolds, R.G., 2002, Upper Cretaceous and Tertiary stratigraphy of the Denver Basin, Colorado: Rocky Mountain Geology, v. 37, no. 2, p. 111–134, accessed December 2023 at https://doi.org/10.2113/gsrocky.37.2.111.
Raynolds, R.G.H., Johnson, K.R., Arnold, L.R., Farnham, T.M., Fleming, R.F., Hicks, J.F., Kelley, S.A., Lapey, L.A., Nichols, D.J., Obradovich, J.D., and Wilson, M.D., 2001, The Kiowa core, a continuous drill core through the Denver Basin bedrock aquifers at Kiowa, Elbert County, Colorado: U.S. Geological Survey Open-File Report 2001–185, 127 p., accessed December 2023 at https://doi.org/10.3133/ofr01185.
Robson, S.G., 1987, Bedrock aquifers in the Denver Basin, Colorado—A quantitative water-resources appraisal: U.S. Geological Survey Professional Paper 1257, 73 p., 5 pl., accessed November 2023 at https://doi.org/10.3133/pp1257.
Robson, S.G., Romero, J.C., and Zawistowski, S., 1981a, Geologic structure, hydrology, and water quality of the Arapahoe aquifer in the Denver Basin, Colorado: U.S. Geological Survey Hydrologic Atlas 647, scale 1:500,000, 3 pl., accessed November 2023 at https://doi.org/10.3133/ha647.
Robson, S.G., Wacinski, A., Zawistowski, S., and Romero, J.C., 1981b, Geologic structure, hydrology, and water quality of the Laramie-Fox Hills aquifer in the Denver Basin, Colorado: U.S. Geological Survey Hydrologic Atlas 650, scale 1:500,000, 3 pl., accessed November 2023 at https://doi.org/10.3133/ha650.
Ruybal, C.J., Hogue, T.S., and McCray, J.E., 2019a, Evaluation of groundwater levels in the Arapahoe aquifer using spatiotemporal regression kriging: Water Resources Research, v. 55, no. 4, p. 2820–2837, accessed April 2021 at https://doi.org/10.1029/2018WR023437.
Ruybal, C.J., Hogue, T.S., and McCray, J.E., 2019b, Assessment of groundwater depletion and implications for management in the Denver Basin aquifer system: Journal of the American Water Resources Association, v. 55, no. 5, p. 1130–1148, accessed April 2021 at https://doi.org/10.1111/1752-1688.12755.
Rydlund, P.H., Jr., and Densmore, B.K., 2012, Methods of practice and guidelines for using survey-grade global navigation satellite systems (GNSS) to establish vertical datum in the United States Geological Survey: U.S. Geological Survey Techniques and Methods, book 11, chap. D1, 102 p. with appendixes, accessed November 8, 2024, at https://pubs.usgs.gov/tm/11d1/.
Schneider, P.A., Jr., 1980, Water-supply assessment of the Laramie-Fox Hills aquifer in parts of Adams, Boulder, Jefferson, and Weld Counties, Colorado: U.S. Geological Survey Open-File Report 80–327, 17 p., 6 pl., accessed April 2021 at https://doi.org/10.3133/ofr80327.
Sen, P.K., 1968, Estimate of the regression coefficient based on Kendall’s tau: Journal of the American Statistical Association, v. 63, no. 324, p. 1379–1389, accessed November 2023 at https://doi.org/10.1080/01621459.1968.10480934.
Taylor, C.J., and Alley, W.M., 2001, Ground-water-level monitoring and the importance of long-term water-level data: U.S. Geological Survey Circular 1217, 68 p., accessed November 2023 at https://pubs.usgs.gov/circ/circ1217/.
Topper, R., 2008, Upper Black Squirrel Creek Basin aquifer recharge and storage evaluation: Colorado Springs, Colo., El Paso County Water Authority, prepared by Colorado Geological Survey, Golden, Colo., accessed June 21, 2021, at https://coloradogeologicalsurvey.org/publications/upper-black-squirrel-creak-basin-aquifer-recharge-storage-evaluation/.
Topper, R., and Horn, A., 2011, El Paso County groundwater quality study phase 1: Colorado Springs, Colo., El Paso Groundwater Quality Study Committee, prepared by Colorado Geological Survey, Golden, Colo., accessed June 21, 2021, at https://coloradogeologicalsurvey.org/publications/el-paso-groundwater-quality/.
Upper Black Squirrel Creek Ground Water Management District, 2023, About the district: Calhan, Colo., Upper Black Squirrel Creek Ground Water Management District web page, accessed November 29, 2023, at https://upperblacksquirrelcreekwater.com/about.php.
U.S. Geological Survey [USGS], 2024, USGS water data for the Nation: U.S. Geological Survey National Water Information System database, accessed January 4, 2024, at https://doi.org/10.5066/F7P55KJN.
Van Rossum, G., and Drake, F.L., 2009, Python 3 reference manual: Scotts Valley, Calif., CreateSpace, accessed December 2, 2024, at https://dl.acm.org/doi/book/10.5555/1593511.
Watts, K.R., 1995, Hydrogeology and simulation of flow between the alluvial and bedrock aquifers in the Upper Black Squirrel Basin, El Paso County, Colorado: U.S. Geological Survey Water-Resources Investigations Report 94–4238, 82 p., accessed February 10, 2023, at https://doi.org/10.3133/wri944238.
Wellman, T.P., and Rupert, M.G., 2016, Groundwater quality, age, and susceptibility and vulnerability to nitrate contamination with linkages to land use and groundwater flow, Upper Black Squirrel Creek Basin, Colorado, 2013: U.S. Geological Survey Scientific Investigations Report 2016–5020, 78 p., accessed October 10, 2023, at https://doi.org/10.3133/sir20165020.
Wireman, M., and Romero, J.C., 1989, Bibliography of geology and ground water geology for the Denver Basin, Colorado: Denver, Colo., Colorado Division of Water Resources Office of the State Engineer, 12 p., accessed December 2023 at http://hermes.cde.state.co.us/drupal/islandora/object/co:10423/datastream/OBJ/view.
Appendix 1. Groundwater Well Measurement Diagram
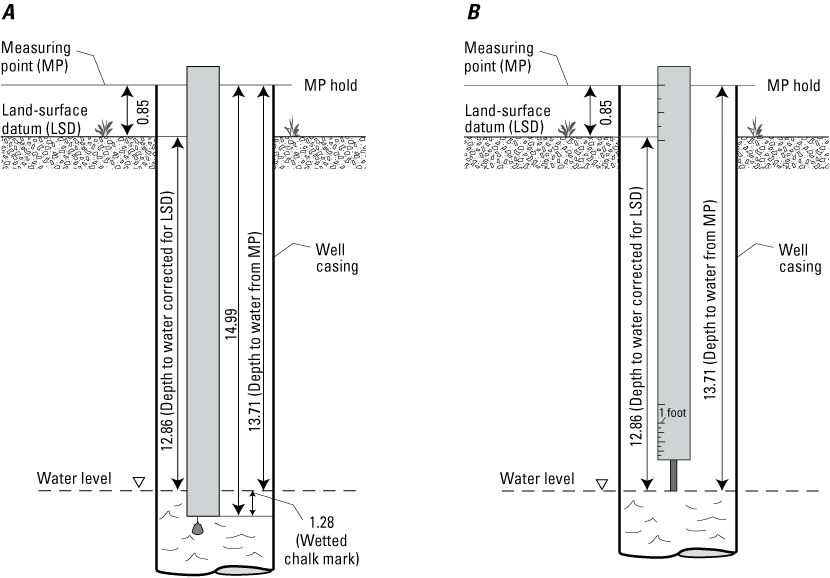
Diagram showing example measuring point and groundwater-level measurements using A, a calibrated steel tape with chalk, and B, a calibrated electrical tape. Modified from Cunningham and Schalk (2011) and from Penn and Everett (2019). (Values are in feet.)
References Cited
Cunningham, W.L, and Schalk, C.W., comps., 2011, Groundwater technical procedures of the U.S. Geological Survey: U.S. Geological Survey Techniques and Methods, book 1, chap. A1, 151 p., accessed November 2023 at https://doi.org/10.3133/tm1A1.
Penn, C.A., and Everett, R.R., 2019, Groundwater-level elevations in the Denver Basin bedrock aquifers of Elbert County, Colorado, 2015–18: U.S. Geological Survey Scientific Investigations Report 2019–5014, 50 p., accessed November 2023 at https://doi.org/10.3133/sir20195014.
Appendix 2. Hydrographs Showing Groundwater-Level Elevation Through Time for Wells in the Upper Black Squirrel Creek Designated Groundwater Basin, El Paso County, Groundwater-Level Monitoring Network
Groundwater-level elevation hydrograph for well QAL11, U.S. Geological Survey site number 385727104225101, Upper Black Squirrel Creek Designated Groundwater Basin, El Paso County, Colorado (USGS, 2024). QAL, Upper Black Squirrel Creek alluvial aquifer well
Groundwater-level elevation hydrograph for well QAL13, U.S. Geological Survey site number 384938104204001, Upper Black Squirrel Creek Designated Groundwater Basin, El Paso County, Colorado (USGS, 2024). QAL, Upper Black Squirrel Creek alluvial aquifer well
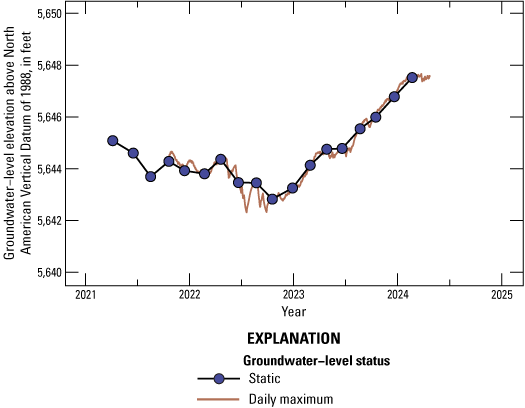
Groundwater-level elevation hydrograph for well QAL14, U.S. Geological Survey site number 384348104232201, Upper Black Squirrel Creek Designated Groundwater Basin, El Paso County, Colorado (USGS, 2024). QAL, Upper Black Squirrel Creek alluvial aquifer well
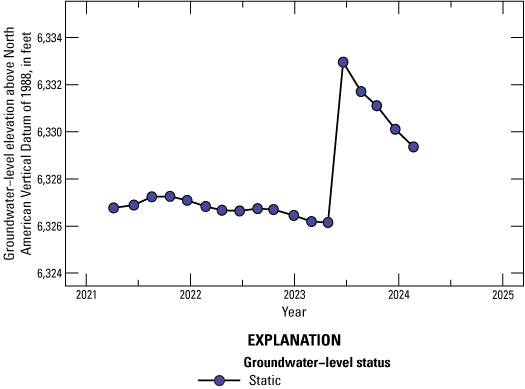
Groundwater-level elevation hydrograph for well QAL15, U.S. Geological Survey site number 385439104263501, Upper Black Squirrel Creek Designated Groundwater Basin, El Paso County, Colorado (USGS, 2024). QAL, Upper Black Squirrel Creek alluvial aquifer well
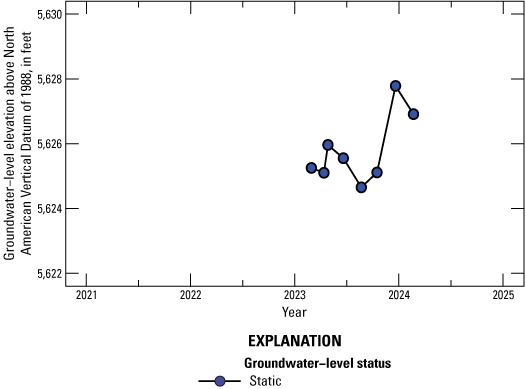
Groundwater-level elevation hydrograph for well QAL16, U.S. Geological Survey site number 384335104241101, Upper Black Squirrel Creek Designated Groundwater Basin, El Paso County, Colorado (USGS, 2024). QAL, Upper Black Squirrel Creek alluvial aquifer well

Groundwater-level elevation hydrograph for well QAL35, U.S. Geological Survey site number 384544104222001, Upper Black Squirrel Creek Designated Groundwater Basin, El Paso County, Colorado (USGS, 2024). QAL, Upper Black Squirrel Creek alluvial aquifer well
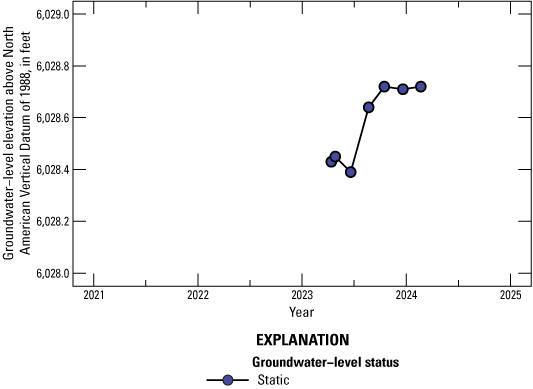
Groundwater-level elevation hydrograph for well QAL36, U.S. Geological Survey site number 385202104203201, Upper Black Squirrel Creek Designated Groundwater Basin, El Paso County, Colorado (USGS, 2024). QAL, Upper Black Squirrel Creek alluvial aquifer well
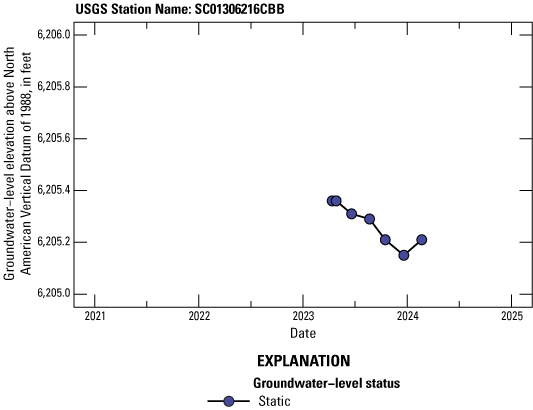
Groundwater-level elevation hydrograph for well QAL37, U.S. Geological Survey site number 385458104210101, Upper Black Squirrel Creek Designated Groundwater Basin, El Paso County, Colorado (USGS, 2024). QAL, Upper Black Squirrel Creek alluvial aquifer well
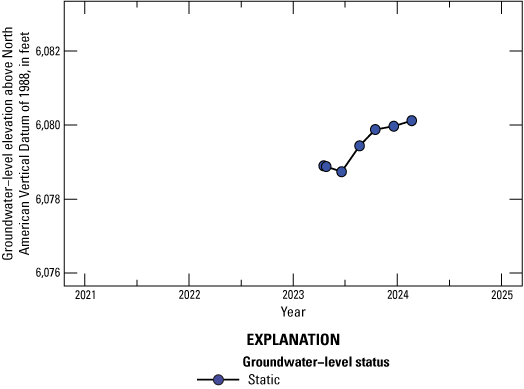
Groundwater-level elevation hydrograph for well QAL38, U.S. Geological Survey site number 385227104231402, Upper Black Squirrel Creek Designated Groundwater Basin, El Paso County, Colorado (USGS, 2024). QAL, Upper Black Squirrel Creek alluvial aquifer well
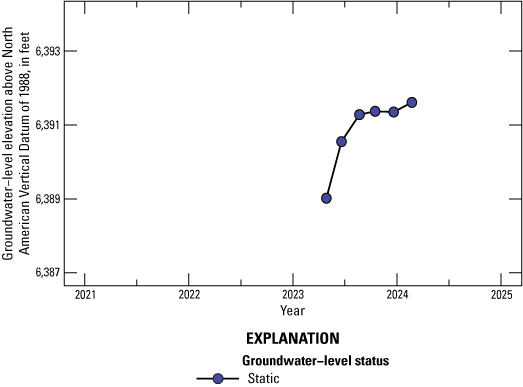
Groundwater-level elevation hydrograph for well QAL39, U.S. Geological Survey site number 385530104270601, Upper Black Squirrel Creek Designated Groundwater Basin, El Paso County, Colorado (USGS, 2024). QAL, Upper Black Squirrel Creek alluvial aquifer well
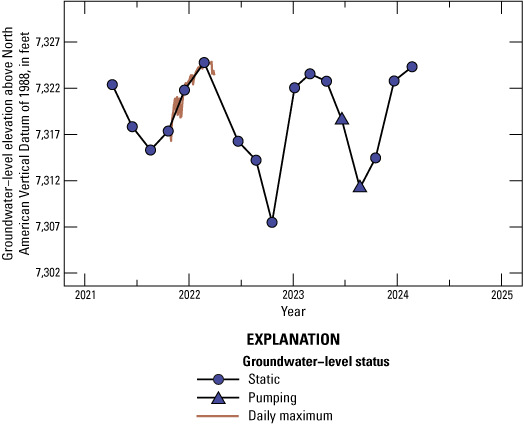
Groundwater-level elevation hydrograph for well TDW17, U.S. Geological Survey site number 390010104385101, Upper Black Squirrel Creek Designated Groundwater Basin, El Paso County, Colorado (USGS, 2024). TDW, lower Dawson aquifer well
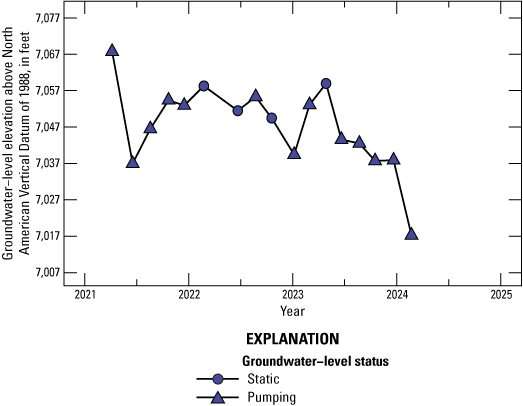
Groundwater-level elevation hydrograph for well TDW18, U.S. Geological Survey site number 385801104370801, Upper Black Squirrel Creek Designated Groundwater Basin, El Paso County, Colorado (USGS, 2024). TDW, lower Dawson aquifer well
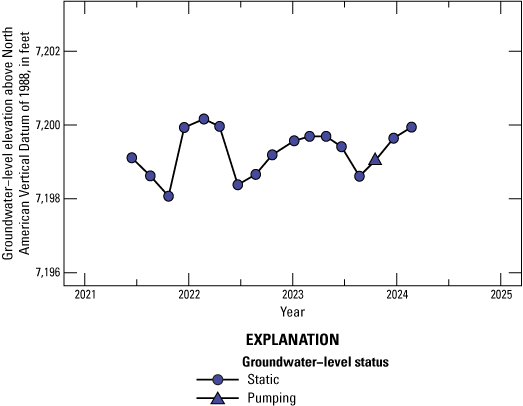
Groundwater-level elevation hydrograph for well TDW19, U.S. Geological Survey site number 390218104353201, Upper Black Squirrel Creek Designated Groundwater Basin, El Paso County, Colorado (USGS, 2024). TDW, lower Dawson aquifer well
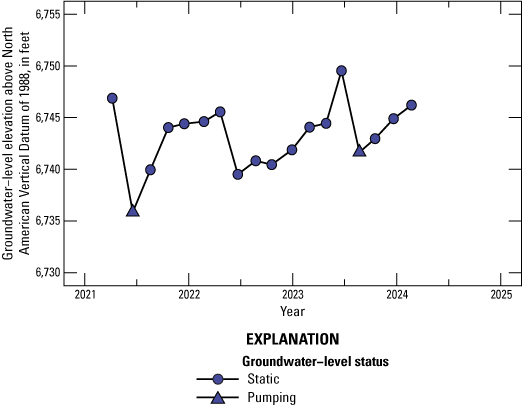
Groundwater-level elevation hydrograph for well TDW20, U.S. Geological Survey site number 390003104302801, Upper Black Squirrel Creek Designated Groundwater Basin, El Paso County, Colorado (USGS, 2024). TDW, lower Dawson aquifer well
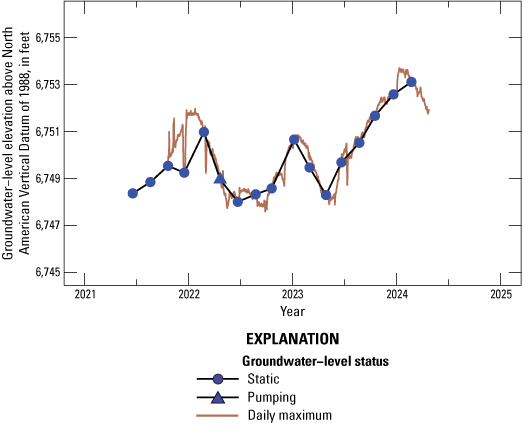
Groundwater-level elevation hydrograph for well TDW21, U.S. Geological Survey site number 390148104285401, Upper Black Squirrel Creek Designated Groundwater Basin, El Paso County, Colorado (USGS, 2024). TDW, lower Dawson aquifer well
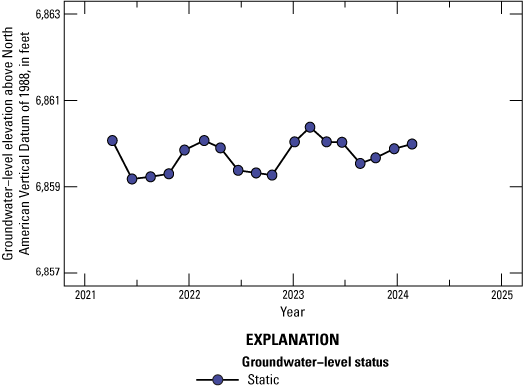
Groundwater-level elevation hydrograph for well TDW22, U.S. Geological Survey site number 390408104301801, Upper Black Squirrel Creek Designated Groundwater Basin, El Paso County, Colorado (USGS, 2024). TDW, lower Dawson aquifer well
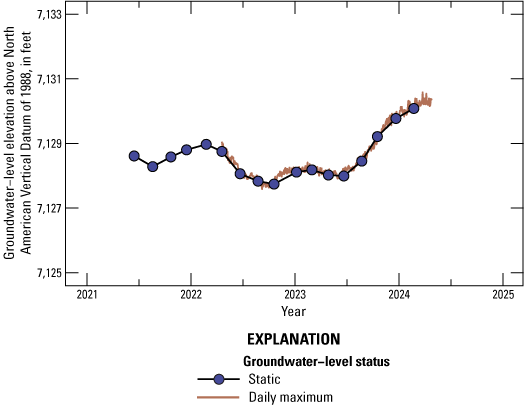
Groundwater-level elevation hydrograph for well TDW33, U.S. Geological Survey site number 390129104344401, Upper Black Squirrel Creek Designated Groundwater Basin, El Paso County, Colorado (USGS, 2024). TDW, lower Dawson aquifer well
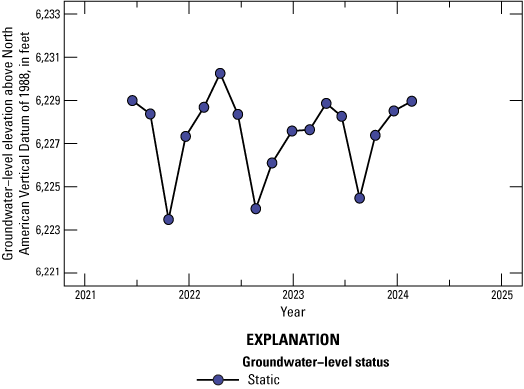
Groundwater-level elevation hydrograph for well TKD1, U.S. Geological Survey site number 385607104230801, Upper Black Squirrel Creek Designated Groundwater Basin, El Paso County, Colorado (USGS, 2024). TKD, Denver aquifer well
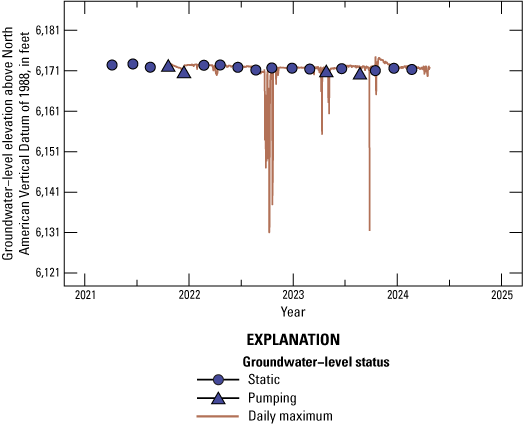
Groundwater-level elevation hydrograph for well TKD7, U.S. Geological Survey site number 385208104324401, Upper Black Squirrel Creek Designated Groundwater Basin, El Paso County, Colorado (USGS, 2024). TKD, Denver aquifer well
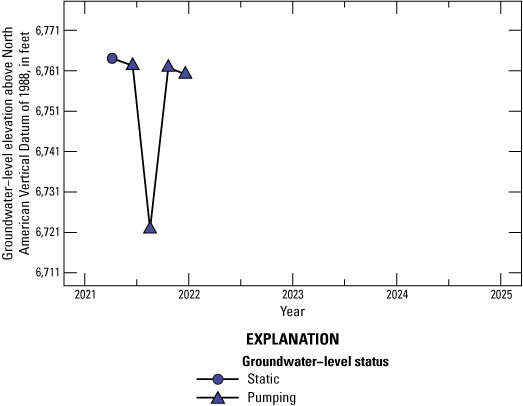
Groundwater-level elevation hydrograph for well TKD9, U.S. Geological Survey site number 385501104362701, Upper Black Squirrel Creek Designated Groundwater Basin, El Paso County, Colorado (USGS, 2024). TKD, Denver aquifer well
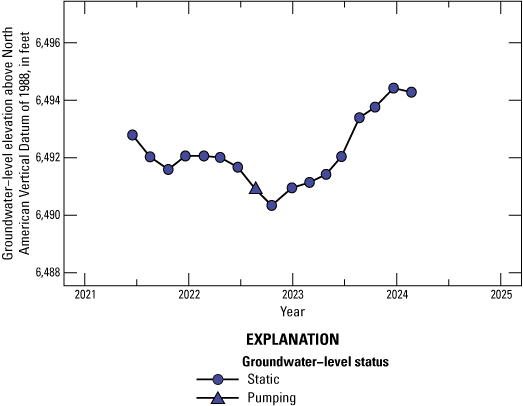
Groundwater-level elevation hydrograph for well TKD10, U.S. Geological Survey site number 385957104242801, Upper Black Squirrel Creek Designated Groundwater Basin, El Paso County, Colorado (USGS, 2024). TKD, Denver aquifer well
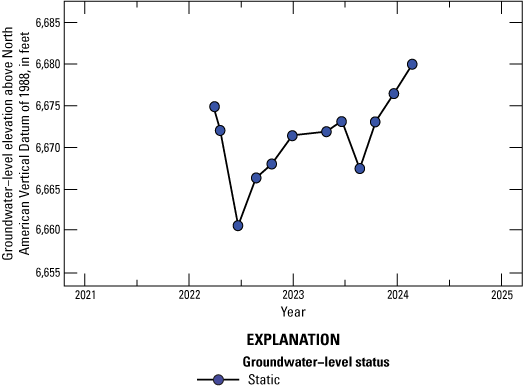
Groundwater-level elevation hydrograph for well TKD12, U.S. Geological Survey site number 385459104362101, Upper Black Squirrel Creek Designated Groundwater Basin, El Paso County, Colorado (USGS, 2024). TKD, Denver aquifer well
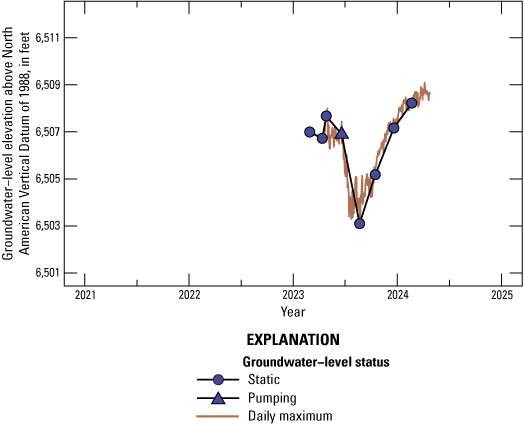
Groundwater-level elevation hydrograph for well TKD24, U.S. Geological Survey site number 385821104194601, Upper Black Squirrel Creek Designated Groundwater Basin, El Paso County, Colorado (USGS, 2024). TKD, Denver aquifer well
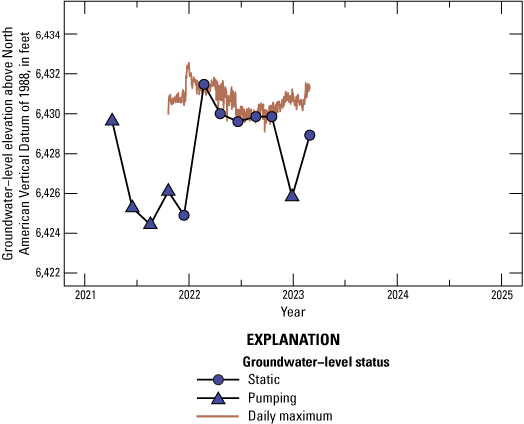
Groundwater-level elevation hydrograph for well TKD27, U.S. Geological Survey site number 385732104204501, Upper Black Squirrel Creek Designated Groundwater Basin, El Paso County, Colorado (USGS, 2024). TKD, Denver aquifer well
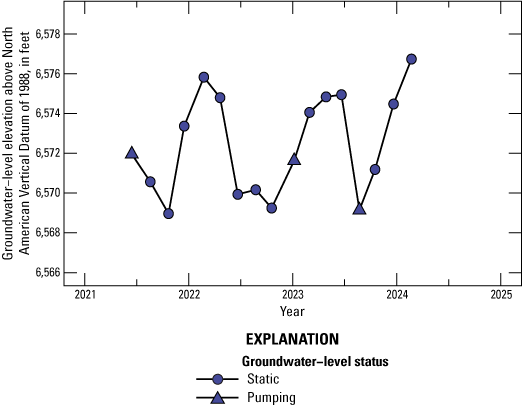
Groundwater-level elevation hydrograph for well TKD28, U.S. Geological Survey site number 390315104314801, Upper Black Squirrel Creek Designated Groundwater Basin, El Paso County, Colorado (USGS, 2024). TKD, Denver aquifer well
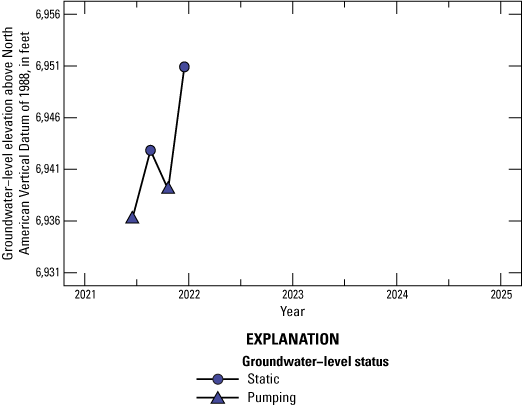
Groundwater-level elevation hydrograph for well TKD29, U.S. Geological Survey site number 390050104384001, Upper Black Squirrel Creek Designated Groundwater Basin, El Paso County, Colorado (USGS, 2024). TKD, Denver aquifer well
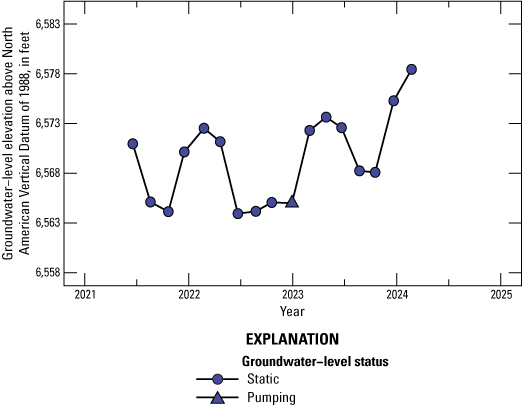
Groundwater-level elevation hydrograph for well TKD30, U.S. Geological Survey site number 390035104295901, Upper Black Squirrel Creek Designated Groundwater Basin, El Paso County, Colorado (USGS, 2024). TKD, Denver aquifer well
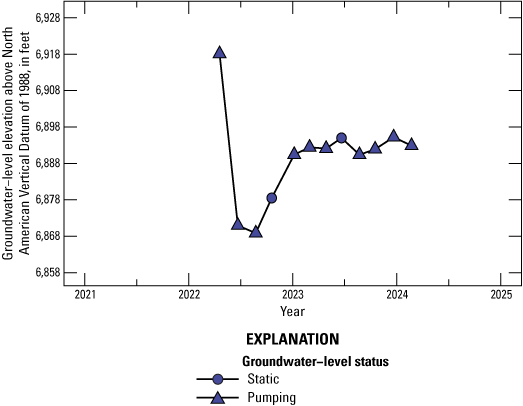
Groundwater-level elevation hydrograph for well TKD31, U.S. Geological Survey site number 390232104352001, Upper Black Squirrel Creek Designated Groundwater Basin, El Paso County, Colorado (USGS, 2024). TKD, Denver aquifer well
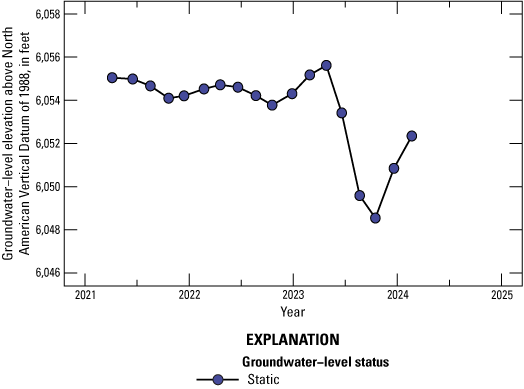
Groundwater-level elevation hydrograph for well KA2, U.S. Geological Survey site number 385323104224004, Upper Black Squirrel Creek Designated Groundwater Basin, El Paso County, Colorado (USGS, 2024). KA, Arapahoe aquifer well
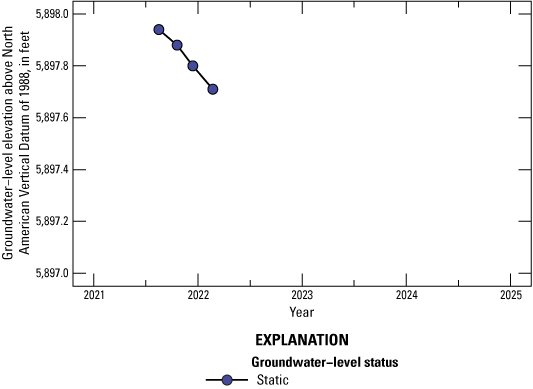
Groundwater-level elevation hydrograph for well KA3, U.S. Geological Survey site number 384938104204002, Upper Black Squirrel Creek Designated Groundwater Basin, El Paso County, Colorado (USGS, 2024). KA, Arapahoe aquifer well
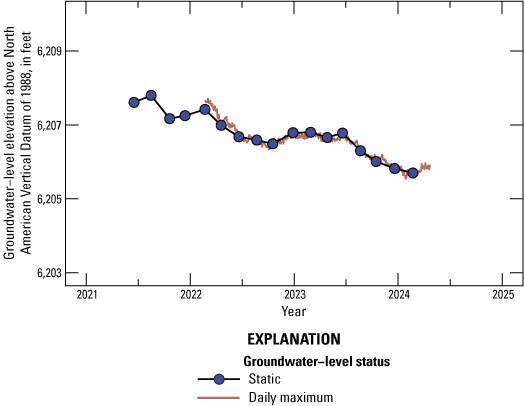
Groundwater-level elevation hydrograph for well KA6, U.S. Geological Survey site number 384824104332601, Upper Black Squirrel Creek Designated Groundwater Basin, El Paso County, Colorado (USGS, 2024). KA, Arapahoe aquifer well
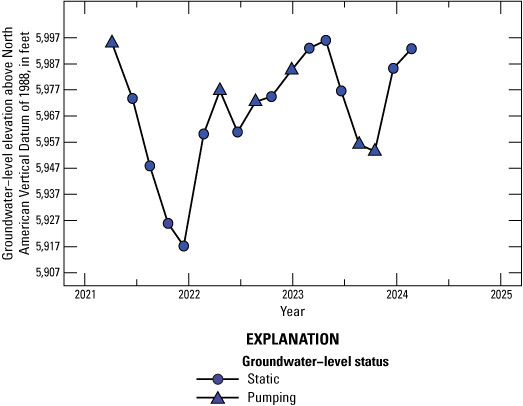
Groundwater-level elevation hydrograph for well KA8, U.S. Geological Survey site number 385029104284001, Upper Black Squirrel Creek Designated Groundwater Basin, El Paso County, Colorado (USGS, 2024). KA, Arapahoe aquifer well
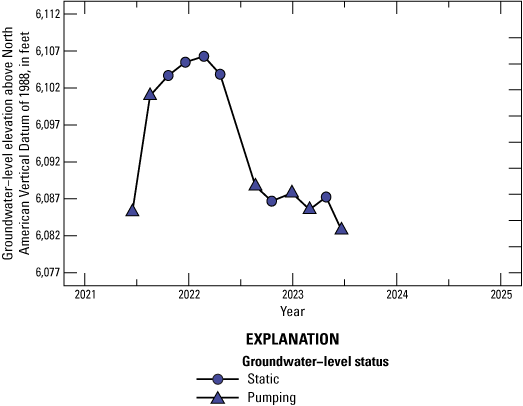
Groundwater-level elevation hydrograph for well KA23, U.S. Geological Survey site number 385326104315501, Upper Black Squirrel Creek Designated Groundwater Basin, El Paso County, Colorado (USGS, 2024). KA, Arapahoe aquifer well
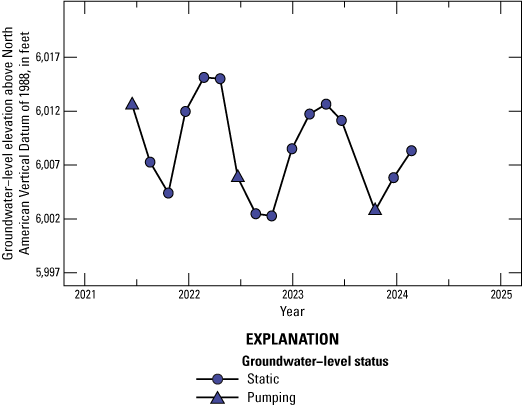
Groundwater-level elevation hydrograph for well KA25, U.S. Geological Survey site number 385540104245701, Upper Black Squirrel Creek Designated Groundwater Basin, El Paso County, Colorado (USGS, 2024). KA, Arapahoe aquifer well
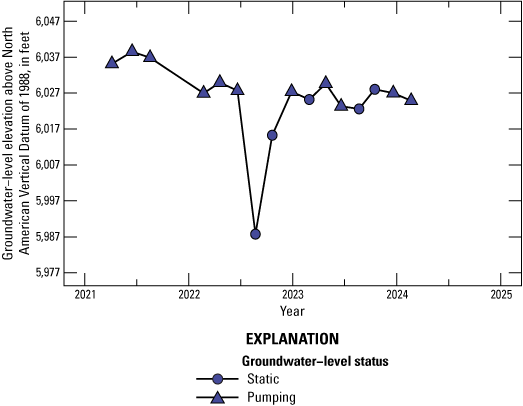
Groundwater-level elevation hydrograph for well KA26, U.S. Geological Survey site number 385340104153701, Upper Black Squirrel Creek Designated Groundwater Basin, El Paso County, Colorado (USGS, 2024). KA, Arapahoe aquifer well
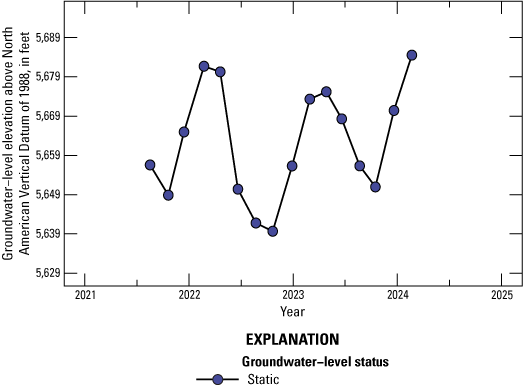
Groundwater-level elevation hydrograph for well KFL4, U.S. Geological Survey site number 384834104215703, Upper Black Squirrel Creek Designated Groundwater Basin, El Paso County, Colorado (USGS, 2024). KLF, Laramie-Fox Hills aquifer well
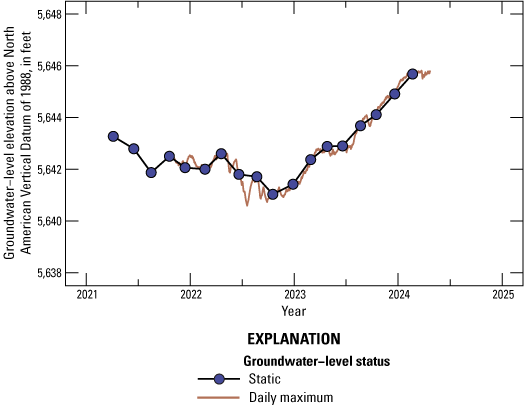
Groundwater-level elevation hydrograph for well KFL5, U.S. Geological Survey site number 384348104232901, Upper Black Squirrel Creek Designated Groundwater Basin, El Paso County, Colorado (USGS, 2024). KLF, Laramie-Fox Hills aquifer well
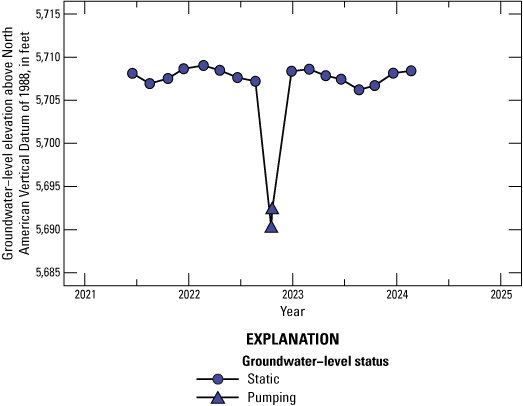
Groundwater-level elevation hydrograph for well KLF32, U.S. Geological Survey site number 384539104262101, Upper Black Squirrel Creek Designated Groundwater Basin, El Paso County, Colorado (USGS, 2024). KLF, Laramie-Fox Hills aquifer well
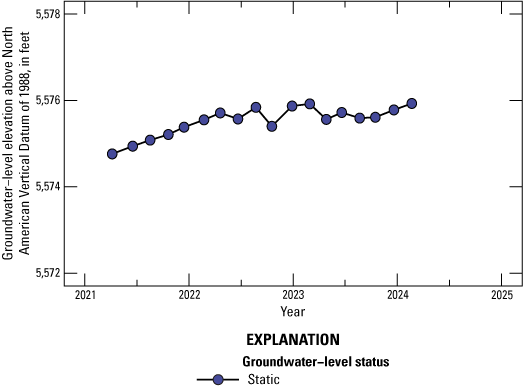
Groundwater-level elevation hydrograph for well KP34, U.S. Geological Survey site number 384210104231701, Upper Black Squirrel Creek Designated Groundwater Basin, El Paso County, Colorado (USGS, 2024). KP, Pierre Shale well
References Cited
U.S. Geological Survey [USGS], 2024, USGS water data for the Nation: U.S. Geological Survey National Water Information System database, accessed January 4, 2024, at https://doi.org/10.5066/F7P55KJN.
Appendix 3. Descriptions and Equations of Mann-Kendall Test, Seasonal Mann-Kendall Test, and Theil-Sen Slope Estimate
S
is the test statistic, which estimates the monotonic dependence of y on x;
x
is the rank of the time variable, from least to most recent; and
y
is the measured groundwater-level elevation, in feet above North American Vertical Datum of 1988.
References Cited
Helsel, D.R., Hirsch, R.M., Ryberg, K.R., Archfield, S.A., and Gilroy, E.J., 2020, Statistical methods in water resources: U.S. Geological Survey Techniques and Methods, book 4, chapter A3, 458 p., accessed November 2023 at https://doi.org/10.3133/tm4A3.
Hirsch, R.M., Alexander, R.B., and Smith, R.A., 1991, Selection of methods for the detection and estimation of trends in water quality: Water Resources Research, v. 27, no. 5, p. 803–813, accessed November 2023 at https://doi.org/10.1029/91WR00259.
Conversion Factors
Datums
Vertical coordinate information is referenced to the North American Vertical Datum of 1988 (NAVD 88). Horizontal coordinate information is referenced to the North American Datum of 1983 (NAD 83).
Elevation, as used in this report, refers to distance above the vertical datum.
Abbreviations
CDWR
Colorado Division of Water Resources
District
Upper Black Squirrel Creek Ground Water Management District
KA
Arapahoe aquifer well, used in the well common names
KLF
Laramie-Fox Hills aquifer well, used in the well common names
KP
Pierre Shale well, used in the well common names
M-K
Mann-Kendall
MP
measuring point
NWIS
National Water Information System
QAL
Upper Black Squirrel Creek alluvial aquifer well, used in the well common names
rM-K
regional Mann-Kendall
sM-K
seasonal Mann-Kendall
TDW
lower Dawson aquifer well, used in the well common names
TKD
Denver aquifer well, used in the well common names
USGS
U.S. Geological Survey
For more information concerning the research in this report, contact the Director, USGS Colorado Water Science Center
Box 25046, Mail Stop 415
Denver, CO 80225
(303) 236-4882
Or visit the Colorado Water Science Center website at
https://www.usgs.gov/centers/colorado-water-science-center
Publishing support provided by the Science Publishing Network, Denver Publishing Service Center
Disclaimers
Any use of trade, firm, or product names is for descriptive purposes only and does not imply endorsement by the U.S. Government.
Although this information product, for the most part, is in the public domain, it also may contain copyrighted materials as noted in the text. Permission to reproduce copyrighted items must be secured from the copyright owner.
Suggested Citation
Kisfalusi, Z.D., Hennessy, E.K., and Sharp, J.B., 2025, Groundwater-level elevations in the Denver Basin bedrock aquifers and Upper Black Squirrel Creek alluvial aquifer, El Paso County, Colorado, 2021–24: U.S. Geological Survey Scientific Investigations Report 2024–5123, 49 p., https://doi.org/10.3133/sir20245123.
ISSN: 2328-0328 (online)
ISSN: 2328-031X (print)
Study Area
| Publication type | Report |
|---|---|
| Publication Subtype | USGS Numbered Series |
| Title | Groundwater-level elevations in the Denver Basin bedrock aquifers and Upper Black Squirrel Creek alluvial aquifer, El Paso County, Colorado, 2021–24 |
| Series title | Scientific Investigations Report |
| Series number | 2024-5123 |
| ISBN | 978-1-4113-4591-1 |
| DOI | 10.3133/sir20245123 |
| Publication Date | January 14, 2025 |
| Year Published | 2025 |
| Language | English |
| Publisher | U.S. Geological Survey |
| Publisher location | Reston VA |
| Contributing office(s) | Colorado Water Science Center |
| Description | Report: vii, 49 p.; Database |
| Country | United States |
| State | Colorado |
| County | El Paso County |
| Online Only (Y/N) | N |