Simulating Present and Future Groundwater/Surface-Water Interactions and Stream Temperatures in Beaver Creek, Kenai Peninsula, Alaska
Links
- Document: Report (34.3 MB pdf) , HTML , XML
- Dataset: USGS National Water Information System database - USGS water data for the Nation
- Data Releases:
- USGS data release - Surface water and groundwater hydrology and temperature, Beaver Creek, Kenai Peninsula, Alaska, 2022–2023
- USGS data release - Soil water balance, groundwater flow, and stream temperature models for Beaver Creek, Alaska, 2019 to 2050
- NGMDB Index Page: National Geologic Map Database Index Page (html)
- Download citation as: RIS | Dublin Core
Acknowledgments
This work was funded by the Alaska Climate Adaptation Science Center. We also acknowledge the World Climate Research Programme’s Working Group on Coupled Modelling, which is responsible for the Coupled Model Intercomparison Project (CMIP), and we thank the climate modeling groups (listed in table 4.1 of this report) for producing and making available their model output. For CMIP, the U.S. Department of Energy’s Program for Climate Model Diagnosis and Intercomparison provided coordinating support and led development of software infrastructure in partnership with the Global Organization for Earth System Science Portals.
We are grateful for fieldwork assistance from the following organizations and individuals: Kevin Duffie, Burke Haywood, and Sara Aamodt (Kenai Watershed Forum); Alana Shaw and Moses Jordan (Kenaitze Indian Tribe); Yvonne Weber and Ciara Bismark (Salamatof Tribe); Addison McCarthy; and Molly Dischner.
We also appreciate the thoughtful report reviews by Dylan Blaskey (University of Colorado Boulder, Institute of Arctic and Alpine Research) and Chanse Ford (U.S. Geological Survey).
Abstract
In many places, coldwater ecosystems are facing increasing pressure from anthropogenic warming. This study examined stream temperatures and the water balance in the Beaver Creek watershed on the Kenai Peninsula in south-central Alaska—an area that is experiencing rapid warming. Low-gradient streams near the Kenai coast provide important spawning and rearing habitat for salmon but may be especially vulnerable to rising temperatures, because of long residence times, inflows from abundant riparian wetlands, and reliance on groundwater discharge that may also warm, or decrease in volume with rising evapotranspiration. In recent decades, observed maximum 7-day temperatures have consistently exceeded statistical (regression-based) projections. Here we simulate total streamflows and temperatures with a physics-based model that links the Soil Water Balance, MODFLOW 6 and SNTEMP simulation codes on a 7-day timestep. The model is based on existing data and groundwater levels, instream flows, and stream temperatures collected during 2019–23. Future climate scenarios were developed for 2023–50 from downscaled climate projections.
Results indicate that groundwater discharge is about 64 percent of the total streamflow during the months of May through September. Total streamflow and groundwater discharge are expected to remain similar to current conditions through 2050. Stream temperatures are expected to rise; by midcentury, near the Beaver Creek mouth the model predicts 34 to 63 additional days per year with average weekly temperatures above 13 degrees Celsius, 14 to 81 additional days with average weekly temperatures above 15 degrees Celsius, and routine exceedances of 20 degrees Celsius during the warmest periods. Projected stream temperatures vary spatially. Areas of high groundwater inflows in the lower main stem and some tributaries may be most resilient to warming air temperatures during dry conditions. During storm events, groundwater-dominated tributaries may have the coolest stream temperatures.
Introduction
Beaver Creek (figs. 1, 2) is a tributary to the Kenai River on the Kenai Peninsula in south-central Alaska where salmon are a key economic driver. Wild and hatchery salmon from south-central Alaska support a $587 million economy and sustain close to 8,000 jobs (Hayward and others, 2017). The Kenai River is an important part of this economy and is the most heavily sport-fished river in Alaska with notable Chinook salmon (Oncorhynchus tshawytscha), sockeye salmon (Oncorhynchus nerka), and coho salmon (Oncorhynchus kisutch) runs (Alaska Department of Fish and Game (ADFG), 2022). Beaver Creek provides important habitat for several anadromous fish (ADFG, 2024a) including coho salmon, Chinook salmon, sockeye salmon, and Dolly Varden (Salvelinus malma). Key life cycle events for these fish species include the following:
-
· Chinook spawn in the Kenai River basin between May and July (ADFG, 2020). The eggs hatch in late winter to early spring. The parr spend 1 year in freshwater before migrating to the ocean as smolt the following spring (ADFG, 2024c).
-
· Sockeye spawn in the Kenai River basin between June and August (ADFG, 2020) and eggs hatch during the winter. The parr spend 1–3 years in the stream before migrating to the ocean as smolt (ADFG, 2024d).
-
· Coho spawn in Alaska between July and November, with fish in the Kenai River basin often spawning during late July through October (ADFG, 2020). The eggs hatch the following spring and the parr remain in the freshwater streams or lakes for 1–3 years before migrating to the ocean as smolt (ADFG, 2024b).
-
· Dolly Varden spawn in Alaska in the fall, between September and November, with eggs hatching 4–5 months later in the spring. Fry move to rearing habitats in late spring to early summer. After 2–4 years in freshwater the fish transition to smolt and migrate to the ocean (ADFG, 2024e).
Because of their role as important fish habitats during the freshwater portion of these anadromous fish life cycles, Beaver Creek and similar lowland groundwater- and wetland-dominated streams have been identified as a high conservation priority in south-central Alaska by several multi-agency efforts including the Kenai Peninsula Fish Habitat Partnership (KPFHP; KPFHP, 2014), Freshwater Conservation Plans (KPFHP, 2022a), and the Mountains to Sea Strategic Plan (Morton and others, 2015). Lowland tributaries of the Kenai River have also been identified as potentially more sensitive to disturbance and experiencing greater ecological pressures relative to the rest of the basin (Schoen and others, 2017). These lowland basins may be more susceptible to reductions in base flow and increases in stream temperature because of greater development and groundwater withdrawals (KPFHP, 2014). Development along the lower main-stem Kenai River riparian zone, which includes part of the Beaver Creek Basin, has expanded from 1 percent of the area in the 1950s to 17 percent in 2013 (Schoen and others, 2017). The City of Kenai, partially located within the Beaver Creek Basin, is expected to experience a population increase of 13.3 percent by 2046, relative to 2015 (Alaska LNG, 2017). Groundwater withdrawals from municipal wells in the Beaver Creek Basin are the sole source of municipal drinking water for the City of Kenai (Alaska LNG, 2017), and the projected increase in population will likely result in greater groundwater withdrawals from the Beaver Creek Basin, which could potentially reduce stream base flow.
A warming climate on the Kenai Peninsula could also cause base-flow reductions by increasing evapotranspiration (Anderson, 2023), which would raise stream temperature above thermal thresholds of concern for salmon (KPFHP, 2022b). Climate change is already affecting the Kenai Peninsula (KPFHP, 2022a, b) through increased lightning strikes and forest fires ignited by lightning (Schoen and others, 2017), decreased wetland area in the Kenai Lowlands since the mid-1900s (Klein and others, 2005), and increased occurrence of salmon thermal threshold exceedances in some area streams (Mauger and others, 2017). In addition to canopy loss from fire, canopy reduction from insects, including spruce tree (Picea spp.) death from spruce beetles (Dendroctonus rufipennis; Dial and others, 2007) and defoliation of thin-leaf alders (Alnus tenuifolia) by green alder sawflies (Monsoma pulveratum; Roon and others, 2018), may contribute to reduced stream shade and higher stream temperatures. Stream thermal exceedances in the Anchor River in the southern Kenai Peninsula have already motivated conservation land purchases of parcels near cooler stream reaches that likely have preferential groundwater inputs (KPFHP, 2022b).
Stream temperatures have been previously studied in this region (Kyle and Brabets, 2001; Mauger and others, 2017; KPFHP, 2022b; Meyer and others, 2023); Mauger and others (2017) and Meyer and others (2023) have shown that slower water velocities and higher residence times in low-gradient streams result in high thermal sensitivity, with warming air temperatures closely tied to warming water temperatures. Additionally, greater wetland cover is associated with warmer stream temperatures, likely because longer hydrologic residence times and flatter topography allow for water to have more exposure to solar radiation (Mauger and others, 2017; Shaftel and others, 2020). Mauger (2013) and Mauger and others (2017) assessed stream temperatures in the region using 7-day rolling averages (computed from maximum daily and average daily stream temperature) and compared those to the following 18 AAC 70 Alaska Water Quality Standards (Alaska Department of Environmental Conservation, 2024):
-
· A 13-degrees Celsius (°C) maximum for egg and fry incubation and spawning areas
-
· A 15-°C maximum for migration routes and rearing areas
-
· A 20-°C maximum for all times
Of 48 watersheds studied in the Cook Inlet basin from 2008 to 2012, 63 percent had 7-day rolling average maximum daily stream temperatures above 15 °C and 27% had seven day rolling average daily mean temperatures above 15 °C (Mauger, 2013). Despite its low gradient and relatively high wetland cover, prior stream temperature data in Beaver Creek had indicated low sensitivity to air temperature. Mauger (2013, p. 23) classified Beaver Creek as “cold, low sensitivity,” which would indicate a greater thermal resilience compared to the other Cook Inlet basins. Even with the cold, low sensitivity classification, the maximum weekly 7-day rolling average mean daily temperature for Beaver Creek reached 15.1 °C and the maximum weekly 7-day rolling average maximum daily temperature reached 16.8 °C during 2008–12 (Mauger and others, 2017). Both temperatures are above the incubation, spawning, migration, and rearing standards.
Kyle and Brabets (2001) developed a logistic regression model for the area using historical stream and air temperature data and then made predictions of stream temperatures in 2100 using future climate projections. In the Beaver Creek main stem near the confluence with the Kenai River, the annual maximum weekly mean temperature was predicted to increase by 1 °C to a temperature of 13.6 °C, whereas the mean temperature for the mid-May to mid-October period was predicted to increase by 5.3 °C to a temperature of 12.9 °C. In the 2008–12 period, Mauger and others (2017) observed maximum weekly (rolling) mean temperatures ranging from 14.0 to 16.8 °C.). Using a mixed effects model, Mauger and others (2017) predicted a maximum weekly mean temperature of 18 °C by the 2060–69 period. The 2019 observed maximum weekly 7-day rolling average daily maximum temperature of 18 °C (KPFHP, 2022b) already has reached the predicted 2060–69 values for this basin, which indicates that stream temperatures in Beaver Creek Basin may be warming faster than expected. The reasons for the underpredictions in these prior models are unclear but could include the regression models or the driving climate projections not being well suited for predicting maximum weekly temperatures. A summary of observed and predicted temperatures in the Beaver Creek Basin from prior studies is shown in table 1.
Table 1.
Summary of observed and predicted temperatures in the lower main stem of Beaver Creek Basin from prior studies.| Study | Location, as a latitude, longitude in decimal degrees | Temperature, in degrees Celsius | Time period and metric |
|---|---|---|---|
| Mauger and others (2017); S1 supplementary files | 60.561−151.123 | 17.9 | Overall maximum daily temperature for 2008–12 |
| Mauger and others (2017); S2 supplementary files | 60.561−151.123 | 13.1–15.1 | Maximum weekly 7-day rolling average temperature calculated from daily average temperatures in 2008–12 |
| Mauger and others (2017); S2 supplementary files | 60.561−151.123 | 14.0–16.8 | Maximum weekly 7-day rolling average temperature calculated from daily maximum temperatures in 2008–12 |
| Kenai Peninsula Fish Habitat Partnership (2022b); estimated from figure 1 | 60.561−151.123 | 18 | Observed maximum weekly 7-day rolling average temperature calculated from daily maximum temperatures in 2019 |
| Mauger and others (2017); estimated from figure 6 | 60.561, −151.123 | 18 | Predicted maximum weekly 7-day rolling average temperature calculated from daily maximum temperatures in 2060–69 |
| Kyle and Brabets (2001) | 60.563, −151.120 | 13.6 | Maximum weekly mean temperature in 2100. |
These previous works relied on temperature observations and predictions at a single point in the Beaver Creek Basin and did not assess potential temperature changes across the diversity of thermal habitats throughout the basin. Salmonoids are known to utilize diverse thermal freshwater habitats to optimize metabolic needs (Armstrong and others, 2013; Armstrong and others, 2021, Barrett and Armstrong, 2022). This study was initiated to better understand stream temperatures and streamflow throughout the Beaver Creek Basin when groundwater discharge is explicitly simulated for current conditions and under potential future climates. Specifically, the goals of this study were to (1) quantify the groundwater/surface-water interactions and stream temperature in Beaver Creek under current conditions, (2) estimate how streamflow and temperature may change by 2050 under potential future climate projections, (3) improve understanding of the groundwater flow system in this region, and (4) provide local resource managers a tool to assess the effects of climate change and groundwater pumping on stream base flow and temperatures in the study basin.
The study included field data collection and modeling components. Field data collection included stream temperature, shallow groundwater levels, shallow groundwater temperature, and stream discharge collected continuously between June 2022 and September 2024 as well as synoptic, spatially-distributed measurements collected in June and July of 2022. The field data were used to inform a combined soil water balance, groundwater flow, and stream temperature model. Soil-Water-Balance code (SWB; Westenbroek and others, 2018) was used to estimate the daily surface-water balance from precipitation and temperature inputs. Net infiltration past the root zone and surface runoff from the SWB model were applied to a transient, three-dimensional finite difference groundwater flow model (using MODFLOW 6; Langevin and others, 2017; 2023) that simulated the water budget of Beaver Creek and the contributing groundwater flow system at a 7-day time resolution. Instream temperatures were simulated using a Stream Network Temperature (SNTEMP) model (Theurer and others, 1984; Bartholow, 2010;) based on the MODFLOW model Streamflow Routing (SFR) package network, using groundwater discharge and surface runoff from the MODFLOW model. Instream temperatures were evaluated throughout Beaver Creek from 2019 to 2023 and under potential future climate projections out to 2050. Simulated instream temperatures were compared to the 18 AAC 70 Alaska Water Quality standards (Alaska Department of Environmental Conservation, 2024) to assess the potential for future thermal threshold exceedances.
The results of the study are presented in this report and include (1) a description of the hydrologic setting, climate, and geology of the site; (2) a summary of the field data collection methods and results; (3) a description of the soil water balance, groundwater flow, and stream temperature model constructions, and of the history matching and future scenario analyses; (4) a summary of the model results; and (5) discussion of model limitations and assumptions. The main body of the text summarizes the study methods and key findings. Additional methods details are provided in the appendixes. The model files and workflows are available in the accompanying U.S. Geological Survey (USGS) data release (Leaf and others, 2024); field data are available in the National Water Information System (NWIS; USGS, 2023) and from a USGS data release (Koch and others, 2024).
Site Description and Hydrologic Setting
The Beaver Creek Basin is located on the Kenai Peninsula of south-central Alaska (fig. 1). The following sections describe pertinent physiographic features that affect the conceptual model of the basin hydrology.
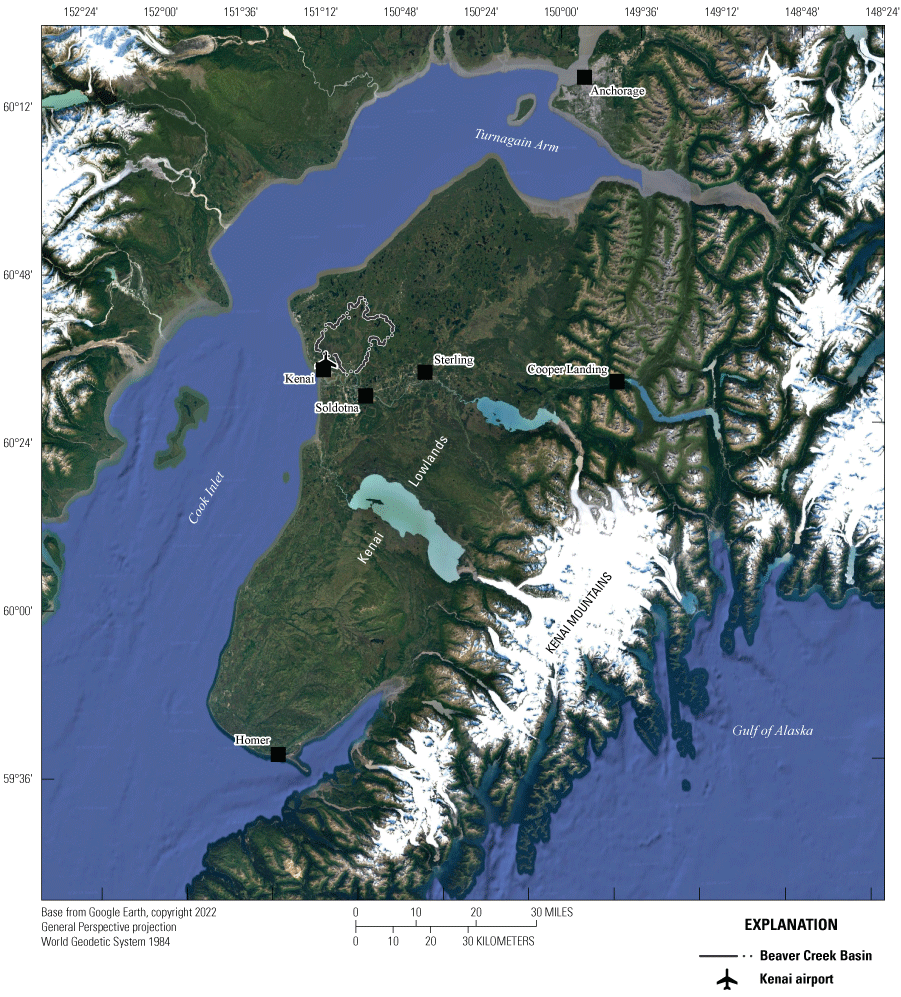
Map showing the Beaver Creek Basin on the Kenai Peninsula, Alaska, and notable geographic features in the area.
Topography and Hydrology
The Beaver Creek basin (fig. 1) is in the flat, northwestern lowlands of the Kenai Peninsula. The peninsula is defined by Turnagain Arm to the north, Cook Inlet to the west, Prince William Sound to the east (not shown), and the Gulf of Alaska to the south and southeast. The Kenai Peninsula has a sharp topographic divide between the Kenai Mountains rising to the east and the flat Kenai Lowlands (from Karlstrom, 1964) stretching west. The Kenai Lowlands are 20–50 miles wide, 106 miles long, and have local topographic relief ranging from a few feet to more than 200 feet. The topography in this lowland landscape reflects a series of glacial advances and retreats that have left behind a poorly drained, wetland-rich, flat surface disrupted by moraines, kettle depressions, and relict glacial drainageways (Karlstrom, 1964).
The Beaver Creek Basin is about 13 miles wide north to south and east to west. The major hydrologic features near Beaver Creek are highlighted in figure 2. The creek generally runs north to south through a valley that was carved by glacial outwash and is now oversized relative to the modern Beaver Creek. The western edge of the basin is about 2 miles from a steep bluff down to Cook Inlet, an embayment of the Pacific Ocean. Areas west of the basin drain into Cook Inlet. Bishop Creek forms a surface-water divide to the northwest and the Swanson River forms a boundary to the northeast. East and southeast of the study basin is a large, poorly drained hummocky area with numerous lakes at the boundary of the Moose River, Swanson River, and Soldotna Creek basins. The headwaters of the west fork of the Moose River begin to form a mapped channel about 2.7 miles east of the edge of the Beaver Creek Basin. Southeast of the basin is Soldotna Creek, and the Kenai River forms the southern boundary. The Kenai River is a key hydrologic feature in this region and is tidally influenced from Cook Inlet for several miles upstream from its outlet; this zone includes the outlet of Beaver Creek (Morton and others, 2015). There are four named lakes that drain into the headwaters of Beaver Creek including Beaver Lake, Tern Lake, Lake Ootka, and Ermine Lake. Several smaller lakes are present across the basin, particularly along the eastern and northern edges. Wetlands (fig. 2) cover 23 percent of the basin (Morton and others, 2015), with large wetland complexes on the western side of the basin and throughout the wide, relict glacial drainageway that the Beaver Creek channel now occupies (U.S. Fish and Wildlife Service, 2020).
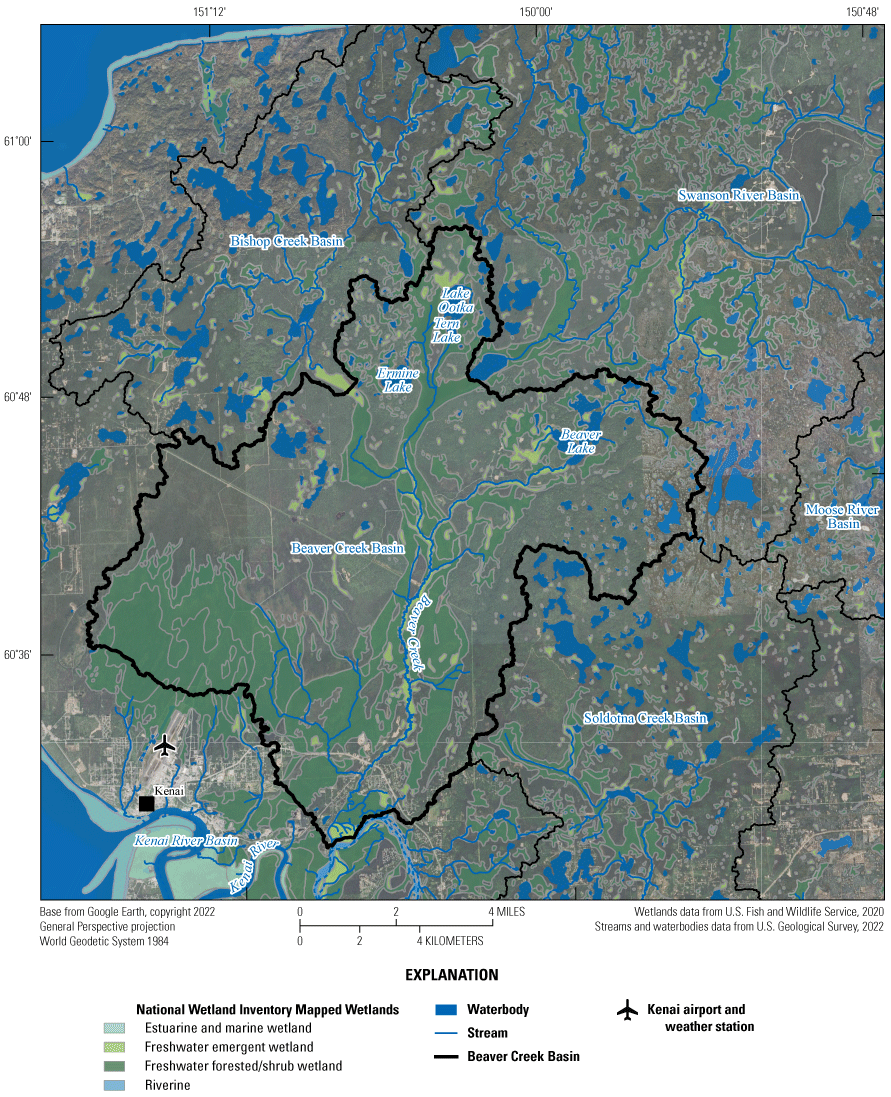
Map of hydrologic features in the study area including streams, rivers, lakes, and wetlands. Boundaries are shown for basins bordering the Beaver Creek Basin.
Climate
The Kenai Peninsula has a subarctic climate that is in the transition zone from the dry, cold continental climate of interior Alaska to the wet, mild coastal climate along the Gulf of Alaska (Karlstrom, 1964). Summers are cool and short, with frequent cloud cover. Winters are long, with snowpack often lasting from October to May. Winters bring a mix of temperatures with periods well below freezing and times where temperatures remain above freezing (Hayward and others, 2017). The Beaver Creek Basin straddles the divide between the Köppen climate classification of “Dsc” to the west and “Dfc” to the east. “Dsc” and “Dfc” are cold, subarctic continental climates that differ only by the amount of summer precipitation relative to winter precipitation; “s” climates have dry summers, whereas “f” climates are fully humid with no significant precipitation differences between seasons (Kottek and others, 2006; Geodiode, 2022). Storms across the Kenai Peninsula typically move in a counterclockwise direction from the Gulf of Alaska, into Prince William Sound, and then west. This predominant weather pattern causes the Kenai Mountains to form a partial rain shadow in the northwestern part of the Kenai Peninsula where Beaver Creek Basin is located (Hayward and others, 2017).
Weather data have been collected since 1899 (with a large gap from 1908 to 1943) at the Kenai airport weather station (National Oceanic and Atmospheric Administration [NOAA], 2023a) located just southwest of the basin edge (fig. 2). Continuous daily weather records from this station were used to assess climate trends in temperature and precipitation. The Kenai weather data were compared to nearby weather stations in Sterling (NOAA, 2023b) and Soldotna (NOAA, 2023c) for more recent periods when all three stations were collecting data. Precipitation totals were similar at these stations until 2015 when the Kenai station record started to deviate with lower total precipitation despite showing a complete record for this period. It is unknown why the Kenai station recorded less precipitation, but based on streamflows at the Beaver Creek near Kenai, Alaska, streamgage (USGS site 15266500; hereafter referred to as the “Beaver Creek streamgage”), it appears the Kenai station precipitation data do not match conditions in the basin for recent years and may be erroneous. Therefore, Kenai station precipitation data were used through 2014 and Soldotna station data were used from 2015 to 2023; Kenai station temperature data were reasonable and used for the full period. The annual precipitation for 1944–2023 is shown in figure 3. Average annual precipitation is 19.4 inches, with the study period of 2019–23 having above average precipitation.
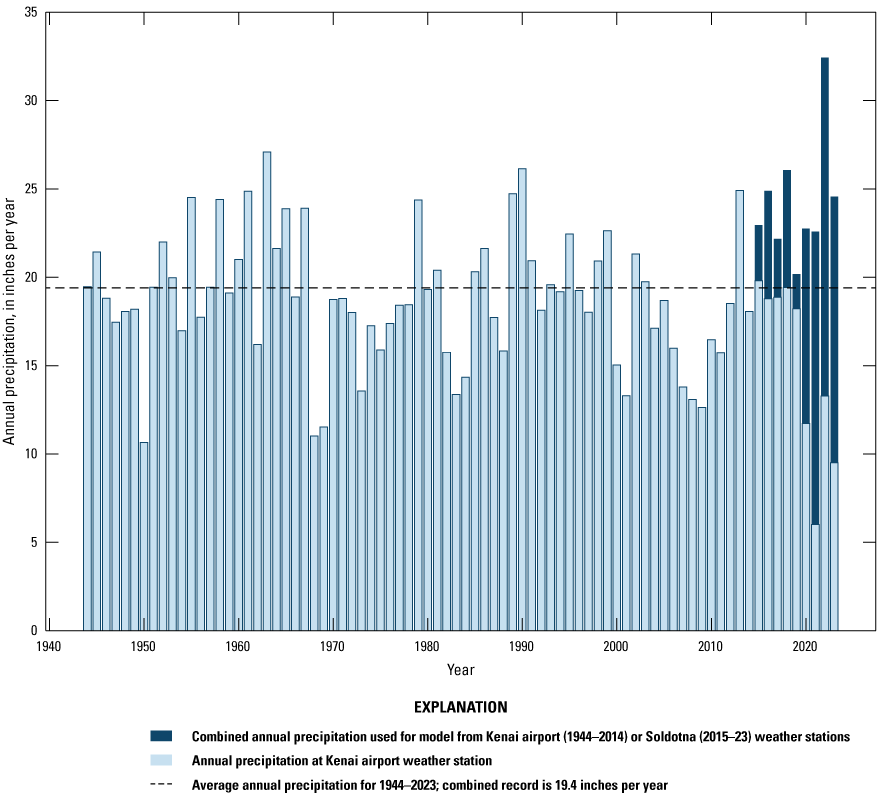
Annual precipitation during 1944–2023. The chart uses Kenai airport weather station (Global Historical Climatology Network Daily [GHCND]: USW00026523) data through 2014 and Soldotna station (GHCND: USC00508615) data from 2015 onward. The Kenai airport weather station data are shown for the full period and are notably lower than the combined record especially during the last 4 years.
The average monthly temperatures (fig. 4) show a maximum average monthly temperature of 16.8 °C in July and a minimum average monthly temperature of −14.8 °C in January. A plot of average growing season air temperatures (May–Sept; fig. 5) shows a warming trend, with the warmest average growing season temperature of 12.3 °C occurring in 2019. The summer of 2019 was notably warm in Alaska with stream temperatures in the Yukon River basin exceeding the thermal thresholds above which adult salmon show decreased spawning success and early mortality (von Biela and others, 2020) while Alaska’s most expensive wildfire to date burned close to 170,000 acres just east of Beaver Creek Basin (University of Alaska Fairbanks, 2022).
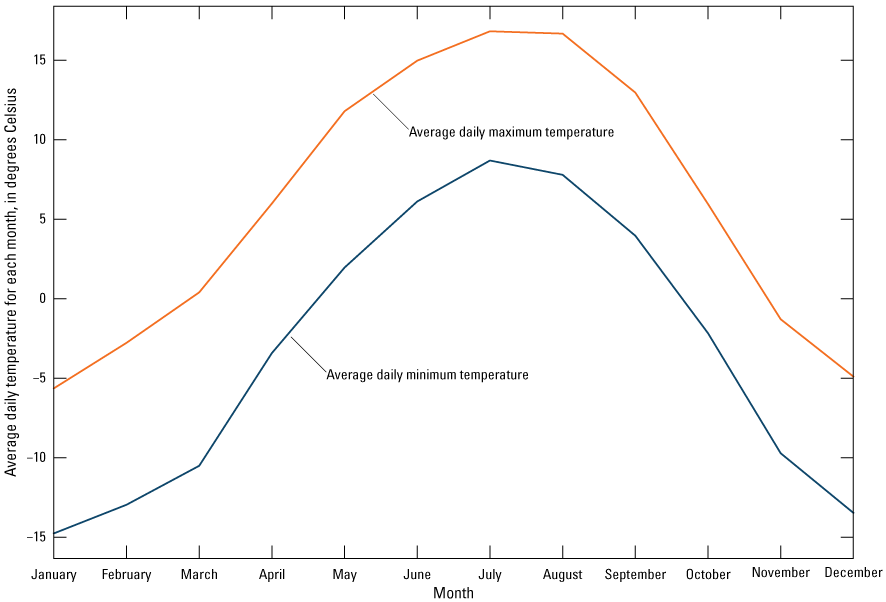
Average daily minimum and maximum air temperature for each month from 1944–2023.
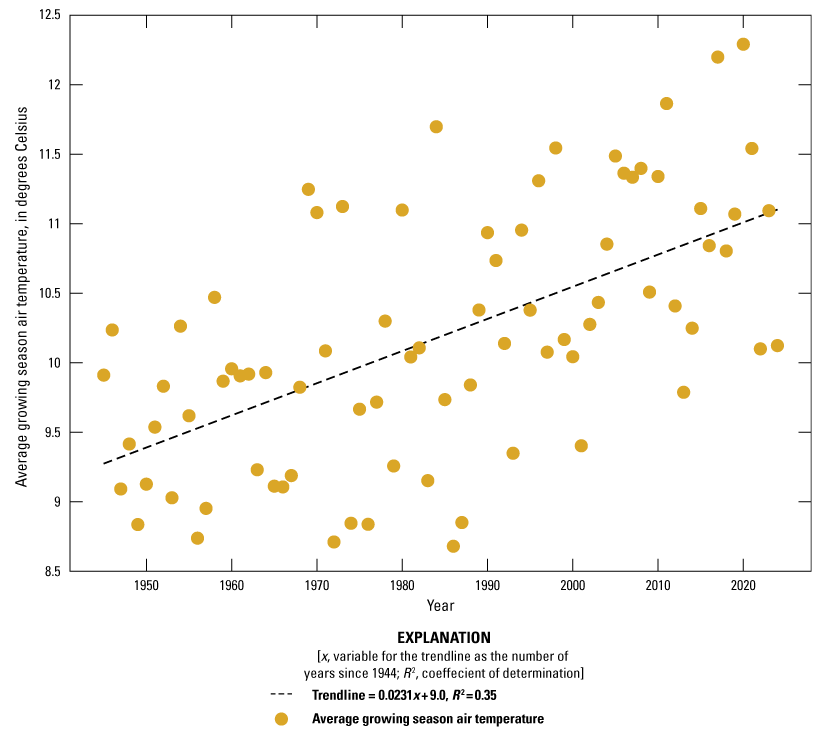
Average growing season air temperatures for each year during 1944–2023. The growing season months were May–September.
Looking forward, a 2017 report (Hayward and others, 2017) on climate change vulnerability in the Kenai Peninsula summarized Scenarios Network for Alaska and Arctic Planning (SNAP) climate projections for the region. The SNAP climate projections show a 2–3-°C increase in July air temperatures and a 3–3.5-°C increase in January air temperatures across the Kenai Peninsula during the next 50 years. Spring thaw is expected to come 3–10 days earlier by the 2060s, with an increase in the warm season length from 200 to 230 days for Kenai (Hayward and others, 2017). By the end of the 21st century, precipitation in Kenai is generally expected to increase (SNAP, 2022). The fraction of precipitation days that include snow (snow-day fraction) in 2030–59 is expected to decline by 22.7 percent in the Kenai Lowlands relative to the 1970–99 average (Hayward and others, 2017). However, the SNAP projections for precipitation are more uncertain than projections for temperature and have a known wet bias in the Kenai Mountain rain shadow where Beaver Creek is located (Bieniek and others, 2016). Additional discussion of the SNAP climate projections and their use in the model is provided in appendix 7.
Geology
The geology of the study area consists of thick Quaternary deposits over Tertiary sedimentary bedrock of the Kenai Group. The bedrock forms a structural trough (Karlstrom, 1964) with reported depths to bedrock of 500–600 feet (ft) near Kenai and as much as 750 ft near Nikiski (Freethey and Scully, 1980; Bailey and Hogan, 1995; Glass, 1996). The bedrock surface becomes shallower towards the southern Kenai Peninsula, where it is exposed in road cuts and beach cliffs, and to the east, where it eventually outcrops as the Kenai Mountains. Thick glacial deposits have since covered the bedrock surface during a complex glacial history. Five major glacial advances occurred in the Pleistocene, from oldest to youngest: the Mount Susitna, Caribou Hills, Eklutna, Knik, and Naptowne glaciations of Karlstrom (1964) (hereafter referred to as “Mount Susitna,” “Caribou Hills,” “Eklutna,” “Knik,” and “Naptowne”). During these periods, ice moved from the surrounding mountain ranges, many of which still have glacial ice today, toward Cook Inlet—east and south from the Alaska and Aleutian Ranges, south from the Talkeetna Mountains, and west from the Chugach Mountains and Kenai Mountains. An overview of the relevant glacial geologic interpretations of the area and the deposits they left across the study basin is provided in appendix 1.
Wilson and Hults (2012) compiled available geologic maps into a geologic map of the region, which became the basis of the surficial geologic units used for this study. Boundaries from Wilson and Hults (2012) were improved using information in a USGS (2010) digital elevation model to better align unit edges with topography. These surficial units were further updated with information from Reger and others (2007) on the more recent Killey stade of Karlstrom (1964) moraine and outwash braidplain deposits. The major surficial geologic units across the study area, as interpreted for this study, are shown in figure 6.
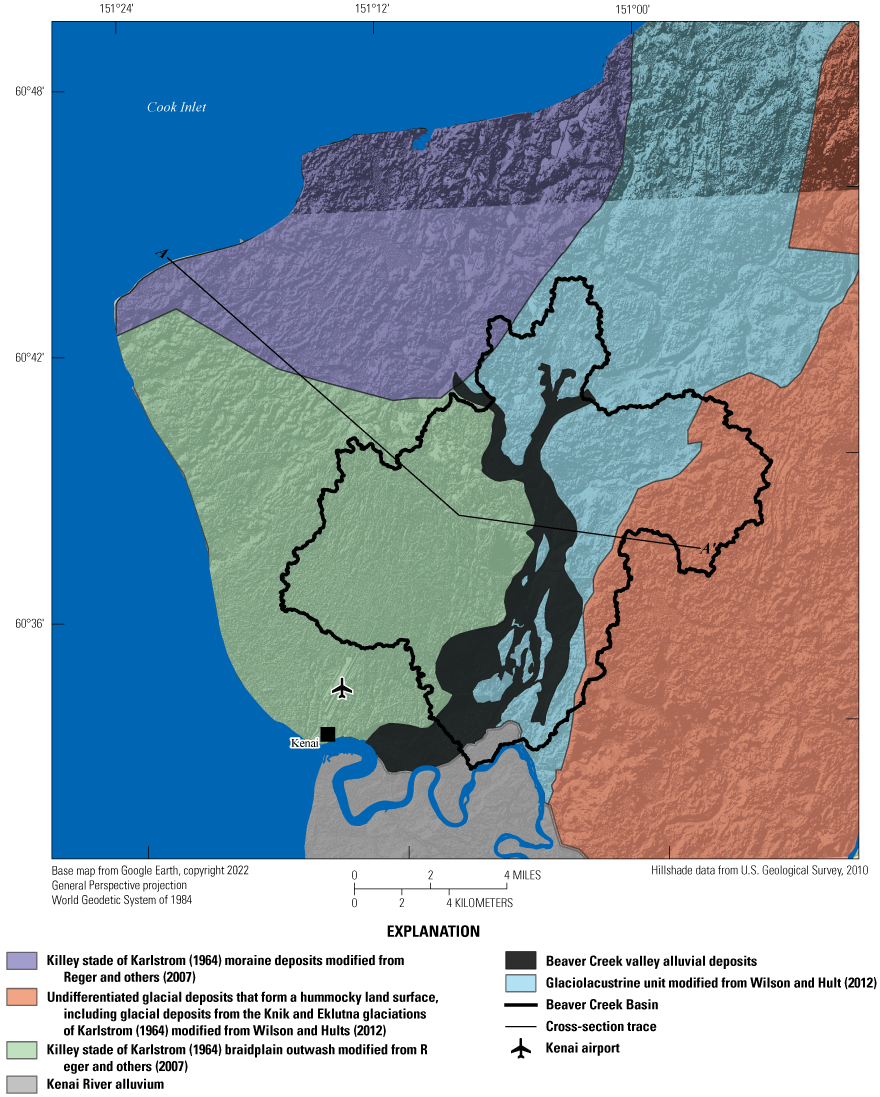
Surficial geologic units in the study area and a trace showing the location of a generalized cross-section presented in figure 7.
Hydrostratigraphic Units and Aquifer Properties
The interpretations of the glacial geologic history of the study area vary somewhat in the available literature (for example, Karlstrom, 1964; Reger and others, 2007), but there is general consensus among prior hydrologic studies in the region on major hydrostratigraphic units (for example, Anderson, 1971; Anderson and Jones, 1972; Freethey and Scully, 1980; Nelson, 1981; Bailey and Hogan, 1995; Homer Soil & Water Conservation District, 2006; R&M Consultants, Inc., 2007; DOWL, 2015). These hydrostratigraphic units are shown in table 2 and include the following:
-
· An upper unconfined aquifer unit of predominately coarse sand and gravel deposits with reported thicknesses ranging from 20 to 100 ft (Anderson and Jones, 1972). This unit includes the sand and gravelly Killey stade moraine and the Killey stade braidplain outwash units to the west; an undated, mixed coarse and fine glaciolacustrine unit modified from Wilson and Hults (2012); and the modern Beaver Creek alluvial deposits.
-
· A unit representing the undifferentiated Knik and Eklutna glacial deposits to the east. This unit is assumed to extend from land surface to the top of the lower confining unit.
-
· A thick (as much as 100 ft; Anderson and Jones, 1972) silt and clay leaky upper confining unit that has a sharp top contact and a gradual gradation into fine sand at the lower contact. This unit was interpreted as fine deposits from Glacial Lake Cook of Karlstrom (1964) during the Moosehorn stade of the Naptowne glaciation and, therefore, assumed to only underly the parts of the upper unconfined aquifer that are mapped as younger, post-Moosehorn stade deposits. This unit was assumed to terminate east at the contact with the older undifferentiated glacial deposits from the Knik and Eklutna glacial periods. Area well logs show fine grained materials consistent with this aquitard under the glaciolacustrine deposits mapped by Wilson and Hults (2012).
-
· A lower confined aquifer with sand and gravel lenses interbedded with fine silt and clay layers. This unit is reported to be 0–100 ft thick (Anderson and Jones, 1972). This unit was interpreted as coarser, pre-Glacial Lake Cook deposits under the upper confining unit. The City of Kenai municipal wells are screened in this unit (AKDNR, 2022).
-
· A lower confining unit that extends below the lower confined aquifer down to bedrock. Less is known about this lowest unit, but it is thought to be mostly clay and silt layers with occasional discontinuous sand lenses (Anderson and Jones, 1972). The glacial history associated with this unit is unknown and it was assumed to be present across the study area.
Table 2.
Site conceptual model showing the hydrostratigraphic units represented by each model layer.The model hydrostratigraphic units were modified from the surficial geology in Wilson and Hults (2012) and Reger and others (2007), with depths and thicknesses of the subsurface units informed by available borehole data (AKDNR, 2022). The borehole data were plotted in several cross-sections across the study area to assess the spatial distribution of the confining unit as well as spatial patterns in the lithologies of the surficial units mapped in figure 6. A generalized cross-section (fig. 7) was developed using the pattern of lithologies observed in the borehole data. Additional details on the development of the geospatial geology datasets for the model is discussed in appendix 1.
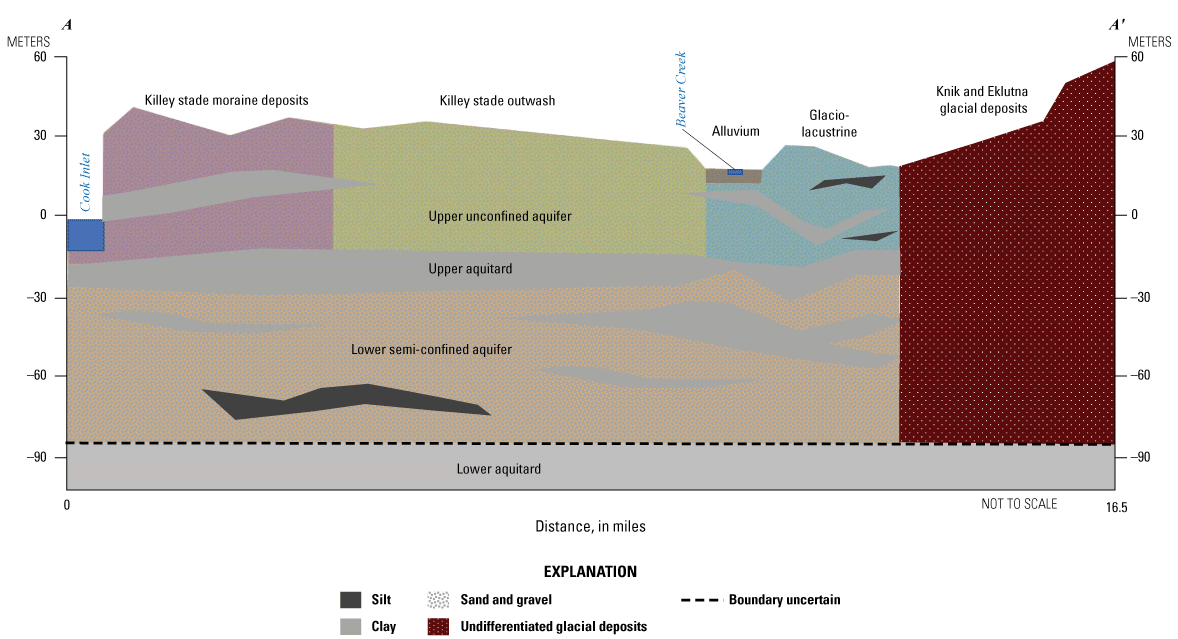
Generalized cross-section showing the hydrostratigraphic units across the study area. Unit depths, contacts, and land surface are approximate and based on data from boreholes across the basin. The location of the section is shown in figure 6.
Water Use
Water use data for permitted withdrawals were obtained from the Alaska Water Use Data System (AKDNR, 2023). The reported data are for larger withdrawals that exceed typical household water use from a private well. The only reported water uses within the basin in recent years (2020 and after) were the City of Kenai municipal wells. Well construction information including screen depths and lengths were obtained from the Alaska Well Log Tracking System database (AKDNR, 2022). Pumping rates were available in Alaska Water Use Data System for 2011–22. City of Kenai total pumping rates declined slightly from 2011 to 2018 and then were more consistent through 2022 (fig. 8).
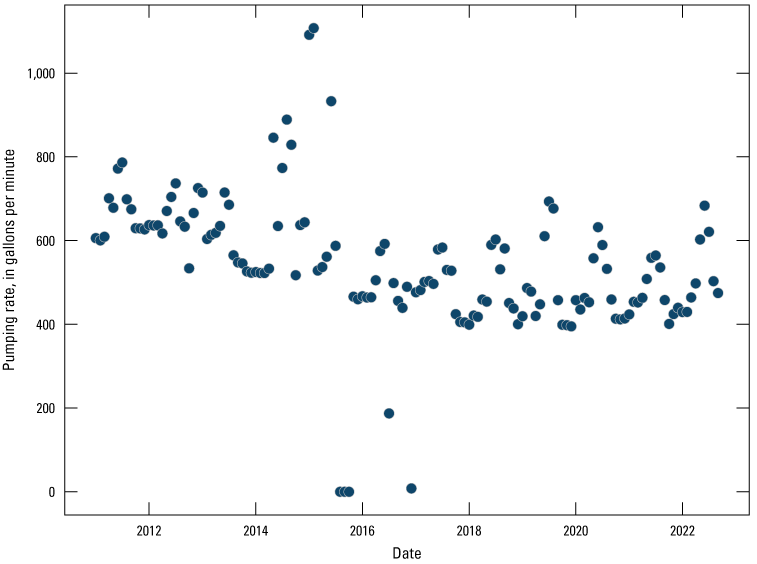
Combined pumping rate for the City of Kenai water supply wells, averaged by month from 2011 to 2022.
Conceptual Model
Water enters the basin primarily as precipitation (rainfall or snowmelt), which is partitioned into evapotranspiration, surface runoff, and net infiltration through the soil zone to the groundwater system (recharge). Groundwater originating from net infiltration or surface-water leakage ultimately discharges to streams, lakes, and wetlands, but may also be taken up directly by vegetation. A small amount of groundwater (approximately 0.03 cubic meter per second [m3/s] or about 4 percent of average base flow in Beaver Creek) is withdrawn by the City of Kenai municipal wells, and some groundwater originating in the westernmost part of the topographic basin likely discharges to Cook Inlet, a competing sink that is closer and lower in elevation. Similarly, some groundwater originating in the hummocky (and streamless) area between the Beaver Creek, Soldotna Creek, and Moose River basins probably flows into the Beaver Creek Basin along its eastern margin. Within the basin, groundwater may cycle through streams, lakes, and wetlands, depending on their elevations relative to the water table. Nearby age dating of wells in the upper aquifer showed relatively young groundwater ages of about 20 years (Glass, 2002).
Historical records of stream discharge where Beaver Creek crosses the Kenai Spur Highway (USGS site 15266500) indicate a base flow-dominated system, where base flow between discharge peaks constitutes approximately 70 percent of the total discharge during the months of May through September (fig. 9). In many natural systems, groundwater discharge makes up the bulk of this base flow. In Beaver Creek, flat topography and extensive wetland areas may slow the flow of surface runoff compared to steeper basins and provide surface storage that results in a substantial surface-water component of base flow. This slow runoff has more exposure to solar radiation and can heat up when at or near the land surface (Sjöberg and others, 2021), providing a steady but warmer source of base flow to Beaver Creek. Deeper and cooler groundwater discharge to Beaver Creek may originate primarily from the upper unconsolidated aquifer, with the upper aquitard limiting interactions between the lower semi-confined aquifer and the surface-water system. Near the City of Kenai wells, pumping from the lower semi-confined aquifer may pull water downward through the leaky aquitard, diverting some water that would otherwise discharge to the creek.
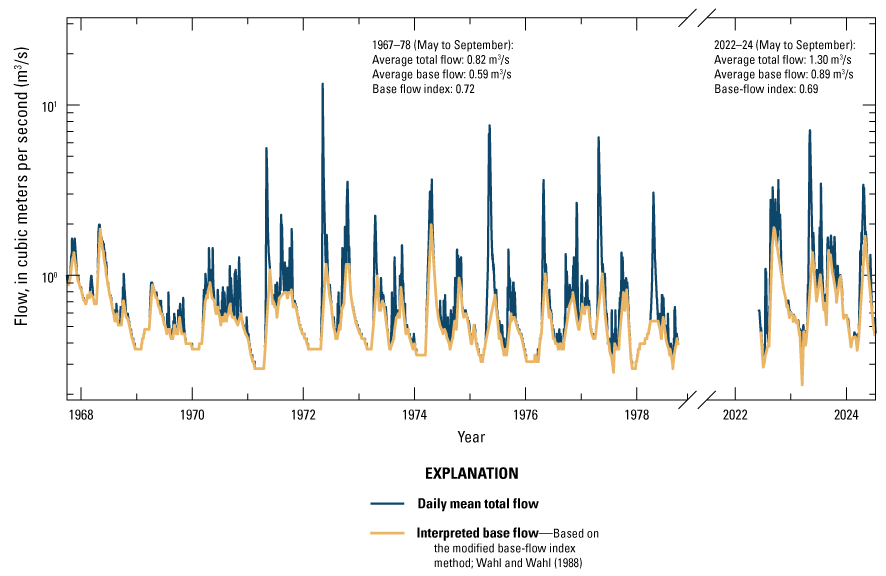
Historical Beaver Creek flow at the Kenai Spur Highway streamgage (U.S. Geological Survey site 15266500) from 1967 to 2024.
Water temperature in Beaver Creek is affected by air temperature; the temperatures of inflowing groundwater; surface runoff; surface water from features such as Beaver Lake; and the interplay of solar radiation, shading, channel width, and flow velocity, among other factors (for example, Bartholow, 1989). Although vegetative shading can mitigate the warming effects of solar radiation (for example, Garner and others, 2017; Fehling and Hart, 2021), shading potential along much of Beaver Creek is limited by the wide valley and predominance of short wetland vegetation. Narrow tributaries that extend into wooded areas or are overhung by alder and other shrub or scrub vegetation may have the best shading potential. Conversely, upstream areas with low flow velocities through wide wet areas of short emergent vegetation may be especially vulnerable to summer temperature increases.
In general, groundwater temperature in cold regions such as the Kenai Lowlands reflects the mean annual air temperature plus some offset representing the insulating effects of the snowpack (Zhang, 2005). Temperature fluctuations at the land surface are dampened exponentially with depth and shifted linearly in time as heat is carried downward from the surface by infiltration, conduction, and vertical groundwater flow (Suzuki, 1960; Stallman, 1965). The temperature of groundwater discharge entering the stream is therefore a function of groundwater flowpath depth (Kurylyk and others, 2015). Shallow groundwater discharge may fluctuate in temperature seasonally but lag air temperatures (for example, with cooler temperatures in early summer and higher temperatures in late summer or early fall). Groundwater originating from deeper than a few meters will be mostly attenuated in temperature amplitude, reflecting the mean annual air temperature plus the offset from snowpack insulation. Groundwater temperatures at greater depths will increasingly lag multidecadal changes in air temperature at the surface, reflecting, in part, past temperatures (Kurylyk and others, 2015).
As noted earlier in the “Introduction” section, Mauger (2013) determined Beaver Creek to have a low sensitivity to air temperature, presumably owing to thermal buffering from cold groundwater. However, similar seasonal amplitudes and phases for air temperatures and stream temperatures collected for this study (fig. 10) indicate stronger “air coupling” (for example, Hare and others, 2023). “Tributary 6” and the lower part of the west fork (fig. 11; sites TL–8 and TL–14 in fig. 10) may have greater proportions of groundwater discharge, as evidenced by cooler summer temperatures in 2022 and winter temperatures above 0 °C. These and other similar locations may serve as thermal “refugia” (for example, Sedell and others, 1990) during warm periods. Other locations in the stream network, including TL–14 during June and July of 2023, show stream temperatures greater than the air temperature (fig. 10). Stream temperatures in excess of air temperature could be an artifact of those locations being farther inland from Cook Inlet than the Kenai airport (and therefore warmer), or indicative of the slow release of water from surface-water storage that is subject to radiative warming. Warm surface runoff during mid- to late summer rain events that are common in this area could dramatically affect temperatures throughout the stream network for days or longer (Feinstein and others, 2022).
A key question for the future sustainability of salmon habitat in Beaver Creek is the extent to which base flow is dominated by groundwater, and the thermal sensitivity of that groundwater to long-term warming of air temperatures. Thermal sensitivity can be conceptualized across different timescales by an “effective depth” parameter that represents the average depth of groundwater flowpaths discharging to a stream (Kurylyk and others, 2015). Deep groundwater can potentially lag surface temperatures in warming for decades and therefore provide a buffer against warming air temperatures, especially during dry periods (Kurylyk and others, 2015; Briggs and others, 2018).
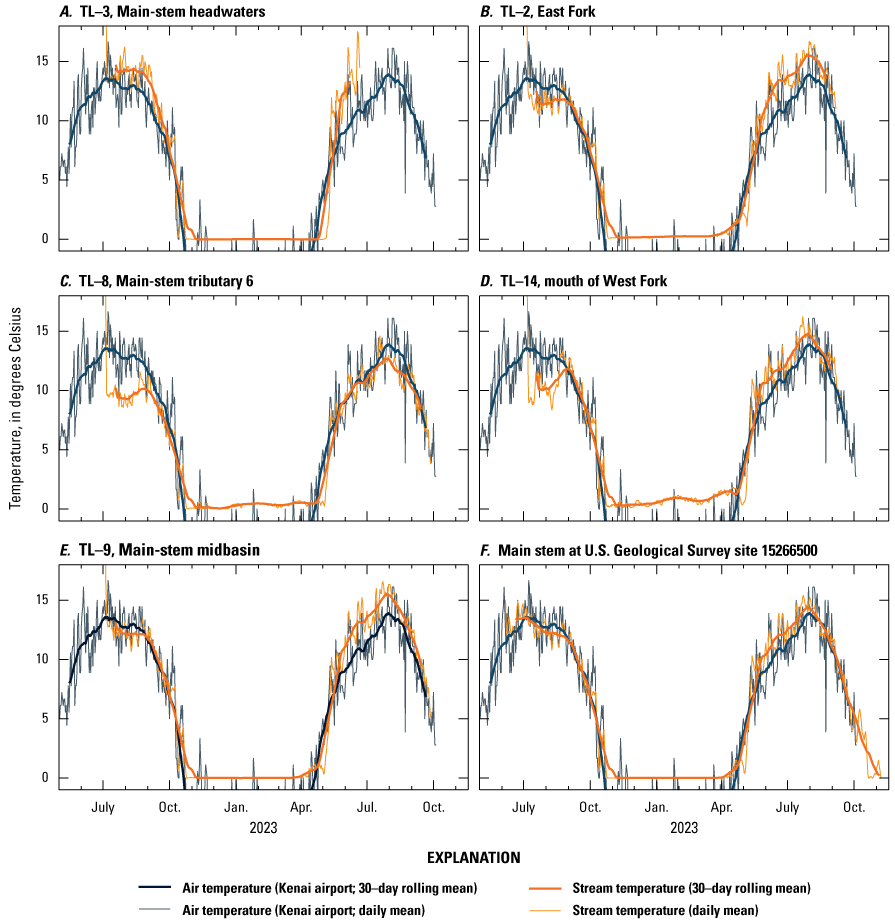
Air and stream temperature at monitoring locations. A, Site TL–3. B, Site TL–8. C, Site TL–8. D, Site TL–14. E, Site TL–9. F, Beaver Creek near Kenai, Alaska, streamgage (U.S. Geological Survey site 15266500).
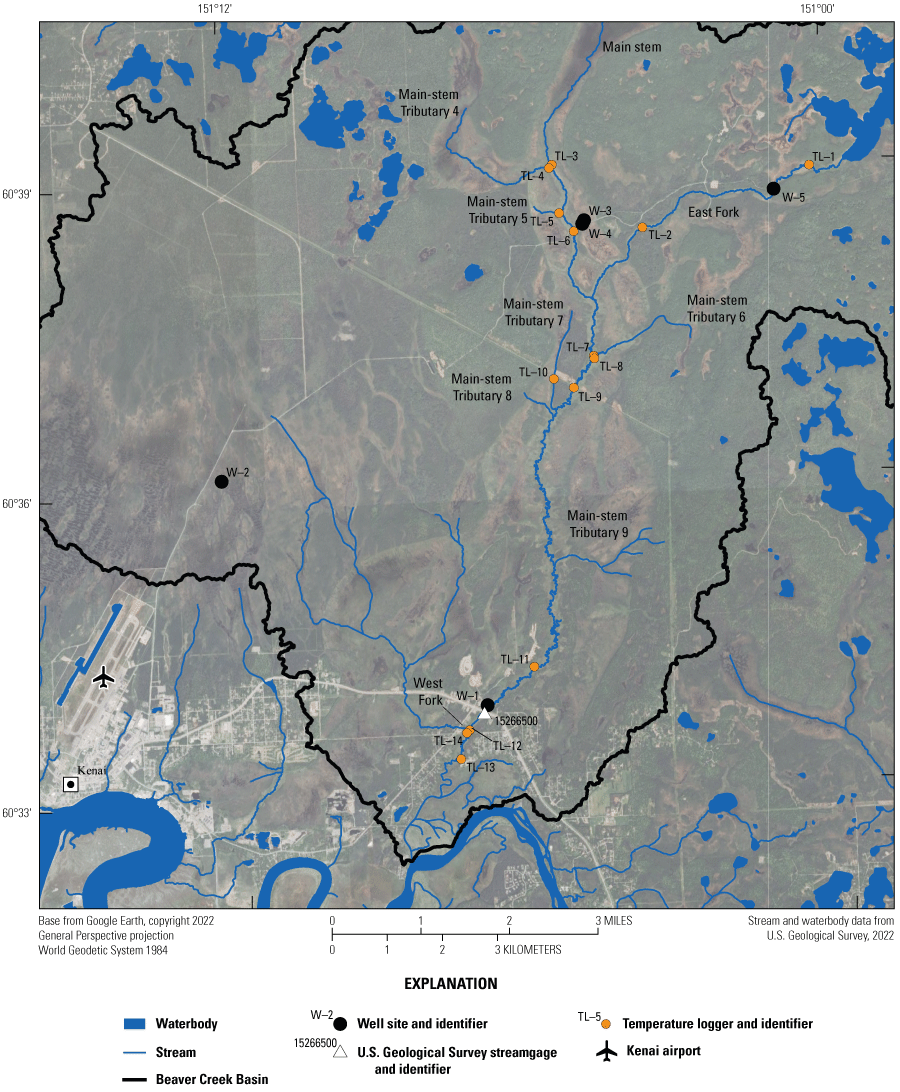
Field data monitoring locations including monitoring wells, stream temperature sensors, and a real-time streamgage. Logger labels at confluences are plotted on the side of the map that corresponds to the tributary the logger is on.
Field Data Collection
Field data were collected for this study to observe instream temperature, streamflow, and groundwater-level dynamics and to inform the groundwater flow and stream temperature models through history matching. The locations of field data monitoring sites are shown in figure 11 and discussed briefly in this section.
Monitoring Well Network
Groundwater levels and water temperatures were measured by the Kenai Watershed Forum (https://www.kenaiwatershed.org/) in five shallow monitoring wells installed for this study (fig. 11). Well depths varied from 1.3 to 4.3 meters below land surface (table 3). Wells 3 and 4 were colocated to observe vertical hydraulic gradients. The wells were instrumented with pressure transducers for continuous recording of hourly groundwater level and temperature data from July 2022 to September 2023. The transducers record absolute pressure, and a barometric logger was deployed to compensate the data for air pressure changes. Manual measurements of depth to water from the top of the well casing were made during each visit to correct for instrument drift and convert the transducer data from water levels to depths below land surface. Raw well data and data with the applied corrections are available in a USGS data release (Koch and others, 2024).
Table 3.
Well construction information for the five study wells.Temperature Sensors
Fourteen temperature loggers were installed in Beaver Creek from July 2022 to September 2023 to record continuous water temperature at a network of locations across the basin (fig. 11). Temperature loggers were operated by the Kenai Watershed Forum following methods from Mauger and others, 2015 for stream temperature monitoring in south-central Alaska, including verifying that sites are well-mixed, pre- and post-deployment quality control checks against a National Institute of Standards and Technology thermometer, and biannual site visits. Site TL–12 is a “long-term” monitoring site where Kenai Watershed Forum has collected stream temperature data since 2010.
Streamflow
Continuous stream discharge data for Beaver Creek at the Kenai Spur Highway are available from June 2022 to September 2024, as well as in the 1960s and 1970s (USGS, 2023; Beaver Creek streamgage; fig. 11). Streamflow at 12 upstream sites along Beaver Creek were measured during synoptic flow surveys on June 8 and July 4–7, 2022 (Koch and others, 2024; locations and values shown on fig. 12).
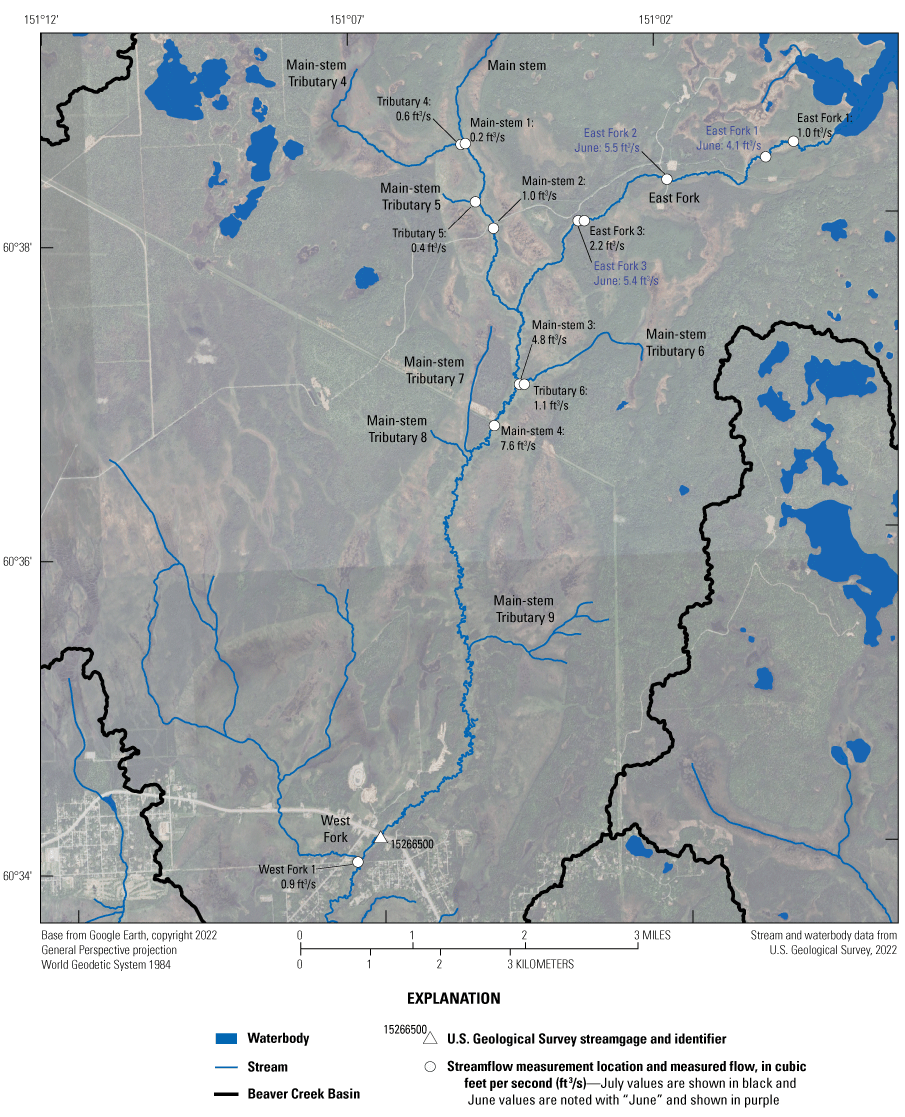
Locations where streamflow was measured during June and July 2022 synoptic streamflow surveys. Shading estimates were also made near the July 2022 streamflow measurements.
Shading
Stream channel shading data were collected in July 2022 near the synoptic streamflow locations (fig. 12) using a densiometer and following the methods of Fitzpatrick and others (1998). Shading data were grouped by wetland type (fig. 13) to estimate ranges of shade for the riparian vegetation communities (emergent, scrub-shrub, mixed emergent and scrub-shrub; and non-wetland for riparian areas not mapped as wetlands; U.S. Fish and Wildlife Service, 2020). Representative values and ranges were then applied across the basin for the SNTEMP model using the mapped wetland communities (appendix 5). A summary of the measured shading information for the wetland types is provided in table 4; shading measurements by point location are available in a USGS data release (Koch and others, 2024).
Based on the wetland descriptions in USGS (1996), palustrine emergent wetlands in Alaska are generally marshes and wet meadows dominated by herbaceous plants and sedges that are typically not tall enough to provide much shade to the stream channel. These wetland corridors had the lowest estimated shade in the Beaver Creek Basin (10 percent) and are the most common wetland plant community along the main stem and east fork valleys. Palustrine scrub-shrub wetlands are common near stream channels in Alaska, are dominated by woody plants and perennial herbs, and should provide more shade to a nearby stream channel than emergent wetlands. These wetland corridors had an average estimated shade of 37 percent and are common in the southern tributaries and near the confluence of the main stem and east forks (fig. 13). Mixed palustrine and scrub-shrub wetlands should have a range in shading values between emergent and scrub-shrub but only one measurement site was in a mixed setting because many of these reaches were in inaccessible parts of the basin (along the north and west forks). Therefore, the range and average in table 4 for the mixed category are from all the emergent, scrub-shrub, and mixed measurement points. Most of the creek valley is covered by some type of mapped wetland. The non-wetland category covers areas that are mostly in the smaller tributary valleys, which had narrower valleys with more shrub cover. Two representative shading measurements were collected in the west fork in non-wetland stream corridor locations and had an average of 62 percent shade.
Table 4.
Measured shading for the mapped wetland types along the Beaver Creek channel.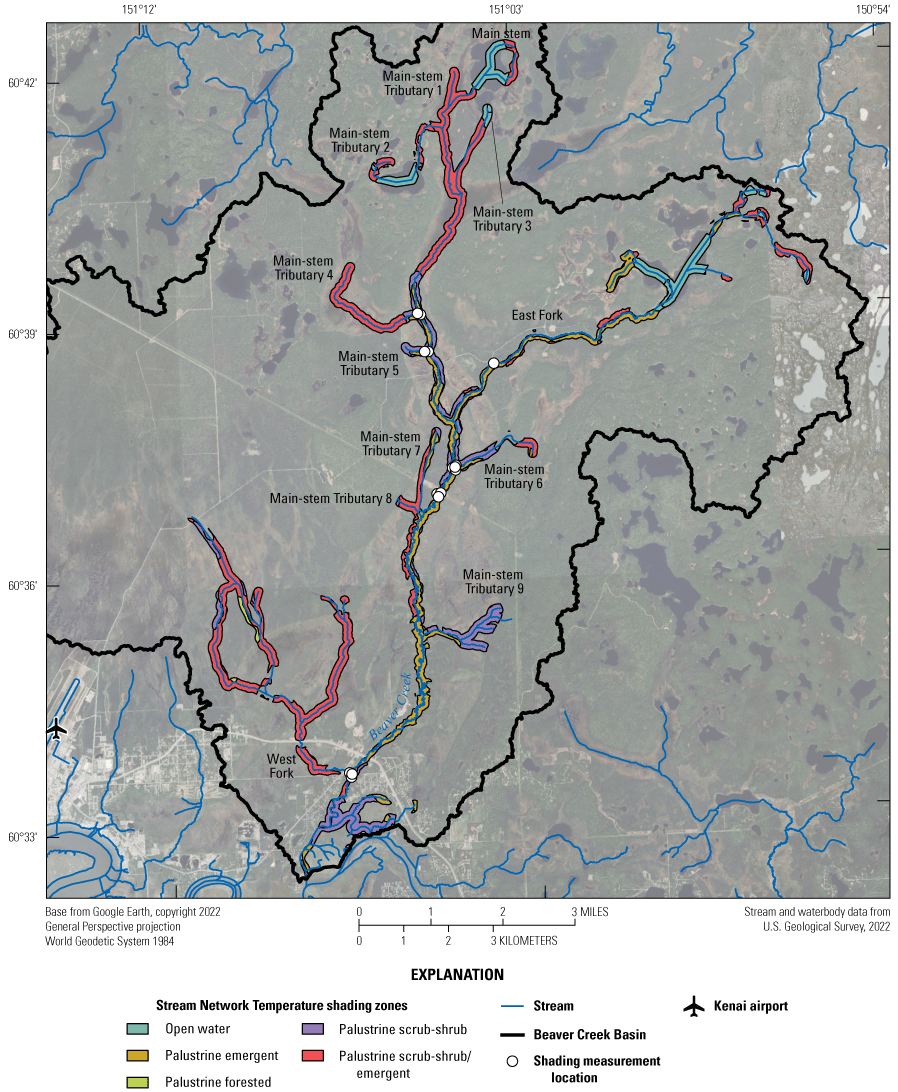
Wetland shading zones based on the vegetation communities within a 100-meter buffer of the Beaver Creek channel and locations where shading was measured during July 2022. Note, most shading measurement locations have several nearby measurements but show up as a single location at the basin scale.
Groundwater Flow and Soil-Water-Balance Models
An analytic element groundwater flow model was constructed using GFLOW (version 2.2.4; Haitjema, 1995) to simulate regional groundwater flows and a groundwater contributing area (“groundwatershed”) for Beaver Creek, under the dry summer conditions of early July 2022, after several months of little to no precipitation. A more detailed numerical groundwater flow model focused on the Beaver Creek Basin was then developed using MODFLOW 6 (version 6.4.2; Langevin and others, 2017, 2023) to look at water exchanges between Beaver Creek and the groundwater system. Groundwater recharge and surface runoff inputs to the MODFLOW 6 model were obtained from an SWB (Westenbroek and others, 2018) model that partitions precipitation into evapotranspiration, runoff, and groundwater recharge (as net infiltration past the root zone), across a gridded area. The domains for all three models are shown in figure 14. The following sections provide an overview of the MODFLOW 6 groundwater flow model construction and history matching, where model inputs were systematically adjusted to improve the fit between model outputs and equivalent field measurements. Additional details on the GFLOW model are available in appendix 2, on the SWB model in appendix 3, on the MODFLOW 6 model construction in appendix 4, and on history matching in appendix 6. Model files and reproducible model construction workflows are provided in an associated data release (Leaf and others, 2024).
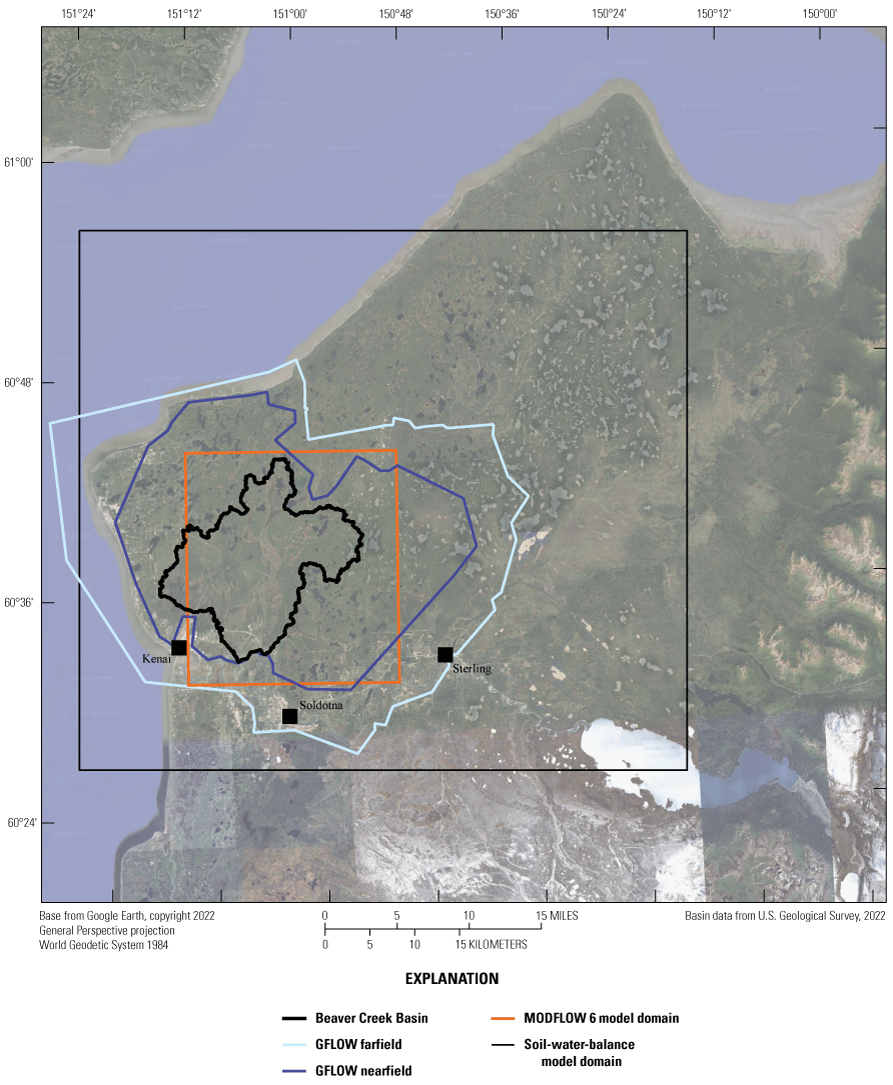
Map showing the extents of the GFLOW, MODFLOW 6, and Soil-Water-Balance code model domains.
Discretization
The MODFLOW 6 model is discretized on a uniform grid of 50-meter cells with four layers that represent the hydrostratigraphic units described in table 2. Temporally, the historical MODFLOW 6 model simulates an initial steady-state period representing average conditions between January 1, 2015, and January 1, 2019, followed by transient 7-day periods from January 1, 2019, to October 1, 2023. Periods of 1 or 2 days are included at the end of each calendar year so that a new 7-day period starts on January 1, and the periods within each year span consistent days of the year (a requirement of SNTEMP).
Boundary Conditions
Boundary conditions include sources, sinks, and surface-water levels that control the groundwater flow system. The following boundary conditions were included in the MODFLOW 6 model (fig. 15):
-
· Groundwater recharge (as net infiltration from SWB) applied across the top of the model using the Recharge Package.
-
· Runoff from SWB (“runoff” and “rejected net infiltration” variables) within a designated area (fig. 15); mapped to the SFR Package using NHDPlus High Resolution catchments (Moore and others, 2019).
-
· Lateral fluxes along the model perimeter representing regional groundwater flow (simulated by the GFLOW model); applied using the Well Package.
-
· Groundwater pumping from the City of Kenai represented with the Well Package.
-
· Groundwater/surface-water interactions along Beaver Creek and other streams represented with the SFR Package, which also tracks instream flows, allowing for comparison between model outputs and measured instream flows.
-
· The Kenai River was represented with the River Package and the Kenai River Estuary with the General Head Boundary Package.
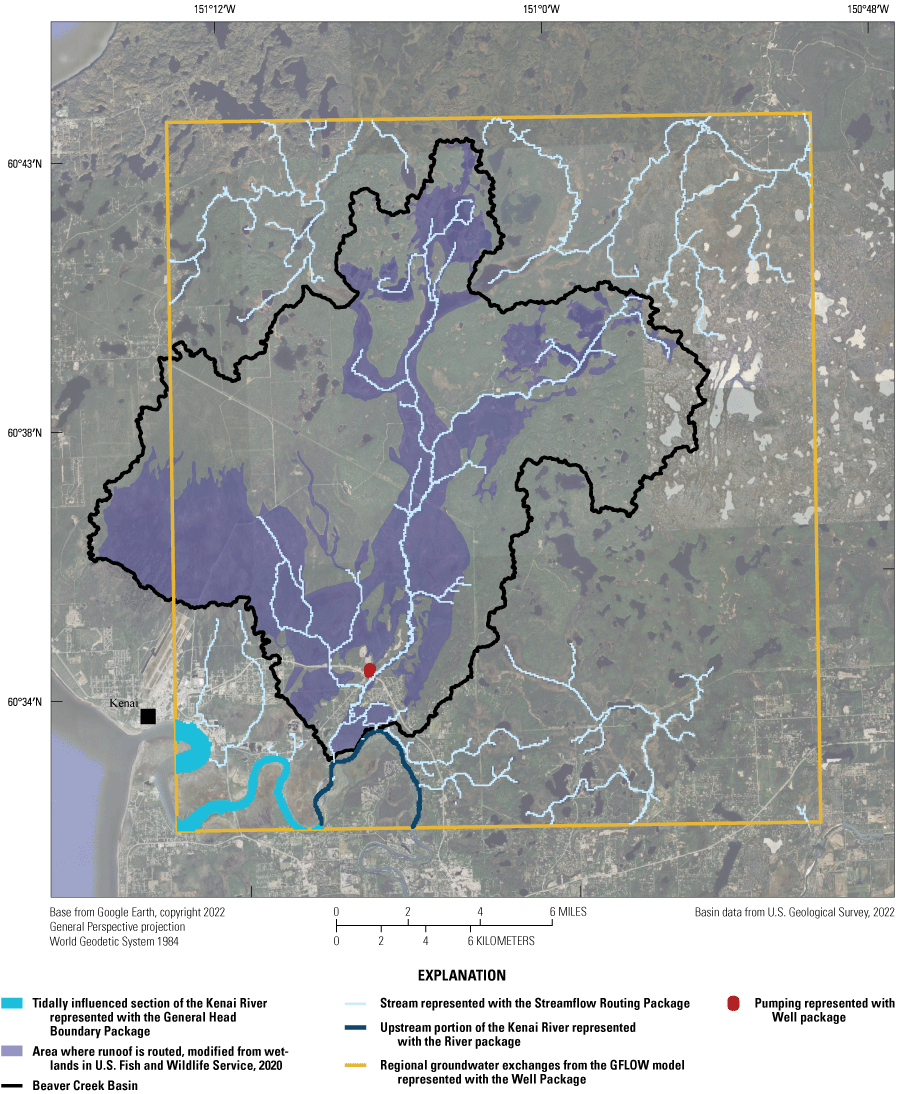
Map showing the boundary conditions for the MODFLOW model.
Aquifer Properties
Aquifer properties define how easily water can move through the modeled aquifer (hydraulic conductivity) or be released from aquifer storage (storativity). The limited information from previous studies on the aquifer properties for the hydrostratigraphic units beneath the Beaver Creek Basin is summarized in table 5. Most of the estimates do not specify if they are horizontal or vertical hydraulic conductivity. In addition, the applicability of these measurements to the groundwater model is limited by small measurement volumes (especially for drill cuttings and lab permeability tests) and the potential for bias in methods that disturb the original pore structure. In general, larger hydraulic conductivities would be expected at groundwater modeling scales compared to lab measurements (Rovey and Cherkauer, 1995). The lower confined aquifer is thought to be more conductive than the upper unconfined aquifer (Anderson and Jones, 1972).
An aquifer test in a production well near North Kenai indicated a storativity of 2.8x10⁻⁴ for the confined aquifer (Anderson and Jones, 1972) but it is unclear whether the test represented the regional confined aquifer or the local upper confined aquifer that is present near Nikiski. An aquifer test in the City of Kenai production wells in the confined aquifer beneath the Beaver Creek valley produced storativities between 2.8x10⁻⁴ and 3.3x10⁻³ (Anderson and Jones, 1972; AKDNR, 2022). Assuming a 60-meter thick aquifer, this would correspond to specific storage values of between 4.7x10⁻⁶ and 5.5x10⁻⁵ (per meter of aquifer thickness).
Table 5.
Summary of literature values for hydraulic conductivity in this region.| Unit | Location | Hydraulic conductivity, in feet per day | Method | Source1 |
|---|---|---|---|---|
| Upper unconfined aquifer | Kenai, Alaska, near Cook Inlet bluffs | 11.2–11.8 (vertical) | Lab permeability tests | R&M Consultants, Inc, 2007 |
| Kenai, Alaska | 13–54 | Unknown | Anderson and Jones, 1972 | |
| Upper confining unit | Beaver Creek valley | 0.0007–0.3 | Repacked drill cuttings | Anderson and Jones, 1971 |
| Lower confined aquifer | Beaver Creek valley | 1.8–76 | Repacked drill cuttings | Anderson and Jones, 1971 |
| North Kenai, Alaska | 54–350 | Aquifer tests, type unspecified | Anderson and Jones, 1972 | |
| Kenai, Alaska, supply well 2B, state well ID 34930 | 48 (horizontal) | Pumping test attached to well log in Alaska Well Log Tracking System database | Alaska Department of Natural Resources, 2022 |
Stream Temperature Model
A stream temperature model of Beaver Creek and its tributaries was developed using the SNTEMP simulation code (Bartholow, 2010). SNTEMP is a physically-based, one-dimensional heat transport model that predicts daily mean stream temperatures using a steady-state, control volume-energy balance that considers radiation, evaporation, conduction, and convection for each stream reach, and heat transport between successive reaches in a stream network (Theurer and others, 1984). Inputs to the model include simplified stream geometry, meteorologic data, and hydrologic data. The primary output is average stream temperature at each reach for each simulation period. Empirically-based maximum temperatures are also available, but potentially unreliable (Bartholow, 2010, p. 73). Details of the SNTEMP model construction, parameter estimation, and future climate scenarios are provided in appendixes 5–7.
Parameter Estimation
After the models were constructed and manually adjusted to produce reasonable outputs, formal parameter estimation was performed on a sequentially linked MODFLOW and SNTEMP model via history matching. Model input parameters were systematically adjusted to improve the fit between model outputs and equivalent field measurements. Colloquially, this process is often called model “calibration,” a term that implies a unique, optimal model configuration (Oxford English Dictionary, 2023). We use the term “history matching” here to recognize the inherent nonuniqueness of the model—that many different model configurations can produce outputs that are consistent with field observations. In addition to the “hard data” of system state that guides the formal parameter estimation, history matching is also guided by subjective decisions (for example, in determining how the model is parametrized, which field observations are emphasized, and the acceptable level of model fit to those observations; appendix 6).
History matching was performed using the iterative Ensemble Smoother (iES) algorithm implemented in the PEST++ software suite (White, 2018; White and others, 2020). Initial “prior” distributions of plausible model input parameter values were developed from field data, previous studies, and expert knowledge. The prior parameter distributions were then randomly sampled to produce an initial ensemble of plausible models that was input to PEST++ iES.
At each iteration, PEST++ iES runs each model in the ensemble and evaluates the outputs. An approximate Jacobian matrix consisting of empirical correlations (sensitivities) between the parameter values of the various ensemble members and their respective outputs is assembled and used to update input parameter values to reduce the discrepancy between the model outputs and equivalent field observations. The result is a posterior ensemble of models conditioned on the field observations, where uncertainty in the model inputs and outputs are reflected in the spread of values in the ensemble. A “base” realization represents the minimum error variance solution and can be used when a single model is desired. In this study, the “base” was carried forward to the future scenarios analysis (appendix 7).
The MODFLOW model was parametrized similar to Corson-Dosch and others (2022) and Leaf and others (2023), where coarse zones were used to address large-scale biases in aquifer property input arrays and finer pilot point multipliers were used to allow for local aquifer heterogeneity. Other MODFLOW parameters included multipliers for boundary condition conductances (SFR, River [RIV], and Constant Head [CHD] Packages), and static global multipliers on recharge and surface runoff fluxes. SNTEMP inputs that were parametrized included lateral inflow temperatures, headwater inflow temperatures, shading percentages, and stream width.
Field measurements and model outputs of aquifer heads, total streamflows, and stream temperatures were processed into equivalent observations, assigned weights, and assembled into an objective function that quantified the model misfit. A primary objective of this process was to best replicate the observed stream temperatures and streamflow, which were the focus of this study. Less weight was placed on fitting groundwater elevations (heads).
The adjustable parameters and observations used in the history matching are summarized in appendix 6; additional details are included in the companion data release (Leaf and others, 2024). Several iterations of iES were run with adjustments to the model setup, the parametrization, and the observation weighting until the model produced a satisfactory fit to the observations.
Model Scenarios
Potential future climate scenarios for the period of October 1, 2023–September 30, 2050 were developed as inputs to the linked SWB, MODFLOW, and SNTEMP model. Five climate scenarios were developed from daily and monthly SNAP climate projection data (SNAP, 2022). Available daily downscaled projections included the Geophysical Fluid Dynamics Laboratory (GFDL) GFDL–CM3 model and the National Center for Atmospheric Research (NCAR) CCSM4 model. For both of these general circulation models (GCMs), only the Representative Concentration Pathway (RCP) 8.5 scenario, which assumes high emissions, was available (Moss and others, 2010; Intergovernmental Panel on Climate Change, 2014). The “gfdl3” and “ccsm4” scenarios in this study were based on these projections. Three additional scenarios were based on the SNAP community projections, which averaged results from five GCMs to produce average temperatures for each month of the year, for the 2030–39, 2060–69 and 2090–99 periods, under the RCP 4.5, 6.0 and 8.5 scenarios (Walsh and others, 2018). To create daily input from the SNAP monthly means, average rates of temperature increases (for example, degrees Celsius per week) between the 2030 and 2039 and 2060 and 2069 community projection periods were computed for each month of the year. The previous 9 years of climate (October 1, 2014–September 30, 2023) were repeated to fill the period of October 1, 2023, to October 1, 2050. Total changes in temperature were then linearly interpolated to each weekly simulation period, based on the average monthly rates. The total changes were added to the repeated historical temperatures to create hypothetical future temperatures. All other climate variables were assumed to remain the same.
The five climate scenarios were each evaluated with alternative conceptual models of “shallow” or “deep” (thermally sensitive or insensitive) groundwater temperature inputs to the SNTEMP model (making 10 scenarios total). The “shallow” conceptual model assumed groundwater temperatures to be lagged only a few months behind average air temperatures, whereas the “deep” groundwater scenario assumed that groundwater temperatures would remain steady at the observed average temperature of 4.2 °C through 2050 (appendixes 6 and 7). An 11th scenario evaluated the potential effects of a 0.44-percent annual increase in groundwater pumping for the City of Kenai in response to projected population growth. For brevity and consistency with the scenarios based on the daily SNAP projections, only the RCP 8.5 scenario of the SNAP community projections (hereafter referred to as the “snap-mean” scenario) is presented in this report; results from the RCP 4.5 and 6.0 versions of the SNAP community projections are included in the companion data release (Leaf and others, 2024). The scenarios used the “best fitting” MODFLOW and SNTEMP model parameters from history matching with updated climate inputs for SWB and SNTEMP, including groundwater inflow and surface runoff water temperatures (appendix 6). Additional information on the climate projections, including a comparison of projection outputs and observed weather data are available in appendix 7.
The mean annual air temperature for the historical period and each of the model scenarios that have unique air temperature datasets are shown in figure 16. During the overlapping historical period from 2010 to 2023, where observed and projected data are available, the ccsm4 model scenario most closely matched the observed data. The gfdl3 model scenario is biased slightly high relative to the observed period and has the highest annual air temperatures by 2050.
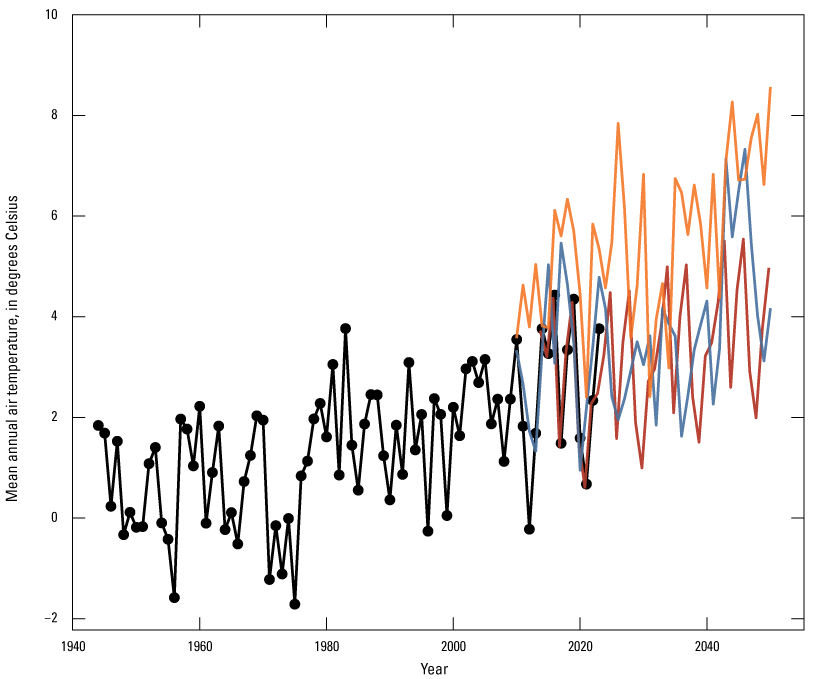
Average annual air temperature near Kenai, Alaska. Historical data are from the Kenai and Soldotna airports as described in the “Site Description and Hydrologic Setting” section. Future projections are from the climate projections discussed in the “Model Scenarios” section.
The scenario models were run from January 1, 2019, to September 30, 2050. For 2019 through September 2023, the historical SWB model outputs (driven by observed precipitation and temperatures) were used. From October 1, 2023, the future SWB model outputs were used. Using the historical conditions through September 2023 ensured consistent initial conditions across the scenario groundwater flow models and allowed for quantitative comparison of model fit to field observations between the scenario models and historical model to verify consistency. The SNTEMP models, which simulate each time period independently, used the “future” (GCM-based) forcings for the entire scenario period starting with January 1, 2019, which allowed for comparison of temperature changes between “current” and future conditions without any artifacts of bias between historical observed temperatures and GCM-based temperatures simulated for the historical period.
Results and Discussion
In this section the results are first presented for observations used in the history matching, followed by summaries of the MODFLOW and SNTEMP outputs. The MODFLOW and SNTEMP sections present information for the historical and future projected climate periods to allow for easy comparison in how stream and stream temperatures might change in the coming decades.
History Matching Results and Discussion
History matching results for streamflow at Kenai Spur Highway (Beaver Creek streamgage) and stream temperature at the Kenai Watershed Forum long-term monitoring site TL–12 (located just downstream from the streamgage; fig. 11) are shown in figures 17 and 18. Detailed history matching results for all observations are available in appendix 6 and the companion data release (Leaf and others, 2024). These figures include the base member of the history matching ensemble that was selected as the “best” model and results for each ensemble member, with the spread in these lines indicating model uncertainty (in the input parameter values that were adjusted during history matching). Places where the measured values fall outside of the ensemble results indicate structural error in the model (stemming from oversimplification, missing processes, or other factors in the model design) that was not interrogated in the history matching process. For example, the offset between the observed and simulated spring freshet peaks in May 2023 may stem from snowmelt being simulated too quickly in the SWB model, which was not included in formal parameter estimation; unsaturated zone processes that are not considered in the groundwater flow model (Hunt and others, 2008); or surface runoff delays or storage that are not considered in the SWB model. Oversimulation of low flows during the summer of 2022 and winter of 2022 and 2023, and undersimulation of streamflow in the fall of 2022 and other times may indicate a tradeoff in optimizing the fit of the full time series.
In general, stream temperatures are well-fit by the model across the longest time-series at site TL–12 (fig. 18). Across all sites, a root mean squared error in temperature of 1.35 °C was achieved, with some bias in the ensemble varying by site and through time (appendix 6).
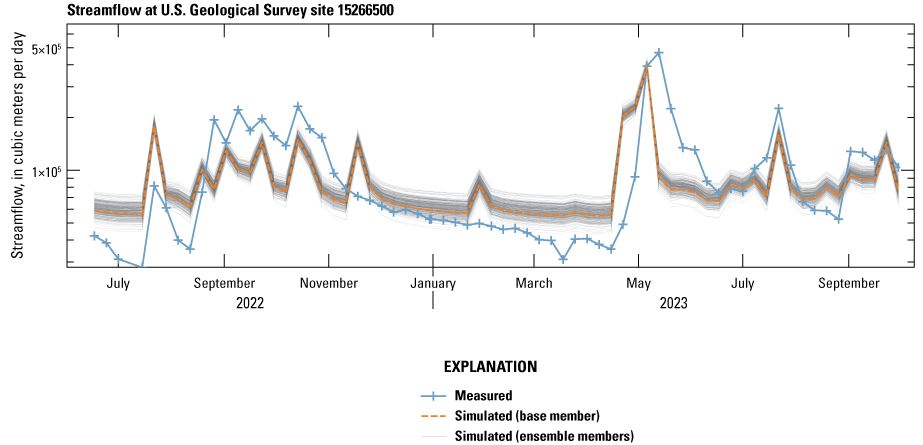
History matching results for simulated and observed streamflow at the Beaver Creek near Kenai, Alaska, streamgage (U.S. Geological Survey site 15266500).
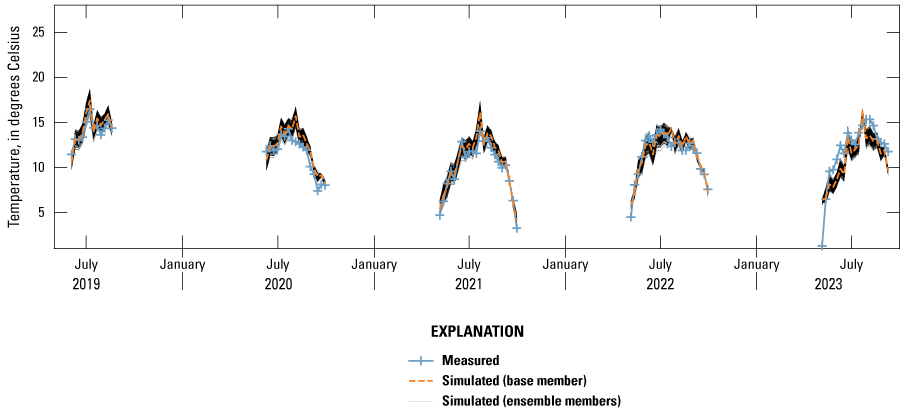
History matching results for simulated and observed stream temperatures at site TL–12 (Kenai Watershed Forum long-term site near Kenai Spur Highway).
MODFLOW Model Results and Discussion for Study Period and Future Scenarios
The MODFLOW model provided an estimate of groundwater flow throughout the Beaver Creek Basin including exchanges between the groundwater and surface-water system and the water table surface during the study period (fig. 19). The average growing season basin conditions show neutral or loss of stream water to the groundwater system in the headwaters of most tributaries, with the strongest groundwater inflows to the stream along the lower two-thirds of the main stem of Beaver Creek. These conditions are consistent with many of the basin headwaters being in topographically flatter, wetland-rich areas and the main stem occupying the relict glacial drainageway that provides more topographic relief to support steeper groundwater gradients.
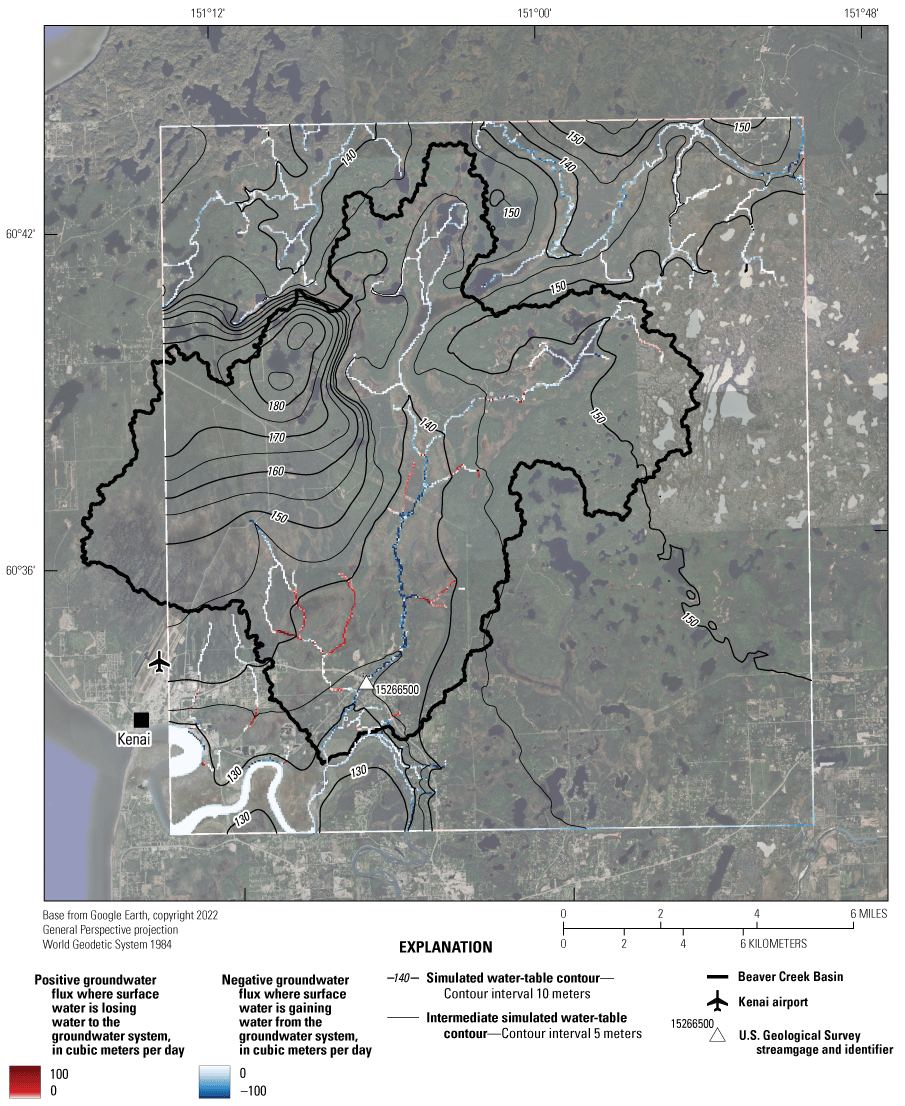
Map showing average groundwater fluxes and water table contours simulated by the MODFLOW 6 model for the April 23–October 1 growing season in 2022 and 2023.
The simulated water balance during the warm growing season of May through September was evaluated for the historical and potential future climate scenarios. Average total flows simulated May through September at the mouth of Beaver Creek are shown in figure 20. Mean growing season streamflow in Beaver Creek at the outlet with the Kenai River is between one-third and one-half runoff and the rest is base flow, making this system slightly base flow dominated. During future summer periods, streamflow may remain similar to the study period or increase somewhat with more runoff. The slight jump in streamflow between the study period, which uses observed climate data, and the subsequent 2024–32 future period, which uses climate projection data, indicates that with the rain shadow adjustment, running the model with projection data can produce reasonable streamflow estimates, but they might be biased slightly high. The lack of obvious trends from 2024 to 2032 and 2042 to 2050 indicates that total streamflow volumes and the base-flow portion in Beaver Creek Basin is not expected to change dramatically by the mid-21st century.
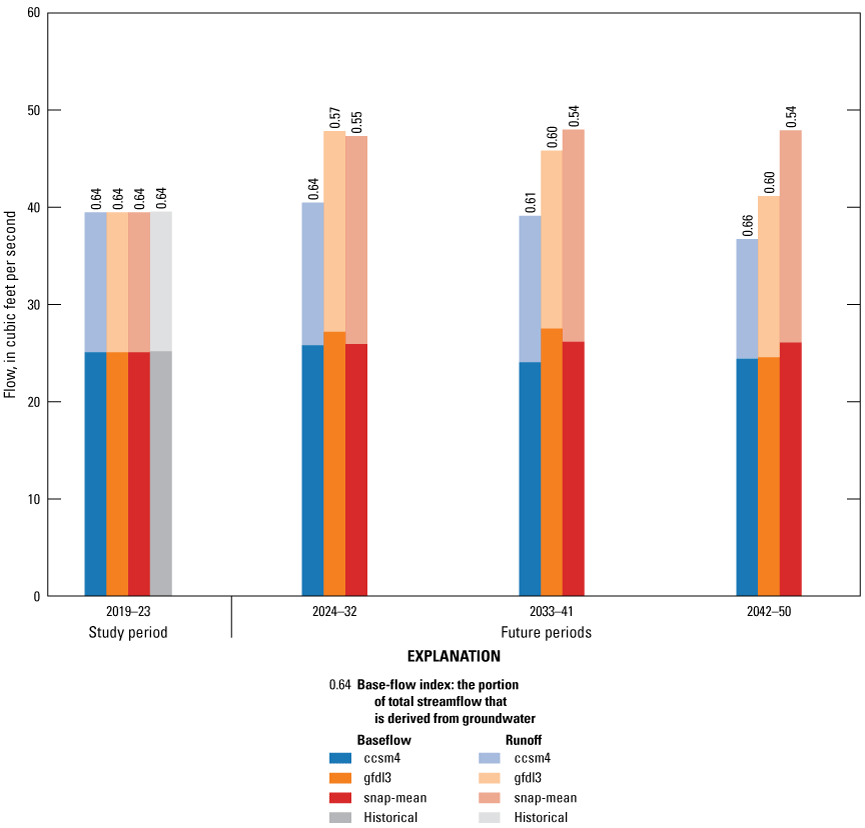
Bar graph summarizing the simulated mean growing season (May–September) total streamflow split into base flow and runoff for Beaver Creek at the outlet during 2019–23 (study period), 2024–28, and 2042–46 for the historical model and future model scenarios. The total bar height represents total streamflow.
Stream Network Temperature Model Results and Discussion for Study Period and Future Scenarios
Simulated stream temperatures were assessed using the Alaska water quality standards for stream temperature. Based on the anadromous fish life cycles discussed in the “Introduction” section, the egg and fry incubation and spawning standard of 13 °C is critical during the late summer and fall for coho salmon, early to mid-summer for Chinook salmon, mid- to late summer for sockeye salmon, and late fall to early winter for Dolly Varden. Between these four fish species, the 13-°C standard could be applicable for spawning and egg incubation throughout the full May–September simulation period. If species-specific timing is of interest to a future user, monthly exceedances could be readily calculated using the SNTEMP results in the data release (Leaf and others, 2024). The migration and rearing standard of 15 °C is applicable across the full growing season and for all four anadromous fish species, which each spend at least one full summer season in the basin. The 18 AAC 70 Alaska water quality standards also state that stream temperature should not exceed 20 °C at any time (Alaska Department of Environmental Conservation, 2024).
Maximum 7-Day Mean Stream Temperatures
Maximum weekly stream temperatures were selected from the SNTEMP results as the maximum 7-day model period mean stream temperature in each year at a given location. Observed equivalents were developed from the field data by averaging temperatures during each 7-day simulation period and selecting the annual maximums. This method is equivalent to the method in Kyle and Brabets (2001), who computed means for 7-day periods occurring on the same days of each year, but differs from the maximum weekly average and maximum weekly maximum temperatures presented by Mauger and others (2017), which were based on 7-day rolling averages of daily mean and daily maximum temperatures, respectively. The 7-day temporal resolution of the SNTEMP model in this study precludes the use of rolling means. Discrete 7-day averaging periods may underrepresent extremes compared to rolling means if the extreme temperature events are split between two 7-day periods.
The maximum 7-day mean stream temperatures simulated in each year, across the seven future scenarios, are compared in figure 21. To correct for bias between observed and simulated temperatures while retaining the relative differences between the “shallow” and “deep” (referred to here as “steady”) groundwater variants, the mean offset from the observed 2019 maximum 7-day temperature (for a model stress period) was computed across all variants and subtracted from the simulated temperatures for that scenario. For the three climate scenarios, subtracting the mean offset resulted in 2019 simulated results where the “shallow” groundwater variant was greater than the 2019 observed maximum, and the “deep” (“steady”) groundwater variant was less than the 2019 observed maximum (fig. 21). The results indicate summer maximum temperatures like 2019 becoming more frequent or even common by mid-century. Considering a typical difference of about 1.5 °C between maximum weekly average temperatures (similar to the 7-day model period maximums shown in fig. 21) and maximum weekly maximum temperatures (Mauger and others, 2017), the results indicate that maximum weekly maximum temperatures in excess of 20 °C may be common by the 2040s. Nearly identical results for the “ccsm4” and “ccsm4-pop-growth” scenarios, which differ only in the simulation of the municipal pumping increase, indicate that a 0.44-percent annual increase in municipal pumping from 2023 to 2050 would have little to no effect on annual maximum 7-day temperatures in Beaver Creek. This finding was consistent across the other temperature metrics presented in this section (Leaf and others, 2024).
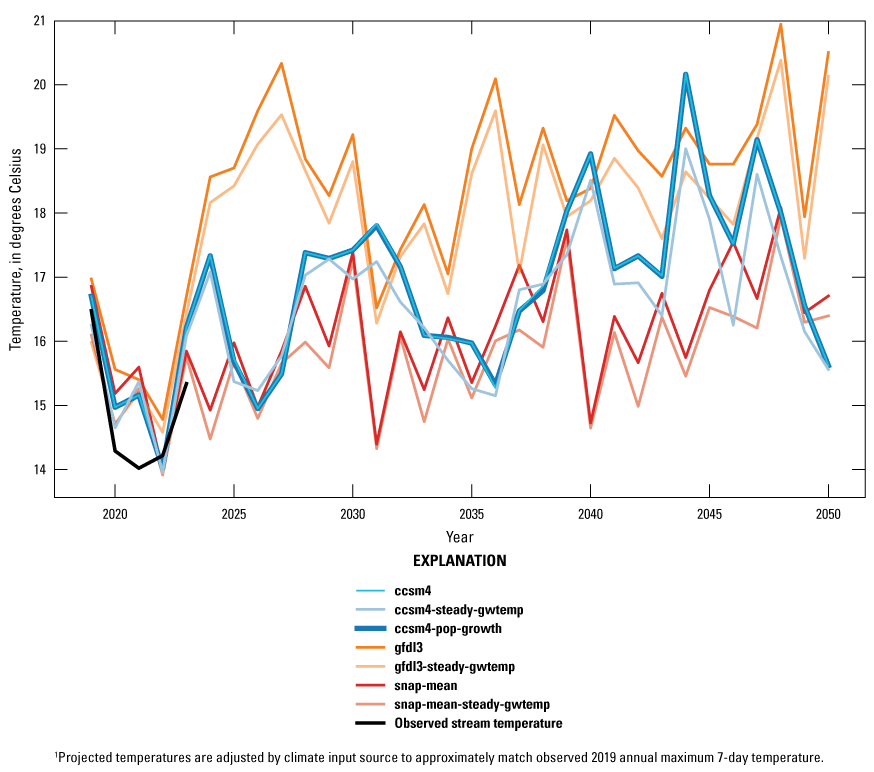
Annual maximum 7-day mean temperatures at site TL–12.
Duration of Temperatures Above Water Quality Standards
Simulated shifts in the distribution of 7-day mean stream temperatures at site TL–12 during the annual simulation period of May through September are shown in figure 22. The 5-year periods of 2019–23 and 2046–50 were combined to produce the temperature duration curves. Overall, the results indicate roughly 34 to 63 additional days (on average each year) with average temperatures above the 13-°C threshold. For the 15-°C threshold, 14 to 81 additional days with average temperatures above the threshold are anticipated. In 2019–23, weekly average temperatures above 15 °C only occurred for 3 weeks in 2019 and 2 weeks in 2023 (Leaf and others, 2024).
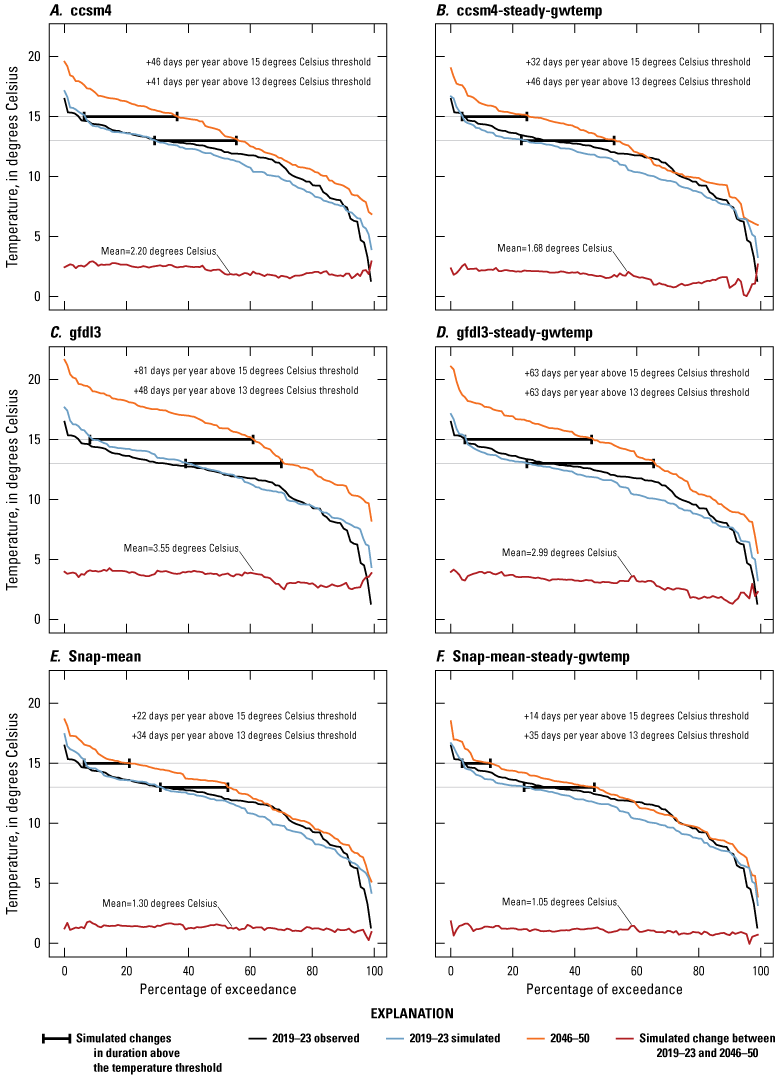
Simulated and observed temperature duration curves at site TL–12, for 2019–23 and 2046–50. A, ccsm4. B, ccsm4-steady-gwtemp. C, gfdl3. D, gfdl3-steady-gwtemp. E, Snap-mean. F, Snap-mean-steady-gwtemp.
Average annual exceedances of the 15-°C migration and rearing standard (fig. 23), the 13-°C egg and fry incubation and spawning standard (fig. 24), and the 20-°C maximum water temperature standard (fig. 25) were calculated as the average number of 7-day periods exceeding the thresholds during the time periods indicated, expressed as a number of days per year. Only the “deep” or “steady” groundwater scenario variants are shown in this report; results for the “shallow” groundwater scenarios are available from Leaf and others (2024). Exceedances generally show an increase from the study period to the late 2040s. Exceedances are greatest for the gfdl3 scenario, followed by the cssm4 and snap-mean scenarios. These exceedances are nonuniform across the basin, with the northern headwaters at tl3 (main stem headwater) showing the highest number of exceedances (between 60 to almost 100 days a year with temperatures greater than 15 °C, with 22–42 additional days per year from the study period to the mid-21st century). Site TL–8 (tributary 6) had the least number of exceedances (less than 20 days per year and only 2–13 additional days per year from the study period to the mid-21st century). Similar to other tributaries in the basin, tributary 6 is dominated by low-gradient wetlands upstream with little to no groundwater input but has cooling groundwater inflows in its lower reaches. This tributary also has higher shade than the upper basin or west fork. The headwaters of the main stem have relatively small groundwater inflows and little shade. Lower reaches have more shade and larger groundwater inflows that moderate temperatures and reduce the number of exceedances moving downstream.
Exceedances of the 20-°C standard are rare in the study period but may occur regularly by the mid-21st century, with the main stem headwaters having 1–20 days per year greater than 20 °C and the lower main stem 0–2 days per year. The tributaries vary from few to no exceedances in the west fork or tributary 6 to as much as 15 additional days per year greater than 20 °C at the east fork downstream from Beaver Lake.
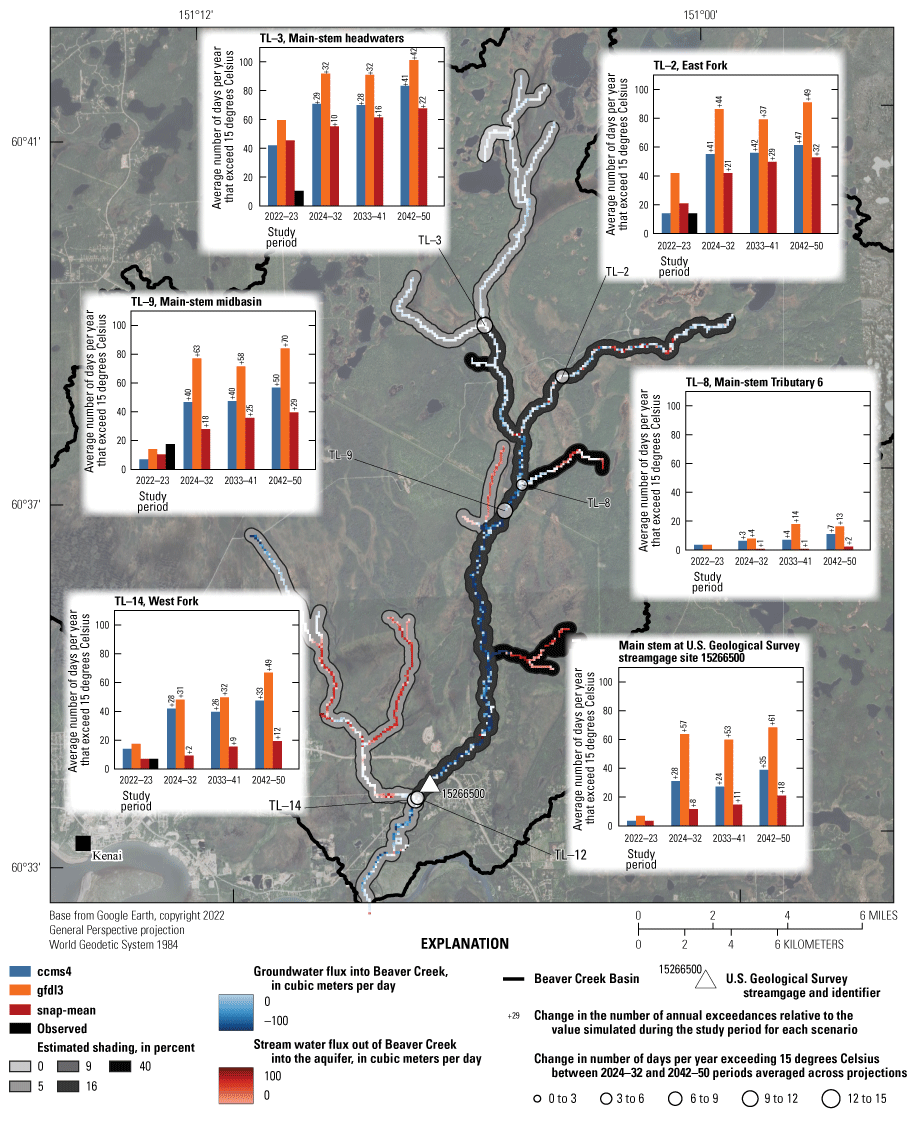
Average observed and projected days per year with weekly mean temperatures exceeding 15 degrees Celsius, for various sites under the “deep” groundwater scenarios.
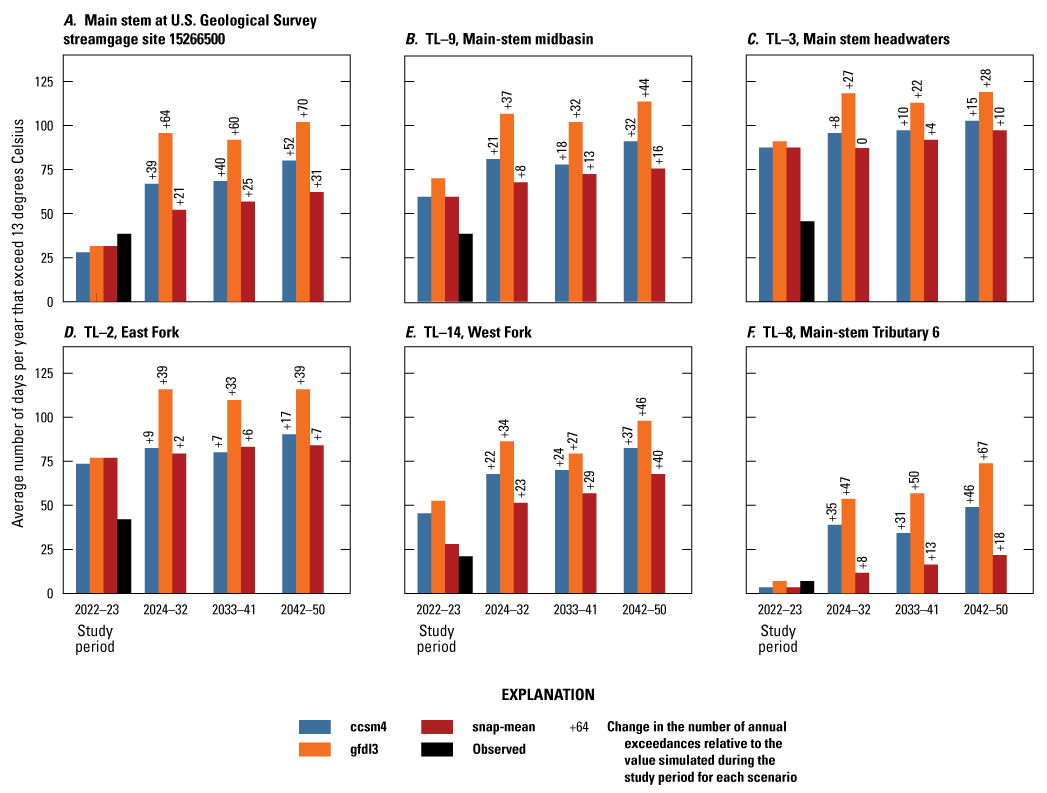
Average observed and projected days per year with weekly mean temperatures exceeding 13 degrees Celsius, for various sites under the “deep” groundwater scenarios. A, Main stem at U.S. Geological Survey streamgage site 15266500. B, TL–9, Main-stem midbasin. C, TL–3, Main stem headwaters. D, TL–2, East Fork. E, TL–14, West Fork. F, TL–8, Main-stem Tributary 6.
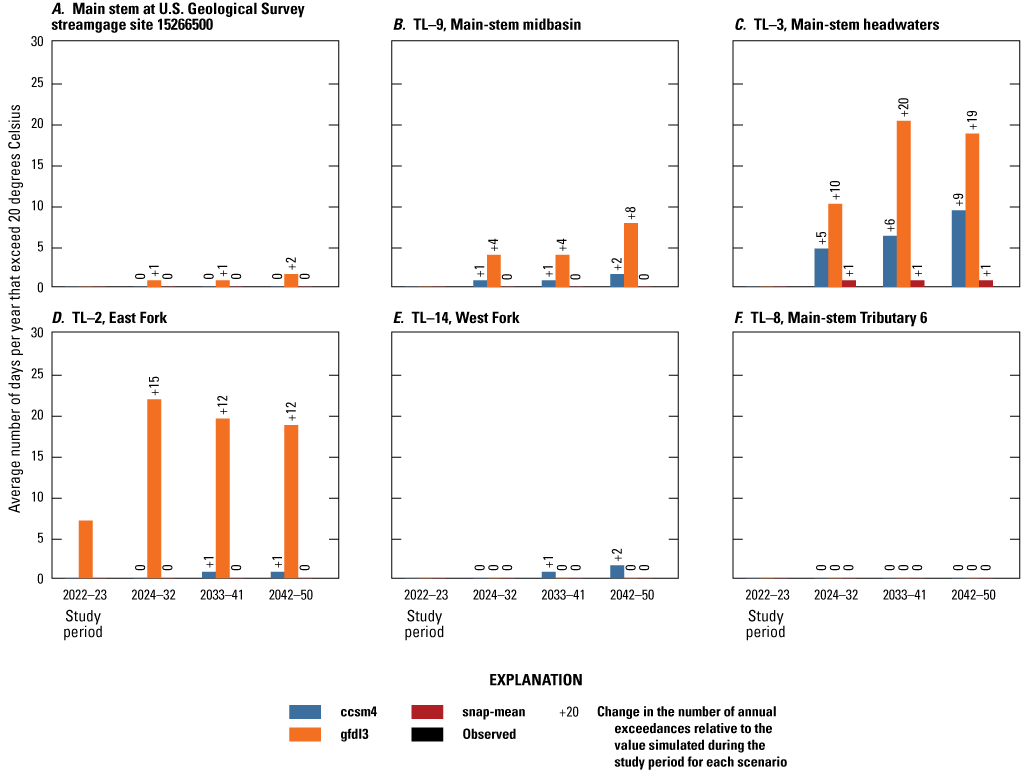
Average observed and projected days per year with weekly mean temperatures exceeding 20 degrees Celsius, for various sites under the “deep” groundwater scenario. A, Main stem at U.S. Geological Survey streamgage site 15266500. B, TL–9, Main-stem midbasin. C, TL–3, Main stem headwaters. D, TL–2, East Fork. E, TL–14, West Fork. F, TL–8, Main-stem Tributary 6.
Spatial Distribution of Temperatures During Heatwaves and Effects of Surface Runoff
The spatial distribution of simulated stream temperatures in relation to the stream hydrology during a hypothetical mid-century heatwave is shown in figure 26. Hot and dry conditions simulated for the week of July 30, 2050, in the gfdl3 “deep” groundwater scenario are shown in figure 26A–C. Most reaches of Beaver Creek and its tributaries are receiving groundwater inflow, which accounts for 100 percent of flow into Beaver Creek. Stream temperatures are generally coolest in the downstream reaches of tributaries 5, 6, and 9 (fig. 12) and in the main stem. Cool temperatures simulated in the headwaters of the West Fork may not be accurate. There are no stream temperature data in this area, and groundwater levels in well 2, which is within about 2 kilometers of the creek, were oversimulated by several meters in the model (fig. 6.4), which likely means that groundwater discharge to the West Fork headwaters is also being oversimulated, resulting in cooler than actual temperatures.
Hot and wet conditions simulated for the following week of August 6, 2050, in the gfdl3 “deep” groundwater scenario are shown in figure 26D–F. Air temperature is similar to the previous week, but surface runoff constitutes 85 percent of flow into the creek. Most of the lower main stem and lower reaches of tributaries 5, 6, and 9 are still receiving groundwater, but the overall volume of surface runoff is sufficient to raise stream temperatures to approximately 20 °C throughout the system. The lower reaches of tributaries 5, 6, and 9 maintain the coolest temperatures while the mainstem is relatively warm compared to the tributaries. These results illustrate the importance of surface runoff as a variable affecting stream temperature, especially in the Kenai region, where late summer rains are typical.

Spatial distributions of stream temperatures during a mid-century heat wave (gfdl3 climate scenario, assuming thermally insensitive groundwater that remains at 4.2 degrees Celsius). A, Example of surface-water and groundwater interactions during dry, base-flow conditions, July 30, 2050. B, Example of surface runoff during dry, base-flow conditions, July 30, 2050. C, Example of stream temperature during dry, base-flow conditions, July 30, 2050. D, Example of surface-water and groundwater interactions during warm rain conditions, August 6, 2050. E, Example of surface runoff during warm rain conditions, August 6, 2050. F, Example of stream temperature during warm rain conditions, August 6, 2050.
Implications for Anadromous Fish and Basin Management
Evaluating the effect of projected stream temperature rises on anadromous fish populations in Beaver Creek was beyond the scope of this study. Other studies in the region have discussed potential effects of warmer stream temperatures on anadromous fish (for example, Leppi and others, 2014; Mauger and others, 2017; Schoen and others, 2017; Smiley, 2019; Shaftel and others, 2020). Effects are largely uncertain because climate change is affecting stream habitats in unprecedented ways. Factors such as the timing of species life cycle events in relation to water temperatures and basin characteristics could produce a mix of harmful and beneficial outcomes. Warmer temperatures could potentially benefit some species, such as coho salmon, that spawn later in the season (ADFG, 2024b). Other species, like Chinook salmon, that spawn in the warmest summer months (ADFG, 2024c) may be particularly affected by the additional warming. Continued research on fish responses to observed heat waves like the one in 2019 may provide insights; additional research on the timing of life cycle events at a basin-scale may help relate effects to particular species.
Options to mitigate the effect of rising air temperatures are limited in undeveloped basins like Beaver Creek where there is little human activity affecting water temperatures. Although not evaluated in this study, an extreme option (if feasible) could be to increase channel shading by planting taller, native woody vegetation. More realistic management options might include consideration of groundwater effects or water temperature effects when evaluating proposed activities within the basin; for example, increased or new pumping could reduce groundwater flow to the channel. Vegetation removal by activities like logging or damage by human activities or animals could reduce channel shading. The data release files (Leaf and others, 2024) could be used to evaluate the potential effect of such scenarios. Pooling of water caused by undersized culverts, blocked culverts, beaver activity, or reduced drainage across a roadbed can exacerbate temperature impacts by allowing water to warm at the land surface before flowing into the stream.
Assumptions and Limitations
The Beaver Creek model, like any model, is a necessary simplification of a complex natural system and is therefore subject to limitations. The limitations stem from the model’s spatial and temporal discretization, simplification of physical processes, and a sparsity of information about the subsurface and the states of the hydrologic system. Most importantly, future projections are inherently limited by deep uncertainties in future human behavior and the nonlinear dynamics of the atmosphere and coupled natural systems.
Uncertainty in the model inputs was addressed formally and reduced through history matching of model outputs to field observations. The spread of model outputs shown in figures 17, 18, 6.4, and 6.5 illustrates the effects of the remaining model input uncertainty. Many other uncertainties were excluded from the formal modeling analysis through simplifying assumptions and other modeling decisions. This section reviews the key assumptions and unknowns that may limit the model's ability to accurately simulate stream temperatures and future changes to the hydrologic system.
Limitations of Soil Water Balance
The SWB simulation partitions precipitation into evapotranspiration, surface runoff, and net infiltration past the root zone. The pattern of precipitation across the basin was assumed to be adequately represented by the weather data collected at the Kenai and Soldotna airports based on the small basin size, flat topography, and lack of appreciable spatial trends in gridded precipitation products. The overall partitioning of precipitation into evapotranspiration and runoff to Beaver Creek was constrained by manual history matching of simulated and observed annual mean total flows at the Beaver Creek streamgage. Partitioning of the runoff component into groundwater recharge and surface runoff was partially constrained during history matching of the groundwater flow and stream temperature model.
Global multiplier estimates of 1.7 for surface runoff and 0.6 for groundwater recharge indicate undersimulation of runoff by the SWB model and oversimulation of recharge, which may be a result of shallow water table depths throughout much of the study area. In the modeling analysis, net infiltration is calculated by SWB without accounting for the water table position; all net infiltration is assumed to enter the groundwater system as recharge. In places where the water table is shallow, this assumption can result in unrealistic recharge and simulated heads that are above the last surface. In reality, groundwater discharge and surface runoff occur when the water table reaches the land surface. Although the global recharge and runoff multipliers compensate for this defect at a coarse scale, future work could potentially improve the spatial and temporal simulation of the recharge and surface runoff components by formally including the SWB model in the formal history matching, and by representing the effects of a shallow water table with the MODFLOW Unsaturated Zone Flow Package (for example, Feinstein and others, 2020).
In this analysis, surface runoff generated by SWB is assumed to reach the stream channel within each 7-day time period; no surface-water storage is considered. This assumption could potentially be problematic if appreciable surface-water storage is actually creating longer recession times for warm rain events. Inspection of streamflow peaks in figure 17 and simulated and observed temperatures (fig. 18 and appendix 6) indicates that the assumption of little to no surface-water storage is reasonable.
Early simulation of the observed spring 2023 freshet may indicate an issue with the simulation of snowmelt in the SWB model. This possible issue could be evaluated further by extending the historical model to simulate the 2024 spring freshet and could be potentially corrected by including the SWB model in the formal parameter estimation. In the context of evaluating warm stream temperatures, early simulation of snowmelt is likely conservative, in that temperatures simulated later in the spring would be warmer than the actual stream temperatures.
Limitations of Groundwater Model
The groundwater model in this study was primarily designed to simulate streamflows and the stream water balance for the stream temperature model. Relatively little is known about the subsurface beneath the Beaver Creek Basin other than that it consists of heterogenous glacial deposits of greater than or equal to 500 ft in thickness, which reflect a complex glacial history (appendix 1). Large ranges in simulated heads across the historical model ensemble reflect uncertainty in the aquifer property inputs. The places or times where the ensemble results are poorly fit to observed heads reflect additional structural error in the model stemming from simplifications including relatively coarse vertical resolution, coarse spacing of pilot point input parameters, coarse grid spacing that may skew simulation of groundwater levels at the study wells close to Beaver Creek, and the previously mentioned unrealistic treatment of places where the water table is shallow. Simulated heads are most constrained near surface-water boundary conditions that are relatively well characterized and exert strong influence on nearby groundwater levels.
Inspection of the streamflow history matching results (fig. 17 and appendix 6) indicates a model tendency to oversimulate low stream flows and undersimulate some high flows. These errors could be the result of limiting assumptions in the surface-water balance as well as the neglection of unsaturated zone processes including delays in groundwater recharge from infiltration time, evapotranspiration of shallow groundwater, and groundwater seepage to the land surface. Good agreement between simulated and observed stream temperatures and limited variability in the ensemble of simulated stream temperatures (fig. 18 and appendix 6) indicate that the effect of these deficiencies on the simulation of stream temperatures is acceptable.
Water use by the City of Kenai was assumed to be constant across years for each month of the year (for example, the same water use was assumed in July of each year). Given the small magnitude of water use, which represents approximately 4 percent of average base flow in Beaver Creek, the effects of this assumption are assumed to be negligible.
Limitations of Stream Temperature Model
The 7-day temporal resolution of the stream temperature model carries several limitations. A key limitation is the inability to simulate individual daily maximum temperatures. Extreme temperatures occurring at subweekly scales cannot be represented. The results here are similar or equivalent to the weekly average temperatures reported by past studies (for example, Kyle and Brabets, 2001; Mauger and others, 2017), but fixed 7-day periods can underrepresent extremes compared to rolling averages if a warm period is split between 2 weeks.
Although the results here cannot be compared directly to the maximum weekly maximum temperatures presented by Mauger and others (2017) and KPFHP (2022b), which average daily maximum temperatures, supplementary information from Mauger and others (2017) and data collected for this study indicate a typical difference between maximum weekly average temperatures and maximum weekly maximum temperatures of about 1.5 °C. Adding 1.5 °C to the maximum 7-day mean temperatures shown in figure 21 can provide an approximation of the maximum weekly maximum temperature metric.
The transient effects of warm runoff from individual summer rainstorms may be overrepresented (that is, the temperature of the rain may in reality be cooler than the average temperature for that week and the residence time of the runoff in the basin may be substantially less than the 7-day model period length). Conversely, the assumption that all surface runoff generated within a 7-day period reaches the stream within that period may underrepresent the effects of surface-water storage across the flat topography of the basin, which may slowly release water to the stream that has been warmed by solar radiation. This phenomenon may explain stream temperatures observed in June and July 2023 that were consistently greater than air temperature (fig. 10).
As explained in appendix 6, the representation of groundwater temperatures is greatly simplified. Similar history matching results with thermally sensitive and insensitive conceptual models indicate a lack of discriminating information in the field data about groundwater thermal sensitivity. Inclusion of the thermally sensitive and thermally insensitive conceptual models in the future scenarios indicates a potential effect of groundwater thermal lag of about 1 °C, which is well within the range of outcomes stemming from uncertainty in the future climate. Colder winter temperatures in the shallow subsurface resulting from a reduced snowpack may counteract this effect, resulting in less warming of groundwater in the near term.
The representation of shading in the model is simplified to four vegetation zones based on a small number of field measurements, which could be highly variable at the scale of an individual site (for example, depending on position relative to individual alder shrubs, and so forth). The model did not account for effects of large undercut banks, which are common throughout the main stem and may provide persistent cool habitat. The model also did not account for heterogeneity in shading, which may explain some of the mismatch between simulated and observed temperatures.
Despite all of these limitations, a mean error of 0.15 °C in stream temperatures simulated by the base member of the ensemble indicates a general lack of bias in the model results. An approximate 4-°C spread in maximum weekly mean temperatures shown in figure 21 indicates greater uncertainty in the future climate, compared to the model uncertainty in simulating historical temperatures (root mean square error of 1.35 °C for the base model). Uncertainty in the future climate is reflected in the wide ranges of projected future temperature increases shown in figures 21–25.
Limitations of the Future Climate Scenarios
The limitations of any future projection based on general circulation models are well understood (for example, Pörtner and others, 2023), with projected temperatures and precipitation varying by model and by scenario. The range of results across the ensemble of climate scenarios presented in this report reflects uncertainty in the nonlinear dynamics of the atmosphere and in future human behavior. Although a wide range of potential outcomes is presented in this report, the actual uncertainty may be wider because only a limited number of downscaled climate projections were available for this area.
Numerous issues were encountered in the available GFDL–CM3 and NCAR–CCSM4 projections. Precipitation from these projections was reduced by 41 and 47 percent, respectively, to match observed precipitation for the historical period. Both projections had smaller, more frequent rain events; a compressed daily temperature amplitude; and some general bias in sun fraction, wind speed, and humidity (appendix 7). The implications of these issues are unclear, but it is perhaps notable that GFDL–CM3 and NCAR–CCSM4 projections (with precipitation reduced as described) and the snap-mean scenario (which repeats historical climate with only the temperatures increased) indicate little change in the overall water balance between the near future and midcentury (fig. 20). A step change in the amount of simulated runoff between the historical period and near future (fig. 20) gives some indication of the effects of the climate projection limitations on the water balance. Differences between historical temperatures simulated by GFDL–CM3 and NCAR–CCSM4 and observed historical temperatures were addressed by applying bias corrections to the results presented in figures 21 and 26. Evaluation of simulated changes instead of absolute quantities (for example, fig. 22) is more robust.
Summary and Conclusions
Beaver Creek provides important habitat for anadromous fish including coho salmon (Oncorhynchus kisutch), Chinook salmon (Oncorhynchus tshawytscha), sockeye salmon (Oncorhynchus nerka), and Dolly Varden (Salvelinus malma), and is representative of lowland groundwater- and wetland-dominated streams that have been identified as a high conservation priority in south-central Alaska. There is local interest in understanding how water temperatures in these types of stream systems will respond to climate change. This study was initiated to improve understanding of the current basin hydrology and stream temperatures, and how those might change between now and midcentury.
The hydrology of the Beaver Creek watershed and instream temperatures were investigated using a linked Soil-Water-Balance code, MODFLOW 6 (groundwater flow), and Stream Network Temperature (SNTEMP) model supported by field data collection. Field data included measurements of continuous streamflow near the Beaver Creek outlet, synoptic streamflow throughout the basin, continuous stream temperature, channel shading, and groundwater levels and temperatures in five wells installed for this study. The field data were used to inform the model inputs and provide targets for history matching using the iterative ensemble smoother algorithm implemented in PEST++. The key study findings include the following:
-
· Groundwater discharge made up an estimated 64 percent of total streamflow in Beaver Creek in the months of May through September during the 2019–23 study period; this study shows a consistent percentage of inflowing groundwater through 2050.
-
· Comparison of recent streamgaging in 2022–24 with the historical record for 1968–78 indicates a similar proportion of base flow, but about 60 percent greater total flow. The model predicts total flow in Beaver Creek to remain consistent or increase slightly between the study period and 2050.
-
· Current groundwater pumping by the City of Kenai is equivalent to about 4 percent of average base flow in Beaver Creek; a 0.44-percent annual increase in groundwater pumping by the City of Kenai from 2023 to 2050 appears to have little to no effect on instream temperatures in Beaver Creek.
-
· At site TL–12 near the Beaver Creek mouth, the model results show maximum weekly mean stream temperatures like those experienced in 2019 becoming more frequent, or even common, by midcentury. During these periods, maximum daily temperatures may routinely exceed 20 degrees Celsius (°C).
-
· At site TL–12 near the Beaver Creek mouth, the model predicts about 34 to 63 additional days per year by midcentury with average temperatures above the 13-°C threshold, and 14 to 81 additional days by midcentury with average temperatures above the 15-°C threshold.
-
· Exceedances of the Alaska Water Quality Standards stream temperature thresholds are experienced unevenly throughout the basin, with greater durations of thermal exceedances in the northern headwaters and east fork and lesser durations in the lower main stem by TL–12, southern tributaries like tributary 6 at TL–8, and the west fork at TL–14.
-
· During summer heat waves, precipitation conditions may affect which parts of the basin remain cool. During dry periods, stream inflow is dominated by cooler groundwater and relatively cooler conditions are present throughout the main stem and portions of the east and west forks. During warm rain events, stream temperatures rise from runoff that warms the main stem and reduces cooler areas to portions of groundwater-dominated tributaries.
-
· Current field data are insufficient to robustly characterize groundwater thermal sensitivity. Inclusion of thermally sensitive and thermally insensitive conceptual models in the future scenarios indicates a potential effect of groundwater thermal lag of about 1 °C, which is well within the range of outcomes stemming from uncertainty in the future climate. Colder winter temperatures in the shallow subsurface resulting from a reduced snowpack may counteract this effect, resulting in less warming of groundwater in the near term.
References Cited
Alaska Department of Environmental Conservation, 2024, 18 AAC 70 Water Quality Standards, Amended as of April 26, 2024: Alaska Department of Environmental Conservation, 73 p., accessed June 24, 2024, at https://dec.alaska.gov/media/eovgrgs5/18-aac-70.pdf.
Alaska Department of Fish and Game (ADFG), 2020, Kenai, Soldotna, & Homer run timing: Alaska Department of Fish and Game, 2 p., accessed July 22, 2024, at https://www.adfg.alaska.gov/static-sf/Region2/pdfpubs/kenrun.pdf.
Alaska Department of Fish and Game (ADFG), 2022, The Kenai River: Southcentral Region, Alaska Department of Fish and Game, Division of Sport Fishing, 8 p., accessed August 3, 2022, at https://www.adfg.alaska.gov/static-sf/Region2/pdfpubs/kenairiver.pdf.
Alaska Department of Fish and Game (ADFG), 2024a, Anadromous waters catalog: Alaska Department of Fish and Game, accessed July 3, 2024, at https://www.adfg.alaska.gov/sf/sarr/awc/.
Alaska Department of Fish and Game (ADFG), 2024b, Coho salmon species profile: Alaska Department of Fish and Game, accessed July 2024 at https://www.adfg.alaska.gov/index.cfm?adfg=cohosalmon.main.
Alaska Department of Fish and Game (ADFG), 2024c, Chinook salmon species profile: Alaska Department of Fish and Game, accessed July 2024 at https://www.adfg.alaska.gov/index.cfm?adfg=chinook.main.
Alaska Department of Fish and Game (ADFG), 2024d, Sockeye salmon species profile: Alaska Department of Fish and Game, accessed July 2024 at https://www.adfg.alaska.gov/index.cfm?adfg=sockeyesalmon.main.
Alaska Department of Fish and Game (ADFG), 2024e, Dolly Varden species profile: Alaska Department of Fish and Game, accessed July 2014 at https://www.adfg.alaska.gov/index.cfm?adfg=sockeyesalmon.main.
Alaska Department of Natural Resources (AKDNR), 2022, Well Log Tracking System (WELTS) database: Alaska Department of Fish and Game, MapServer of borehole lithology data, accessed September 28, 2022, at https://arcgis.dnr.alaska.gov/arcgis/rest/services/MLW/WELTSwithBoreholeData/MapServer.
Alaska Department of Natural Resources (AKDNR), 2023, Alaska Water Use Data System (AKWUDs): Alaska Department of Fish and Game database, accessed February 23, 2023, at https://dnr.alaska.gov/akwuds/.
Alaska LNG, 2017, City of Kenai water system feasibility study: Alaska LNG, AKLNG-4030-OOO-RTA-DOC-0000, accessed July 7, 2021, at http://alaska-lng.com/wp-content/uploads/2018/07/2018-05-18_City-of-Kenai-Water-System-Feasibility-Study.pdf.
Anderson, D.J., 2023, Monitoring streamflow response to effects of climate change in the Kenai Peninsula and Prince William Sound region of Southcentral Alaska: Masters of Science Thesis at Oregon State University, accessed April 11, 2024, at https://ir.library.oregonstate.edu/concern/graduate_thesis_or_dissertations/x059ch00p.
Anderson, G.S., 1971, Ground-water exploration, Beaver Creek valley near Kenai, Alaska: U.S. Geological Survey Open-File Report 71–6, 27 p., accessed October 13, 2022, at https://doi.org/10.3133/ofr716.
Anderson, G.S., and Jones, S.H., 1971, Lake-level fluctuations in the Kenai-Soldotna area, Alaska, 1967–71: U.S. Geological Survey Open-File Report 71–77, accessed October 17, 2024, at https://doi.org/10.3133/ofr717.
Anderson, G.S., and Jones, S.H., 1972, Water resources of the Kenai-Soldotna area, Alaska: U.S. Geological Survey Open-File Report 72–7, 81 p., 2 plates, accessed October 17, 2024, at https://doi.org/10.3133/ofr727.
Armstrong, J.B., Schindler, D.E., Ruff, C.P., Brooks, G.T., Bentley, K.E., and Torgersen, C.E., 2013, Diel horizontal migration in streams—Juvenile fish exploit spatial heterogeneity in thermal and trophic resources: Ecology, v. 94, no. 9, p. 2066–2075. [Also available at https://doi.org/10.1890/12-1200.1.]
Armstrong, J.B., Fullerton, A.H., Jordan, C.E., Ebersole, J.L., Bellmore, J.R., Arismendi, I., Penaluna, B.E., and Reeves, G.H., 2021, The importance of warm habitat to the growth regime of cold-water fishes: Nature Climate Change, v. 11, no. 4, p. 354–361. [Also available at https://doi.org/10.1038/s41558-021-00994-y.]
Bailey, B.J., and Hogan, E.V., 1995, Overview of environmental and hydrogeologic conditions near Kenai, Alaska, U.S. Geological Survey Open-File Report 95–410, 141 p., accessed October 17, 2024, at https://doi.org/10.3133/ofr95410.
Bartholow, J.M., 1989, Stream temperature investigations—Field and analytic methods: Instream Flow Information Paper No. 13, U.S. Department of the Interior Fish and Wildlife Service Biological Report 89(17), 139 p., accessed May 8, 2023, at http://www.krisweb.com/biblio/gen_usfws_bartholow_1989_br8917.pdf.
Bartholow, J.M., 2010, SNTEMP—Stream network temperature model microcomputer implementation (version 3): U.S. Geological Survey model software, accessed May 3, 2023, at https://doi.org/10.3133/96233.
Barrett, H.S., and Armstrong, J.B., 2022, Move, migrate, or tolerate—Quantifying three tactics for cold-water fish coping with warm summers in a large river: Ecosphere, v. 13, no. 6, p. e4095. [Also available at https://doi.org/10.1002/ecs2.4095.]
Bieniek, P.A., Bhatt, U.S., Walsh, J.E., Rupp, T.S., Zhang, J., Krieger, J.R., and Lader, R., 2016, Dynamical downscaling of ERA-Interim temperature and precipitation for Alaska: Journal of Applied Meteorology and Climatology, v. 55, no. 3, p. 635–654, accessed October 17, 2024 at https://doi.org/10.1175/JAMC-D-15-0153.1.
Briggs, M.A., Johnson, Z.C., Snyder, C.D., Hitt, N.P., Kurylyk, B.L., Lautz, L., Irvine, D.J., Hurley, S.T., and Lane, J.W., 2018, Inferring watershed hydraulics and cold-water habitat persistence using multi-year air and stream temperature signals: Science of the Total Environment, v. 636, p. 1117–1127. [Also available at https://doi.org/10.1016/j.scitotenv.2018.04.344.]
Corson-Dosch, N.T., Fienen, M.N., Finkelstein, J.S., Leaf, A.T., White, J.T., Woda, J., and Williams, J.H., 2022, Areas contributing recharge to priority wells in valley-fill aquifers in the Neversink River and Rondout Creek drainage basins, New York: U.S. Geological Survey Scientific Investigations Report 2021–5112, 50 p., accessed October 17, 2024 at https://doi.org/10.3133/sir20215112.
Dial, R.J., Berg, E.E., Timm, K., McMahon, A., and Geck, J., 2007, Changes in the alpine forest-tundra ecotone commensurate with recent warming in southcentral Alaska—Evidence from orthophotos and field plots: Journal of Geophysical Research, v. 112, no. G4, 15 p. [Also available at https://doi.org/10.1029/2007JG000453.]
DOWL, 2015, Nikiski groundwater study: Prepared for the Kenai Peninsula Borough, 264 p., accessed October 3, 2022, at https://www.kpb.us/images/KPB/PUR/Projects/Nikiski/1_Nikiski_Report_REVISED_FINAL_04-28-2015.pdf.
Fehling, A.C., and Hart, D.J., 2021, Potential effects of climate change on stream temperature in the Marengo River headwaters: U.S. Geological and Natural History Survey Division of Extension University pf Wisconsin, Madison Bulletin 115, accessed May 8, 2023 at https://wgnhs.wisc.edu/catalog/publication/000976.
Feinstein, D.T., Hart, D.J., Gatzke, S., Hunt, R.J., Niswonger, R.G., and Fienen, M.N., 2020, A simple method for simulating groundwater interactions with fens to forecast development effects: Ground Water, v. 58, no. 4, p. 524–534. [Also available at https://doi.org/10.1111/gwat.12931.]
Feinstein, D.T., Hunt, R.J., and Morway, E.D., 2022, Simulation of heat flow in a synthetic watershed—Lags and dampening across multiple pathways under a climate-forcing scenario: Water (Basel), 14, 2810. [Also available at https://doi.org/10.3390/w14182810.]
Fitzpatrick, F.A., Waite, I.R., D’Arconte, P.J., Meador, M.R., Maupin, M.A., and Gurtz, M.E., 1998, Revised methods for characterizing stream habitat in the National Water-Quality Assessment Program: U.S. Geological Survey Water Resources Investigations Report 98–4052, 67 p., accessed October 17, 2024 at https://doi.org/10.3133/wri984052.
Freethey, G.W., and Scully, D.R., 1980, Water resources of the Cook Inlet Basin, Alaska: U.S. Geological Survey Hydrologic Investigations Atlas HA–260, 4 sheets, accessed October 17, 2024 at https://doi.org/10.3133/ha620.
Garner, G., Malcolm, I.A., Sadler, J.P., and Hannah, D.M., 2017, The role of riparian vegetation density, channel orientation and water velocity in determining river temperature dynamics: Journal of Hydrology, v. 553, p. 471–485, accessed October 17, 2024 at https://doi.org/10.1016/j.jhydrol.2017.03.024.
Geodiode, 2022, The Koppen-Geiger climate classification—A summary guide: Geodiode, accessed August 1, 2022, at https://geodiode.com/climate/koppen-classification.
Glass, R.L., 1996, Ground-water conditions and quality in the western part of the Kenai Peninsula, southcentral Alaska: U.S. Geological Survey Open-File Report 96–466, 66 p., accessed October 17, 2024 at https://doi.org/10.3133/ofr96466.
Glass, R.L., 2002, Ground-water age and its water-management implications, Cook Inlet Basin, Alaska: U.S. Geological Survey Fact Sheet 022–02, 4 p., accessed October 17, 2024 at https://doi.org/10.3133/fs02202.
Hare, D.K., Benz, S.A., Kurylyk, B.L., Johnson, Z.C., Terry, N.C., and Helton, A.M., 2023, Paired air and stream temperature analysis (PASTA) to evaluate groundwater influence on streams: Water Resources Research, v. 59, no. 4, 11 p. [Also available at https://doi.org/10.1029/2022WR033912.]
Hayward, G.H., Colt, S., McTeague, M.L., and Hollingsworth, T.N., eds., 2017, Climate change vulnerability assessment for the Chugach National Forest and the Kenai Peninsula: U.S. Department of Agriculture, Forest Service, Pacific Northwest Research Station, Gen. Tech. Rep. PNW-GTR-950, 340 p., accessed August 1, 2022, at https://www.fs.fed.us/pnw/pubs/pnw_gtr950.pdf.
Homer Soil & Water Conservation District, 2006, Section 1—Idealized landscape level draft diagrams western Kenai Peninsula Lowlands: Homer Soil & Water Conservation District, accessed October 3, 2022 at https://www.restorsci.com/images/section1-final.pdf.
Hunt, R.J., Prudic, D.E., Walker, J.F., and Anderson, M.P., 2008, Importance of unsaturated zone flow for simulating recharge in a humid climate: Ground Water, v. 46, no. 4, p. 551–560. [Also available at https://doi.org/10.1111/j.1745-6584.2007.00427.x.]
Intergovernmental Panel on Climate Change, 2014, Climate change 2014—Synthesis report: Contribution of Working Groups I, II and III to the Fifth Assessment Report of the Intergovernmental Panel on Climate Change [Core Writing Team, R.K. Pachauri and L.A. Meyer (eds.)]: Geneva, Switzerland, Intergovernmental Panel on Climate Change, 151 p.
Karlstrom, T.N.V., 1964, Quaternary geology of the Kenai Lowland and glacial history of the Cook Inlet region, Alaska: U.S. Geological Survey Professional Paper 443, 69 p. [Also available at https://doi.org/10.3133/pp443.]
Kenai Peninsula Fish Habitat Partnership (KPFHP), 2014, Kenai Peninsula Fish Habitat Partnership strategic plan: accessed August 3, 2023, at https://www.kenaifishpartnership.org/wp-content/uploads/2014/03/Strategic_plan.pdf.
Kenai Peninsula Fish Habitat Partnership (KPFHP), 2022a, Kenai Peninsula Fish Habitat Partnership 2022 freshwater conservation plan—A plan to protect fish and fish habitat in the rivers, lakes, and streams of the Kenai Peninsula: accessed August 3, 2023, at https://www.kenaifishpartnership.org/wp-content/uploads/2022/08/Kenai-Peninsula-Fish-Habitat-Partnership-Freshwater-Conservation-Plan-August-2022.pdf.
Kenai Peninsula Fish Habitat Partnership (KPFHP), 2022b, Climate change and the future of freshwater fish habitat on the Kenai Peninsula: Supplemental document accompanying the Kenai Peninsula Fish Habitat Partnership 2022 freshwater conservation plan, accessed August 3, 2023, at https://www.kenaifishpartnership.org/wp-content/uploads/2022/08/Supplement-Climate-Change-and-the-Future-of-Fish-and-Fish-Habitat-on-the-Kenai-Peninsu la-August-2022.pdf.
Klein, E., Berg, E.E., and Dial, R., 2005, Wetland drying and succession across the Kenai Peninsula Lowlands, south-central Alaska: Canadian Journal of Forest Research, v. 35, no. 8, p. 1931–1941. [Also available at https://doi.org/10.1139/x05-129.]
Koch, J.C., Meyer, B., Haserodt, M., and Leaf, A., 2024, Surface water and groundwater hydrology and temperature, Beaver Creek, Kenai Peninsula, Alaska, 2022–2023: U.S. Geological Survey data release, accessed December 19, 2024, at https://doi.org/10.5066/P14UAWGB.
Kottek, M., Grieser, J., Beck, C., Rudolf, B., and Rubel, F., 2006, World map of the Köppen-Geiger climate classification updated: Meteorologische Zeitschrift (Berlin), v. 15, no. 3, p. 259–263. [Also available at https://doi.org/10.1127/0941-2948/2006/0130.]
Kurylyk, B.L., MacQuarrie, K.T.B., Caissie, D., and McKenzie, J.M., 2015, Shallow groundwater thermal sensitivity to climate change and land cover disturbances—Derivation of analytical expressions and implications for stream temperature modeling: Hydrology and Earth System Sciences, v. 19, no. 5, p. 2469–2489, accessed October 17, 2024 at https://doi.org/10.5194/hess-19-2469-2015.
Kyle, R.E., and Brabets, T.B., 2001, Water temperature of streams in the Cook Inlet basin, Alaska, and implications of climate change: U.S. Geological Survey Water-Resources Investigation Report 01–4109, 24 p. [Also available at https://doi.org/10.3133/wri014109.]
Langevin, C.D., Hughes, J.D., Banta, E.R., Niswonger, R.G., Panday, S., and Provost, A.M., 2017, Documentation for the MODFLOW 6 groundwater flow model: U.S. Geological Survey Techniques and Methods, book 6, chap. A55, 197 p., accessed March 24, 2022, at https://doi.org/10.3133/tm6A55.
Langevin, C.D., Hughes, J.D., Provost, A.M., Russcher, M.J., Niswonger, R.G., Panday, S., Merrick, D., Morway, E.D., Reno, M.J., Bonelli, W.P., and Banta, E.R., 2023, MODFLOW 6 Modular Hydrologic Model version 6.4.2: U.S. Geological Survey Software Release, accessed June 28, 2023, at https://doi.org/10.5066/P9FL1JCC.
Leaf, A.T., Duncan, L.L., Haugh, C.J., Hunt, R.J., and Rigby, J.R., 2023, Simulating groundwater flow in the Mississippi Alluvial Plain with a focus on the Mississippi Delta: U.S. Geological Survey Scientific Investigations Report 2023–5100, 143 p., accessed October 17, 2024 at https://doi.org/10.3133/sir20235100.
Leaf, A.T., Haserodt, M.J., and Westenbroek, S.M., 2024, Soil water balance, groundwater flow, and stream temperature models for Beaver Creek, Alaska, 2019 to 2050: U.S. Geological Survey data release, accessed December 31, 2024, at http://doi.org/10.5066/P9K30VAP.
Leppi, J.C., Rinella, D.J., Wilson, R.R., and Loya, W.M., 2014, Linking climate change projections for an Alaskan watershed to future coho salmon production: Global Change Biology, v. 20, no. 6, p. 1808–1820, accessed October 17, 2024, at https://doi.org/10.1111/gcb.12492.
Mauger, S., 2013, Stream temperature monitoring network for Cook Inlet salmon streams 2008–2012: Cook Inletkeeper report, accessed July 22, 2024, at https://inletkeeper.org/wp-content/uploads/2024/04/Cook-Inlet-Stream-Temp-Network-Synthesis-Report.pdf.
Mauger, S., Shaftel, R., Trammell, J., Geist, M., and Bogan, D., 2015, Stream temperature data collection standards for Alaska—Minimum standards to generate data useful for regional-scale analyses: Journal of Hydrology, v. 4, part B, p. 431–438, accessed October 17, 2024, at https://doi.org/10.1016/j.ejrh.2015.07.008.
Mauger, S., Shaftel, R., Leppi, J.C., and Rinella, D.J., 2017, Summer temperature regimes in southcentral Alaska streams—Watershed drivers of variation and potential implications for Pacific salmon: Canadian Journal of Fisheries and Aquatic Sciences, v. 74, no. 5, p. 702–715. [Also available at https://doi.org/10.1139/cjfas-2016-0076.]
Meyer, B., Wipfli, M.S., Schoen, E.R., Rinella, D.J., and Falke, J.A., 2023, Landscape characteristics influence projected growth rates of stream-resident juvenile salmon in the face of climate change in the Kenai River watershed, south-central Alaska: Transactions of the American Fisheries Society, v. 152, no. 2, p. 169–186. [Also available at https://doi.org/10.1002/tafs.10397.]
Moore, R.B., McKay, L.D., Rea, A.H., Bondelid, T.R., Price, C.V., Dewald, T.G., and Johnston, C.M., 2019, User’s guide for the national hydrography dataset plus (NHDPlus) high resolution: U.S. Geological Survey Open-File Report 2019–1096, 66 p., accessed October 17, 2024, at https://doi.org/10.3133/ofr20191096.
Morton, J.M., Magness, D.R., McCarty, M., Wigglesworth, D., Ruffner, R., Bernard, M., Walker, N., Fuller, H., Mauger, S., Bornemann, B., Fuller, L., Smith, M., and Borass, A., 2015, Kenai mountains to sea—A land conservation strategy to sustain our way of life on the Kenai Peninsula: Kachemak Heritage Land Trust, 82 p., accessed September 27, 2022, at https://kenaiwatershed.org/wp-content/uploads/2019/03/Kenai-Mountains-to-Sea-Strategic-Plan_5nov2016_compressed.pdf.
Moss, R.H., Edmonds, J.A., Hibbard, K.A., Manning, M.R., Rose, S.K., van Vuuren, D.P., Carter, T.R., Emori, S., Kainuma, M., Kram, T., Meehl, G.A., Mitchell, J.F.B., Nakicenovic, N., Riahi, K., Smith, S.J., Stouffer, R.J., Thomson, A.M., Weyant, J.P., and Wilbanks, T.J., 2010, The next generation of scenarios for climate change research and assessment: Nature, v. 463, no. 7282, p. 747–756, accessed October 17, 2024, at https://doi.org/10.1038/nature08823.
National Oceanic and Atmospheric Administration (NOAA), 2023a, Daily summaries station details for Kenai Airport, AK station GHCND:USW00026523: National Oceanic and Atmospheric Administration, accessed October 10, 2023, at https://www.ncdc.noaa.gov/cdo-web/datasets/GHCND/stations/GHCND:USW00026523/detail.
National Oceanic and Atmospheric Administration (NOAA), 2023b, Daily summaries station details for Soldotna 5 SSW, AK station GHCND: USC00508615: National Oceanic and Atmospheric Administration, accessed November 8, 2023, at https://www.ncdc.noaa.gov/cdo-web/datasets/GHCND/stations/GHCND:USC00508615/detail.
National Oceanic and Atmospheric Administration (NOAA), 2023c, Daily summaries station details for STERLING 6 SW, AK station GHCND:USC00508731: National Oceanic and Atmospheric Administration, accessed November 8, 2023, at https://www.ncdc.noaa.gov/cdo-web/datasets/GHCND/stations/GHCND:USC00508731/detail.
Nelson, G.L., 1981, Hydrology and the effects of industrial pumping in the Nikiski area, Alaska: U.S. Geological Survey Open-File Report 81–685, 22 p., accessed October 3, 2022, at https://doi.org/10.3133/ofr81685.
Oxford English Dictionary, 2023, s.v. “calibrate (v.), sense 2”: Oxford English Dictionary [Online dictionary], accessed September 2023 at https://doi.org/10.1093/OED/1188054103.
Pörtner, H.-O., Roberts, D.C., Poloczanska, E.S., Mintenbeck, K., Tignor, M., Alegría, A., Craig, M., Langsdorf, S., Löschke, S., Möller, V., and Okem, A., eds., 2023, Summary for policymakers, in Pörtner, H.-O., Roberts, D.C., Tignor, M., Poloczanska, E.S., Mintenbeck, K., Alegría, A., Craig, M., Langsdorf, S., Löschke, S., Möller, V., Okem, A., and Rama, B., eds., Climate change 2022—Impacts, adaptation, and vulnerability [Contribution of Working Group II to the Sixth Assessment Report of the Intergovernmental Panel on Climate Change]: Cambridge, United Kingdom, and New York, United States, Cambridge University Press, p. 3–33, accessed October 17, 2024, at https://doi.org/10.1017/9781009325844.001.
Reger, R.D., Sturmann, A.G., Berg, E.E., and Burns, P.A.C., 2007, A guide to the late Quaternary history of the northern and western Kenai Peninsula, Alaska: State of Alaska Department of Natural Resources Division of Geological & Geophysical Surveys, Guidebook 8, accessed October 13, 2022, at https://dggs.alaska.gov/pubs/id/15941.
R&M Consultants, Inc., 2007, Geotechnical investigation and site conditions report Kenai River bluff erosion: Prepared for U.S. Army Engineer District, Alaska, accessed October 3, 2022, at https://www.poa.usace.army.mil/Portals/34/docs/civilworks/publicreview/AppendixD1aRM2007FinalGeotechReport.pdf?ver=2017-06-19-144122-650.
Roon, D.A., Wipfli, M.S., and Kruse, J.J., 2018, Riparian defoliation by the invasive green alder sawfly influences terrestrial prey subsidies to salmon streams: Ecology of Freshwater Fish, v. 27, no. 4, p. 963–975, accessed October 17, 2024, at https://doi.org/10.1111/eff.12407.
Rovey, C.W., II, and Cherkauer, D.S., 1995, Scale dependency of hydraulic conductivity measurements: Ground Water, v. 33, no. 5, p. 769–780, accessed October 17, 2024, at https://doi.org/10.1111/j.1745-6584.1995.tb00023.x.
Scenarios Network for Alaska + Arctic Planning (SNAP), 2022, About SNAP data: accessed September 30, 2022, at https://registry.opendata.aws/wrf-alaska-snap/.
Schoen, E.R., Wipfli, M.S., Trammell, E.J., Rinella, D.J., Floyd, A.L., Grunblatt, J., McCarthy, M.D., Meyer, B.E., Morton, J.E., Powell, J.E., Prakash, A., Reimer, M.N., Stuefer, S.L., Toniolo, B.M., and Witmer, F.D.W., 2017, Future of Pacific salmon in the face of environmental change—Lessons from one of the world’s remaining productive salmon regions: Fisheries, v. 42, no. 10, p. 538–53, accessed October 17, 2024, at https://doi.org/10.1080/03632415.2017.1374251.
Sedell, J.R., Reeves, G.H., Hauer, F.R., Stanford, J.A., and Hawkins, C.P., 1990, Role of refugia in recovery from disturbances—Modern fragmented and disconnected river systems: Environmental Management, v. 14, no. 5, p. 711–724. [Also available at https://doi.org/10.1007/BF02394720.]
Shaftel, R., Mauger, S., Falke, J., Rinella, D., Davis, J., and Jones, L., 2020, Thermal diversity of salmon streams in the Matanuska-Susitna Basin, Alaska: Journal of the American Water Resources Association, v. 56, no. 4, p. 630–646. [Also available at https://doi.org/10.1111/1752-1688.12839.]
Sjöberg, Y., Jan, A., Painter, S.L., Coon, E.T., Carey, M.P., O'Donnell, J.A., and Koch, J.C., 2021, Permafrost promotes shallow groundwater flow and warmer headwater streams: Water Resources Research, v. 57, no. 2, e2020WR02746. [Also available at https://doi.org/10.1029/2020WR027463.]
Smiley, S., 2019, In hot water—How warmer years might affect salmon populations: KDLG 670AM radio interview, accessed July 15, 2024, at https://www.kdlg.org/environment/2019-07-23/in-hot-water-how-warmer-years-might-affect-salmon-populations.
Stallman, R.W., 1965, Steady one-dimensional fluid flow in a semi-infinite porous medium with sinusoidal surface temperature: Journal of Geophysical Research, v. 70, no. 12, p. 2821–2827, accessed October 17, 2024, at https://doi.org/10.1029/JZ070i012p02821.
Suzuki, S., 1960, Percolation measurements based on heat flow through soil with special reference to paddy fields: Journal of Geophysical Research, v. 65, no. 9, p. 2883–2885, accessed October 17, 2024, at https://doi.org/10.1029/JZ065i009p02883.
Theurer, F.D., Voos, K.A., and Miller, W.J., 1984, Instream water temperature model instream flow information paper 16: U.S. Fish and Wildlife Service FWS/OBS-85/15, accessed June 24, 2024, at https://hdl.handle.net/2027/mdp.39015086455733.
University of Alaska Fairbanks, 2022, Alaska’s changing wildfire environment, accessed August 1, 2022, at https://uaf-iarc.org/alaskas-changing-wildfire-environment/.
U.S. Fish and Wildlife Service, 2020, National wetlands inventory geospatial data, accessed August 3, 2022, at https://www.fws.gov/program/national-wetlands-inventory/wetlands-mapper.
U.S. Geological Survey, 1996, National water summary on wetland resources: U.S. Geological Survey Water Supply Paper 2425, 431 p. [Also available at https://doi.org/10.3133/wsp2425.]
U.S. Geological Survey (USGS), 2010, ned19_n60x75_w151x25_ak_kenainorth_2008, ned19_n60x75_w150x75_ak_kenainorth_2008, ned19_n60x75_w151x50_ak_kenainorth_2008, and ned19_n60x75_w151x00_ak_kenainorth_2008 1/9 arc-second 2010 15 x 15 minute IMG: U.S. Geological Survey, The National Map, accessed August 2, 2022, at https://apps.nationalmap.gov/viewer/.
U.S. Geological Survey (USGS), 2022, USGS National Hydrography Dataset Best Resolution (NHD) for Hydrological Unit (HU) 8 - 19020302 database, accessed October 17, 2024, at https://doi.org/10.5066/F7P55KJN.
U.S. Geological Survey (USGS), 2023, USGS water data for the Nation: U.S. Geological Survey National Water Information System database, accessed April 12, 2024, at https://www.usgs.gov/national-hydrography/access-national-hydrography-products.
von Biela, V.R., Bowen, L., McCormick, S.D., Carey, M.P., Donnelly, D.S., Waters, S., Regish, A.M., Laske, S.M., Brown, R.J., Larson, S., Zuray, S., and Zimmerman, C.E., 2020, Evidence of prevalent heat stress in Yukon River Chinook salmon: Canadian Journal of Fisheries and Aquatic Sciences, v. 77, no. 12, p. 1878–1892, accessed October 17, 2024, at https://doi.org/10.1139/cjfas-2020-0209.
Walsh, J.E., Bhatt, U.S., Littell, J.S., Leonawicz, M., Lindgren, M., Kurkowski, T.A., Bieniek, P.A., Thoman, R., Gray, S., and Rupp, S.T., 2018, Downscaling of climate model output for Alaskan stakeholders: Environmental Modelling & Software, v. 110, p. 38–51, accessed October 17, 2024, at https://doi.org/10.1016/j.envsoft.2018.03.021.
Westenbroek, S.M., Engott, J.A., Kelson, V.A., and Hunt, R.J., 2018, SWB version 2.0—A soil-water-balance code for estimating net infiltration and other water-budget components: U.S. Geological Survey Techniques and Methods, book 6, chap. A59, 118 p., accessed January 1, 2019, at https://doi.org/10.3133/tm6A59.
White, J.T., 2018, A model-independent iterative ensemble smoother for efficient history- matching and uncertainty quantification in very high dimensions: Environmental Modelling & Software, v. 109, p. 191–201, accessed October 17, 2024, at https://doi.org/10.1016/j.envsoft.2018.06.009.]
White, J.T., Hunt, R.J., and Fienen, M.N., and Doherty, J.E., 2020, Approaches to highly parameterized inversion: PEST++ Version 5, a software suite for parameter estimation, uncertainty analysis, management optimization and sensitivity analysis: U.S. Geological Survey Techniques and Methods, book 7, chap. C26, 52 p., accessed October 17, 2024, at https://doi.org/10.3133/tm7C26.
Wilson, F.H., and Hults, C.P., 2012, Geology of the Prince William Sound and Kenai Peninsula Region, Alaska: U.S. Geological Survey Scientific Investigations Map 3110, 38 p., 1 plate, accessed October 17, 2024, at https://doi.org/10.3133/sim3110.
Zhang, T., 2005, Influence of the seasonal snow cover on the ground thermal regime—An overview: Reviews of Geophysics, v. 43, no. 4, RG4002, accessed October 17, 2024, at https://doi.org/10.1029/2004RG000157.
Appendix 1. Glacial Geologic History of the Beaver Creek Basin and Interpretation into Model Layers
-
· An upper unconfined aquifer unit of coarse sand and gravel deposits with a reported regional thickness ranging from 20 to 100 ft in Anderson and Jones (1972). For the model, this unit includes the sand and gravel Killey stade moraine and the Killey stade braidplain outwash units to the west, an undated glaciolacustrine unit modified from Wilson and Hults (2012) that has mixed coarse and fine material in area well logs, and the modern mixed coarse and fine-grained Beaver Creek alluvial deposits. Underlying Killey stade outwash and glaciolacustrine deposits in the Beaver Creek valley are also included.
-
· A unit representing the undifferentiated Knik and Eklutna glacial deposits to the east. This unit is assumed to extend from land surface to the base of the model and to be above the lower confining unit that extends to bedrock.
-
· A thick (as much as 100 ft in Anderson and Jones, 1972) silt and clay leaky upper confining unit that has a sharp top contact and a gradual gradation into fine sand at the lower contact. This unit was interpreted as fine deposits from Glacial Lake Cook of Karlstrom (1964) during the Moosehorn stade of the Naptowne glaciation and, therefore, assumed to only underly the parts of the upper unconfined aquifer that are mapped as younger, post-Moosehorn stade deposits. This unit was assumed to terminate east at the contact with the older undifferentiated glacial deposits from the Knik and Eklutna glaciations. Area well logs show fine grained materials consistent with this aquitard under the glaciolacustrine deposits mapped by Wilson and Hults (2012).
-
· A lower confined aquifer with sand and gravel lenses interbedded with fine silt and clay layers. This unit is reported to be 0–100 ft thick in Anderson and Jones (1972). This unit was interpreted as coarser, pre-Glacial lake cook deposits under the upper confining unit.
-
· A lower confining unit that extends down to bedrock. Less is known about this lowest unit, but it is thought to be mostly clay and silt layers with occasional discontinuous sand lenses (Anderson and Jones, 1972). The glacial history associated with this unit is unknown and it was assumed to extend across the full model area.
-
· Near Nikiski the upper unconfined aquifer is split into a discontinuous coarse aquifer unit separated from a lower, partially confined aquifer by a 25-ft thick fine-grained glacial till unit (DOWL, 2015; Freethey and Scully, 1980; Nelson, 1981). This sequence is limited to the coast by Nikiski and does not reach the study basin. It is associated with the westernmost moraine from the Killey stade when ice advanced from the west to the Kenai coast. This discontinuous upper confining unit was not included in the MODFLOW 6 model.
References Cited
Alaska Department of Natural Resources (AKDNR), 2022, Well Log Tracking System (WELTS) database: MapServer of borehole lithology data, accessed September 28, 2022, at https://arcgis.dnr.alaska.gov/arcgis/rest/services/MLW/WELTSwithBoreholeData/MapServer.
Anderson, G.S., 1971, Ground-water exploration, Beaver Creek valley near Kenai, Alaska: U.S. Geological Survey Open-File Report 71–6, accessed October 13, 2022, at https://doi.org/10.3133/ofr716.
Anderson, G.S., and Jones, S.H., 1972, Water resources of the Kenai-Soldotna area, Alaska: U.S. Geological Survey Open-File Report 72–77, 81 p., 2 plates, accessed October 17, 2024, at https://doi.org/10.3133/ofr727.
Bailey, B.J., and Hogan, E.V., 1995, Overview of environmental and hydrogeologic conditions near Kenai, Alaska: U.S. Geological Survey Open-File Report 95–410, 141 p., accessed October 17, 2024, at https://doi.org/10.3133/ofr95410.
DOWL, 2015, Nikiski groundwater study: Prepared for the Kenai Peninsula Borough, 264 p., accessed October 3, 2022, at https://www.kpb.us/images/KPB/PUR/Projects/Nikiski/1_Nikiski_Report_REVISED_FINAL_04-28-2015.pdf.
Freethey, G.W., and Scully, D.R., 1980, Water resources of the Cook Inlet Basin, Alaska: U.S. Geological Survey Hydrologic Investigations Atlas HA–260, 4 sheets, accessed October 17, 2024, at https://doi.org/10.3133/ha620.
Homer Soil & Water Conservation District, 2006, Section 1—Idealized landscape level draft diagrams western Kenai Peninsula Lowlands: Homer Soil & Water Conservation District, accessed October 3, 2022, at https://www.restorsci.com/projects/water.html.
Karlstrom, T.N.V., 1964, Quaternary geology of the Kenai Lowland and glacial history of the Cook Inlet region, Alaska: U.S. Geological Survey Professional Paper 443, 69 p. [Also available at https://doi.org/10.3133/pp443.]
Miller, R.D., and Dobrovolny, E., 1959, Surficial geology of Anchorage and vicinity, Alaska: U.S. Geological Survey Bulletin 1093, 128 p. [Also available at https://doi.org/10.3133/b1093.]
Nelson, G.L., 1981, Hydrology and the effects of industrial pumping in the Nikiski area, Alaska: U.S. Geological Survey Open-File Report 81–685, 22 p., accessed October 3, 2022, at https://doi.org/10.3133/ofr81685.
Reger, R.D., Sturmann, A.G., Berg, E.E., and Burns, P.A.C., 2007, A guide to the late Quaternary history of the northern and western Kenai Peninsula, Alaska: State of Alaska Department of Natural Resources Division of Geological & Geophysical Surveys, Guidebook 8, accessed October 13, 2022, at https://dggs.alaska.gov/pubs/id/15941.
R&M Consultants, Inc., 2007, Geotechnical investigation and site conditions report Kenai River bluff erosion: prepared for U.S. Army Engineer District, Alaska, accessed October 3, 2022, at https://www.poa.usace.army.mil/Portals/34/docs/civilworks/publicreview/AppendixD1aRM2007FinalGeotechReport.pdf?ver=2017-06-19-144122-650.
Wilson, F.H., and Hults, C.P., 2012, Geology of the Prince William Sound and Kenai Peninsula Region, Alaska: U.S. Geological Survey Scientific Investigations Map 3110, 38 p., 1 plate, accessed October 17, 2024, at https://doi.org/10.3133/sim3110.
Appendix 2. GFLOW Model
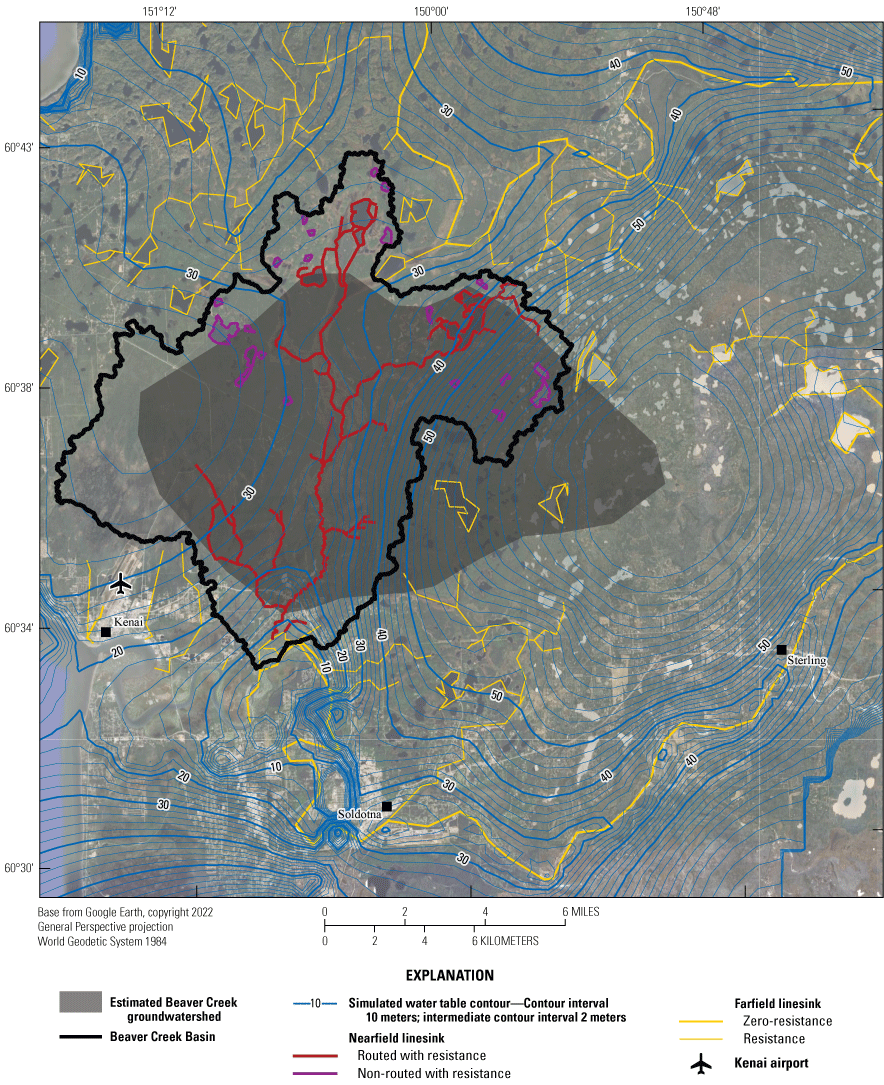
Map showing the extent of the GFLOW model, simulated water table contours, and approximate groundwatershed.
-
· 471 miscellaneous groundwater level measurements from the National Water Information System (NWIS; USGS, 2023) taken between 1962 and 1999.
-
· Four groundwater levels measured in wells 1, 2, 4, and 5 installed for this study, taken on July 7 and 8, 2022. Well 3 was affected by a beaver dam at Marathon Road (that was not reproduced in the model) and was not used. Well 4 (the deeper well at the same location) was assumed to be more representative of ambient conditions in the absence of the beaver dam.
-
· 11 streamflows measured along Beaver Creek and its tributaries from July 4 to 7, 2022, following several months of little to no precipitation.
-
· Mean August base flow for Bishop Creek, 1977–79, determined from base-flow separation of daily data from NWIS (base-flow index method; Wahl and Wahl, 1988). During 1977–79, August had the lowest average monthly flow.
References Cited
Fehling, A.C., Leaf, A.T., Bradbury, K.R., Hunt, R.J., Mauel, S.W., Schoephoester, P.R., and Juckem, P.F., 2018, Characterization of groundwater resources in the Chequamegon-Nicolet National Forest, Wisconsin—Nicolet Unit: Wisconsin Geological and Natural History Survey Technical Report 004–2, 61 p., 20 plates.
Haitjema, H.M., 2021. GFLOW version 2.2.4. Accessed October 2, 2021, at https://www.epa.gov/ceam/gflow-groundwater-flow-analytic-element-model.
Hunt, R., Anderson, M., and Kelson, V., 1998, Improving a complex finite-difference ground water flow model through the use of an analytic element screening model: Ground Water, v. 36, no. 6, p. 1011–1017, accessed October 17, 2024 at https://doi.org/10.1111/j.1745-6584.1998.tb02108.x.
Leaf, A.T., Fienen, M.N., and Reeves, H.W., 2021, SFRmaker and Linesink-maker—Rapid construction of streamflow routing networks from hydrography data: Groundwater, v. 59, no. 5, p. 761–771, accessed October 17, 2024, at https://doi.org/10.1111/gwat.13095.
Leaf, A.T., Haserodt, M.J., and Westenbroek, S.M., 2024, Soil water balance, groundwater flow, and stream temperature models for Beaver Creek, Alaska, 2019 to 2050: U.S. Geological Survey data release, accessed December 31, 2024, at http://doi.org/10.5066/P9K30VAP.
Moore, R.B., McKay, L.D., Rea, A.H., Bondelid, T.R., Price, C.V., Dewald, T.G., and Johnston, C.M., 2019, User’s guide for the national hydrography dataset plus (NHDPlus) high resolution: U.S. Geological Survey Open-File Report 2019–1096, 66 p., accessed October 17, 2024 ,at https://doi.org/10.3133/ofr20191096.
U.S. Geological Survey (USGS), 2023, USGS water data for the Nation: U.S. Geological Survey National Water Information System database, accessed July 6, 2023, at https://doi.org/10.5066/F7P55KJN.
Wahl, K.L., and Wahl, T.L., 1988, Effects of regional ground-water level declines on streamflow in the Oklahoma Panhandle, in Waterstone, M., and Burt, R.J., ed., Proceedings of the symposium on water-use data for water resources management, [Tuscon, Ariz.], 1988: Tuscon, Ariz., American Water Resources Association, 830 p.
Appendix 3. Soil-Water-Balance Model
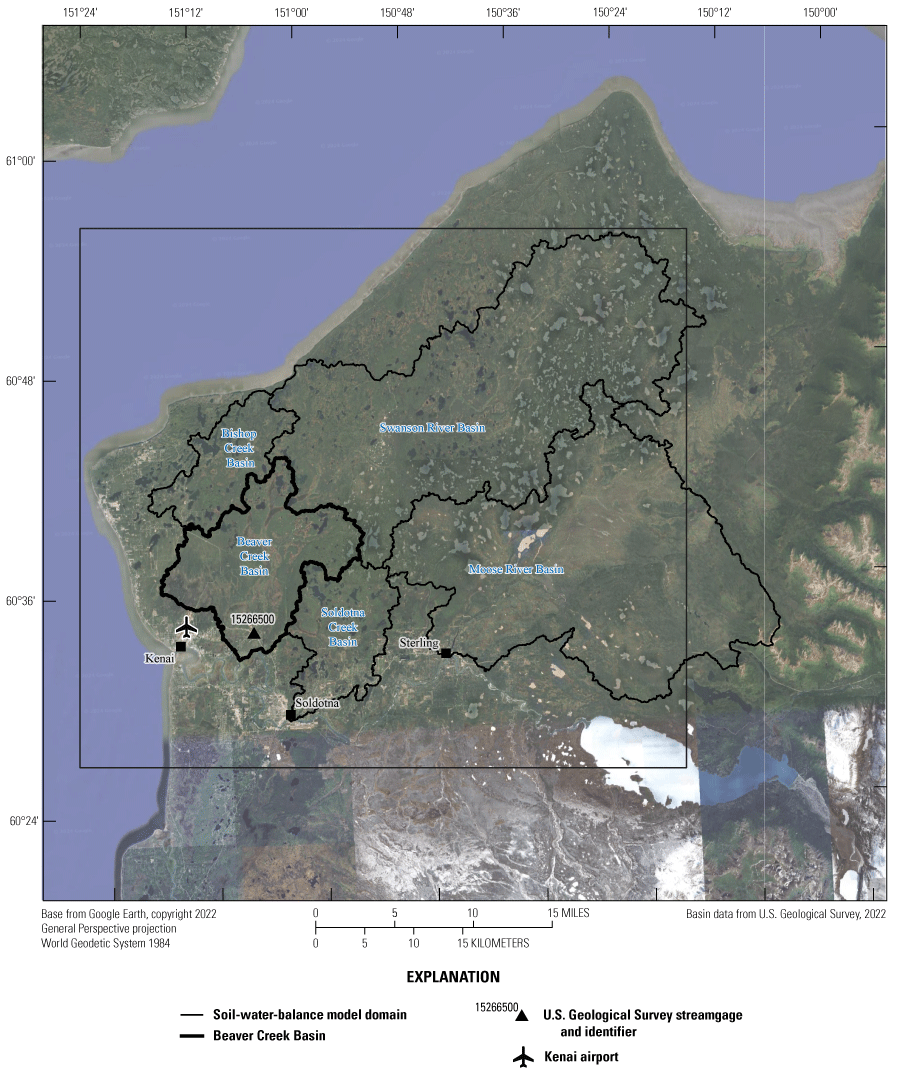
Model domain for the soil-water-balance model and locations of Kenai, Soldotna, and Sterling where weather data were queried for the Beaver Creek soil-water-balance model.
SWB Model Inputs
The SWB model calculates a water balance for the soil zone using the following inputs:
-
· A table of climate data (temperature and precipitation) from the Kenai airport and Soldotna weather stations (National Oceanic and Atmospheric Administration [NOAA], 2023a, 2023c).
-
· Gridded 2016 land-use data from the National Land Cover Database (USGS, 2020).
-
· Gridded soil data, including hydrologic soil group (HSG) and top 150-centimeter available water content from the gridded National Soil Survey Geographic (gNATSGO) database (Natural Resources Conservation Service, 2020).
-
· A land-use lookup table with runoff curves, maximum daily recharge, and rooting depths for the various land-use type and HSG combinations.
Climate data from a single nearby weather station were assumed to represent precipitation and temperature conditions across the basin because of the small basin size and minimal elevation changes. This assumption was supported by the lack of substantial spatial trends across the study basin in compiled gridded precipitation and temperature data representing averages from 1981 to 2010 (PRISM Climate Group, 2018). Kenai airport weather station data (NOAA, 2023a) were pre-processed to fill data gaps and check for extreme values. Overall, the Kenai airport record was complete with less than 50 missing data days from January 1944 to October 2023. Missing precipitation was assigned a value of 0 and missing temperature data were filled using a linear interpolation with data before and after the gap. The Kenai airport weather station showed similar weather trends to the nearby Soldotna weather station (NOAA, 2023b; 8 miles south of the basin) and Sterling weather station (NOAA, 2023c; 7 miles southeast of the basin) weather stations until 2020 onward when the Kenai station recorded less than one-half the annual precipitation observed at the other two stations. It is unknown why precipitation at the Kenai airport weather station began to deviate substantially in recent years but recent streamflow records at the Beaver Creek streamgage indicate substantially more precipitation than recorded by the Kenai weather station. To remedy this bias, the Soldotna weather station (NOAA, 2023b) precipitation data were used for 2015–23. Kenai airport weather station temperature data did not appear to be erroneous and were used for the whole model period.
HSG and available water content soil data were resampled to 45.7-meter (150-foot) grid cells (figs. 3.2 and 3.3). There is a sharp divide in the soil data across the model domain owing to the area being partially covered by the SSURGO and STATSGO2 soil datasets. The gNATSGO dataset uses the SSURGO data, where available, and fills in remaining areas with the STATSGO2 data. Unlike the continental states where SSURGO coverage is dominant, SSURGO coverage in Alaska is limited (Natural Resources Conservation Service, 2020); gNATSGO were the best soil data available in Beaver Creek Basin at the time of this study. There were four different mapped HSGs in the model domain: A, B, C, D; and 3 mixed groups: A/D, B/D, and C/D. The mixed groups can be treated as D soils under undrained conditions or the first letter soil type under drained conditions, typically present in agricultural areas (U.S. Department of Agriculture, 2009). Because agriculture is sparse across the domain, it was assumed that these mixed soil areas were undrained, and they were treated as D soils for the SWB model. The HSG soil groups represent a continuum of textures and infiltration potential ranging from porous, coarse A soils to fine-textured D soils (Westenbroek and others, 2018). The most common HSGs (fig. 3.4) in the SWB area, excluding the inactive model area over Cook Inlet, were B (47.7 percent) and D (50.5 percent) with minor amounts of C and almost no A soils.
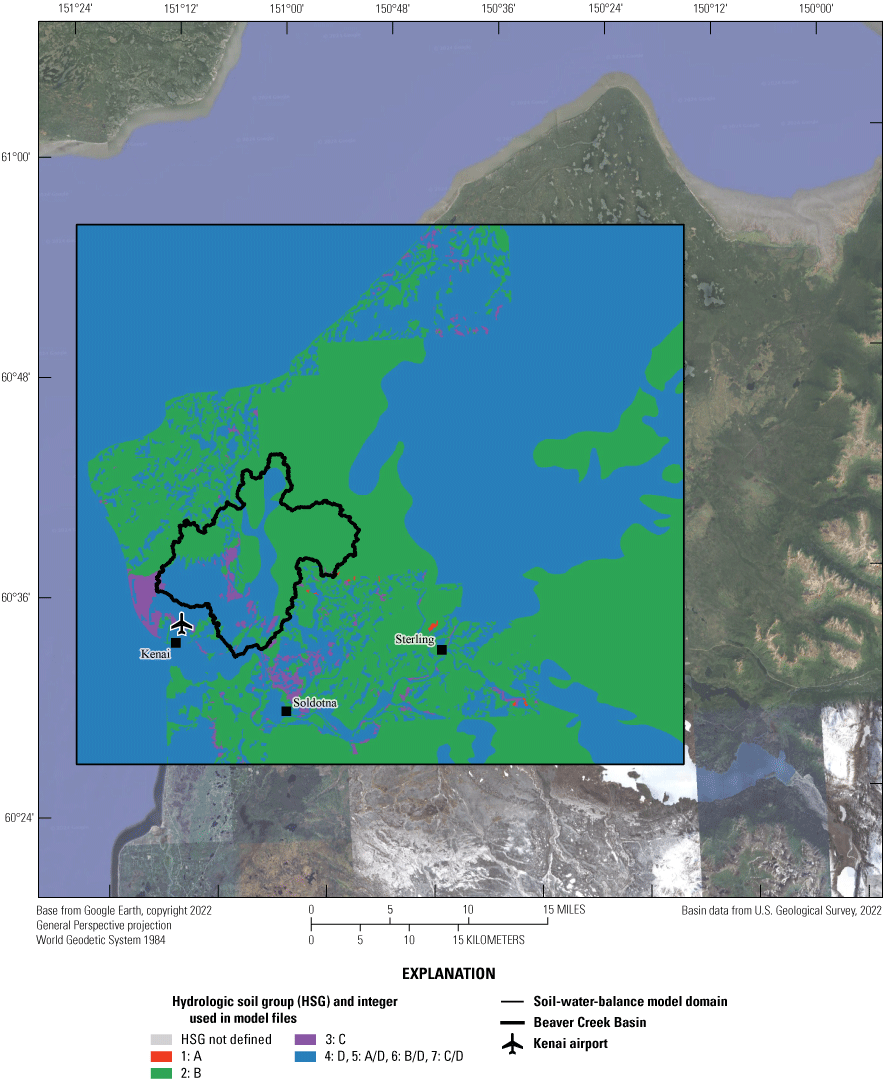
Hydrologic soil groups from the gridded National Soil Survey Geographic dataset.
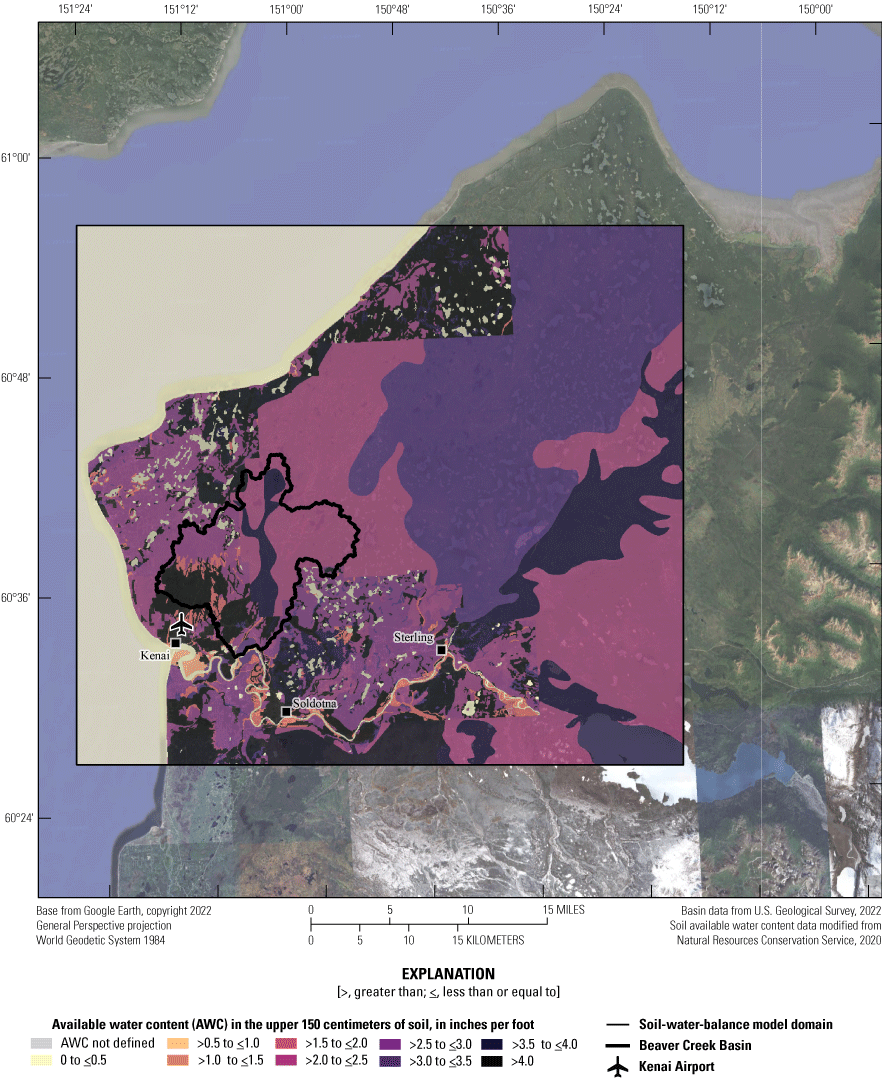
Available water content for the upper 150 centimeters of soil from the Alaska gridded National Soil Survey Geographic dataset.
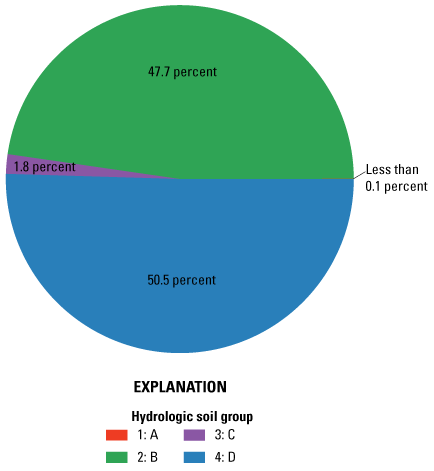
Pie chart of the hydrologic soil groups in the active soil-water-balance model area.
Land cover was estimated using gridded 2016 data (fig. 3.5) from the National Land Cover Database (USGS, 2020). Annual land cover datasets were not available for the period spanning the model simulation and changes between available years were deemed minimal, so the most recent land use (2016) was used for the full SWB period. Inactive portions of this dataset were used to define the active model area and exclude large open water areas such as Cook Inlet. A total of 15 different land cover types occur across the Beaver Creek SWB model area. Land cover is dominated (59 percent) by evergreen, mixed, and deciduous forests (fig. 3.6). Woody wetlands, emergent herbaceous wetlands, and open water make up the other common land types (31 percent). Development makes up less than 5 percent of land cover in the SWB model area.
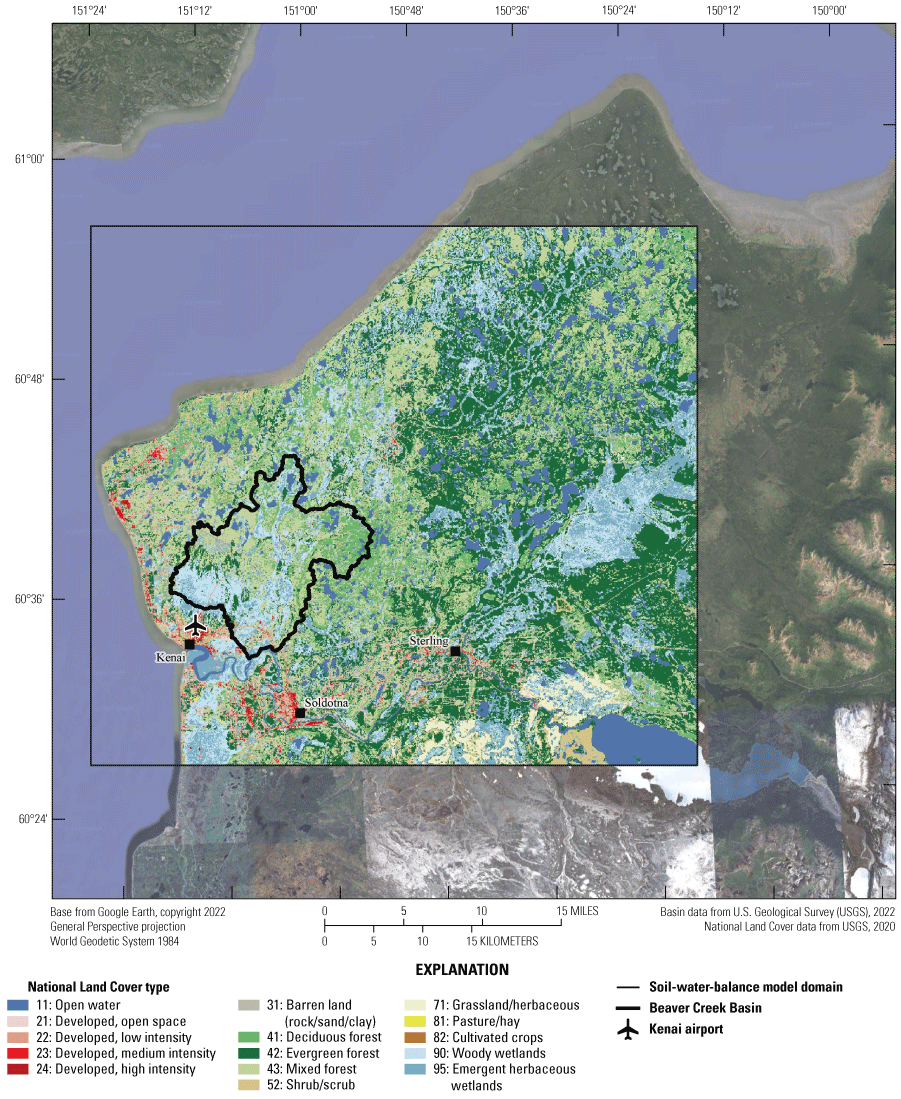
Land-use data from the National Land Cover Dataset (U.S. Geological Survey, 2020), resampled to the soil-water-balance model area. Areas over Cook Inlet were set to inactive. Inactive portions of this dataset were used to define the active and inactive areas for the whole soil-water-balance model.
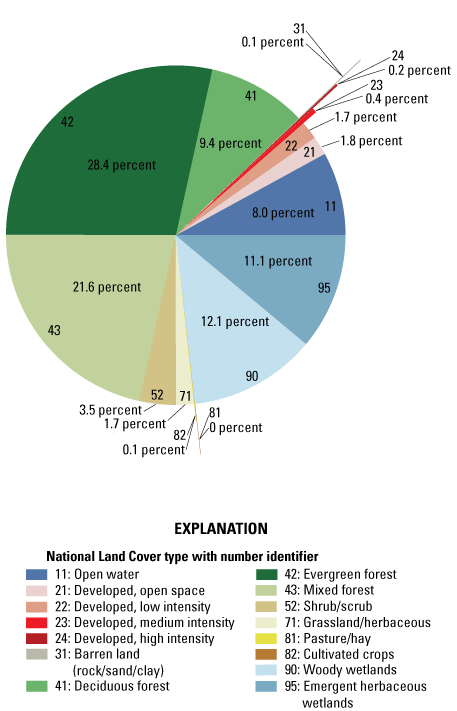
Pie chart of the land cover types in the active Beaver Creek soil-water-balance model area.
Lookup tables are used by SWB to assign properties like runoff curve numbers, maximum daily net infiltration, and rooting depths to individual grid cells; the cell’s land use code and hydrologic soil group are used to assign the appropriate value to each cell.
Curve numbers for hydrologic soil group “A” were derived from values in the TR–55 publication (Cronshey and others, 1986) as a starting point. Curve numbers for urban land uses are generally unadjusted table values. Curve numbers for forested, shrub/scrub, and hay/pasture were initially derived from TR–55 values but were adjusted upward to generate more runoff, as described in the following section. Curve numbers for hydrologic soil groups “B,” “C,” and “D” were determined using the “curve number aligner” equations, originally developed in graphical form by Viktor Mockus (Hawkins and others, 2009).
Maximum daily net infiltration values were set to values that have been used in previous projects. The values range from a maximum net infiltration rate of 4 inches for hydrologic soil group “A,” to 0.12 inch for hydrologic soil group “D.” The maximum net infiltration rate is a coarse control to ensure that estimated net infiltration rates do not exceed rates judged to be realistic. There is no physical process representation in SWB, and substantial professional judgement is involved in setting parameter values; therefore, we set parameter values to larger or less restrictive values unless the comparison of SWB-derived and observed base flow indicated otherwise.
Rooting depths for hydrologic soil group “A” were derived loosely from the ranges published by Thornthwaite and Mather (1957). Rooting depths for hydrologic soil groups “B,” “C,” and “D” were assumed to be 0.9, 0.93, and 0.96 times, respectively, the value assigned to the “A” soil groups. The relation between rooting depth and soil texture is not well established. There seems to be a general inverse relation between soil texture and rooting depth; that is, “A” soils (generally sandy soils) may have the greatest rooting depth, with a minimum relative rooting depth for group “B” (silt loam) and intermediate relative values for groups “C” (clay loam) and “D” (clay) (refer to Dwyer and others, 1988), although there is substantial variability between soil texture and crop types.
Manual Beaver Creek Streamflow Comparison
Evapotranspiration often represents the largest water balance component but can be difficult to constrain. Evapotranspiration estimates from a nearby eddy covariance flux site at Lily Lake (Sullivan, 2023) were examined, but actual evapotranspiration at this location may be enhanced by perennial groundwater availability. To better constrain the non-evaporative component (that ultimately runs off to streams), the combined runoff and net infiltration estimated by SWB model for the Beaver Creek Basin upstream from the Beaver Creek streamgage were compared to the recorded streamflow data at the Beaver Creek streamgage (USGS, 2023) for 1967–78 and 2022–23. Rooting depths and runoff curve numbers were manually adjusted to reduce the misfit between the measured and estimated streamflow. Groundwater-derived base flow was estimated from SWB output by taking a zonal sum of the daily results for the “net_infiltration” variable (Westenbroek and others, 2018), from all grid cells within the upstream contributing area for the Beaver Creek streamgage, and aggregating those results on an annual basis. Similarly, estimates of surface runoff were generated by adding zonal sums of the daily outputs for the “rejected_net_infiltration” and “runoff” variables (Westenbroek and others, 2018), for all grid cells within the upstream contributing area for the Beaver Creek streamgage. The estimates of base flow and surface runoff were combined to yield a series of annual total flow estimates. Because SWB provides a result in inches, a conversion is required to convert these sums into cubic feet per second.
whereq
is the daily mean discharge, in cubic feet per second; and
m
is the mean of the summed gridded daily values; and
n
is the number of SWB gridcells in the basin area upstream from the Beaver Creek streamgage (2018).
The mean daily value for the Beaver Creek streamgage from 1967 to 2022 is 26.1 cubic feet per second; the total flow for that same period estimated by SWB is 25.2 cubic feet per second.
SWB Model Outputs
The Beaver Creek SWB model produced gridded daily outputs for each of the soil-water-balance terms across the study area. The net infiltration output from the Beaver Creek SWB model was used for the recharge array input to the groundwater flow model. The Beaver Creek SWB model estimate of runoff was trimmed to a routing area assumed to represent the area contributing surface runoff to Beaver Creek and applied directly to the corresponding SFR Package reaches as discussed in appendix 4.
The total annual net infiltration for 2021, a representative year similar to long-term average conditions in the study period, is shown in figure 3.7A. Net infiltration is highest (6–8 inches per year [in/yr]) in the upland northern and eastern portions of the basin, which have coarser type B soils than the dominant D soils across much of the lowland areas. Net infiltration is lowest (less than 2 in/yr) in the wetland-rich Beaver Creek valley and large wetland complex to the west. The runoff is shown in figure 3.7B and rejected recharge in figure 3.7C; the area where this water is routed for the MODFLOW model is also shown in these figures. The runoff is highest (4–6 in/yr) in the Beaver Creek valley where the net infiltration is low and to closed depressions such as lakes. The rejected recharge is low across the model domain. Average annual potential net infiltration, rejected recharge, and runoff were plotted across the Beaver Creek SWB model simulation periods in figure 3.8. The recent period has been wetter than average, with 2022 being exceptionally wet. Across the Beaver Creek SWB simulation period, net infiltration is the largest potential source of water for Beaver Creek (3.7 in/yr), followed by runoff (2.6 in/yr), and then a nominal contribution from rejected recharge (0.6 in/yr).

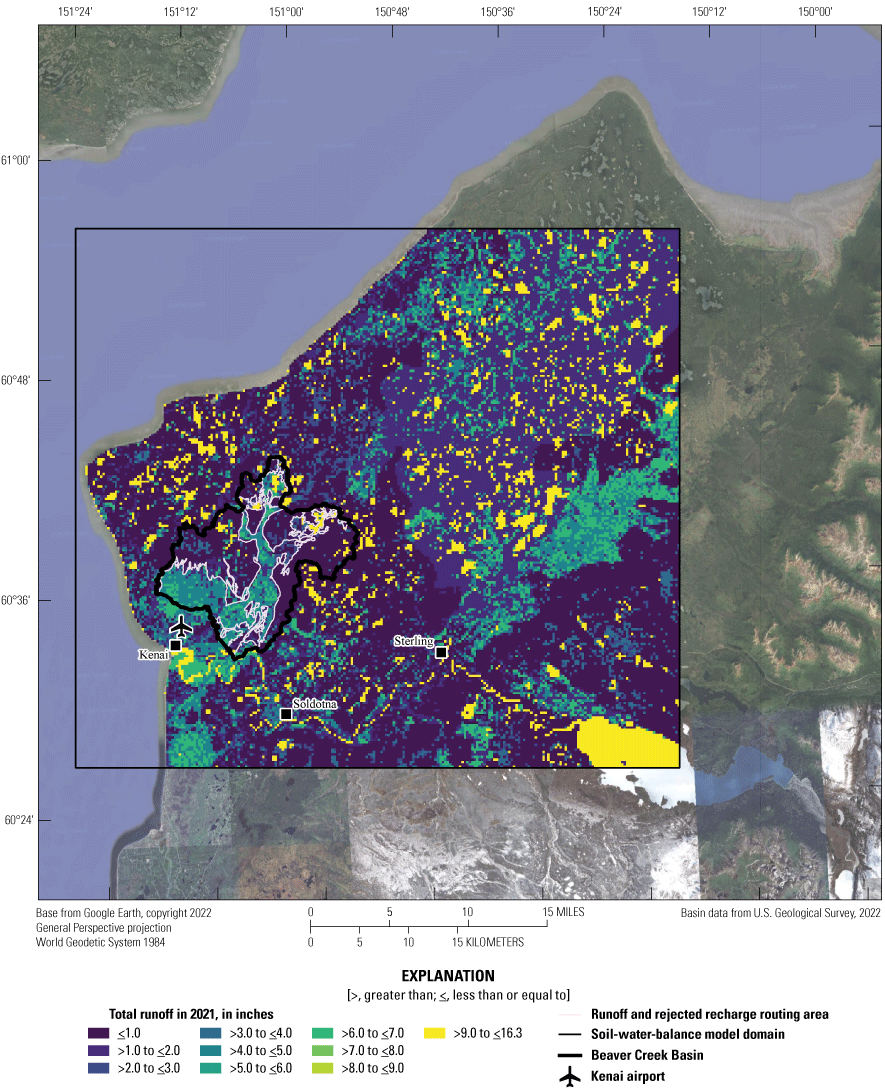
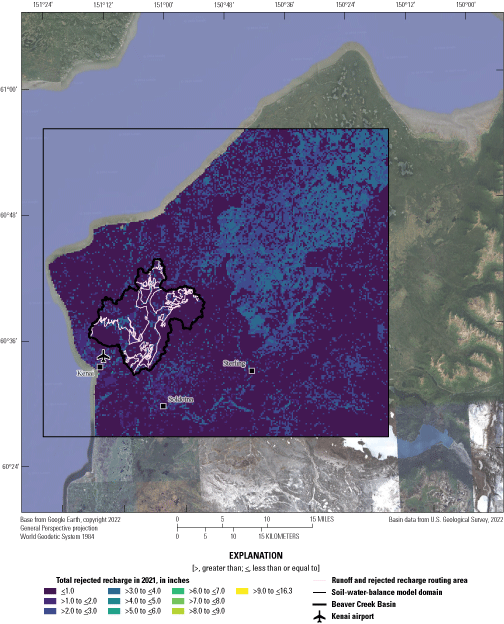
Map showing spatial distribution of soil-water-balance model outputs. A, Annual net infiltration. B, Annual runoff. C, Annual rejected recharge simulated by the Beaver Creek soil-water-balance model for 2021.
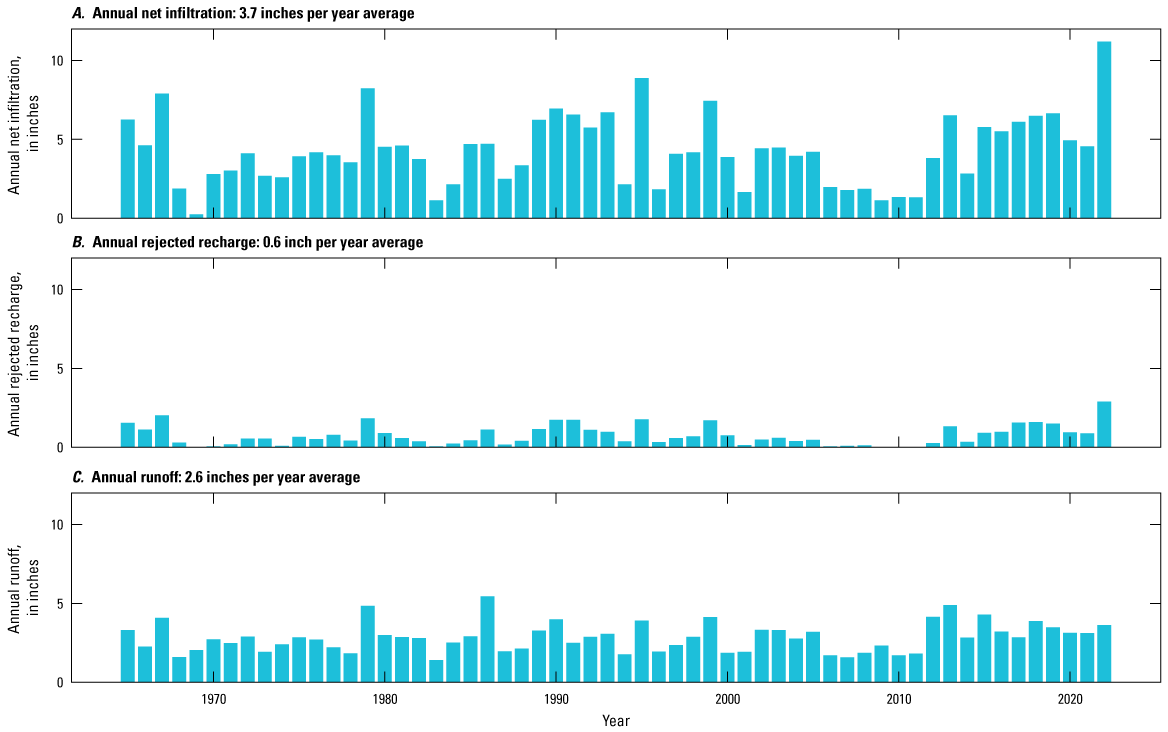
Bar chart of annual net infiltration, rejected recharge and surface runoff outputs from the soil-water-balance simulation, 1965–2022. A, Net infiltration. B, Runoff. C, Rejected recharge across the Beaver Creek Basin, upstream from the Beaver Creek near Kenai, Alaska, streamgage (U.S. Geological Survey site 15266500; fig. 3.1).
The range in annual net infiltration estimated by the Beaver Creek SWB model is comparable to previous work, including (1) 4–15 in/yr estimated by Anderson and Jones (1972) near Kenai and Soldotna, with 4 in/yr in the Beaver Creek Basin using base-flow separation of the Beaver Creek hydrograph; (2) 7.4 in/yr using base-flow separation on the Ninilchik River (south of the study site and in a slightly wetter part of the Kenai Lowlands) hydrograph by Nelson and Johnson (1981); and (3) 4–15 in/yr from a groundwater flow model of the shallow groundwater system at wetland sites in the southern Kenai Peninsula lowlands (Haserodt, 2014). The long-term study average net infiltration of 3.7 in/yr in the basin is slightly lower than these area studies.
References Cited
Anderson, G.S., and Jones, S.H., 1972, Water resources of the Kenai-Soldotna area, Alaska: U.S. Geological Survey Open-File Report 72–77, 81 p., 2 plates, accessed October 17, 2024, at https://doi.org/10.3133/ofr727.
Cronshey, R., McCuen, R., Miller, N., Rawls, W., Robbins, S., and Woodward, D., 1986, Urban hydrology for small watersheds: U.S. Department of Agriculture, Soil Conservation Service, Engineering Division, Technical Release 55, 164 p., accessed June 21, 2024, at https://www.nrc.gov/docs/ML1421/ML14219A437.pdf.
Dwyer, L.M., Stewart, D.W., and Balchin, D., 1988, Rooting characteristics of corn, soybeans and barley as a function of available water and soil physical characteristics: Canadian Journal of Soil Science, v. 68, no. 1, p. 121–132. [Also available at https://doi.org/10.4141/cjss88-011.]
Hawkins, R.H., Ward, T.J., Woodward, D.E., and Van Mullem, J.A., 2009, Curve number hydrology. American Society of Civil Engineers, 106 p. https://doi.org/10.1061/9780784410042.
Leaf, A.T., Haserodt, M.J., and Westenbroek, S.M., 2024, Soil water balance, groundwater flow, and stream temperature models for Beaver Creek, Alaska, 2019 to 2050: U.S. Geological Survey data release, accessed December 31, 2024, at http://doi.org/10.5066/P9K30VAP.
Natural Resources Conservation Service (NRCS), 2020, The Gridded National Soil Survey Geographic (gNATSGO) database for Alaska: U.S. Department of Agriculture, Natural Resources Conservation Service, accessed June 23, 2021, at https://nrcs.app.box.com/v/soils.
National Oceanic and Atmospheric Administration (NOAA), 2023a, Daily summaries station details for Kenai Airport, AK station GHCND:USW00026523: National Oceanic and Atmospheric Administration, accessed October 10, 2023, at https://www.ncdc.noaa.gov/cdo-web/datasets/GHCND/stations/GHCND:USW00026523/detail.
National Oceanic and Atmospheric Administration (NOAA), 2023b, Daily summaries station details for Soldotna 5 SSW, AK station GHCND: USC00508615: National Oceanic and Atmospheric Administration, accessed November 8, 2023, at https://www.ncdc.noaa.gov/cdo-web/datasets/GHCND/stations/GHCND:USC00508615/detail.
National Oceanic and Atmospheric Administration (NOAA), 2023c, Daily summaries station details for STERLING 6 SW, AK station GHCND:USC00508731: National Oceanic and Atmospheric Administration, accessed November 8, 2023, at https://www.ncdc.noaa.gov/cdo-web/datasets/GHCND/stations/GHCND:USC00508731/detail.
Nelson, G.L., and Johnson, P.R., 1981, Ground-water reconnaissance of part of the Lower Kenai Peninsula, Alaska: U.S. Geological Survey Open-File Report 81–905, 32 p., accessed October 17, 2024, at https://doi.org/10.3133/ofr81905.
PRISM Climate Group, 2018, Alaska average monthly and annual precipitation and minimum, maximum, and mean temperature for the period 1981–2010 (completed 2018): PRISM Climate Group, Oregon State University, accessed October 10, 2023, at https://prism.oregonstate.edu/projects/alaska.php.
Sullivan, P., 2023, AmeriFlux BASE US-KPL Lily Lake Fen: AmeriFlux AMP dataset, version 2–5, accessed October 17, 2024, at https://doi.org/10.17190/AMF/1865478
U.S. Geological Survey (USGS), 2020, NLCD 2016 land cover—Alaska (ver. 2.0, July 2020): National Land Cover Database, Multi-Resolution Land Characteristics Consortium, accessed July 29, 2022, at https://www.mrlc.gov/data?f%5B0%5D=region%3Aalaska.
U.S. Geological Survey (USGS), 2023, USGS water data for the Nation: U.S. Geological Survey National Water Information System database, accessed October 17, 2024, at https://doi.org/10.5066/F7P55KJN.
Westenbroek, S.M., Engott, J.A., Kelson, V.A., and Hunt, R.J., 2018, SWB version 2.0—A soil-water-balance code for estimating net infiltration and other water-budget components: U.S. Geological Survey Techniques and Methods, book 6, chap. A59, 118 p., accessed January 1, 2019, at https://doi.org/10.3133/tm6A59.
Appendix 4. MODFLOW 6 Model Construction
Extent and Discretization
The model extent was based on the groundwatershed defined by the GFLOW model (appendix 2). Within the extent, the model is discretized horizontally into uniform 50-meter cells. Vertically the model consists of four layers representing the hydrostratigraphic units described in table 2 in the “Hydrostratigraphic Units and Aquifer Properties” section in the main report. The layer surface elevations were developed as follows:
-
· Layers 1 and 2 represent the Killey stade and glaciolacustrine deposits in the western part of the model, and the undifferentiated Knik and Eklutna deposits in the east. The bottom of layer 1 was set 12 meters below an initial water table elevation or the land surface (whichever was less), so that the water table was always simulated in layer 1; this greatly improved the stability of the model solution.
-
· Layer 3 represents the upper confining unit. The top of layer 3 (bottom of layer 2) was based on interpretation of borehole data (appendix 1). A uniform thickness of 10 meters was assigned based on the range of upper confining unit thicknesses interpreted from the borehole data. Layer 3 is only present in the western part of the model where Naptowne deposits are represented. In the eastern part, where the older Knik and Eklutna deposits are assumed to extend through the full model thickness, layer 3 contains vertical pass-through cells (Langevin and others, 2017) with zero-thickness (figs. 6 and 7).
-
· Layer 4 represents the lower confined aquifer that provides water to the City of Kenai.
Temporally, the historical model simulates an initial steady-state period representing average conditions between January 1, 2015, and January 1, 2019, followed by transient 7-day periods from January 1, 2019, to October 1, 2023. The transient time discretization was selected to align with the stream temperature model (appendix 5). Periods of 1 or 2 days are included at the end of each calendar year so that a new 7-day period starts on January 1, and the periods within each year span consistent days of the year (a requirement for the Stream Network Temperature model; appendix 5). Scenario models with various future net infiltration, runoff, and water use forcings were constructed in the same manner starting January 1, 2019, with the same discretization as the historical model but continuing the 7-day stress periods out to October 1, 2050 (appendix 7).
Boundary Conditions
Recharge
Recharge to the groundwater system was estimated as net infiltration from a Soil-Water-Balance code (SWB) model of the study area that was run from 1965 to the historical simulation end date of October 1, 2023 (appendix 3). Daily net infiltration values were averaged to the 7-day model stress periods and resampled to the model grid using the nearest neighbor option in Modflow-setup (Leaf and Fienen, 2022). Recharge was simulated in the MODFLOW 6 model using the Recharge Package with array-based input. To account for uncertainty in the SWB model partitioning of precipitation into evapotranspiration, surface runoff, and net infiltration, recharge input to the groundwater model was adjusted globally in the parameter estimation process with a single multiplier parameter (appendix 6).
Regional Groundwater Flow
Regional groundwater flow across the MODFLOW 6 model perimeter was simulated using a steady-state analytic element (GFLOW) model (Haitjema, 1995; appendix 2). Simulated steady-state groundwater flow representing conditions in early July 2022 was extracted at the locations of the MODFLOW model perimeter cells, using the “MODFLOW extract” feature in the GFLOW software (Hunt and others, 1998). The vertically integrated GFLOW fluxes were distributed among the four MODFLOW layers using transmissivity-weighted averages and simulated in the MODFLOW model using the Well Package.
Water Use
The City of Kenai has three water supply locations, including two individual wells and Wellfield 2, which has five wells. All wells are screened in the confined aquifer represented by layer 4. In recent years, the city has relied exclusively on four wells in Wellfield 2. Pumping rates for 2020–22 (the most recent available for this study; AKDNR, 2023) were averaged by month and spatially aggregated to “north” and “south” groups representing the two model cells covering Wellfield 2. Pumping rates at these two cells were simulated using the Well Package. The aggregated monthly pumping rates for the north and south groups are shown in figure 4.1. Water use is lowest in the fall and winter and highest in the warmer summer months when seasonal populations are highest and outdoor water use likely increases.
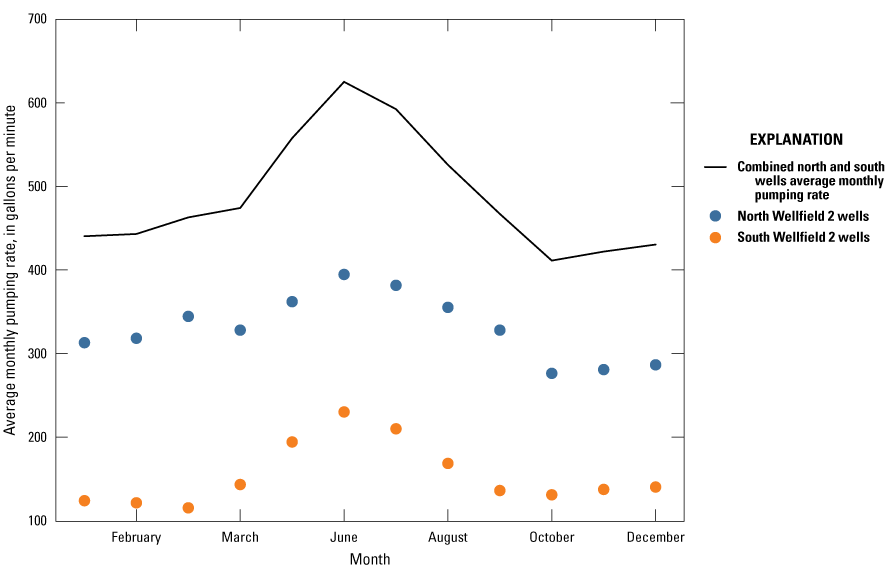
Average pumping rate for each month, from the 2020–22 reported monthly pumping data.
Surface Water
Beaver Creek and its tributaries, including headwater lakes and wetlands, as well as the Swanson River and other small streams within the model domain, were simulated using the Streamflow Routing (SFR) Package. SFR Package input was developed from NHDPlus High Resolution data (Moore and others, 2019) as part of the Modflow-setup build process (Leaf and others, 2024), which uses SFRmaker (Leaf and others, 2021). Streambed top elevations were based on the 3-meter lidar digital elevation models from the National Map (USGS, 2018). Drainage lakes connected to the stream network, such as Beaver Lake, were simulated as linear features using their associated NHDPlus “flowlines.” Given St. Venant’s Principle (for example, Haitjema, 1995) and the focus on downstream areas of Beaver Creek, this assumption was deemed reasonable. Total flow in Beaver Creek was simulated by including surface runoff estimates from the SWB simulation (appendix 3). A runoff contributing area where surface runoff might be expected to reach Beaver Creek was defined (fig. 15 in the main report), and 7-day average runoff values from this area were aggregated to each stream reach using the NHDPlus Catchment polygons, as described by Leaf (2023).
The Kenai River was simulated with the River Package, and the Kenai River Estuary was simulated with the General Head Boundary Package. MODFLOW input for both of these packages was developed from NHDPlus High Resolution data as part of the Modflow-setup build, similar to the SFR Package. Water surface elevations for these two packages were obtained from the 3-meter lidar digital elevation models.
References Cited
Alaska Department of Natural Resources (AKDNR), 2023, Alaska Water Use Data System (AKWUDs): Alaska Department of Fish and Game database, accessed February 23, 2023, at https://dnr.alaska.gov/akwuds/.
Bakker, M., Post, V., Langevin, C.D., Hughes, J.D., White, J.T., Starn, J.J., and Fienen, M.N., 2016, Scripting MODFLOW model development using Python and FloPy: Groundwater, v. 54, no. 5, p. 733–739, accessed October 17, 2024, at https://doi.org/10.1111/gwat.12413.
Bakker, M., and Post, V., Hughes, J.D., Langevin, C.D., White, J.T., Leaf, A.T., Paulinski, S.R., Bellino, J.C., Morway, E.D., Toews, M.W., Larsen, J.D., Fienen, M.N., Starn, J.J., Brakenhoff, D.A., and Bonelli, W.P., 2024, FloPy v3.8.0.dev0 (preliminary): U.S. Geological Survey Software Release, accessed May 23, 2024, at https://doi.org/10.5066/F7BK19FH.
Hunt, R., Anderson, M., and Kelson, V., 1998, Improving a complex finite-difference ground water flow model through the use of an analytic element screening model: Ground Water, v. 36, no. 6, p. 1011–1017, accessed October 17, 2024, at https://doi.org/10.1111/j.1745-6584.1998.tb02108.x.
Langevin, C.D., Hughes, J.D., Banta, E.R., Niswonger, R.G., Panday, S., and Provost, A.M., 2017, Documentation for the MODFLOW 6 groundwater flow model: U.S. Geological Survey Techniques and Methods, book 6, chap. A55, 197 p., accessed March 24, 2022, at https://doi.org/10.3133/tm6A55.
Langevin, C.D., Hughes, J.D., Provost, A.M., Russcher, M.J., and Niswonger, R.G., Panday, S., Merrick, D., Morway, E.D., Reno, M.J., Bonelli, W.P., and Banta, E.R., 2023, MODFLOW 6 Modular Hydrologic Model version 6.4.2: U.S. Geological Survey Software Release, accessed June 28, 2023, at https://doi.org/10.5066/P9FL1JCC.
Leaf, A.T., 2023, Automated construction of Streamflow-Routing networks for MODFLOW—Application in the Mississippi Embayment region: U.S. Geological Survey Scientific Investigations Report 2023–5051, 27 p., accessed October 17, 2024, at https://doi.org/10.3133/sir20235051.
Leaf, A.T., and Fienen, M.N., 2022, Modflow-setup—Robust automation of groundwater model construction: Frontiers in Earth Science, v. 10, art. 903965, 11 p., accessed October 17, 2024, at https://doi.org/10.3389/feart.2022.903965.
Leaf, A.T., Fienen, M.N., and Reeves, H.W., 2021, SFRmaker and Linesink-maker—Rapid construction of streamflow routing networks from hydrography data: Groundwater, v. 59, no. 5, p. 761–771, accessed October 17, 2024, at https://doi.org/10.1111/gwat.13095.
Leaf, A.T., Haserodt, M.J., and Westenbroek, S.M., 2024, Soil water balance, groundwater flow, and stream temperature models for Beaver Creek, Alaska, 2019 to 2050: U.S. Geological Survey data release, accessed December 31, 2024, at http://doi.org/10.5066/P9K30VAP.
Moore, R.B., McKay, L.D., Rea, A.H., Bondelid, T.R., Price, C.V., Dewald, T.G., and Johnston, C.M., 2019, User’s guide for the national hydrography dataset plus (NHDPlus) high resolution: U.S. Geological Survey Open-File Report 2019–1096, 66 p., accessed October 17, 2024, at https://doi.org/10.3133/ofr20191096.
U.S. Geological Survey (USGS), 2018, 3D Elevation Program data: U.S. Geological Survey web page, accessed August 2, 2022, at https://apps.nationalmap.gov/downloader.
Appendix 5. Stream Network Temperature Model Construction
Simulation Code Description
The SNTEMP energy balance considers heat flux from long-wave atmospheric radiation, short-wave solar radiation, convection, conduction, evaporation, streambed friction, and back radiation from the water, as well as the effects of vegetation and topographic shading, dust scattering effects, and “lateral” inflows (combined flow accumulation from groundwater and surface water). Conceptually, the steady-state solution in SNTEMP assumes that the input conditions persist long enough for water to move through the whole stream network within a simulation period. A stress period length greater than the travel time in the system from the farthest upstream headwater to the most downstream point in the model is therefore recommended (Theurer and others, 1984). Other key assumptions and limitations of SNTEMP (Bartholow, 2000) include the following:
-
• Stream flows are constant during each stress period.
-
• Model boundary conditions are homogenous within each reach and constant during each stress period.
-
• When two sources of water are combined, the mixing is homogenous and instantaneous. The model does not simulate lateral or vertical temperature distribution but does simulate longitudinal temperature distribution from upstream to downstream.
-
• SNTEMP does not simulate streamflow. Inflows and outflows to each reach must be specified from a hydrologic model or field observations. “Lateral” flow quantities (representing flow accumulation from groundwater and surface-water sources) are implied by differences in the specified flows at each node in the stream network.
SNTEMP requires input data on the geometry and properties of the stream network, as well as temporal meteorological and hydrologic data that are preprocessed to represent average conditions during each time period (Bartholow, 1989). The stream network is defined by nodes that represent different locations along the stream. Enumeration of the SNTEMP network starts at the most upstream location on the main branch and continues through incoming tributaries as they are encountered going downstream (listing the nodes in each tributary sequentially from headwater to confluence as the tributaries are encountered). Several node types are specific to reservoirs and diversions, which are not present in Beaver Creek. The types of nodes (Bartholow, 2000) potentially relevant to the Beaver Creek model include the following:
-
· H nodes—Headwater nodes define locations that are the starting point of a tributary or the main stem branch. They are typically placed at the start of the channel where flow is zero, but inflows from outside of the model area can also be specified. Flows must be specified at these locations. If the flow is greater than zero, a temperature time-series for the inflows must also be provided.
-
· B nodes—Branch nodes are specified just above a confluence with a tributary. Flows must be specified at these locations.
-
· T nodes—Terminal nodes define the mouth of a tributary at the confluence with the main stem. Flow must be provided at these locations.
-
· J nodes—Junction nodes are specified just below a confluence with a tributary and are therefore colocated with a T and B node. Flows must be specified at these locations.
-
· E nodes—End nodes to define the farthest downstream point in the stream network. There is only one end node per model. Flow must be specified at these locations.
-
· Q nodes—Discharge nodes are used to specify streamflow (and therefore differences in lateral inflow rates) at intermediate locations between confluences, headwaters, or the outlet. In the absence of Q nodes, a homogenous lateral inflow rate is applied, representing the difference in flow between closest upstream and downstream hydrology nodes. Flows must be specified at these locations.
-
· V nodes—Verification nodes allow for specification of observed stream temperatures for history matching. Streamflow must also be defined for these nodes. Verification nodes were not used in this study, because all history matching was done external to SNTEMP using PEST++ and associated tools.
-
· C nodes—Change nodes are used to specify changes in stream properties (for example, shading, stream width, Manning’s coefficient) at intermediate locations between confluences, headwaters, or the outlet. C nodes were not used in this study; stream properties were assumed to be homogenous between headwaters, confluences, and the outlet. Future work could modify the workflow code provided by Leaf and others (2024) to incorporate MODFLOW Streamflow Routing (SFR) Package properties specified by reach into the SNTEMP network using C nodes.
-
· O nodes—Output nodes are used to request stream temperature output at intermediate locations between stream network nodes. Because of the fine resolution used in this study (Q nodes specified about every 50–100 meters at the start and end of each MODFLOW SFR Package reach), O nodes were not needed.
The H, B, T, J, and E nodes constitute “skeleton nodes” that define the structure of the stream network and the model input. The following section provides details on the various input files and source datasets used for the Beaver Creek SNTEMP model.
Input Structure
SNTEMP requires seven input files (job control file, study file, stream geometry file, hydrology node file, hydrology data file, time period file, and meteorological data file) plus an optional shade file for the internal shading routine. Together these input files define the routing of the stream network, the stream characteristics, the model simulation period, and the meteorological data inputs. A summary of the input files, the types of information they contain, and the values used in the Beaver Creek study are provided in table 5.1. All input files for this study were generated using Python scripts that are available in the companion data release (Leaf and others, 2024; refer to the “Beaver Creek SNTEMP Model Construction” section for additional details). The following section provides some additional details on the SNTEMP files.
-
· The job control file is called by the SNTEMP executable to initiate a model run. This file controls what output files are generated and contains a summary of the stream network nodes and model time periods, user-specified model correction factors and calibration coefficients, and names of the model input files.
-
· The study file, stream geometry file, hydrology node file, and hydrology data file contain node location information (as distance upstream from the ending E node) with varying additional information.
-
· The study file contains the stream skeleton nodes (H, B, T, J, and E nodes) plus any additional O nodes where a model output is requested.
-
· The stream geometry file has information about the stream channel including latitude, elevation, a Manning’s n-value, stream width or width formula parameters, minimum and maximum stream shading if a shade file is not used, ground temperature, and a streambed thermal gradient. The stream geometry file has a line for each skeleton node plus any C nodes where different stream properties are specified.
-
· The hydrology node file contains similar information to the study file but, in addition to the skeleton nodes, includes Q nodes where discharge is specified. For each node discharge, lateral inflow temperatures and upstream inflow temperatures (for H nodes with nonzero flows) are specified for each model time period.
-
· The time period file contains the model time periods, which are defined as days of the year that are repeated for each year of the simulation. For example, if the model is run monthly for May–September, every year in the simulation must include the same months defined by the same days of the year (regardless of leap years). For each time period, start and end days of the year are specified along with a dust coefficient, ground reflectivity, and optional period-specific calibration coefficients.
-
· The meteorological data file includes relevant weather data for each model time period. This file starts with information on the weather station location for use with internal routines that compensate for large elevation changes across a basin; topographic changes across the Beaver Creek Basin are minimal so no elevation compensation is needed. Relevant weather data included for the model simulation periods are (1) mean air temperature (degrees Celsius), (2) mean wind speed (meters per second), (3) mean relative humidity (decimal), (4) mean percent sunshine (decimal) estimated from the reported cloud cover, and (5) an optional mean ground-level solar radiation (joules per square meter per second). Solar radiation data were not available for the Kenai airport weather station (NOAA, 2023a), so the default SNTEMP routine for estimating solar radiation was used. In a study in Wisconsin, Hunt and others (2016) determined that the default solar radiation routine produced a better fit to measured stream temperatures compared to supplied solar radiation from a local site.
-
· The shade file is optional and controls SNTEMP’s internal shading routine to estimate shade using stream orientation, topographic angle, and vegetation characteristics (height, density, canopy width, and offset from the stream channel). Alternatively, a minimum and maximum percent shade can be directly supplied in the stream geometry file. The program then uses the minimum shade for the winter months and prorates to the maximum shade during the peak growing season. The model shade proration process is fixed and likely overestimates vegetation cover in late spring/early summer for a northern climate like Alaska, but does allow for declining shade towards late summer and into fall. Bartholow (1989) determined shading to be a moderately sensitive SNTEMP parameter for low-flow and high width channels, especially in midsummer, and only recommends collection of detailed shade data if shading as a management option is a focal point of the study or if sensitivity testing indicates that the model is highly sensitive to shading. Fehling and Hart (2021) and Hunt and others (2016) used the internal SNTEMP shading routine and provided generalized vegetation parameters for each SNTEMP reach in the study basin. Both studies recognized the vegetation parameters as uncertain and varied some or all of them during the model history matching. Fehling and Hart (2021) varied the vegetation density and left the vegetation geometry fixed; the density was determined to be insensitive and was left at the initial values. Fehling and Hart (2021) also concluded that accounting for differences in shading between vegetation community types was important after observing poor model performance in a run that tested uniform shading input across the stream network.
-
· For low topographic relief systems like Beaver Creek where the stream valleys are wide, topographic shading is likely minimal and vegetation shading dominates (for example, Golder Associates, 2005). A direct estimate of vegetative shading may suffice. There are several methods to directly estimate vegetative shading (Bartholow, 1989) including a densiometer as described by Fitzpatrick and others (1998) and Golder Associates (2005). For the Beaver Creek study, right and left bank densitometer readings from the stream center were made at 15 locations throughout the watershed as part of the July 2022 fieldwork. These measurement locations were then categorized into four generalized plant communities using the National Wetland Inventory wetland types (U.S. Fish and Wildlife Service, 2017): (1) short emergent vegetation, (2) scrub-shrub plant communities with vegetation less than 20 feet tall, (3) shrub-scrub dominant area with some emergent zones, and (4) open water. Table 5.2 summarizes the shading measurement results by wetland type. Nineteen SNTEMP shading zones were manually delineated using the dominant wetland vegetation communities plus the location of major stream reaches to allow shading to vary by vegetation community and physical characteristics of a particular valley. Additional details on how shading input to SNTEMP was parametrized and estimated during history matching is available in appendix 6.
Table 5.1.
Stream Network Temperature model input files, as described in Bartholow (2000). Input files are required unless listed as optional.[SNTEMP, Stream Network Temperature; SFR, Streamflow Routing Package; J/m2/s/°C, joule per square meter per second per degree Celsius; SNAP, Scenarios Network for Alaska and Arctic Planning; °C, degree Celsius; m/s, meter per second]
| File type | General file information | File information for Beaver Creek |
|---|---|---|
| Job control file | This file is called with the SNTEMP executable to initiate a model run. It contains information about the other model input files. | No user-override parameters, internal calibration coefficients/constants, or regression factors were used. |
| Study file | This file has all stream network skeleton nodes (H, B, T, J, and E) plus output (O) nodes. Each line contains the stream name, node type, and distance (in kilometers) from the E node. | This was generated using a python script to build the SNTEMP network from the MODFLOW SFR stream network. Distances came from the SFR stream network. |
| Stream geometry file | This file has all the stream network skeleton nodes (H, B, T, J, and E) plus the C
nodes. Each line contains the stream name, node type, distance from the E node, latitude,
and elevation. For H and J nodes it also includes a Manning’s n-value, stream width, minimum and maximum stream shading, ground temperature below the streambed, and the streambed thermal gradient. |
Stream widths were estimated from aerial imagery. It is possible to use a width power
function in SNTEMP to increase width as discharge increases. However, for base-flow
periods when flows are more constant, a constant width is adequate. Elevations came from the SFR network. Manning’s n-value inherited from the SFR file and is the same value used for the MODFLOW model of 0.037, which is between the values of 0.030 for a straight clean natural stream and 0.040 for a sluggish natural stream with deep pools (Engineering Toolbox, 2023). Minimum and maximum shading: Minimum set to 0 and maximum estimated from field measurements and applied by vegetation community (refer to “Shading” section in “Field Data Collection” section of the main text). No shade file was used. Ground temperature: None assigned so defaults to the mean annual air temperature provided. Stream thermal gradient: Used the recommended default (Bartholow, 2000) of 1.65 J/m2/s/°C |
| Hydrology node file | This file has the stream network skeleton nodes (H, B, T, J, and E) plus nodes where
additional hydrology data are required (Q and V nodes). This file has the same information for each node as the study file as well as time-series data. |
Refer to “Study File” section. |
| Hydrology data file | This file has the same header line as the hydrology node file plus discharge, stream temperature (if a V node or a H node with non-zero flow), and lateral inflow groundwater temperature (if blank uses average air temperature). | Discharge came from the MODFLOW model and is applied at constant rate over the reach
length in units of cubic meters per second. Development of lateral inflow and headwater (H) node temperatures is described in the “Beaver Creek SNTEMP Model Construction” section and appendix 6. |
| Time period file | This file defines values for the repeating successive steady-state time periods including days of the year, dust coefficient, ground reflectivity, and air or wind speed calibration values. Note that a single set of values is defined for each time period and then repeats during any additional years (that is, May values are constant for all May time periods in the simulation). | Time periods were defined by a name and day of the year. Periods were 7 days. Dust coefficient: This is not a sensitive parameter (Bartholow, 1989) and was set to 0.06 based on summer values for Madison, Wisconsin, in table II.1 in Theurer and others (1984). Ground reflectivity is also an insensitive parameter (Bartholow, 1989) and was set to 24 percent based on the early and late summer vegetation values in table 5 of Bartholow (1989). No wind speed or air calibration equations were used. |
| Meteorological data file | This file contains meteorological data for each model time period as well as time-constant information about the meteorological data station. | Time-constant station data include latitude, elevation, and average annual air temperature. The Kenai airport (USW00026523; National Oceanic and Atmospheric Administration, 2023a) and Soldotna airport (USC00508615; National Oceanic and Atmospheric Administration, 2023b) weather station data were used for all meteorological data for the study period, and SNAP climate projections were used for the future conditions scenarios. Time period meteorological data included: 1. Mean air temperature (°C). 2. Mean wind speed (m/s). 3. Mean relative humidity (decimal). 4. Mean percent sunshine (decimal), estimated from the reported cloud cover. No mean ground-level solar radiation (J/m2/s) was available at the Kenai airport station so SNTEMP’s internal routine was used to estimate this. |
| Shade data file (optional) | This file contains information on the topographic angle, vegetation height, offset, density, and crown widths for the east and west banks. | This file was not used for Beaver Creek; shade data were directly input into the stream geometry file using estimates from field measurements. |
Table 5.2.
Observed shading ranges by wetland vegetation community. Shade was estimated using a densiometer in July 2022.[n/a, not applicable, NWI, National Wetland Inventory (U.S. Fish and Wildlife Service, 2017)]
Beaver Creek SNTEMP Model Construction
Input to the SNTEMP model including stream geometry, time discretization, and stream flow was based on the MODFLOW model. Initial setup of the SNTEMP stream network was accomplished by identifying the NHDPlus High-resolution “NHDPlusID” (Moore and others, 2019) associated with each desired SNTEMP headwater (H) node location, identifying the MODFLOW SFR reaches associated with the headwater NHDPlusIDs, and then mapping subsequent downstream reaches to SNTEMP nodes. The use of NHDPlusIDs to map SFR reaches to SNTEMP nodes allowed for the SNTEMP network to be rebuilt automatically following changes to the MODFLOW model (including the SFR reach numbering). Within the SNTEMP hydrology node file, MODFLOW SFR reach numbers were recorded in the header information for each SNTEMP node, to allow for mapping between the two models in subsequent workflow steps. SNTEMP nodes were aligned with the beginning of SFR reaches, so that lateral inflows in SNTEMP (represented by the differences between specified discharges at successive SNTEMP nodes) were consistent with MODFLOW SFR Package discharges (that occur at the reach midpoint). In other words, the sum of tributary flow from upstream reaches term (QTRBnb) in the SFR Package budget output (Langevin and others, 2017) was used to specify discharge at the SNTEMP node so that headwater SNTEMP (H) nodes coinciding with headwater SFR reaches had specified discharges of 0.
Stream network distances representing the start of each SFR reach were computed from SFR reach length information so that the SNTEMP reaches had equivalent lengths. Reach lengths varied from 2.5 m (8.2 ft) to 118 m (387 ft). A total of 6,152 reaches were simulated. Figure 5.1 shows the SNTEMP stream network used for this study with the various tributary names that are used in the SNTEMP input files.
Other SNTEMP stream geometry inputs such as latitude, elevation, and Manning’s roughness were also copied from the MODFLOW SFR Package.
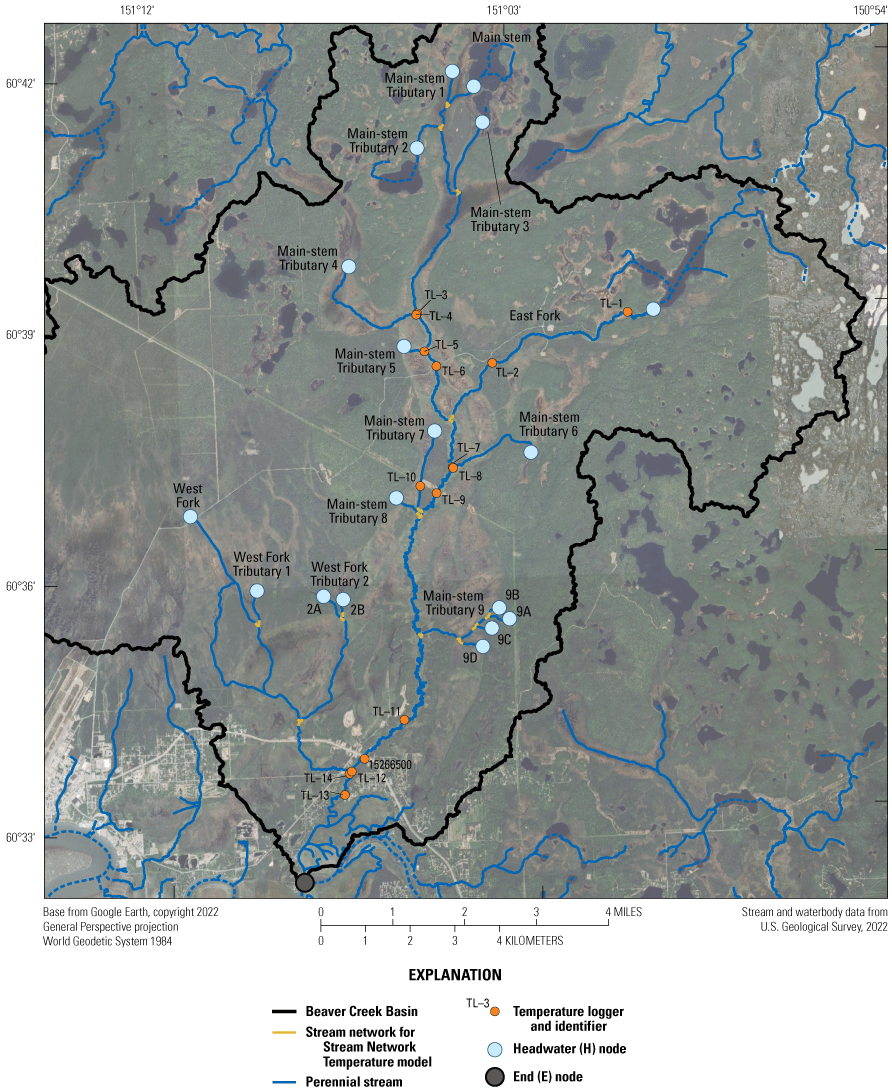
Map of the Stream Network Temperature model stream network.
Time Discretization
Bartholow (2000) and Theurer and others (1984) recommend choosing a model time step that is greater than the basin travel time. Using the average thalweg velocity from the July 2022 discharge measurements in tributaries (0.07 meter per second), the main stem (0.25 meter per second), and the longest flowpath in the basin split into an upper tributary (6.2 kilometers) and the main stem (21.1 kilometers), an approximate travel time through the Beaver Creek Basin was estimated to take at least 2 days. A time discretization of 7 days was selected to exceed the travel time estimate and for its similarity to other stream temperature studies in the region that employed 7-day analysis periods (for example, Kyle and Brabets, 2001; Mauger, 2013; Mauger and others, 2015, 2017; KPFHP, 2022). It should be noted, however, that most of these studies evaluated 7-day rolling averages; therefore, the results in this report could differ. For example, a maximum weekly average temperature could be lower than a maximum weekly rolling average temperature if the warm period was split between 2 weeks.
SNTEMP time discretization was set to align with the MODFLOW model stress periods. Each year, the SNTEMP simulation starts on day 120 (April 29 or 30) and ends on day 273 (September 29 or 30). The steady-state assumption means that each day in the SNTEMP simulation is independent of previous days.
Instream Flows and Specified Inflow Temperatures
Instream flows specified in the SNTEMP hydrology input file were obtained from the SFR Package binary budget output, and assigned to the corresponding SNTEMP node. SNTEMP does not distinguish between sources of streamflow generation; therefore, lateral inflow temperature inputs represent an average temperature across discharges from all sources. Lateral inflow temperatures for SNTEMP were computed as flow-weighted averages of groundwater and surface runoff temperatures. Groundwater temperatures were based on two alternative conceptual models: (1) deep groundwater input that responds slowly to temperature changes at the land surface (using a constant 4.2 degrees Celsius average observed in well 4) or (2) shallow groundwater input where temperatures reflect a lagged and dampened signal of land surface temperature from some months prior (refer to appendix 6 for additional details). Surface runoff temperatures were based on the mean air temperature for the 7-day model stress period.
SNTEMP requires specification of stream temperature for any headwater (H) nodes with specified inflows greater than zero. Temperatures for H nodes with inflows from Beaver, Ootka, Ermine, and Tern Lakes were based on rolling averages of previous air temperatures combined with an offset value to represent the warming effects of solar radiation on these waterbodies. Additional detail on the parametrization of these temperatures is available in appendix 6.
References Cited
Bartholow, J.M., 1989, Stream temperature investigations—Field and analytic methods: Instream Flow Information Paper No. 13: U.S. Department of the Interior Fish and Wildlife Service Biological Report 89(17), 139 p., accessed May 8, 2023, at http://www.krisweb.com/biblio/gen_usfws_bartholow_1989_br8917.pdf.
Bartholow, J.M., 1991, A modeling assessment of the thermal regime for an urban sport fishery: Environmental Management, v. 15, no. 6, p. 833–845, accessed October 17, 2024, at https://doi.org/10.1007/BF02394821.
Bartholow, J.M., 2000, The stream segment and stream network temperature models—A self-study course: U.S. Geological Survey Open-File Report 99–112, 276 p., accessed May 10, 2023, at https://doi.org/10.3133/ofr99112.
Bartholow, J.M., 2010, SNTEMP—Stream network temperature model microcomputer implementation (version 3): U.S. Geological Survey model software, accessed May 3, 2023, at https://doi.org/10.3133/96233.
Engineering Toolbox, 2023, Manning’s roughness coefficients for some common materials: Engineering Toolbox, accessed May 11, 2023, at https://www.engineeringtoolbox.com/mannings-roughness-d_799.html.
Fehling, A.C., and Hart, D.J., 2021, Potential effects of climate change on stream temperature in the Marengo River headwaters: U.S. Geological and Natural History Survey Division of Extension, University of Wisconsin–Madison Bulletin 115, accessed May 8, 2023, at https://wgnhs.wisc.edu/catalog/publication/000976.
Fitzpatrick, F.A., Waite, I.R., D’Arconte, P.J., Meador, M.R., Maupin, M.A., and Gurtz, M.E., 1998, Revised methods for characterizing stream habitat in the National Water-Quality Assessment Program: U.S. Geological Survey Water Resources Investigations Report 98–4052, 67 p., accessed October 17, 2024, at https://pubs.usgs.gov/wri/wri984052/pdf/wri98-4052.pdf.
Golder Associates, 2005, Appendix C—Temperature model and analysis of the lower Ruby River and Mill Creek: Prepared for Montana Department of Environmental Quality, 36 p., accessed May 8, 2023, at https://deq.mt.gov/files/Water/WQPB/TMDL/PDF/RubyWS/M04-TMDL-01a_App_C.pdf.
Herb, W.R., Erickson, T., and Stefan, H.G., 2009, Stream temperature modeling of Miller Creek, Duluth, Minnesota: University of Minnesota St. Anthony Falls Laboratory Engineering, Environmental, and Geophysical Fluid Dynamics Project Report No. 525, accessed May 8, 2023, at https://www.pca.state.mn.us/sites/default/files/wq-iw10-07p.pdf.
Hunt, R.J., Walker, J.F., Selbig, W.R., Westenbroek, S.M., and Regan, R.S., 2013, Simulation of climate-change effects on streamflow, lake water budgets, and stream temperature using GSFLOW and SNTEMP, Trout Lake Watershed, Wisconsin: U.S. Geological Survey Scientific Investigations Report 2013–5159, 118 p., accessed October 17, 2024, at https://doi.org/10.3133/sir20135159.
Hunt, R.J., Westenbroek, S.M., Walker, J.F., Selbig, W.R., Regan, R.S., Leaf, A.T., and Saad, D.A., 2016, Simulation of climate change effects on streamflow, groundwater, and stream temperature using GSFLOW and SNTEMP in the Black Earth Creek Watershed, Wisconsin: U.S. Geological Survey Scientific Investigations Report 2016–5091, 117 p., accessed October 17, 2024, at https://doi.org/10.3133/sir20165091.
Kenai Peninsula Fish Habitat Partnership (KPFHP), 2022, Climate change and the future of freshwater fish habitat on the Kenai Peninsula: Supplemental document accompanying the Kenai Peninsula Fish Habitat Partnership 2022 freshwater conservation plan, accessed August 3, 2023, at https://www.kenaifishpartnership.org/wp-content/uploads/2022/08/Supplement-Climate-Change-and-the-Future-of-Fish-and-Fish-Habitat-on-the-Kenai-Peninsu la-August-2022.pdf.
Kyle, R.E., and Brabets, T.B., 2001, Water temperature of streams in the Cook Inlet basin, Alaska, and implications of climate change: U.S. Geological Survey Water-Resources Investigation Report 01–4109, 24 p. [Also available at https://doi.org/10.3133/wri014109.]
Langevin, C.D., Hughes, J.D., Banta, E.R., Niswonger, R.G., Panday, S., and Provost, A.M., 2017, Documentation for the MODFLOW 6 groundwater flow model: U.S. Geological Survey Techniques and Methods, book 6, chap. A55, 197 p., accessed March 24, 2022, at https://doi.org/10.3133/tm6A55.
Leaf, A.T., Haserodt, M.J., and Westenbroek, S.M., 2024, Soil water balance, groundwater flow, and stream temperature models for Beaver Creek, Alaska, 2019 to 2050: U.S. Geological Survey data release, accessed December 31, 2024, at http://doi.org/10.5066/P9K30VAP.
Mauger, S., 2013, Stream temperature monitoring network for Cook Inlet salmon streams 2008–2012: Cook Inletkeeper report, accessed October 23, 2024, at https://inletkeeper.org/document/stream-temperature-monitoring-network-for-cook-inlet-salmon-streams-2008-2012-synthesis-report/.
Mauger, S., Shaftel, R., Trammell, J., Geist, M., and Bogan, D., 2015, Stream temperature data collection standards for Alaska—Minimum standards to generate data useful for regional-scale analyses: Journal of Hydrology, v. 4, part B, p. 431–438, accessed October 17, 2024, at https://doi.org/10.1016/j.ejrh.2015.07.008.
Mauger, S., Shaftel, R., Leppi, J.C., and Rinella, D.J., 2017, Summer temperature regimes in southcentral Alaska streams—Watershed drivers of variation and potential implications for Pacific salmon: Canadian Journal of Fisheries and Aquatic Sciences, v. 74, no. 5, p. 702–715, accessed October 17, 2024, at https://doi.org/10.1139/cjfas-2016-0076.
Moore, R.B., McKay, L.D., Rea, A.H., Bondelid, T.R., Price, C.V., Dewald, T.G., and Johnston, C.M., 2019, User’s guide for the national hydrography dataset plus (NHDPlus) high resolution: U.S. Geological Survey Open-File Report 2019–1096, 66 p., accessed October 17, 2024, at https://doi.org/10.3133/ofr20191096.
National Oceanic and Atmospheric Administration (NOAA), 2023a, Hourly local climatological data for Station Kenai Airport, AK US GHCND: USW00026523: National Oceanic and Atmospheric Administration, accessed May 24, 2023, at https://www.ncdc.noaa.gov/cdo-web/datasets/GHCND/stations/GHCND:USW00026523/detail.
National Oceanic and Atmospheric Administration (NOAA), 2023b, Daily summaries station details for Soldotna 5 SSW, AK station GHCND: USC00508615: National Oceanic and Atmospheric Administration, accessed November 8, 2023, at https://www.ncdc.noaa.gov/cdo-web/datasets/GHCND/stations/GHCND:USC00508615/detail.
Theurer, F.D., Voos, K.A., and Miller, W.J., 1984, Instream water temperature model instream flow information paper 16: U.S. Fish and Wildlife Service FWS/OBS-85/15, accessed June 24, 2024, at https://hdl.handle.net/2027/mdp.39015086455733.
U.S. Fish and Wildlife Service, 2017, Wetlands and deepwater habitats of the United States, Version 2—Surface waters and wetlands: National Wetlands Inventory, accessed June 20, 2023, using “Get Data” tool at https://fwsprimary.wim.usgs.gov/wetlands/apps/wetlands-mapper/.
Appendix 6. Parameter Estimation and Uncertainty Analysis
Observations
Field observation data included groundwater levels (heads), streamflow, and stream temperatures (fig. 6.1). Raw field observations and model outputs were processed together to create equivalent comparisons at the 7-day model stress periods, and then were further processed into derivative observations aimed at capturing various aspects of the system.
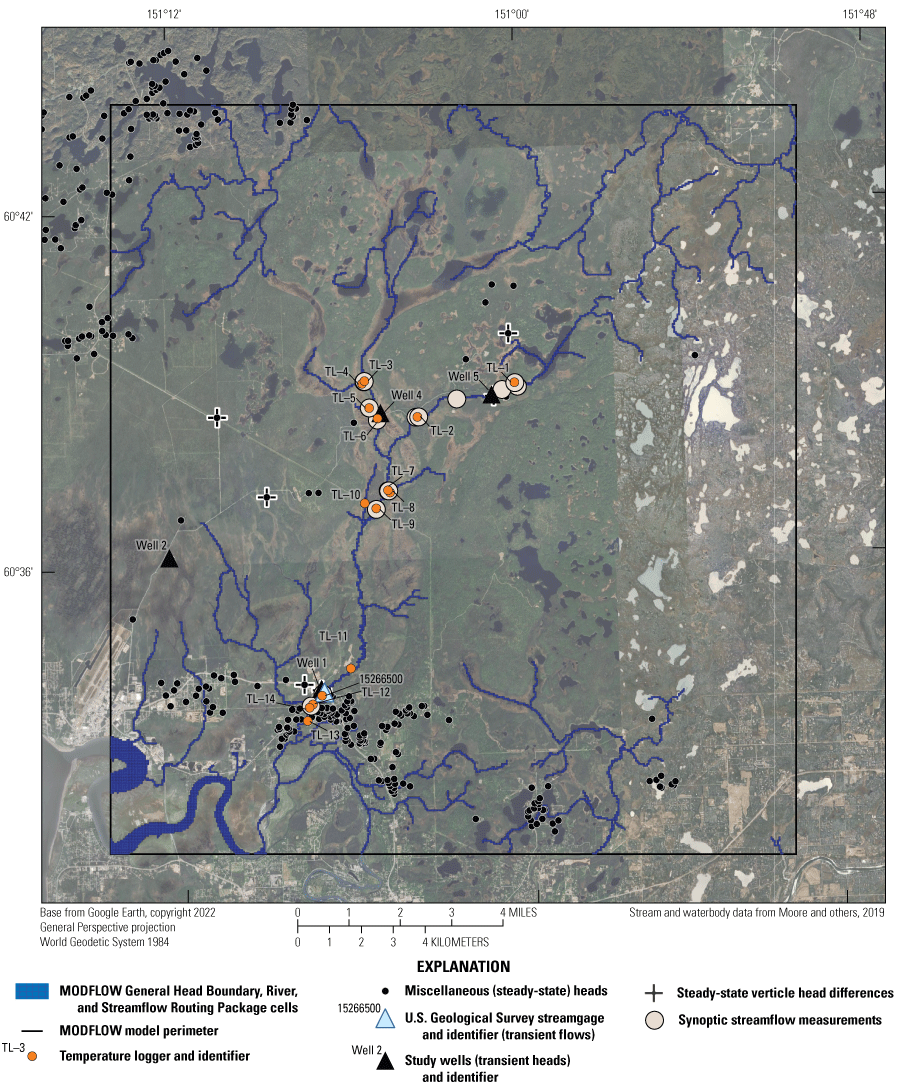
Map of groundwater flow and stream temperature model observations.
Observation Data
An observation dataset was developed from the following sources:
-
· Miscellaneous groundwater level measurements at 471 sites from the National Water Information System (NWIS; U.S. Geological Survey, 2023) between 1962 and 1999.
-
· Continuous water levels measured in wells 1, 2, 4, and 5 (installed for this study) between July 4, 2022, and September 4, 2023. Well 3 was affected by a beaver dam at Marathon Road (not reproduced in the model) and was not used. Well 4 (the deeper well at the same location) was assumed to be more representative of ambient conditions in the absence of the beaver dam.
-
· Streamflows measured at 14 sites along Beaver Creek and its tributaries on June 8, 2022, and between July 4 and July 7, 2022.
-
· Continuous streamflows measured at the Beaver Creek near Kenai, Alaska, streamgage (U.S. Geological Survey site 15266500; hereafter referred to as the “Beaver Creek streamgage”) between June 15, 2022, and September 30, 2023.
-
· Continuous stream temperatures measured at 13 sites along Beaver Creek and its tributaries between July 8, 2022, and September 30, 2023.
-
· Continuous stream temperatures measured by the Kenai Watershed Forum at site TL–12 (fig. 6.1) between June 3, 2019, and September 9, 2023.
Data collection procedures for the continuous water levels, streamflows, and stream temperatures are described in the “Field Data Collection” section of the main report.
Observation Processing
Raw observation data were preprocessed into daily (average) values in a tabular, comma separated variable (CSV) format. Within the forward model run, model output and the pre-processed field observations were processed further into equivalent values as follows:
-
· At the finest timescale, model outputs and field observations were averaged to the 7-day model stress periods.
-
· The observations for each 7-day stressed period were then further processed to develop monthly mean, mean monthly, and annual mean values that capture the system state at different timescales.
-
· Temperature observations for each model stress period were also processed into exceedance statistics measuring the number of 7-day periods in which the 18 AAC 70 Alaska Water Quality Standards (Alaska Department of Environmental Conservation, 2024) for stream temperature of 13 degrees Celsius (°C) and 15 °C were exceeded, and the longest consecutive duration of 7-day periods where those standards were exceeded each year.
-
· Transient head observations from the four study wells were also processed into displacements, where the head for the model stress period including July 4, 2022, was subtracted from each subsequent 7-day value to obtain a change relative to the initial value.
-
· Miscellaneous groundwater levels from NWIS (U.S. Geological Survey, 2023) were compared to simulated heads from the initial steady-state period.
-
· Miscellaneous streamflow measurements taken for this study were compared to the model output from the stress period containing the measurement date.
Observation Groups and Weighting
Processed observations were grouped by measurement type (head, flow, temperature), and processing category. The miscellaneous head observations were additionally subdivided into a nearfield group of observations located within the Beaver Creek watershed and a farfield group of observations located outside of the watershed. The various observation groups are described in table 6.1.
Table 6.1.
Summary of weighted field data observations used for history matching.[NWIS, National Water Information System (U.S. Geological Survey, 2023); USGS, U.S. Geological Survey; KWF, Kenai Watershed Forum; °C, degree Celsius]
Observations were assigned initial weights based on measurement uncertainty and an estimated ability of the model to fit the observations. Initial weighting based on uncertainty was computed following the methods of Hunt and others (2013). The model was then run using PEST++, and an objective function consisting of the sum of squared, weighted residuals was computed. The contribution of each observation group to the objective function was evaluated and adjusted if needed by multiplying the weights in each group to achieve a desired balance in the objective function that would convey the important aspects of the system to the parameter estimation algorithm (Doherty and Hunt, 2010, p. 12). Observation weights, and the workflows for preprocessing and processing the observations are available in the companion data release (Leaf and others, 2024). To avoid overfitting and collapse in the diversity of parameter estimates during the iterative iES process, observation noise was assigned. Observations for each ensemble member were drawn from a normal distribution with a mean of the observation value and standard deviation of the estimated uncertainty (White, 2018; Leaf and others, 2024).
Parametrization
Parameters were assigned to the MODFLOW and SNTEMP models to allow for systematic adjustment of model inputs at different scales. A basic description of the input parameter types is provided in table 6.2; additional description including starting and ending values and bounds is provided in the companion data release (Leaf and others, 2024).
MODFLOW inputs that were parametrized included aquifer storage and hydraulic conductivity properties and conductance inputs that control groundwater/surface-water interactions at boundaries such as Beaver Creek and the Kenai River. SNTEMP inputs that were parametrized included lateral inflow temperatures, headwater inflow temperatures, shading percentages, and stream width. Manning’s n (roughness coefficient) was fixed at the global value of 0.037 used for the MODFLOW Streamflow Routing (SFR) Package (for example, Leaf, 2023) because it is only used by SNTEMP to estimate heat flux from fluid friction, which is typically insignificant, especially in warmer months in low-gradient systems (Theurer and others, 1984). Stream width was included because it dictates the surface area across which most heat fluxes occur (Bartholow, 2000). Parameterizing widths reflects uncertainty from natural variability in the channel width, which is often ill-defined, especially in marshy upstream areas where channel water may mix with warmer stagnant or slow-moving water in adjacent wetlands.
Table 6.2.
Summary of model parameters adjusted by PEST++ during history matching.[SFR, Streamflow Routing; SWB, soil-water-balance; SNTEMP, Stream Network Temperature; GHB, General Head Boundary; RIV, River]
| Parameter group name | Description |
|---|---|
| sfrkv-mult-zone | Multipliers on the vertical hydraulic conductivity of the SFR Package reaches, for NHDPlus lines, which generally correspond to sections of stream between headwaters, confluences, and the outlet. |
| sfrrunoff-mult-const | Global multiplier (for all SFR Package reaches and stress periods) on SWB runoff that is routed to the stream. |
| kvani_pp_layer{x} | Pilot points for the vertical anisotropy for model layer x, where x is model layers 1, 2, 3, or 4. |
| k_pp_layer{x} | Pilot points for the horizontal hydraulic conductivity for model layer x, where x is model layers 1, 2, 3, or 4. |
| ss_pp_layer{x} | Pilot points for the specific storage for model layer x, where layer x is model layers 1 or 2. |
| sy_pp_layer0 | Pilot points for the specific yield for model layer 1. |
| sntemp-width | Channel widths for SNTEMP nodes representing the start and end of tributaries and portions of the main stem between tributaries (H, T, B, J, and E nodes). |
| {property}-direct-zone | {k, horizontal hydraulic conductivity; kvani, vertical anisotropy; ss, specific storage; and sy, specific yield} spatially homogenous absolute values for the aquifer property zones listed in table 6.3. Multiplier parameters for pilot points are applied on top of these values to allow for heterogeneity within zones. |
| hw-window-days | Number of prior days incorporated in rolling average of air temperatures applied to inflows at nonzero flow H nodes. |
| hw-offset-c | Scaler to offset the average of previous air temperatures applied to inflows at nonzero flow H nodes. |
| shade-max | Growing season shade for each SNTEMP vegetation zone (see “Shading” section of this appendix for zone descriptions), as a decimal. |
| ghbcond-mult-constant | Multiplier on the GHB Package conductance for the tidally influenced part of the Kenai River. |
| gw-eff-depth | Effective depth from which the discharging groundwater is coming, in meters. This is used to estimate the groundwater inflow water temperature for SNTEMP. |
| recharge-mult-constant | Global multiplier (for all values and stress periods) on SWB net infiltration. |
| rivcond-mult-constant | Multiplier on the RIV Package conductance for the Kenai River upstream from Beaver Creek outlet. |
Aquifer Properties
Parameters to adjust aquifer property inputs at two scales were set up using the automated parametrization routines in the pyEMU PstFrom module (White and others, 2021). At the coarsest level, piecewise-constant, “direct” or absolute values of horizontal hydraulic conductivity (Kh), hydraulic conductivity vertical anisotropy (Kvani), specific yield (Sy), and specific storage (Ss) were estimated for zones corresponding to the units described in the “Hydrostratigraphic Units and Aquifer Properties” section in the main report, in each layer (tables 6.3 and 6.2).
Table 6.3.
Description of model aquifer property zone numbers.Use of the zone-based parameters allowed mean aquifer property values to be estimated by unit and for the estimated means to vary by model layer. Within each layer, a uniform network of pilot point (Doherty, 2003) multiplier parameters spaced every 1 kilometer (20 cells) allowed for more local-scale adjustment of aquifer property values within each unit and layer. Multiplier values were estimated for each pilot point (starting with an initial value of 1); kriging was then used within the model forward run to interpolate multiplier values between the pilot points to each model cell. The resulting array of multipliers was then applied to the array of aquifer property estimates from the direct zone parameters to produce a composite array of aquifer property estimates in each cell. To account for spatial correlation in aquifer properties, pilot point parameter values were drawn from a prior spatial covariance matrix, using an exponential variogram with a range of three pilot point spacings (for example, White and others, 2021; Leaf and others, 2024182). To avoid unreasonable parameter values, “ultimate” upper and lower bounds were set for each property type; any resulting property values outside of these bounds were reset to the bound value (for example, White and others, 2021). Hydraulic conductivity vertical anisotropy estimates were converted to vertical hydraulic conductivity input to MODFLOW using a custom python script within the forward model run workflow (Leaf and others, 2024).
Boundary Conditions
Boundary condition input to the groundwater flow model was generally parametrized by assigning global multipliers to the MODFLOW package input, except for SFR Package streambed vertical hydraulic conductivities that were parametrized by NHDPlusID, which generally encompasses a section of stream between a confluence, headwater, or outlet. Recharge, General Head Boundary cell conductances (representing groundwater interactions with the Kenai River Estuary), and River cell conductances (representing groundwater interactions with the Kenai River) were all parametrized using the PstFrom routines in pyEMU. Nontabular input structures in the SFR Package required custom python code for the setup and forward run application of the multiplier parameters for streambed vertical hydraulic conductivity and a global multiplier for surface runoff (Leaf and others, 2024).
Groundwater Temperature
As noted in the “Conceptual Model” section in the main report, the temperature of discharging groundwater can be an important factor in determining stream temperature. Conceptually, the sensitivity of groundwater discharge temperature to changes in land surface temperature can be represented by an “effective depth” parameter that integrates the depths of the various flowpaths contributing discharge to the stream (with greater depths experiencing more lagged and dampened changes in temperature compared to the land surface; Kurylyk and others, 2015). A key question for the future sustainability of salmon habitat in Beaver Creek is the extent to which base flow is dominated by groundwater and the sensitivity of groundwater temperature to future changes in air temperature. The latter part of this question was addressed by creating an effective groundwater depth parameter. An effective depth (zeff) was estimated by PEST++, and then a time series of groundwater discharge temperatures (for all of Beaver Creek and its tributaries) was developed within the forward model run based on the assumption that groundwater temperatures reflect an average temperature condition at the land surface plus a sinusoidal seasonal fluctuation that decreases in amplitude exponentially with depth and is lagged by a time that increases linearly with depth (for example, Suzuki, 1960; Kurylyk and others, 2015). An average air temperature condition () was developed from recorded temperatures at the Kenai airport weather station (National Oceanic and Atmospheric Administration [NOAA], 2023a), by applying a 365-day centered rolling window to remove seasonal variability:
whereTm
is the (rolling) average temperature,
k
is the number of days on either side of the window center (182 days for a 365-day window),
j
is the index position of each measurement x being included in the average (ranging from -182 to +182 days in this case), and
t
is the time (day) at the center of the window.
A second time series of smoothed air temperatures with daily and weekly variability removed was then created by applying a 30-day centered rolling window to the Kenai airport weather station temperatures. In both cases, the rolling method in the Pandas Python package (Pandas Development Team, 2024) was used to compute the rolling windows. Note that for even numbered window sizes, equation 1 can be computed on either side of the window center and the results averaged. A time series of smoothed seasonal temperature deviations from the mean (Tdev) was then developed by subtracting the 365-day rolling mean from the smoothed (30-day rolling mean) air temperatures. From the effective groundwater depth estimate, values for the lag time (lag(days)) and the exponential dampening factor (; dimensionless) were computed (based on Kurylyk and others, 2015):
whereL
is the additional time lag per meter of depth, in days per meter;
zeff
is effective depth; and
d
is the rate of exponential decay of temperature amplitude with depth, in meters-1.
The L and d terms were determined experimentally by comparing the Kenai airport weather station temperatures to groundwater temperatures measured in the study wells. For example, in well 4, which is screened at a depth of 4.3 meters, groundwater temperatures lagged air temperatures by about 170 days (L=40 days per meter) and had an amplitude () of about 3 percent of the air temperatures (d=0.8 per meter).
Finally, an offset term Tgw_offset is needed to account for the insulating effects of snow (for example, Zhang, 2005; Kurylyk and others, 2015). An offset of 1.9 °C was estimated from comparison of temperatures in well 4, which averaged 4.2 °C, and the mean air temperature from 2010 to 2023, which averaged 2.3 °C.
Putting this together, a time series of estimated groundwater temperatures () can be computed for any time (t) greater than lag(days):
The estimated groundwater temperatures, and corresponding air temperatures assumed to represent surface runoff temperatures, were averaged to the 7-day model stress periods and then combined by way of flow-weighted averaging to develop lateral inflow temperatures to SNTEMP (appendix 5).
This approach is limited in that only shallow groundwater depths (of a few meters) with subannual lag times can be estimated. Evaluation of groundwater thermal sensitivity at decadal timescales would require multidecadal datasets of stream temperature and groundwater temperature. To address this limitation, history matching was also performed on a second end-member simulation where groundwater temperature was assumed to be fixed at the observed 4.2-°C average temperature. Similar to other SNTEMP parameters, effective groundwater depth was included in the formal parameter estimation by way of tabular input to the PstFrom feature in pyEMU.
Headwater Inflow Temperatures
The SNTEMP model contains numerous headwater nodes where instream flows into the stream network at specified temperatures may be assumed (fig. 5.1). Most of the headwater nodes coincide with headwater reaches in the MODFLOW model SFR package and therefore have no inflows. Headwater nodes at or near the outlets of Beaver, Ootka, Ermine, and Tern Lakes coincide with MODFLOW SFR Package reaches that are downstream from the headwaters. In these nodes, headwater inflows were assigned from instream inflows computed by the MODFLOW simulation. In the MODFLOW simulation, Beaver, Ootka, Ermine, and Tern Lakes were represented by their NHDPlus flowlines (linear features that run down the center of the lake, connecting it to the stream network); instream flows at these headwater points represent groundwater discharge and surface runoff to these lakes that ultimately flow downstream.
Beaver Lake has a clearly defined outlet with appreciable flow; flow from the remaining lakes may enter the stream network after passing slowly through wetlands with no defined channel. Inflow temperatures at these headwaters may therefore reflect an average temperature condition during some time period, as well as additional warming from solar radiation. To incorporate this into the model, a rolling average of the previous k days plus an offset term (Toffset) to account for warming from solar radiation was used:
whereThw_inflow
is the estimated headwater inflow temperature.
j
is the index position of each measurement x being included in the average (ranging from 0 to k days), and
t
is the time (day) for the average (at the right side of the window).
For each headwater, the rolling window size (k) and temperature offset (Toffset) were included in the formal parameter estimation using tabular input to the PstFrom feature in pyEMU to facilitate automated setup of the parametrization. At site TL–2 near the Beaver Lake outlet (fig. 10 in main report), a window size of about 5 days and temperature offset of about 2 °C produced a good match to observed temperatures (see the “History Matching Results” section).
Shading
Minimum and maximum shading parameters were developed for the direct shading input to SNTEMP for each of the four wetland types listed in table 4 in the main report. Maximum shading (representing peak growing season conditions) parameter upper bounds were based on densiometer values measured in the field plus a 10-percent buffer to account for unmeasured conditions and potential bias in the densiometer method, which estimates overhead shading and not angled sunlight paths through vegetation and various hours (Bartholow, 1989). Maximum shading lower bounds were set to 0. Initial values for maximum shading were based on averages of field densiometer measurements for the various communities and the results of initial history matching model runs. Minimum shading (representing nongrowing season conditions) was fixed at 0. This assumption was considered appropriate given the generally unshaded condition of Beaver Creek and the focus on the growing season peak when stream temperatures are warmest. Additional discussion about shading input to SNTEMP is available in appendix 5.
Shading information was listed in a model input file by stream reach and wetland type and input to the PstFrom routine in pyEMU to facilitate automated setup of the parametrization.
Stream Channel Width
Stream channel width input to SNTEMP was parametrized by stream name, which encompasses each group of reaches between a confluence, headwater, or the outlet in this report. Initial widths based on satellite imagery and the potential for mixing with slow or stagnant riparian water were entered manually to the same table used for shading information and then input to PstFrom. Multiplier parameters were assigned to each stream name and allowed to vary during parameter estimation between 0.5 and 2.0 (from an initial value of 1).
History Matching
Following manual trial-and-error runs, history matching with the iES followed an iterative, stepwise approach in which the iES was run; the results were evaluated by assessing if the solution was hydrologically reasonable and what observations had the greatest misfit between the measured and modeled values; and then the model structure, parametrization, observations, or observation weighting were adjusted (often with additional trial-and-error runs) in response to the results. In particular, much of the history matching effort focused on improving the model fit to poorly matched streamflows at the Beaver Creek streamgage, which ultimately led to the discovery of erroneous precipitation records from the Kenai airport weather station (NOAA, 2023a) and substitution of Soldotna weather station precipitation data (NOAA, 2023b; refer to “Climate” section in in main report). The trajectory of ensemble member objective function values in the final iES run are shown in figure 6.2. A “base” member, which starts with the specified initial parameter values and is typically considered to be the most representative member when a single realization is desired, is also shown in figure 6.2 (White and others, 2020). The second iteration was selected as the definitive ensemble because it had a base realization with a low objective function (phi) value (good fit to observations) and appreciable spread (representation of model uncertainty) in the ensemble objective function values. Subsequent realizations with narrower spreads in ensemble phi may be overfit.
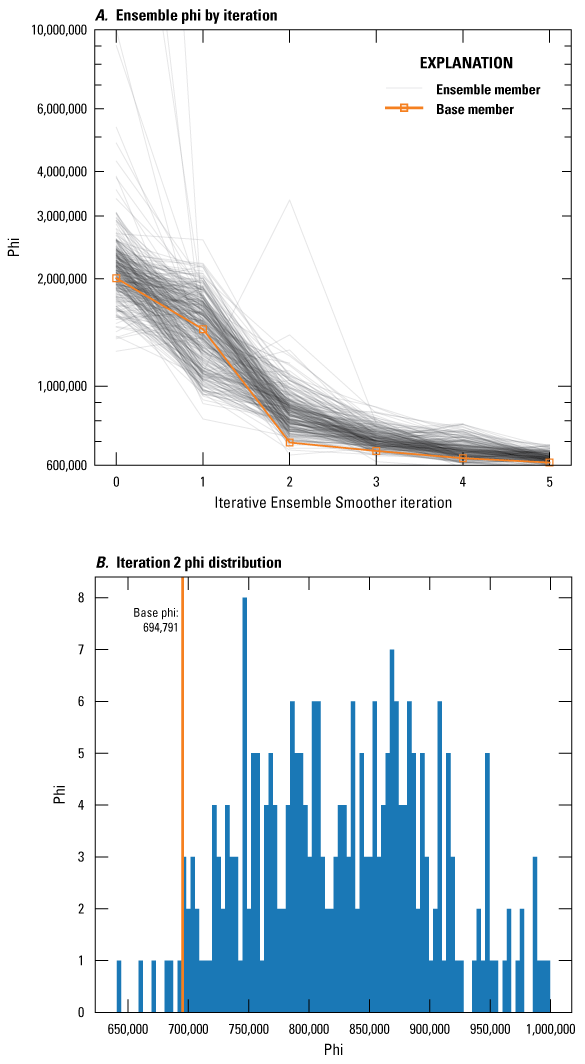
Summary of objective function trajectory and variability. A, Ensemble phi by iteration. B, Iteration 2 phi distribution.
History Matching Results
A comparison of model outputs to equivalent field observations is shown in figure 6.3. Poor fit to some of the miscellaneous heads (including the vertical head gradients) may be due to high levels of uncertainty in well construction reports, as well as limited understanding of subsurface heterogeneity and the presence of vertical hydraulic gradients that cannot be reproduced well with the relatively coarse model layering. Time series of ensemble output for heads at the four study wells and temperatures at the instream sites compared to average observed values for the 7-day model periods are shown in figures 6.4 and 6.5. Results for streamflow at the Beaver Creek streamgage and temperature at TL–12, the Kenai Watershed Forum long-term monitoring site (fig. 11 in main report), are shown in figures 17 and 18 in the main report. The spread of ensemble values provides a sense of how uncertainty in the parameter values (conditioned on the observation data through history matching) affects uncertainty in the model outputs.
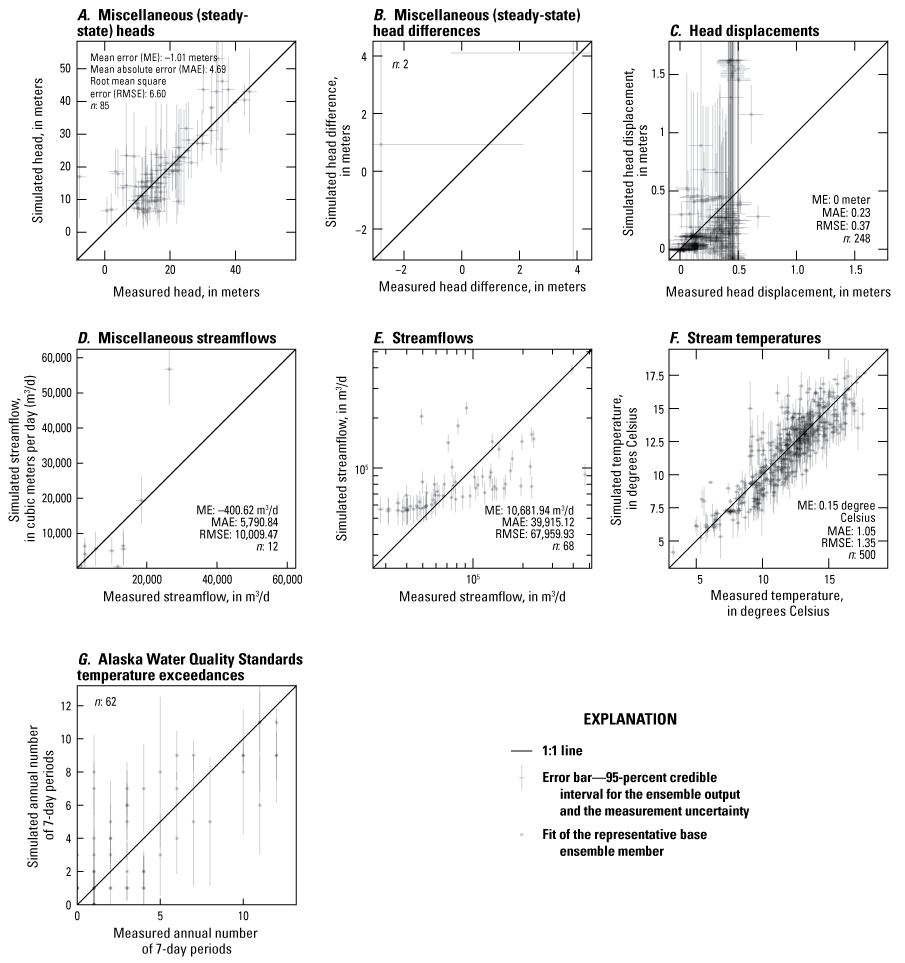
One-to-one comparison of model outputs to equivalent field observations.
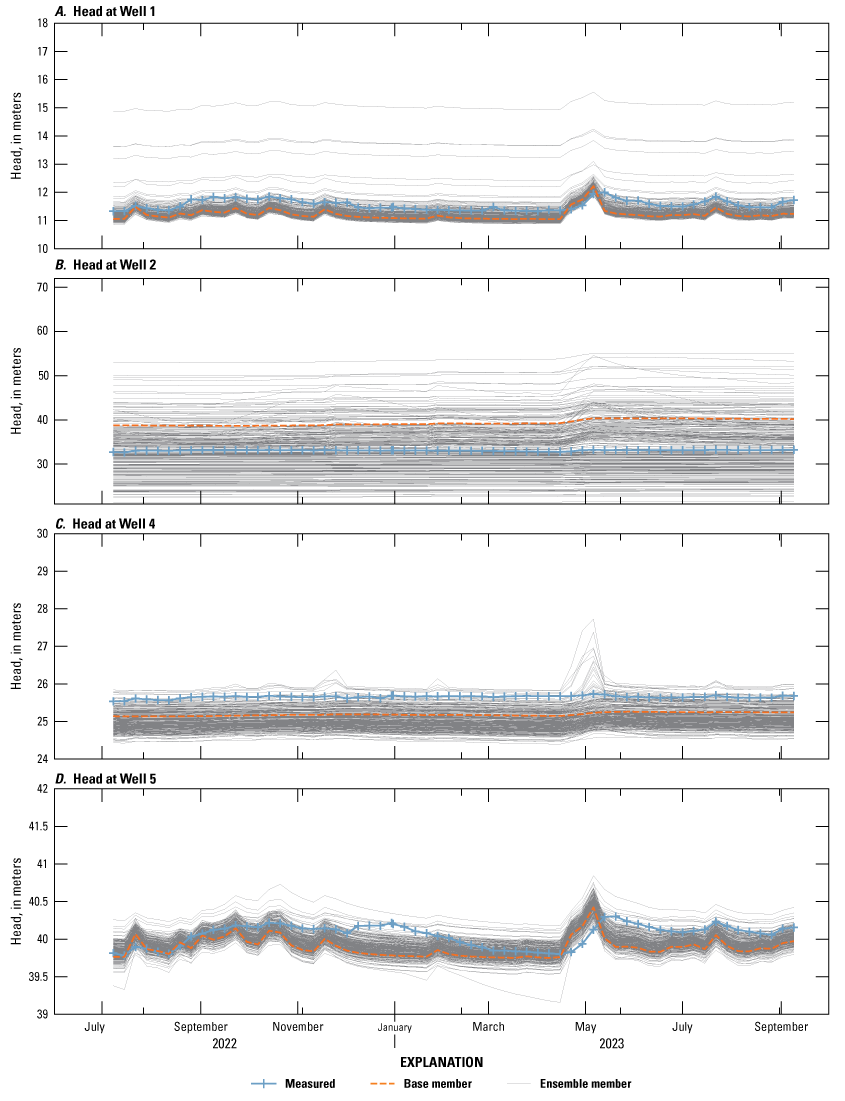
Time series of simulated heads and average observed head for each model stress period.
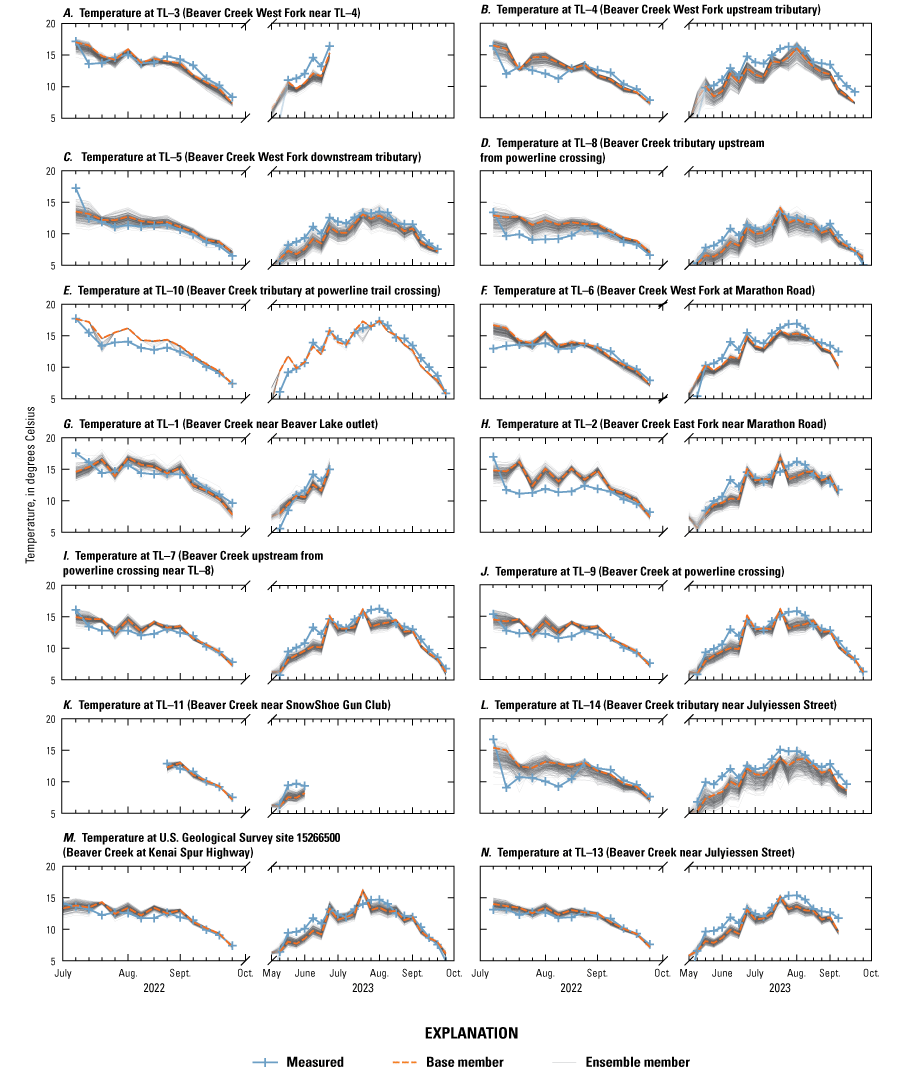
Time series of simulated stream temperatures and observed stream temperatures for each model stress period, in approximate upstream to downstream order.
Parameter Estimation Results for Base Realization
This section describes parameter estimation results for the base realization that was used for the future climate scenarios. Full details of the parameter estimation results, including maps of aquifer property estimates for the base realization, are available in the associated data release (Leaf and others, 2024).
Aquifer Properties
Aquifer property estimates are summarized in table 6.4. Few data exist about hydraulic conductivities in the quaternary deposits beneath Beaver Creek, and the previous measurements summarized in table 5 (in the main report) are not necessarily comparable to groundwater model inputs owing to differences of scale and inherent uncertainties in ex-situ measurement techniques that disturb the original pore structure. The results in table 6.4 are mostly consistent with literature values for heterogeneous unconsolidated deposits (for example, Schwartz and Zhang, 2003). Extreme values at the “ultimate” upper or lower bounds for a given unit may indicate misspecification of the unit in those areas; for example, high hydraulic conductivity estimates within the upper aquitard zone may indicate the absence of the aquitard in those areas.
Table 6.4.
Summary of aquifer property estimates for the base realization.[—Left][Kh, horizontal hydraulic conductivity; m/day, meter per day; Min, minimum; Max, maximum; Sy, specific yield; Ss, specific storage]
Groundwater Effective Depth
The effective groundwater depth for the base realization was estimated to be 1.6 meters. Using values of L=40 days per meter and d=0.8 per meter (refer to the “Parametrization” section) would correspond to a thermal response in groundwater discharge that is on average lagged 64 days behind land surface temperatures and dampened 72 percent. Although this result was mostly consistent across many parameter estimation runs, another experimental run with groundwater temperature fixed at the 4.2 °C observed in well 4 (implying a large effective depth) produced similar history matching results, which indicates that the history matching dataset does not have enough information to constrain groundwater thermal sensitivity.
Groundwater Recharge and Runoff Multipliers
Global multipliers of 0.61 and 1.7 were estimated for recharge and surface runoff, indicating less net infiltration and more surface runoff compared to the Soil Water Balance Simulation. This result was also consistent across many parameter estimation runs and may reflect infiltration being limited by shallow water table conditions in many areas—a process not accounted for in the Soil Water Balance simulation.
References Cited
Alaska Department of Environmental Conservation, 2024, 18 AAC 70 Water Quality Standards, Amended as of April 26, 2024: Alaska Department of Environmental Conservation, 73 p., accessed June 24, 2024, at https://dec.alaska.gov/media/eovgrgs5/18-aac-70.pdf.
Bartholow, J.M., 1989: Stream temperature investigations—Field and analytic methods: Instream Flow Information Paper No. 13, U.S. Department of the Interior Fish and Wildlife Service Biological Report 89(17), 139 p., accessed May 8, 2023, at http://www.krisweb.com/biblio/gen_usfws_bartholow_1989_br8917.pdf.
Bartholow, J.M., 2000, The stream segment and stream network temperature models: A self-study course: U.S. Geological Survey Open-File Report 99-112, 282p., accessed October 23, 2024, at https://doi.org/10.3133/ofr99112.
Corson-Dosch, N.T., Fienen, M.N., Finkelstein, J.S., Leaf, A.T., White, J.T., Woda, J., and Williams, J.H., 2022, Areas contributing recharge to priority wells in valley-fill aquifers in the Neversink River and Rondout Creek drainage basins, New York: U.S. Geological Survey Scientific Investigations Report 2021–5112, 50 p., accessed October 17, 2024, at https://doi.org/10.3133/sir20215112.
Doherty, J., 2003, Ground water model calibration using pilot points and regularization: Groundwater, v. 41, no. 2, p. 170–177, accessed October 17, 2024, at https://doi.org/10.1111/j.1745-6584.2003.tb02580.x.
Doherty, J.E., and Hunt, R.J., 2010, Approaches to highly parameterized inversion—A guide to using PEST for groundwater model calibration: U.S. Geological Survey Scientific Investigations Report 2010–5169, 59 p., accessed October 17, 2024, at https://doi.org/10.3133/sir20105169.
Hunt, R.J., Walker, J.F., Selbig, W.R., Westenbroek, S.M., and Regan, R.S., 2013, Simulation of climate-change effects on streamflow, lake water budgets, and stream temperature using GSFLOW and SNTEMP, Trout Lake Watershed, Wisconsin: U.S. Geological Survey Scientific Investigations Report 2013–5159, 118 p., accessed October 17, 2024, at https://doi.org/10.3133/sir20135159.
Kurylyk, B.L., MacQuarrie, K.T.B., Caissie, D., and McKenzie, J.M., 2015, Shallow groundwater thermal sensitivity to climate change and land cover disturbances—Derivation of analytical expressions and implications for stream temperature modeling: Hydrology and Earth System Sciences, v. 19, no. 5, p. 2469–2489, accessed October 17, 2024, at https://doi.org/10.5194/hess-19-2469-2015.
Leaf, A.T., 2023, Automated construction of Streamflow-Routing networks for MODFLOW—Application in the Mississippi Embayment region: U.S. Geological Survey Scientific Investigations Report 2023–5051, 27 p., ., accessed October 17, 2024, at https://doi.org/10.3133/sir20235051.
Leaf, A.T., Duncan, L.L., Haugh, C.J., Hunt, R.J., and Rigby, J.R., 2023, Simulating groundwater flow in the Mississippi Alluvial Plain with a focus on the Mississippi Delta: U.S. Geological Survey Scientific Investigations Report 2023–5100, 143 p., accessed October 17, 2024, at https://doi.org/10.3133/sir20235100.
Leaf, A.T., Haserodt, M.J., and Westenbroek, S.M., 2024, Soil water balance, groundwater flow, and stream temperature models for Beaver Creek, Alaska, 2019 to 2050: U.S. Geological Survey data release, accessed December 31, 2024, at http://doi.org/10.5066/P9K30VAP.
National Oceanic and Atmospheric Administration (NOAA), 2023a, Daily summaries station details for Kenai Airport, AK station GHCND:USW00026523: National Oceanic and Atmospheric Administration, accessed October 10, 2023, at https://www.ncdc.noaa.gov/cdo-web/datasets/GHCND/stations/GHCND:USW00026523/detail.
National Oceanic and Atmospheric Administration (NOAA), 2023b, Daily summaries station details for Soldotna 5 SSW, AK station GHCND: USC00508615: National Oceanic and Atmospheric Administration, accessed November 8, 2023, at https://www.ncdc.noaa.gov/cdo-web/datasets/GHCND/stations/GHCND:USC00508615/detail.
Suzuki, S., 1960, Percolation measurements based on heat flow through soil with special reference to paddy fields: Journal of Geophysical Research, v. 65, no. 9, p. 2883–2885, accessed October 17, 2024, at https://doi.org/10.1029/JZ065i009p02883.
Pandas Development Team, 2024, pandas-dev/pandas: Pandas (v2.2.2): Zenodo, accessed October 17, 2024, at https://doi.org/10.5281/zenodo.10957263.
Theurer, F.D., Voos, K.A., and Miller, W.J., 1984, Instream water temperature model instream flow information paper 16: U.S. Fish and Wildlife Service FWS/OBS-85/15, accessed June 24, 2024, at https://hdl.handle.net/2027/mdp.39015086455733.
U.S. Geological Survey (USGS), 2023, USGS water data for the Nation: U.S. Geological Survey National Water Information System database, accessed October 17, 2024, at https://doi.org/10.5066/F7P55KJN.
White, J.T., 2018, A model-independent iterative ensemble smoother for efficient history-matching and uncertainty quantification in very high dimensions: Environmental Modelling & Software, v. 109, p. 191–201, accessed October 17, 2024, at https://doi.org/10.1016/j.envsoft.2018.06.009.
White, J.T., Fienen, M.N., and Doherty, J.E., 2016, A python framework for environmental model uncertainty analysis: Environmental Modelling & Software, v. 85, p. 217–228, accessed October 17, 2024, at https://doi.org/10.1016/j.envsoft.2016.08.017.
White, J.T., Hemmings, B., Fienen, M.N., and Knowling, M.J., 2021, Towards improved environmental modeling outcomes—Enabling low-cost access to high-dimensional, geostatistical- based decision-support analyses: Environmental Modelling & Software, v. 139, art. 105022, 9 p., accessed October 17, 2024, at https://doi.org/10.1016/j.envsoft.2021.105022
White, J.T., Hunt, R.J., Fienen, M.N., and Doherty, J.E., 2020, Approaches to highly parameterized inversion—PEST++ Version 5, a software suite for parameter estimation, uncertainty analysis, management optimization and sensitivity analysis: U.S. Geological Survey Techniques and Methods, book 7, chap. C26, 52 p., accessed October 17, 2024, at https://doi.org/10.3133/tm7C26
Zhang, T.J., 2005, Influence of the seasonal snow cover on the ground thermal regime—An overview: Reviews of Geophysics, v. 43, no. 4, RG4002, accessed October 17, 2024, at https://doi.org/10.1029/2004RG000157.
Appendix 7. Future Climate Scenarios
Table 7.1.
Summary of future scenarios.[RCP, relative concentration pathway; CCSM, Community Climate System Model; RCP, Representative Concentration Pathway; GFDL, Geophysical Fluid Dynamics Laboratory; SNAP, Scenarios Network for Alaska and Arctic Planning]
| Scenario name | Climate Data source | Emissions scenario | Groundwater thermal sensitivity | Water use |
|---|---|---|---|---|
| ccsm4 | Daily downscaled results from the NCAR–CCSM4 model (National Center for Atmospheric Research CCSM, version 4) | RCP 8.5 | High (shallow groundwater) | Historical (2020–22) |
| ccsm4-pop-growth | High (shallow groundwater) | Increased by 0.44 percent each year after 2023 | ||
| ccsm4-steady-gwtemp | Low (deep groundwater) | Historical (2020–22) | ||
| gfdl3 | Daily downscaled results from the GFDL–CM3 model (GFDL Climate Model, version 3) | RCP 8.5 | High (shallow groundwater) | Historical (2020–22) |
| gfdl3-steady-gwtemp | Low (deep groundwater) | Historical (2020–22) | ||
| snap-mean-45 | Repeated historical (October 1, 2014–September 30, 2023) climate data with monthly temperature increases based on SNAP community projections (which average the CCSM4, GFDL–CM3, GISS–E2–R, IPSL–CM5A–LR, and MRI–CGCM3 models; Walsh and others, 2018) | RCP 4.5 | High (shallow groundwater) | Historical (2020–22) |
| snap-mean-45-steady-gwtemp | Low (deep groundwater) | Historical (2020–22) | ||
| snap-mean-60 | RCP 6.0 | High (shallow groundwater) | Historical (2020–22) | |
| snap-mean-60-steady-gwtemp | Low (deep groundwater) | Historical (2020–22) | ||
| snap-mean | RCP 8.5 | High (shallow groundwater) | Historical (2020–22) | |
| snap-mean-steady-gwtemp | Low (deep groundwater) | Historical (2020–22) |
Future Climate Forcings
Daily climate inputs were developed from the SNAP downscaled climate projections (Bieniek and others, 2016; SNAP, 2022). SNAP provides daily downscaled projections at a 20-kilometer spatial resolution for two general circulation models (GCMs; for example, Flato and others, 2013): the Geophysical Fluid Dynamics Laboratory (GFDL) GFDL–CM3 model, and National Center for Atmospheric Research (NCAR) NCAR-CCSM4 model. Both sets of daily downscaled data simulate the Representative Concentration Pathway (RCP) 8.5 scenario, which assumes high emissions (Moss and others, 2010; Intergovernmental Panel on Climate Change, 2014). Additional projections of period-average monthly temperature and precipitation for 2030–39, 2060–69, and 2090–99 are available by community for the RCP 4.5, 6.0, and 8.5 scenarios (SNAP, 2023). All downscaled climate information used in this study is based on the Coupled Model Intercomparison Project 5 (CMIP5) versions of the source GCMs.
Given inherent uncertainty about the future climate and differences across GCMs that may constitute bias or make individual models more or less suitable for particular area, an ensemble approach to future climate projections in hydrologic models has often been taken (for example, Hunt and others, 2013; Leaf and others, 2023). More recently, some have advocated for careful selection of GCMs that best suit a particular area based on reproduction of known dynamics and historical measurements (for example, Saravanan, 2023). In this report, we used both sets of available downscaled daily projections (from GFDL–CM3 and NCAR-CCSM4) and added additional scenarios based on historical time series of climate variables with linear increases in temperature added to the historical temperatures based on the 2030–39 to 2060–69 monthly temperature changes projected in the SNAP community charts for Kenai, Alaska (SNAP, 2023; for example, Bieniek and others, 2016; Hunt and others, 2016). The SNAP community projections average results from five GCMs for the RCP 4.5, 6.0 and 8.5 scenarios (Walsh and others, 2018). The applied monthly temperature changes ranged from 1.4 degrees Celsius (°C) in the spring and fall to as much as 2.5 °C in the winter months.
Development of Precipitation and Temperature Inputs
Data were queried at the Kenai airport weather station (National Oceanic and Atmospheric Administration [NOAA]; NOAA, 2023a) latitude and longitude to maintain a single station input configuration for SWB. Comparison of the downscaled daily SNAP data with Kenai airport and Soldotna (NOAA, 2023b) weather station records for 2010–23 revealed a wet bias in annual precipitation for the NCAR–CCSM4 and GFDL–CM3 climate models (fig. 7.1). Bieniek and others (2016) also observed a wet bias in the SNAP downscaled data for Alaska, especially in areas of higher precipitation gradients such as the Kenai Mountain rain shadow that includes Beaver Creek. The wet bias in the downscaled SNAP projections was consistent throughout the decade from 2010 to 2019 (fig. 7.2). The 2010–19 period was used to estimate a precipitation correction factor of 1.7 for the GFDL–CM3 precipitation and 1.9 for the NCAR–CCSM4 precipitation. The GCM-based precipitation used for the SWB model was divided by this correction factor to remove the wet bias. If wet bias had not been corrected, it would have resulted in a simulated 100-percent increase in the base flow in Beaver Creek, which would confound any analysis of future stream temperatures.
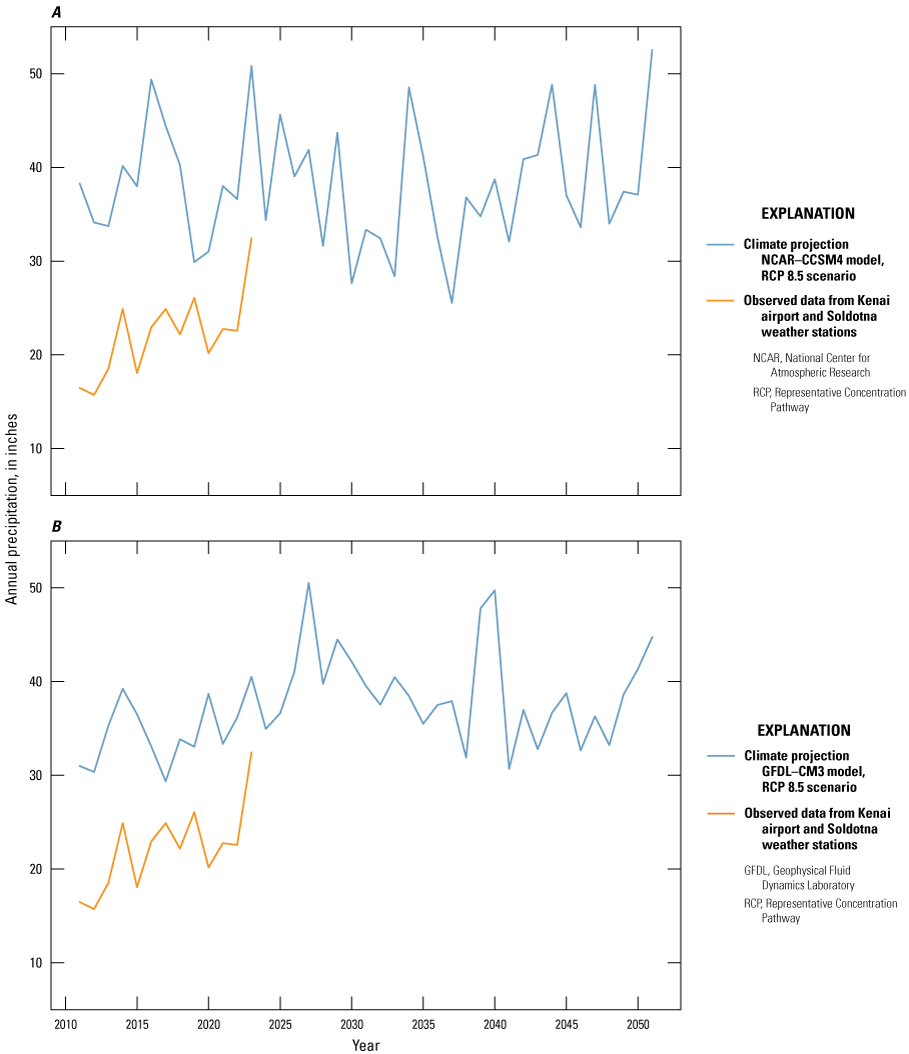
Comparison of 2010–22 annual precipitation measured at the Kenai airport and Soldotna weather stations (National Oceanic and Atmospheric Administration [NOAA], 2023a, b) with 2010–50 projected annual precipitation. A, NCAR–CCSM4 projected annual precipitation. B, GFDL–CM3 projected annual precipitation.
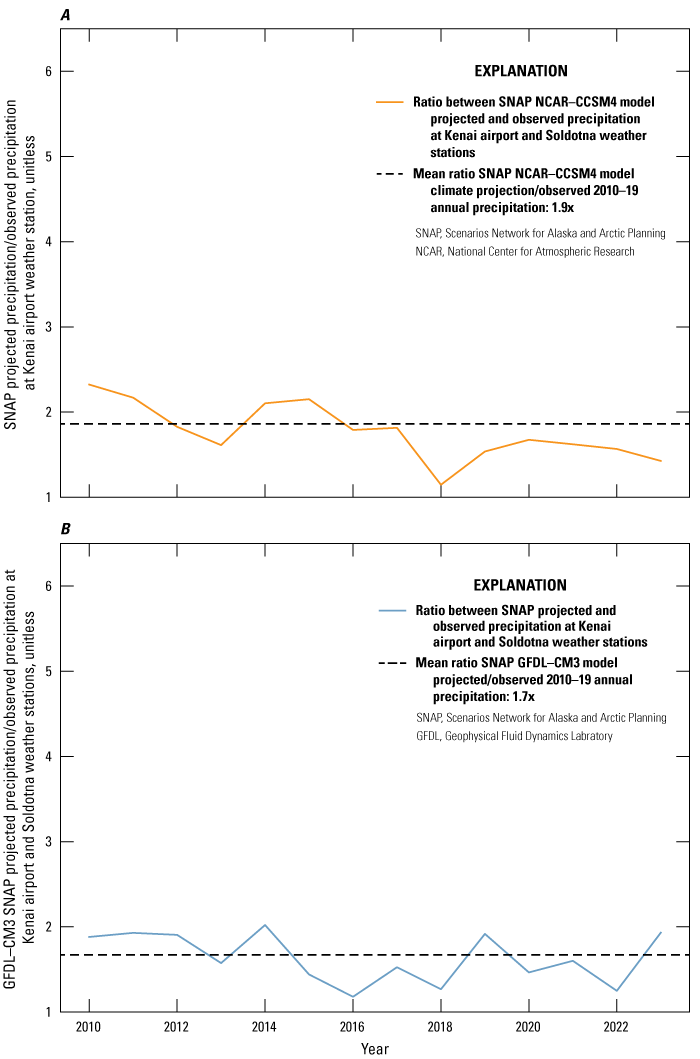
Ratios of projected to measured annual precipitation A, NCAR–CCSM4 projected annual precipitation vs measured precipitation at the Kenai airport and Soldotna weather stations (National Oceanic and Atmospheric Administration [NOAA], 2023a, b). B, GFDL–CM3 projected annual precipitation vs measured precipitation at the Kenai airport and Soldotna weather stations (2023a, b)
Comparison of the downscaled daily SNAP data with Kenai and Soldotna airport weather station records for 2010–23 also revealed a bias and lack of seasonality in the frequency of precipitation events (fig. 7.3). Overall, precipitation is more frequent in the SNAP projections, and the frequency of events is uniformly distributed throughout the year. In reality, precipitation is most frequent in late summer and early fall, and least frequent in the mid to late winter (fig. 7.3). “Undercatch,” where weather stations record less than actual precipitation, especially for small events (for example, Yang and others, 1998) could account for some of this discrepancy. Regardless, an unrealistically high frequency of smaller precipitation events could affect simulated net infiltration by reducing the portion of water that runs off during more intense rain events (thereby increasing net infiltration) or by increasing the portion of water that is lost to leaf interception and evapotranspiration (which would reduce net infiltration). We considered substituting observed storm events from 2010 to 2020 for the future climate periods but concluded that doing so would unrealistically decouple the precipitation from other correlated climate variables used in SNTEMP, including relative humidity and cloud cover (appendix 5), with unknown implications for the projected stream temperatures. Therefore, the storm distribution in the SNAP data was accepted as a model limitation of using this product for the future climate scenarios.
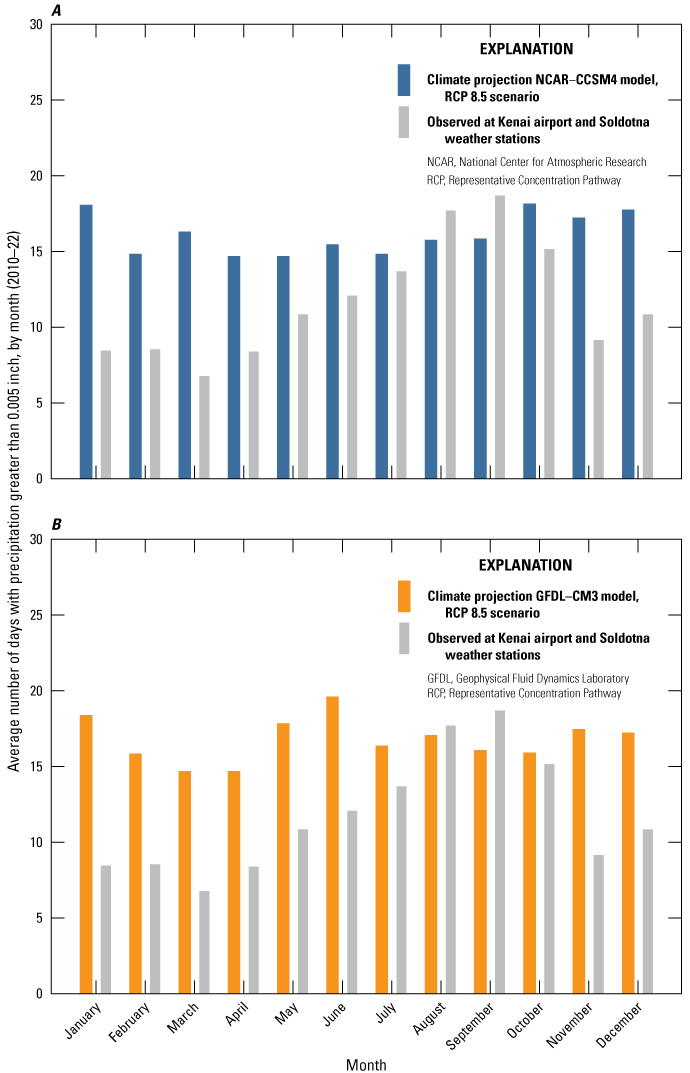
Graphs of the average number of days with observed precipitation events (greater than 0.005 inch) by month for 2010–22. A, NCAR–CCSM4 projected precipitation dataset. B, GFDL–CM3 projected precipitation dataset.
A third limitation identified with the SNAP data is a compressed range in simulated daily minimum and maximum temperatures, with projected minimum daily temperatures being higher than observed (fig. 7.4). The positive bias in minimum daily temperatures is greater in the GFDL–CM3 projection data than NCAR–CCSM4. A reduced difference in daily minimum and maximum temperatures would result in lower than actual simulated evapotranspiration, because the SWB model uses the daily temperature amplitude to estimate evapotranspiration. In lieu of a coherent approach for correcting daily temperature amplitudes, the SNAP temperatures were used as is.
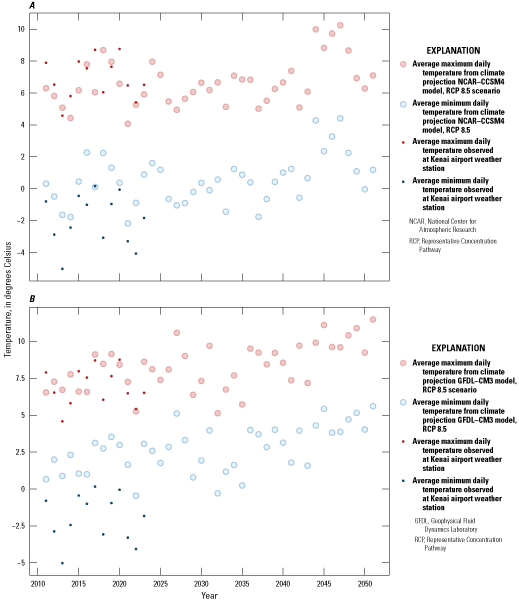
Graphs of the 2010–22 observed annual average minimum and maximum daily temperature with 2010–50 temperatures. A, NCAR–CCSM4 projected temperatures. B, GFDL–CM3 projected temperatures.
In recognition of the daily SNAP climate projection limitations for precipitation and temperature, an alternative set of scenarios was developed based on historical time series of climate variables. Nine years of historical daily climate data, including minimum and maximum temperature from October 1, 2014, to September 30, 2023, were repeated three times to develop a time series of realistic weather variability out to September 29, 2050. Average daily rates of temperature change were computed for each month of the year by dividing the 2030–39 to 2060–69 monthly temperature changes in the SNAP community charts for Kenai, Alaska, (SNAP, 2023) by 30 years. The repeated historical minimum and maximum temperature daily temperatures were then incremented by the daily rates of change computed for each month to derive future temperature time series representing the RCP 4.5, 6.0, and 8.5 scenarios. No future rate of change was applied to precipitation or other variables (the historical data were used as is).
Comparison of Other Downscaled General Circulation Model Outputs to Historical Data
The SNAP data are available as gridded data in NetCDF files (SNAP, 2022). The grid cells are large (20 kilometers) relative to the Beaver Creek Basin, so data were pulled from a single point representing the Kenai airport weather station where the study period weather data are recorded. From 2010 to 2022, SNAP climate projections and observed data from the Kenai airport weather station were used as a comparison period to check for notable biases in the projected data. A summary of that comparison for each of the input climate datasets needed for SNTEMP, in addition to the precipitation and temperature discussed previously in the section, are shown in figures 7.5–7.7.
Projected average monthly wind speed (fig. 7.5) and relative humidity (converted from the available specific humidity using the SNAP pressure dataset; fig. 7.6) were close to the observed data during the growing season with larger deviations in the winter months, which are outside the SNTEMP model period. The average sunshine fraction (fig. 7.7) was biased notably high for both climate projections despite the SNAP projected data showing more frequent storm events (fig. 7.3). Cloud cover (and the related sunshine fraction) has long been a large source of uncertainty in climate models (Pearce, 2020) and may be poorly constrained in the climate projections. The effect of the cloud cover bias may be minimal—Bartholow (1989) found SNTEMP stream temperature prediction to be insensitive to cloud cover relative to other SNTEMP parameters.
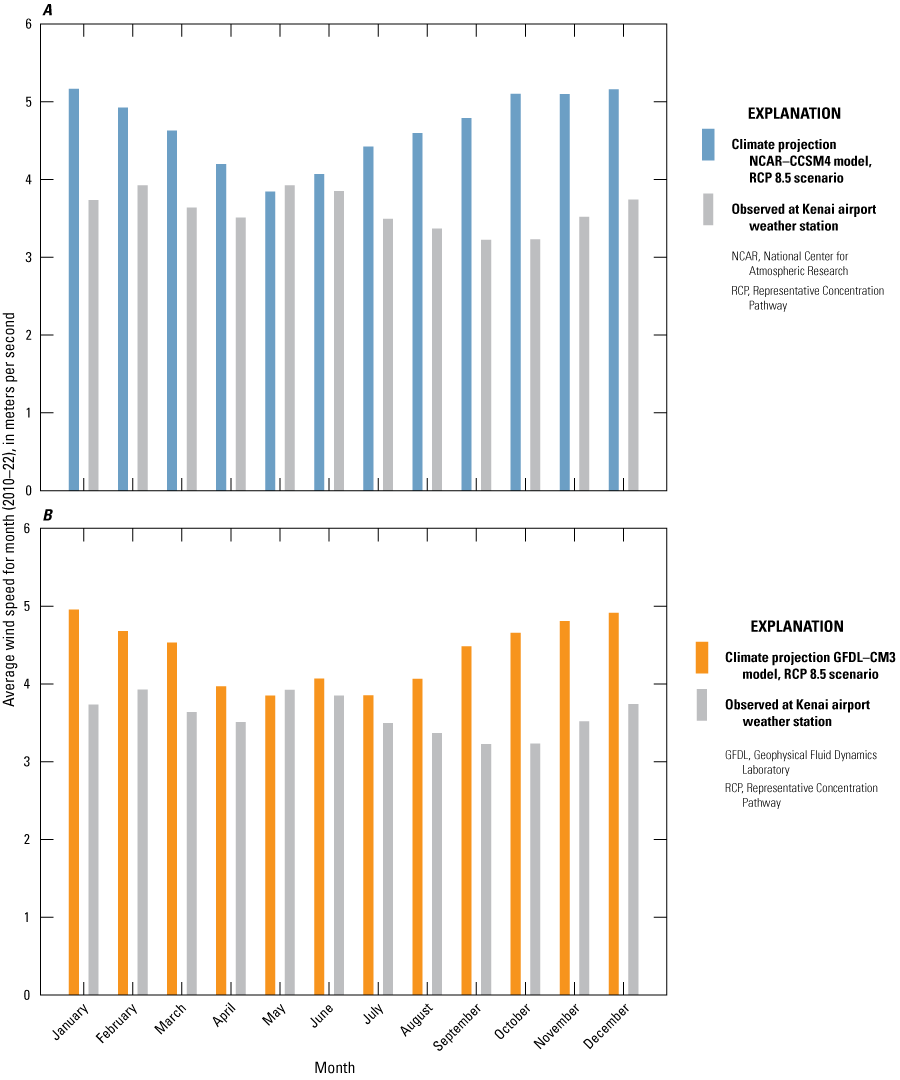
Graphs of the average wind speed by month for 2010–22. A, NCAR–CCSM4 projected average monthly wind speed. B, GFDL–CM3 projected average monthly wind speed.
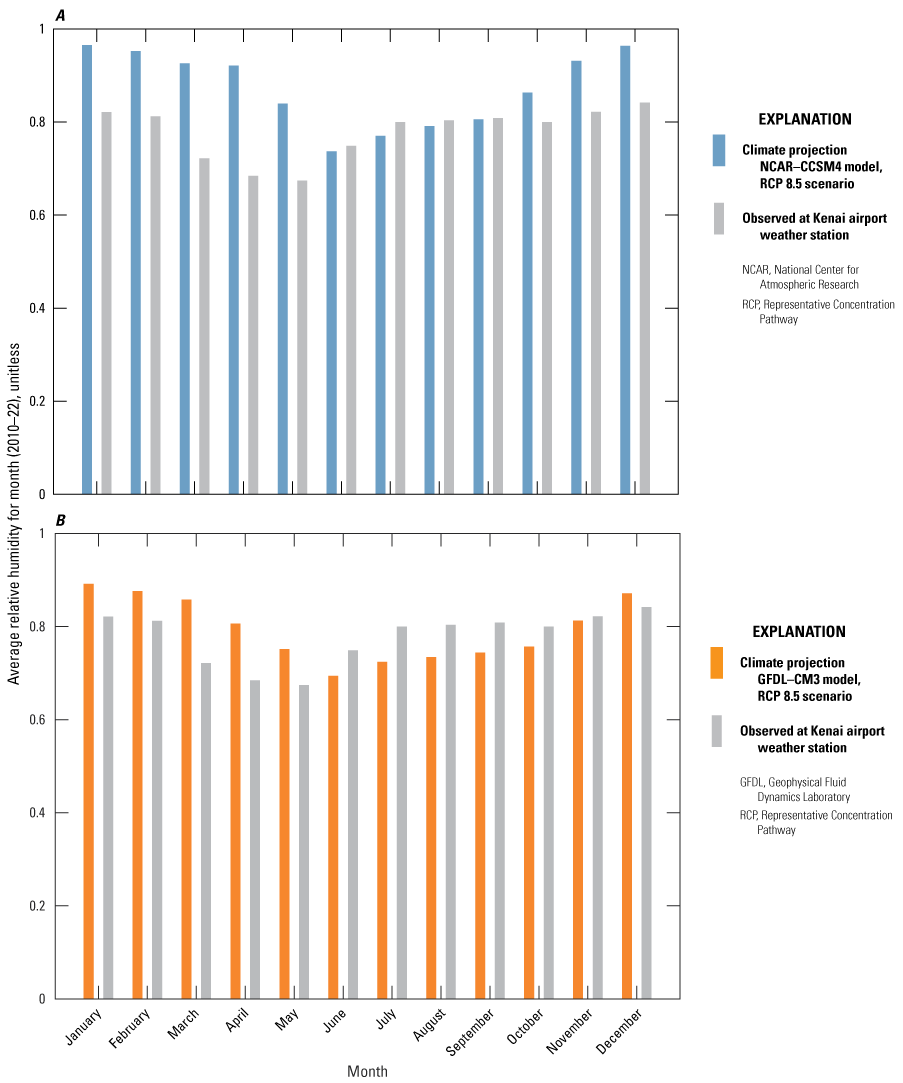
Graphs of the average relative humidity by month for 2010–22. A, NCAR–CCSM4 projected average monthly relative humidity. B, GFDL–CM3 projected average monthly relative humidity.
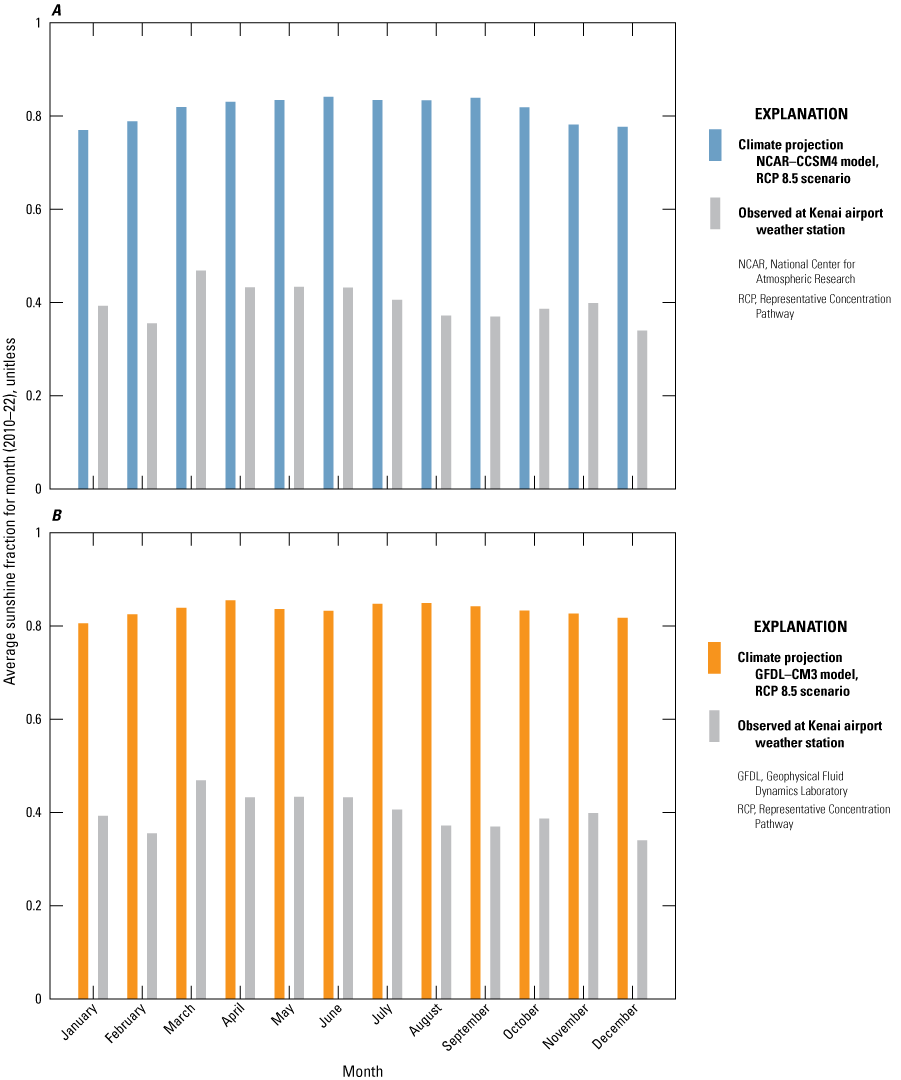
Graphs of the sunshine fraction by month for 2010–22. A, NCAR–CCSM4 projected average monthly sun fraction. B, GFDL–CM3 projected average monthly sun fraction.
Scenario Model Construction
Eleven scenario models were created from the five sets of future climate forcings, alternative end-member scenarios of groundwater sensitivity, and a scenario that evaluated the potential effects of increased groundwater pumping from population growth (table 7.1). Five SWB models were constructed for each of the GFDL–CM3 and NCAR–CCSM4 daily SNAP datasets and the historically based input developed from the monthly SNAP community projections for the RCP 4.5, 6.0, and 8.5 scenarios. Land use, soil properties, and the look-up table parameters were assumed to be unchanged from the historical simulations.
Net infiltration and surface runoff results from the SWB models were processed into Recharge and Streamflow Routing (SFR) Package input for the MODFLOW models. For 2019 through September 2023, the historical SWB model outputs (driven by observed precipitation and temperatures) were used. From October 1, 2023, to the end of the scenario period on October 1, 2050, the future SWB model outputs were used. Use of historical forcings for the historical period ensured consistent initial conditions across all of the scenario groundwater flow models and allowed for comparison of phi (model fit to observations) between the scenario models and historical models to ensure consistency.
The scenarios included six different MODFLOW models, one for each SWB simulation, and a second model driven with the NCAR–CCSM4-based input that incorporated reoccurring pumping increases of 0.44 percent per year for the City of Kenai based on a projected 13.3-percent increase in population from 2015 to 2046 (Alaska LNG, 2017). Each of the five MODFLOW models was included in two scenarios—one with thermally sensitive (shallow) groundwater discharge to Beaver Creek using the estimated effective depth of 1.6 meters (refer to the “Parametrization” section), and the other with thermally insensitive groundwater discharge at a constant 4.2 °C through 2050 (table 7.1).
In the GCM-based scenarios, the SNTEMP model was driven by GCM-based climate inputs for the entire period of 2019 through 2050. This allowed for comparison of temperature changes between “current” and future conditions without any artifacts of bias between historical observed temperatures and GCM-based temperatures simulated for the historical period. In the “snap-mean” scenarios that repeated historical climate, the SNTEMP model was driven by observed climate inputs during the historical period and the repeated historical climate with the applied temperature increases during the future period (refer to the “Development of Precipitation and Temperature Inputs” section). With the successive steady-state assumption, each time period simulated by SNTEMP is independent of previous periods. Stream characteristics such as shading and geometry were assumed to be unchanged from the historical model.
The scenario models were run using PEST++ in a single forward run (NOPTMAX=0) context (White and others, 2020) using the composite model workflow from the parameter estimation analysis. This allowed estimated parameter values from the history matching process to be easily applied to the scenario models in a repeatable manner. Only the base parameter ensemble realization was used for the scenarios. The composite model workflow involved the following steps:
-
1. Apply the parameter values.
-
2. Run MODFLOW and postprocess the results to the observation values.
-
3. Update the SNTEMP hydrology data file with instream flow values from the MODFLOW SFR Package binary output and flow-weighted average temperatures for the lateral inflows in the SNTEMP simulation. Simulated groundwater discharge and surface runoff from the SFR Package results were used to develop the flow-weighted averages.
-
4. For the groundwater component of the lateral inflows, the sensitive (shallow) and insensitive (deep) groundwater discharge temperature conceptualizations were incorporated for each climate scenario (table 7.1).
-
5. Run SNTEMP and postprocess the results to the observation values.
Scenario Water Balance Results
The summed Beaver Creek SWB model output for annual net infiltration, surface runoff, and evapotranspiration were plotted together for the historical period and the snap-mean, ccsm4, and gfdl3 model scenarios in figure 7.8. Together these terms sum to the annual precipitation. These budget terms were averaged for a recent period (2015–22) and a future period (2042–49). The averaging periods were selected so that the recent and future periods reflected the same climate input in the snap-mean scenarios (refer to the “Development of Precipitation and Temperature Inputs” section). The goal was to evaluate the effects of the anticipated temperature increases on the water balance without additional artifacts from interannual variability.
The historical SWB model outputs show a notable rise in net infiltration, surface runoff, and evapotranspiration between the 1970s and the recent period, driven by a rise in average precipitation. The ccsm4 and gfdl3 scenarios show slight increases in evapotranspiration and slight decreases in surface runoff. Net infiltration remains stable for gfdl3 and decreases slightly under ccsm4. Minimal changes to the water balance terms are seen in the snap-mean scenario between the current to future periods. The RCP–4.5 and RCP–6.0 versions of the snap-mean scenario produced almost identical results to the RCP–8.5 version shown here; results for the RCP–4.5 and RCP–6.0 snap-mean scenarios are included in the data release (Leaf and others, 2024). The snap-mean scenarios may underestimate evapotranspiration because the daily mean temperature slowly rises but the difference between the daily minimum and maximum remains the same as the repeating historical period because both are increased by the same amount. The assumption that daily temperature amplitude will remain unchanged from the recent period is potentially problematic for the SWB model, which, in addition to daily mean temperature, uses the difference in daily minimum and maximum temperature to estimate evapotranspiration (Westenbroek and others, 2018).
Simulated net infiltration for the historical and future model scenarios is shown in figure 7.9. Net infiltration is projected to remain relatively steady in the future periods. The model scenarios predict 5-year average net infiltration that is similar to the 2010-20 historical period and higher than the 1965–85 historical period. Steady net infiltration indicates some resilience in future streamflows, particularly base flows, under projected climate change scenarios.
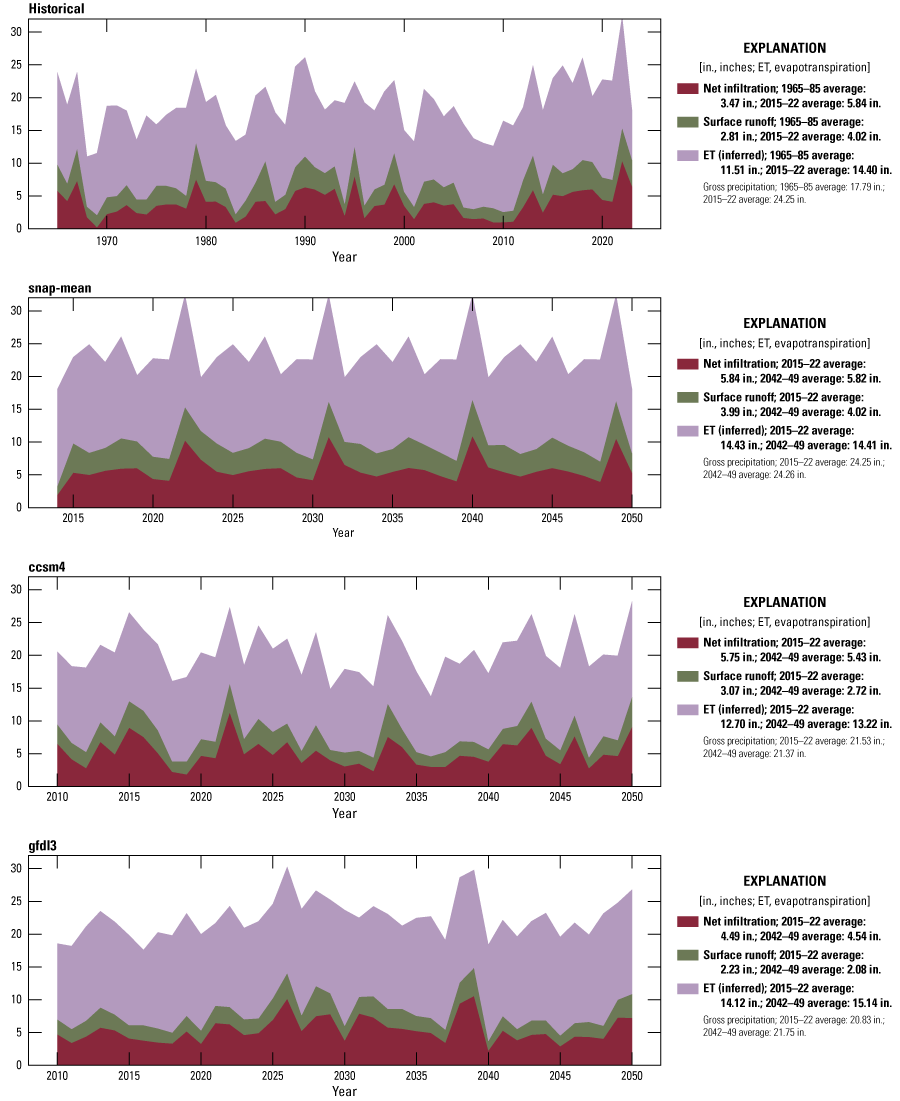
Simulated partitioning of precipitation into evapotranspiration, surface runoff and net infiltration past the root zone, from 1965 to 2050.
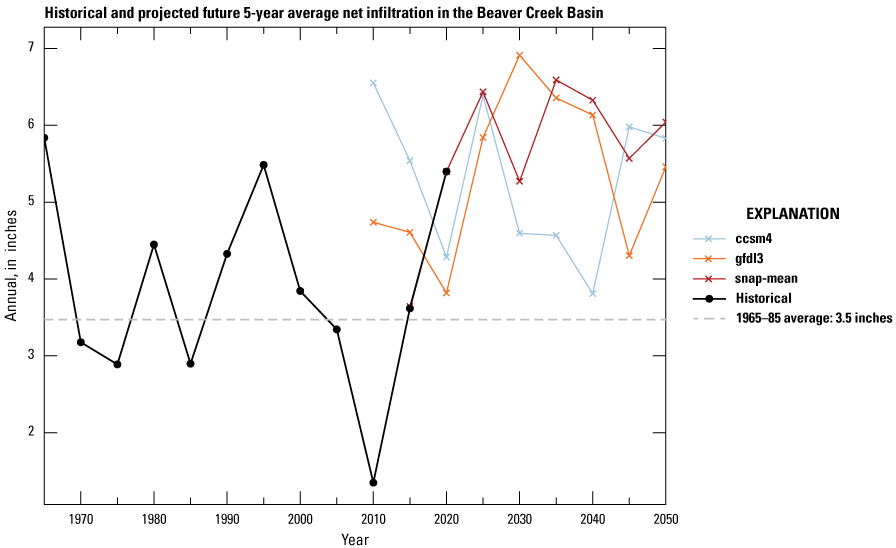
5-year average annual net infiltration simulated by the Beaver Creek soil-water-balance model, for the three climate scenarios and the observed weather data.
References Cited
Alaska LNG, 2017, City of Kenai water system feasibility study: Alaska LNG, AKLNG-4030-OOO-RTA-DOC-0000, accessed July 7, 2021, at http://alaska-lng.com/wp-content/uploads/2018/07/2018-05-18_City-of-Kenai-Water-System-Feasibility-Study.pdf.
Bartholow, J.M., 1989, Stream temperature investigations—Field and analytic methods: Instream Flow Information Paper No. 13, U.S. Department of the Interior Fish and Wildlife Service Biological Report 89(17), 139 p., accessed May 8, 2023, at http://www.krisweb.com/biblio/gen_usfws_bartholow_1989_br8917.pdf.
Bieniek, P.A., Bhatt, U.S., Walsh, J.E., Rupp, T.S., Zhang, J., Krieger, J.R., and Lader, R., 2016, Dynamical downscaling of ERA-Interim temperature and precipitation for Alaska: Journal of Applied Meteorology and Climatology, v. 55, no. 3, p. 635–654, accessed October 17, 2024, at https://doi.org/10.1175/JAMC-D-15-0153.1.
Flato, G., Marotzke, J., Abiodun, B., Braconnot, P., Chou, S.C., Collins, W., Cox, P., Driouech, F., Emori, S., Eyring, V., Forest, C., Gleckler, P., Guilyardi, E., Jakob, C., Kattsov, V., Reason, C., and Rummukainen, M., 2013, Evaluation of climate models, in Climate Change 2013—The physical science basis: Contribution of Working Group I to the Fifth Assessment Report of the Intergovernmental Panel on Climate Change [Stocker, T.F., D. Qin, G.-K. Plattner, M. Tignor, S.K. Allen, J. Boschung, A. Nauels, Y. Xia, V. Bex and P.M. Midgley (eds.)]: Cambridge, United Kingdom, and New York, United States, Cambridge University Press, 126 p.
Hunt, R.J., Walker, J.F., Selbig, W.R., Westenbroek, S.M., and Regan, R.S., 2013, Simulation of climate-change effects on streamflow, lake water budgets, and stream temperature using GSFLOW and SNTEMP, Trout Lake Watershed, Wisconsin: U.S. Geological Survey Scientific Investigations Report 2013–5159, 118 p., accessed October 17, 2024, at https://doi.org/10.3133/sir20135159.
Hunt, R.J., Westenbroek, S.M., Walker, J.F., Selbig, W.R., Regan, R.S., Leaf, A.T., and Saad, D.A., 2016, Simulation of climate change effects on streamflow, groundwater, and stream temperature using GSFLOW and SNTEMP in the Black Earth Creek Watershed, Wisconsin: U.S. Geological Survey Scientific Investigations Report 2016–5091, 117 p., accessed October 17, 2024, at https://doi.org/10.3133/sir20165091.
Intergovernmental Panel on Climate Change, 2014, Climate change 2014—Synthesis report: Contribution of Working Groups I, II and III to the Fifth Assessment Report of the Intergovernmental Panel on Climate Change [Core Writing Team, R.K. Pachauri and L.A. Meyer (eds.)]: Geneva, Switzerland, Intergovernmental Panel on Climate Change, 151 p.
Leaf, A.T., Duncan, L.L., Haugh, C.J., Hunt, R.J., and Rigby, J.R., 2023, Simulating groundwater flow in the Mississippi Alluvial Plain with a focus on the Mississippi Delta: U.S. Geological Survey Scientific Investigations Report 2023–5100, 143 p., accessed October 17, 2024, at https://doi.org/10.3133/sir20235100.
Leaf, A.T., Haserodt, M.J., and Westenbroek, S.M., 2024, Soil water balance, groundwater flow, and stream temperature models for Beaver Creek, Alaska, 2019 to 2050: U.S. Geological Survey data release, accessed December 31, 2024, at http://doi.org/10.5066/P9K30VAP.
Moss, R.H., Edmonds, J.A., Hibbard, K.A., Manning, M.R., Rose, S.K., van Vuuren, D.P., Carter, T.R., Emori, S., Kainuma, M., Kram, T., Meehl, G.A., Mitchell, J.F.B., Nakicenovic, N., Riahi, K., Smith, S.J., Stouffer, R.J., Thomson, A.M., Weyant, J.P., and Wilbanks, T.J., 2010, The next generation of scenarios for climate change research and assessment: Nature, v. 463, no. 7282, p. 747–756, accessed October 17, 2024, at https://doi.org/10.1038/nature08823.
National Oceanic and Atmospheric Administration (NOAA), 2023a, Daily summaries station details for Kenai Airport, AK station GHCND:USW00026523: National Oceanic and Atmospheric Administration, accessed October 10, 2023, at https://www.ncdc.noaa.gov/cdo-web/datasets/GHCND/stations/GHCND:USW00026523/detail.
National Oceanic and Atmospheric Administration (NOAA), 2023b, Daily summaries station details for Soldotna 5 SSW, AK station GHCND: USC00508615: National Oceanic and Atmospheric Administration, accessed November 8, 2023, at https://www.ncdc.noaa.gov/cdo-web/datasets/GHCND/stations/GHCND:USC00508615/detail.
Pearce, F., 2020, Why clouds are the key to new troubling projections on warming: YaleEnvironment360, Yale School of Environment, accessed August 25, 2023, at https://e360.yale.edu/features/why-clouds-are-the-key-to-new-troubling-projections-on-warming#:~:text=Clouds%20have%20long%20been%20the,it%20is%20day% 20or%20night.
Scenarios Network for Alaska + Arctic Planning (SNAP), 2022, About SNAP data: accessed September 30, 2022, at https://registry.opendata.aws/wrf-alaska-snap/.
Scenarios Network for Alaska + Arctic Planning (SNAP), 2023, Community charts: accessed December, 1, 2023, at https://snap.uaf.edu/tools/community-charts.
Walsh, J.E., Bhatt, U.S., Littell, J.S., Leonawicz, M., Lindgren, M., Kurkowski, T.A., Bieniek, P.A., Thoman, R., Gray, S., and Rupp, S.T., 2018, Downscaling of climate model output for Alaskan stakeholders: Environmental Modelling & Software, v. 110, p. 38–51, accessed October 17, 2024, at https://doi.org/10.1016/j.envsoft.2018.03.021.
Westenbroek, S.M., Engott, J.A., Kelson, V.A., and Hunt, R.J., 2018, SWB version 2.0—A soil-water-balance code for estimating net infiltration and other water-budget components: U.S. Geological Survey Techniques and Methods, book 6, chap. A59, 118 p., accessed January 1, 2019, at https://doi.org/10.3133/tm6A59.
White, J.T., Hunt, R.J., Fienen, M.N., and Doherty, J.E., 2020, Approaches to highly parameterized inversion—PEST++ Version 5, a software suite for parameter estimation, uncertainty analysis, management optimization and sensitivity analysis: U.S. Geological Survey Techniques and Methods, book 7, chap. C26, 52 p., accessed October 17, 2024, at https://doi.org/10.3133/tm7C26
Yang, D., Goodison, B.E., Ishida, S., and Benson, C.S., 1998, Adjustment of daily precipitation data at 10 climate stations in Alaska—Application of World Meteorological Organization intercomparison results: Water Resources Research, v. 34, no. 2, p. 241–256, accessed October 17, 2024, at https://doi.org/10.1029/97WR02681.
Conversion Factors
U.S. customary units to International System of Units
International System of Units to U.S. customary units
Temperature in degrees Celsius (°C) may be converted to degrees Fahrenheit (°F) as follows:
°F = (1.8 × °C) + 32.
Datums
Vertical coordinate information is referenced to the North American Vertical Datum of 1988 (NAVD 88).
Horizontal coordinate information is referenced to the North American Datum of 1983 (NAD 83) with the Alaska Albers Coordinate Reference System (European Petroleum Survey Group [EPSG]: 3338).
Altitude, as used in this report, refers to distance above the vertical datum.
Abbreviations
ADFG
Alaska Department of Fish and Game
AWC
available water content
GCM
general circulation model
GFDL
Geophysical Fluid Dynamics Laboratory
GHCND
Global Historical Climatology Network Daily
HSG
hydrologic soil group
iES
iterative Ensemble Smoother
KPFHP
Kenai Peninsula Fish Habitat Partnership
NAVD 88
North American Vertical Datum of 1988
NCAR
National Center for Atmospheric Research
NOAA
National Oceanic and Atmospheric Administration
NWIS
National Water Information System
RCP
Representative Concentration Pathway
SFR
Streamflow Routing
SNAP
Scenarios Network for Alaska and Arctic Planning
SNTEMP
Stream Network Temperature
SWB
Soil-Water-Balance code
USGS
U.S. Geological Survey
For more information about this publication, contact:
Director, USGS Upper Midwest Water Science Center
8505 Research Way
Middleton, WI 53562
608–828–9901
For additional information, visit: https://www.usgs.gov/centers/umidwater
Publishing support provided by the
Rolla Publishing Service Center
Disclaimers
Any use of trade, firm, or product names is for descriptive purposes only and does not imply endorsement by the U.S. Government.
Although this information product, for the most part, is in the public domain, it also may contain copyrighted materials as noted in the text. Permission to reproduce copyrighted items must be secured from the copyright owner.
Suggested Citation
Leaf, A.T., Haserodt, M.J., Meyer, B.E., Westenbroek, S.M., and Koch, J.C., 2024, Simulating present and future groundwater/surface-water interactions and stream temperatures in Beaver Creek, Kenai Peninsula, Alaska: U.S. Geological Survey Scientific Investigations Report 2024–5126, 111 p., https://doi.org/10.3133/sir20245126.
ISSN: 2328-0328 (online)
Study Area
| Publication type | Report |
|---|---|
| Publication Subtype | USGS Numbered Series |
| Title | Simulating present and future groundwater/surface-water interactions and stream temperatures in Beaver Creek, Kenai Peninsula, Alaska |
| Series title | Scientific Investigations Report |
| Series number | 2024-5126 |
| DOI | 10.3133/sir20245126 |
| Publication Date | December 31, 2024 |
| Year Published | 2024 |
| Language | English |
| Publisher | U.S. Geological Survey |
| Publisher location | Reston VA |
| Contributing office(s) | Upper Midwest Water Science Center |
| Description | Report: ix, 111 p.; 2 Data Releases; Dataset |
| Country | United States |
| State | Alaska |
| Other Geospatial | Beaver Creek, Kenai Peninsula |
| Online Only (Y/N) | Y |
| Additional Online Files (Y/N) | N |


