

Groundwater Age Estimates for the Mississippi River Valley Alluvial Aquifer Based on Tracer Data Collected During 2018–20
Links
- Document: Report (3.54 MB pdf) , HTML , XML
- Data Release: USGS Data Release - Data for groundwater age estimates for the Mississippi River Valley alluvial aquifer based on tracer data collected during 2018–20
- NGMDB Index Page: National Geologic Map Database Index Page (html)
- Download citation as: RIS | Dublin Core
Acknowledgments
This project was part of the Mississippi Alluvial Plain Regional Water-Availability Study led by the U.S. Geological Survey and funded by the U.S. government and several other stakeholders. Sampling access was granted by private households, farmers, municipalities, Arkansas Department of Agriculture--Natural Resources Division, Louisiana Department of Transportation, Mississippi Department of Environmental Quality, Yazoo Water Management District, Southeast Missouri Regional Water District, University of Mississippi. U.S. Department of Agriculture, U.S. Army Corps of Engineers, and U.S. Fish and Wildlife Service.
The authors thank the many U.S. Geological Survey employees who contributed to this project, including Gerolamo Casile for his invaluable help with understanding the age tracer data and William Asquith for his general scientific guidance throughout the duration of the project.
Abstract
This study characterized groundwater age across the Mississippi River Valley alluvial aquifer (MRVA). Groundwater samples from 69 MRVA wells and 19 wells in Tertiary units of the Mississippi embayment aquifer system (MEAS) were analyzed for sulfur hexafluoride (SF6), tritium (3H), helium (He), and (or) carbon-14 of dissolved inorganic carbon (14C). The age distributions of 89 samples were estimated by fitting lumped parameter models to processed tracer concentrations with the U.S. Geological Survey software TracerLPM. Mean ages of MRVA groundwater samples ranged from 12 to 22,000 years, with a median of 140 years. Mean ages of MEAS groundwater samples ranged from 230 to 52,000 or more years, with a median of 13,500 years. The spatial distribution of MRVA groundwater ages was found to be influenced by depth, inflow of groundwater from deeper units, and soil saturated hydraulic conductivity. In parts of the MRVA, the spatial distribution of MRVA groundwater ages was found to be influenced by annual recharge and (or) annual groundwater pumpage.
Introduction
The Mississippi embayment region in the central United States includes two principal aquifers: the Mississippi River Valley alluvial aquifer (MRVA), which is a surficial alluvial aquifer, and the Mississippi embayment aquifer system (MEAS), which includes Tertiary aquifers and confining units (Renken, 1998). The Mississippi Alluvial Plain (MAP) extent generally coincides with the MRVA extent (Painter and Westerman, 2018), and is the broad, flat-lying area associated with the floodplain of the Mississippi River (fig. 1). The MRVA is the main source of irrigation water for the MAP, a region in which agriculture is the primary land use. The extent of the MRVA and MAP consists of parts of Illinois, Missouri, Kentucky, Arkansas, Mississippi, Louisiana, and Tennessee (Painter and Westerman, 2018). In parts of the MRVA, groundwater levels have declined in response to irrigation withdrawals since as early as the 1930s (Kresse and others, 2014). Several cones of depression, some of which underlie parts of several counties, have formed at locations across the MRVA (McGuire and others, 2021). Groundwater flow modeling results indicate that groundwater withdrawals in the Mississippi embayment region are unsustainable for the MRVA (Clark and others, 2013), highlighting the importance of better understanding the timescale of water replenishment of the MRVA.
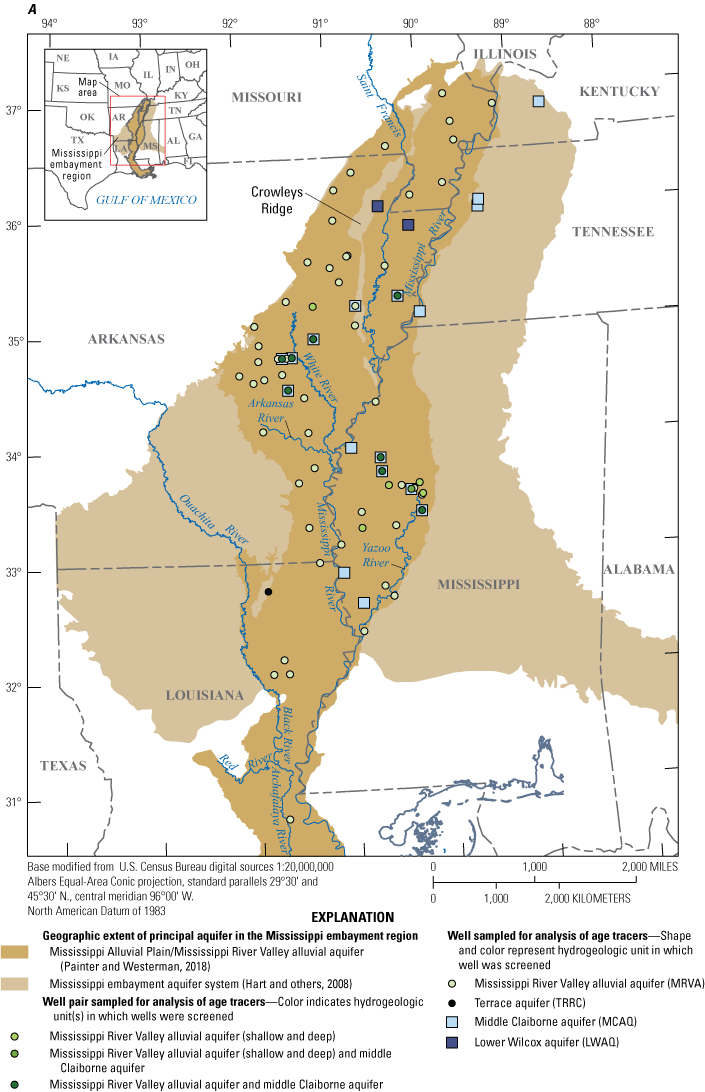
A, Wells and B, well pairs where samples were collected in 2018–20 for analysis of age tracers in the Mississippi River Valley alluvial aquifer and underlying aquifers of the Mississippi embayment aquifer system for a regional groundwater-availability study.
The U.S. Geological Survey (USGS) is currently leading an ongoing MAP groundwater-availability study, which was developed to better enable the Mississippi Embayment Regional Aquifer Study groundwater flow model (Clark and Hart, 2009) to provide reliable information at an appropriate resolution for water-resource managers to use in decision making. As part of this effort, environmental age tracers were used to characterize the groundwater age of the MRVA. Groundwater age, when combined with other hydrologic data for an aquifer, can provide information on sources of water to the aquifer, flow paths within the aquifer, and groundwater travel times through the aquifer.
Results of previous research indicated that groundwater age varied from less than 10 to more than 70 years in the MRVA (Gonthier, 2003; Welch and others, 2011; Wacaster and others, 2021) and from 18 to 86,000 years in the Mississippi embayment aquifer system (MEAS) (Larsen and others, 2016; Kingsbury and others, 2017; Solder, 2020). Studies by Welch and others (2011), Larsen and others (2016), and Kingsbury and others (2017) were local in scale. Welch and others (2011) estimated apparent MRVA groundwater ages from chlorofluorocarbons, sulfur hexafluoride (SF6), and tritium in samples from various depths at a site in the Bogue Phalia Basin in the Delta region of the MAP. Welch and others (2011) reported ages for groundwater in or above the MRVA ranging from 10 to 60 years in samples at depths of 6.5 to 33 feet (ft). Age did not increase monotonically as depth increased, but a best-fit line was fit to the data with a positive slope of 0.2 foot per year, which Welch and others (2011) used as an estimate of the recharge rate at their study site. Larsen and others (2016) and Kingsbury and others (2017) used various tracers, including tritium and SF6, with the USGS software TracerLPM (Jurgens and others, 2020) to estimate age distributions of samples from the middle Claiborne aquifer (MCAQ)—an aquifer within the MEAS—in southwestern Tennessee. Larsen and others (2016) and Kingsbury and others (2017) reported some MCAQ samples as mixtures of old and young water, with the young water being pulled down into the MCAQ from shallow terrace aquifers because of high pumpage from the MCAQ; mean ages estimated by Larsen and others (2016) and Kingsbury and others (2017) ranged from 810 to 1,950 years and from 21 to 4,900 years, respectively.
In regional-scale studies, Gonthier (2003) and Wacaster and others (2021) published tritium results for samples collected throughout the MAP and the Mississippi embayment region, and Solder (2020) used tritium, SF6, carbon-14 of dissolved inorganic carbon (14C), and tritiogenic helium-3 (3Hetrit) with TracerLPM to estimate age distributions of more than 100 MEAS samples. In the MRVA, Gonthier (2003) reported lower tritium concentrations in Holocene alluvium than in Pleistocene valley-train deposits and concluded that a potentially greater abundance of organic matter in the Holocene alluvium and the thinner confining unit, coarser aquifer matrix, and higher land surface altitude in the extents of the Pleistocene valley-train deposits contributed to differences in water age and chemistry between the Holocene alluvium and Pleistocene valley-train deposits. Wacaster and others (2021) found that, based on tritium concentrations, most MRVA groundwater samples were dominantly composed of water recharged after 1953 or consisted of a mixture of water recharged before and after 1953; however, some samples were mostly composed of water recharged before 1953. The presence of groundwater recharged before 1953 in parts of the MRVA likely results from several phenomena including drainage of old water from fine-grained deposits (Kresse and Fazio, 2002); inflow of old water from deeper sources (Kresse and others, 2014); and fine-grained deposits that decrease recharge rates in parts of the aquifer (Kresse and Fazio, 2002). Most MEAS samples were dominantly composed of water recharged before 1953 based on tritium. Mississippi embayment aquifer system samples containing a significant percentage of water recharged after 1953 were generally found in the extents of MEAS unit outcrops (Wacaster and others, 2021). Solder (2020) concluded that MEAS groundwater age was controlled by aquifer characteristics and position in the groundwater system: groundwater was generally older where aquifers were confined and thus deep and far from recharge zones compared to younger groundwater in the recharge zones of the MEAS where units crop out.
Although these previous studies provided information on groundwater age throughout the MAP, the studies were local in focus (Welch and others, 2011; Larsen and others, 2016; Kingsbury and others, 2017), included the underlying units of the MEAS but not the MRVA (Larsen and others, 2016; Kingsbury and others, 2017; Solder, 2020), or provided semi-quantitative groundwater ages for the MRVA as opposed to age distributions (Gonthier, 2003; Wacaster and others, 2021). This study builds on previous research and provides the first aquifer-wide characterization of MRVA groundwater age in the form of multi-tracer-based age distributions. Lumped parameter models (LPMs) of groundwater age were fit to tracer concentrations from samples collected from the MRVA and underlying units. Ages of MRVA samples were compared with potential drivers of age to provide a better understanding of what controls the spatial distribution of groundwater age in the MRVA.
Hydrogeology
The MRVA consists of unconsolidated alluvium—sand, gravel, silt, and clay. Most of the aquifer is characterized by fluvial deposits, such as Pleistocene braided-stream terrace (valley-train) and Holocene meander-belt deposits (Kresse and others, 2014). The southernmost part of the aquifer extent is characterized by Holocene delta and beach deposits (Saucier, 1994). The sediments of the MRVA generally fine southward (Saucier, 1994).
Stratigraphy, grain size, bedding, and sedimentary structures of the MRVA vary across the study area based on the environments in which the alluvium was deposited (Saucier, 1994). For example, a valley-train or point-bar deposit may consist of a thin layer (less than 10 ft) of fine sediment overlying a thicker deposit of sand or sand and gravel (50 to more than 100 ft), a backswamp deposit may consist of 100 ft or more of clay, and a natural-levee deposit may consist of 10 to 20 ft of silty or sandy clay or silty sand (Saucier, 1994). These deposits can stack on top of each other based on how streams have changed over time. The fine-grained uppermost deposits of the MRVA form a discontinuous upper confining unit that can restrict areal recharge (Minsley and others, 2021). Where present, the thickness of the confining unit ranges widely. Also, the confining unit thickness can change abruptly at lateral contacts between deposits of different depositional environments of the aquifer; for example, the confining unit may be 50–100 ft thicker in the extent of an oxbow lake deposit than the confining unit is in the extent of an adjacent valley-train deposit (Kresse and others, 2014). The confining unit can be up to 150 ft thick (Kresse and others, 2014). The permeable layer of the MRVA can be up to almost 200 ft thick (Godwin and others, 2022) and has an average thickness of about 100 ft (Ackerman, 1996).
The MRVA has a heterogeneous mineralogic composition because of the diverse sources of sediment transported by the streams that deposited the MRVA. The MRVA also contains organic matter, such as plant material and lignite (Saucier, 1994). Groundwater in the MRVA is dominated by a calcium bicarbonate or calcium-magnesium bicarbonate water type (Ackerman, 1996), and redox conditions typically are reducing (Kingsbury and others, 2014). Organic carbon and carbonate minerals in the MRVA are sources of dissolved carbon that affect the carbon isotopic composition of the groundwater.
The northern two-thirds of the MRVA primarily overlie aquifers and confining units of the MEAS (Hart and others, 2008) (fig. 1) and the southern third overlies Tertiary sediments of the Coastal Lowlands aquifer system. The MRVA may exchange water with underlying aquifers of the MEAS, such as the upper Claiborne aquifer (UCAQ), MCAQ, middle Wilcox aquifer (MWAQ), or lower Wilcox aquifer (LWAQ), depending on contact textures and hydraulic gradients (Kresse and others, 2014). The Eocene MCAQ consists mostly of sand and generally ranges in thickness from about 500 to more than 1,000 ft (Hart and others, 2008). In northeastern Arkansas, east of Crowleys Ridge (fig. 1), the Eocene LWAQ consists mostly of sand (Hart and others, 2008; Kresse and others, 2014). The LWAQ can be more than 200 ft thick in this area (Kresse and others, 2014).
Methods
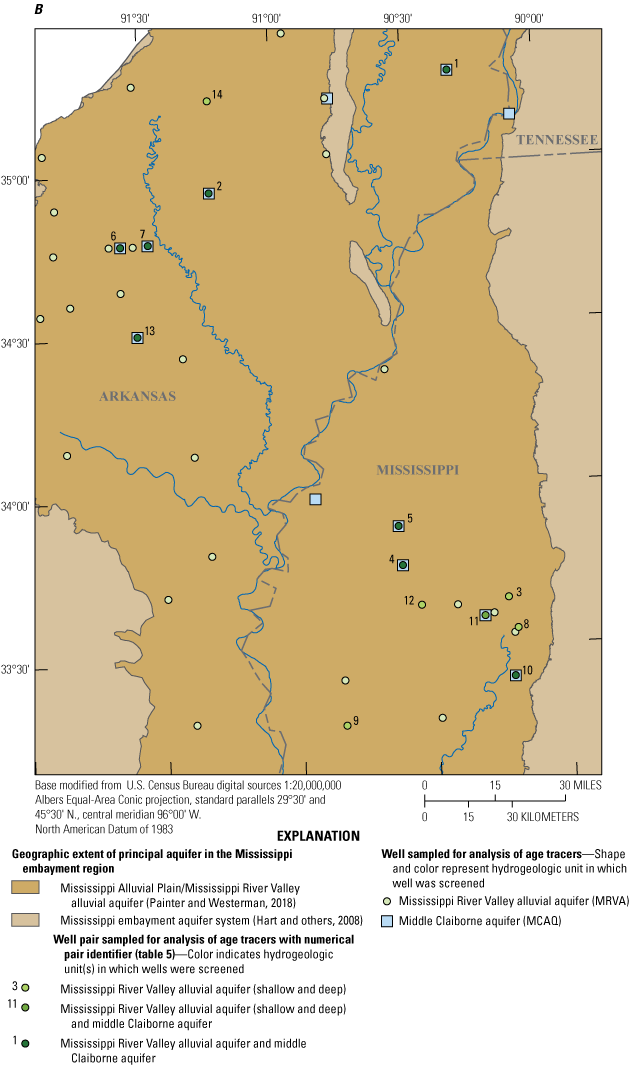
Groundwater samples were collected across the MRVA and from some underlying aquifers of the MEAS, specifically the MCAQ and LWAQ (fig. 1, table 1), to characterize the range and spatial distribution of groundwater age in the MRVA and investigate groundwater interaction with underlying aquifers. The age distribution of each sample was estimated by using environmental tracer concentrations (table 2) with the USGS software TracerLPM (Jurgens and others, 2012). Measured tracer concentrations were corrected to better approximate the concentration of the tracer at the point of recharge (in the case of SF6), the activity that the tracer would have had if unaffected by chemical processes and isotopic fractionation (in the case of 14C), or the amount of the tracer that accumulated in the water after it was recharged (in the cases of 3Hetrit and terrigenic helium-4 (4Heterr). Well screen intervals, potentiometric surface maps, well logs, and hydrogeologic information products based on airborne electromagnetic data were used to form the conceptual model of the flow paths to each well. The conceptual model of the flow paths guided the selection of an LPM type for simulating tracer transport to a well (fig. 2) and, in some cases, estimation of LPM parameter values and (or) evaluation of optimized parameter values for an LPM. The number of parameters, including mean age, that TracerLPM can optimize for an LPM depends on the number of tracer concentrations to which an LPM is fit. Therefore, if enough tracer concentrations were available for a sample, parameter values were optimized. Otherwise, parameter values were estimated. In TracerLPM, measured tracer concentrations are compared to modeled tracer concentrations for waters of different ages, and modeled parameters are optimized so that modeled tracer concentrations match measured tracer concentrations as closely as possible. The LPM type, sample date, modeled parameter values, and tracer concentrations define the estimated age distribution for each sample.
Table 1.
Number of wells sampled for an age tracer in each aquifer in 2018–20, number of groundwater samples collected, and number of samples for which an age distribution was estimated, Mississippi River Valley alluvial aquifer, middle Claiborne aquifer, and lower Wilcox aquifer.| Aquifer | Wells sampled | Samples collected | Number of samples with an estimated age distribution (table 8 of Gratzer and others, 2025) |
|---|---|---|---|
| Mississippi River Valley alluvial aquifer | 69 | 71 | 71 |
| Middle Claiborne aquifer | 17 | 17 | 16* |
| Lower Wilcox aquifer | 2 | 2 | 2 |
Table 2.
Maximum ages datable by tracers used in this study.| Tracer | Maximum age datable by tracer concentration |
|---|---|
| Sulfur hexafluoride | Water recharged since approximately 1970 (Busenberg and Plummer, 2000) |
| Tritium | Water recharged since approximately 1953 (Lindsey and others, 2019) |
| Tritiogenic helium-3 | Same as tritium |
| Carbon-14 | Water recharged since approximately 52,000 years ago (National Ocean Sciences Accelerator Mass Spectrometry, 2020) |
| Terrigenic helium-4 | Water recharged since approximately 100 million years ago (Solomon and others, 1996) |
Decision tree used to select the lumped parameter model (LPM) type with which to model a sample for groundwater age estimation.
Possible sources of uncertainty of age distributions estimated by using TracerLPM include potentially imperfect representation of hydrogeology, stresses, and the nature of mixing that affected a sample. Also, tracer concentrations in a sample can differ from those that the water in that sample had when it recharged the aquifer because of changes to the composition of the water independent of age, and these differences may be accounted for imperfectly because of incomplete knowledge of the chemical evolution of the water. These sources of uncertainty influence the precision at which ages can be resolved. Based on ages reported by several previous studies that used similar sets of tracers, it was appropriate for the present study to report mean ages with two significant figures or less (Jurgens and others, 2012; Plummer and others, 2012; Solder, 2020).
Sampling Design
Wells were chosen to obtain age-tracer concentrations throughout the MRVA extent and at various depths (fig. 1). Selected wells screened in the MEAS were sampled to better understand groundwater interactions between the MRVA and some underlying aquifers. One additional well in an adjacent terrace aquifer (USGS site number 324627091505203) was sampled and age dated (Gratzer and others, 2025); however, because the well lies outside the extent of the MRVA, the sample is not discussed in this report. Samples were collected primarily from production or monitoring wells—as opposed to irrigation wells which are abundant across the MRVA—to limit exposure of sample water to the atmosphere which can alter some age-tracer concentrations. Groundwater from some wells could not be analyzed for dissolved gas concentrations because the pumps used to sample these wells aerated the water.
In 14 locations, samples were collected from 2 or 3 nearby wells with different depths in the MRVA or in the MRVA and the underlying MCAQ (fig. 1B). Paired MRVA wells were used to assess the stratification of age in the MRVA. Paired MRVA and MCAQ wells were used to help assess the likelihood of hydraulic connection and groundwater mixing between the MRVA and MCAQ.
Samples were collected by following protocols in the USGS National Field Manual (USGS, variously dated). Prior to collecting samples, at least three casing volumes were pumped from the well, and pH, temperature, specific conductance, and dissolved oxygen were monitored for stabilization. Stabilization of pH, temperature, specific conductance, and dissolved oxygen signals that the water entering the well is likely representative of the groundwater in the aquifer rather than water that has remained inside the well for an extended period and acquired a different chemical composition. A submersible pump with Teflon tubing and stainless-steel fittings was used for sampling monitoring wells. At production wells, sample tubing was connected to a spigot at the wellhead that discharged the groundwater prior to any treatment. When collecting samples to be analyzed for the concentration of a dissolved gas, containers were filled by using procedures that prevented any bubbles from being trapped in the samples. Trapped bubbles, or “headspace,” can change the concentrations of dissolved gases in water because of fractionation of the gas as it is exchanged between the water and the bubble. All equipment was cleaned following standard procedures in the USGS National Field Manual (USGS, variously dated) after each well was sampled.
Alkalinity, General Chemistry, Stable Isotopes of Water, and Dissolved Organic Carbon
Each groundwater sample was analyzed for alkalinity, general chemistry (cations, anions, silica, trace elements, nitrate, and total dissolved solids [TDS]), and stable isotopes of water, and 10 groundwater samples collected in 2020 were also analyzed for dissolved organic carbon (DOC) (Gratzer and others, 2025). Samples collected for the determination of alkalinity, some general chemistry analytes, and DOC were collected through a 0.45-micron filter. The bottles for samples collected for analyses of alkalinity and some general chemistry analytes were rinsed with the filtered groundwater before being filled. Samples collected for the determination of general chemistry and DOC were analyzed by the USGS National Water Quality Laboratory in Lakewood, Colorado.
Alkalinity samples were collected in 250-mL polyethylene bottles. Samples were titrated in the field by the inflection point method using sulfuric acid delivered by a digital titrator.
Samples for analyses of cations, silica, and major and trace elements were collected in acid-rinsed 250-milliliter (mL) clear polyethylene bottles; nitric acid preservative was added to these samples. Samples were analyzed for cations and silica by inductively coupled plasma (ICP) atomic emission spectroscopy and ICP optical emission spectroscopy (Fishman, 1993; American Public Health Association, American Water Works Association, and Water Environment Federation, 1998). Samples were analyzed for trace elements by ICP mass spectrometry and cell ICP mass spectrometry (Garbarino, 1999; Garbarino and others, 2006).
Samples for analyses of anions and TDS were collected in 250-mL polyethylene bottles. Anions were analyzed by ion chromatography, and TDS was analyzed by the residue on evaporation method (Fishman and Friedman, 1989). Samples for analysis of the sum of nitrite plus nitrate were collected in 125-mL brown polyethylene bottles and analyzed by using colorimetry by enzymatic reduction (Patton and Kryskalla, 2011).
Samples for analysis of stable isotope ratios of water (δ2H and δ18O) were collected unfiltered in a 125-mL polyethylene bottle and analyzed at the University of Arkansas Stable Isotope Laboratory with a Thermo Scientific DELTA V Plus isotope ratio mass spectrometer. Results were reported in delta (δ) notation, relative to the Vienna Standard Mean Ocean Water (VSMOW) standard:
Samples for analysis of DOC were collected in 125-mL baked amber glass bottles. Sulfuric acid preservative was added to these samples. These samples were analyzed by using the high-temperature combustion method (National Environmental Methods Index, 2023).
Major inorganic constituents and stable isotope ratios of water were used in the USGS speciation program NetpathXL to calculate the speciation of each sample (Parkhurst and Charlton, 2008). Concentrations were not adjusted for charge balance. The carbonate speciations of samples were required to correct 14C for subsequent age dating. The mineral-saturation indices provided by each speciation helped to constrain the conceptual model of chemical processes that likely affected the 14C activity of each sample.
Tritium
Groundwater samples were collected from 68 MRVA wells, 17 MCAQ wells, and 2 LWAQ wells for the analysis of tritium (Gratzer and others, 2025). Samples were collected in 1-liter (L) clear polyethylene bottles with poly-seal cone caps and analyzed at the University of Miami Tritium Laboratory by gas-proportional counting with electrolytic enrichment (University of Miami Tritium Laboratory, 2023).
Tritium can be used to identify groundwater recharged since about 1953 (table 2) (Lindsey and others, 2019). Tritium data were used to categorize each sample (Gratzer and others, 2025) as “modern” (recharged after 1953), “premodern” (recharged before 1953), or “mixed” (a mixture of water recharged after 1953 and water recharged before 1953) by using the methods of Lindsey and others (2019). Tritium-based age categories provided an initial framework for modeling groundwater age.
In the USGS software TracerLPM (Jurgens and others, 2012), the tritium concentration of each sample was modeled relative to the tritium input function, which is the time series of tritium in the precipitation assumed to have recharged the aquifer. Tritium concentrations in precipitation vary spatially and temporally. Michel and others (2018) compiled tritium input functions for each latitude-longitude quadrant (2 degrees latitude x 5 degrees longitude) of the continental United States. These tritium input functions were used in TracerLPM for estimating ages of samples with tritium. The recharge zone of each sample was assumed to be in the same latitude-longitude quadrant as the well from which the sample was collected. In this report, the “recharge zone” of an aquifer refers to the areas in which recharge to the aquifer takes place as well as the groundwater in those areas. The recharge zone of a sample refers to the portion of an aquifer’s recharge zone in which the water in the sample recharged the aquifer.
Dissolved Gases
Concentrations of dissolved nitrogen (N2) and argon (Ar) were used to estimate recharge water temperatures (hereinafter referred to as “recharge temperatures”) and excess air concentrations to correct SF6, 3Hetrit, and 4Heterr data. Excess air refers to air that dissolved in the groundwater after recharge, for example, water that was trapped between a wetting front and the water table and then dissolved beneath the water table under hydrostatic pressure. Samples for each site were collected without headspace in two 125-mL pre-weighed glass bottles with rubber stoppers, chilled, and shipped to the USGS Groundwater Dating Laboratory in Reston, Virginia, for analysis by gas chromatography (USGS Groundwater Dating Laboratory, 2023a, d).
The software package DGMETA (Jurgens and others, 2020) was used to fit the Unfractionated Excess Air (UA) model (Heaton and Vogel, 1981) to the measured N2 and Ar concentrations of each sample to estimate recharge temperature and the amounts of N2 and air that were dissolved in the water after it recharged the aquifer (that is, excess N2 and excess air). Recharge temperature, excess N2 concentration, and excess air concentration must be known to determine the concentrations of SF6 and helium in water when it recharged the aquifer, and these concentrations must be known to use SF6, 3Hetrit, and 4Heterr for estimating the age of groundwater.
The following assumptions were made when estimating recharge temperature, excess N2 concentration, and excess air concentration:
-
• the salinity of the water was assumed to be zero;
-
• the altitude of the recharge zone was assumed to be the same as the well altitude;
-
• all entrapped air was assumed to have totally dissolved;
-
• the water was assumed to have been in equilibrium with the atmosphere when it recharged the aquifer;
-
• the only sources of each gas to the groundwater were assumed to be gas dissolved in the water before it recharged the aquifer, excess air, and denitrification; and
-
• no degassing or diffusive loss of gases was assumed to have occurred.
Noble Gases
Concentrations of noble gases—helium (He), neon (Ne), Ar, krypton (Kr), and xenon (Xe)—also were used to estimate recharge temperatures and excess air concentrations to correct SF6 and He tracer data. Samples for noble gas analysis were collected in air-tight copper tubes under back pressure to ensure no head space; samples were analyzed at the Lamont-Doherty Earth Observatory in New York, New York, with a MAP 215-50 semi-automated noble gas mass spectrometer. Noble gas concentrations were reported in cubic centimeters of gas at standard temperature and pressure per gram of water. Helium-3 abundances (δ3He) were reported as percentages (%) by using the following equation, which includes the ratio of helium-3 (3He) to helium-4 (4He):
where(3He/4He)air
is 1.384×10⁻⁶ (Schlosser and others, 1988).
The closed-system equilibration (CE) model (Aeschbach-Hertig and others, 2000) or the UA model was fit to noble gas concentrations to estimate recharge temperatures and concentrations of fractionated or unfractionated excess air. Similar assumptions were made when fitting models to noble gases as those made when fitting models to N2 and Ar; however, the CE model, which requires noble gas concentrations, allows for none, some, or all entrapped air in groundwater to remain in the gaseous phase rather than dissolve, thus making the CE model a more realistic excess air model than the UA model. The CE model assumes that excess air results from groundwater equilibrating with entrapped air at constant hydrostatic pressure (Aeschbach-Hertig and others, 2000).
A helium mass balance was computed for each sample by using DGMETA because sources of helium in the measured 3He and 4He other than radioactive decay must be accounted for; that is, to be used for groundwater age estimation, 3Hetrit and 4Heterr concentrations must only include the 3He formed by tritium decay (half-life ≈ 12.43 years) and the 4He formed by uranium-238 decay (half-life ≈ 4.47×10⁹ years) and thorium-232 decay (half-life ≈ 1.4×10¹⁰ years) in the aquifer after recharge (Senftle and others, 1956; Clark and Fritz, 1997; Jurgens and others, 2020). Potential helium sources and sinks that could bias age interpretations include helium dissolved in water before it recharges the aquifer, helium from the mantle, helium that diffuses into the aquifer from neighboring units, crustal helium that migrates into the aquifer through the Reelfoot rift and active faults of the New Madrid seismic zone, dissolution of entrapped air (addition of excess air), and loss of helium to diffusion out of groundwater parcels (Clark and Fritz, 1997; Aeschbach-Hertig and others, 2000). The recharge temperature and excess air concentration (based on the CE or UA model fit to a sample’s N2 and Ar or noble gas concentrations) were used to estimate how much helium was dissolved in the sample water when it recharged the aquifer and how much helium was added to the sample from excess air. It was assumed that in the aquifer, no helium diffused into or out of the sampled water from or to other groundwater parcels in the aquifer. The atmospheric 3He/4He ratio was assumed to be 1.384×10⁻⁶, and the 3He/4He ratio of helium from uranium and thorium decay was assumed to be 2.8×10⁻⁸ (Andrews, 1985; Pearson and others, 1991; Solder, 2020). Amounts of 4Heterr and 3Hetrit were estimated for 21 samples from the MRVA and 9 samples from the MEAS (table 7 of Gratzer and others, 2025). In TracerLPM, 3Hetrit was used to date groundwater recharged since approximately 1953; the 3Hetrit abundance of each sample was compared to 3Hetrit abundances calculated for groundwater of any given age based on the tritium input function (table 2) (Jurgens and others, 2012). The accumulation of 4Heterr can be used to date groundwater that was recharged on the order of 10 to 100 million years ago (table 2) (Solomon and others, 1996). The 4Heterr accumulation rate in the aquifer must be known to use 4Heterr to estimate groundwater age. Because of the uncertainty of estimating the 4Heterr accumulation rates for the aquifers sampled, 4Heterr was used qualitatively to inform LPMs; that is, greater amounts of 4Heterr were assumed to represent progressively older groundwater.
Sulfur Hexafluoride
SF6 can be used to date water recharged since about 1970 (table 2) (Busenberg and Plummer, 2000). Samples for analysis of SF6 were collected in two 1-L amber glass bottles (replicates) without headspace and were analyzed by gas chromatography at the USGS Groundwater Dating Laboratory in Reston, Virginia (USGS Groundwater Dating Laboratory, 2023b). SF6 concentrations were reported in femtograms of SF6 per kilogram of water. The laboratory made an approximate correction for headspace, if any, in each sample and also reported the maximum percentage of uncertainty that may have resulted from headspace. These uncertainties as well as comments by the laboratory on sample-specific issues are available in table 6 of Gratzer and others (2025). Potential sources of SF6 contamination to groundwater, that is, dissolved SF6 that did not enter the aquifer as gas dissolved in water in equilibrium with the recharge atmosphere, include excess air and geogenic SF6 (Busenberg and Plummer, 2000).
Recharge temperatures and excess air concentrations, estimated by using the CE or UA model, were used to correct measured SF6 concentrations. Corrected SF6 concentrations are expressed in parts per trillion by volume (pptv) and represent atmospheric gas-mixing ratios. SF6 atmospheric gas-mixing ratios are atmospheric SF6 concentrations in equilibrium with concentrations in recharge water. The SF6 tracer input function in TracerLPM is a historical record of tropospheric SF6 concentrations compiled by the USGS Groundwater Dating Laboratory (USGS Groundwater Dating Laboratory, 2023c). Based on the extrapolation by Jurgens and others (2012) of the SF6 atmospheric mixing ratio timeseries, the current and highest SF6 atmospheric mixing ratio in history is about 10 pptv. Therefore, no SF6 values greater than 10 pptv were used to estimate groundwater age.
Carbon-14
The 14C isotope (half-life of about 5,730 years) of dissolved inorganic carbon (DIC) can be used to estimate the age of water recharged up to about 52,000 years ago (table 2) (Godwin, 1962; National Ocean Sciences Accelerator Mass Spectrometry, 2020). Samples were collected from 70 MRVA wells and 18 MEAS wells for analysis of 14C (Gratzer and others, 2025); samples were filtered through 0.45-micron filters and collected in 1-L plastic-coated glass bottles with poly-seal cone caps. Samples were stored on ice and shipped to the Woods Hole Oceanographic Institution’s National Ocean Sciences Accelerator Mass Spectrometry facility for 14C/12C and 13C/12C analyses. The laboratory reported the 14C abundance of each sample in units of absolute percent modern, an expression of the difference between the 14C/12C ratio of the sample and that of the “modern” standard. The “modern” standard is defined as 95 percent of the 14C concentration of the National Bureau of Standards Oxalic Acid I standard normalized to a δ13C of −19‰ (Olsson, 1970). The 13C isotopic composition of each sample was reported relative to the Vienna Pee Dee Belemnite (VPDB) standard:
Each sample was measured 10 times, and a 14C counting error was reported that accounted for the magnitude of the 14C activity or the variability in all of the measurements of the sample (the larger of the two derived errors), the error associated with normalization of the measured value to the standard, and the error associated with correcting the sample 14C activity based on the 14C activity of the process blank (National Ocean Sciences Accelerator Mass Spectrometry, 2020).The laboratory reported a normalized 14C activity (14Creported) for each sample, based on an assumption that the initial δ13C composition of the sample was −25‰ and that the measured δ13C composition (δ13Cmeasured) of the sample resulted from isotopic fractionation that affected both 13C and 14C, in proportion to their atomic weights. The laboratory normalized the 14C activity of each sample by adjusting the sample’s measured 14C activity (14Cmeasured) to the 14C activity that the sample would have if its δ13C composition was −25‰, using equation 5:
The laboratory performed this normalization procedure in order to undo the assumed isotopic fractionation and determine the 14C activity that the sample would have if the only process affecting the 14C activity was radioactive decay. However, the assumed initial δ13C composition of −25‰ may be incorrect, as the δ13C composition of recharge can vary widely based on various aspects of the unsaturated zone (Clark and Fritz, 1997). Also, correcting 14C activities for the processes that likely altered them is more appropriate than applying a general fractionation correction (Jurgens and others, 2012). Therefore, we calculated a denormalized 14C activity from the reported 14C activity of the sample using equation 5. When 14Creported is expressed in percent modern and δ13Cmeasured is expressed in per mil (‰), the value of 14Cmeasured calculated by equation 5 is in units of absolute percent modern carbon (pmc).
Processes other than radioactive decay can alter groundwater DIC’s 14C activity, leading to an inaccurate estimate of groundwater age based on the 14C activity. Based on previous studies, as well as speciation results for samples collected during this study, carbonate mineral dissolution likely occurs in the MRVA (Kresse and Fazio, 2002; Borrok and others, 2018; Voll and others, 2019). If the carbonate mineral has a different 14C activity from that of the groundwater DIC, dissolution of the mineral changes the groundwater DIC’s 14C activity. The graphical method from Han and others (2012), as implemented in NetpathXL (Parkhurst, 2016), was used to determine whether a sample’s 14C activity likely was altered by geochemical processes and whether that alteration likely occurred predominantly in an environment open or closed to soil carbon dioxide (CO2), that is, the gaseous CO2 in the unsaturated zone atmosphere. In this method, the δ13C composition, DIC concentration, and 14C activity of each sample are compared to those of four DIC end members referred to as points A, B, C, and O: (point A) dissolved CO2 (CO2(aq)) in carbon isotopic equilibrium with gaseous soil CO2; (point B) bicarbonate (HCO3−) in carbon isotopic equilibrium with calcite; (point C) HCO3− in carbon isotopic equilibrium with gaseous soil CO2; and (point O) DIC that is half derived from gaseous soil CO2 and half derived from calcite (through a process where groundwater became saturated with respect to gaseous soil CO2 in an environment open to gaseous soil CO2, referred to as the open system, and then became saturated with respect to calcite in an environment closed to gaseous soil CO2, referred to as the closed system). Based on the results of the graphical method, if a sample’s composition suggested open- or closed-system carbonate mineral dissolution and, in some cases, carbon isotopic exchange with CO2 or carbonate minerals, the open- or closed-system revised Fontes and Garnier 14C correction model (Han and Plummer, 2013) (eq. 6 or 7, respectively), as implemented in NetpathXL (Parkhurst, 2016), was used to estimate 14C0,corrected; the 14C activity of recharge DIC accounting for gaseous soil CO2 dissolution, carbonate mineral (calcite) dissolution, and, in some cases, corresponding carbon isotopic exchange. Some 14C activities were interpreted to require no correction, and the age distributions estimated for these samples, if estimated using 14C, were based on 14Cmeasured (Gratzer and others, 2025).
The inverse geochemical modeling software NetpathXL (Parkhurst and Charlton, 2008) was used to calculate the carbonate speciation (H2CO3, HCO3−, and CO32− concentrations) of each sample. The carbonate species concentrations, temperature, 14C activity, and δ13C of each sample requiring correction were used in the open- or closed-system revised Fontes and Garnier 14C correction model (eqs. 6 and 7, respectively) to calculate a corrected 14C activity of DIC before decay (14C0,corrected), which was then used to calculate a corrected groundwater 14C activity at the time of sample collection (14Ct,corrected) using equation 8 (Han and Plummer, 2013).
To correct for alteration of 14C by a process that predominantly took place in an environment open to soil CO2, the following equation was used:
where14C0
is the 14C activity of DIC before radioactive decay,
Ca
is the concentration of CO2(aq) in the water,
CT
is the concentration of DIC in the water,
14Ca0
is the 14C activity of CO2(aq),
Cb
is the concentration of HCO3− in the water,
14Cb0
is the 14C activity of HCO3− at the start of isotopic exchange,
14Cg
is the 14C activity of gaseous soil CO2,
εg/b
is the enrichment factor from HCO3− to CO2 gas
δ13C
is the δ13C of DIC,
δ13Ca0
is the δ13C of CO2(aq),
δ13Cb0
is the δ13C of HCO3− at the start of isotopic exchange, and
δ13Cg
is the δ13C of gaseous soil CO2.
To correct for alteration of 14C by a process that predominantly took place in an environment closed to soil CO2, the following equation was used:
where14Cs
is the 14C activity of calcite,
δ13Cs
is the δ13C of calcite, and
εs/b
is the enrichment factor from HCO3− to calcite.
In the open- and closed-system revised Fontes and Garnier 14C correction models (eqs. 6 and 7, respectively), values were assumed for the 14C activity and δ13C of soil CO2 and carbonate minerals (calcite) based on compositions that would be characteristic of a landscape dominated by C3 plants—plants that use the C3 photosynthesis pathway—with marine carbonates present in the subsurface. For all corrections, the 14C activity of soil CO2 (14Cg) was assumed to be 100 pmc, the approximate 14C activity of the atmosphere for the past 4,000 years (excluding the period during and following thermonuclear bomb testing) (Clark and Fritz, 1997). For all corrections, the 14C activity of calcite (14Cs) was assumed to be 0 pmc; that is, all carbonate minerals in the open and closed systems of the MRVA were assumed to have lost all their 14C to decay. Four possible values were assumed for δ13C of soil CO2 (δ13Cg):
-
(a) the δ13C of CO2(g) in carbon isotopic equilibrium with DIC with the average δ13C of samples with 14C activities greater than or equal to 100 pmc (−28.36‰),
-
(b) the average δ13C of samples with 14C activities greater than or equal to 100 pmc (similar to (a) but assuming no fractionation from CO2(g) to DIC) (−20.84‰),
-
(c) the typical δ13C of soil CO2(g) in C3-vegetation-dominated landscapes (−23‰, Clark and Fritz, 1997), and
-
(d) the average of (a) and (b) (−25‰).
The 14C0,corrected values were used to calculate 14Ct,corrected values, the actual values entered in TracerLPM, by using equation 8:
whereGroundwater Age Estimation Using TracerLPM
Groundwater age distributions were estimated using LPMs fit to tracer concentrations with the USGS software TracerLPM (Jurgens and others, 2012). An LPM can account for mixing of groundwaters of different ages and leverage multiple tracer concentrations to constrain an age distribution. The LPM approach to estimating groundwater age is intermediate in complexity and expense between estimating an apparent piston flow age and estimating an age distribution by developing a mass-transport model. This intermediate approach to estimating groundwater age was appropriate for the goals and regional scale of the study.
TracerLPM contains five single-mixture LPM types—the piston flow model (PFM), dispersion model (DM), exponential mixing model (EMM), partial exponential model (PEM), and exponential piston flow model (EPM)—that represent different aquifer geometries. A PFM is the simplest LPM and describes a sample consisting of water parcels that have traveled the same flow path at the same rates and therefore have the same age. The assumptions of the PFM did not fit the conceptual model of MRVA groundwater flow, so PFMs were not used to estimate ages of samples. The DM describes water that has mixed with water flowing at different velocities through the aquifer. A parameter of the DM, the dispersion parameter (DP), is defined as the dispersion coefficient divided by the product of velocity and position and describes the ratio of dispersion to advection of the tracers being modeled and controls the ratio of the width to the height of the age distribution (Jurgens and others, 2012). The EMM describes a sample collected from a well screened through the saturated thickness of an unconfined aquifer. The PEM describes a sample collected from a well screened through a portion of the saturated thickness of an unconfined aquifer. Two parameters of the PEM, the upper and lower PEM ratios, describe where the bottom and top of the well screen lie in relation to the bottom and top of the saturated thickness. The EPM describes a sample collected from a well screened through the saturated thickness of a confined aquifer. A parameter of the EPM, the EPM ratio, describes the length of the part of a flow path that is in the confined portion of the aquifer divided by the length of the part of that flow path that is in the unconfined portion of the aquifer where recharge occurs. The EMM, PEM, and EPM are the most physically realistic LPM types and were therefore used when possible. Each single-mixture LPM models a sample as a mixture of waters of different ages, an approximation of the mixture that results from the increase in age with depth along the length of a well screen.
An additional LPM, the binary mixing model (BMM), can be used for samples conceptualized as consisting of water from two distinct sources; for example, a BMM may be used to model a sample containing a mixture of water from two different aquifers or a sample containing a mixture of water from precipitation that recharged the aquifer far away and water gained by the aquifer from a losing stream near the well. The water from each distinct source has its own age distribution, so the resulting BMM is bimodal. If the conceptual model for a sample involves more than one distinct source but a single-mixture LPM can be fit to the sample, it may suggest that one of the sources of water to the sample is dominant or that the multiple sources of water to the well have similar age distributions. However, if a sample contains significant amounts of waters from two sources with dissimilar age distributions, a BMM is likely the only LPM that fits the sample’s set of tracer concentrations. Any of the five LPM types can be combined for a BMM. The LPM type used for each component of the BMM is the same LPM type that would be used to model that component alone. For example, if the conceptual model for a sample was a mixture of younger water that recharged the MRVA and traveled to the well under unconfined conditions and older water from a deeper confined aquifer that flowed up into the MRVA, a PEM would be used for the young component, an EPM would be used for the old component, and the LPM type for the sample would be referred to as a BMM-PEM-EPM.
The simplest LPM consistent with the conceptual model for the hydrologic setting of a well was chosen for each sample in this study. Attempts were made to fit a single-mixture LPM, that is, one individual EMM, PEM, EPM, or DM, to the sample before attempting to fit a BMM to the sample (fig. 2, table 3).
Table 3.
Numbers of samples for which different lumped parameter model (LPM) types were used to simulate tracer transport in the Mississippi River Valley alluvial aquifer, the middle Claiborne aquifer, and the lower Wilcox aquifer.[Binary mixing models (BMM) are named in the following manner: “BMM-A-B,” where A is the LPM representing the young component of the water and B is the LPM representing the old component of the water; na = not applicable]
The conceptual model for the aquifer geometry influencing the paths to a well screen was informed by the well screen interval, potentiometric surface maps (Haugh and others, 2020; McGuire and others, 2020; McGuire and others, 2021), well logs (USGS, 2019), and hydrogeologic information products based on airborne electromagnetic data and (or) borehole geophysical data (Hart and others, 2008; Torak and Painter, 2019; James and Minsley, 2021). The datasets were used to identify the well screen location relative to the extents of the upper and lower confining units of the aquifer, the depths of the top and bottom of the saturated thickness of the aquifer, and the extents of connected reaches of upgradient losing streams. Generally, wells identified as being in unconfined portions of the aquifer were modeled with a PEM, EMM, or DM, and wells identified as being in confined portions of the aquifer were modeled with an EPM or DM, in accordance with the definitions of these LPM types (fig. 2).
For the selected LPM type and observed tracer concentrations, TracerLPM is used to find the optimum mean age and parameter values that produce an age distribution for which modeled tracer concentrations most closely match observed tracer concentrations. An LPM should be fit to as many tracers as possible to yield a better-constrained solution. Because of the oscillation of atmospheric tracer concentrations through time, one tracer concentration alone may correspond to several different ages; therefore, it is often necessary to measure multiple tracers in a sample to determine the most likely age of the sample. Also, the number of tracers determines the number of model parameters that TracerLPM can optimize.
For some samples, no LPM could be fit to all the available tracers for that sample, likely because of errors (such as sampling or measurement errors), uncertainty (such as in tracer correction models or input functions), the simplifying assumptions made by a given LPM type, or an incorrectly assumed LPM type. For these samples, an LPM was fit to a subset of the sample’s tracers and, if necessary and applicable, the DP or EPM ratio was estimated by graphically evaluating the model fit for different values of the parameter. If enough tracer concentrations were available for a sample, the TracerLPM software was used to optimize DPs and (or) EPM ratios (Jurgens and others, 2012). For five samples, more than one possible age distribution was reported because more than one conceptual model of the physical hydrology affecting the sample was probable or the sample had more than one corrected 14C, SF6, or 3Hetrit concentration to which an appropriate LPM could be fit.
For all samples, the unsaturated zone residence time was assumed to be zero, no mixing of waters with different tracer abundances was assumed to have occurred in the unsaturated zone, and the recharge added to the aquifer at a given time was assumed to be in equilibrium with the atmosphere or rain at that time. Generally, using groundwater sample age distributions rather than mean ages is preferable when using groundwater age to inform decisions because age distributions better represent the variety of travel times from recharge zones to a well (Eberts and others, 2012). Gratzer and others (2025) contains the parameters necessary to reproduce the full age distribution(s) estimated for each sample. The mean ages of the distributions are used in this report to summarize results. Hereinafter, the “age” of a sample refers to the mean of the sample’s age distribution.
Relations of Groundwater Age to Hydrogeology and Stressors
The depositional history of the MAP shaped the MRVA and the sediment and soil that overlie it (Saucier, 1994). The properties and geometry of materials overlying the MRVA, as well as precipitation rates and land use, influence recharge rates. Recharge rates, aquifer properties and geometry, and discharge rates affect groundwater flow velocities. Recharge rates and groundwater flow velocities control groundwater age. Because the age of a groundwater parcel is affected by several factors along its path and because the age of a groundwater sample pumped from a well is affected by mixing along paths and mixing of parcels pulled into the well from all directions, the spatial distribution of age might not reflect the spatial pattern of any one controlling factor. However, if one or more factors with similar spatial patterns have the greatest influence on groundwater age in the aquifer or a region of the aquifer, the spatial distribution of those factors might be reflected in the spatial distribution of age.
Mean ages of MRVA groundwater samples were compared to several variables hypothesized to influence recharge rates, groundwater flow velocities, and (or) groundwater age. These variables included well depth, soil saturated hydraulic conductivity (Soil Survey Staff, 2020), net infiltration (potential recharge) (Westenbroek and Nielsen, 2023), groundwater use (Wilson, 2021), electrical resistivity of the MRVA saturated thickness (James and Minsley, 2021), and the degree of potential for hydraulic connection between the MRVA and an underlying unit (James and Minsley, 2021). Well depth can be a proxy for position within the groundwater flow system because deep wells likely capture longer flow paths and thus relatively older groundwater than shallow wells. Investigating the controls on the full age distribution estimated for each sample, as opposed to the mean age estimated for each sample, was beyond the scope of this study. Therefore, the effect of well screen length on the age distribution of each sample was not examined. A longer well screen is likely to capture a wider range of ages of water parcels. Soil hydraulic conductivity can affect where recharge occurs. Groundwater use varies throughout the MRVA (Kresse and others, 2014) and affects hydraulic gradients and thus groundwater paths. Electrical resistivity was used as a proxy for hydraulic conductivity because sediment with low clay content tends to have higher resistivity and hydraulic conductivity than sediment with a high clay content (Mazáč and others, 1985). Groundwater in an area of high hydraulic conductivity is expected to be young. Additionally, the electrical resistivity of the sediment within 82 ft of the contact between the MRVA and the underlying unit was used to estimate the potential for hydraulic connection between the MRVA and the underlying unit (James and Minsley, 2021). Groundwater where the MRVA is in hydraulic connection with an underlying unit is expected to be old.
Selected gridded spatial variables (that is, rasters) representing hydrogeologic conditions across the MAP (soil saturated hydraulic conductivity, recharge, groundwater use, resistivity of the saturated thickness of the MRVA, and conductance of the base of the MRVA) were clipped to the area within 1.24 miles (mi) of each well, and the area-weighted averages of the values of the grid cells within 1.24 mi of the well were assigned to the well. The 1.24-mi radius was chosen based on the estimated distance a water parcel might travel through the MRVA in 160 years, which is the median of the mean ages estimated using TracerLPM for MRVA samples in this study. Each variable was compared to age, first considering all the MRVA wells and then considering the wells in each region of the MAP separately (Ladd and Travers, 2019) (fig. 11). Regions of the MAP are separated by Crowleys Ridge or major rivers. Several of these features act as groundwater divides for the aquifer (Renken, 1998; Kresse and others, 2014).
Results
This report describes raw and processed tracer results and modeled excess air concentrations, recharge temperatures, age categories, and mean ages of 89 groundwater samples collected from the MRVA and MEAS (MCAQ, and LWAQ) between 2018 and 2020 (fig. 1, table 1). Note that 91 samples were collected, but one sample was from an adjacent terrace aquifer; the results from the terrace aquifer sample are not discussed, but data are available in the companion ScienceBase data release (Gratzer and others, 2025). Additionally, one MCAQ sample was only analyzed for tritium and could not be age dated. Mean ages of MRVA samples ranged from 12 to 22,000 years, with a median of 140 years. Most MRVA sample mean ages were younger than most MEAS sample mean ages, which ranged from 230 to 52,000 or more years, with a median of 13,500 years.
Tritium Concentrations and Age Categories
Tritium concentrations in historical samples and samples from this study collected between 1988 and 2020 from the MRVA (n=187) ranged from below the detection limit (about 0.2 tritium unit [TU]) to 16.3 TU, with a median of 1.9 TU (Gratzer and others, 2025). Of the samples from the MRVA, 43 percent were categorized as modern (recharged after 1953), 41 percent were mixed (a mixture of water recharged after 1953 and water recharged before 1953), and 14 percent were premodern (recharged before 1953). The remaining 2 percent could not be classified because of censored tritium values with censoring limits greater than categorical thresholds (Gratzer and others, 2025).
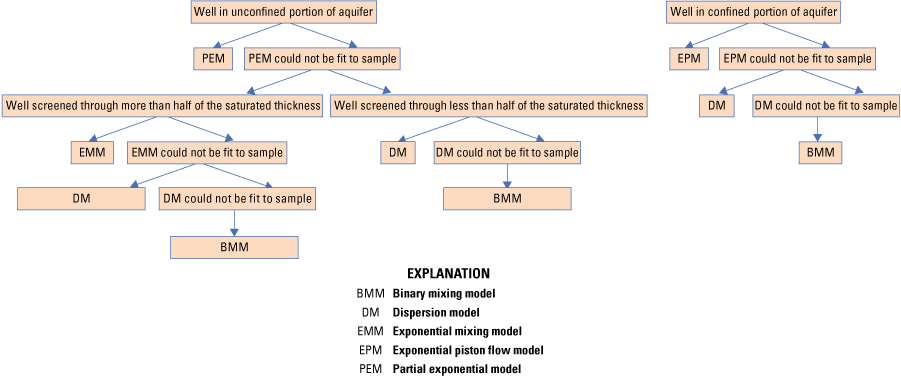
Throughout much of the MRVA, no systematic spatial distribution of modern, mixed, or premodern groundwater was observed (fig. 3A). An exception was that samples collected in the northern part of the MRVA (southeastern Missouri and northeastern Arkansas) were predominantly modern (fig. 3A). No substantial difference was observed in the depths of wells for the three tritium-based age categories (fig. 4A).
Tritium-based age categories of groundwater samples collected during 1988–2020 from the A, Mississippi River Valley alluvial aquifer and B, Mississippi embayment aquifer system.
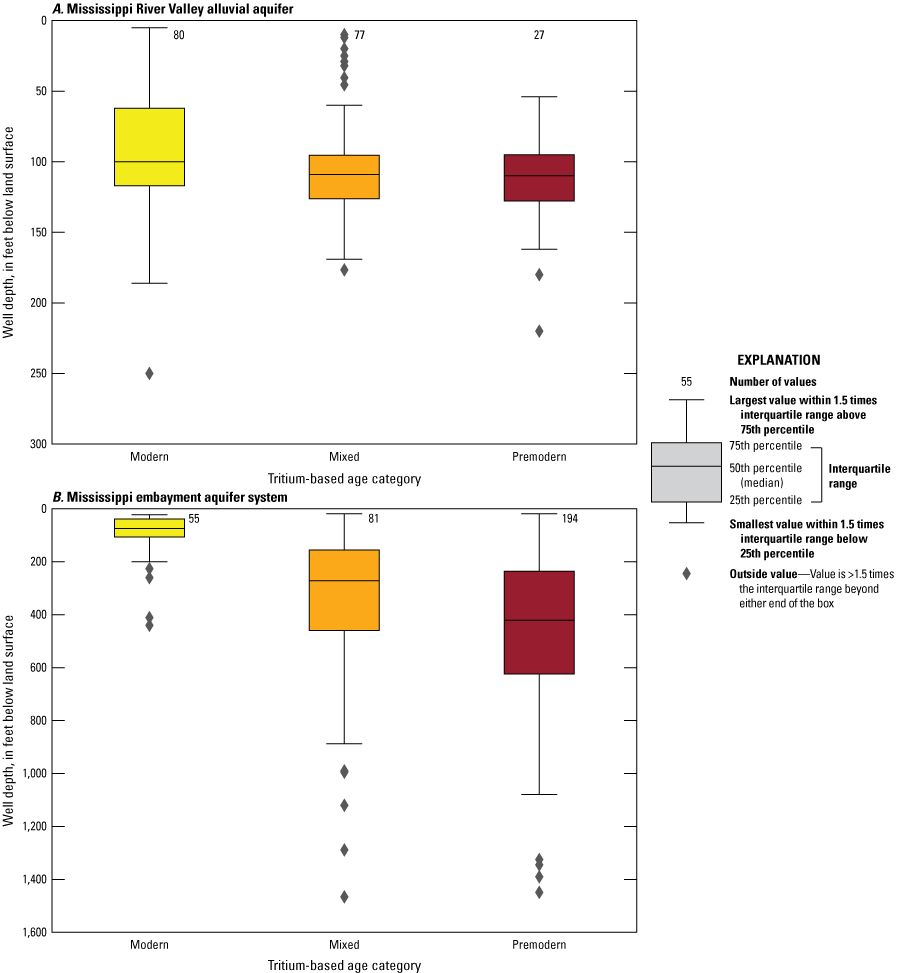
Depths of wells for tritium-based age categories of groundwater samples collected from the A, Mississippi River Valley alluvial aquifer and B, Mississippi embayment aquifer system during 1988–2020.
The samples from the MEAS had lower tritium concentrations than those from the MRVA. Tritium concentrations in 344 MEAS samples collected between 1989 and 2020 ranged from below the detection limit (about 0.2 TU) to 14.1 TU, with a median concentration below the detection limit (Gratzer and others, 2025). Based on tritium concentrations, 16 percent of the samples collected from the MEAS were modern, 24 percent were mixed, and 56 percent were premodern; the remaining 4 percent could not be classified. Modern groundwater was generally near or in outcrop areas of MEAS units near the eastern and western edges of the embayment (fig. 3B). Throughout the entire embayment, especially where the MRVA overlies the MEAS (fig. 3B), groundwater samples were classified as premodern and mixed. Modern samples generally were collected from shallower wells than mixed and premodern samples (fig. 4B).
Recharge Temperatures and Excess Air Concentrations
Sixty-eight MRVA samples and 17 MEAS samples were analyzed for dissolved N2 and Ar. Of those samples, 26 MRVA and 12 MEAS samples were also analyzed for He, Ne, Xe, Kr, and 3He. Recharge temperatures (ranging from 6.6 to 20 degrees Celsius) and excess air concentrations based on the UA model fit to N2 and Ar concentrations were used to correct concentrations of SF6 in 54 samples (Gratzer and others, 2025). Recharge temperatures (ranging from 10.5 to 14.3 degrees Celsius) and excess air concentrations based on the UA model fit to noble gas concentrations were used to correct SF6 concentrations in seven samples and helium tracer data in six samples (Gratzer and others, 2025). Recharge temperatures (ranging from 7.7 to 18.3 degrees Celsius) and excess air concentrations based on the CE model fit to noble gas concentrations were used to correct SF6 concentrations in 23 samples and helium tracer data in 24 samples (Gratzer and others, 2025). Recharge temperatures and excess air concentrations estimated using dissolved N2 and Ar did not exhibit strong positive correlations with recharge temperatures and excess air concentrations estimated using noble gases for the same samples, suggesting that the assumption made by the UA model of complete dissolution of entrapped air was inaccurate for the recharge zones of these samples. Excess air concentrations were similar in samples collected from the MRVA and from the MEAS (fig. 5A); recharge temperatures were higher for the samples from the MRVA than for samples from the MEAS (fig. 5B) (Gratzer and others, 2025).
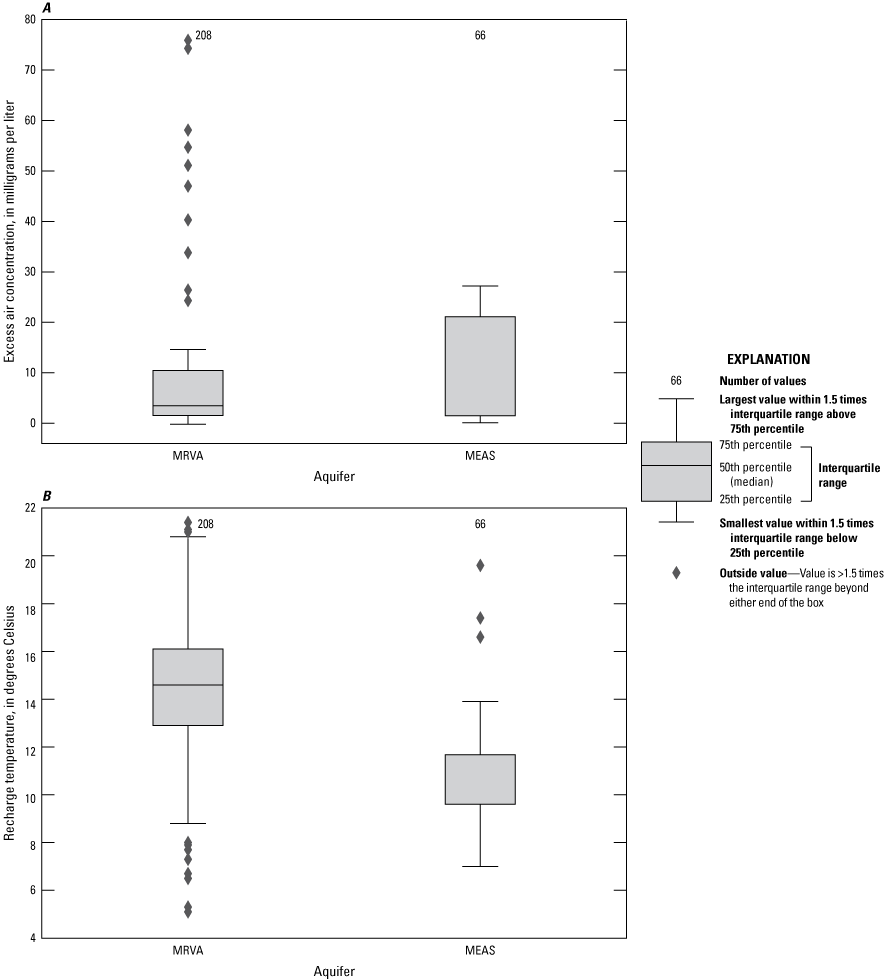
A, Excess air concentrations and B, recharge temperatures based on the closed-system equilibration (Aeschbach-Hertig and others, 2000) or unfractionated excess air (Heaton and Vogel, 1981) model fit to concentrations of noble gases or nitrogen and argon in samples collected from the Mississippi River Valley alluvial aquifer (MRVA) and Mississippi embayment aquifer system (MEAS) during 2018–20.
Helium Tracers
Samples collected from the MRVA had similar R/Ra values and concentrations of helium, 4Heterr, and 3Hetrit to those of samples collected from the MEAS. The fraction R/Ra is an expression of the isotopic composition of dissolved helium, where R is the ratio of 3He to 4He in the groundwater sample and Ra is the ratio of 3He to 4He in air.
Sulfur Hexafluoride
MRVA samples had higher SF6 concentrations than MEAS samples had (fig. 6). Corrected SF6 concentrations ranged from 0.3 to 246.5 pptv with a median of 2.6 pptv in MRVA samples, and concentrations ranged from 0.2 to 1.6 pptv with a median of 0.4 pptv in MEAS samples. Two corrected SF6 concentrations greater than 10 pptv (the highest natural atmospheric mixing ratio in recorded history) in MRVA samples are not shown on figure 6 because these high concentrations suggest interaction with SF6 sources in addition to SF6 from recharge.
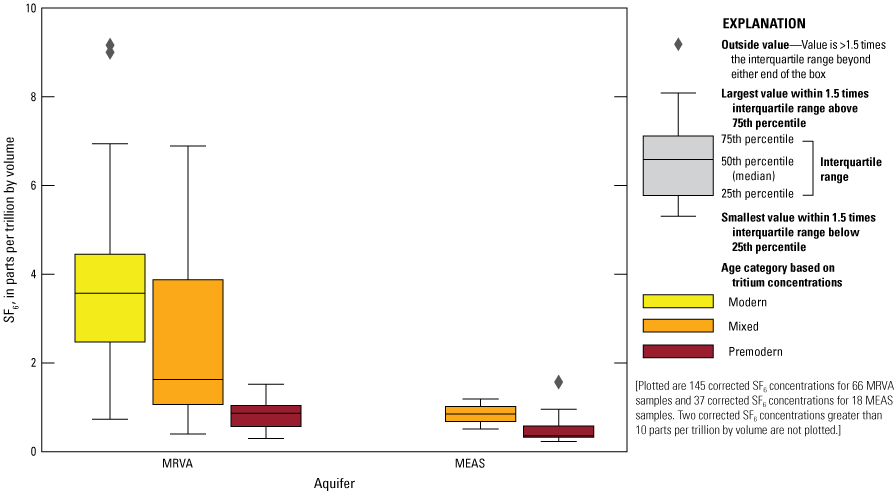
Corrected sulfur hexafluoride (SF6) concentrations of samples collected from the Mississippi River Valley alluvial aquifer (MRVA) and Mississippi embayment aquifer system (MEAS).
Based on all the MRVA and MEAS samples, SF6 concentrations were lower in samples classified as premodern than in mixed and modern samples (fig. 6). Although SF6 concentrations were higher in mixed and modern samples than in premodern samples, each premodern sample had an SF6 concentration suggesting an age of 51 years or less, which conflicts with the tritium-based age classification. Incompatibility between tritium and SF6 age results suggests that SF6 was added to these samples by a source other than recharge, likely a geogenic source based on the pervasiveness of this excess SF6. Solder (2020) found evidence of geogenic SF6 contamination in samples collected from the south Atlantic and Gulf Coast principal aquifer systems, including the MEAS.
Carbon-14
Denormalized, uncorrected 14C activities of MRVA samples (ranging from 19.98 to 111.4 pmc, with a median of 71.83 pmc) were higher than those of MEAS samples (ranging from 0.14 to 86.76 pmc, with a median of 27.61 pmc) (Gratzer and others, 2025).
Groundwater from the MRVA and MEAS was interpreted to have undergone processes other than radioactive decay that may have influenced its carbon isotopic composition (Han and others, 2012). Figure 7 illustrates carbon compositions of samples relative to those of two likely sources of carbon to groundwater: gaseous soil CO2—with an assumed composition of δ13Cg = −25 ‰ and 14Cg = 100 pmc (labeled as the dark orange diamond in fig. 7) and calcite—with an assumed composition of δ13Cs = 0 ‰ and 14Cs = 0 pmc (labeled as the light blue diamond in fig. 7). Figure 7 shows three possible carbon isotopic composition end members of DIC that have interacted with these two carbon sources (soil CO2 and (or) calcite): CO2(aq) (labeled as “A” in fig. 7) in isotopic equilibrium with gaseous soil CO2; HCO3− (labeled as “C” in fig. 7) in isotopic equilibrium with gaseous soil CO2; HCO3− (labeled as “B” in fig. 7) in isotopic equilibrium with calcite; and total DIC (assumed to equal the sum of CO2(aq) and HCO3-; labeled as “O” in fig. 7) that is half derived from gaseous soil CO2 and half derived from calcite (Han and others, 2012; Parkhurst, 2016). The Tamers X and Y lines in figure 7 are vertical and horizontal extensions, respectively, of point O that aid in comparing carbon isotopic compositions of samples to that of DIC at point O (Parkhurst, 2016).
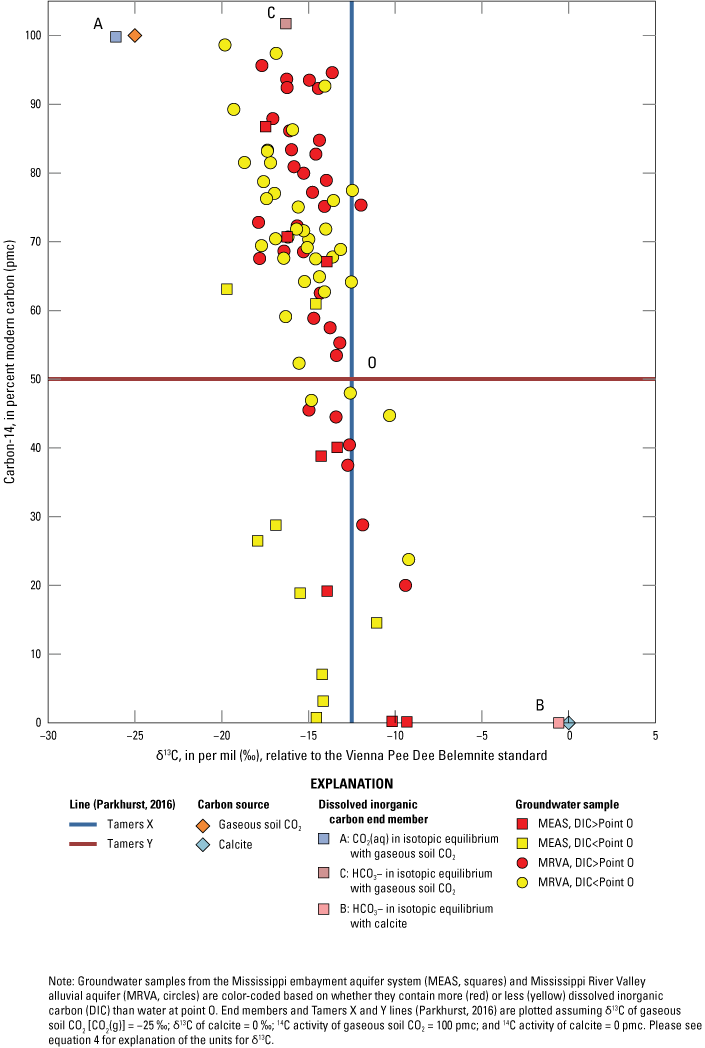
Relation between measured δ13C and 14C activities of samples collected from the Mississippi River Valley alluvial aquifer (MRVA) and Mississippi embayment aquifer system (MEAS).
Figure 7 can be used to interpret geochemical processes other than radioactive decay which may have affected the carbon compositions (DIC, δ13C, and 14C activity) of the samples (Han and others, 2012; Parkhurst, 2016). In figure 7, most MRVA samples have higher DIC and 14C than point O and δ13C between points C and O, thus appearing in the upper left quadrant of the plot, which is consistent with open-system carbonate mineral dissolution (Han and others, 2012). Most MEAS samples have lower DIC and 14C than point O and plot near the Tamers X line of figure 7, which is consistent with closed-system carbonate mineral dissolution. Based on observations from figure 7, processes such as carbonate mineral dissolution likely influenced the 14C/12C and 13C/12C of groundwater DIC in the MRVA and MEAS. The revised Fontes and Garnier 14C correction models (Han and Plummer, 2013), as implemented in NetpathXL (Parkhurst, 2016), were used to correct 14C activities of samples with carbon compositions that suggested carbonate mineral dissolution.
Corrected 14C activities using the twelve assumed combinations of carbon isotopic compositions of soil CO2 and calcite were generally greater for MRVA samples than for MEAS samples for open- and closed-system correction models (fig. 8). Most samples from the MRVA and from the MEAS had wide ranges (greater than or equal to 50 pmc) of open-system corrected 14C activities. Most samples from the MRVA had wide ranges of closed-system corrected 14C activities, but most samples from the MEAS did not have wide ranges of closed-system corrected 14C activities. The range of corrected 14C values for each sample reflects the sensitivity of the revised Fontes and Garnier 14C correction models to the possible soil CO2 and calcite compositions and open- versus closed-system assumptions used for corrections as well as the measured 14C activity of the sample.
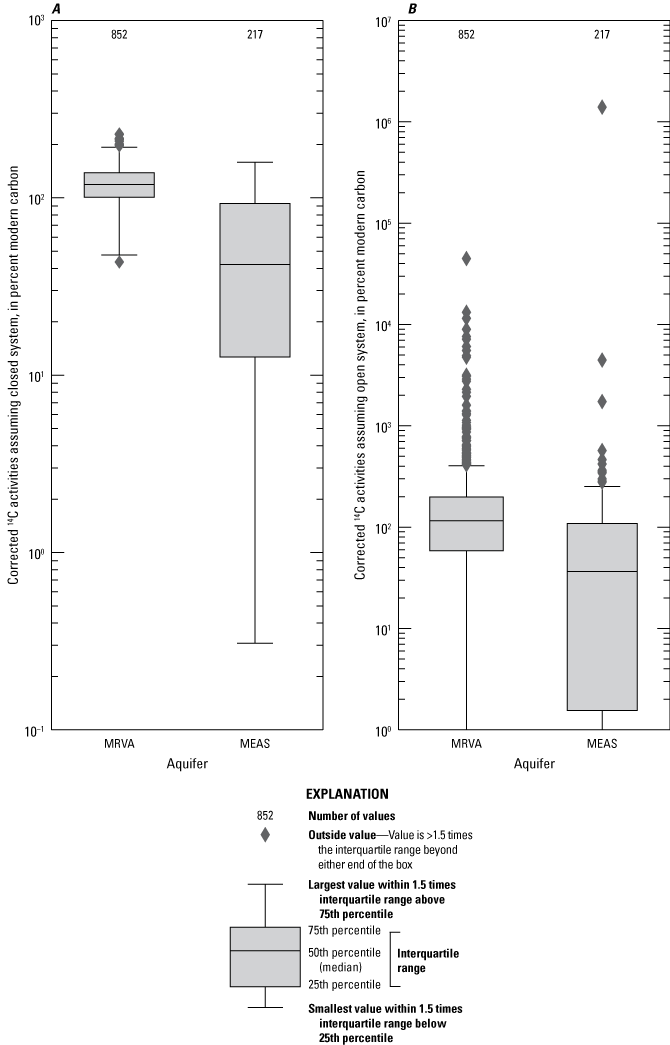
Corrected carbon-14 (14C) activities of groundwater samples from the Mississippi River Valley alluvial aquifer (MRVA) and the Mississippi embayment aquifer system (MEAS) based on the A, closed-system and B, open-system revised Fontes and Garnier 14C correction models for estimating the 14C activity of groundwater unaltered by geochemical processes (Han and Plummer, 2013).
Not all 14C values required correction because the carbon compositions of some samples were consistent with no dilution of 14C; uncorrected 14C activities were used for 41 percent of MRVA samples and 61 percent of MEAS samples for which LPMs were fit to 14C (table 4). Corrected 14C activities used for estimating ages of samples ranged from 51.34 to 121.1 pmc for the MRVA and from 7.24 to 102.7 pmc for the MEAS (Gratzer and others, 2025). Table 4 summarizes the number of samples for which each combination of correction model (open- or closed-system revised Fontes and Garnier 14C correction model), δ13Cs assumption, and δ13Cg assumption was used to correct a sample’s 14C activity. Of the samples for which a corrected 14C activity was used to date the sample, most MEAS samples were corrected using the closed-system revised Fontes and Garnier 14C correction model, and most MRVA samples were corrected using the open-system revised Fontes and Garnier 14C correction model (table 4).
Table 4.
Numbers of groundwater samples for which each combination of correction model type, δ13Cs assumption, and δ13Cg assumption was used to correct the carbon-14 activity used to estimate the age of a sample collected from the Mississippi River Valley alluvial aquifer (MRVA) or the Mississippi embayment aquifer system (MEAS) in 2018–20.[δ13Cs, abundance of carbon-13 (relative to carbon-12, equation 4) in calcite with which the water interacted; δ13Cg, abundance of carbon-13 in gaseous soil carbon dioxide with which the water interacted; na, not applicable]
Groundwater Age Lumped Parameter Models
Mean ages of 71 MRVA samples ranged from 12 to 22,000 years, with a median of 140 years (fig. 9). Most MRVA sample mean ages were less than 500 years old, and about one-third of the mean ages were less than 50 years. Most of the LPMs used for MRVA samples were BMMs or PEMs (table 3). Most of the LPMs for these samples were fit to tritium and 14C concentrations or tritium and SF6 concentrations.
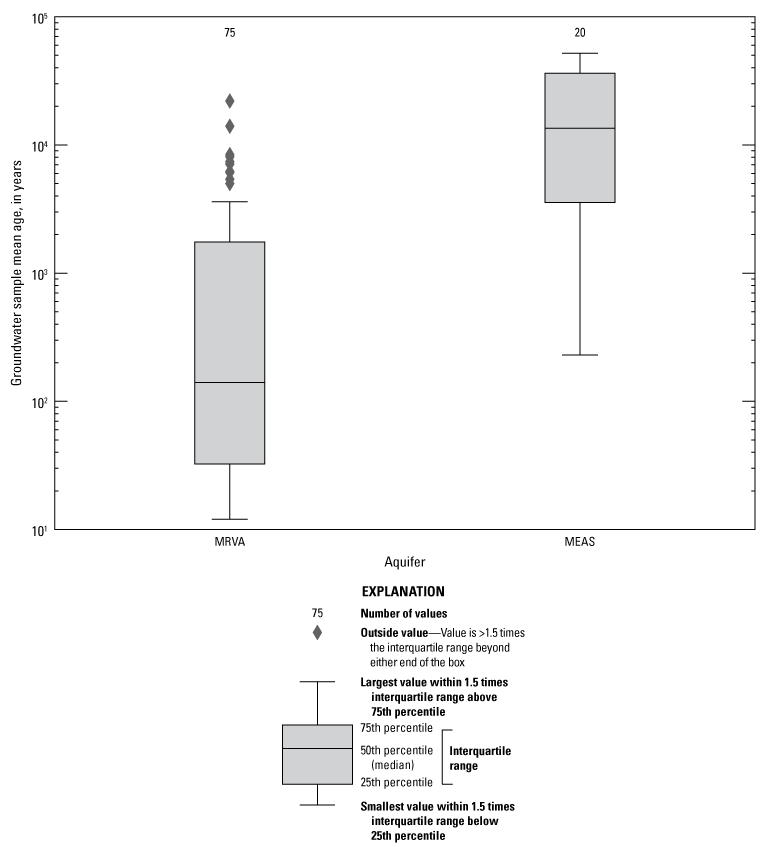
Distributions of mean ages of groundwater samples collected during 2018–20 from the Mississippi River Valley alluvial aquifer (MRVA) and Mississippi embayment aquifer system (MEAS).
Mean ages of 18 samples from the MEAS ranged from 230 to 52,000 or more years, with a median of 13,500 years, similar to results from a larger scale study of MEAS groundwater age (Solder, 2020). Most MEAS samples were at least 10,000 years old (fig. 9). Most MEAS samples were modeled as DMs; however, four MCAQ samples were modeled as EPMs, and two MCAQ samples were modeled as BMMs (table 3). Most MEAS models were fit to 14C alone. Four MCAQ models, including two BMMs and one EPM, were fit to 14C and tritium.
Tracer concentrations exhibited general relations between old and young tracers, suggesting that results of tracer measurement and any necessary corrections were reasonable (fig. 10). For example, corrected SF6 concentrations in premodern samples (based on tritium) were lower than concentrations in most mixed and modern samples (figs. 6, 10). Also, 14C activities (for corrected and uncorrected samples) generally increased with increasing corrected SF6 concentrations. Figure 10 also highlights the wider range of tracer concentrations in the MRVA compared to the MEAS. For example, samples in each tritium-based age category in the MRVA had a wide range of 14C activities, suggesting the presence of old groundwater in parts of the MRVA, also highlighting the importance of understanding carbon cycling in the MRVA to accurately interpret groundwater age using 14C.
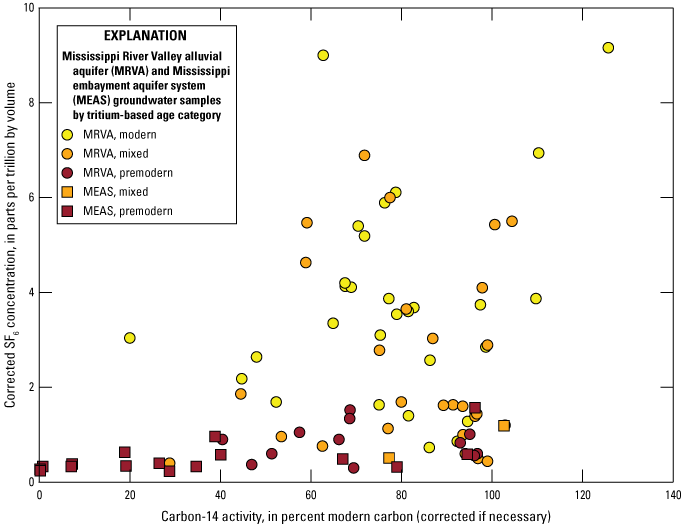
Carbon-14 activities, corrected if necessary, of Mississippi River Valley alluvial aquifer (MRVA) and Mississippi embayment aquifer system (MEAS) samples, relative to corrected sulfur hexafluoride (SF6) concentrations and tritium-based age categories of the samples.
Discussion
Tracer-based mean ages of groundwater samples collected from the MRVA varied spatially across the MAP (figs. 11A and 12) and increased with depth (fig. 13A). The oldest groundwater generally was found in the Grand Prairie and Cache regions, and younger groundwater was found in the St. Francis and Delta regions (fig. 12). The Grand Prairie region, the Cache region, and the central part of the Delta region exhibited high variability in groundwater age (fig. 11A). Groundwater in the MRVA generally was older where collected from deeper wells (fig. 13A), consistent with deeper water in an aquifer having traveled farther from its recharge zone than shallower water. In four of the six locations where paired shallow and deep MRVA wells were sampled, the ages of the samples collected from the deep MRVA wells were similar to the ages of the samples collected from the shallow MRVA wells, suggesting that stratification of groundwater age in the MRVA is not ubiquitous (table 5, fig. 1).
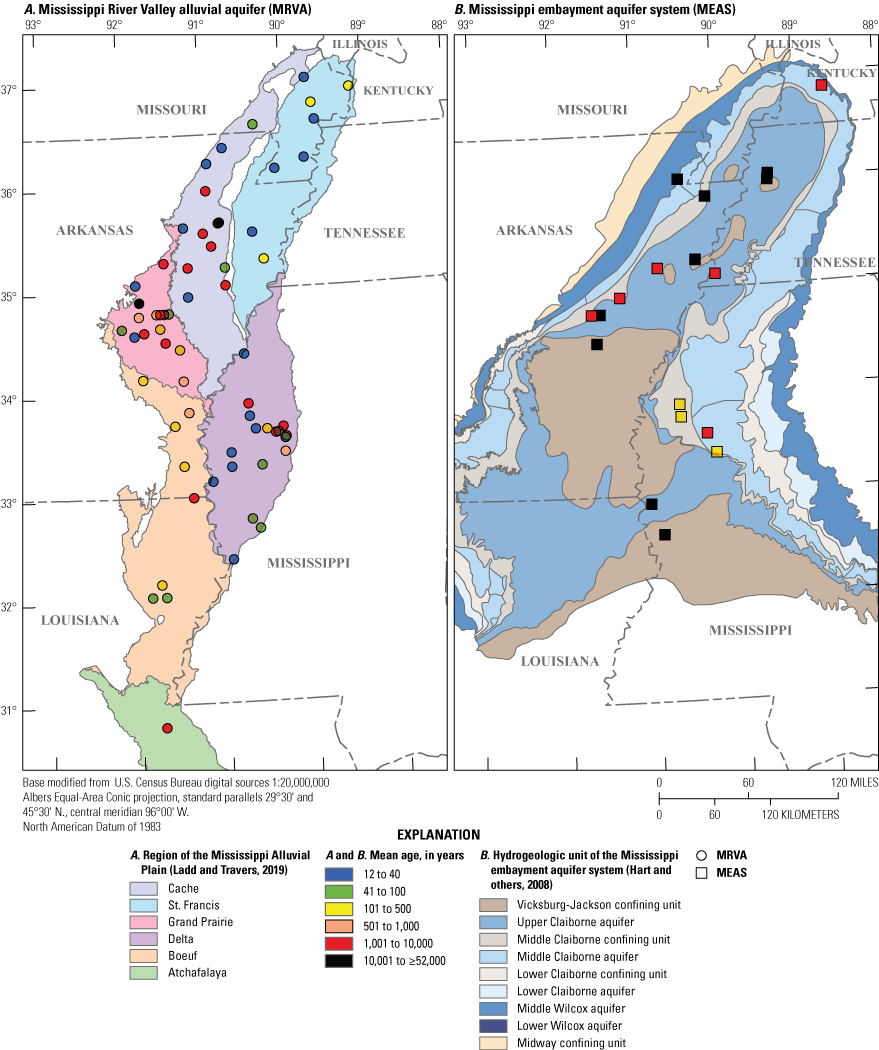
Spatial distributions of mean ages of samples collected from the A, Mississippi River Valley alluvial aquifer (MRVA) and B, Mississippi embayment aquifer system (MEAS).
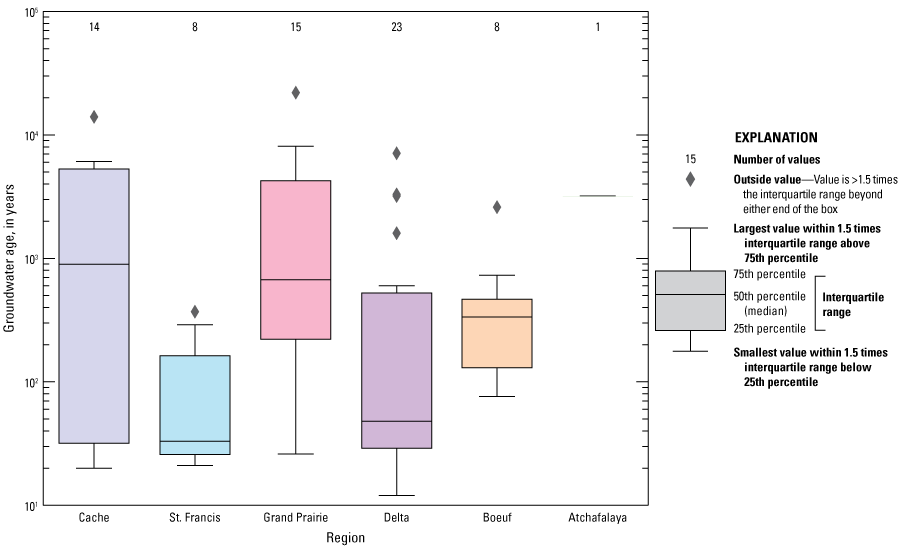
Distributions of mean ages of Mississippi River Valley alluvial aquifer (MRVA) groundwater samples collected from different regions of the Mississippi Alluvial Plain during 2018–20.
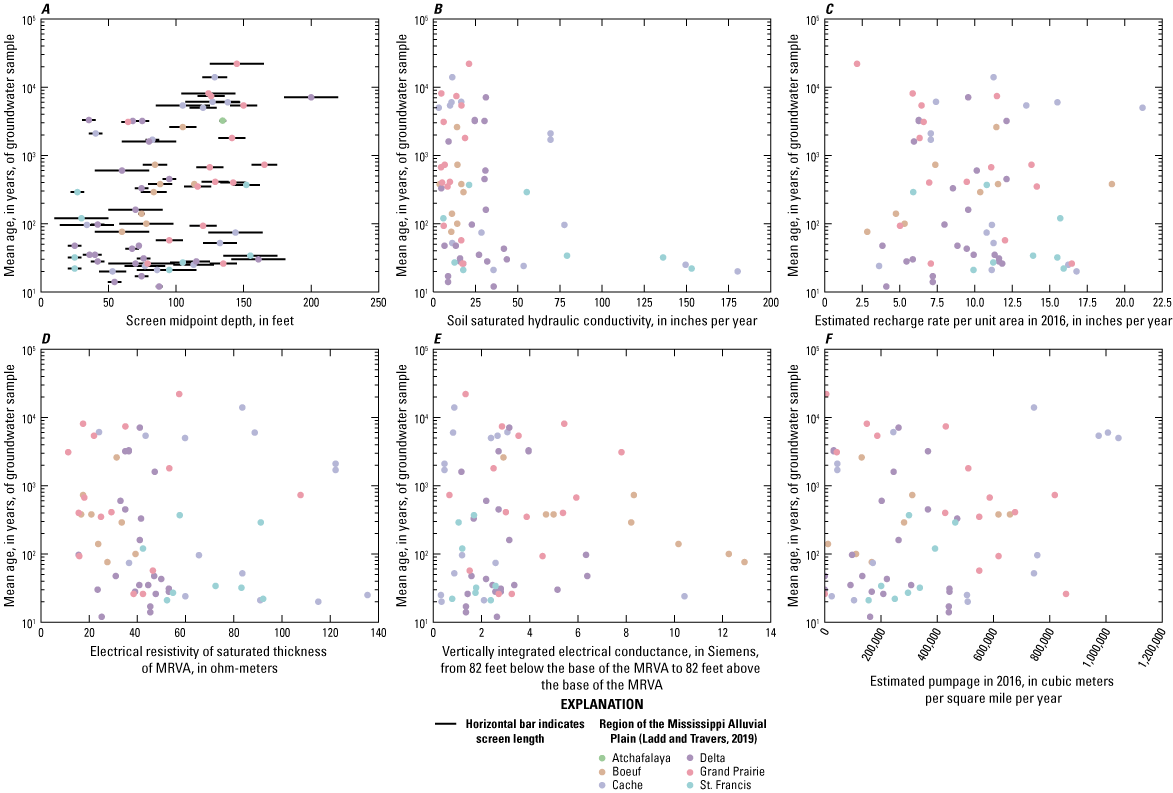
Relations of mean ages of Mississippi River Valley alluvial aquifer (MRVA) groundwater samples with A, depth; B, soil saturated hydraulic conductivity; C, estimated recharge per unit area in 2016; D, electrical resistivity of the saturated thickness of the MRVA; E, vertically integrated electrical conductance, in Siemens, from 82 feet below the base of the MRVA to 82 feet above the base of the MRVA, proxy for clay content of the sediment near the basal contact between the MRVA and an underlying unit; and F, annual groundwater pumpage.
Table 5.
Depths and mean ages of groundwater samples collected from paired wells in the Mississippi River Valley alluvial aquifer (MRVA) and the middle Claiborne aquifer (MCAQ) in 2018–20.[MRVA-MCAQ, a MRVA well paired with an MCAQ well; MRVA-MRVA, a shallow MRVA well paired with a deep MRVA well; MRVA-MRVA-MCAQ, a shallow MRVA well paired with a deep MRVA well and an MCAQ well; USGS, U.S. Geological Survey]
| Pair identifier (fig. 1B) | Pair type | Shallow MRVA well identifier | Deep well identifier | Depth to bottom of screen of shallow well (feet) | Depth to bottom of screen of deep well (feet) | Mean age of sample from shallow well (years) | Mean age of sample from deep well (years) |
|---|---|---|---|---|---|---|---|
| 3 | MRVA-MRVA | USGS 333900090123703 | USGS 333900090123702 | 90 | 220 | 160 | 7,100 |
| 8 | MRVA-MRVA | USGS 333315090105302 | USGS 333315090105301 | 40.5 | 80 | 3,300 | 3,200 |
| 9 | MRVA-MRVA | USGS 331654090501402 | USGS 331654090501401 | 47 | 81 | 28 | 31 |
| 12 | MRVA-MRVA | USGS 333824090320702 | USGS 333824090320701 | 59.5 | 79.5 | 14 | 17 |
| 14 | MRVA-MRVA | USGS 351305091143402 | USGS 351305091143401 | 45.5 | 87.5 | 2,100 | 1,700 |
| 1 | MRVA-MCAQ | AR008 351630090193301 | AR008 351630090193302 | 162 | 460 | 370 | 18,000 |
| 2 | MRVA-MCAQ | USGS 345618091150902 | USGS 345616091150201 | 101 | 275 | 21 | 10,000 |
| 4 | MRVA-MCAQ | USGS 334554090355302 | USGS 334554090355303 | 90 | 200 | 26 | 230 |
| 5 | MRVA-MCAQ | USGS 335308090362102 | USGS 335308090362101 | 100 | 236 | 1,600 | 490 |
| 6 | MRVA-MCAQ | AR008 344651091355101 | USGS 344651091355102 | 136 | 534 | 7,400 | 8,800 |
| 7 | MRVA-MCAQ | AR008 344659091293701 | AR008 344659091293702 | 130 | 446 | 93 | 31,000 |
| 10 | MRVA-MCAQ | USGS 332424090120902 | USGS 332424090120901 | 80 | 170 | 600 | 320 |
| 13 | MRVA-MCAQ | AR001 343014091325401 | AR008 343015091325401 | 144 | 677 | 8,100 | 18,000 |
| 11 | MRVA-MRVA-MCAQ | USGS 333547090180301; USGS_333548090180601 | USGS 333547090180501 | 73; 100 | 200 | 3,200; 450 | 3,400 |
Groundwater in the MRVA was generally young where soil saturated hydraulic conductivity (Ksat) was greater than 125 inches per year (in/yr), and the range in age was large in areas where Ksat was less than 100 in/yr (fig. 13B). The inverse relation between Ksat and age was most evident in the Cache and St. Francis regions, possibly because the highest soil Ksat values for sampled wells occurred in the Cache and St. Francis regions (fig. 13B). In the Cache region, MRVA samples collected where soil Ksat was high (greater than 75 in/yr) were young (less than or equal to 100 years), and samples collected where soil Ksat was low (less than 25 in/yr) were mostly old (greater than 4,000 years). The inverse relation between Ksat and age in the MRVA may exist because higher soil Ksat contributes to higher recharge rates, which result in younger groundwater ages along flow paths originating from the zones of high recharge. The large range in age exhibited by groundwater samples in areas with low soil Ksat may exist because soil Ksat has less influence on recharge where soil Ksat is low.
Mean groundwater ages in the MRVA did not show a relation with estimated annual recharge when ages and recharge estimates were compared across the entire MAP (fig. 13C). However, the samples from the Grand Prairie region exhibited a weak negative relation (Pearson correlation coefficient = −0.5; p-value = 0.04) between recharge and groundwater age (fig. 13C). For example, samples collected from the MRVA in the Grand Prairie region were young (less than 1,000 years old) in areas where estimated recharge rates were high (greater than 12.5 in/yr), but ages varied widely where recharge rates were less than 12.5 in/yr (fig. 13C). This relation is consistent with higher recharge rates leading to younger groundwater ages by supplying more water of zero age to flow paths and causing faster flow rates through the aquifer by steepening hydraulic head gradients along flow paths.
No relation was observed between MRVA mean groundwater ages and vertically averaged electrical resistivity (proxy for hydraulic conductivity) of the MRVA saturated thickness (fig. 13D). One possible explanation for the lack of relation between age and resistivity is that resistivity within 1.24 mi of the well is not representative of hydraulic conductivities of the sediment that the sampled groundwater flowed through from its recharge zone to the well.
Across the MAP, groundwater older than about 1,000 years occurred in areas where vertically integrated electrical conductance (proxy for clay content) 82 ft above and below the base of the MRVA was low (fig. 13E); low values suggest lithologic potential for hydraulic connection between the MRVA and an underlying aquifer (James and Minsley, 2021). The relation between lithologic potential for hydraulic connection and age was weak but may indicate that old groundwater in the MRVA has mixed with water that flowed into the MRVA from underlying units. The relation between lithologic potential for hydraulic connection and age was strongest in the Boeuf region (fig. 13E). Additional evidence for old groundwater from underlying aquifers moving upward into the MRVA is that groundwater in the MRVA generally was older where no confining unit separates the MRVA from an underlying aquifer (fig. 14). For example, mean groundwater ages were oldest in the MRVA where the MCAQ or MWAQ directly underlie the aquifer (fig. 14).
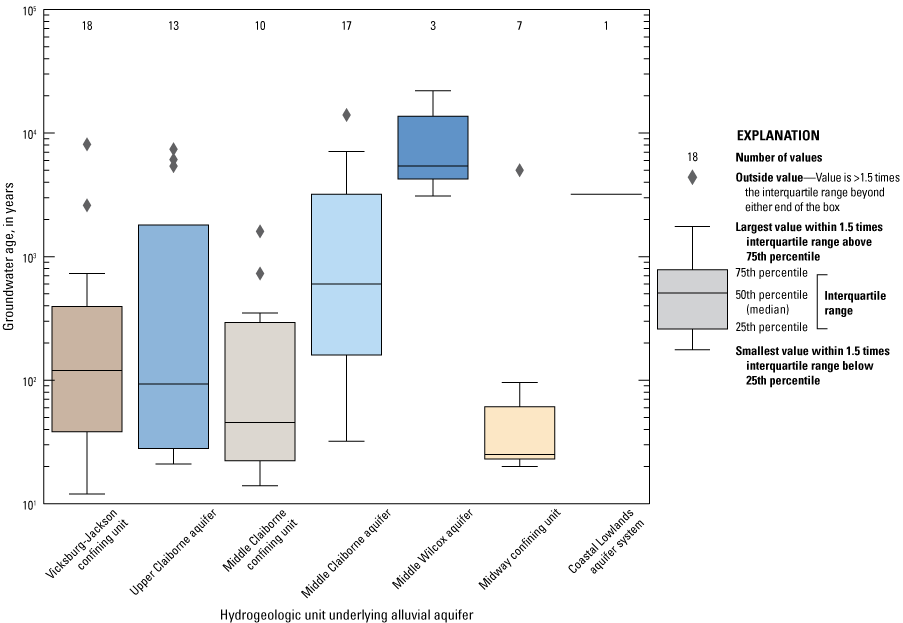
Distributions of mean ages of Mississippi River Valley alluvial aquifer groundwater samples collected from sites where the aquifer overlies different hydrogeologic units.
Groundwater pumpage volumes in 2016 (Wilson, 2021) and mean ages were not related across the MAP, but weak relations were seen in some regions of the MAP (fig. 13F). The Cache region exhibited a weak positive relation between pumpage and age. Some of the oldest MRVA samples in the Cache region, including the oldest MRVA sample in the Cache region (14,000 years), were collected in areas of high pumpage (fig. 13F). These old Cache region samples were collected where the MRVA overlies an aquifer and low electrical conductance suggests lithologic potential for connection between the MRVA and the underlying aquifer. Therefore, the positive relation between pumpage and age in the Cache region likely resulted from water flowing up into the MRVA from underlying aquifers in areas of high pumpage. Conversely, the Grand Prairie region exhibited a weak negative relation between pumpage and age (fig. 13F). For example, samples collected from the MRVA in the Grand Prairie region had mean ages less than 1,000 years where estimated pumpage rates were greater than 600,000 cubic meters per square mile per year and mean ages mostly greater than or equal to 3,000 years where estimated pumpage rates were less than 200,000 cubic meters per square mile per year. Additionally, three of the four youngest samples from the Grand Prairie region (less than 100 years old) were collected at depths greater than 100 ft in areas of high pumpage. The negative relation between pumpage and age in the Grand Prairie region suggests that high pumpage increased hydraulic gradients from the water table toward the production zone of the MRVA, which is where most of the Grand Prairie wells sampled for this study were screened. These steep hydraulic gradients resulted in shorter groundwater travel times in areas of high pumpage from recharge zones to the production zone of the MRVA. To understand how pumpage influences groundwater age at a location, the following must be considered: the age of water near the water table, the age of any water that flows into the MRVA from underlying aquifers, the hydraulic conductivity of the sediment between the water table and the well screen, and the hydraulic conductivity of the sediment between the underlying aquifer and the well screen.
Conclusions
The objective of this study was to characterize the magnitudes and spatial distribution of groundwater age in the Mississippi River Valley alluvial aquifer (MRVA). Samples were collected from 69 MRVA wells and 19 wells in underlying units of the Mississippi embayment aquifer system (MEAS) and analyzed for sulfur hexafluoride (SF6), tritium, carbon-14 (14C), and (or) helium. Age distributions were modeled using the U.S. Geological Survey software TracerLPM, and the mean ages of the distributions were used to summarize results. Most of the lumped parameter models (LPMs) for MRVA samples were fit to tritium and 14C concentrations or tritium and SF6 concentrations, whereas most models for MEAS samples were fit to 14C alone. Most of the LPMs used for MRVA samples were binary mixing models or partial exponential models. Most MEAS samples were modeled as dispersion models, but four samples from the middle Claiborne aquifer were modeled as exponential piston flow models, and two samples from the middle Claiborne aquifer were modeled as binary mixing models. Mean ages of MRVA samples ranged from 12 to 22,000 years, with a median of 140 years. Mean ages of MRVA samples were generally younger than those of the MEAS, which ranged from 230 to 52,000 or more years, with a median of 13,500 years, but both systems exhibited variability in groundwater age.
The high degree of spatial variability in groundwater age in the relatively thin and shallow MRVA was likely related to well depth, soil saturated hydraulic conductivity, and hydraulic connection with underlying aquifers. The age of groundwater in the MRVA generally increased as well depth increased. Groundwater was generally young where soil saturated hydraulic conductivity was high, which likely contributes to higher recharge rates. Most old MRVA groundwater samples were collected where the MRVA overlies a deeper MEAS aquifer, and low electrical conductance suggests lithologic potential for hydraulic connection between the MRVA and the underlying unit. In contrast, most young MRVA samples were collected where the MRVA overlies a confining unit or where the texture of the contact between the MRVA and an underlying unit is likely fine, suggesting lower potential for hydraulic connection between the MRVA and the deeper unit. The spatial variability of MRVA groundwater age across the Mississippi Alluvial Plain (MAP) was not explained by any of the following variables alone: recharge rates, pumpage rates, or electrical resistivity of the saturated thickness of the MRVA (a proxy for hydraulic conductivity).
Different regions of the MAP exhibited different relations between groundwater age and hydrologic factors that may influence age. For example, in the Cache region of the MAP, some of the oldest MRVA groundwater samples (with mean ages greater than or equal to 5,400 years) were collected where pumpage rates were high, and low electrical conductance at the base of the MRVA suggests lithologic potential for connection between the MRVA and the underlying aquifer. Therefore, in the Cache region, pumpage may induce inflow of old groundwater from underlying aquifers into the MRVA. In contrast, in the Grand Prairie region, MRVA samples were young (less than 1,000 years) where estimated pumpage rates were higher, and samples were mostly old (greater than or equal to 3,000 years) where pumpage rates were lower. Therefore, high pumpage rates in the Grand Prairie region may shorten travel times from recharge zones to the production zone of the MRVA near its base (where most samples were collected in the Grand Prairie region for this study), resulting in young water at depth. Also, in the Grand Prairie region of the MAP, samples from the MRVA were young (less than 1,000 years) in areas where estimated recharge rates were high (greater than 12.5 inches per year). Therefore, in the Grand Prairie region, high recharge rates likely lead to young groundwater ages by increasing groundwater flow rates and adding water of zero age to the MRVA.
The heterogeneity in MRVA groundwater age and variability in the relations between age and potential drivers of age reflect the complex interactions between hydrogeology and hydrologic stresses governing water availability from the MRVA. Monitoring and modeling the characteristics of this water resource can provide information about its sustainability.
References Cited
Ackerman, D.J., 1996, Hydrology of the Mississippi River Valley alluvial aquifer, south-central United States: U.S. Geological Survey Professional Paper 1416–D, 56 p., accessed June 11, 2024, at https://doi.org/10.3133/pp1416D.
Aeschbach-Hertig, W., Peeters, F., Beyerle, U., and Kipfer, R., 2000, Paleotemperature reconstruction from noble gases in groundwater taking into account equilibration with entrapped air: Nature, v. 405, no. 6790, p. 1040–1044, accessed June 10, 2024, at https://doi.org/10.1038/35016542.
American Public Health Association, American Water Works Association, and Water Environment Federation, 1998, Standard methods for the examination of water and wastewater (20th ed.): Washington, D.C., American Public Health Association, American Water Works Association, and Water Environment Federation, part 3120, 1,220 p., p. 3–37 to 3–43.
Andrews, J.N., 1985, The isotopic composition of radiogenic helium and its use to study groundwater movement in confined aquifers: Chemical Geology, v. 49, nos. 1–3, p. 339–351, accessed June 10, 2024, at https://doi.org/10.1016/0009-2541(85)90166-4.
Borrok, D.M., Lenz, R.M., Jennings, J.E., Gentry, M.L., Steensma, J., and Vinson, D.S., 2018, The origins of high concentrations of iron, sodium, bicarbonate, and arsenic in the Lower Mississippi River alluvial aquifer: Applied Geochemistry, v. 98, p. 383–392, accessed June 10, 2024, at https://doi.org/10.1016/j.apgeochem.2018.10.014.
Busenberg, E., and Plummer, L.N., 2000, Dating young groundwater with sulfur hexafluoride—Natural and anthropogenic sources of sulfur hexafluoride: Water Resources Research, v. 36, no. 10, p. 3011–3030, accessed June 10, 2024, at https://doi.org/10.1029/2000WR900151.
Clark, B.R., Westerman, D.A., and Fugitt, D.T., 2013, Enhancements to the Mississippi Embayment Regional Aquifer Study (MERAS) groundwater-flow model and simulations of sustainable water-level scenarios: U.S. Geological Survey Scientific Investigations Report 2013–5161, 29 p., accessed June 10, 2024, at https://pubs.usgs.gov/sir/2013/5161/.
Eberts, S.M., Böhlke, J.K., Kauffmann, L.J., and Jurgens, B.C., 2012, Comparison of particle-tracking and lumped-parameter age-distribution models for evaluating vulnerability of production wells to contamination: Hydrogeology Journal, v. 20, no. 1, p. 263–282, accessed June 10, 2024, at https://link.springer.com/article/10.1007/s10040-011-0810-6.
Garbarino, J.R., 1999, Methods of analysis by the U.S. Geological Survey National Water Quality Laboratory—Determination of dissolved arsenic, boron, lithium, selenium, strontium, thallium, and vanadium using inductively coupled plasma-mass spectrometry: U.S. Geological Survey Open-File Report 99–93, 31 p.
Gratzer, M.C., Solder, J.E., Knierim, K.J., and Kingsbury, J.A., 2025, Data for groundwater age estimates for the Mississippi River Valley alluvial aquifer based on tracer data collected during 2018–20: U.S. Geological Survey data release, https://doi.org/10.5066/P14DPCXE.
Haugh, C.J., Knierim, K.J., and Kingsbury, J.A., 2020, Simulated groundwater residence times in two principal aquifers of the Mississippi embayment physiographic region: U.S. Geological Survey data release, accessed June 10, 2024, at https://doi.org/10.5066/P9X513WO.
Heaton, T.H.E., and Vogel, J.C., 1981, “Excess air” in groundwater: Journal of Hydrology, v. 50, p. 201–216, accessed June 10, 2024, at https://doi.org/10.1016/0022-1694(81)90070-6.
James, S.R., and Minsley, B.J., 2021, Combined results and derivative products of hydrogeologic structure and properties from airborne electromagnetic surveys in the Mississippi Alluvial Plain: U.S. Geological Survey data release, accessed June 10, 2024, at https://doi.org/10.5066/P9382RCI.
Jurgens, B.C., Böhlke, J., Haase, K., Busenberg, E., Hunt, A.G., and Hansen, J.A., 2020, DGMETA (version 1)—Dissolved gas modeling and environmental tracer analysis computer program: U.S. Geological Survey Techniques and Methods, book 4, chap. F5, 50 p., accessed June 10, 2024, at https://doi.org/10.3133/tm4F5.
Kingsbury, J.A., Barlow, J.R.B., Katz, B.G., Welch, H.L., Tollett, R.W., and Fahlquist, L.S., 2014, The quality of our Nation’s waters—Water quality in the Mississippi embayment–Texas coastal uplands aquifer system and Mississippi River Valley alluvial aquifer, south-central United States, 1994–2008: U.S. Geological Survey Circular 1356, 72 p., accessed June 13, 2024, at https://doi.org/10.3133/cir1356.
Kresse, T.M., and Fazio, J.A., 2002, Pesticides, water quality and geochemical evolution of ground water in the alluvial aquifer, Bayou Bartholomew watershed, Arkansas: Arkansas Ambient Ground-Water Monitoring Program, Arkansas Department of Environmental Quality, Water Quality Report WQ02–05–1, 115 p.
Kresse, T.M., Hays, P.D., Merriman, K.R., Gillip, J.A., Fugitt, D.T., Spellman, J.L., Nottmeier, A.M., Westerman, D.A., Blackstock, J.M., and Battreal, J.L., 2014, Aquifers of Arkansas—Protection, management, and hydrologic and geochemical characteristics of groundwater resources in Arkansas: U.S. Geological Survey Scientific Investigations Report 2014–5149, 334 p.
Ladd, D.E., and Travers, L.R., 2019, Generalized regions of the Mississippi Alluvial Plain: U.S. Geological Survey data release, accessed June 13, 2024, at https://doi.org/10.5066/P915ZZQM.
Larsen, D., Waldron, B., Schoefernacker, S., Gallo, H., Koban, J., and Bradshaw, E., 2016, Application of environmental tracers in the Memphis aquifer and implication for sustainability of groundwater resources in the Memphis metropolitan area, Tennessee: Journal of Contemporary Water Research & Education, v. 159, no. 1, p. 78–104.
Lindsey, B.D., Jurgens, B.C., and Belitz, K., 2019, Tritium as an indicator of modern, mixed, and premodern groundwater age: U.S. Geological Survey Scientific Investigations Report 2019–5090, 18 p., accessed June 13, 2024, at https://doi.org/10.3133/sir20195090.
Mazáč, O., Kelly, W.E., and Landa, I., 1985, A hydrogeophysical model for relations between electrical and hydraulic properties of aquifers: Journal of Hydrology, v. 79, nos. 1–2, p. 1–19, accessed June 13, 2024, at https://doi.org/10.1016/0022-1694(85)90178-7.
McGuire, V.L., Seanor, R.C., Asquith, W.H., Nottmeier, A.M., Smith, D.C., Tollett, R.W., Kress, W.H., and Strauch, K.R., 2020, Datasets used to map the potentiometric surface, Mississippi River Valley alluvial aquifer, spring 2018: U.S. Geological Survey data release, accessed June 13, 2024, at https://doi.org/10.5066/P992HD1R.
McGuire, V.L., Seanor, R.C., Asquith, W.H., Strauch, K.R., Nottmeier, A.M., Thomas, J.C., Tollett, R.W., and Kress, W.H., 2021, Datasets used to map the potentiometric surface, Mississippi River Valley alluvial aquifer, spring 2020: U.S. Geological Survey data release, accessed June 13, 2024, at https://doi.org/10.5066/P9CXDIPL.
Michel, R.L., Jurgens, B.C., and Young, M.B., 2018, Tritium deposition in precipitation in the United States, 1953–2012: U.S. Geological Survey Scientific Investigations Report 2018–5086, 11 p., accessed June 13, 2024, at https://doi.org/10.3133/sir20185086.
Minsley, B.J., Rigby, J.R., James, S.R., Burton, B.L., Knierim, K.J., Pace, M.D., Bedrosian, P.A., and Kress, W.H., 2021, Airborne geophysical surveys of the lower Mississippi Valley demonstrate system-scale mapping of subsurface architecture: Communications Earth & Environment, v. 2, no. 1, article 131, 14 p.
National Environmental Methods Index, 2023, Standard methods—5310B—Total organic carbon by high-temperature combustion: National Environmental Methods Index web page, accessed February 20, 2023, at https://www.nemi.gov/methods/method_summary/5717/.
National Ocean Sciences Accelerator Mass Spectrometry, 2020, Radiocarbon data calculations: Woods Hole Oceanographic Institution web page, accessed February 19, 2023, at https://www2.whoi.edu/site/nosams/calculations-and-reporting-of-results/.
Painter, J.A., and Westerman, D.A., 2018, Mississippi Alluvial Plain extent, November 2017: U.S. Geological Survey data release, accessed June 13, 2024, at https://doi.org/10.5066/F70R9NMJ.
Parkhurst, D.L., 2016, Implementation of the revised Fontes and Garnier radiocarbon adjustment model in NetpathXL: U.S. Geological Survey, 7 p., accessed June 13, 2024, at https://water.usgs.gov/water-resources/software/NETPATH/Revised_Fontes_and_Garnier_in_NetpathXL.pdf.
Plummer, L.N., Eggleston, J.R., Andreasen, D.C., Raffensperger, J.P., Hunt, A.G., and Casile, G.C., 2012, Old groundwater in parts of the upper Patapsco aquifer, Atlantic Coastal Plain, Maryland, USA—Evidence from radiocarbon, chlorine-36 and helium-4: Hydrogeology Journal, v. 20, no. 7, p. 1269–1294.
Soil Survey Staff, 2020, Gridded National Soil Survey Geographic (gNATSGO) database for the conterminous United States: U.S. Department of Agriculture, Natural Resources Conservation Service database, accessed April 14, 2020, at https://nrcs.app.box.com/v/soils. [FY2020 official release.]
Solder, J.E., 2020, Groundwater age and susceptibility of south Atlantic and Gulf Coast principal aquifers of the contiguous United States: U.S. Geological Survey Scientific Investigations Report 2020–5050, 46 p., accessed June 13, 2024, at https://doi.org/10.3133/sir20205050.
Torak, L.J., and Painter, J.A., 2019, Digital surfaces of the bottom altitude and thickness of the Mississippi River Valley alluvial aquifer and site data within the Mississippi Alluvial Plain project region: U.S. Geological Survey data release, accessed June 13, 2024, at https://doi.org/10.5066/P9D9XR5F.
University of Miami Tritium Laboratory, 2023, 3H analysis by gas proportional counting: University of Miami Tritium Laboratory web page, accessed June 13, 2024, at https://tritium.rsmas.miami.edu/analytical-services/3h-analysis-by-gas-proportional-counting/.
U.S. Geological Survey [USGS], [variously dated], National field manual for the collection of water-quality data: U.S. Geological Survey Techniques of Water-Resources Investigations, book 9, 6 chap. (A1–A6), accessed June 13, 2024, at https://pubs.water.usgs.gov/twri9A.
U.S. Geological Survey [USGS], 2011, Change to solubility equations for oxygen in water: U.S. Geological Survey, Office of Water Quality Branch Technical Memorandum No. 11.03, accessed June 13, 2023, at https://water.usgs.gov/water-resources/memos/documents/WQ.2011.03.pdf.
U.S. Geological Survey [USGS], 2019, GeoLog Locator, USGS web page, accessed June 13, 2024, at https://webapps.usgs.gov/GeoLogLocator/#!/.
USGS Groundwater Dating Laboratory, 2023a, Analytical procedures for dissolved gases N2 / Ar: USGS Groundwater Dating Laboratory web page, accessed March 9, 2023, at https://water.usgs.gov/lab/dissolved-gas/lab/analytical_procedures/.
USGS Groundwater Dating Laboratory, 2023b, Analytical procedures for SF6: USGS Groundwater Dating Laboratory web page, accessed March 9, 2023, at https://water.usgs.gov/lab/SF6/lab/analytical_procedures/index.html.
USGS Groundwater Dating Laboratory, 2023c, Atmospheric mixing ratios of CFC-11, CFC-12, CFC-113, SF6 x 100, and tritium in precipitation for Northern Hemisphere atmosphere: USGS Groundwater Dating Laboratory web page, accessed March 13, 2023, at https://water.usgs.gov/lab/software/air_curve/index.html.
USGS Groundwater Dating Laboratory, 2023d, Dissolved gas N2 / Ar sample collection procedure: USGS Groundwater Dating Laboratory web page, accessed February 20, 2023, at https://water.usgs.gov/lab/dissolved-gas/sampling/.
Wacaster, S.R., Gratzer, M.C., II, Knierim, K.J., and Kingsbury, J.A., 2021, Groundwater age categories based on tritium concentrations in samples collected from the Mississippi River Valley alluvial aquifer and aquifers of the Mississippi embayment principal aquifer system: U.S. Geological Survey data release, accessed June 13, 2024, at https://doi.org/10.5066/P9980P5H.
Westenbroek, S.M., and Nielsen, M.G., 2023, Model archive and output files for net infiltration, runoff, and irrigation water use for the Mississippi Embayment Regional Aquifer System, 2000 to 2020, simulated with the Soil-Water-Balance model: U.S. Geological Survey data release, accessed June 13, 2024, at https://doi.org/10.5066/P97KK17G.
Wilson, J.L., 2021, Aquaculture and Irrigation Water-Use Model (AIWUM) version 1.0 estimates and related datasets for the Mississippi Alluvial Plain, 1999–2017 (ver. 2.0, April 2021): U.S. Geological Survey data release, accessed June 13, 2024, at https://doi.org/10.5066/P9JMO9G4.
Conversion Factors
U.S. customary units to International System of Units
Temperature in degrees Celsius (°C) may be converted to degrees Fahrenheit (°F) as follows: °F = (1.8 × °C) + 32.
Supplemental Information
Corrected sulfur hexafluoride (SF6) concentrations are expressed in parts per trillion by volume (pptv).
Specific conductance is in microsiemens per centimeter at 25 degrees Celsius (µS/cm at 25 °C).
Abbreviations
BMM
binary mixing model
CE
closed-system equilibration
DIC
dissolved inorganic carbon
DM
dispersion model
DOC
dissolved organic carbon
DP
dispersion parameter
EMM
exponential mixing model
EPM
exponential piston flow model
ICP
inductively coupled plasma
Ksat
soil saturated hydraulic conductivity
LPM
lumped parameter model
LWAQ
lower Wilcox aquifer
MAP
Mississippi Alluvial Plain
MCAQ
middle Claiborne aquifer
MEAS
Mississippi embayment aquifer system
MRVA
Mississippi River Valley alluvial aquifer
MWAQ
middle Wilcox aquifer
PEM
partial exponential model
PFM
piston flow model
TDS
total dissolved solids
TU
tritium unit
UA
Unfractionated Excess Air (model)
UCAQ
upper Claiborne aquifer
USGS
U.S. Geological Survey
VSMOW
Vienna Standard Mean Ocean Water
For more information about this publication, contact
Director, Lower Mississippi-Gulf Water Science Center
U.S. Geological Survey
640 Grassmere Park, Suite 100
Nashville, TN 37211
For additional information, visit
https://www.usgs.gov/centers/lmg-water/
Publishing support provided by
Lafayette Publishing Service Center
Disclaimers
Any use of trade, firm, or product names is for descriptive purposes only and does not imply endorsement by the U.S. Government.
Although this information product, for the most part, is in the public domain, it also may contain copyrighted materials as noted in the text. Permission to reproduce copyrighted items must be secured from the copyright owner.
Suggested Citation
Gratzer, M.C., Solder, J.E., Knierim, K.J., Kingsbury, J.A., O’Reilly, A.M., and Davidson, G.R., 2025, Groundwater age estimates for the Mississippi River Valley alluvial aquifer based on tracer data collected during 2018–20: U.S. Geological Survey Scientific Investigations Report 2024–5127, 34 p., https://doi.org/10.3133/sir20245127.
ISSN: 2328-0328 (online)
Study Area
| Publication type | Report |
|---|---|
| Publication Subtype | USGS Numbered Series |
| Title | Groundwater age estimates for the Mississippi River Valley alluvial aquifer based on tracer data collected during 2018–20 |
| Series title | Scientific Investigations Report |
| Series number | 2024-5127 |
| DOI | 10.3133/sir20245127 |
| Publication Date | February 13, 2025 |
| Year Published | 2025 |
| Language | English |
| Publisher | U.S. Geological Survey |
| Publisher location | Reston, VA |
| Contributing office(s) | Lower Mississippi-Gulf Water Science Center |
| Description | Report: viii, 34 p.; Data Release |
| Country | United States |
| State | Alabama, Arkansas, Illinois, Kentucky, Louisiana, MIssissippi, Missouri, Tennessee |
| Online Only (Y/N) | Y |