

Geologic Framework and Holocene Sand Thickness Offshore of Seven Mile Island, New Jersey
Links
- Document: Report (4.74 MB pdf) , HTML , XML
- Data Releases:
- USGS Data Release - Archive of chirp subbottom profile data collected in 2022 from Seven Mile Island, New Jersey
- USGS Data Release - Coastal multibeam bathymetry and backscatter data collected in May 2021 from Seven Mile Island, New Jersey
- NGMDB Index Page: National Geologic Map Database Index Page (html)
- Download citation as: RIS | Dublin Core
Acknowledgments
The authors would like to thank Lenore Tedesco, of The Wetlands Institute, for help with survey logistics and planning. Robert Smith and Scott Wahl of the Boroughs of Avalon and Stone Harbor also aided with survey logistics and planning. This research was funded by the National Fish and Wildlife Foundation grant number 2300.16.055110 and the U.S. Geological Survey (USGS) Coastal and Marine Hazards and Resources Program.
This work would not have been possible without the help of U.S. Geological Survey employees Julie Bernier, Nancy DeWitt, Andrew Farmer, Ben Galbraith, Erin Lyons, Billy Reynolds, and Chelsea Stalk, who aided in field operations at sea, on personal watercraft, and on land. Jason Chaytor and Jenna Hill, also of the U.S. Geological Survey, provided insightful reviews of this report.
Abstract
The U.S. Geological Survey assessed the Quaternary evolution of Seven Mile Island, New Jersey, to quantify coastal sediment availability, which is crucial for establishing sediment budgets, understanding sediment dispersal, and managing coastlines. This report presents preliminary interpretations of seismic profiles, maps of Holocene sand thickness from the shoreline to 2 kilometers offshore, and tables quantifying the volume of available sediment along the coastal margin based on data collected during 2021 and 2022. The results reveal spatial variability in the thickness and cross-shore extent of Holocene sand. The study area was separated into northern, central, and southern zones by using underlying stratigraphy and geomorphic features. The characteristics and spatial extent of the Holocene sand deposit indicate that hydrodynamic processes contribute to its spatial variability. Northern Seven Mile Island contains the thickest deposits of Holocene sand that were formed by sediment bypass around the Townsends Inlet ebb-tidal delta. Specifically, swash bars have welded to the updrift end of Seven Mile Island and have formed thick deposits of Holocene sand that thicken landward and taper seaward. Despite their thickness, these deposits have the smallest cross-shore extent; therefore, northern Seven Mile Island has the smallest volume of Holocene sand of the three geomorphic zones. Central Seven Mile Island has the thinnest Holocene sand deposits because this section of the barrier island is outside the influence of ebb-tidal deltas. Southern Seven Mile Island has the greatest volumes of Holocene sand because of increased accommodation and deposition adjacent to the Hereford Inlet ebb-tidal delta. Even though tidal inlets exert variable influence on the three geomorphic zones, sediment is distributed fairly uniformly within each geomorphic zone; each of the three zones contains 31.05–36.48 percent of the volume of available Holocene sand.
Introduction
The availability of coastal sediment is important to determine the necessary volume and placement of dredged sediment on the beach and dunes. Nevertheless, most of the studies that evaluate the effectiveness of beach nourishment focus on the subaerial environment, with limited data from the shallow marine environment (U.S. Army Corps of Engineers [USACE], 2014; Stockton University Coastal Research Center, 2019). Recent studies have demonstrated that determining sediment availability in the subaerial and submarine environments can aid in the prediction of alongshore and across-shore sediment fluxes and in the distribution of future placement of nourished sediment across the coastal profile (Harley and others, 2022; Kinsela and others, 2022; van der Spek and others, 2022). Furthermore, some beach environments with chronic erosion problems that require more frequent nourishment have been found to be spatially coincident with lower volumes of available sand in the nearshore marine environment (Miselis and McNinch, 2006; Wei and others, 2021; Wei and Miselis, 2022).
Understanding cross- and alongshore sediment distribution is important at the study site, Seven Mile Island in New Jersey (fig. 1), because beach and dune nourishment projects in this area are frequently conducted by the two boroughs on the island, Avalon and Stone Harbor, and by the USACE. Beach and dune nourishment was initiated after 1962, when a severe winter storm caused widespread erosion to infrastructure on the island. Due to construction and maintenance of dunes at Stone Harbor and Avalon, infrastructure damage was minimal after Hurricane Sandy impacted the southern New Jersey coast in 2012 (Stockton University Coastal Research Center, 2012).
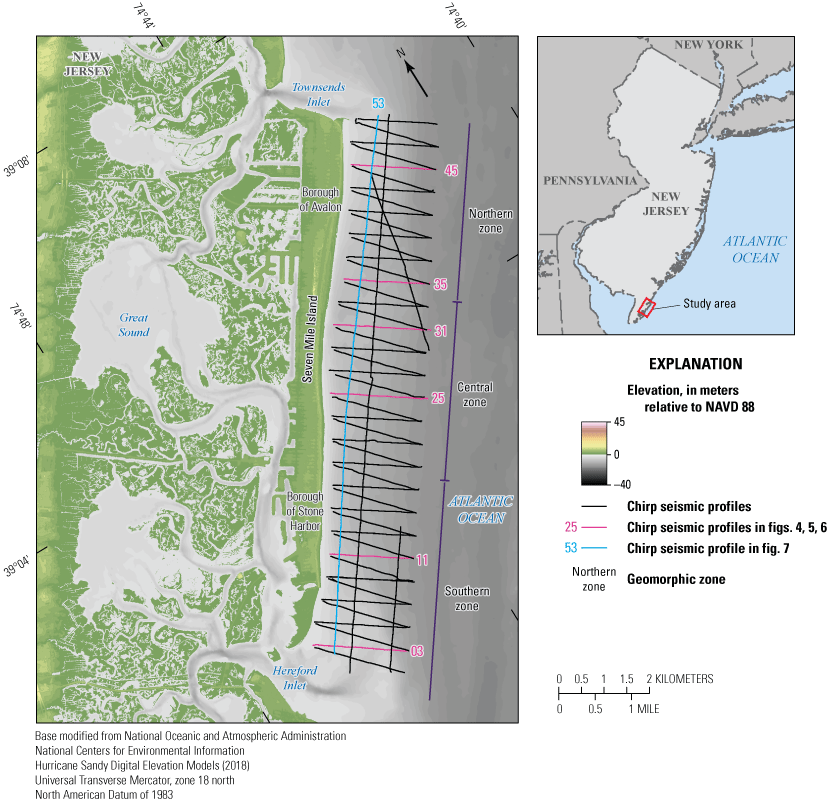
Seven Mile Island study area in southeast New Jersey, geomorphic zones, and tracklines along which chirp seismic data were collected during April 29–May 2, 2022. [NAVD 88, North American Vertical Datum of 1988; NOAA, National Oceanic and Atmospheric Administration; NCEI, National Centers for Environmental Information]
The purposes of this study are to characterize the geologic framework of the Seven Mile Island shelf and shoreface and to use geological interpretations to quantify the volume of available sediment in the shoreface, the region that morphologically adjusts to wave conditions (Stive and de Vriend, 1995). Despite recent studies that link shoreface geology and barrier response (Miselis and McNinch, 2006; van der Spek and others, 2022; Wei and Miselis, 2022), much is still unknown about the timescales of shoreface response and how that response is affected by geology. This knowledge gap is partly caused by the difficulty of collecting geophysical measurements in shallow water environments because breaking waves pose substantial hazards to boats and seismic equipment. To address this knowledge gap, the U.S. Geological Survey (USGS), in cooperation with the National Fish and Wildlife Foundation, collected geophysical data with custom, purpose-built equipment to support several objectives, including interpreting the nearshore geologic framework and quantifying nearshore sediment budgets.
Regional Geologic Setting
Seven Mile Island is located within the Coastal Plain Physiographic Province in New Jersey. In Cape May County, the Coastal Plain Physiographic Province consists of more than 1,980 meters (m) of unconsolidated sediment overlying crystalline basement bedrock that is Precambrian in age (Miller and others, 1997). The deposits that are relevant to this study are within the upper 100 m of the Coastal Plain Physiographic Province and include the Pleistocene Cape May Formation, Holocene marsh and estuarine deposits, and Holocene beach sand deposits (see geologic cross sections in Sugarman and others, 2016). The Cape May Formation outcrops on land in some locations, and in the marine environment, it is located at depths of 15–60 meters below sea level (mbsl). In terrestrial and submarine settings, the formation is composed of two units, Q c m1 and Q c m2, and consists of sand and pebble gravel deposits that fine upward into deposits of silt, clay, and fine sand (Sugarman and others, 2016). The sand and gravel deposits were interpreted to have been deposited during the sea level highstand associated with Marine Isotope Stage (MIS) 5e (Sugarman and others, 2005; USACE, 2014). When sea level lowered during MIS 4, the upper portions of sand and gravel deposits were eroded by Pleistocene paleochannels that form the S1 sequence boundary (see schematic cross sections in Smith, 1996). These channels were infilled with fluvial, marine, and estuarine deposits during the intermediate MIS 3 sea level highstand (Smith, 1996; USACE, 2014). When sea level lowered during MIS 2, another set of paleochannels eroded and then formed the S2 sequence boundary (Smith, 1996). The paleochannels that make up the S2 sequence boundary have lower relief than the S1 paleochannels, possibly because the Coastal Plain Physiographic Province in New Jersey was on the periphery of an ice margin and paleochannels were incised mainly by braided streams (Snedden and others, 1994; Smith, 1996). Overlying the Cape May Formation is Holocene-age salt marsh and estuarine deposits that are composed of peat, organic silt, clay, and fine silt, called Q m (Sugarman and others, 2016). The uppermost unit at Seven Mile Island is Q b s, which consists of barrier island and shoreface deposits of Holocene age (Sugarman and others, 2016).
Seven Mile Island is a mixed-energy barrier island, with an average annual significant wave height of 0.82 m, average wave periods of 8.3 seconds (Thompson, 1977), and a mean tidal range of 1.18 m (National Oceanic and Atmospheric Administration [NOAA], 2020). Wave heights and periods increase during extratropical and tropical storm conditions, and maximum wave heights can exceed 10 m (NOAA, 2020). Because of swell and storms, net sediment transport is to the south (Nordstrom and others, 2002).
The subaerial morphology of Seven Mile Island during the 20th century was heavily influenced by human modification. Development of Seven Mile Island began when bridges connected the island to mainland Cape May between 1930 and 1967, and shortly thereafter, the area of developed land surpassed the area of natural land (Barone, 2016). Three major types of human development have altered the Seven Mile Island landscape: (1) extensive dune building in response to the 1962 Ash Wednesday storm, (2) beach nourishment led by the municipalities that started in 1987 and continues to the present, and (3) hard engineering, or the construction of jetties and groins, that increased between 1955 and 1977 and leveled off after 1995 (Nordstrom and others, 2002; Barone, 2016). As a result of these modifications, the shoreline and beach have prograded, resulting in net positive shoreline change rates (Hapke and others, 2013).
Seven Mile Island is divided into the Borough of Avalon in the north and the Borough of Stone Harbor in the south, with each borough managing their own beach engineering plans. The northern end of Seven Mile Island has been stabilized by multiple hard engineering structures, whereas the southern end contains Stone Harbor Point natural area and remains undeveloped. In response to Hurricane Sandy, which made landfall on the New Jersey coast in 2012, restoration efforts have focused not only on the beach side of the barrier but also on placing dredged sediment in the backbarrier marsh (Bridges and others, 2016).
Materials and Methods
From April 29 through May 2, 2022, the USGS acquired 281 line-kilometers of chirp seismic data from the shoreface and inner shelf near Seven Mile Island, New Jersey, onboard the USGS research vessel (R/V) Sallenger (fig. 1). This seismic survey is composed of a grid of alongshore, or strike profiles, and cross-shore, or dip profiles. Dip profiles alternated between shore-normal and oblique profiles, and shore-normal dip profiles were used for bathymetric and transect analyses. Shoreface and inner shelf geological information was collected using an EdgeTech 512i subbottom profiler and a Spectra Precision SP90M Global Navigation Satellite System (GNSS), which were deployed in a purpose-built towed sled system. Location information associated with each seismic profile was determined by post-processed differential correction using a base/rover setup. Differential positioning was obtained by post-processing the SP90M GNSS data to the concurrent base station data using GrafNav (Novatel Waypoint GNSS processing software version 8.9; GrafNav is a processing engine for static or kinematic GNSS | NovAtel). Positional accuracy for survey data is further described by Lyons and others (2023) and Forde and others (2023). Inclement weather prevented USGS scientists from collecting alongshore chirp profiles at the seaward extent of the survey.
The seismic sled was located roughly 18 m behind the R/V Sallenger and consisted of two inflatable pontoon floats to position the chirp just below the water’s surface and to minimize the offset between the water surface and the chirp towfish. The seismic sled was configured to help increase the quality of data collected in exceedingly shallow water depths, such as those observed near the shoreline, over shallow nearshore bars, and within the surf zone. This setup also facilitated launching and recovery of the seismic sled from adjacent beach environments.
Chirp seismic data were recorded in EdgeTech's native J-Star (JSF) raw data format and nonproprietary Society of Exploration Geophysicists SEG-Y revision 2 format. The seismic data were acquired at frequency ranges of 0.7–12 kilohertz, a pulse length of 20 milliseconds, and a ping rate of 5 hertz. More details on acquisition can be found in Forde and others (2023). Custom Unix and C program language scripts were used to convert the analytic, full waveform JSF-formatted files to envelope seismic data before they were output as SEG-Y revision 0 files; this conversion was done to increase long-term usability of the data. The seismic processing workflow and scripts used for processing are described in further detail by Forde and others (2023) and Forde and others (2016). Using Seismic Unix version 44 software (Cohen and Stockwell, 2010), the SEG-Y files were bandpass filtered at frequencies of 3, 4, 10, and 12 kilohertz to remove shallow-water artifacts and noise from the subbottom profiles and trimmed to a 30-millisecond two-way travel time (TWTT).
Single-beam bathymetry data were collected concurrently along the same track lines as chirp seismic data by using an Odom Echotrac CV100 single-beam echo sounder mounted on the seismic sled. Processing of single-beam data involved merging it with post-processed navigation data and correcting soundings for sound velocity and tides. CARIS HIPS and SIPS software (https://teledynecaris.com) was used to process and clean the bathymetry data. The data were then horizontally and vertically transformed within the VDatum software (https://vdatum.noaa.gov) from World Geodetic System of 1984 Ellipsoid to North American Datum of 1983 and North American Vertical Datum of 1988 GEOID 12B with a transformational error of 5 centimeters as described by Lyons and others (2023). Multibeam bathymetry data were collected at Seven Mile Island in 2018, 2021, and 2023 using a Reson dual-head T50P multibeam echosounder. Multibeam data were processed in CARIS HIPS and SIPS software, as described by Farmer and others (2019) and Stalk and others (2022). The 2021 multibeam bathymetry data were gridded in CARIS HIPS and SIPS software and exported as a raster for visualization in Esri ArcPro (fig. 2) because it was closest in time to the 2022 geophysical survey. Multibeam backscatter data from 2021 were processed using the CARIS SIPS Backscatter tool and exported as a raster mosaic for visualization in Esri ArcPro (fig. 2B; Stalk and others, 2022).

A, Multibeam bathymetry and B, backscatter collected near Seven Mile Island, New Jersey, 2021. High intensity (bright colors) generally indicate harder seafloor substrate, whereas low intensity (dark colors) generally correspond to softer seafloor substrate.
Processed single-beam bathymetry data were exported as XYZ files and imported into Blue Marble Geographics’ Global Mapper Pro geographic information system software (version 24.1; https://www.bluemarblegeo.com/). Digital elevation models (DEMs) were created for the single-beam bathymetry survey by using the “Create Elevation Grid” tool with a triangular irregular network because the single-beam data do not create a spatially continuous bathymetry dataset and a gridding algorithm was needed to create a continuous surface. The DEM created with the single-beam data was created specifically for use within Chesapeake Technology’s SonarWiz software (version 7.10.02; https://chesapeaketech.com/) for chirp profile elevation adjustments and not for bathymetric maps. The parameters for this grid’s creation were a 2.5-m cell size with a 20-m “no data” distance criteria. These criteria were chosen to allow for the highest resolution cell size possible along widely spaced tracklines, while also ensuring coverage beyond the rasterized cells when a trackline was curvilinear. This single-beam bathymetry grid was exported in geoTIFF format for use in SonarWiz.
Bandpass filtered and trimmed chirp SEG-Y files were imported into SonarWiz software where the data were converted to TWTT by using a sound velocity of 1,500 meters per second (m/s) for the water column and 1,650 m/s for sandy sediment, following Wei and others (2021) and Locker and others (2017); all TWTT information associated with the original data format were retained. In SonarWiz, the bottom track function automatically detected the seafloor in all chirp profiles, and these were manually checked for accuracy. The water column above the seafloor was blanked. Additionally, time-varying gains, automatic gain control, and intensity were applied to the data. An elevation correction was performed to adjust the seafloor of the chirp profiles to the DEM created from the concurrently collected single-beam bathymetry data. This is an important step in shallow water environments, where shoreface elevations may change over the course of the survey, leading to seafloor offsets that may propagate to subsurface reflections and interfere with the interpretation. All chirp data were exported from SonarWiz as elevation-corrected SEG-Y files for further analysis within Kingdom Suite software (version 2021; https://kingdom.ihs.com). Sediment units and surfaces were interpreted based on sequence-stratigraphic principles (Mitchum and others, 1977). Deposit thickness maps of interpreted units were computed by using the “math on two maps” tool within Kingdom Suite software and exported as .dat files. The surfaces of interpreted units were also exported. Isopach and structure maps were gridded by using the surface function within Generic Mapping Tools version 6.2.0, converted to a raster, and imported to Esri’s ArcGIS Pro geographic information system for visualization.
In Global Mapper Pro, the volume of Holocene sand was calculated in three geographic zones that spanned alongshore lengths of 4–5 kilometers (km) by using the “measure volume between surfaces” tool that used the thickness of Holocene sand raster and a raster with values of zero as inputs. The tool clipped the data to the boundaries of each zone and calculated Holocene sand volumes, resulting in volumes reported for each zone (table 1). To investigate how Holocene sand volumes vary at spatial scales of 0.5 km along the margin of Seven Mile Island, Holocene sand volume estimates at each chirp profile were determined by drawing transects along shore-normal chirp profiles (odd-numbered chirp dip profiles) in Esri ArcPro. Then, deposit thickness along these transects was extracted by using the ArcPro add-on, Xtools, and exported as comma separated variable (.csv) files. Thickness transect data recorded in the .csv files were imported into MATLAB, where profiles were plotted, and the trapezoidal function integrated the area under each profile. The volume of Holocene sand at each profile is represented by these integrated values and are shown in table 2. This calculation at shore-normal chirp profiles reduced errors caused by interpolation.
Table 1.
Volumes of Holocene sand (stratigraphic unit C) deposits subdivided by region and total volumes, Seven Mile Island, New Jersey, May 2021.[m3, cubic meter; km2, square kilometer; %, percent; m, meter; —, not calculated]
| Geomorphic zone (fig. 2B) |
Deposit volume (1×10⁶ m3) |
Deposit area (km2) |
Deposit volume (% in each geomorphic zone) |
Average deposit thickness in each zone (m) |
|---|---|---|---|---|
| Northern | 12.50 | 6.25 | 31.05 | 2.01 |
| Central | 13.07 | 8.80 | 32.46 | 1.49 |
| Southern | 14.68 | 7.93 | 36.48 | 1.85 |
| Total | 40.25 | — | — | — |
Table 2.
Volumes of Holocene sand (stratigraphic unit C) at each shore-normal chirp line transect, Seven Mile Island, New Jersey, April 29–May 2, 2022.[m3/m, cubic meter per meter; m, meter]
To ground truth seismic data from this study, USGS scientists deployed a petite ponar from the R/V Sallenger in May 2021 and collected 31 surficial sediment grab samples from the shoreface and inner shelf. After recovering the ponar sampling device, the sediment was subsampled and archived in zip-close bags. Sediment was digested by using hydrogen peroxide and was analyzed for grain size with a Coulter LS2000 particle-size analyzer. Detailed discussion of methods and grain size results are available in Everhart and others (2022).
Results
Morphology
Offshore of Seven Mile Island, the shoreface and inner shelf have alongshore-variable morphologies and slopes. Bathymetric maps reveal that the subaerial barrier island and shoreface widen at the northern and southern ends of the island (fig. 2A). The width of the barrier island and shoreface, seafloor morphology, and seismic stratigraphy were used to classify the Seven Mile Island margin into three alongshore zones: northern, central, and southern (fig. 2B). The shoreface in southern Seven Mile Island is indented by several eastward-trending depressions that are about 2 m deep (fig. 2A). South of these depressions are eastward-trending bedforms. In north-central Seven Mile Island, a narrow depression follows the northern shoal and curves landward. Backscatter intensity maps reveal that depressions in northern and southern Seven Mile Island have higher reflectance than the surrounding sediment. The highest backscatter intensities are recorded at depths of 13 m offshore of northern Seven Mile Island (fig. 2B).
This study further used bathymetric profiles taken along shore-normal chirp lines to subdivide the shoreface into upper and lower cross-shore domains (fig. 3). Upper shorefaces are the most landward portions of the shoreface and shelf, and their distinguishing feature is a steep gradient ranging from 0.67 to 0.87 degrees (°) (fig. 3). The transition between the steeper upper shoreface and gradual slopes of the lower shoreface (0.21 to 0.24°) occurs at depths greater than (>) 5 mbsl in central and southern Seven Mile Island (fig. 3). The bathymetric profiles in southern Seven Mile Island show the highest variability alongshore (high standard deviation; fig. 3C), which coincides with the Hereford Inlet ebb-tidal delta and bedforms. The bathymetric profiles in northern Seven Mile Island have a steep upper shoreface until depths of 5 mbsl, a flat middle shoreface at depths between 5 and 5.3 mbsl, and a steep convex-upward lower shoreface that dips at 0.5° to depths of 13.5 mbsl (figs. 3A and D).
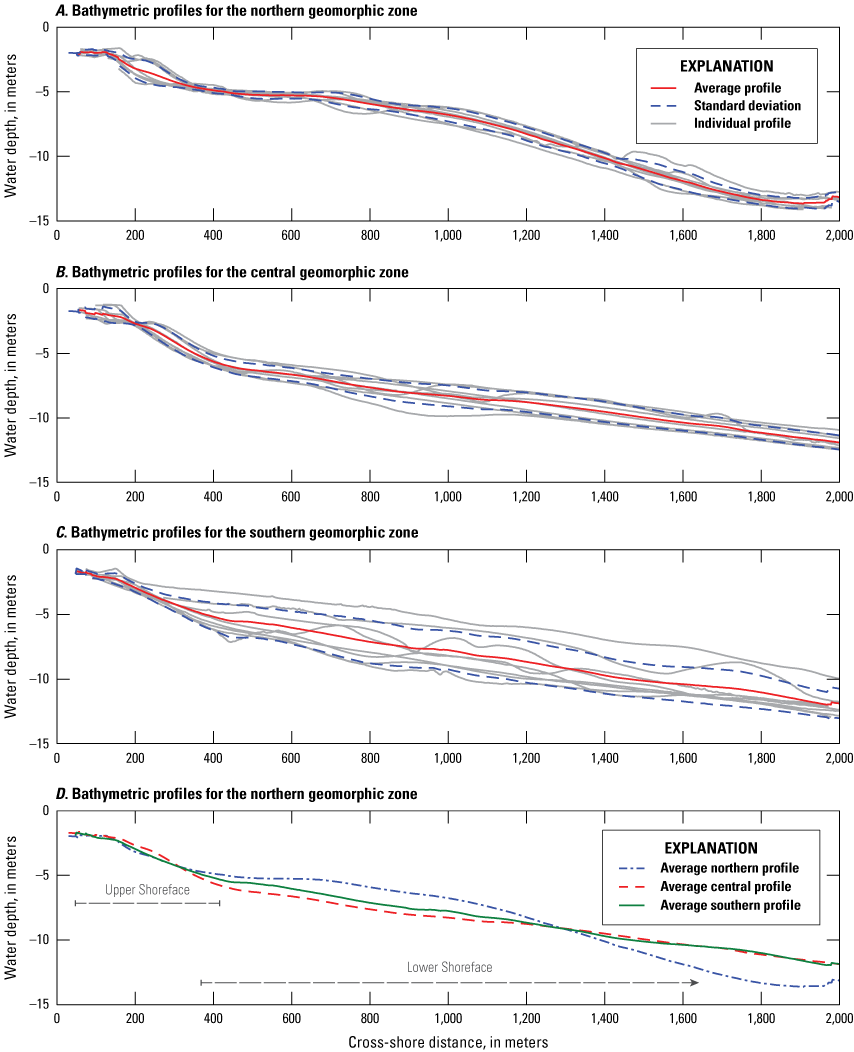
Bathymetric profiles from each shore-normal chirp profile and plotted by geomorphic zone: A, northern profiles, B, central profiles, C, southern profiles, and D, average profile from each zone, Seven Mile Island, New Jersey. Profiles were extracted from multibeam bathymetry collected in 2021. (NAVD 88 G12B, North American Vertical Datum of 1988 Geoid 12B).
Seismic Stratigraphy
Three stratigraphic units were identified in all seismic profiles (figs. 4–7), and one additional unit was observed only offshore of northern Seven Mile Island (fig. 4). Units are separated by regional unconformities that represent vertical and horizontal shifts in acoustic character, and the unconformity may appear as a reflector with medium to high acoustic amplitudes (Mitchum and others, 1977). The most common type of regional unconformity observed in the study area is a transgressive unconformity, which dips gently seaward and displays low relief. In some areas, subaerial unconformities were observed, which are undulatory surfaces that display greater relief and commonly truncate reflections in underlying units (Mitchum and others, 1977). Within units, some internal reflections were interpreted as paleochannel bases if they satisfied these criteria: (1) internal reflections are concave-upward or undulatory, (2) internal reflections display relief from <1 to 5 m. Additionally, some of the reflections that were interpreted as paleochannel bases were undulatory and truncated underlying flat-lying reflections (figs. 5B and 6A).
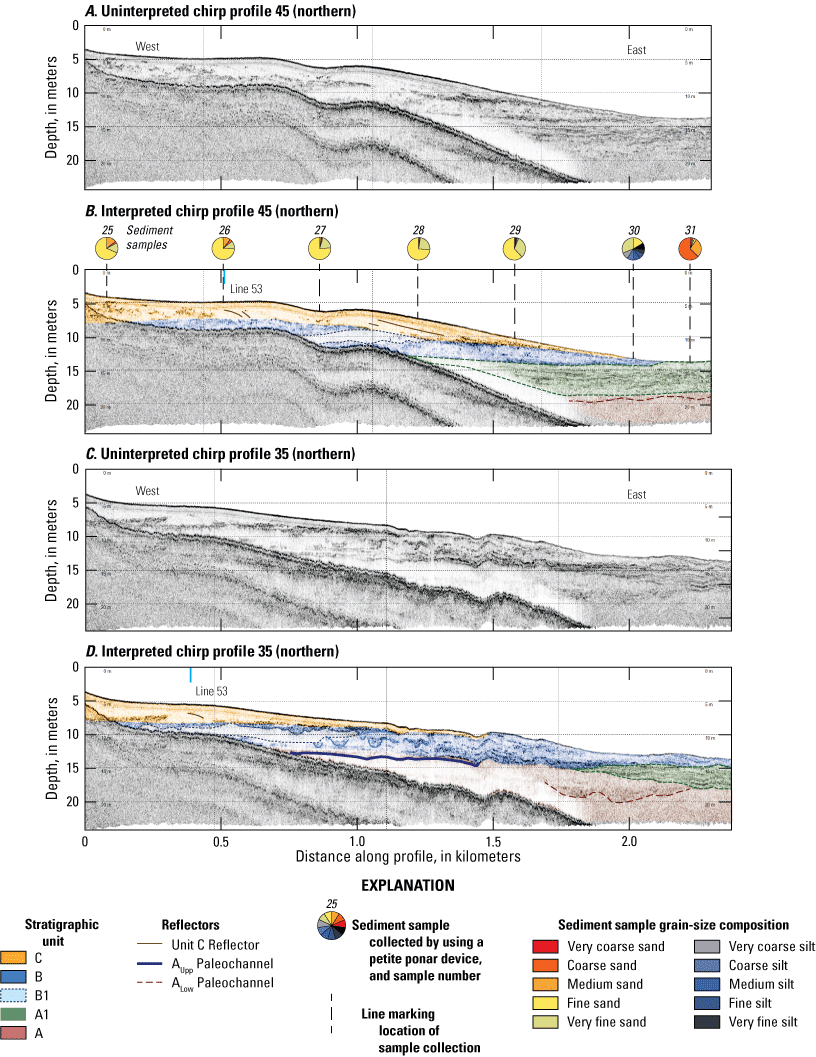
A, Uninterpreted and B, interpreted chirp dip profile 45 and grain-size composition of sediment samples collected along the line showing configurations of stratigraphic units C, B, B1, A1, A, and unconformities in the northern geomorphic zone of Seven Mile Island, New Jersey. C, uninterpreted and D, interpreted chirp dip profile 35 showing configurations of stratigraphic units C, B, B1, A1, A, and unconformities in the northern geomorphic zone of Seven Mile Island, New Jersey. Line locations are shown in figures 1 and 2. The intersections of each dip line with strike line 53 in figure 6 are indicated by light blue vertical lines on the interpreted profiles. The grain size composition of sediment samples is shown by circular pie charts. Depth below sea level is plotted in meters (NAVD 88 G12B, North American Vertical Datum of 1988 Geoid 12B).
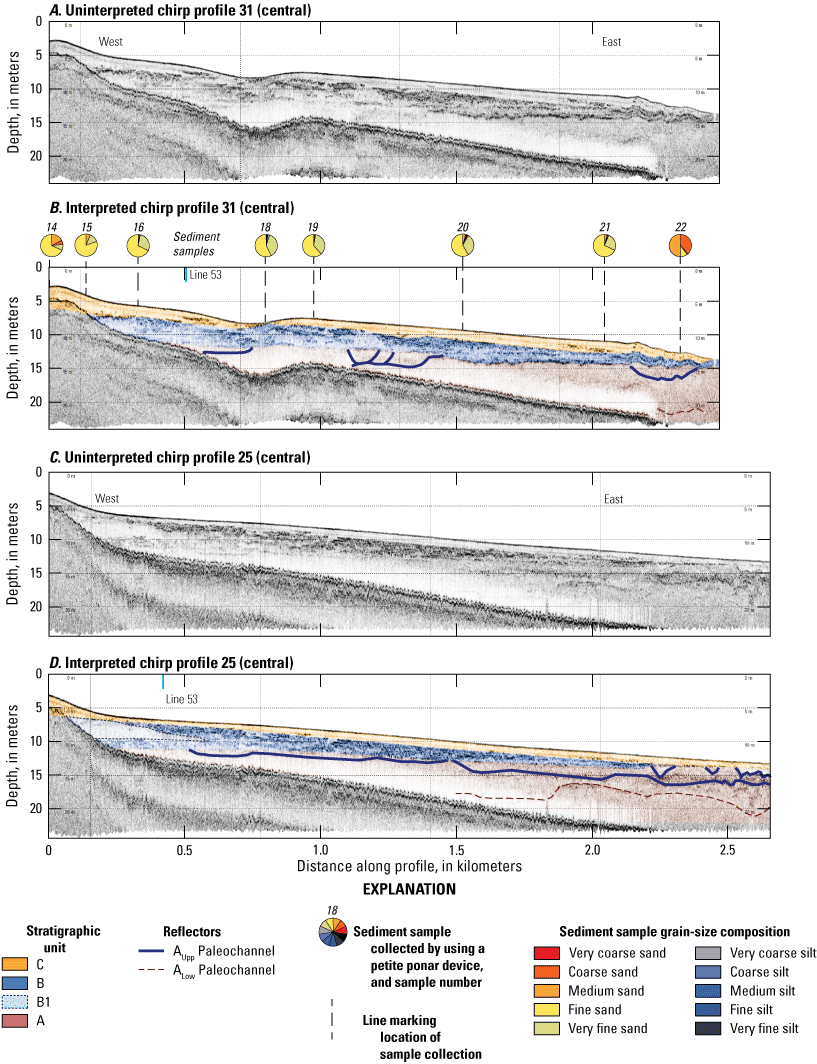
A, Uninterpreted and B, interpreted chirp dip profile 31 and grain-size composition of sediment samples collected along the line showing configurations of stratigraphic units C, B, A, and unconformities in the central geomorphic zone of Seven Mile Island, New Jersey. C, uninterpreted and D, interpreted chirp dip profile 25 showing configurations of stratigraphic units C, B, B1, A, and unconformities in the central geomorphic zone of Seven Mile Island, New Jersey. Line locations are shown in figures 1 and 2. The intersections of each dip line with strike line 53 in figure 6 are indicated by light blue vertical lines on the interpreted profiles. The grain size composition of sediment samples is shown by circular pie charts. Depth below sea level is plotted in meters (NAVD 88 G12B, North American Vertical Datum of 1988 Geoid 12B).
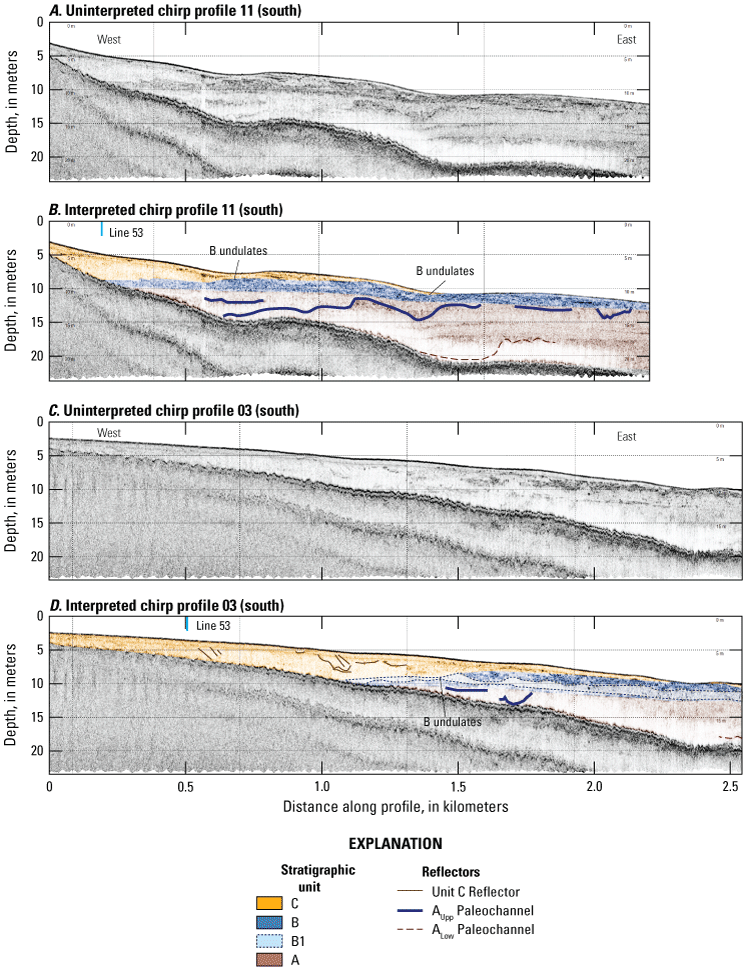
A, Uninterpreted and B, interpreted chirp dip profile 11 showing configurations of stratigraphic units C, B, A, and unconformities in the southern geomorphic zone of Seven Mile Island, New Jersey. C, uninterpreted and D, interpreted chirp dip profile 03 showing configurations of stratigraphic units C, B, B1, A, and unconformities in the southern geomorphic zone of Seven Mile Island, New Jersey. Line locations are shown in figures 1 and 2. The intersections of each dip line with strike line 53 in figure 6 are indicated by light blue vertical lines on the interpreted profiles. The grain size composition of sediment samples is shown by circular pie charts. Depth below sea level is plotted in meters (NAVD 88 G12B, North American Vertical Datum of 1988 Geoid 12B).

Uninterpreted and interpreted profile of strike line 53 shows thickening and southward elongation of unit C in southern Seven Mile Island and deepening of underlying unit B. Line 53 is visually separated into two segments A, the southern and B, the northern end with distances from south to north shown on the x-axis. Line 53 location is shown in figure 1. The intersections of line 53 with dip lines 45 and 35 (fig. 4), 31 and 25 (fig. 5), and 11 and 03 (fig. 6) are indicated by pink vertical lines. Above the interpreted profile, the locations of ponar sediment samples are indicated by the black dashed vertical lines. The grain size composition of ponar sediment samples is shown by circular pie charts. Above the uninterpreted profiles, gray rectangles show the extent of the southern, central, and northern zones. Water depth is plotted in meters (NAVD 88 G12B, North American Vertical Datum of 1988 Geoid 12B).
The basal stratigraphic unit, unit A, is mostly acoustically transparent with some concave-upward or undulatory discontinuous internal reflections that are truncated at the top of the unit. The lower boundary of unit A could not be detected because of a lack of penetration at depth by the chirp system. Within unit A, some internal reflectors were interpreted as paleochannel bases because they are concave-upward and paleochannel heights range from <1 to 5 m, where channel height is defined as the vertical distance between the channel top and thalweg.
The paleochannels within unit A are divided into two categories based on their depth within the unit. Broad ALow paleochannels are 15–20 mbsl, with widths of 0.2–0.5 km and heights of about 5 m. Paleochannels in the upper portion of the unit, AUpp, are 10–15 mbsl and are smaller, with widths of 0.1–0.4 km and heights of 2–5 m (figs. 4–6). Reflections at the base of ALow paleochannels are lower in amplitude and appear to be less continuous than reflections at shallower AUpp paleochannels (figs. 4–6).
Unit A1 overlies unit A and is observed only in profiles 35–49 offshore of northern Seven Mile Island (fig. 4). Unlike unit A, which is mostly acoustically transparent, unit A1 contains multiple, uniformly spaced, conformable, medium-amplitude reflections (fig. 4). In profile 35, the base of unit A1 thins landward, and internal reflections onlap onto laterally adjacent deposits in unit A. Surficial sediment sample 31 from profile 45 was composed of well-sorted sediment from unit A1 that consisted of rounded gravel clasts, 61 percent coarse sand, 26 percent medium sand, and 4 percent mud, and had a median grain size (D50) of 579 micrometers (µm; fig. 4A; Everhart and others, 2022). The seaward portion of line 45, where unit A1 outcrops at the seafloor, is spatially coincident with a feature containing the highest backscatter reflectance in the study area (fig. 2B).
Unit B, which onlaps units A or A1, is distinguished by its discontinuous, chaotic, high-amplitude internal reflections that are most prominent in central and southern-central Seven Mile Island (profiles 31 and 11; figs. 5A and 6A; ~8-km mark on line 53, fig. 7B). Several of the seismic profiles (45, 35, 25, and 03) contain a subunit, B1, which is composed of packages of acoustically transparent sediment in between the chaotic, high-amplitude reflections in the upper and lower boundaries of the unit (figs. 4, 6B, and 7). B1 deposits are more continuous and slightly thinner in south-central Seven Mile Island and less continuous and deeper in northern Seven Mile Island (fig. 7). In profile 25 in the central geomorphic zone, a B1 deposit is wedge-shaped and located within the landward side of unit B (fig. 5B); however, in profiles 35 and 45 in the northern geomorphic zone, B1 deposits appear as beds at more seaward locations and at depths of about 10 mbsl (fig. 4).
The thickness of unit B varies with the elevation of its upper surface (fig. 8A), which dips towards the south, and the presence or absence of underlying unit A1. The upper boundary of unit B dips seaward at a steeper gradient than the lower boundary, which results in unit B thickening landward and tapering seaward. Erosional incisions truncate unit B reflections at the upper boundary in southern Seven Mile Island (at 0.5 and 1.5 km in fig. 6A; at 1–1.5 km in fig. 6B; at 4, 6, and 10 km in fig. 7). Sediment sample 30 contained sediment from unit B. The sample consisted of 53 percent mud and 47 percent sand, had a D50 of 53 µm, and was finer than samples collected landward of it (fig. 4A; Everhart and others, 2022).
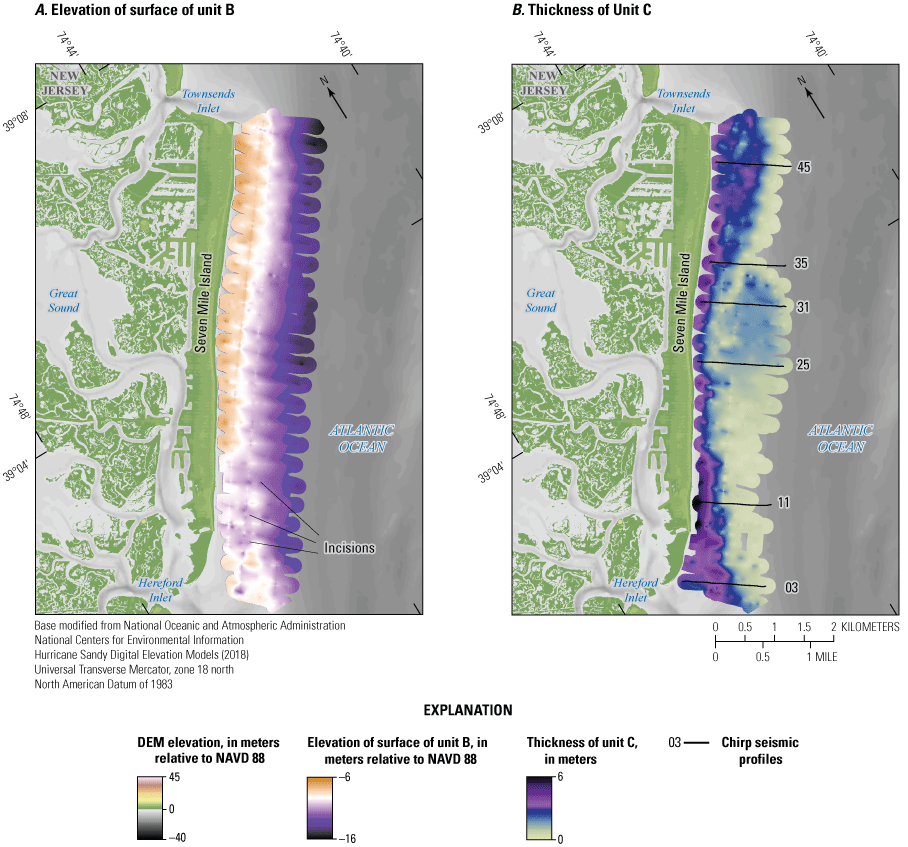
A, Elevation of the top of stratigraphic unit B and B, thickness of stratigraphic unit C, Seven Mile Island, New Jersey.
Unit C overlies unit B and is mostly acoustically transparent but has occasional internal reflectors (figs. 4–7). The base of unit C is delineated by the truncation of dense high-amplitude reflections in underlying unit B. Offshore of southern Seven Mile Island (the southern 7 km in line 53), unit C thickens and contains southward-dipping, medium-amplitude internal reflections (fig. 7). The upper portion of unit C offshore of southern Seven Mile Island (kilometers 3–6 in line 53) contains a high-amplitude internal reflection at depths of 5–6 mbsl that truncates underlying dipping reflectors (fig. 7). Most of the sediment samples from unit C had D50 values ranging from 135 to 189 µm and consisted of 54–75 percent fine sand (figs. 4A and 5A; Everhart and others, 2022). Within the upper shoreface, small changes in depth can cause great variability in grain size (figs. 4 and 5). Sediment sample 22 from central Seven Mile Island contained slightly coarser sand, with a D50 of 441 µm, and consisted of 37 percent coarse sand, 50 percent medium sand, and 9 percent fine sand (Everhart and others, 2022). The slightly coarser grain size may be related to the presence of bedforms or reworking of coarser A1 deposits located to the north.
Seismic dip profiles and isopach maps reveal that unit C thins offshore and has variable thickness alongshore (fig. 8B). Unit C in central Seven Mile Island is thin and extends past the survey area, but unit C deposits in southern and northern Seven Mile Island thicken landward and pinch out 1.5–2 km seaward of the shoreline (figs. 4, 6, 8B, and 9B). In northern Seven Mile Island, the seaward extension of unit C likely contributes to its anomalous, convex morphology in bathymetric profiles (figs. 3A and 4). This also results in the greatest average thickness of unit C in northern Seven Mile Island (table 1). Seaward extension and thickening of unit C are also observed in profile 03 adjacent to the Hereford Inlet ebb-tidal delta (fig. 6B). Southern Seven Mile Island has the greatest unit C volume (table 1). Another possible contributor to this larger volume in the southern part of the study area is the deepening of the unit B surface, which provides greater accommodation for unit C sediment (fig. 7). Strike line 53 reveals southward-dipping reflectors in unit C where accommodation increases (at 2–4 km; fig. 7A). An isopach map (fig. 8B) and sediment volumes calculated along the margin (fig. 9A) indicate that unit C has the smallest volume between profiles 11-25 at the transition between southern and central Seven Mile Island. The greatest unit C volumes are adjacent to the Hereford Inlet and just south of the transition between central and northern Seven Mile Island (fig. 9A).

A, Volume of stratigraphic unit C measured at every shore-normal chirp profile and B, spatial cross-shore extent of stratigraphic unit C, Seven Mile Island, New Jersey. The geomorphic zones are labeled as Southern, Central, and Northern.
Discussion
Seismic Unit Interpretation
Seismic units in this study were tied to units interpreted by the New Jersey Geological and Water Survey in Cape May County (Sugarman and others, 2016) and sediment cores and interpreted seismic surveys offshore of Seven Mile Island and Sea Isle City (Smith, 1996). Units B and C were interpreted as Holocene deposits that correspond to Q m and Q b s, respectively, from Sugarman and others (2016). Unit A was interpreted as a Pleistocene deposit that corresponds to the Cape May Formation interpreted by Sugarman and others (2016). Further age constraints are required to determine the age of subunit A1. Of the Holocene deposits, unit C is identified as sediment available for barrier island replenishment because unit B may contain a higher concentration of fine-grained sediment. Ideally, sediment that replenishes Cape May County beaches has mean grain sizes that are equal to or slightly coarser than 100–200 µm (Uptegrove and others, 1994).
The oldest deposits in this study, unit A, coincide spatially with deposits interpreted by Sugarman and others (2016) as the Cape May Formation. Previous studies have established that the Cape May Formation was initially emplaced during a Pleistocene highstand and was subaerially exposed, subsequently incised by tidal channels, and finally infilled by transgressive deposits (Smith, 1996; Sugarman and others, 2016). The lowermost deposits of unit A observed in this study are acoustically transparent substrate at depths of 20–30 mbsl, and the depths of these deposits are coincident with Sangamonian (MIS 5) highstand deposits (Knebel and Circé, 1988). Therefore, the lower portion of unit A observed on seismic profiles could be Sangamonian or younger.
Several lines of evidence were used to interpret unit A1 as an infilled paleochannel. First, unit A1 is a localized deposit, and its laminated infill onlaps laterally adjacent unit A (fig. 4B). The seismic signatures of unit A1 and A resemble those observed offshore of Kitty Hawk, North Carolina. There, an acoustically transparent sediment unit is laterally adjacent to laminated infill and was interpreted as channels that were infilled by laminated pebbly sand and acoustically transparent silty sand (Browder and McNinch, 2006). In this study, the depth of unit A1, which ranges from 14 to 19 mbsl, is similar to that of nearby incised valleys and drainages of the ancestral Delaware River, which have depths between 10 and 40 mbsl (Knebel and others, 1988). The channel heights of A1, which range from 4 to 5 m, are consistent with other paleovalley systems that typically were incised no deeper than 10 m during the late Pleistocene (Mattheus and others, 2020). This study proposes that the A1 paleochannel was formed during the MIS 2, rather than the MIS 6 lowstand, because the ancestral MIS 6 Delaware River paleovalley, which coursed through present-day Wildwood, N.J., had channel thalwegs at depths >47 mbsl (Knebel and Circé, 1988), which is deeper than the lower limit of this study’s seismic profiles. This study cannot definitively constrain unit A1’s formation processes and timescale of formation without sediment cores. Future collection of a seismic strike line at the seaward end of the survey could better support the interpretation of A1 as a paleochannel formed during MIS 2.
Interpretation of unit A1 as fluvial in origin is supported by the coarse grain size from sediment sample 31. The A1 paleochannel is located offshore of Townsends Inlet, and it may have been formed initially by a branch of a fluvial drainage and reoccupied by tidal channels, which is a phenomenon commonly observed at tide-dominated and mixed-energy barrier islands (Belknap and Kraft, 1985). Ponar sample 31 from this unit is similar in composition to fluvial paleochannel infill observed by Smith (1996). These fluvial paleochannel deposits may have been reworked into a lag deposit that could be represented by the north-south-trending band of high backscatter at the northeast extent of the survey area. Lag deposits may be commonly observed at other nearby paleovalleys, such as at the mouth of Delaware Bay (Knebel and Circé, 1988). The sand within the unit A1 deposits that outcrop at depths of 14–19 mbsl could potentially be mobilized onshore during energetic wave events, but its potential for supplying sand to the shoreface and beach cannot be evaluated without further analysis and hydrodynamic modeling.
Units B and C are interpreted as Holocene-age units based on terrestrial mapping efforts (Sugarman and others, 2016). Unit B is tied to the unit Q m, which was interpreted by Sugarman and others (2016) as a Holocene-age salt marsh and estuarine deposit. Surficial sediment samples with high concentrations of silt and very fine sand support this interpretation. Acoustically transparent packages of B1 may represent flood-tidal delta lobes or overwash deposits because they appear as beds that are laterally continuous in the along- and cross-shore directions. These flood-tidal delta deposits could have been deposited if there was a breach in the barrier island, similar to deposits observed adjacent to breaches at Cedar Island, Virginia (Hein and others, 2021). Although the acoustically transparent nature of unit B1 suggests that it has a higher sand content than adjacent unit B deposits, this could not be confirmed because unit B does not outcrop at the seafloor within the survey area.
Unit C is interpreted as barrier island and shoreface deposits Q b s from Sugarman and others (2016). This interpretation is supported by surficial sediment samples from this unit that contain mostly fine to very fine sand. Furthermore, unit C is acoustically transparent in seismic profiles and has relatively high backscatter. Of these two Holocene units, unit C is likely the only one that can provide sand to the shoreface and beach once it is reworked because unit B deposits may be too fine grained to be retained in nearshore environments.
The alongshore variability in the acoustic character and thickness of unit C may reveal insights into tidal channel formation and rates of barrier island elongation. Elongation of Seven Mile Island is supported by southward dipping reflectors within unit C offshore of southern Seven Mile Island (0–6 km in line 53; fig. 7A). Another indicator of Seven Mile Island’s southerly growth is the deepening of the base of unit C at 3–7 km in line 53 that is interpreted as a paleochannel. This paleochannel may have formed at the end of the barrier island as a tidal inlet channel, similar to those observed at Fire Island (Liu and Goff, 2018) and offshore of Rockaway Beach, New York (Wei and Miselis, 2022). At 6–7 km of line 53 in central Seven Mile Island, the paleochannel has a height of about 4 m and is spatially coincident with a wide tidal creek channel through the backbarrier marsh (fig. 1). The relatively deep incision suggests that rates of barrier island elongation may have slowed, which could have provided more time for deeper channel incision at the southern end of the barrier island (fig. 7A). Thereafter, this paleochannel was infilled by unit C sediment with southward-dipping and seaward-dipping reflections, which suggests that southward elongation was initiated by an increase in sediment supply. The speed of barrier island elongation may have increased; paleochannels observed at 3–6 km are shallower than the paleochannel at 6-7 km, suggesting a shorter duration of incision at the barrier terminus (fig. 7). Alternatively, tidal channel morphology could be asymmetric. Even further south, the lack of deep tidal paleochannels observed at 0-3 km in line 53 suggests that barrier island elongation occurred rapidly. Once Hereford Inlet reached its present position, the ebb-tidal delta grew and promoted seaward progradation of unit C that is observed on line 03 (fig. 6B). The rates of Seven Mile Island’s elongation cannot be constrained by historical navigation charts because the earliest charts of Seven Mile Island suggest that the island has been in its current configuration since before the mid-eighteenth century. Thus, constraining the timing of southward elongation and formation of flood-tidal deltas would require subsampling for age constraints from sediment cores.
Holocene Sand Availability
While the thickness and spatial extent of unit C sediment are variable throughout the northern, central, and southern geomorphic zones of the island, the deposit volumes calculated within each zone are similar (table 1). Nevertheless, the shape of the shoreface and the geometry of the unit C deposits suggest that several different processes contributed to unit C formation. In northern Seven Mile Island, volumes of unit C sediment thicken in the upper shoreface adjacent to the Townsends Inlet ebb-tidal delta (fig. 9A); however, this deposit has a limited cross-shore extent which helps explain why zonally averaged unit C volumes are smallest in northern Seven Mile Island (fig. 9B). One process that likely contributed sediment to the northern Seven Mile Island upper shoreface is inlet sediment bypass, a process in which waves break over the ebb-tidal delta and produce swash bars at its periphery. These swash bars migrate downdrift and eventually weld to the beach of the downdrift barrier island, causing the updrift end of the drumstick barrier island to accrete sediment (Fitzgerald and others, 1984). Thus, the northern Seven Mile Island shoreface thickens landward and dramatically tapers seaward because sediment accumulation patterns are controlled by wave breaking and swash bar processes, which are typically confined to nearshore environments.
Central Seven Mile Island has the second highest volume despite having the thinnest deposits (table 1), likely because unit C deposits do not pinch out offshore of central Seven Mile Island, remain uniformly thin, and extend beyond the end of the seismic profiles (fig. 9B). Thin sediment deposits in central Seven Mile Island are adjacent to the narrow portion of the barrier island, which was likely formed by spit accretion (Fitzgerald and others, 1984). Since bar welding processes may be minimal, most of the sediment may instead be sourced from along- and cross-shore sediment transport. As a result, much of the sediment accumulation along the central Seven Mile Island shoreface may occur at deeper parts of the shoreface, compared to northern Seven Mile Island.
Southern Seven Mile Island has the greatest unit C deposit volumes and the second greatest zonally averaged sediment thickness (table 1). These large volumes are likely influenced by incision of underlying unit B deposits by tidal channels, which were later infilled by sandy unit C sediment as Seven Mile Island elongated southward and the ebb-tidal delta adjacent to Hereford Inlet grew seaward. Even though the geometry of unit C is highly variable along the island, unit volumes in each zone are relatively uniform, with each zone containing 31.05–36.48 percent of the total Holocene sand volumes (table 1).
Summary
From April 29 through May 2, 2022, a geophysical survey was conducted by the U.S. Geological Survey (USGS), in cooperation with the National Fish and Wildlife Foundation, to quantify the volume of available shoreface sediment from the shoreline to 2 kilometers offshore of Seven Mile Island, New Jersey. This survey used a purpose-built seismic sled with an EdgeTech 512i chirp subbottom profiler and single-beam bathymetric profiler. As revealed by seismic profiles, available shoreface sediment, unit C, is composed of Holocene sand. The thickness and morphology of unit C vary along the margin of Seven Mile Island in accordance with its proximity to tidal inlets and accommodation. Offshore of northern Seven Mile Island, thick shoreface deposits are constrained to the upper shoreface and are likely influenced by sediment bypass around the Townsends Inlet ebb-tidal delta swash bar welding processes. Northern Seven Mile Island has the smallest volumes of Holocene sand because the thick wedge does not extend far offshore. Central Seven Mile Island is outside the influence of tidal inlets, and as a result, has the thinnest deposits of Holocene sand, but has moderate volumes of Holocene sand because the thin deposits have a greater offshore extent than in northern or southern Seven Mile Island. Southern Seven Mile Island has the greatest volumes of unit C because of proximity to the Hereford Inlet ebb-tidal delta and excess accommodation for Holocene sand created by incision of unit B deposits, which is a stratigraphic unit underlying unit C, as the barrier island elongated to the south. Although unit B is composed of mostly mud, which is too fine to supply sand to the shoreface and beach, sediment in underlying units A1 and A may contain higher concentrations of sand and gravel derived from fluvial paleochannels, tidal paleochannels, and highstand deposits. Outcrops of these coarser units have the potential to supply sand to the shoreface and beach during energetic wave events; however, this cannot be confirmed without further hydrodynamic modeling. This study quantified the volume of Holocene sand in the shoreface and inner shelf. Since this sediment can be mobilized and transferred onshore to the beach during storms and sea level rise, these results provide information about spatial variability in barrier island response to storms and sea level rise. Furthermore, these results can be used to support objectives to evaluate the response of Seven Mile Island to coastal restoration projects.
References Cited
Barone, D.A., 2016, Determining human dominance thresholds for barrier islands along the New Jersey coast: New Brunswick, N.J., Rutgers University, Ph.D. dissertation, 109 p., accessed April 23, 2021, at https://rucore.libraries.rutgers.edu/rutgers-lib/51188/.
Belknap, D.F., and Kraft, J.C., 1985, Influence of antecedent geology on stratigraphic preservation potential and evolution of Delaware’s barrier systems: Marine Geology, v. 63, no. 1–4, p. 235–262, accessed October 1, 2019, at https://doi.org/10.1016/0025-3227(85)90085-4.
Bridges, T.S., Banks, C.J., and Chasten, M.A., 2016, Engineering with nature—Advancing system resilience and sustainable development: The Military Engineer, v. 108, no. 699, p. 52–54, accessed May 2, 2022, at http://www.jstor.org/stable/26357621.
Browder, A.G., and McNinch, J.E., 2006, Linking framework geology and nearshore morphology—Correlation of paleo-channels with shore-oblique sandbars and gravel outcrops: Marine Geology, v. 231, no. 1–4, p. 141–162, accessed May 14, 2022, at https://doi.org/10.1016/j.margeo.2006.06.006.
Cohen, J.K., and Stockwell, J.W., Jr., 2010, CWP/SU–Seismic Un*x release no. 44—An open source software package for seismic research and processing: Golden, Colo., Center for Wave Phenomena, Colorado School of Mines, accessed November 3, 2023, at https://cwp.mines.edu/software/.
Everhart, C.S., Wei, E.A., and Miselis, J.L., 2022, Grain-size data from sediment samples at Seven Mile Island, New Jersey and Rockaway Peninsula, New York: U.S. Geological Survey data release, accessed May 1, 2023, at https://doi.org/10.5066/P9FH8ZJW.
Farmer, A.S., Fredericks, J.J., Reynolds, B.J., and Miselis, J.L., 2019, Coastal multibeam bathymetry data collected in 2018 offshore of Seven Mile Island, New Jersey: U.S. Geological Survey data release, accessed June 3, 2023, at https://doi.org/10.5066/P9BSJHVL.
Fitzgerald, D.M., Penland, S., and Nummedal, D., 1984, Control of barrier island shape by inlet sediment bypassing—East Frisian Islands, West Germany: Marine Geology, v. 60, no. 1–4, p. 355–376, accessed January 23, 2023, at https://doi.org/10.1016/0025-3227(84)90157-9.
Forde, A.S., DeWitt, N.T., Wei, E.A., and Miselis, J.L., 2023, Archive of chirp subbottom profile data collected in 2022 from Seven Mile Island, New Jersey: U.S. Geological Survey data release, https://doi.org/10.5066/P9PY4RR0.
Forde, A.S., Flocks, J.G., Wiese, D.S., and Fredericks, J.J., 2016, Archive of digital chirp subbottom profile data collected during USGS cruise 14BIM05 offshore of Breton Island, Louisiana, August 2014: U.S. Geological Survey Data Series 972, 2 DVDs, http://dx.doi.org/10.3133/ds972.
Hapke, C.J., Kratzmann, M.G., and Himmelstoss, E.A., 2013, Geomorphic and human influence on large-scale coastal change: Geomorphology, v. 199, p. 160–170, accessed November 3, 2019, at https://doi.org/10.1016/j.geomorph.2012.11.025.
Harley, M.D., Masselink, G., Ruiz de Alegría-Arzaburu, A., Valiente, N.G., and Scott, T., 2022, Single extreme storm sequence can offset decades of shoreline retreat projected to result from sea-level rise: Communications Earth & Environment, v. 3, no. 1, article 112, accessed July 1, 2022, at https://doi.org/10.1038/s43247-022-00437-2.
Hein, C.J., Fenster, M.S., Gedan, K.B., Tabar, J.R., Hein, E.A., and DeMunda, T., 2021, Leveraging the interdependencies between barrier islands and backbarrier saltmarshes to enhance resilience to sea-level rise: Frontiers in Marine Science, v. 8, article 721904, accessed January 3, 2022, at https://doi.org/10.3389/fmars.2021.721904.
Kinsela, M.A., Hanslow, D.J., Carvalho, R.C., Linklater, M., Ingleton, T.C., Morris, B.D., Allen, K.M., Sutherland, M.D., and Woodroffe, C.D., 2022, Mapping the shoreface of coastal sediment compartments to improve shoreline change forecasts in New South Wales, Australia: Estuaries and Coasts, v. 45, no. 4, p. 1143–1169, accessed August 23, 2023, at https://doi.org/10.1007/s12237-020-00756-7.
Knebel, H.J., and Circé, R.C., 1988, Late Pleistocene drainage systems beneath Delaware Bay: Marine Geology, v. 78, no. 3–4, p. 285–302, accessed January 19, 2023, at https://doi.org/10.1016/0025-3227(88)90114-4.
Knebel, H.J., Fletcher, C.H., III, and Kraft, J.C., 1988, Late Wisconsinan-Holocene paleogeography of Delaware Bay; a large coastal plain estuary: Marine Geology, v. 83, no. 1–4, p. 115–133, accessed January 19, 2023, at https://doi.org/10.1016/0025-3227(88)90055-2.
Liu, S., and Goff, J.A., 2018, Lower shoreface seismic stratigraphy and morphology off Fire Island, New York—Evidence for lobate progradation and linear erosion: Continental Shelf Research, v. 163, p. 23–34, accessed October 25, 2019, at https://doi.org/10.1016/j.csr.2018.04.013.
Locker, S.D., Miselis, J.L., Buster, N.A., Hapke, C.J., Wadman, H.M., McNinch, J.E., Forde, A.S., and Stalk, C.A., 2017, Nearshore sediment thickness, Fire Island, New York: U.S. Geological Survey Open-File Report 2017–1024, 21 p., accessed October 3, 2019, at https://doi.org/10.3133/ofr20171024.
Lyons, E.O., DeWitt, N.T., Stalk, C.A., Reynolds, B.J., Farmer, A.S., Bernier, J.C., Galbraith, B.A., Wei, E.A., and Miselis, J.L., 2023, Coastal single-beam bathymetry data collected in 2022 off Seven Mile Island, New Jersey: U.S. Geological Survey data release, accessed December 1, 2023, at https://doi.org/10.5066/P9P07T3W.
Mattheus, C.R., Ramsey, K.W., and Tomlinson, J.L., 2020, The evolution of coastal-plain incised valleys over multiple glacio-eustatic cycles—Insights from the inner continental shelf of Delaware, U.S.A.: Journal of Sedimentary Research, v. 90, no. 11, p. 1510–1526, accessed June 3, 2022, at https://doi.org/10.2110/jsr.2020.69.
Miller, K.G., Rufolo, S., Sugarman, P.J., Pekar, S.F., Browning, J.V., and Gwynn, D.W., 1997, Early to middle Miocene sequences, systems tracts, and benthic foraminiferal biofacies, New Jersey Coastal Plain, in Miller, K.G., and Snyder, S.W., eds., Proceedings of the Ocean Drilling Program, Scientific Results, v. 150X: College Station, Tex., Ocean Drilling Program, p. 169–186, accessed May 3, 2021, at https://doi.org/10.2973/odp.proc.sr.150x.313.1997.
Miselis, J.L., and McNinch, J.E., 2006, Calculating shoreline erosion potential using nearshore stratigraphy and sediment volume—Outer Banks, North Carolina: Journal of Geophysical Research, Earth Surface, v. 111, no. F2, 15 p., accessed October 3, 2019, at https://doi.org/10.1029/2005jf000389.
Mitchum, R.M., Jr., Vail, P.R., and Sangree, J.B., 1977, Seismic stratigraphy and global changes of sea level—Part 6. Stratigraphic interpretation of seismic reflection patterns in depositional sequences—Section 2. Application of seismic reflection configuration to stratigraphic interpretation, in Payton, C.E., ed., Seismic stratigraphy—Applications to hydrocarbon exploration: Tulsa, Okla., American Association of Petroleum Geologists Memoir 26, p. 117–133, accessed September 8, 2023, at https://doi.org/10.1306/m26490c8.
National Oceanic and Atmospheric Administration [NOAA], 2020, Tide Tables 2020—East Coast of North and South America: Washington, D.C., U.S. Department of Commerce, 290 p, accessed May 3, 2022, at https://tidesandcurrents.noaa.gov/tidetables/2020/ectt_2020_full_book.pdf.
Nordstrom, K.F., Jackson, N.L., Bruno, M.S., and de Butts, H.A., 2002, Municipal initiatives for managing dunes in coastal residential areas—A case study of Avalon, New Jersey, USA: Geomorphology, v. 47, no. 2–4, p. 137–152, accessed March 23, 2021, at https://doi.org/10.1016/s0169-555x(02)00084-3.
Smith, P.C., 1996, Nearshore ridges and underlying upper Pleistocene sediments on the inner continental shelf of New Jersey: New Brunswick, N.J., Rutgers University, Master’s thesis, 157 p., accessed May 3, 2022, at https://www.boem.gov/sites/default/files/mm-research/2021-05/NJ_1996_Smith.pdf.
Snedden, J.W., Tillman, R.W., Kreisa, R.D., Schweller, W.J., Culver, S.J., and Winn, R.D., 1994, Stratigraphy and genesis of a modern shoreface-attached sand ridge, Peahala Ridge, New Jersey: Journal of Sedimentary Research, v. 64, no. 4b, p. 560–581, accessed August 1, 2021, at https://doi.org/10.1306/d4268004-2b26-11d7-8648000102c1865d.
Stalk, C.A., Farmer, A.S., Wei, E.A., and Miselis, J.L., 2022, Coastal multibeam bathymetry and backscatter data collected in May 2021 from Seven Mile Island, New Jersey: U.S. Geological Survey data release, https://doi.org/10.5066/P9M2EQIR.
Stive, M.J.F., and de Vriend, H.J., 1995, Modelling shoreface profile evolution: Marine Geology, v. 126, no. 1–4, p. 235–248, accessed at February 19, 2020, at https://doi.org/10.1016/0025-3227(95)00080-i.
Stockton University Coastal Research Center, 2012, An assessment of Cape May County beaches at the New Jersey Beach Profile Network (NJBPN) sites after Hurricane Sandy related to (DR-NJ 4086): Port Republic, N.J., The Stockton University Coastal Research Center, 39 p., accessed September 8, 2023, at https://stockton.edu/coastal-research-center/project-archive/documents/Cape_May2.pdf.
Stockton University Coastal Research Center, 2019, Final report for 2018 on the condition of the municipal oceanfront beaches—The Borough of Avalon, Cape May County, New Jersey: Port Republic, N.J., The Stockton University Coastal Research Center, 41 p., accessed September 8, 2023, at https://stockton.edu/coastal-research-center/documents/AVFinal2018.pdf.
Sugarman, P.J., Miller, K.G., Browning, J.V., Kulpecz, A.A., McLaughlin, P.P., Jr., and Monteverde, D.H., 2005, Hydrostratigraphy of the New Jersey Coastal Plain—Sequences and facies predict continuity of aquifers and confining units: Stratigraphy, v. 2, no. 3, p. 259–275, accessed February 23, 2023, at https://doi.org/10.29041/strat.02.3.04.
Sugarman, P.J., Monteverde, D.H., Stanford, S.D., Johnson, S.W., Stroiteleva, Y., Pristas, R.S., Vandegrift, K., and Domber, S.E., 2016, Geologic and aquifer map of Cape May County, New Jersey: New Jersey Geological and Water Survey Geologic Map Series GMS 16–1, 2 sheets, accessed February 23, 2023, at https://dep.nj.gov/wp-content/uploads/njgws/maps/gmseries/gms16-1.pdf.
Thompson, E.F., 1977, Wave climate at selected locations along U.S. coasts: Fort Belvoir, Va., U.S. Army Corps of Engineers Technical Report 77–1, 364 p., accessed September 8, 2023, at https://apps.dtic.mil/sti/pdfs/ADA037904.pdf.
Uptegrove, J., Mullikin, L.G., Waldner, J.S., Sheridan, R.E., Hall, D.W., Gilroy, J.T., and Farrell, S.C., 1994, Characterization of offshore sediments in Federal waters as potential sources of beach replenishment sand—Phase 1: Trenton, N.J., New Jersey Geological Survey Technical Report, 150 p., accessed May 2, 2022, at https://www.nj.gov/dep/njgs/pricelst/ofreport/ofr95-1.pdf.
U.S. Army Corps of Engineers [USACE], 2014, Hereford Inlet to Cape May Inlet—Final feasibility report and integrated environmental assessment: U.S. Army Corps of Engineers, Philadelphia District, 378 p., accessed September 8, 2023, at https://erdc-library.erdc.dren.mil/jspui/handle/11681/37696.
van der Spek, A., van der Werf, J., Oost, A., Vermaas, T., Grasmeijer, B., and Schrijvershof, R., 2022, The lower shoreface of the Dutch coast—An overview: Ocean & Coastal Management, v. 230, article 106367, accessed April 30, 2023, at https://doi.org/10.1016/j.ocecoaman.2022.106367.
Wei, E., and Miselis, J., 2022, Geologic framework, anthropogenic impacts, and hydrodynamics contribute to variable sediment availability and shoreface morphology at the Rockaway Peninsula, NY: Journal of Marine Science and Engineering, v. 10, no. 7, article 989, accessed August 1, 2022, at https://doi.org/10.3390/jmse10070989.
Wei, E.A., Miselis, J.L., and Forde, A.S., 2021, Shoreface and Holocene sediment thickness offshore of Rockaway Peninsula, New York: U.S. Geological Survey Open-File Report 2021–1100, 14 p., accessed July 17, 2022, at https://doi.org/10.3133/ofr20211100.
Conversion Factors
U.S. customary units to International System of Units
International System of Units to U.S. customary units
Datums
Vertical coordinate information is referenced to the North American Vertical Datum of 1988 (NAVD 88).
Horizontal coordinate information is referenced to the North American Datum of 1983 (NAD 83).
Elevation, as used in this report, refers to distance relative to the vertical datum.
Supplemental Information
For chirp data, frequencies are given in kilohertz, pulse length is given in milliseconds, and ping rate is given in hertz.
Abbreviations
>
greater than
chirp
compressed high intensity radar pulse
D50
median grain size
DEM
digital elevation model
GNSS
Global Navigation Satellite System
mbsl
meters below sea level
MIS
Marine Isotope Stage
NOAA
National Oceanic and Atmospheric Administration
R/V
research vessel
TWTT
two-way travel time
USACE
U.S. Army Corps of Engineers
USGS
U.S. Geological Survey
For more information about this publication, contact
Director, St. Petersburg Coastal and Marine Science Center
U.S. Geological Survey
600 4th Street South
St. Petersburg, FL 33701
For additional information, visit
https://www.usgs.gov/centers/spcmsc
Publishing support provided by
Lafayette Publishing Service Center
Disclaimers
Any use of trade, firm, or product names is for descriptive purposes only and does not imply endorsement by the U.S. Government.
Although this information product, for the most part, is in the public domain, it also may contain copyrighted materials as noted in the text. Permission to reproduce copyrighted items must be secured from the copyright owner.
Suggested Citation
Wei, E.A., Miselis, J.L., Buster, N.A., and Forde, A.S., 2025, Geologic framework and Holocene sand thickness offshore of Seven Mile Island, New Jersey: U.S. Geological Survey Scientific Investigations Report 2024–5131, 19 p., https://doi.org/10.3133/sir20245131.
ISSN: 2328-0328 (online)
Study Area
| Publication type | Report |
|---|---|
| Publication Subtype | USGS Numbered Series |
| Title | Geologic framework and Holocene sand thickness offshore of Seven Mile Island, New Jersey |
| Series title | Scientific Investigations Report |
| Series number | 2024-5131 |
| DOI | 10.3133/sir20245131 |
| Publication Date | March 14, 2025 |
| Year Published | 2025 |
| Language | English |
| Publisher | U.S. Geological Survey |
| Publisher location | Reston, VA |
| Contributing office(s) | St. Petersburg Coastal and Marine Science Center |
| Description | Report: viii, 19 p.; 2 Data Releases |
| Country | United States |
| State | New Jersey |
| Other Geospatial | Seven Mile Island |
| Online Only (Y/N) | Y |