

Estimation of Baseflow and Flooding Characteristics for East Canyon Creek, Summit and Morgan Counties, Utah
Links
- Document: Report (8.1 MB pdf) , HTML , XML
- Data Release: USGS data release - Baseflow estimation and trend and correlation analysis results for East Canyon Creek, Summit and Morgan Counties, Utah, 2010–2022
- NGMDB Index Page: National Geologic Map Database Index Page (html)
- Download citation as: RIS | Dublin Core
Acknowledgments
The authors acknowledge the Snyderville Water Reclamation District for funding this study and the streamgages that supported it, as well as for providing effluent data from the East Canyon Water Reclamation Facility.
Installation and maintenance for streamgages used in this study were done by Ryan Rowland, Martel Fisher, Brandon Root, Andy Karlson, Phil Klebba, Noah Derrick, Lincoln Smith, Manny Guzman, Chris Wilkowske, Mark Danner, Robert Eacret, Paul Downhour, Travis Gibson, and Adam Birken of the U.S. Geological Survey (USGS) Utah Water Science Center.
Assistance and guidance in baseflow modeling were provided by David O’Leary and Tom Marston of the USGS Utah Water Science Center and Matthew Miller of the USGS Water Mission Area.
Abstract
An improved understanding of hydrologic responses to changing climatic conditions is needed to better inform water management practices. East Canyon Creek, a perennial, snowmelt-dominated stream in the Wasatch Mountains of northern Utah, is subjected to increasing development and demands on water in the Snyderville Basin and adjacent areas. In this study, streamflow and specific conductance measured at three U.S. Geological Survey streamgages on East Canyon Creek were used to estimate daily baseflow for water years 2011–22. Trends in these estimates and correlations with climate data from two Natural Resource Conservation Service snow telemetry (SNOTEL) stations within the Snyderville Basin above East Canyon Reservoir, were quantified and reported. Peak annual streamflow also was assessed for flood potential on the study reach of East Canyon Creek. The hydrograph separations showed consistent baseflow indices among all sites, with a larger baseflow component during the fall–spring period (September–April; baseflow indices approximately equal to [≈] 0.751–0.835) and smaller component during the summer period (May–August; baseflow indices ≈ 0.428–0.532). In-stream specific conductance during spring (February–April) was influenced by road salt application, limiting the utility of the hydrograph separation approach. Annual streamflow and climate data were evaluated for trends using the nonparametric Mann–Kendall test, with inconclusive results. Related tests for trends, the Seasonal and Regional Kendall tests, were used to evaluate data at monthly timesteps and indicated a decreasing trend in total streamflow and baseflow at all streamgages. The rank-based Kendall’s tau test for correlation was used to measure the ordinal association with climatic data at co-located SNOTEL stations. Total streamflow and baseflow were strongly correlated with precipitation and snow-water equivalent. By incorporating a predictive regression model, the nonparametric Theil–Sen line, these correlations could support the development of streamflow forecast models using climate data from SNOTEL stations. Such models would provide water managers with tools to help make proactive decisions, such as reservoir or water reclamation releases and curtailment of withdrawals, in response to regional drought or varying snowpack and spring runoff in a given year.
Introduction
East Canyon Creek is a perennial, snowmelt-dominated stream in the Snyderville Basin of Summit and Morgan Counties, Utah (fig. 1). Its headwaters begin as McLeod Creek in the eastern slopes of the Wasatch Mountains before joining Kimball Creek to form East Canyon Creek below the Interstate 80 (I-80) overpass where it flows north-northwest into East Canyon Reservoir. The reach between the headwaters and East Canyon Reservoir includes three U.S. Geological Survey (USGS) streamgages that monitor streamflow and specific conductance (SC). The Snyderville Basin Water Reclamation District (SBWRD) provides wastewater collection and reclamation services for Park City, Utah, and the surrounding areas and operates a water reclamation facility on East Canyon Creek near Jeremy Ranch.
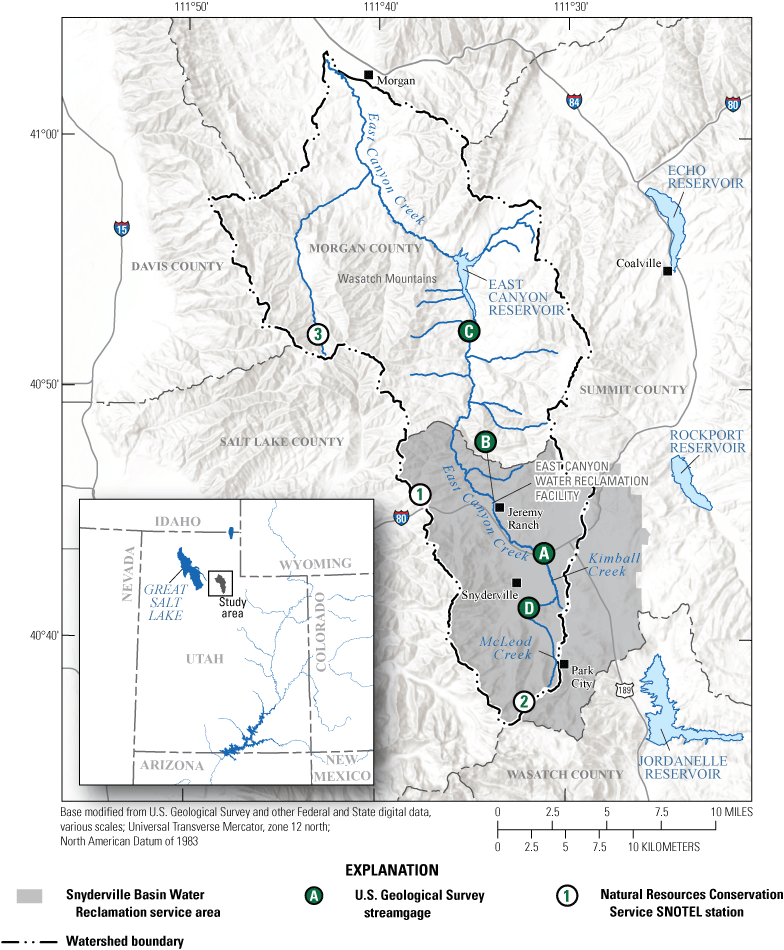
Location of East Canyon Creek in the Snyderville Basin, Summit and Morgan Counties, Utah. Streamlines and watershed boundaries from U.S. Geological Survey (USGS) National Hydrography Dataset (NHD) Plus High Resolution dataset (U.S. Geological Survey, 2022). Political boundaries and locations modified from USGS and other Federal and State geospatial data. Horizontal coordinates referenced to the North American Datum of 1983 with the National Adjustment of 2011. The snow telemetry (SNOTEL) stations (U.S. Department of Agriculture, National Water and Climate Center, 2025) are labeled with numbers: (1) Parleys Summit (684); (2) Thaynes Canyon (814); and (3) Hardscrabble (896; not included in study). The USGS streamgages (U.S. Geological Survey, 2024) are labeled with letters: (A) E Canyon CR BL I-80 Rest Stop NR Park City, UT (USGS streamgage 10133650); (B) East Canyon Creek Near Jeremy Ranch, UT (USGS streamgage 10133800); (C) East Canyon Creek AB East Cyn Res NR Morgan, Utah (USGS streamgage 10133980); and (D) Mcleod Creek Near Park City, UT (USGS streamgage 10133600, not included in baseflow estimation).
Baseflow represents the groundwater fraction of total streamflow that sustains flow between snowmelt and precipitation events. The baseflow component in East Canyon Creek was estimated for this study by means of a conductivity mass balance chemical hydrograph separation approach applied to SC and discharge data collected at USGS streamgages above (USGS streamgage 10133650; U.S. Geological Survey, 2024) and below (USGS streamgages 10133800 and 10133980; U.S. Geological Survey, 2024) the East Canyon Water Reclamation Facility (ECWRF; Pinder and Jones, 1969; Miller and others, 2014). Baseflow in the Upper Colorado River Basin, which includes the proximal eastern slopes of the Wasatch Mountains, is estimated, on average, to constitute 56 percent of total streamflow (Miller and others, 2016), providing a well-studied and analogous hydrological system for comparison. Quantitative baseflow estimates may be used to inform water management, provide reasonable forecasts for seasonal streamflow, and enable water managers to take proactive actions in response to seasonal climate fluctuations (Reay and others, 1992; Arnold and others, 2000; Levin and others, 2023).
Accurate flood frequency and magnitude estimates can be used in support of flood risk management and monitoring changes in hydrologic behavior. Guidelines to determine flood frequency have been provided by the USGS and other federal agencies since 1967 (U.S. Water Resources Council, 1967) through the time of this study (England and others, 2018). Methods to estimate flood frequency and magnitude incorporate annual peak streamflow to estimate recurrence probability. Flood frequency analyses can be applied to flood risk management and damage abatement, though flooding also may indicate changes in watershed hydrology such as frequency of rain-on-snow events, resiliency of baseflow, and climate change (Jenicek and others, 2016; Blahušiaková and others, 2020; Myers and others, 2023). With respect to the relation between baseflow in East Canyon Creek and flood frequency, the magnitude of flooding during spring snowmelt and runoff may be affected because baseflow begins to increase earlier in the spring (Berghuijs and Slater, 2023).
The conductivity mass balance method is best applied to streams and rivers with an inverse relation between discharge and SC, ideally in the absence of anthropogenic influences (Miller and others, 2014; Rumsey and others, 2015). Although the most upstream streamgage in the watershed with continuous SC monitoring (USGS streamgage 10133650, E Canyon CR BL I-80 Rest Stop NR Park City, UT; U.S. Geological Survey, 2024) is exposed to sources for contaminants, such as road salt or effluent from water reclamation facilities, the period of flow expected to be most affected occurs during spring runoff.
Purpose and Scope
The USGS, in cooperation with the SBWRD, evaluated the hydrologic characteristics of flows in East Canyon Creek to provide a contextual basis to better inform water management practices. The purposes of this report were to provide estimates of baseflow; describe long-term, seasonal, and year‐to‐year fluctuations in streamflow and baseflow; discuss relations between seasonal climate proxies, including temperature and snowpack, and streamgage data; and relate flood frequency and magnitude to anthropogenic and climatic influences.
The approach for this study includes compiling existing streamgage data collected at sites in the Snyderville Basin to (1) estimate baseflow using chemical hydrograph separation methods with daily streamflow and continuous SC data, (2) compare streamflow and baseflow with snow telemetry (SNOTEL) stations within the East Canyon Creek watershed to develop relations between streamflow and snowpack and timing of snowmelt, and (3) use long-term trends in streamflow, including magnitude, timing, and frequency of peak streamflow in East Canyon Creek, to evaluate the 100-year peak flow for East Canyon Creek at the ECWRF and the associated stage and inundated area.
Study Area
The reach of East Canyon Creek in this study flows through Summit and Morgan Counties, Utah, and north of Park City, Utah (fig. 1). East Canyon Creek is sourced from the east-facing slopes of the Wasatch Mountains and begins as McLeod Creek, which receives water from snowmelt and abandoned mining sites associated with the Spiro Tunnel. The beginning of East Canyon Creek is considered (in this report and in Wilkowske, 2005) to be where Kimball Creek joins McLeod Creek just upstream from USGS streamgage 10133650 (E Canyon CR BL I-80 Rest Stop NR Park City, Utah). A previous study of the Snyderville Basin estimated that precipitation comprises as much as 80 percent of total groundwater recharge, and total dissolved solids (TDS) concentrations in groundwater are between 200 and 600 milligrams per liter (mg/L) as a result of mixing with water from the Spiro Tunnel (Brooks and others, 1998). The ECWRF is a wastewater treatment facility on East Canyon Creek with a capacity of 4.0 million gallons per day (Mgal/d) and treats wastewater from Park City and western Snyderville Basin. Effluent, or treated wastewater, is returned to East Canyon Creek just upstream from USGS streamgage 10133800 (East Canyon Creek Near Jeremy Ranch, UT). East Canyon Creek gains water from small perennial streams, springs, and groundwater before flowing into East Canyon Reservoir at the terminus of the East Canyon Creek watershed (hydrologic unit 1602010201). Below East Canyon Reservoir, East Canyon Creek flows into the Weber River and, ultimately, the Great Salt Lake.
Streamgage Summary
This study incorporated daily streamgage data for baseflow and flood-frequency modeling from four streamgages in the study area (table 1). The conductivity mass balance method used to estimate baseflow requires daily streamflow and SC data which are available at three streamgages above East Canyon Reservoir on East Canyon Creek (fig. 2): (1) USGS streamgage 10133650, E Canyon CR BL I-80 Rest Stop NR Park City, UT; (2) USGS streamgage 10133800 East Canyon Creek Near Jeremy Ranch, UT; and (3) USGS streamgage 10133980 East Canyon Creek AB East Cyn Res NR Morgan, Utah (U.S. Geological Survey, 2024). Effluent data from the ECWRF (Root, 2025), including monthly TDS and daily discharge, also were incorporated into the calculation at downstream USGS streamgages 10133800 and 10133980. The method used to determine flood frequency, namely the Expected Moments Algorithm (England and others, 2018), requires only discharge monitoring, allowing for the streamgage on McLeod Creek to be included in the analysis (USGS streamgage 10133600, Mcleod Creek Near Park City, UT).
Table 1.
Description of U.S. Geological Survey streamgages on East Canyon Creek used in this study (U.S. Geological Survey, 2024).[ID, identification; N/A, not applicable; USGS, U.S. Geological Survey; yyyy-mm-dd, year-month-day]
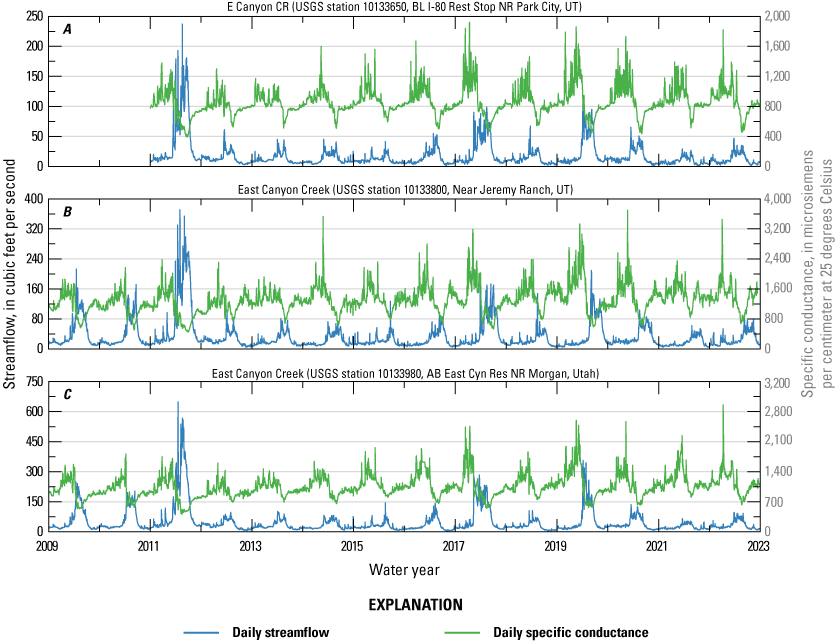
Daily streamflow (blue) and specific conductance (green) records for U.S. Geological Survey (USGS) streamgages (U.S. Geological Survey, 2024) at A, E Canyon CR BL I-80 Rest Stop NR Park City, UT (10133650); B, East Canyon Creek Near Jeremy Ranch, UT (10133800); and C, East Canyon Creek AB East Cyn Res NR Morgan, Utah (10133980). These streamgages are used to estimate baseflow on East Canyon Creek. A water year is the 12-month period from October 1 through September 30 of the following year and is designated by the calendar year in which it ends.
The most upstream streamgage in the reach with daily discharge and SC is USGS streamgage 10133650 (E Canyon CR BL I-80 Rest Stop NR Park City, UT). The streamgage is located immediately downstream from where I-80 crosses over McLeod Creek and below the confluence with Kimball Creek and represents a drainage area of 42.1 square miles (mi2). The site was established on October 31, 2002, for continuous discharge monitoring and discrete data collection, which began on November 7, 2002. The streamgage was updated in May 2010 to continuously measure SC, pH, and dissolved oxygen. The streambed comprises cobbles and gravel at the location of the streamgage, and the channel emerges from two 8-foot (ft) culverts approximately 100 ft upstream. A thick growth of riparian vegetation and other aquatic plants typically develops along the streambank during the late summer and early fall months before moderate to heavy ice builds over the stream during the winter. Because McLeod and Kimball Creeks join just upstream and may not be fully mixed at the streamgage, SC values may be skewed during high-flow events. This streamgage is likely exposed to anthropogenic contaminants including road salt from I-80 (Brooks and others, 1998).
U.S. Geological Survey streamgage 10133800 (East Canyon Creek Near Jeremy Ranch, UT) is approximately 4 miles (mi) downstream from USGS streamgage 10133650 and has a drainage area of 57.2 mi2. The streamgage is located on the Jeremy Ranch Golf and Country Club property just downstream from a culvert and the ECWRF. This streamgage records continuous discharge, SC, pH, water temperature, and dissolved oxygen. The streamgage was moved approximately 100 yards downstream in April 2016 due to poor mixing between ECWRF releases and natural streamflow at the site. The streambed comprises mostly cobbles, and the channel is straight above and below the streamgage as the stream flows from an 8-ft culvert. The streambanks are steep and covered with large rocks and vegetation including willows. Ice does not typically build during the winter due to constant warm-water releases from the ECWRF.
U.S. Geological Survey streamgage 10133980 (East Canyon Creek AB East Cyn Res NR Morgan, Utah) is approximately 10 mi downstream from USGS streamgage 10133800. This streamgage records continuous discharge, SC, pH, dissolved oxygen, and water temperature and is immediately upstream from East Canyon Reservoir on East Canyon Resort property and represents a 107 mi2 drainage area. The streambed comprises cobbles at the site of the streamgage, with a channel that is straight above and below. A bridge is immediately upstream and constricts flow at the site of the streamgage. The banks are steep and covered with large rocks, willows, and other vegetation. Considerable ice builds along the shore during the winter months, typically between December and February.
U.S. Geological Survey streamgage 10133600 (Mcleod Creek Near Park City, UT) is the most upstream streamgage in the watershed and is approximately 4 mi upstream from USGS streamgage 10133650. The streamgage has measured daily discharge since October 1990 but is not used for baseflow estimation in this study because SC is not measured at this site. The streambed consists of gravel and small- to medium-sized cobbles, and the channels are heavily vegetated with small willows that can constrict the channel and inhibit flow at the streamgage.
Snow Telemetry Stations
The Natural Resources Conservation Service operates two SNOTEL stations located within the study area above East Canyon Reservoir at Parleys Summit (site no. 684; 7,585 ft in altitude) and Thaynes Canyon (site no. 814; 9,230 ft in altitude; table 2). The Parleys Summit station has reported snow-water equivalent (SWE), daily precipitation, and cumulative precipitation since October 1, 1978; minimum, maximum, and mean daily temperature data were added on May 5, 2003. Thaynes Canyon has reported SWE, daily precipitation, and cumulative precipitation since October 1, 1987; minimum, maximum, and mean daily temperature data were added on June 21, 2004. The Parleys Summit and Thaynes Canyon SNOTEL station data may be accessed through the U.S. Department of Agriculture (USDA) Natural Resource Conservation Service (NRCS) National Water and Climate Center (NWCC) Air and Water Database website at https://wcc.sc.egov.usda.gov/nwcc/site?sitenum=684 and https://wcc.sc.egov.usda.gov/nwcc/site?sitenum=814, respectively (U.S. Department of Agriculture, National Water and Climate Center, 2025). A third site, the Hardscrabble SNOTEL station (site no. 896; 7,250 ft in altitude), drains into East Canyon Creek below East Canyon Reservoir and is not considered for this study.
Table 2.
Description of Natural Resources Conservation Service snow telemetry stations (U.S. Department of Agriculture, National Water and Climate Center, 2025) within the East Canyon Creek watershed used in this study.[ID, identification; SNOTEL, snow telemetry; yyyy-mm-dd, year-month-day]
Methods
The baseflow component in East Canyon Creek was estimated using conductivity mass balance hydrograph separation (Pinder and Jones, 1969; Miller and others, 2014; Rumsey and others, 2015, 2020) at USGS streamgages above (USGS streamgage 10133650) and below (USGS streamgages 10133800 and 10133980) the ECWRF, using approaches similar to those in related studies. Effluent data from the ECWRF (Root, 2025), including monthly TDS and daily discharge, were incorporated into the model at the two downstream sites (USGS streamgages 10133800 and 10133980).
Long-term trends in streamflow, including baseflow, magnitude, timing, and frequency of peak streamflows in East Canyon Creek, were evaluated at USGS streamgages 10133650, 10133800, and 10133980 on East Canyon Creek and 10133600 on McLeod Creek (fig. 1). Methods used to determine flood frequency, namely the Expected Moments Algorithm, are outlined in USGS Bulletin 17C (England and others, 2018). A companion software program developed by the USGS, PeakFQ (Veilleux and others, 2014), uses annual peak flows to calculate annual exceedance probabilities. Although the East Canyon Creek streamgage records are relatively short, with the earliest dating to 2001, they still exceed the minimum suggested record length of 10 years (U.S. Geological Survey, 2019) and produce recurrence intervals with adequate confidence. The McLeod Creek streamgage (USGS streamgage 10133600) has been active since 1991 and provides a more robust annual exceedance probability (AEP) graph.
Baseflow Estimation by Conductivity Mass Balance Hydrograph Separation
The baseflow component in East Canyon Creek was estimated at a daily timestep using a conductivity mass balance hydrograph separation approach. Streamflow (Q) and SC data required for hydrograph separation were obtained from the USGS National Water Information System (NWIS) online database (U.S. Geological Survey, 2024). Each respective streamgage record was truncated to the nearest complete water year (WY) on record to reduce seasonal bias. A water year is the 12-month period from October 1 through September 30 of the following year and is designated by the calendar year in which it ends. For sites 10133800 and 10133980, which are downstream from the ECWRF, the records are truncated from October 1, 2008, to September 15, 2022, to coincide with the earliest and last available effluent data.
The conductivity mass balance approach is best suited for sites that meet criteria outlined by Miller and others (2014) and Rumsey and others (2015). The summarized criteria that apply to this study include (1) an inverse relation between Q and SC as described by a power function; (2) annual peak discharge coinciding with snowmelt runoff during the spring–summer months, typically between March and June, and is an order of magnitude greater than low-flow conditions; (3) a wide range of SC values throughout the year, with the minimum approaching the runoff end-member; and (4) streamgages must be at least 2 kilometers (km) downstream from a reservoir. The streamgages used in this study did not fully satisfy the first criteria, so additional steps were taken to compensate. With respect to the first criteria, Q and SC showed an inverse relation only during the summer (May–August) and fall–winter months (September–January), with an early spring runoff (February–April) deviation (fig. 3) that may be related to anthropogenic contaminants, including road salt. Data during this spring runoff interval were excluded from the baseflow estimation to reduce the potential anthropogenic influence on the model during expected periods of runoff and characterize a more natural representation of East Canyon Creek.
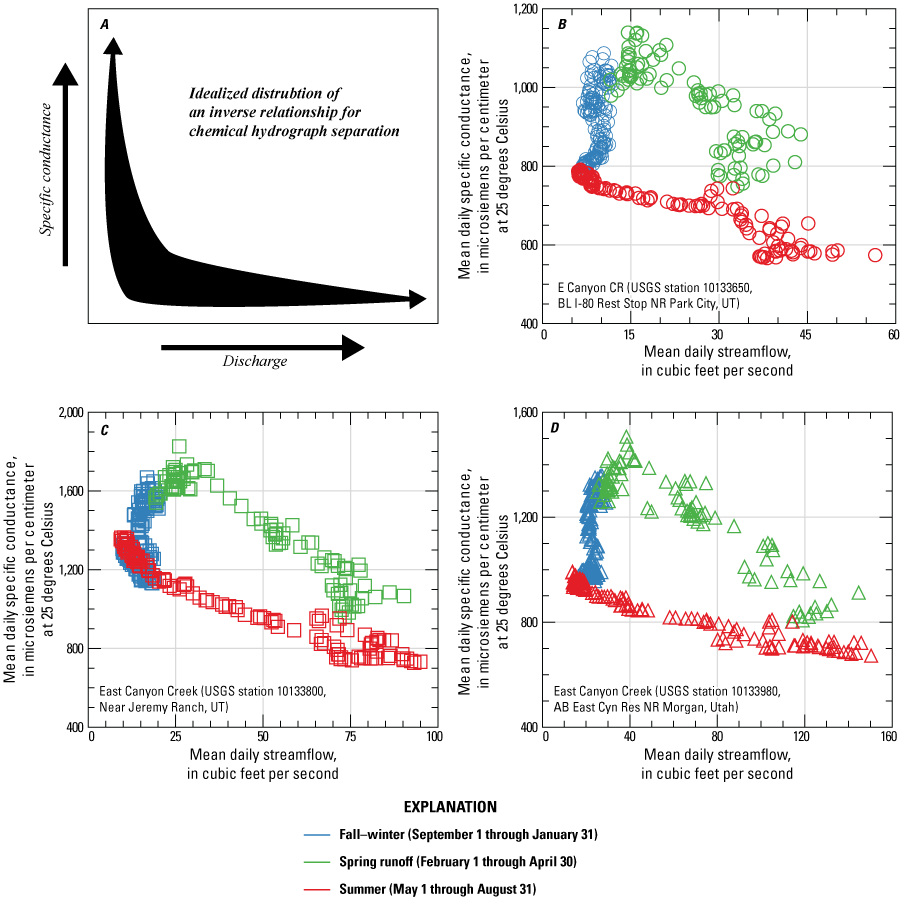
Relations between mean daily specific conductance (SC) and discharge (Q). A, The conductivity mass balance approach is best applied in rivers and streams that have an inverse relation between Q and SC, as indicated in this idealized graphic (Miller and others, 2014; Rumsey and others, 2015). The mean daily relations between Q and SC are shown for U.S. Geological Survey (USGS) streamgages B, 10133650 (E Canyon CR BL I-80 Rest Stop NR Park City, UT); C, 10133800 (East Canyon Creek Near Jeremy Ranch, UT); and D, 10133980 (East Canyon Creek AB East Cyn Res NR Morgan, Utah). During runoff (February–April), a distinct trend separate from the summer, fall, and winter is present at all streamgages (U.S. Geological Survey, 2024).
Daily baseflow was estimated for the period of record at each streamgage using a two-component mass balance approach (Pinder and Jones, 1969):
whereQBF
is the daily estimated baseflow, in cubic foot per second (ft3/s);
QGAGE
is the measured daily mean stream discharge of East Canyon Creek from the streamgage, in ft3/s; at USGS streamgage 10133650, this value is from the streamgage record (U.S. Geological Survey, 2024); at USGS streamgages 10133800 and 10133980, the value is the streamgage discharge minus the daily mean of effluent discharge from the ECWRF (QECC from eq. 2);
SCGAGE
is the measured daily mean SC of East Canyon Creek from the streamgage, in microsiemens per centimeters (µS/cm) at 25 degrees Celsius (°C); at USGS streamgage 10133650, this value is from the streamgage record (U.S. Geological Survey, 2024); at USGS streamgages 10133800 and 10133980, the value is solved using a simple mass balance equation (SCECC from eq. 2);
SCRO
is the estimated SC of the runoff end-member, in µS/cm at 25 °C; and
SCBF
is the estimated SC of the baseflow end-member, in µS/cm at 25 °C.
The USGS streamgage below I-80 (10133650) uses only streamgage Q and SC data. Effluent from the ECWRF impacts both the Q and SC records at downstream USGS streamgages (10133800 and 10133980) and is accounted for by a nested mass balance of effluent Q and SC. Monthly total effluent volumes were converted to daily mean effluent Q (in ft3/s) by linear interpolation. Monthly mean effluent TDS (in mg/L) were linearly interpolated to daily mean effluent TDS and were then converted to SC (in µS/cm at 25 °C) using the ratio of TDS to SC, which is typically between 0.5 and 0.9 (Hem, 1985; U.S. Geological Survey, 2019). Due to the proximity of USGS station 10133800 and the ECWRF, the ratio between TDS to SC was established by comparing days where the effluent discharge was nearly equal to the measured discharge of East Canyon Creek. The ratio of TDS to SC on those days was approximately 0.7; this ratio was used to estimate SC for the remainder of the TDS record. Streamgage Q and SC data from the two East Canyon Creek stations (USGS streamgages 10133800 and 10133980), downstream from the ECWRF, were corrected for effluent Q and SC by mass balance using the equations below:
and whereQGAGE
is the measured daily mean stream discharge of East Canyon Creek from the streamgage, in ft3/s;
SCGAGE
is the measured daily mean SC of East Canyon Creek from the streamgage, in µS/cm at 25 °C;
QECC
is the corrected daily mean stream discharge of East Canyon Creek with effluent removed from the streamgage, in ft3/s, and may be calculated by arranging equation 3 where QECC = QGAGE − QEFF;
SCECC
is the corrected daily mean SC of East Canyon Creek with effluent from the streamgage, in µS/cm at 25 °C, and may be calculated by arranging equation 2 where
QEFF
is the daily mean discharge of effluent from the ECWRF, in ft3/s; and
SCEFF
is the estimated daily mean SC of effluent from the ECWRF, in µS/cm at 25 °C.
By accounting for effluent in the streamgage record, the modified conductivity mass balance was used for baseflow estimation at USGS streamgages 10133800 and 10133980:
whereQBF
is the daily baseflow, in ft3/s;
QECC
is the corrected daily mean stream discharge of East Canyon Creek with effluent removed from the streamgage, in ft3/s, and is equal to QGAGE − QEFF;
SCECC
is the corrected daily mean SC of East Canyon Creek with effluent from the streamgage, in µS/cm at 25 °C, and may be calculated by arranging equation 2 where
SCRO
is the estimated SC of the runoff end-member, in µS/cm at 25 °C; and
SCBF
is the estimated SC of the baseflow end-member, in µS/cm at 25 °C.
The runoff end-member (SCRO) represents an estimate of the low-SC surface or near-surface waters that flow into East Canyon Creek and has not been measured in the Wasatch Mountains. Another study in the Upper Colorado River Basin estimated the SCRO in snowmelt-dominated hydrological systems at 33 µS/cm at 25 °C (Miller and others, 2014). Because Miller and others (2014) was based on high-elevation catchments that drain small watersheds during runoff analogous to the Snyderville Basin, 33 µS/cm at 25 °C runoff was used in this study as the SCRO.
The annual estimate of baseflow SC was estimated by calculating the 95th percentile of daily SC values (SCGAGE for 10133650, eq. 1; SCECC for 10133800 and 10133980, eqs. 2, 4) for each water year on record. This annual baseflow SC omitted data from the spring runoff period (February–April) because that period deviates from the inverse relation of SC and Q. The annual 95th percentile estimates of SCBF were linearly interpolated to derive a daily baseflow end-member (SCBF; eq. 1) for the period of record, including during the spring runoff months. Mean daily values for baseflow and streamflow are the mean values of each day of the year from January 1 to December 31 over the period of record. The baseflow index (BFI) is the ratio of total baseflow to total streamflow and was calculated annually for each streamgage. Seasonal BFI also was determined in order to highlight the effect of varying hydrologic conditions on baseflow.
The conductivity mass balance method includes three assumptions: (1) no additional streamflow inputs beyond those described above contribute to streamflow; (2) SCRO is a constant; and (3) SCRO and SCBF are significantly different (Sklash and Farvolden, 1979; Miller and others, 2014). For streamgages affected by effluent from the ECWRF, SCRO, and SCBF are further assumed to be significantly different than SCEFF.
Trend and Correlation Analysis for SNOTEL and Streamflow Data
Daily data for WYs 2011–22 from SNOTEL and streamgage records were used to develop annual and monthly trends and correlations. Only datasets with years that include data for every month in a water year were considered. For SNOTEL data, daily metrics for SWE, precipitation, and temperature were used. Daily SNOTEL data were compiled using the snotelr package for R (Hufkens, 2022). Annual and monthly variables derived from streamgage data include mean discharge, mean baseflow, and mean BFI. These data are available as a data release at https://doi.org/10.5066/P14SJDMX (Root, 2025).
Annual and Seasonal Trend Analyses
Changes in snowpack, precipitation, and temperature at SNOTEL stations and in streamflow and baseflow at streamgages were assessed for trends independently and with respect to one another. Data from two SNOTEL stations within the East Canyon Creek watershed at Parleys Summit (station 684) and Thaynes Canyon (station 814) were considered, and only streamgages on East Canyon Creek that had estimated baseflow were included in the trend tests (USGS streamgages 10133650, 10133800, and 10133980).
Daily data at SNOTEL stations and streamgages were log transformed and tested for annual and seasonal trends. The nonparametric Mann–Kendall test for trend (Mann, 1945; Helsel and others, 2020a) determines the significance of change in annual data over time. The rkt package for R (version 4.2.1; Marchetto, 2021; R Core Team, 2022) was used for the Mann–Kendall test. Corrections for autocorrelation were made using the zyp package for R (Bronaugh and others, 2023). The annual SNOTEL data tested were peak SWE, day of year of peak SWE, cumulative precipitation, cumulative rain, percentage of snow, days between peak SWE and last melt, and melt rate; annual streamgage data tested were mean streamflow, mean baseflow, and BFI.
Seasonal and regional tests for trend were done for SNOTEL and streamgage data. The Seasonal Kendall test (Hirsch and others, 1982; Helsel and others, 2020a) accounted for seasonality by performing the Mann–Kendall tests on each variable at a defined timestep and then combining the result. Monthly timesteps were used for all seasonal trend tests. To test for trends in serially correlated SNOTEL and streamgage data, regional covariates from both datasets were incorporated into this analysis at seasonal timesteps. This trend test, the Regional Kendall test (Helsel and Frans, 2006; Helsel and others, 2020a), also is based on the Mann–Kendall test and operates in the same manner as the Seasonal Kendall test but between response data from different sites. The Seasonal and Regional Kendall tests were done using the rkt package in R (version 4.2.1; Marchetto, 2021; R Core Team, 2022) which includes an onboard correction for autocorrelation and allows for the inclusion of a response covariable. In instances with a covariable, the test is considered a partial trend test in which the critical region, or the set of values for the test statistic for which the null hypothesis is rejected, is determined by the conditional distribution of Mann–Kendall tests for monotonic trend within a set of other Mann–Kendall tests. Because these tests include comparing streamgage-to-streamgage or SNOTEL-to-SNOTEL as well as streamgage-to-SNOTEL at monthly timesteps, they may be considered a combined Seasonal–Regional Kendall test. Monthly SNOTEL data of maximum SWE, mean maximum daily temperature, total days of loss of SWE, cumulative monthly precipitation, and the cumulative annual precipitation through the month in the water year were tested for trends; monthly mean streamflow, baseflow, and BFI were tested for trends at streamgages. Results of the trend tests include uncorrected (rkt) and corrected (zyp) p-values and Kendall’s tau which is a measure of the relation between two ranked variables. The Theil–Sen line is a robust nonparametric regression based on the median of one variable given another (Theil, 1950; Sen, 1968; Helsel and others, 2020a). The Theil–Sen slope was calculated only for trend tests without a covariable and may be used to quantify the trend per unit time. For annual trend tests only, the zyp package provides upper and lower 95-percent confidence intervals for the Thiel–Sen slope and y-intercept.
Annual and Seasonal Correlation Analyses
Kendall’s tau test for correlation was used to determine the ordinal association between annual and seasonal variables in streamgage and SNOTEL data (Helsel and others, 2020a). This correlation method is a rank-based test that measures the strength of a monotonic relation between two variables. Due to the short overlapping record (WYs 2011–22), Kendall’s tau test for correlation is well suited for this study because it resists the influence of outliers. For seasonal correlation, each variable was separated by month. Each month, for every variable of SNOTEL and streamflow, data were tested against one another to produce p-values and Kendall’s tau values. Of the 12,960 different possible combinations, tests could not be performed on 972 pairs due to unsuitable data such as testing against peak SWE during the summer months. A strong linear correlation generally corresponds with Kendall’s tau values of 0.7 or greater (Helsel and others, 2020a).
The Kendall’s tau test for correlation was done using the cor.test function, part of the base R package (version 4.2.1; R Core Team, 2022), to produce two-sided p-values with a continuity correction applied. Correlation tests results were organized by p-value and Kendall’s tau as first-order metrics to determine the strongest correlations between datasets.
The Theil–Sen line was calculated for all correlation pairs to develop predictive relations between each data pair, such as streamgage and SNOTEL data. Because it is closely related to Kendall’s tau, the Theil–Sen line is not strongly affected by outliers. The senth script published with the supporting materials for Statistical Methods in Water Resources (Helsel and others, 2020b) was used to calculate the Theil–Sen line. This script provides the calculated Theil–Sen slope, upper and lower 95-percent confidence intervals of the slope, and the y-intercept of the Theil–Sen line. The correlation test was not done for tests with tied data that dropped the number of available ranked months below a minimum threshold of n=10; in these instances, all data are recorded as NA (not assessed).
Flood Frequency
Flood frequency analyses were done on East Canyon Creek and McLeod Creek to estimate the Pearson Type III distribution parameters and determine flood frequency. The Expected Moments Algorithm provides a direct fit of the distribution using annual peak streamflow data (fig. 4) and adjustments for potentially influential low floods; these methods are detailed in USGS Bulletin 17C (England and others, 2018). The companion software program developed by the USGS (Flynn and others, 2006; Veilleux and others, 2014), PeakFQ (version 7.4.1), uses annual peak flows to calculate annual exceedance probabilities. Although the streamgage records on East Canyon Creek at USGS streamgages 10133650 (WY 2003), 10133800 (WY 2002), and 10133980 (WY 2008) are relatively short, they still exceed the minimum suggested record length of 10 years (U.S. Geological Survey, 2019) and produce recurrence intervals with adequate confidence. Data through WY 2022 were included in the analyses. The USGS streamgage on McLeod Creek (10133600) was established in 1991 and had a 7-year hiatus in monitoring between 1997 and 2002; all available complete WYs are incorporated into the analysis. Annual peak discharge has typically occurred in the late spring or early summer during the period of record. Kenney and others (2007) provided additional work on flood frequency for streams and rivers in Utah including East Canyon Creek.
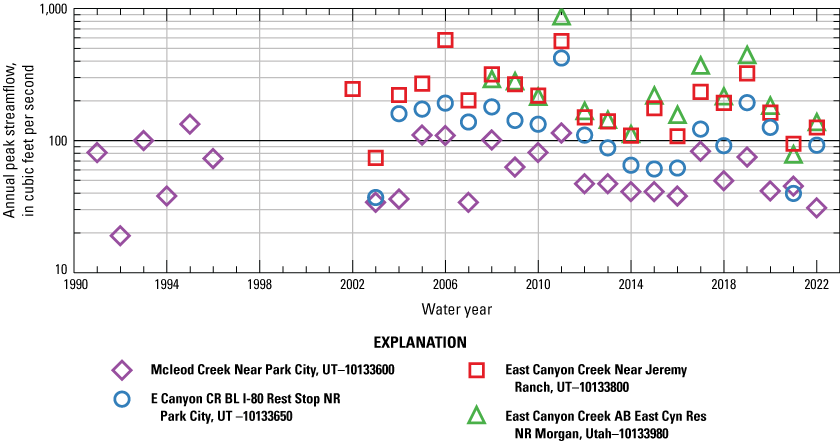
Annual peak streamflow on a logarithmic scale by water year at U.S. Geological Survey streamgages on McLeod Creek and East Canyon Creek (U.S. Geological Survey, 2024). These data are used for the Expected Moments Algorithm to determine flood frequency. A water year is the 12-month period from October 1 through September 30 of the following year and is designated by the calendar year in which it ends.
Annual exceedance probability indicates the probability that measured streamflow will be equaled or exceeded in a given year, whereas a flood recurrence interval is the number of years before a flood of a given magnitude is statistically likely to recur. The AEP is used in this study. The flood recurrence interval (for example, a 100-year flood) has become a less commonly used indicator of flood frequency because it can be misleading with respect to the imminence or absence of flooding.
Results
This section summarizes the results of baseflow estimation; the relation between streamflow, baseflow, and climatological data at SNOTEL stations; and the flood frequency analysis on East Canyon Creek above East Canyon Reservoir. Baseflow estimation and trend and correlation test results are available as a data release at https://doi.org/10.5066/P14SJDMX (Root, 2025).
Baseflow Estimation by Conductivity Mass Balance Hydrograph Separation
Baseflow was estimated at three USGS streamgages (10133650, 10133800, and 10133980) on East Canyon Creek. Daily baseflow (fig. 5), mean daily baseflow (fig. 6), and annual and seasonal BFI (table 3) were calculated by conductivity mass balance hydrograph separation and associated calculations at each streamgage. The annual streamflow and baseflow volume delivered to East Canyon Reservoir at USGS streamgage 10133980 ranged from approximately 16,800 to 92,000 and 11,000 to 60,000 acre-feet (acre-ft), respectively. These values were based on the annual mean discharge at the streamgage according to annual statistics for the period of record (U.S. Geological Survey, 2024). Though streamflow and baseflow proportionally increased at streamgages downstream as East Canyon Creek gains from its tributaries, the contribution from baseflow to streamflow decreased by about 10 percent (table 3). The streamflow and baseflow volumes increased by a factor of approximately 3 from the most upstream USGS streamgage (10133650) to the most downstream USGS streamgage (10133980).
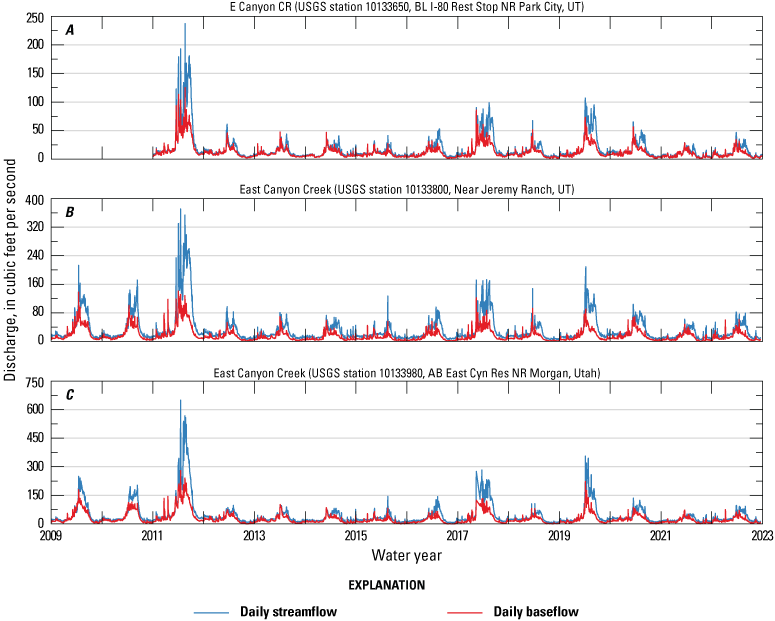
Daily streamflow (blue) and daily estimated baseflow (red) for U.S. Geological Survey (USGS) streamgages (U.S. Geological Survey, 2024) at A, E Canyon CR BL I-80 Rest Stop NR Park City, UT (10133650); B, East Canyon Creek Near Jeremy Ranch, UT (10133800); and C, East Canyon Creek AB East Cyn Res NR Morgan, Utah (10133980). A water year is the 12-month period from October 1 through September 30 of the following year and is designated by the calendar year in which it ends.
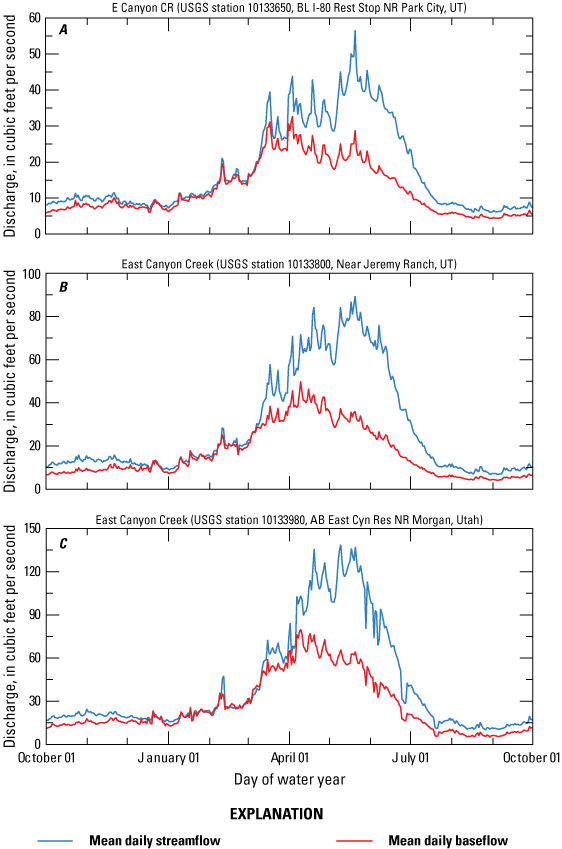
Mean daily streamflow (blue) and estimated baseflow (red) for U.S. Geological Survey (USGS) streamgages (U.S. Geological Survey, 2024) at A, E Canyon CR BL I-80 Rest Stop NR Park City, UT (10133650); B, East Canyon Creek Near Jeremy Ranch, UT (10133800); and C, East Canyon Creek AB East Cyn Res NR Morgan, Utah (10133980). These data represent the mean for all available daily values on each day of the water year for the period of record. A water year is the 12-month period from October 1 through September 30 of the following year and is designated by the calendar year in which it ends.
Table 3.
Annual and seasonal baseflow indices (BFI) and standard deviations at U.S. Geological Survey (USGS) streamgages 10133650, E Canyon CR BL I-80 Rest Stop NR Park City, UT; 10133800, East Canyon Creek Near Jeremy Ranch, UT; and 10133980, East Canyon Creek AB East Cyn Res NR Morgan, Utah (U.S. Geological Survey, 2024).[Runoff (February–April) effects on specific conductance and effluent from the East Canyon Water Reclamation Facility are accounted for in these results. Spring, February–April; summer, May–August; fall-winter, October–January. Abbreviation: ID, identification]
The annual BFI ranged between 0.592 and 0.697, and all sites demonstrated a consistent response to seasonal change in hydrology over the course of the water year. At the beginning of the water year (October 1), baseflow was the dominant component of streamflow through the winter (BFI=0.751–0.835; table 3). Streamflow and baseflow values then increased in parallel during spring runoff (BFI=0.712–0.814; table 3) until late spring–summer when baseflow values declined as runoff values continued to increase. While streamflow declined throughout the summer, baseflow decreased in parallel through the remainder of the water year (BFI=0.428–0.532; table 3). The annual variance, measured by standard deviation, of baseflow estimates ranged from 15 to 18 percent (table 3).
The mean daily streamflow and baseflow on East Canyon Creek represented the general relation between streamflow components throughout the water year (fig. 6). Though the actual mean daily streamflows or baseflows were dependent on annual snowpack and were highly variable in magnitude year-to-year (fig. 5), the relation (or BFI) between streamflow and baseflow largely remained constant during the winter but was more susceptible to fluctuation during the summer (fig. 7).
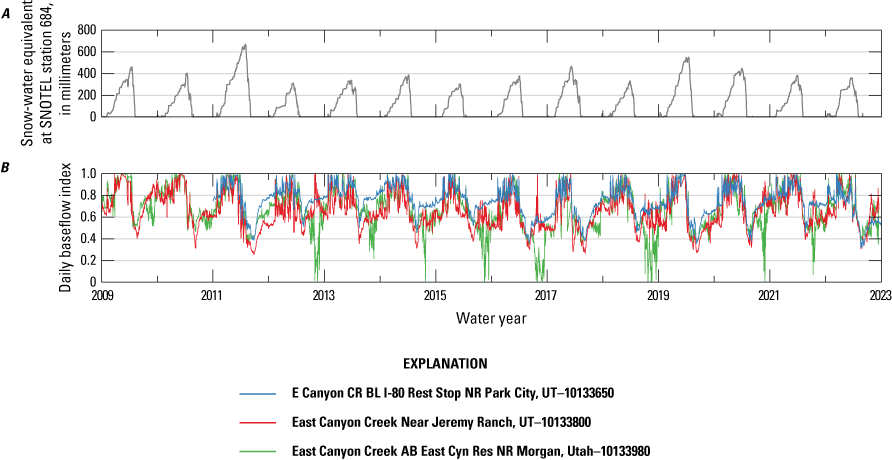
Time series of A, snow-water equivalent at the Parleys Summit snow telemetry (SNOTEL) station (684; U.S. Department of Agriculture, National Water and Climate Center, 2025) and B, daily baseflow index (BFI) for U.S. Geological Survey streamgages (U.S. Geological Survey, 2024) at E Canyon CR BL I-80 Rest Stop NR Park City, UT (10133650), East Canyon Creek Near Jeremy Ranch, UT (10133800), and East Canyon Creek AB East Cyn Res NR Morgan, Utah (10133980). Baseflow may be overestimated on some days and exceed a ratio of 1.0 of baseflow to streamflow; in these instances, the BFI is capped at 1.0 for visual representation. A water year is a one-year period from October 1 through September 30 of the following year and is named for the year in which the period ends.
The effect of effluent on baseflow at the two downstream sites was not assessed by statistical means, though its cumulative impact was qualitatively determined to be minimal at annual timescales. However, low flows during the summer months may incorrectly underestimate the daily baseflow component of streamflow at the USGS streamgage upstream from East Canyon Reservoir (10133980). Because the daily SC of effluent was estimated by linear interpolation of a monthly value, which also was converted from TDS, the suitability of estimating daily SC decreases when the streamflow is nearly equal to the effluent discharge. These circumstances resulted in underestimating the BFI, down to nearly zero, on low flow days (fig. 7).
Trends in Annual and Seasonal Streamflow, Baseflow, and Climatological Data
The Mann–Kendall test for trends was done at annual timesteps for USGS streamgages and SNOTEL sites. Statistically significant trends on annual timesteps were not detected from streamgage or SNOTEL data (fig. 8). At the annual scale, the records were likely too short to develop statistically significant trends. Probability is represented by p-value and can be used to initially test for assessing statistical significance. A level of significance of 0.05 (α=0.05) was used to determine statistical significance for trend results; Mann-Kendall test results indicate that statistically significant annual trends were not detected. Corrections for autocorrelation did not appreciably change the results of the annual trend tests. Tabular test results are available at https://doi.org/10.5066/P14SJDMX (Root, 2025).
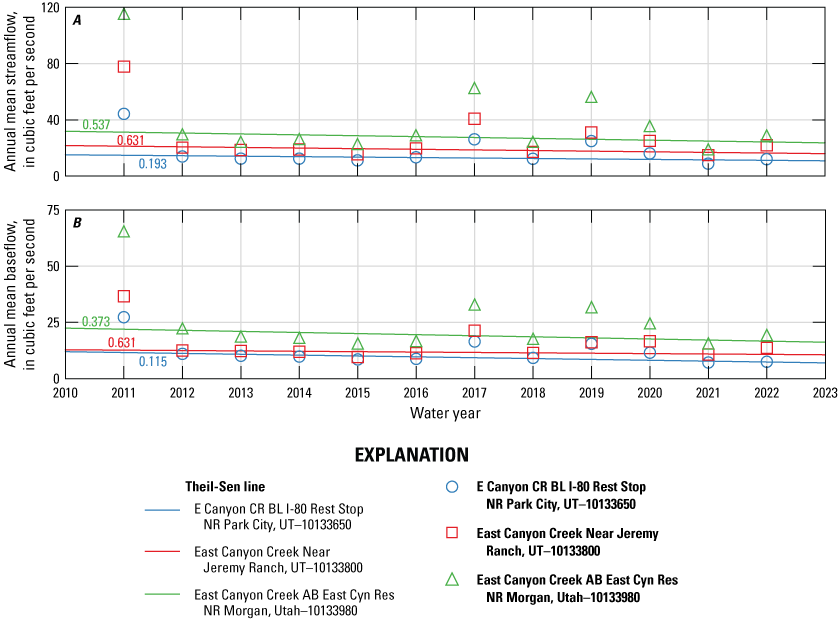
Annual time series for water years 2011–22 for A, annual mean streamflow and B, annual mean baseflow for U.S. Geological Survey streamgages (U.S. Geological Survey, 2024) at E Canyon CR BL I-80 Rest Stop NR Park City, UT (10133650), East Canyon Creek Near Jeremy Ranch, UT (10133800), and East Canyon Creek AB East Cyn Res NR Morgan, Utah (10133980) with the Theil–Sen line for each respective dataset. Numbers along the Theil–Sen line are p-values from the Mann–Kendall trend test that have been corrected for autocorrelation; the colors of these numbers correspond with their respective streamgage. A water year is a one-year period from October 1 through September 30 of the following year and is named for the year in which the period ends.
Monthly trend tests or Seasonal–Regional Kendall tests identified statistically significant trends, particularly with respect to streamflow and baseflow. Monthly mean streamflows and baseflows at USGS streamgages 10133650 (uncorrected p-values of 7.08E−4 and 2.71E−6, respectively) and 10133980 (uncorrected p-values of 0.011 and 0.015, respectively) had decreasing trends over the period of record (WYs 2011–22). U.S. Geological Survey streamgage 10133800 showed less likelihood of a trend in monthly mean streamflow and baseflow, with uncorrected p-values of 0.046 and 0.138, respectively. Monthly mean temperature at SNOTEL station 814 indicated a positive trend and was the only climate variable with a statistically significant trend (uncorrected p-value of 0.024). When SNOTEL attributes were tested with streamgage data as response covariables, only seven instances, including maximum precipitation recorded during each month at SNOTEL station 814 with baseflow as the response covariables at USGS streamgage 10133650 (fig. 9), indicated significant trends may be present. Only two of these instances had corrected p-values below 0.05: (1) mean temperature at SNOTEL station 814 with a response covariable of BFI at USGS streamgage 10133800 (corrected partial p-value of 0.049) and (2) total number of days in a month where SWE loss is recorded at SNOTEL station 684 with a response covariable of streamflow at USGS streamgage 10133650 (corrected partial p-value of 0.050). Other combinations of covariable pairs included streamgage-to-streamgage or streamgage-to-SNOTEL data (where SNOTEL data were the response covariable) that are intrinsically autocorrelated; these results were expected to produce the most statistically significant trends, thereby demonstrating the resiliency of the trend test. For example, monthly streamflow at USGS streamgage 10133650 tested for trend with a response covariable of streamflow at USGS streamgage 10133800 that resulted in an uncorrected partial p-value of 1.85E−4.
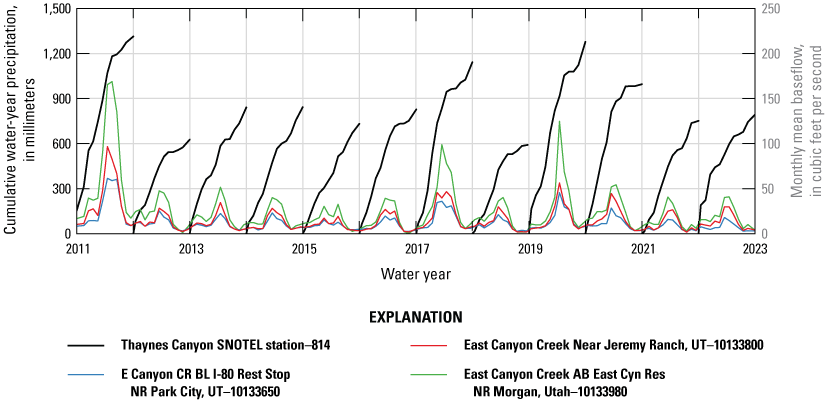
Annual time series for water years 2011–22 illustrating the relations between cumulative precipitation through each water year at the Thaynes Canyon snow telemetry (SNOTEL) station (814; U.S. Department of Agriculture, National Water and Climate Center, 2025) and monthly mean baseflows for U.S. Geological Survey streamgages (USGS; U.S. Geological Survey, 2024) at E Canyon CR BL I-80 Rest Stop NR Park City, UT (10133650); East Canyon Creek Near Jeremy Ranch, UT (10133800); and East Canyon Creek AB East Cyn Res NR Morgan, Utah (10133980). A trend was not detected in the monthly precipitation record (p-value=0.843), though a potentially significant trend may be present with baseflow considered as a response covariable to precipitation. The p-values from the partial trend test for maximum precipitation recorded during each month at SNOTEL station 814 with baseflow response covariables at USGS streamgages 10133650, 10133800, and 10133980 are, respectively, 0.005, 0.125, and 0.358 (uncorrected for autocorrelation) or 0.161, 0.347, and 0.496 (corrected for autocorrelation). A water year is the 12-month period from October 1 through September 30 of the following year and is designated by the calendar year in which it ends.
Correlations in Annual and Seasonal Streamflow, Baseflow, and Climatological Data
The Kendall’s tau test for correlation yielded results that indicated strong correlations between streamgage and climatological SNOTEL data were present at annual and monthly timesteps. Tabular results of the correlation tests were summarized in a data release at https://doi.org/10.5066/P14SJDMX (Root, 2025).
The strongest correlation was between annual streamflow at USGS streamgage 10133650 and annual peak SWE at SNOTEL station 814. This pair was the only test for annual data that indicated a strong linear correlation by Kendall’s tau (0.709), though there was strong evidence (p-values between 0.002 and 0.017) with a high probability of correlation for streamflow and baseflow at all streamgages with peak SWE and cumulative precipitation at SNOTEL station 814. These test statistics were used as a guide for correlations that may be statistically significant and do not substantiate a definite relation.
Correlation test results at monthly timesteps highlighted many statistically significant correlations between streamgage and climatological SNOTEL data. Among the strongest correlations were spring streamflow and baseflow with winter precipitation and SWE (fig. 10). This correlation was strongest between streamflow and baseflow at downstream USGS streamgages 10133800 and 10133980; USGS streamgage 10133650 had a comparatively weaker correlation between streamflow and baseflow in the late spring months (April–May) with maximum monthly precipitation and SWE at SNOTEL station 814 in the winter (January–March). Because all streamgage and SNOTEL attributes were tested against one another every month, some results indicated a false correlation between intrinsically unrelated measures such as spring streamflow and summer precipitation.
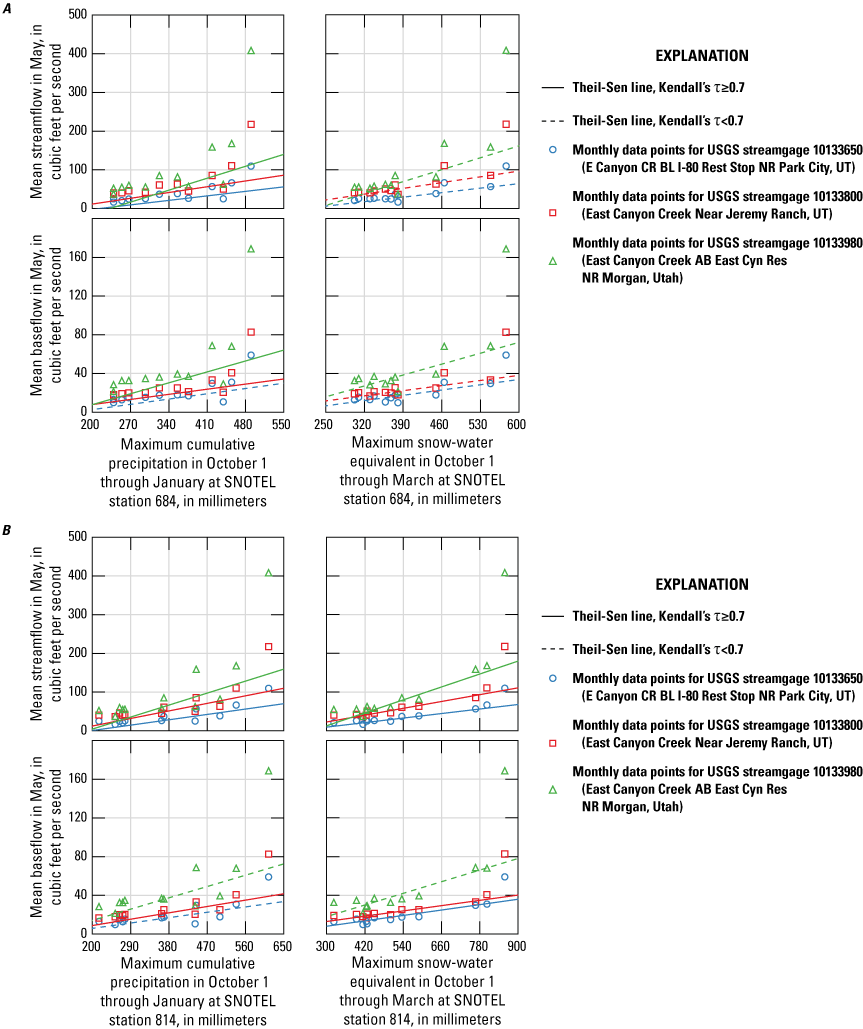
Scatterplots relating monthly precipitation and snow-water equivalent from winter months with spring streamflow and baseflow, with the Theil–Sen line providing an indication of statistical significance for correlation at snow telemetry (SNOTEL) stations A, 684 and B, 814. These scatterplots provide examples where SNOTEL data (U.S. Department of Agriculture, National Water and Climate Center, 2025) from one station may strongly correlate with streamflow and baseflow, whereas the other SNOTEL station may not strongly correlate with streamflow and baseflow. Abbreviation: USGS, U.S. Geological Survey.
Flood Frequency
Table 4 summarizes estimates of flood frequency on East Canyon Creek. The results provide flood frequency data in terms of AEP and recurrence interval for East Canyon Creek and McLeod Creek above East Canyon Reservoir.
Table 4.
Annual exceedance probabilities (AEPs) and recurrence intervals for flood frequency on East Canyon Creek at U.S. Geological Survey (USGS) streamgages: 10133600, Mcleod Creek Near Park City, UT; 10133650, E Canyon CR BL I-80 Rest Stop NR Park City, UT; 10133800, East Canyon Creek Near Jeremy Ranch, UT; and 10133980, East Canyon Creek AB East Cyn Res NR Morgan, Utah (U.S. Geological Survey, 2024).[ft3/s, cubic feet per second; Q, discharge; Q5, lower 5th percentile discharge; Q95, upper 95th percentile discharge]
The highest annual peak streamflow in the period of record at all streamgages (figs. 4, 11) was 876 ft3/s, recorded on April 18, 2011, at USGS streamgage 10133980 (U.S. Geological Survey, 2024). This peak streamflow indicated a flood with an AEP of approximately 6.2 percent. Because this peak streamflow represented the upper end of recorded streamflows, the upper and lower confidence limits widened without additional data. For this event, the AEP may have been as high or low as approximately 11 or 0.4 percent, respectively. Further upstream on East Canyon Creek or McLeod Creek, the range of possible peak streamflows with low AEP narrowed.
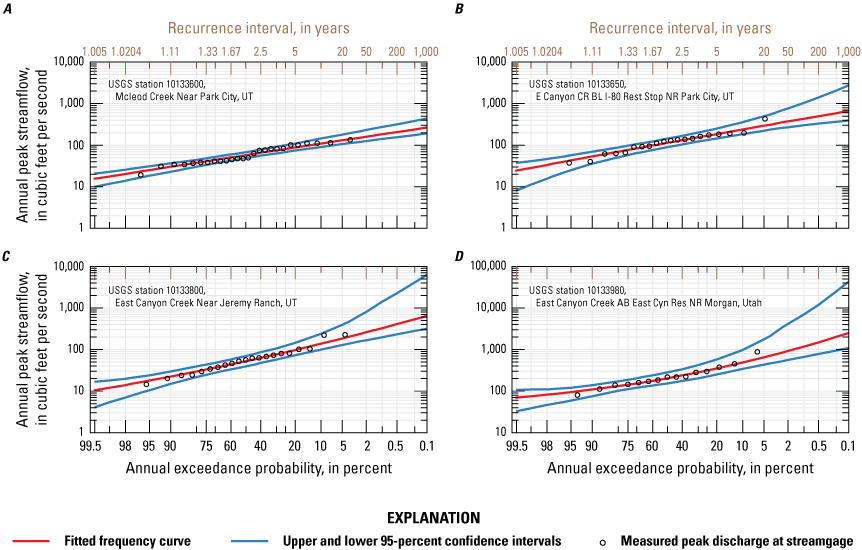
Annual exceedance probabilities and recurrence intervals at U.S. Geological Survey streamgages (U.S. Geological Survey, 2024) are shown in the following locations: A, Mcleod Creek Near Park City, UT (10133600); B, E Canyon CR BL I-80 Rest Stop NR Park City, UT (10133650); C, East Canyon Creek Near Jeremy Ranch, UT (10133800); and D, East Canyon Creek AB East Cyn Res NR Morgan, Utah (10133980). The circles represent the annual peak streamflow from figure 4, with a fitted frequency curve (red) and calculated upper and lower 95-percent confidence intervals (blue).
Discussion on Baseflow Estimation, Trend and Correlation Analysis, and Forecasting Streamflow
Baseflow Estimation
The spatial distributions of streamflow and baseflow volumes varied downstream, whereas the drainage areas increased and East Canyon Creek gained flow from its tributaries. The median annual streamflow volume and annual baseflow volume at each streamgage did not linearly increase downstream. The streamflow volume (table 5) that entered East Canyon Reservoir (10133980) was approximately 28 percent greater than the streamflow volume below ECWRF (10133800) despite the drainage area nearly doubling from 57.2 to 107 mi2. This relation is not strongly affected by year-to-year fluctuations in snowpack or precipitation because the ratio of annual streamflow and baseflow volume delivered to East Canyon Reservoir does not appreciably change with magnitude (table 5). However, patterns in baseflow at the lowermost USGS streamgage above East Canyon Reservoir (10133980) were often inconsistent with patterns in baseflow at the upper two USGS streamgages (10133650 and 10133800) during the summer months, particularly with respect to a decrease in BFI (fig. 7). This decrease was often associated with low flows.
Table 5.
Annual streamflow and baseflow volumes for the periods of record at U.S. Geological Survey (USGS) streamgages (U.S. Geological Survey, 2024) 10133650, E Canyon CR BL I-80 Rest Stop NR Park City, UT (2011–23); 10133800, East Canyon Creek Near Jeremy Ranch, UT (2002–23); and 10133980, East Canyon Creek AB East Cyn Res NR Morgan, Utah (2008–23).[Upper and lower end-member median volumes are calculated using the standard deviation of baseflow index (BFI) for each streamgage. Abbreviation: ID, identification]
Although the annual effluent contribution from ECWRF is a small fraction of total streamflow volume in East Canyon Creek, it may be a substantial component of streamflow during seasonal periods with low flow. Baseflow estimation would be unquantifiable without accounting for effluent by mass balance during seasonal low-flow periods while streamflow decreases during the winter. The path of East Canyon Creek between the uppermost USGS streamgage (10133650) and East Canyon Reservoir does not pass through urban sources of contaminants, although this stretch has historically been used for ranching and subjected to water diversions (Brooks and others, 1998; Wilkowske, 2005). One such pumped diversion includes the Glenwild Golf Club (not shown on figures) which is north of East Canyon Creek between USGS streamgages 10133650 and 10133800. There is a housing development in the Jeremy Ranch community (not shown on figures) and a second golf course, Jeremy Ranch Golf and Country Club (not shown on figures), that East Canyon Creek runs through, though the contribution to salinity from irrigation on the golf course is not known. The primary source for contaminants likely remains I-80, where East Canyon Creek runs parallel to I-80 between USGS streamgages 10133650 and 10133800. Below Jeremy Ranch, much of these lands have been used for ranching dating back to the 19th century (Halverson, 2012), and no significant agricultural districts on East Canyon Creek are noted before reaching the USGS streamgage above East Canyon Reservoir.
The drainage areas represented by USGS streamgages that measure continuous SC on East Canyon Creek increase downstream from 42.1 (10133650) to 57.2 (10133800) to 107 mi2 (10133980). Streamflow and baseflow volume do not linearly increase in proportion from one streamgage to the next. The most upstream USGS streamgage in the reach (10133650) represents approximately 39.3 percent of the drainage area of the most downstream USGS streamgage above East Canyon Reservoir (10133980); streamflow and baseflow volumes at the USGS streamgage below I-80 (10133650) account for 39.3 and 41.8 percent, respectively, of the total volume above East Canyon Reservoir (10133980). Approximately 53.5 percent of the total drainage area is represented by the USGS streamgage below the ECWRF (10133800) but accounts for 71.8 and 64.9 percent of streamflow volume and baseflow volume at East Canyon Reservoir (10133980), respectively. The error bounds for baseflow allow for this disparity to decrease, although streamflow is a measured value and does not have the same level of uncertainty. East Canyon Creek flows out of the greater Jeremy Ranch region and enters a more constricted canyon with numerous tributaries that directly drain off adjacent slopes. This may indicate less surface water runoff is delivered to East Canyon Creek in the section between the lower two USGS streamgages (10133800 and 10133980) or a significant volume of streamflow in East Canyon Creek is diverted.
Seepage studies were done on East Canyon Creek between USGS streamgages 10133650 and 10133800 between 1983 and 2004. The first was done in a year with greater-than-average precipitation and found this reach of East Canyon Creek had a seepage gain of 2.7 ft3/s or 19 percent (Holmes and others, 1986). A second study (Brooks and others, 1998) reported a seepage loss through Kimball Junction using measurements between 1994 and 1995 (Downhour and Brooks, 1996). The third study found this section of East Canyon Creek is a slightly losing reach, with total seepage losses ranging from −1.9 to 0.3 ft3/s or 8 to −27 percent of streamflow at USGS streamgage 10133650 (Wilkowske, 2005). Using data from the full period of record at SNOTEL station 684 (1979–2023), the median annual peak SWE was 450.1 inches (in.). Water years 1983, 1994, 1995, and 2004 had peak SWE values of 690.9, 332.7, 370.8, and 414.0 in., respectively. The seepage rates for each study, and whether East Canyon Creek was gaining or losing in the respective reaches, coincided with the snowpack for the respective year. Streamflow and estimated baseflow during WYs 2011–22 did exhibit a strong positive correlation with snowpack and precipitation over the period of record.
The BFI of East Canyon Creek indicates a baseflow-dominated hydrology, with upwards of 80 percent of total streamflow attributed to baseflow during the fall, winter, and spring (table 3); this characteristic is not regionally exclusive to East Canyon Creek and has been observed elsewhere in the Wasatch Mountains and nearby ranges (Rumsey and others, 2015). Trends in BFI were among the tested measures with the weakest statistical significance at annual or seasonal timescales, and those results may indicate the period of record was too short to characterize a trend if present. Because other streamgages on the eastern slopes of the Wasatch Mountains (which are partially located in the Upper Colorado River Basin) also indicate comparable BFI (0.55–0.92), the results from this study may further corroborate a regional hydrological characteristic (Rumsey and others, 2015). Overall, this study demonstrates that baseflow is a critical component of the regional hydrology on East Canyon Creek, and groundwater discharge represents a significant fraction of the total streamflow in the basin. The estimates of baseflow corroborate previous findings that higher elevation watersheds with greater total precipitation, steeper slopes, resilient snowpack, and sandy soils promote a greater baseflow component (Rumsey and others, 2015).
Trends and Correlations in Streamflow, Baseflow, and Climatological Data
Seasonal-trend testing indicated that streamflow and baseflow on East Canyon Creek above East Canyon Reservoir have declined over the period of record, with changes in snowpack likely having a prominent role in this change. The annual peak SWE for the years in which baseflow was estimated (WYs 2011–22) was below average in 9 of 12 years at SNOTEL stations 684 and 814. The first year in the study period (WY 2011) had the highest peak SWE; the remaining record and any detected trends may thus be skewed negatively in response. The poor distribution of data likely limits the effectiveness of the Mann–Kendall test for trends using annual data, which were inconclusive for all measures. A longer and more representative sample population of climate data, more so than streamflow, are necessary for more substantiated trend analysis. Similar trend studies that incorporate a longer record from SNOTEL stations provide meaningful insight into a changing climate in the Wasatch Mountains (Hu and Nolin, 2020; Hale and others, 2023). Most relevant to East Canyon Creek, earlier melting in the Great Salt Lake basin (Hall and others, 2021) and lower ratios of SWE to winter precipitation are linked to significantly lower maximum SWE in the Wasatch Mountains during the period from 1984 to 2009 (Harpold and others, 2012) as streamflows and baseflows during the spring may negatively correlate with the number of days that record a loss in SWE in the same or preceding month at the Thaynes Canyon SNOTEL station 814 (fig. 12; Root, 2025). In these examples, the relations between streamflow or baseflow and the number of days with recorded loss of SWE in April at SNOTEL station 814 are not well defined. The Kendall’s tau (all below 0.7) and p-values (0.027–0.097) are in opposition regarding the significance of correlation. Earlier declines in streamflow may lead to a less resilient baseflow contribution during the summer (fig. 7) and increased reliance on runoff below ECWRF to sustain East Canyon Creek and, ultimately, East Canyon Reservoir.
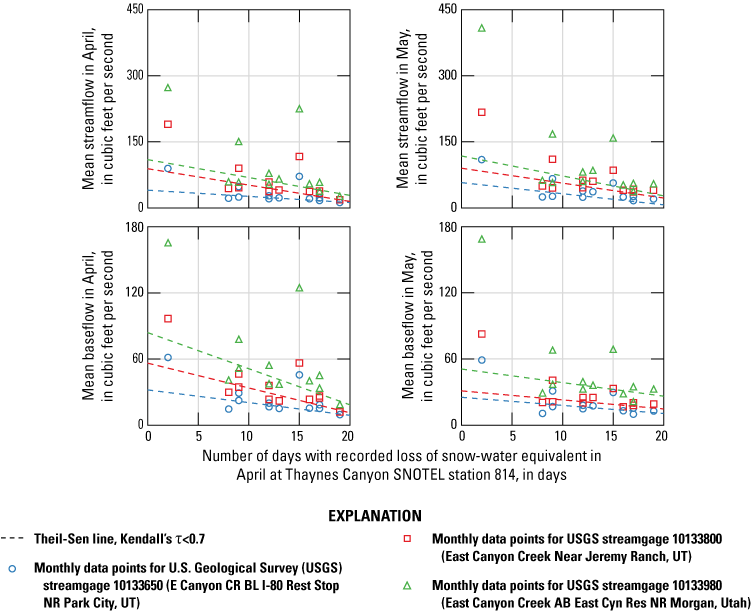
Scatterplots of the number of days with a recorded loss of snow-water equivalent at the Thaynes Canyon snow telemetry (SNOTEL) station (814; U.S. Department of Agriculture, National Water and Climate Center, 2025) with spring streamflow and baseflow, with the Theil–Sen line providing an indication of statistical significance at U.S. Geological Survey streamgages (U.S. Geological Survey, 2024) E Canyon CR BL I-80 Rest Stop NR Park City, UT (10133650); East Canyon Creek Near Jeremy Ranch, UT (10133800); and East Canyon Creek AB East Cyn Res NR Morgan, Utah (10133980).
At seasonal timescales, changing climatic conditions in the Wasatch Mountains directly affect its tributaries including East Canyon Creek. This study aimed to characterize relations between streamflow and climate using robust statistical assessment limited to the period of record for baseflow estimation on East Canyon Creek. This timeframe (WYs 2011–22) constrains the long-term potential for trends in climatological data from SNOTEL stations and limits the strength of its results. Trends for all measures of climate, including precipitation and temperature, are inconclusive as single variable tests or in the presence of a covariable; however, the results here do not exclude possible trends in SNOTEL data for their full respective periods of record.
Predictive Models for Streamflow and Baseflow Using SNOTEL Data
Correlations of streamflow and baseflow with SNOTEL climatological data could be used to predict hydrological conditions. Though statistically significant trends are not well observed in this study, at least in part because of the length of instrumental record, strongly correlated pairs of streamflow or baseflow and SNOTEL data (particularly at monthly timesteps) provide a statistical framework that could support the development of flow forecasts on East Canyon Creek. Among the strongest correlations are those for winter snowpack and spring streamflow or baseflow (fig. 10). Results from the correlation tests provide all required inputs to build a regression using SNOTEL data to determine streamflow, baseflow, or BFI.
The Theil–Sen line slope and y-intercept are used to construct regressions for streamflow or SNOTEL conditions:
wheremVGAGE
is a monthly value (streamflow, baseflow, or BFI) at a specified USGS streamgage;
m
is the slope of the Theil–Sen line;
mDSNOTEL
is the monthly data at a specified SNOTEL station; and
b
is y-intercept of the Theil–Sen line.
Using monthly data and Theil–Sen line results from the supplemental data release of this study as an example (fig. 13; Root, 2025), the January maximum SWE at the Parleys Summit SNOTEL station (684) strongly correlates (Kendall’s tau=0.901; p-value=6.70E−05) with the May baseflow at the streamgage nearest the ECWRF (USGS streamgage 10133800). The Theil–Sen line (for the pair mentioned above) has a slope of 0.145 with lower and upper 95-percent confidence interval slopes of 0.073 and 0.277, respectively, and a y-intercept of −15.9. The slope and intercept estimate of the Theil–Sen line may be used to predict streamflow given a SNOTEL variable. The median maximum SWE in January during WYs 2011–22 is 254 millimeters (mm); using this value in the equation above, the mean monthly baseflow for May at USGS streamgage 10133800 is estimated as 20.9 ft3/s with lower and upper 95-percent confidence interval bounds of 2.63 ft3/s and 54.5 ft3/s, respectively.
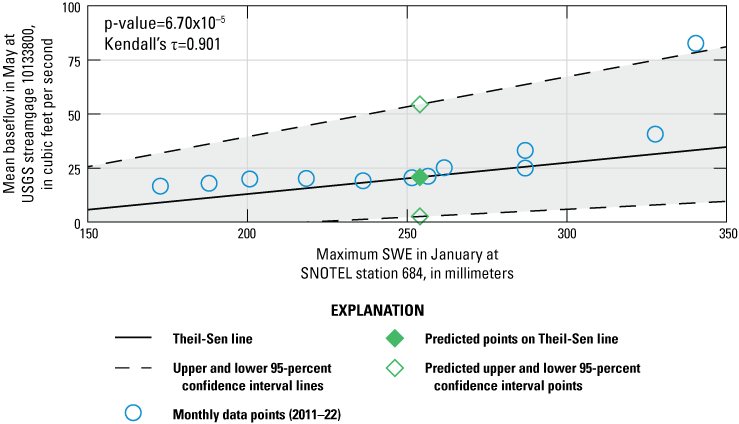
The distribution and Theil-Sen slope relation between mean monthly baseflow in May at U.S. Geological Survey (USGS) streamgage 10133800 on East Canyon Creek (U.S. Geological Survey, 2024) and maximum snow-water equivalent (SWE) in January at snow telemetry (SNOTEL) station 684 (U.S. Department of Agriculture, National Water and Climate Center, 2025).
Summary
This study was done in cooperation between the U.S. Geological Survey (USGS) and the Snyderville Basin Water Reclamation District. The study estimates the baseflow component of total streamflow for East Canyon Creek in Summit and Morgan Counties, Utah, using conductivity mass balance hydrograph separation during water years (WYs) 2011–22. The results provide information that could be applied to develop streamflow forecasts using snow telemetry (SNOTEL) data within the Snyderville Basin. Three USGS streamgages (10133650, 10133800, and 10133980) on the reach of East Canyon Creek have monitored continuous discharge and specific conductance (SC) since the beginning of WY 2011, providing the opportunity to characterize the hydrology over that timespan and assess potential change. Trends and correlation tests were done at annual and monthly timesteps using data from the streamgage and SNOTEL records. Peak annual streamflows were used for the duration of the discharge records, which extended beyond the SC record that limited baseflow estimation, to determine the potential for floods on East Canyon Creek.
Baseflow was estimated at daily timesteps and is summarized in this report and a published data release. Baseflow indices, or the ratio of baseflow to total streamflow, were calculated at all streamgages with hydrograph separations and were highest during the fall through spring months (September–April) before declining during the summer (May–August). Although annual trend tests did not detect statistically significant trends in streamflow or SNOTEL data over the period of record, monthly trend tests indicated a decreasing trend in total streamflow and baseflow. Correlation tests yielded statistically significant results and highlighted situations where SNOTEL data precede streamflow. These relations could be further explored for forecasting hydrological conditions with respect to climate while compensating for year-to-year fluctuations in precipitation, snowpack, and temperature at different periods of a given year. The results shown in this report and continued monitoring could help water managers proactively respond to changing conditions in the East Canyon Creek watershed.
References Cited
Arnold, J.G., Muttiah, R.S., Srinivasan, R., and Allen, P.M., 2000, Regional estimation of base flow and groundwater recharge in the Upper Mississippi River basin: Journal of Hydrology, v. 227, nos. 1–4, p. 21–40. [Avaialable at https://doi.org/10.1016/S0022-1694(99)00139-0.]
Berghuijs, W.R., and Slater, L.J., 2023, Groundwater shapes North American river floods: Environmental Research Letters, v. 18, no. 3, 10 p. [Available at https://doi.org/10.1088/1748-9326/acbecc.]
Blahušiaková, A., Matoušková, M., Jenicek, M., Ledvinka, O., Kliment, Z., Podolinská, J., and Snopková, Z., 2020, Snow and climate trends and their impact on seasonal runoff and hydrological drought types in selected mountain catchments in Central Europe: Hydrological Sciences Journal, v. 65, no. 12, p. 2083–2096. [Available at https://doi.org/10.1080/02626667.2020.1784900.]
Bronaugh, D., Schoeneberg, A., and Zeman, L., 2023, zyp—Zhang + Yue-Pilon trends package (ver. 0.11-1): The comprehensive R archive network web page. [Available at https://CRAN.R-project.org/package=zyp.]
Brooks, L.E., Mason, J.L., and Susong, D.D., 1998, Hydrology and snowmelt simulation of Snyderville Basin, Park City, and adjacent areas, Summit County, Utah: Utah Department of Natural Resources, Division of Water Rights, U.S. Geological Survey Technical Publication 115, prepared by U.S. Geological Survey, 84 p., accessed May 18, 2022, at https://pubs.usgs.gov/publication/70047752.
Downhour, P.A., and Brooks, L.E., 1996, Selected hydrologic data for Snyderville Basin, Park City, and adjacent areas, Summit County, Utah, 1967–95: U.S. Geological Survey Open-File Report 96–494, 52 p., accessed May 18, 2022, at https://doi.org/10.3133/ofr96494.
England, J.F., Jr., Cohn, T.A., Faber, B.A., Stedinger, J.R., Thomas, W.O., Jr., Veilleux, A.G., Kiang, J.E., and Mason, R.R., Jr., 2018, Guidelines for determining flood flow frequency—Bulletin 17C (ver. 1.1, May 2019): U.S. Geological Survey Techniques and Methods, book 4, chap. B5, 148 p., accessed June 3, 2024, at https://doi.org/10.3133/tm4B5.
Flynn, K.M., Kirby, W.H., and Hummel, P.R., 2006, User’s manual for program PeakFQ, annual flood-frequency analysis using Bulletin 17B guidelines: U.S. Geological Survey Techniques and Methods, book 4, chap. B4, 42 p., accessed June 3, 2024, at https://doi.org/10.3133/tm4B4.
Hale, K.E., Jennings, K.S., Musselman, K.N., Livneh, B., and Molotch, N.P., 2023, Recent decreases in snow water storage in western North America: Communications Earth & Environment, v. 4, no. 170, 11 p., accessed June 3, 2024, at https://doi.org/10.1038/s43247-023-00751-3.
Hall, D.K., O’Leary, D.S., III, DiGirolamo, N.E., Miller, W., and Kang, D.H., 2021, The role of declining snow cover in the desiccation of the Great Salt Lake, Utah, using MODIS data: Remote Sensing of Environment, v. 252, 12 p., accessed June 3, 2024, at https://doi.org/10.1016/j.rse.2020.112106.
Halverson, W.D., 2012, The Jeremy Ranch—Valley of Dreams—Summit County, Utah, History & Legacy: Coalville, Utah, Summit County Historical Society, 12 p., accessed February 11, 2025, at https://www.summitcountyutah.gov/587/The-Jeremy-Ranch-Valley-of-Dreams.
Harpold, A., Brooks, P., Rajagopal, S., Heidbuchel, I., Jardine, A., and Stielstra, C., 2012, Changes in snowpack accumulation and ablation in the intermountain west: Water Resources Research, v. 48, no. 11, 11 p., accessed June 3, 2024, at https://doi.org/10.1029/2012WR011949.
Helsel, D.R., and Frans, L.M., 2006, Regional Kendall Test for trend: Environmental Science & Technology, v. 40, no. 13, p. 4066–4073, accessed June 3, 2024, at https://doi.org/10.1021/es051650b.
Helsel, D.R., Hirsch, R.M., Ryberg, K.R., Archfield, S.A., and Gilroy, E.J., 2020a, Statistical methods in water resources: U.S. Geological Survey Techniques and Methods, book 4, chap. A3, 458 p., accessed June 3, 2024, at https://doi.org/10.3133/tm4A3.
Helsel, D.R., Hirsch, R.M., Ryberg, K.R., Archfield, S.A., and Gilroy, E.J., 2020b, Statistical methods in water resources—Supporting materials: U.S. Geological Survey data release, accessed June 3, 2024, at https://doi.org/10.5066/P9JWL6XR.
Hem, J.D., 1985, Study and interpretation of the chemical characteristics of natural water: U.S. Geological Survey Water-Supply Paper 2254, 263 p., accessed November 7, 2022, at https://doi.org/10.3133/wsp2254.
Hirsch, R.M., Slack, J.R., and Smith, R.A., 1982, Techniques of trend analysis for monthly water quality data: Water Resources Research, v. 18, no. 1, p. 107–121, accessed June 3, 2024, at https://doi.org/10.1029/WR018i001p00107.
Holmes, W.F., Thompson, K.R., and Enright, M., 1986, Water resources of the Park City area, Utah, with emphasis on ground water: Utah Department of Natural Resources, Division of Water Rights Technical Publication No. 85, prepared by the U.S. Geological Survey, 82 p., accessed April 16, 2024, at https://pubs.usgs.gov/publication/70044030.
Hu, J.M., and Nolin, A.W., 2020, Widespread warming trends in storm temperatures and snowpack fate across the western United States: Environmental Research Letters, v. 15, no. 3, accessed June 3, 2024, at https://doi.org/10.1088/1748-9326/ab763f.
Hufkens, K., 2022, snotelr—A toolbox to facilitate easy SNOTEL data exploration and downloads in R: accessed June 3, 2024, at https://doi.org/10.32614/CRAN.package.snotelr.
Jenicek, M., Seibert, J., Zappa, M., Staudinger, M., and Jonas, T., 2016, Importance of maximum snow accumulation for summer low flows in humid catchments: Hydrology and Earth System Sciences, v. 20, no. 2, p. 859–874. [Available at https://doi.org/10.5194/hess-20-859-2016.]
Kenney, T.A., Wilkowske, C.D., and Wright, S.J., 2007, Methods for estimating magnitude and frequency of peak flows for natural streams in Utah: U.S. Geological Survey Scientific Investigations Report 2007–5158, 28 p., accessed June 3, 2024, at https://doi.org/10.3133/sir20075158.
Levin, S.B., Briggs, M.A., Foks, S.S., Goodling, P.J., Raffensperger, J.P., Rosenberry, D.O., Scholl, M.A., Tiedeman, C.R., and Webb, R.M., 2023, Uncertainties in measuring and estimating water‐budget components—Current state of the science: WIREs Water, v. 10, no. 4, 33 p. [Available at https://doi.org/10.1002/wat2.1646.]
Mann, H.B., 1945, Nonparametric tests against trend: Econometrica, v. 13, no. 3, p. 245–259, accessed June 3, 2024, at https://doi.org/10.2307/1907187.
Marchetto, A., 2021, rkt—Mann–Kendall test, seasonal and regional Kendall tests (ver. 4.2.1): The comprehensive R archive network web page, accessed June 3, 2024, at https://CRAN.R-project.org/package=rkt.
Miller, M.P., Buto, S.G., Susong, D.D., and Rumsey, C.A., 2016, The importance of base flow in sustaining surface water flow in the Upper Colorado River Basin: Water Resources Research, v. 52, no. 5, p. 3547–3562, accessed June 3, 2024, at https://doi.org/10.1002/2015WR017963.
Miller, M.P., Susong, D.D., Shope, C.L., Heilweil, V.M., and Stolp, B.J., 2014, Continuous estimation of baseflow in snowmelt-dominated streams and rivers in the Upper Colorado River Basin—A chemical hydrograph separation approach: Water Resources Research, v. 50, no. 8, p. 6986–6999, accessed June 3, 2024, at https://doi.org/10.1002/2013WR014939.
Myers, D.T., Ficklin, D.L., and Robeson, S.M., 2023, Hydrologic implications of projected changes in rain-on-snow melt for Great Lakes Basin watersheds: Hydrology and Earth System Sciences, v. 27, no. 9, p. 1755–1770. [Available at https://doi.org/10.5194/hess-27-1755-2023.]
Pinder, G.F., and Jones, J.F., 1969, Determination of the ground-water component of peak discharge from the chemistry of total runoff: Water Resources Research, v. 5, no. 2, p. 438–445, accessed June 3, 2024, at https://doi.org/10.1029/WR005i002p00438.
R Core Team, 2022, R—A language and environment for statistical computing and graphics: Vienna, Austria, R Foundation for Statistical Computing software website, accessed June 3, 2024, at https://www.R-project.org/.
Reay, W.G., Gallagher, D.L., and Simmons, G.M., Jr., 1992, Groundwater discharge and its impact on surface water quality in a Chesapeake Bay inlet: Journal of the American Water Resources Association, v. 28, no. 6, p. 1121–1134. [Available at https://doi.org/10.1111/j.1752-1688.1992.tb04023.x.]
Root, J.C., 2025, Baseflow estimation and trend and correlation analysis results for East Canyon Creek, Summit and Morgan Counties, Utah, 2010–2022: U.S. Geological Survey data release. [Available at https://doi.org/10.5066/P14SJDMX.]
Rumsey, C.A., Miller, M.P., and Sexstone, G.A., 2020, Relating hydroclimatic change to streamflow, baseflow, and hydrologic partitioning in the Upper Rio Grande Basin, 1980 to 2015: Journal of Hydrology, v. 584, accessed June 3, 2024, at https://doi.org/10.1016/j.jhydrol.2020.124715.
Rumsey, C.A., Miller, M.P., Susong, D.D., Tillman, F.D., and Anning, D.W., 2015, Regional scale estimates of baseflow and factors influencing baseflow in the Upper Colorado River Basin: Journal of Hydrology—Regional Studies, v. 4, pt. B, p. 91–107, accessed June 3, 2024, at https://doi.org/10.1016/j.ejrh.2015.04.008.
Sen, P.K., 1968, Estimates of the regression coefficient based on Kendall’s Tau: Journal of the American Statistical Association, v. 63, no. 324, p. 1379–1389, accessed June 3, 2024, at https://doi.org/10.1080/01621459.1968.10480934.
Sklash, M.G., and Farvolden, R.N., 1979, The role of groundwater in storm runoff: Journal of Hydrology, v. 43, nos. 1–4, p. 45–65, accessed February 10, 2025, at https://doi.org/10.1016/0022-1694(79)90164-1.
Theil, H., 1950, A rank-invariant method of linear and polynomial regression analysis, I, II, and III: Proceedings of the Royal Netherlands Academy of Sciences, v. 53, p. 386–392, 521–525, 1397–1412, accessed June 3, 2024, at https://doi.org/10.1007/978-94-011-2546-8_20.
U.S. Department of Agriculture, National Water and Climate Center, 2025, Air and Water Database: U.S. Department of Agriculture, National Water and Climate Center Service database, accessed February 7, 2025, at https://nwcc-apps.sc.egov.usda.gov/.
U.S. Geological Survey, 2019, Specific conductance: U.S. Geological Survey Techniques and Methods, book 9, chap. A6.3, 15 p., accessed June 3, 2024, at https://doi.org/10.3133/tm9A6.3.
U.S. Geological Survey, 2022, National hydrography dataset (NHD) plus high resolution: U.S. Geological Survey web interface, accessed June 3, 2024, at https://www.usgs.gov/national-hydrography/access-national-hydrography-products.
U.S. Geological Survey, 2024, USGS water data for the nation: U.S. Geological Survey National Water Information System database, accessed June 3, 2024, at https://doi.org/10.5066/F7P55KJN.
U.S. Water Resources Council, 1967, A uniform technique for determining flood flow frequencies: Washington, D.C., U.S. Water Resources Council Bulletin No. 15, 15 p. [Available at https://water.usgs.gov/osw/bulletin17b/Bulletin_15_1967.pdf.]
Veilleux, A.G., Cohn, T.A., Flynn, K.M., Mason, R.R., Jr., and Hummel, P.R., 2014, Estimating magnitude and frequency of floods using the PeakFQ 7.0 program: U.S. Geological Survey Fact Sheet 2013–3108, 2 p., accessed April 16, 2024, at https://doi.org/10.3133/fs20133108.
Wilkowske, C.D., 2005, Seepage study of McLeod Creek and East Canyon Creek near Park City, Summit County, Utah, 2004: U.S. Geological Survey Scientific Investigations Report 2005–5164, 26 p., accessed May 18, 2022, at https://doi.org/10.3133/sir20055164.
Glossary
- annual exceedance probability
Annual exceedance probability is the probability of a flood of a given magnitude being equaled or exceeded for any given year.
- baseflow
Baseflow is the sustained flow of a stream in the absence of direct runoff. It includes natural and human-induced streamflows. Natural base flow is sustained largely by groundwater discharge.
- baseflow index
Baseflow index, or BFI, is the ratio of total baseflow to total streamflow.
- chemical hydrograph separation
Chemical hydrograph separation is an approach used to partition components of streamflow such as baseflow.
- conductivity mass balance
Conductivity mass balance is a form of chemical hydrograph separation that uses daily streamflow and specific conductance values to estimate daily baseflow.
- discharge
Discharge is the rate at which matter passes through a cross-section of a stream channel or other water body per unit of time.
- East Canyon Creek
East Canyon Creek is a perennial snowmelt-dominated stream that lies in the Snyderville Basin of Summit and Morgan Counties, Utah.
- effluent
Effluent is water that includes the suspended solids that are discharged back into the environment after wastewater treatment.
- flood-frequency analysis
Flood-frequency analysis provides information about the magnitude and frequency of flood discharges based on records of annual maximum instantaneous peak discharges collected at streamgages. In essence, flood-frequency analysis is used to estimate the probability of flooding at specific river locations.
- hydrograph
A hydrograph shows streamflow measurements, including discharge and specific conductance, with respect to time.
- Kendall's tau correlation test
Kendall's tau correlation test measures the strength of the monotonic relation between x and y and is a rank-based procedure.
- Mann–Kendall trend test
The nonparametric Mann–Kendall test for trend determines if the central tendency of the variable of interest changes, in a monotonic fashion, with a time variable.
- PeakFQ
PeakFQ is a software program developed by the USGS that uses annual peak flows to calculate annual exceedance probability.
- recurrence interval
Recurrence interval, also referred to as return period, is the average time, usually expressed in years, between occurrences of hydrologic events of a specified type (such as exceedances of a specified high flow or non-exceedance of a specified low flow). The terms “return period” and “recurrence interval” do not imply regular cyclic occurrence. The actual times between occurrences vary randomly, with most of the times being less than the mean and a few being substantially greater than the mean.
- Regional Kendall trend test
The Regional Kendall trend test is a set of Mann–Kendall trend tests applied to data from a set of monitoring locations that are near enough to each other that one may expect their data to be correlated across the sites. It operates in the same manner as the Seasonal Kendall test adjusted for serial correlation.
- runoff
Runoff is the quantity of water that is discharged from a drainage basin during a given time period.
- Seasonal Kendall trend test
The Seasonal Kendall trend test accounts for seasonality by computing the Mann–Kendall test for each season separately and combining the results.
- SNOTEL
Snow telemetry (SNOTEL) stations represent a network composed of over 900 automated data collection sites in remote, high-elevation mountain watersheds in the western U.S. They are used to monitor snowpack, precipitation, temperature, and other climatic conditions. The data collected at SNOTEL sites are transmitted to a central database, called the Water and Climate Information System, where they are used to make water supply forecasts.
- snow-water equivalent
Snow-water equivalent is the amount of water released as a liquid when snow is melted.
- specific conductance
Specific conductance is an indirect measure of the collective concentration of dissolved ions in a solution. It is defined as the electrical conductance of 1 cubic centimeter of a solution at 25 degrees Celsius.
- streamflow
Streamflow is the discharge that occurs in a natural channel. Although the term “discharge” can be applied to the flow of a canal, the word “streamflow” uniquely describes the discharge in a surface stream course.
- streamgage
Streamgages are sites on a stream, canal, lake, or reservoir where systematic observations of stage, discharge, or other hydrologic data are obtained.
- Theil–Sen line
The Theil–Sen line is robust nonparametric model of the median of y given x. This line does not depend on the normality of residuals for validity of significance tests, and is not strongly affected by outliers, in contrast with other regressions such as the Ordinary Least Squares regression.
- water year
A water year is the 12-month period for any given year from October 1 through September 30 of the following year and is named for the year in which the period ends.
Conversion Factors
U.S. customary units to International System of Units
Temperature in degrees Celsius (°C) may be converted to degrees Fahrenheit (°F) as follows:
°F = (1.8 × °C) + 32.
Datums
Horizontal coordinate information is referenced to the North American Datum of 1983 (NAD 83).
Altitude, as used in this report, refers to distance above the vertical datum.
Supplemental Information
Specific conductance is given in microsiemens per centimeter at 25 degrees Celsius (µS/cm at 25 °C).
Concentrations of chemical constituents in water are given in milligrams per liter (mg/L).
A water year is the 12-month period from October 1 through September 30 of the following year and is designated by the calendar year in which it ends.
Abbreviations
<
less than
AEP
annual exceedance probability
BFI
baseflow index
ECWRF
East Canyon Water Reclamation Facility
I-80
Interstate 80
NA
not assessed
Q
discharge
SBWRD
Snyderville Basin Water Reclamation District
SC
specific conductance
SNOTEL
snow telemetry
SWE
snow-water equivalent
TDS
total dissolved solids
USGS
U.S. Geological Survey
WY
water year
For more information concerning the research in this report, contact the
Director, Utah Water Science Center
U.S. Geological Survey
2329 West Orton Circle
Salt Lake City, Utah 84119-2047
801-908-5000
https://www.usgs.gov/centers/ut-water/
Publishing support provided by the Science Publishing Network,
Sacramento Publishing Service Center
Disclaimers
Any use of trade, firm, or product names is for descriptive purposes only and does not imply endorsement by the U.S. Government.
Although this information product, for the most part, is in the public domain, it also may contain copyrighted materials as noted in the text. Permission to reproduce copyrighted items must be secured from the copyright owner.
Suggested Citation
Root, J.C., and Rumsey, C.A., 2025, Estimation of baseflow and flooding characteristics for East Canyon Creek, Summit and Morgan Counties, Utah: U.S. Geological Survey Scientific Investigations Report 2025–5003, 29 p., https://doi.org/10.3133/sir20255003.
ISSN: 2328-0328 (online)
Study Area
| Publication type | Report |
|---|---|
| Publication Subtype | USGS Numbered Series |
| Title | Estimation of baseflow and flooding characteristics for East Canyon Creek, Summit and Morgan Counties, Utah |
| Series title | Scientific Investigations Report |
| Series number | 2025-5003 |
| DOI | 10.3133/sir20255003 |
| Publication Date | April 16, 2025 |
| Year Published | 2025 |
| Language | English |
| Publisher | U.S. Geological Survey |
| Publisher location | Reston, VA |
| Contributing office(s) | Utah Water Science Center |
| Description | Report: viii, 29 p.; Data Release |
| Country | United States |
| State | Utah |
| County | Morgan County, Summit County |
| Other Geospatial | East Canyon Creek |
| Online Only (Y/N) | Y |