

Assessment of Effects of Channelization Mitigation Alternatives of Stoney Brook, Carlton and St. Louis Counties, Minnesota
Links
- Document: Report (9.4 MB pdf) , HTML , XML
- Dataset: USGS National Water Information System database - USGS water data for the Nation
- Data Release: USGS data release - Archive of hydraulic and hydrologic models used in the Stoney Brook watershed in Carlton and St. Louis Counties, Minnesota, 2008–2024
- NGMDB Index Page: National Geologic Map Database Index Page (html)
- Download citation as: RIS | Dublin Core
Acknowledgments
The author acknowledges funding provided by the Fond du Lac Band of Lake Superior Chippewa for this study along with the continued support from the Fond du Lac Band of Lake Superior Chippewa in funding the U.S. Geological Survey streamgage 04021520 (Stoney Brook at Pine Drive near Brookston, Minnesota).
Abstract
The U.S. Geological Survey, in cooperation with the Fond du Lac Band of Lake Superior Chippewa (FDLB), studied the effects of channel modification alternatives on lake levels and floodplain inundation in the Stoney Brook watershed in northeast Minnesota. Northern wild rice (Zizania palustris), also referred to as manoomin by the Ojibwe/Chippewa people, is a natural and cultural resource to the FDLB and is sensitive to water levels and rates of water-level changes, particularly during the early stages of growth. Drainage ditches constructed in the early 1900s in the Stoney Brook watershed lowered lake-water levels, caused greater fluctuations in the lakes, and created a loss in wetland coverage. The FDLB is committed to minimizing large fluctuations of the lakes with natural wild rice production in the Stoney Brook watershed and restoring a more natural hydrology to Stoney Brook. The hydrologic response of these lakes and floodplain storage to simulated channel modification alternatives were examined.
Hydrologic and hydraulic models were developed for the watershed and calibrated to historical rainfall events. The models used probabilistic frequency rainfall events of 24-hour duration for 1-, 2-, 5-, and 10-year annual recurrence intervals (100-, 50-, 20-, and 10-percent annual exceedance probability) to simulate watershed management scenarios with existing and alternative conditions. The hydraulic model outputs for peak flows, volume accumulation, water levels, and inundation duration and depths were assessed to quantify the effects of the channel modification alternatives. The channel modification alternatives were simulated with four different terrain conditions: existing conditions, bank spoil breach, original channel reconnection, and original channel reconnection with bank spoil breach. Hydrologic characteristics from six distinct areas were used in the model to evaluate the effects from the channel modification alternatives.
The simulated results of two lakes in which wild rice was planted demonstrated that the lakes would take longer to draw down following an event with the channel modification alternatives compared to existing conditions with little change to peak water-surface elevations. The alternatives provided minor to no increases in flows or conveyances at the downstream reference location at Pine Drive bridge. The restored floodplain locations had increased flows and conveyances for the channel modification alternatives that could be considered substantial when compared to flows with existing conditions. The inundation extent, duration, and water-depth distribution were assessed within selected floodplain areas. Generally, the channel modification alternatives produced increases in the higher depth (3–4 and greater than 4 feet) and duration (10–14 and greater than 14 days) categories for these areas, which may be beneficial to increases in wetland coverage and floodplain storage.
Introduction
The Fond du Lac Reservation, located west of Cloquet, Minnesota, and south of the St. Louis River (fig. 1), contains multiple lakes abundant with northern wild rice (Zizania palustris), also referred to as manoomin by the Ojibwe/Chippewa tribes. The Fond du Lac Reservation has an area of 153.8 square miles (mi2) and consists of Tribal lands belonging to the Fond du Lac Band of Lake Superior Chippewa (FDLB). The Stoney Brook watershed covers an area of 100.8 mi2 in Carlton and St. Louis Counties with most of the watershed within the Fond du Lac Reservation. The study area consists of 77.9 mi2 of the Stoney Brook watershed with the downstream boundary located 2.4 miles (mi) downstream from the U.S. Geological Survey (USGS) streamgage Stoney Brook at Pine Drive near Brookston, Minn. (USGS station 04021520; fig. 1; U.S. Geological Survey, 2023a). The USGS station 04021520 has been in operation since May 28, 2005, in a cooperative agreement with the FDLB (table 1).
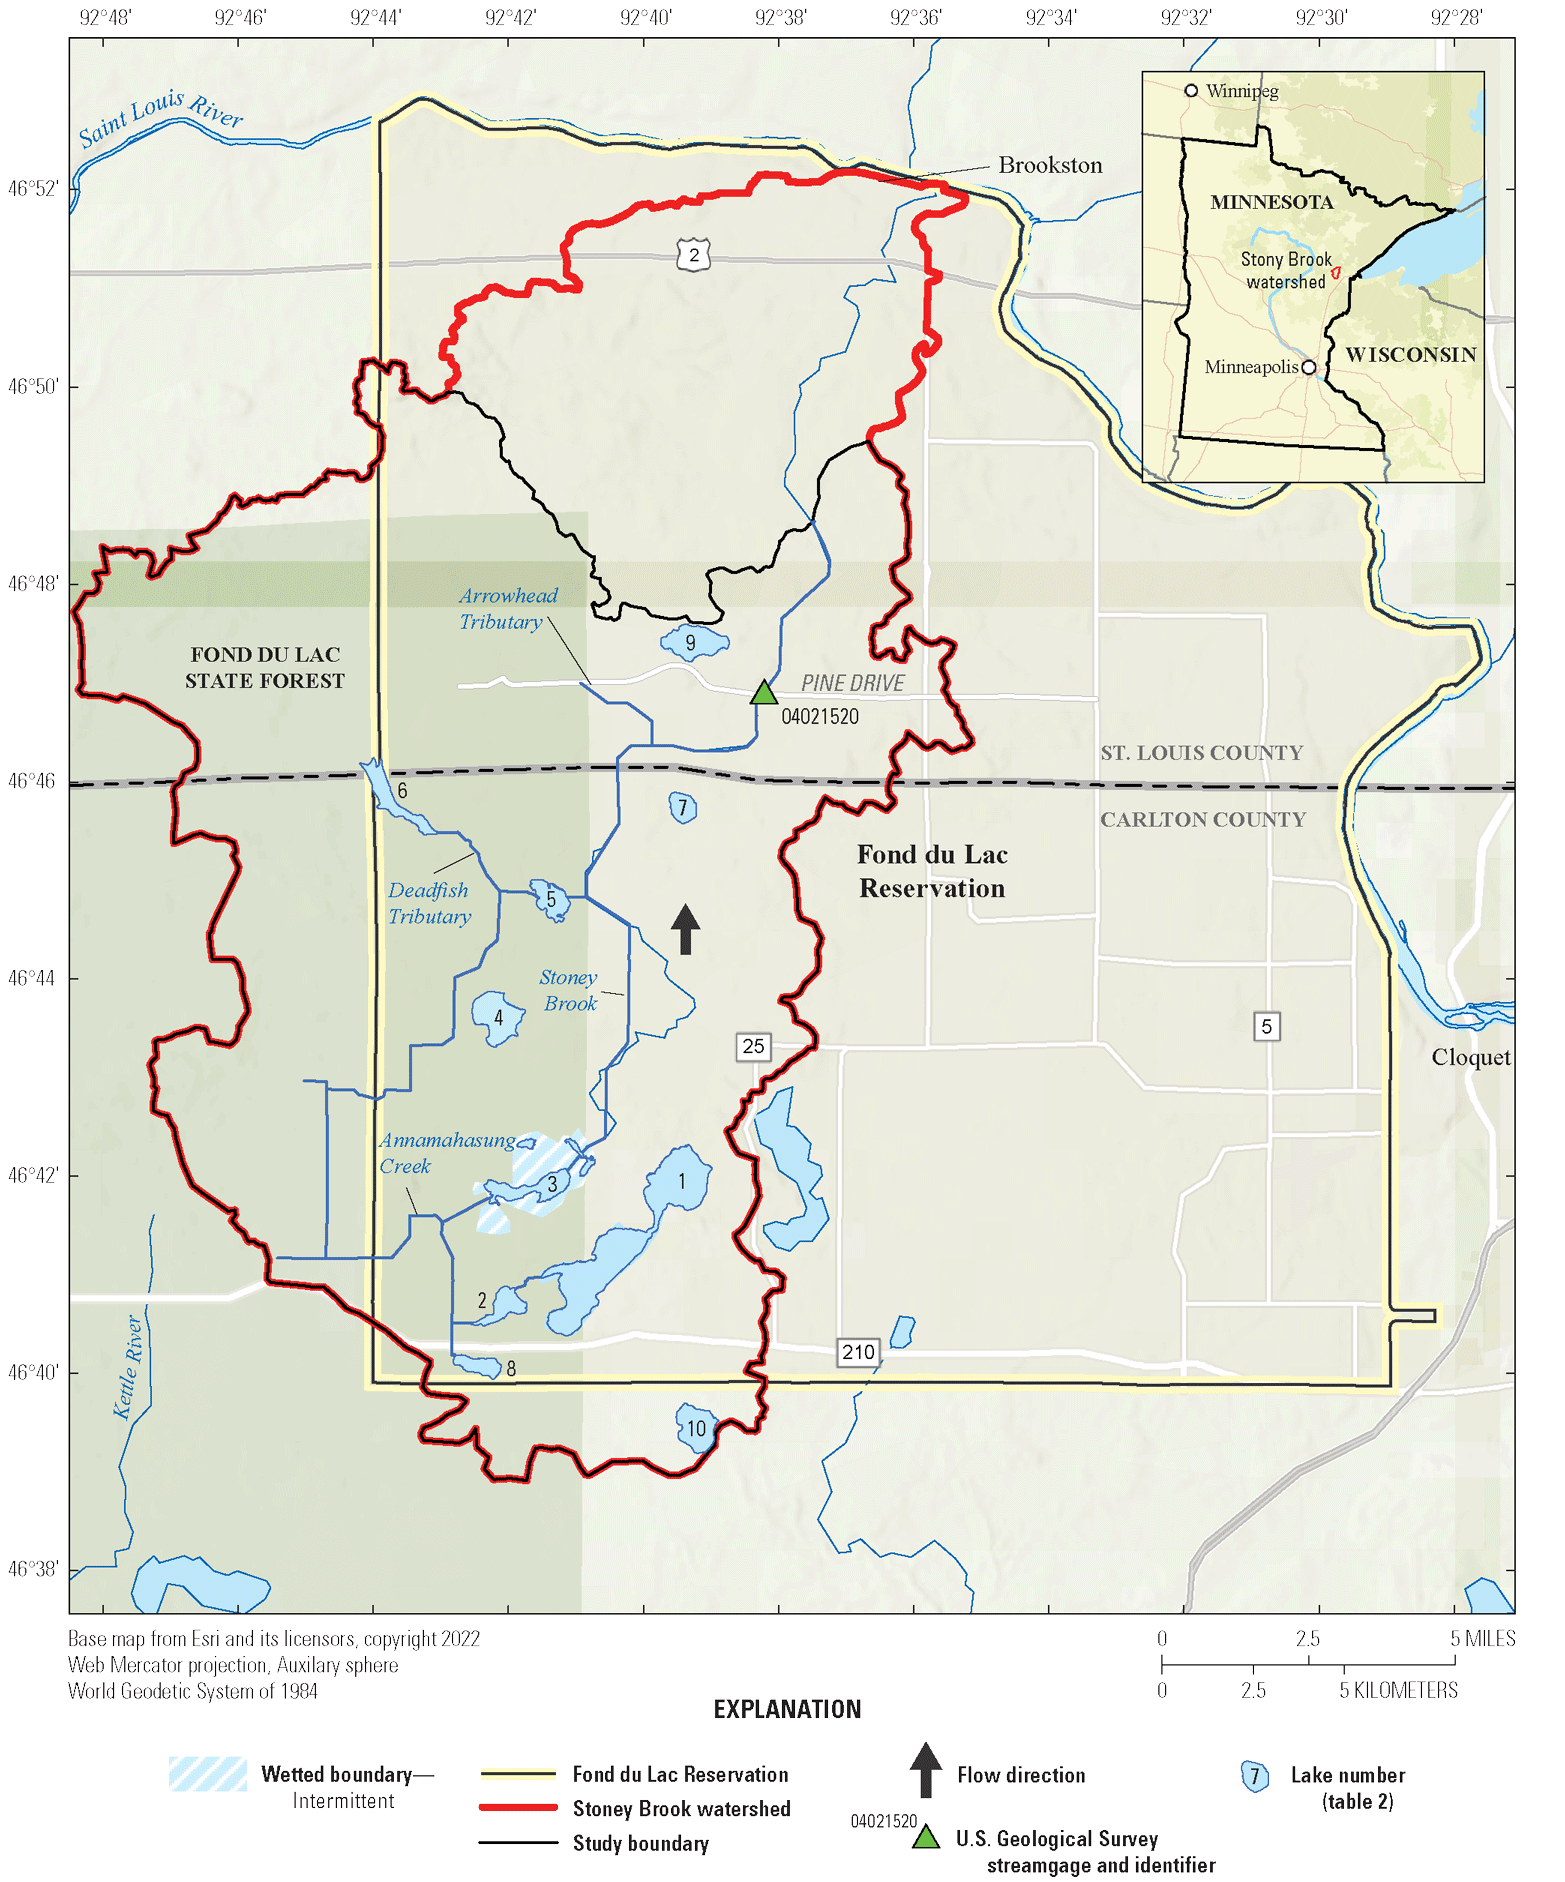
Location of the Stoney Brook watershed and U.S. Geological Survey streamgage Stoney Brook at Pine Street near Brookston, Minnesota (station 04021520).
Table 1.
Information on U.S. Geological Survey streamgage Stoney Brook at Pine Drive near Brookston, Minnesota (station 04021520).[Station location is shown on figure 1; mi2, square mile; ft, foot; ft3/s, cubic foot per second; °, degree; ‘, minute; ”,second. Site information from U.S. Geological Survey (2023b)]
Wild rice is an important natural and cultural resource to the FDLB, who actively harvest the crop (Hedin, 2021). Wild rice is sensitive to water levels and rates of water-level changes, particularly during the early stages of growth when it is most susceptible to uprooting (Zepp and others, 1996). Drainage ditches were constructed in the early 1900s in the Stoney Brook watershed, which lowered and caused greater fluctuations in lake-water levels (Natural Resources Conservation Service, 2009). The FDLB uses gate outlet control structures on the lakes supporting wild rice to manage water levels and mitigate damages to rice crops. The FDLB is committed to minimizing large fluctuations in the lake levels and restoring lake levels to the previous conditions of wild rice production before the drainage ditch construction. The FDLB looks to restore a more natural hydrology to Stoney Brook by exploring alternatives utilizing the remnant Stoney Brook channel and increasing potential storage and wetland coverage in the Stoney Brook floodplain. In addition, the FDLB would like to develop a U.S. Environmental Protection Agency Watershed Plan, which is a comprehensive, long-term management plan for the watershed that may be used to plan treatment and conservation efforts in the watershed under changing landscape, hydrology, and climate conditions.
Purpose and Scope
This report describes an analysis of hydrologic and hydraulic conditions within the Stoney Brook watershed to assess the effects of channel modifications on lake levels and floodplain inundation after substantial rainfall events that can damage wild rice yields on the Fond du Lac Reservation. The channel modifications are used to assess options for improving conveyance and floodplain storage in the watershed. Hydrologic and hydraulic models were developed for the watershed and calibrated to historical rainfall events. The models used probabilistic frequency rainfall events to simulate watershed management scenarios with existing and alternative conditions. The hydraulic model outputs for peak flows, volume accumulation, water levels, and inundation duration and depths were assessed to quantify the effects of the channel modification alternatives.
Study Area Description
The landscape within the Stoney Brook watershed consists of flat low-laying outwash plains with peat bogs, and hilly morainal uplands (Ruhl, 1989). The land cover predominately consists of 71-percent wetlands or open water and 25-percent forest with the remaining 4 percent accounting for grassland, fields, and impervious structures (Dewitz, 2019). The 30-year (1991–2020) average annual precipitation normal from the National Oceanic and Atmospheric Administration (NOAA) was 32.67 inches (in.) at Cloquet, Minn., which is located about 8 mi east of the Stoney Brook watershed (Palecki and others, 2021). The hydrology of the watershed is complex, with a 47-mi network of ditching that interacts with lakes, wetlands, streams, and groundwater (Hedin, 2021). Stoney Brook is the primary stream within the watershed, and major tributaries within the study area include Annamahasung Creek, Deadfish Tributary, and Arrowhead Tributary. There are 10 lakes greater than 50 acres in the study area, with 5 lakes supporting wild rice production (fig. 1, table 2).
Table 2.
Major lakes within the Stoney Brook watershed study area.[mi2, square mile; NAVD 88, North American Vertical Datum of 1988]
| Lake number (fig. 1) | Lake name | Surface area (acres) |
Drainage area (mi2) |
Outlet structure | Wild rice production |
|---|---|---|---|---|---|
| 1 | Perch Lake | 650 | 7.8 | Concrete gated outlet | Yes |
| 2 | Jaskari Lake | 77 | 8.8 | None | Yes |
| 3 | Rice Portage Lake | 148 | 21.4 | Concrete gated outlet | Yes |
| 4 | Miller (Mud) Lake | 157 | 1.1 | None | Yes |
| 5 | Deadfish Lake | 77 | 25.9 | Concrete gated outlet | Yes |
| 6 | Upper Deadfish Impoundment | 330a | 14.5 | Concrete gated outlet | No |
| 7 | Hardwood Lake | 59 | 1.0 | None | No |
| 8 | Bang (Long) Lake | 60 | 2.7 | None | No |
| 9 | Lost Lake | 137 | 1.3 | None | No |
| 10 | Torch Light Lake | 126 | 0.6 | None | No |
The Stoney Brook watershed hydrology was altered during the early 1900s when a 47-mi ditch network was constructed with the intent to drain the soils for agriculture production (Hedin, 2021). Converting the land for agricultural production was not successful owing to the low gradient slope of the stream channels and large areas of poorly drained organic soils (Hedin, 2021); however, the ditching did lower the water levels and inundation area on the shallow bodied rice lakes and created larger fluctuations in lake levels after rain events. As an example, the water-surface area of Rice Portage Lake decreased from 634 to 114 acres because of the ditching (Fond du Lac Band of Lake Superior Chippewa, 2008). Wetland losses because of the ditching were estimated at 2,000 to 4,000 acres (Hedin, 2021). Outlet control structures were installed on Perch, Rice Portage, and Deadfish Lakes in the late 1990s to try and restore the original water levels of the lakes and decrease lake-level fluctuations. The structures use outlet gates to release water after runoff events and stop logs to help maintain consistent water levels during the wild rice growing season. A gated detention structure, the Upper Deadfish Impoundment, was also installed upstream from Deadfish Lake to help attenuate runoff (Natural Resources Conservation Service, 2009).
Previous Studies
A watershed management study was conducted between 2005 and 2009 by the Natural Resources Conservation Service to provide a hydrologic and hydraulic assessment of the Stoney Brook watershed (Natural Resources Conservation Service, 2009). The study also provided recommendations for optimizing water levels of Perch, Rice Portage, and Deadfish Lakes for wild rice production. A hydrologic and a one-dimensional hydraulic model were developed for that study. The one-dimensional hydraulic model was limited to simulating unilateral flows at cross sections (placed at 500-foot [ft] intervals), which represented channel and overbank geometries. The hydraulic model was also limited by simplified overbank areas with elevations derived from a USGS quadrangle topographic map (Natural Resources Conservation Service, 2009).
These models were updated and refined in this USGS study with more advanced modeling capabilities and better-quality terrain data from light detection and ranging (lidar) technology. Lidar data collected in 2011 (Minnesota Department of Natural Resources, 2020) had since become available to produce a 1-meter digital elevation model (DEM) for the hydrologic and hydraulic modeling. The 1-meter DEM can more accurately account for surface water storage from ponded water and storage-elevation ratings at the outlet control structures. The hydraulic model was developed with two-dimensional (2D) capabilities, which can simulate bilateral flows at the overbank areas, levee breaches, and stream junctions (U.S. Army Corps of Engineers, 2021).
Hydrologic Model
A hydrologic model used to simulate the timing and magnitude of streamflow for the Stoney Brook watershed was constructed using the U.S. Army Corps of Engineers Hydrologic Engineering Center–Hydrologic Modeling System (HEC–HMS) version 4.3 computer program, which was designed to simulate the precipitation-runoff processes of dendritic watershed systems (U.S. Army Corps of Engineers, 2018). The HEC–HMS model was calibrated to two observed substantial rainfall events that produced flooding within the watershed. The calibrated HEC–HMS model was then used to produce probabilistic frequency rainfall events of 24-hour duration for simulating channel modification alternatives (refer to “Channel Modification Used for Alternatives” section). Output hydrographs from the HEC–HMS model were used as inputs for the hydraulic model (refer to “Hydraulic Model” section).
The HEC–HMS model was constructed with the Hydrologic Engineering Center–Geospatial Hydrologic Modeling System (HEC–GeoHMS) (Fleming and Doan, 2013) version 10.2, which is used within a geographic information system to build the model framework and to estimate initial model parameters. A 1-meter DEM (Minnesota Department of Natural Resources, 2020) was obtained and resampled to 3-meter resolution to reduce the jaggedness of the delineated flowlines, which can increase their total lengths. Through HEC–GeoHMS, the 3-meter DEM was used to delineate the 77.9-mi2 watershed into 14 subwatersheds (fig. 2) to serve as a basic unit for parameter assignment and to segment the stream network for the hydraulic model boundary conditions.
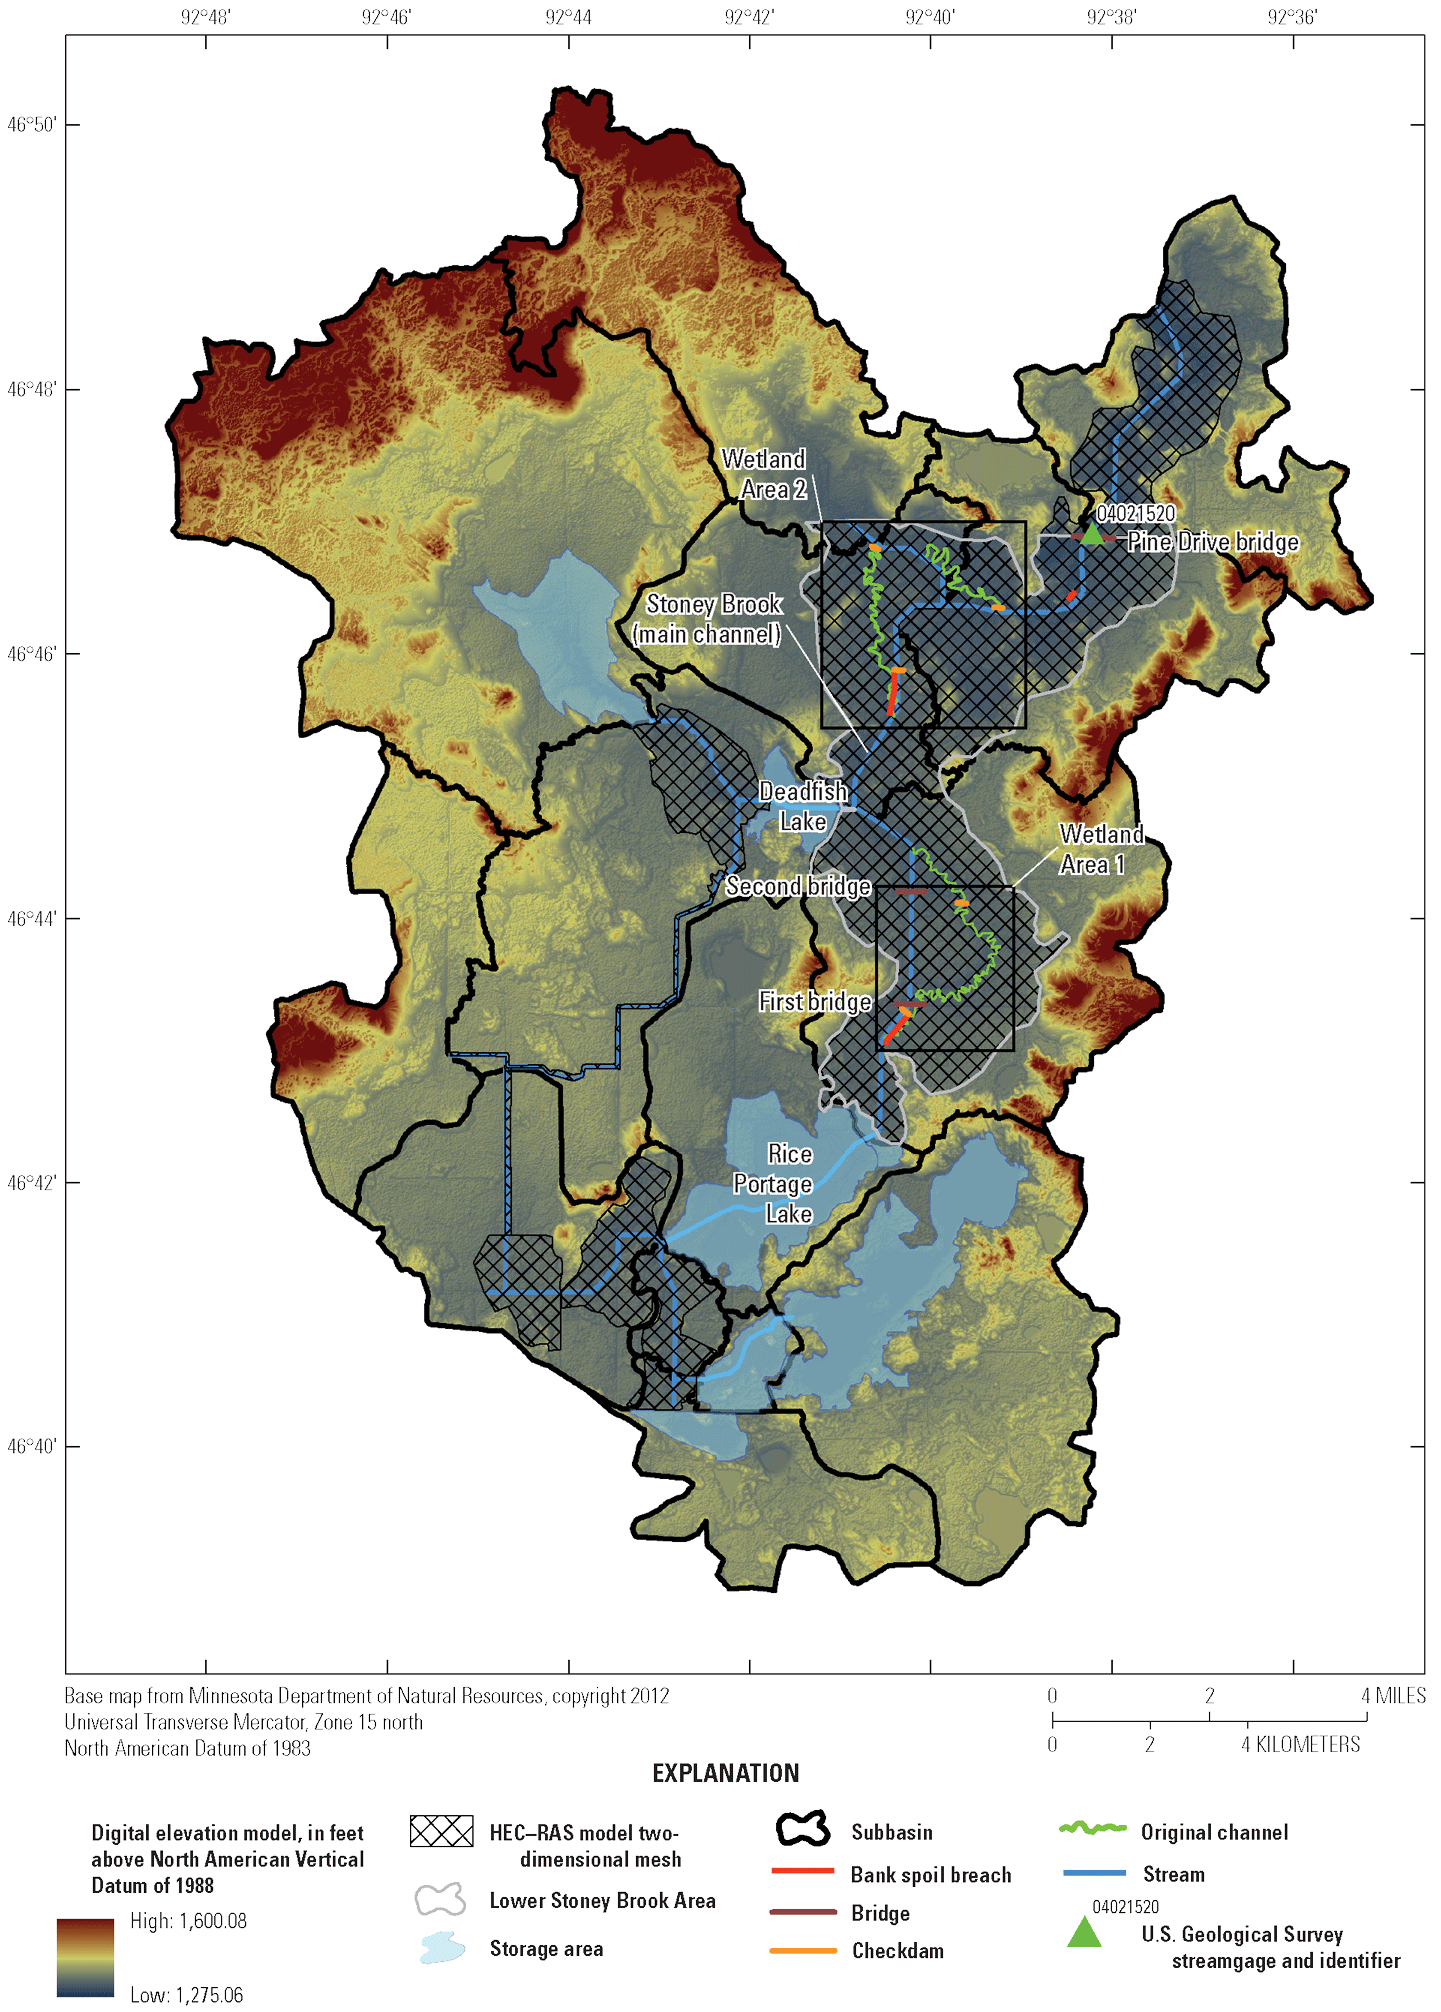
Digital elevation map and hydrologic and hydraulic model components for the study area. Digital elevation data from Minnesota Department of Natural Resources (2020). [HEC–RAS, Hydrologic Engineering Center—River Analysis System]
Precipitation Data and Distribution
To simulate a precipitation runoff event, hydrologic models need accurate temporal and spatial precipitation data for the watershed. Next Generation Weather Radar (NEXRAD) Multi-sensor Precipitation Estimator precipitation data from the National Weather Service were used for the hydrologic model (National Oceanic and Atmospheric Administration, 2022). The NEXRAD dataset provided complete spatial coverage of the watershed in hourly increments and 2-kilometer grid resolution that was read directly into HEC–HMS.
Precipitation Losses
Precipitation losses account for the hydrologic processes such as storage losses and subsurface infiltration. The Soil Conservation Service Curve Number (CN) method was used to simulate precipitation losses for single rainfall events; CNs were applied to each subwatershed according to the TR–55 methodology (Natural Resources Conservation Service, 1986), which uses hydrologic soil type, land use, land treatment, and antecedent runoff conditions. Composite CNs for each subwatershed were determined through HEC–GeoHMS by using spatial data from the Soil Survey Geographic database (U.S. Department of Agriculture, 2021) and the 2016 National Land Cover Database (Dewitz, 2019).
The CNs are divided into three classes based on antecedent runoff conditions: CN(I) for dry soil conditions, CN(II) for average soil moisture conditions, and CN(III) for saturated soil conditions (Natural Resources Conservation Service, 2004). The HEC–GeoHMS derived CNs were for CN(II). The CN(I) and CN(III) were used as the lower and upper CN ranges in HEC–HMS model calibration. The CN(I) and CN(III) can be computed from CN(II) with the following equations (Chow and others, 1988):
Precipitation Transformation
During a rainfall event, runoff is simulated as the amount of precipitation that exceeds soil infiltration rates, surface storage availability, and tree canopy interception in each time-step of the model simulation. The runoff is transformed into a hydrograph representing the direct runoff from a rainfall event by using the Clark (1945) unit-hydrograph method. The HEC–HMS model requires two parameters for this unit hydrograph method, time of concentration (Tc) and a storage coefficient (R). The Tc is the time of travel it takes for precipitation runoff to propagate from the most distant point in a watershed or subwatershed to its outlet. The storage coefficient, R, is used to account for storage within the floodplain such as wetlands, reservoirs, and backwater areas that can produce flood-wave attenuation. Initial Tc estimates were calculated using the TR–55 methodology (Natural Resources Conservation Service, 1986). A dimensionless ratio R/(Tc+R) has been determined to be consistent for watersheds on a regional basis (U.S. Army Corps of Engineers, 1994). The storage coefficient R values were set to the initial Tc values for the subwatershed and further adjusted during calibration.
Base-Flow Method
The recession base-flow method (Chow and others, 1988; U.S. Army Corps of Engineers, 2018) was used to simulate base flow within the watershed. For this method the HEC–HMS model needed three parameters: initial base flow, recession constant, and the base-flow-threshold ratio to peak constant. The initial base flow was applied to the subwatersheds so that the cumulative base-flow values simulated observed initial flows at the USGS station 04021520 during the calibration events. The recession constant represents the rate at which base flow recedes following a rainfall event. The base-flow-threshold ratio to peak constant distinguishes when to begin base flow on the receding limb of the hydrograph. These parameters were estimated and further adjusted during model calibration.
Channel Routing
Channel routing was conducted through an unsteady flow 2D hydraulic modeling program, Hydrologic Engineering Center–River Analysis System (HEC–RAS), which routes flow using the shallow water equations described in the “Hydraulic Model” section. This modeling approach was chosen instead of hydrologic routing methods available in HEC–HMS to better represent floodplain storage and lower flow velocities in low gradient streams (U.S. Army Corps of Engineers, 2021). Thus, model calibration for the HEC–HMS and HEC–RAS models were done simultaneously as an interactive process.
Hydraulic Model
An unsteady flow 2D hydraulic model was used to simulate in-channel streamflows and water levels in the lakes (fig. 2). Gate operations at the lake outlets were also incorporated to the model. The hydraulic model was constructed using the U.S. Army Corps of Engineers modeling program HEC–RAS version 6.4.1 (U.S. Army Corps of Engineers, 2023) and calibrated to the same historical rainfall events as the HEC–HMS model. The calibrated HEC–RAS model was then used to analyze the effects of proposed channel modification alternatives.
Elevation Data
A lidar-derived 1-meter DEM and surveyed cross sections were used for the elevation data in the HEC–RAS model. The lidar data were collected May 3–June 2, 2011, by Woolpert Incorporated (Minnesota Department of Natural Resources, 2020). The lidar data have a vertical accuracy root mean squared error of 5.0 centimeters in the “open terrain” land cover category and a fundamental vertical accuracy of 9.8 centimeters at a 95-percent confidence interval (Minnesota Department of Natural Resources, 2020), which meets USGS lidar base specifications (Heidemann, 2012). The horizontal accuracy is 3.8 ft at the 95-percent confidence level. Channel survey data were collected during the Natural Resources Conservation Service (2009) study. From the fall of 2005 to the spring of 2006, the survey grade Global Positioning System was used to survey channel cross-sections, culvert crossings, and lake outlet structures. The channel cross-sections were surveyed at 500-ft intervals along Stoney Brook and Deadfish Tributary (fig. 1; Natural Resources Conservation Service, 2009).
Model Geometry
The HEC–RAS model consisted of a 2D mesh covering 13.5 mi2 of the watershed, and storage areas representing Perch Lake, Jaskari Lake, Rice Portage Lake, Deadfish Lake, and the Upper Deadfish Impoundment (fig. 2). The 2D mesh had 20- to 40-ft cells in the stream channels to capture the channel geometry and bank spoils. Larger 200-ft cells were used on the expansive floodplain where there were few features that needed to be represented in the mesh. Breaklines also were incorporated into the mesh to align cell faces to abrupt changes in terrain such as bank spoils, elevated road surfaces, and other terrestrial obstructions to flow. Culverts and gate-controlled lake outlets were incorporated in the HEC–RAS model as “2D connections.” The hydraulic model consisted of nine culvert crossings and four gate-controlled structures at lake outlets. Culvert and gate structure geometries were obtained from Natural Resources Conservation Service (2009).
Energy-Loss Factors
Hydraulic analyses require the estimation of energy losses that result from frictional flow resistance. These energy losses are quantified by the Manning’s roughness coefficient (n-value; Chow, 1959). Initial (pre-calibration) n-values from the Fond du Lac Water Management Project (Natural Resources Conservation Service, 2009) were used for channel areas, whereas n-value ranges for overland areas were based on land classifications from the 2016 National Land Cover Database and typical n-value ranges for land classifications (U.S. Army Corps of Engineers, 2020). A channel n-value of 0.05 was used in Natural Resources Conservation Service (2009) because the ditched streams contained logs, heavy vegetation, woody debris, and numerous beaver dams. During the HEC–RAS model calibration for this study, an n-value of 0.045 was determined to best replicate the observed hydrographs from the USGS streamgage 04021520. The calibrated n-values for the overland areas ranged from 0.02 for impervious surfaces (such as roads) to 0.1 for dense evergreen forests and woody wetlands.
Boundary Conditions
Flow hydrographs from the HEC–HMS model were used as the upstream boundary condition, and normal depth was used as the downstream boundary condition in the HEC–RAS model. The normal depth slope of 0.00075 foot per foot was calculated from the average slope of the channel bottom at the downstream boundary of the study area. The HEC–HMS model simulated flow hydrographs for the 14 subwatersheds delineated within the study area. The HEC–HMS subwatershed flow hydrographs were used as upstream boundary conditions for the outer areas of the 2D mesh that were adjacent to a subwatershed outlet. The remaining subwatershed flow hydrographs were incorporated inside the mesh as a lateral inflow or at a storage area if the storage area was located at a subwatershed outlet.
Model Calibration
Calibration of the HEC–HMS and HEC–RAS models was an interactive process of simultaneously calibrating both models and the gate operations at the lake outlets. During calibration, CNs, Tc, storage coefficient R, and base-flow parameters were adjusted in the HEC–HMS model. The CNs governed how much precipitation was converted to direct runoff. The Tc parameter affected the timing of the hydrograph and the storage coefficient R affected hydrograph attenuation. The base-flow parameters affected the initial flow values at the start of the simulation and the location of the inflection point on the receding limb of the hydrograph as the slope of the hydrograph after the inflection point. Manning n-values were adjusted to calibrate the HEC–RAS model and primarily affected water-surface elevations (WSEs) and hydrograph attenuation.
The models were calibrated to two historical rainfall events occurring April 2008 and June 2012. Both rainfall events produced flows ranked in the top seven peak flows for the USGS station 04021520 (table 3). Other historical rainfall events were considered for calibration but could not be replicated accurately with the HEC–HMS model because rainfall occurred during spring thaw while the snowpack was still melting or the events consisted of multiple rainfall events with 4- to 5-day break periods where soil moisture conditions were constantly changing. These conditions cannot be simulated by the CN precipitation loss method in HEC–HMS because it is unable to account for the runoff from snowmelt and on frozen ground. This precipitation loss method was designed for single event-based modeling and does not account for additional soil infiltration once soil conditions change between rain events.
Observed streamflow hydrographs and select stage hydrographs from the USGS station 04021520, located near the downstream boundary of the study area, were used for model calibration (fig. 2 and table 3). The previous vertical datum of 1,280 ft above mean sea level at the streamgage originated from a topographic map that did not provide the accuracy needed to convert observed stage hydrographs to WSEs for model calibration. The streamgage datum was updated in 2022 with a Level II global navigation satellite system survey (Rydlund and Densmore, 2012) to an elevation of 1,278.11 ft above the North American Vertical Datum of 1988 (U.S. Geological Survey, 2023b). The streamgage and associated datum has been at its present location since May 2009, which allowed for the conversion of stage hydrographs to WSEs from this date onward. Therefore, observed WSEs from USGS station 04021520 were used in model calibration for the June 2012 event but could not be used for the April 2008 event because it predated the current location of the streamgage and its associated datum. Lake levels at the outlet control structures were periodically measured by FDLB staff and could be converted to WSEs by using established elevations at the outlet control structures. Lake-level measurements were made during the June 2012 events that captured peak conditions and were used for model calibration. These peak conditions were not measured during the April 2008 event and only observed streamflow from the USGS station 04021520 was used to calibrate this event.
Table 3.
Seven highest peak flow events at the U.S. Geological Survey streamgage Stoney Brook at Pine Drive near Brookston, Minnesota (station 04021520).[ft, foot; ft3/s, cubic foot per second; site information from U.S. Geological Survey (2023a)]
The April 2008 event produced about 2.5 in. of rainfall on the watershed according to the cumulative Multi-sensor Precipitation Estimator precipitation from the NEXRAD dataset (National Oceanic and Atmospheric Administration, 2022). The University of Minnesota’s Cloquet Forestry Center is approximately 5 mi east of the study area (not shown) and has recorded daily weather data including temperature, precipitation totals, and snowpack depth since 1912 that meets the data collection standards from NOAA. These records indicate that the winter snowpack did not completely melt until April 14, 2008, which is only 7 days prior to the rainfall event that was modeled (Cloquet Forestry Center, 2021). The recent snowmelt would indicate that the antecedent soil moisture was under saturated conditions, which likely contributed to higher runoff than expected from a 2.5-in. rainfall event.
The June 2012 event produced substantial rainfall amounts in Carlton and St. Louis Counties of 7 in. or greater during June 19–20, causing severe flooding to the area (Czuba and others, 2012). The flooding caused extensive damages to homes, businesses, and infrastructure—including dams and flood-control structures (Czuba and others, 2012). This event produced the peak-of-record for the USGS streamgage 04021520 with a peak flow of 1,170 cubic feet per second (ft3/s) (table 3; U.S. Geological Survey, 2023a). The extreme rainfall also had a negative effect on the rice lakes within the Stoney Brook watershed by uprooting young rice plants that were in the vulnerable floating leaf stage because of the sudden increase in water levels (Hedin, 2021).
Model calibration was completed by adjusting model parameters between the hydrologic and hydraulic models (CNs, Tc, R, and Manning n-values) until the hydraulic computations at Pine Drive bridge (fig. 2) closely agreed with the observed hydrograph characteristics from USGS station 04021520 (figs. 3 and 4). The simulated peak flow of 471 ft3/s for the April 2008 event was 18 ft3/s (about 4 percent) higher than the observed peak flow of 453 ft3/s, and the simulated peak flow of 1,380 ft3/s for the June–July 2012 event was 210 ft3/s (about 18 percent) higher than the observed peak flow of 1,170 ft3/s at the USGS station 04021520 (table 4). Peak WSEs from lake-level measurements provided additional calibration locations for the June 2012 event, and the differences from observed and simulated peak WSEs ranged from −0.27 to 0.20 ft (table 5). The June 2012 flood caused an outage at USGS station 04021520, and the streamgage did not record data for 5 days near the peak flow of the event, so there is some uncertainty with the observed peak values during this event. Nonetheless, final calibration results indicated the model simulations can replicate observed hydrographs and lake levels with acceptable accuracy (figs. 3 and 4).
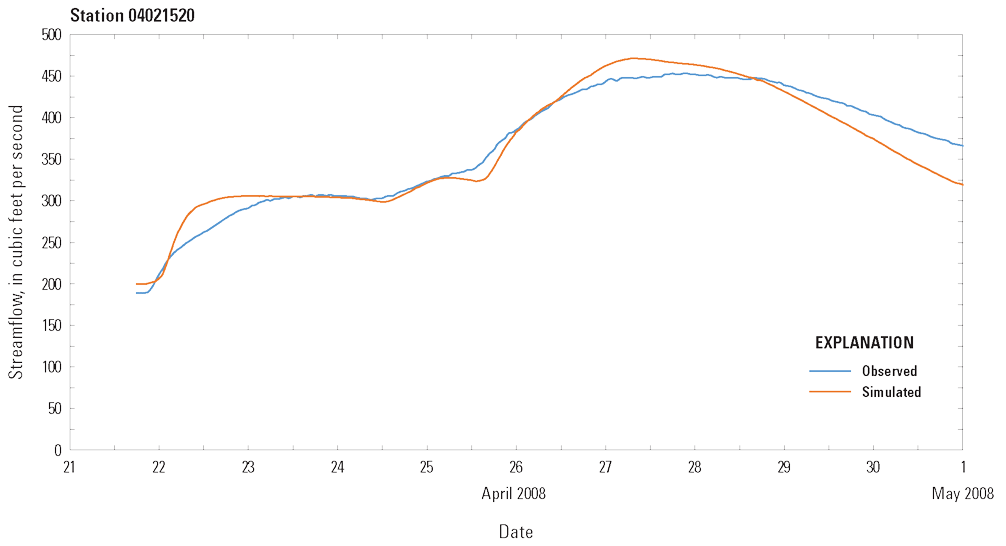
Simulated and observed continuous flows at U.S. Geological Survey streamgage Stoney Brook at Pine Drive near Brookston, Minnesota (station 04021520) during April 2008 calibration event. Data from U.S. Geological Survey (2023a) and Cigrand (2024).
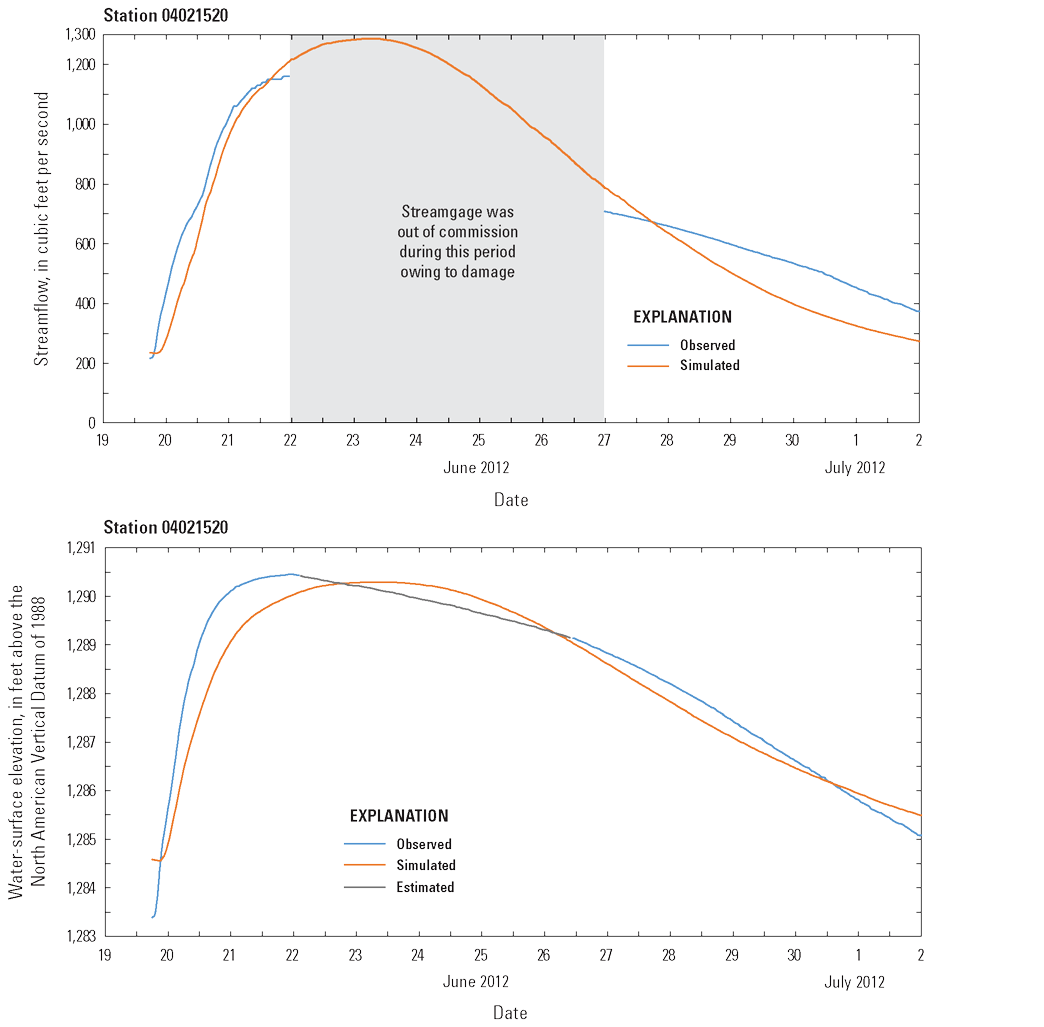
Simulated and observed continuous flows and water-surface elevations at U.S. Geological Survey streamgage Stoney Brook at Pine Drive near Brookston, Minnesota (station 04021520) during June 2012 calibration event. Data from U.S. Geological Survey (2023a) and Cigrand (2024).
Table 4.
Observed and simulated peak flow and model performance statistics (Nash-Sutcliffe efficiency and percentage bias) at the U.S. Geological Survey streamgage Stoney Brook at Pine Drive near Brookston, Minnesota (station 04021520).[ft3/s, foot per second; NSE, Nash-Sutcliffe efficiency (Nash and Sutcliffe, 1970); PBIAS, percentage bias; information from U.S. Geological Survey (2023b) and Cigrand (2024)]
Table 5.
Observed and simulated peak water-surface elevations for the June–July 2012 calibration event at the U.S. Geological Survey streamgage Stoney Brook at Pine Drive near Brookston, Minnesota (station 04021520) and lake outlet structures.[WSE, water-surface elevation (feet above the North American Vertical Datum of 1988); ft, foot; USGS, U.S. Geological Survey; information from U.S. Geological Survey (2023b) and Cigrand (2024)]
The Nash-Sutcliffe efficiency (NSE) coefficient (Nash and Sutcliffe, 1970) and percentage bias (PBIAS; Gupta and others, 1999) statistics were used to assess model fit. The NSE measures the relative magnitude of the residual variance compared to the measured data variance. Values of NSE can vary from –∞ to 1 (where ∞ represents infinity). Values of 1 correspond to a perfect match between simulated and observed time series, whereas values of 0 or less indicate that the average of the observed values is a better predictor than the simulated values. The NSE of the two calibration events using the USGS station 04021520 streamflow data was 0.93 for the April 2008 event and 0.84 for the June 2012 event (table 4), indicating a good to excellent model fit (Moriasi and others, 2007). The PBIAS measures the average tendency of the simulated data to be larger or smaller than the observed data. The optimal value for PBIAS is 0 with low absolute percentage bias, indicating accurate model simulation. Positive values indicate a model underestimation bias, whereas negative values indicate a model overestimation bias. The calibration events at the USGS station 04021520 yielded PBIAS values of 0.47 percent for the April 2008 event and 6.74 percent for the June 2012 event (table 4), indicating a good to excellent model fit (Moriasi and others, 2007). The calibration results and model evaluation statistics demonstrate that the hydrologic and hydraulic models can simulate accurate water levels and flow in the study area.
Channel Modification Used for Alternatives
The calibrated hydrologic and hydraulic models were used to simulate hypothetical channel modification alternatives intended to improve flow conveyances and storage and wetland coverage within the floodplain. Terrain modifications were made in the hydraulic model to reconnect areas of the floodplain that were negatively affected by the ditching and the bank spoils the ditching produced. These terrain modifications include breaches in the bank spoils, reconnecting the original channel to Stoney Brook, and clearing the original channel of soil deposition and debris.
Three breaches to the bank spoils were made along Stoney Brook (fig. 2) to reconnect Stoney Brook to the floodplain and not confine flows within the ditching and bank spoils. Two of the bank spoil breaches were placed on the upstream end of Wetland Areas 1 and 2 (fig. 2) to allow flow to leave the Stoney Brook channel and enter the wetland areas of interest, which are further described in the “Results for Channel Modification Alternatives” section. These breaches were about 2,000 ft in length in areas where the meander belt of the original channel closely parallels Stoney Brook. A meander belt is an area across an alluvial valley in which a stream periodically shifts its channel to form meander loops and bends (Fisk, 1944). These locations provided connectivity to the low-lying areas near the original channel meander belt and to the locations where the course of the original channel begins to deviate from Stoney Brook. A third spoil breach was created about 3,600 ft upstream from the Pine Drive bridge. This breach was about 500 ft in length and connects Stoney Brook to a small area near the original channel meander belt.
The original channel was reconnected to Stoney Brook by means of the breaches, and it was cleared of silt and debris deposition, and furnished with additional culverts at road crossings. With the main source of flow having been diverted from the original channel, it has become silted-in and full of debris (Hedin, 2021). Two large segments of the original channel (fig. 2) were modified into the DEM with a 6-ft channel bottom and 3:1 (horizontal to vertical) side slope that covers a similar footprint to the original channel. Profiles of the terrain elevation were used to give the original channel a similar slope to pre-existing ditching conditions. Two 3.5-ft diameter pipe culverts on the original channel and adjacent to the first bridge replaced a 1.5-ft arching pipe culvert to allow more flow to cross the bridge site into the original channel. Two additional 2.5-ft diameter pipe culverts were also incorporated adjacent to the second bridge on the original channel.
Five checkdams were added to the terrain to enable a flow diversion from the main channel to the original channel and to pool areas in the original channel. Two of the checkdams were added in the main channel (Stoney Brook) immediately downstream from bank spoil breach locations for Wetland Areas 1 and 2 (fig. 2). These checkdams were set to an elevation 1 ft below the spoil breach elevation to allow normal flow in the main channel during base-flow conditions but can propagate flow into the original channel during rainfall runoff conditions. Three additional checkdams were placed in Wetland Areas 1 and 2 in the original channel (fig. 2). These checkdams elevations were set to the top of bank and used to pool water in the original channel.
To analyze the channel modifications under a range of precipitation intensities, frequency rainfall events of 24-hour duration were produced from the hydrologic model for 1-, 2-, 5-, and 10-year annual recurrence intervals (100-, 50-, 20-, and 10-percent annual exceedance probability; table 6). The NOAA Atlas 14 partial duration series was used for the frequency rainfall estimates (Perica and others, 2013). Hydrologic model outputs of simulated flow hydrographs for the frequency rainfall events under CN(II) were incorporated in the hydraulic model as boundary conditions. The hydraulic model simulated the four frequency rainfall events for each of the four channel modification alternatives. The simulations covered a 20-day period to allow the precipitation runoff to route through the watershed and for the flow to return to base-flow conditions and lake-water levels to recede.
Table 6.
National Oceanic and Atmospheric Administration Atlas 14 precipitation-frequency estimates of 24-hour rainfall duration for the Stoney Brook watershed (Perica and others, 2013).Results for Channel Modification Alternatives
Six distinct areas were used in the model to evaluate the effects from the channel modification alternatives. One area is a large portion of the Stoney Brook watershed, which is referred to as the “Lower Stoney Brook” and is bounded by the outlets of Rice Portage Lake and Deadfish Lake as the upstream extent and the Pine Drive bridge as the downstream extent (fig. 2). The other five areas are Deadfish Lake, Pine Drive bridge, Rice Portage Lake, Wetland Area 1, and Wetland Area 2 (fig. 2). Deadfish Lake, Rice Portage Lake, and Pine Drive bridge provided areas to assess if the channel modification alternatives increase flow conveyances or attenuate flow through the watershed. Wetland Areas 1 and 2 are areas of interest to FDLB for the potential to restore or enhance wetland areas and because they are areas of the alluvial valley associated with the original channel that are most disconnected from the ditching that rerouted Stoney Brook. The Lower Stoney Brook Area provides a larger extent for any cumulative additions to wetland coverage with the channel modification alternatives.
Effects of Channel Modification Alternatives on Deadfish and Rice Portage Lake Levels
For each of the four frequency rainfall events (1-, 2-, 5-, and 10-year recurrence intervals), the simulated event peak WSEs and ending WSEs at Deadfish Lake and Rice Portage Lake were assessed. These are the bounding lakes to the alternative scenarios that were simulated on the Lower Stoney Brook Area (fig. 2) where substantial increases of peak WSEs could be detrimental to rice yields. The remaining lakes are located farther upstream where effects from the alternative scenarios were not substantial. The simulated results of Deadfish Lake and Rice Portage Lake had small differences of peak WSEs from the alternative scenarios and existing conditions ranging from −0.09 to 0.03 ft (figs. 5 and 6; table 7). For WSEs at the end of the 20-day simulated scenarios, both lakes had higher WSEs under the alternative scenarios, with Deadfish Lake varying from 0.34 to 0.73 ft and Rice Portage Lake varying from 0.04 to 0.13 ft (figs. 5 and 6; table 7) higher than existing conditions. These results demonstrated that the lakes would take longer to draw down with the alternative scenarios, especially water levels in Deadfish Lake that had increasingly longer drawdown periods for the lower recurrence interval rainfall events when compared to the existing conditions scenario.
Table 7.
Peak water-surface elevations and water-surface elevations at the end of the 20-day simulated period on Deadfish Lake and Rice Portage Lake for channel modification alternatives and existing conditions during 24-hour duration for 1-, 2-, 5-, and 10-year recurrence interval rainfall events. Data available in Cigrand (2024).[WSE, water-surface elevation (feet above the North American Datum of 1988); ft, foot; --, no data]
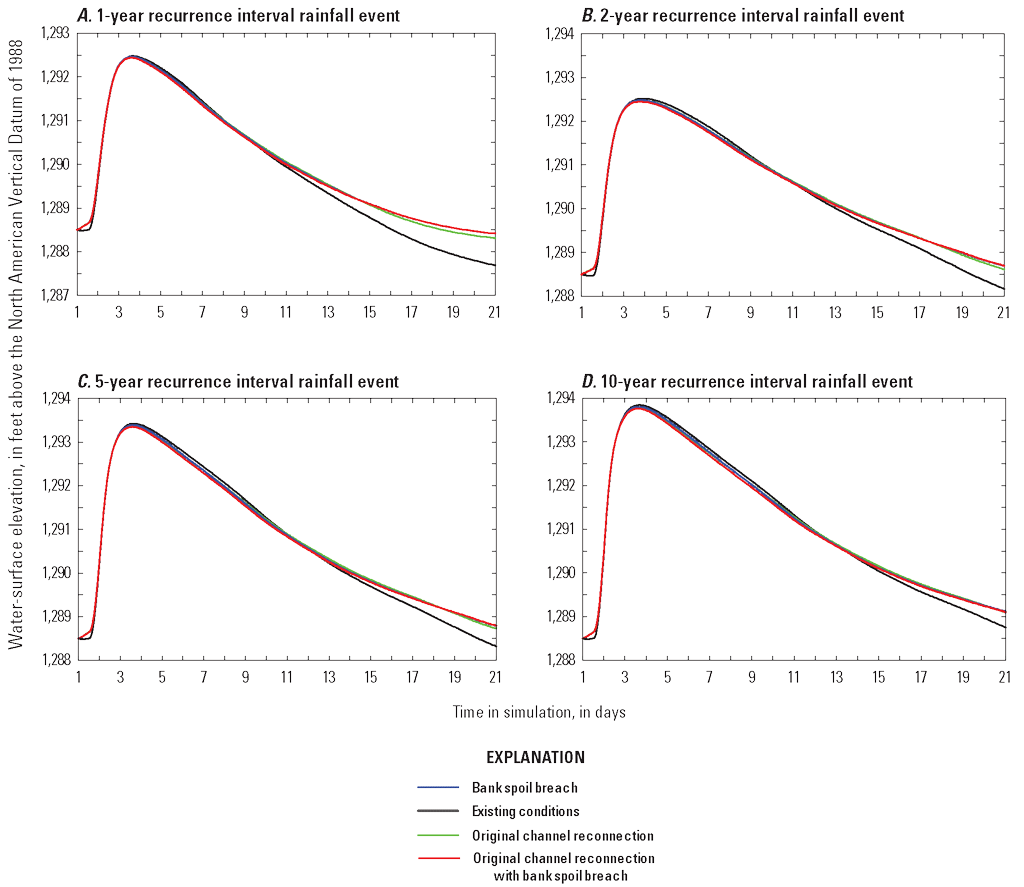
Water-surface elevations on Deadfish Lake for channel modification alternatives and existing conditions during 24-hour duration for 1-, 2-, 5-, and 10-year recurrence interval rainfall events. A, 1-year recurrence interval rainfall event. B, 2-year recurrence interval rainfall event. C, 5-year recurrence interval rainfall event. D, 10-year recurrence interval rainfall event. Data available in Cigrand (2024).
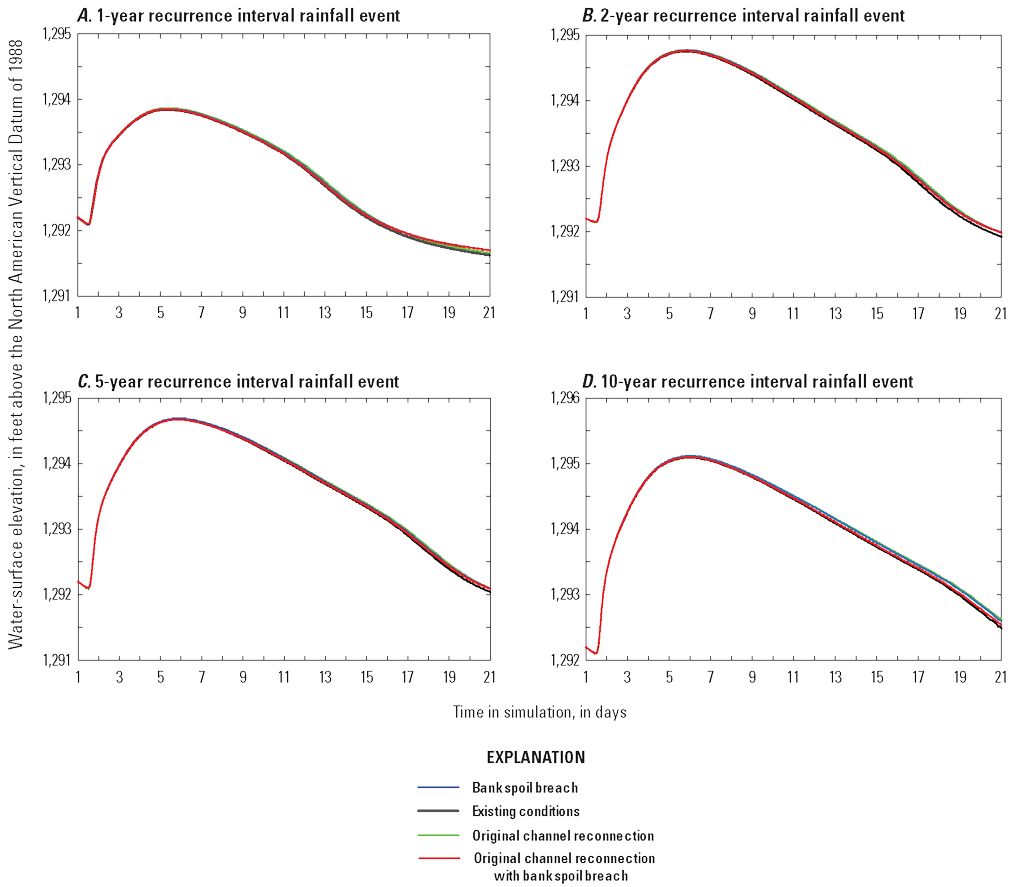
Water-surface elevations on Rice Portage Lake for channel modification alternatives and existing conditions during 24-hour duration for 1-, 2-, 5-, and 10-year recurrence interval rainfall events. A, 1-year recurrence interval rainfall event. B, 2-year recurrence interval rainfall event. C, 5-year recurrence interval rainfall event. D, 10-year recurrence interval rainfall event. Data available in Cigrand (2024).
Effects of Channel Modification Alternatives on Channel Conveyances
For each of the four frequency rainfall events (1-, 2-, 5-, and 10-year recurrence intervals), peak flows and hydrograph volume accumulation were assessed to quantify flow restoration/reconnection and conveyance in the original channel at reference locations in Wetland Area 1, Wetland Area 2, and Stoney Brook at the Pine Drive bridge (fig. 2). To visualize streamflow velocities and flow paths of the channel modification alternatives, a comparison of graphical model outputs for the 1-year recurrence interval rainfall event for the existing conditions and the original channel reconnection with bank spoil breach alternatives is shown in figure 7. The intent was to better evaluate effects of alternatives on flow velocity at the original channel reconnection and bank spoil breach locations for Wetland Area 1 and Wetland Area 2 because of a frequency rainfall event that is lower in magnitude and with less predominate overbank flows.
For the Wetland Area 1 comparison, the channel modification alternative had a small increase in flow velocity, which is distinguished by the higher concentration of velocity vectors (white colored vectors in figure 7) in the area where flow is overtopping the bank spoil breach. In contrast, the existing conditions had an increase in flow velocity in the main channel of Stoney Brook where flow is substantially constricted within the bank spoils. No differences were noticeable in extent of inundated area at this location for the alternative and existing conditions. Wetland Area 1 could prove challenging to establish flow gradients if more flow was routed through the original channel. In Wetland Area 1 the original channel has an exceptionally low gradient (0.30 foot per mile) downstream from the first bridge (fig. 7), and the alluvial valley is not as pronounced. Alternatively, the main channel of Stoney Brook is more than 3 ft lower in elevation than the original channel immediately downstream from the first bridge and is exemplified by the higher bank spoils (fig. 7), which correlates to a greater amount of ditch excavation in this section of ditching. For the Wetland Area 2 comparison, the channel modification alternative had an increase in flow velocity and a smaller extent of inundation (less backwater) than the existing conditions in the overbank area near the checkdam. The increase in velocity and smaller extent of inundation at the flow diversion for Wetland Area 2 was an indication of less backwater and improved conveyance with the channel modification alternatives, whereas conveyance improvements were less pronounced at the Wetland Area 1 channel diversion.
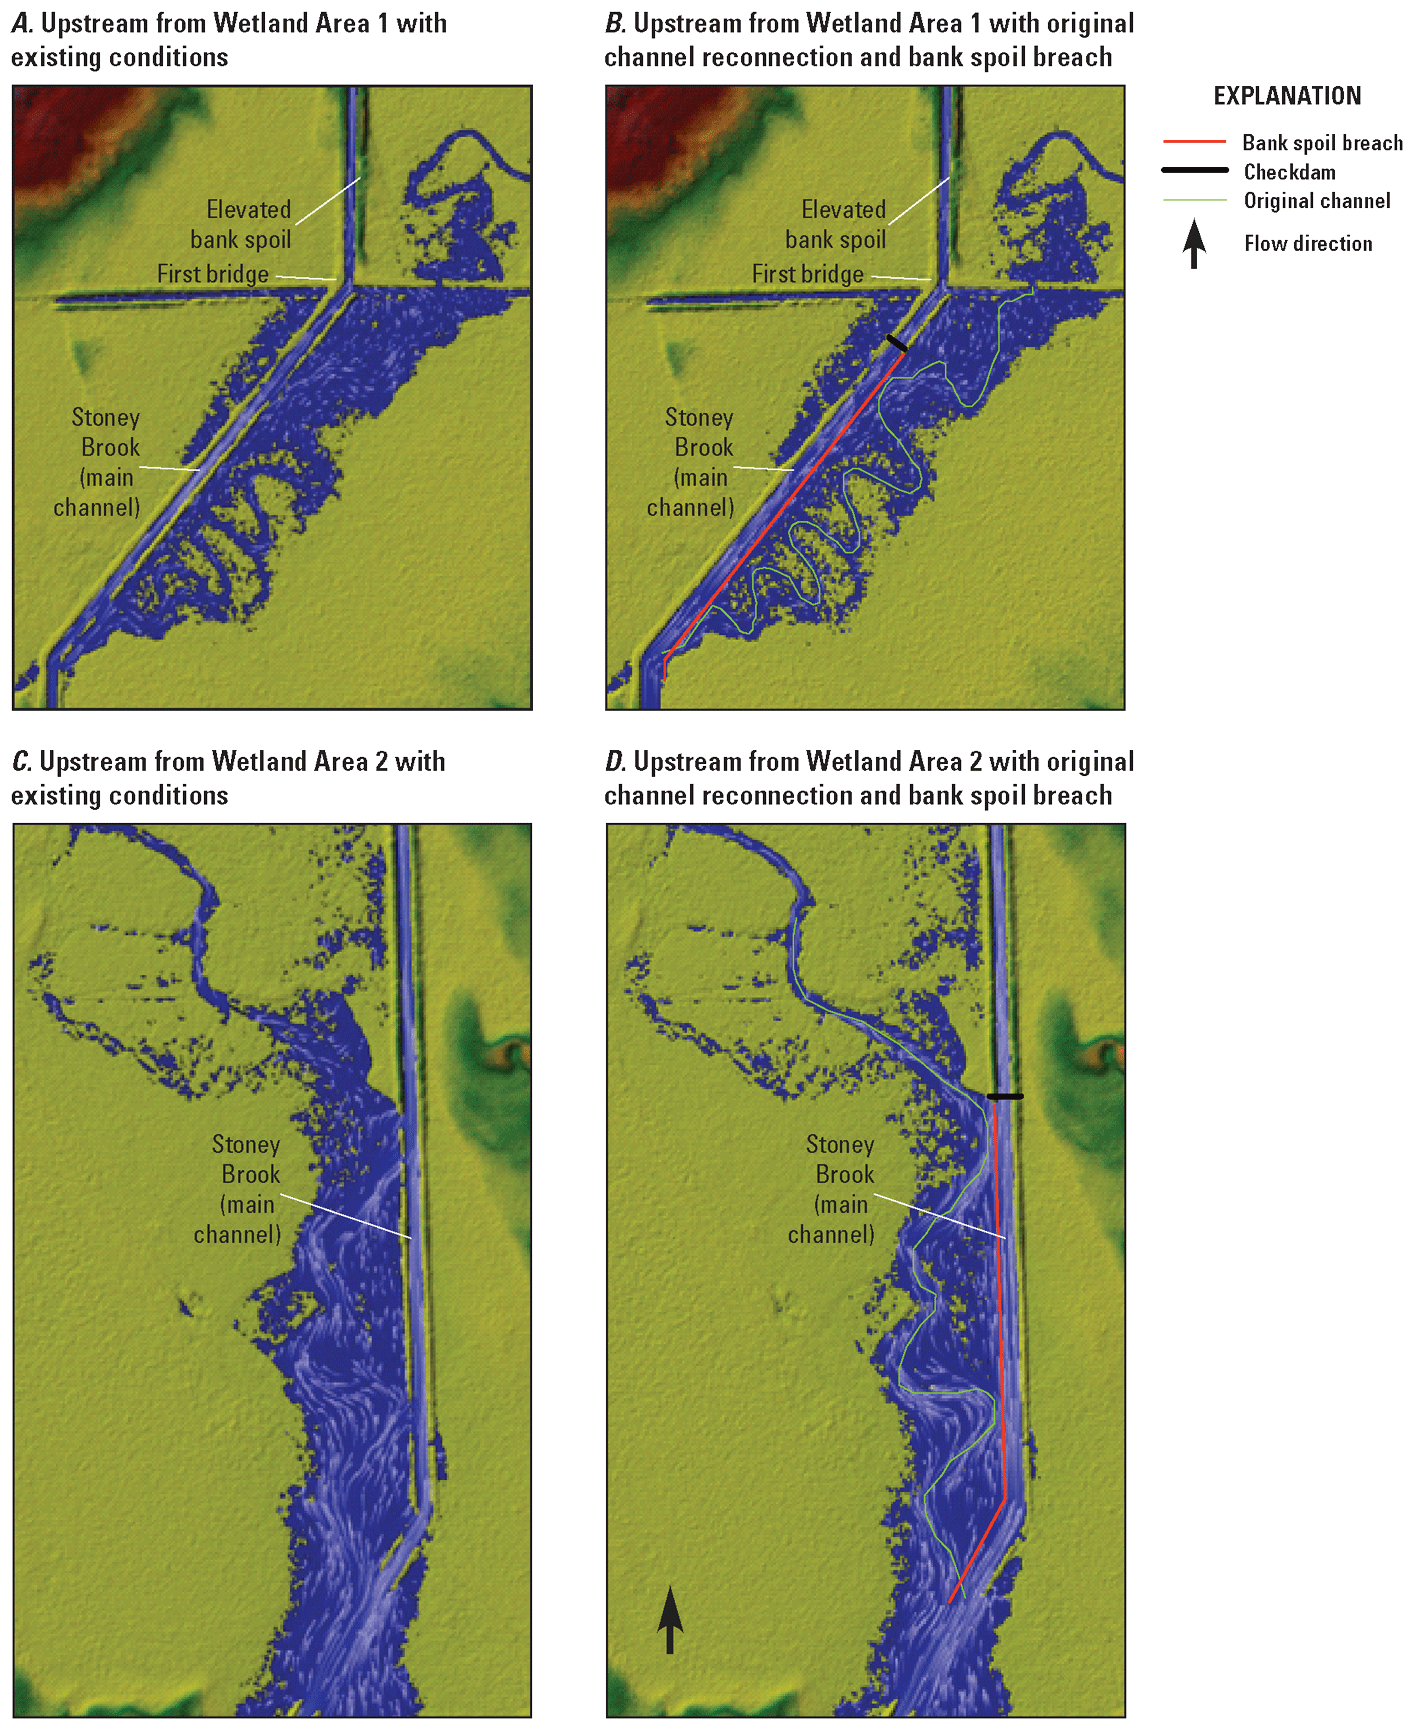
Simulated streamflow velocity vectors (white colored vectors in the figure) near the original channel reconnections and spoil breaches at Wetland Area 1 and Wetland Area 2 during a 1-year recurrence interval rainfall event. A, Upstream from Wetland Area 1 with existing conditions. B, Upstream from Wetland Area 1 with the original channel reconnection and spoil breach alternative. C, Upstream from Wetland Area 2 with existing conditions. D, Upstream from Wetland Area 2 with the original channel reconnection and spoil breach alternative. Visuals are from the hydraulic model available from Cigrand (2024).
Wetland Area 1 received peak flows ranging from 1.10 to 29.7 ft3/s for 1-, 2-, 5-, and 10-year recurrence intervals and hydrograph volume accumulations ranging from 2.88 to 275 acre-feet (acre-ft) for the existing conditions scenario (table 8; fig. 8). The original channel reconnection with and without the bank spoil breach alternatives had the largest increases from existing conditions with peak flows ranging from 2.37 to 40.5 ft3/s and hydrograph volume accumulations ranging from 9.10 to 415 acre-ft (fig. 8; table 8). The bank spoil breach alternative also showed increases in peak flows ranging from 2.07 to 35.9 ft3/s and 8.67 to 358 acre-ft in hydrograph volume accumulations (fig. 8; table 8) from existing conditions. Although there is not a high rate of flow going to Wetland Area 1 (especially for the lower recurrence interval rainfall events), the relative increase in flows with the channel modification alternatives could be considered substantial when compared to flows with existing conditions, and the increase in volume accumulations are more pronounced for the channel modification alternatives.
Table 8.
Peak flows and volume accumulations at discrete locations for channel modification alternatives and existing conditions during 24-hour duration for 1-, 2-, 5-, and 10-year recurrence interval rainfall events. Data from Cigrand (2024).[ft3/s, cubic foot per second; acre-ft, acre-feet; --, no data]
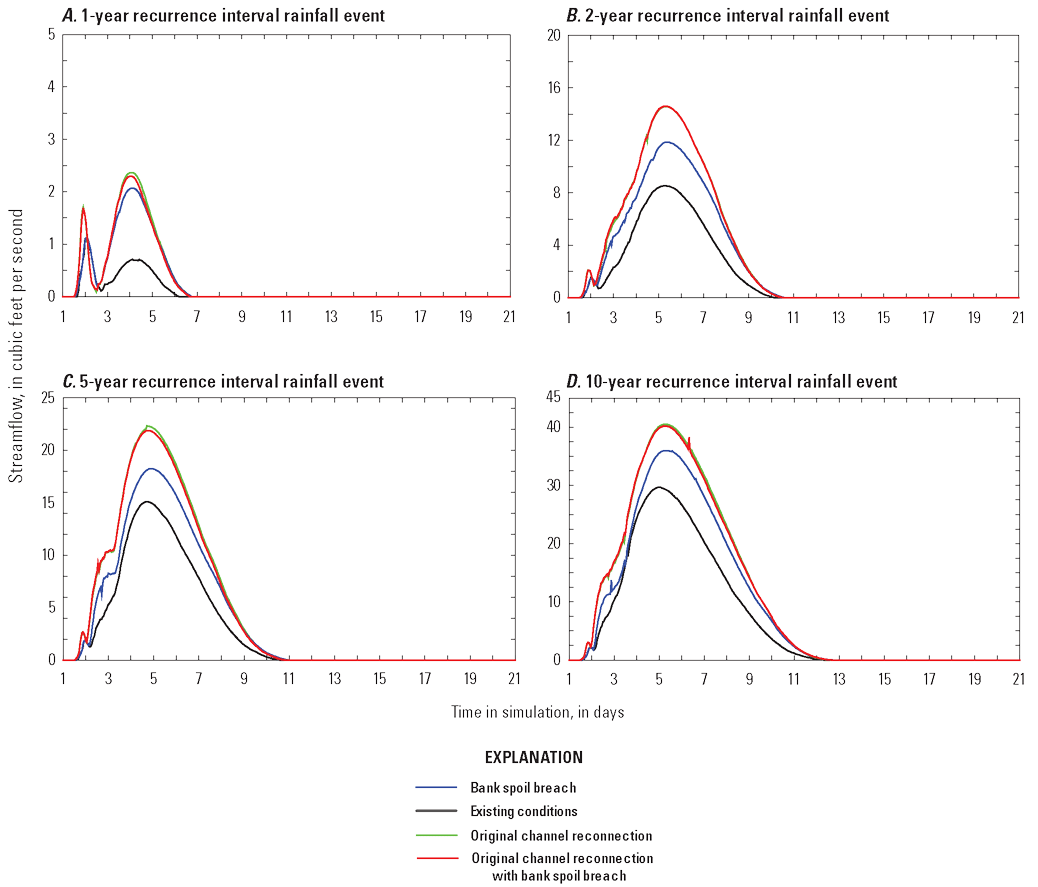
Wetland Area 1 flows for channel modification alternatives and existing conditions with 24-hour duration for 1-, 2-, 5-, and 10-year recurrence interval rainfall events. A, 1-year recurrence interval rainfall event. B, 2-year recurrence interval rainfall event. C, 5-year recurrence interval rainfall event. D, 10-year recurrence interval rainfall event. Data from Cigrand (2024).
Wetland Area 2 received peak flows ranging from 14.9 to 89.2 ft3/s for 1-, 2-, 5-, and 10-year recurrence intervals and hydrograph volume accumulations ranging from 124 to 646 acre-ft for the existing conditions scenario (fig. 9; table 8). The original channel reconnection alternative showed the largest increase in peak flows ranging from 41.1 to 128 ft3/s and hydrograph volume accumulations ranging from 269 to 1,070 acre-ft from existing conditions (fig. 9; table 8). The original channel reconnection with bank spoil breach alternative also resulted in increases from existing conditions with peak flows ranging from 35.9 to 125 ft3/s and 201 to 960 acre-ft in hydrograph volume accumulations (fig. 9; table 8). The bank spoil breach alternative results indicated decreases in peak flows and volume accumulations from existing conditions with peak flows ranging from 12.6 to 85.4 ft3/s and 76.9 to 559 acre-ft in hydrograph volume accumulations (fig. 9; table 8). Wetland Area 2 had substantial increases in peak flow and volume accumulations with the original channel reconnection and the original channel reconnection with bank spoil breach.
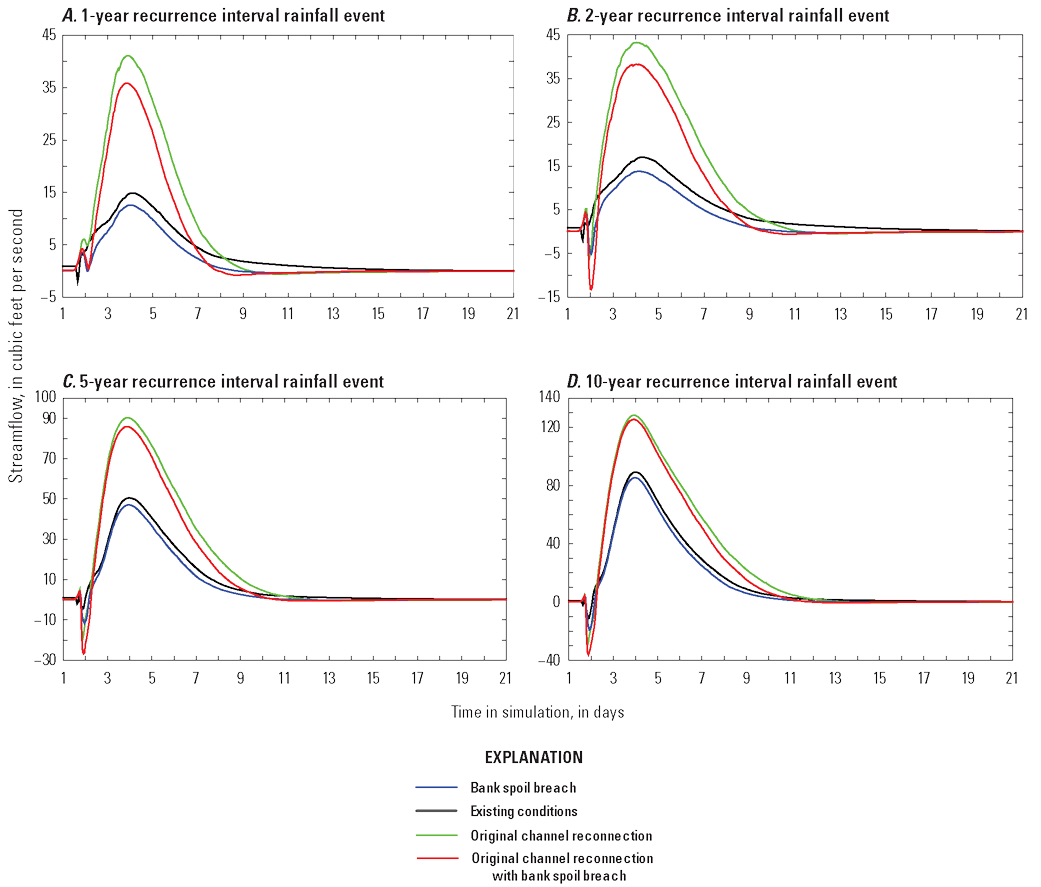
Wetland Area 2 flows for channel modification alternatives and existing conditions during 24-hour duration for 1-, 2-, 5-, and 10-year recurrence interval rainfall events. A, 1-year recurrence interval rainfall event. B, 2-year recurrence interval rainfall event. C, 5-year recurrence interval rainfall event. D, 10-year recurrence interval rainfall event. Data from Cigrand (2024).
The Pine Drive bridge location was assessed for the channel modification alternatives. All simulated probabilistic precipitation events and channel modification alternatives produced greater peak flows at the Pine Drive bridge location than the existing conditions but did not exceed a 2-percent difference from the existing conditions (fig. 10; table 8). The results demonstrate there are little conveyance improvements at the Pine Drive bridge with the channel modification alternatives for 1-, 2-, 5-, and 10-year recurrence intervals events.
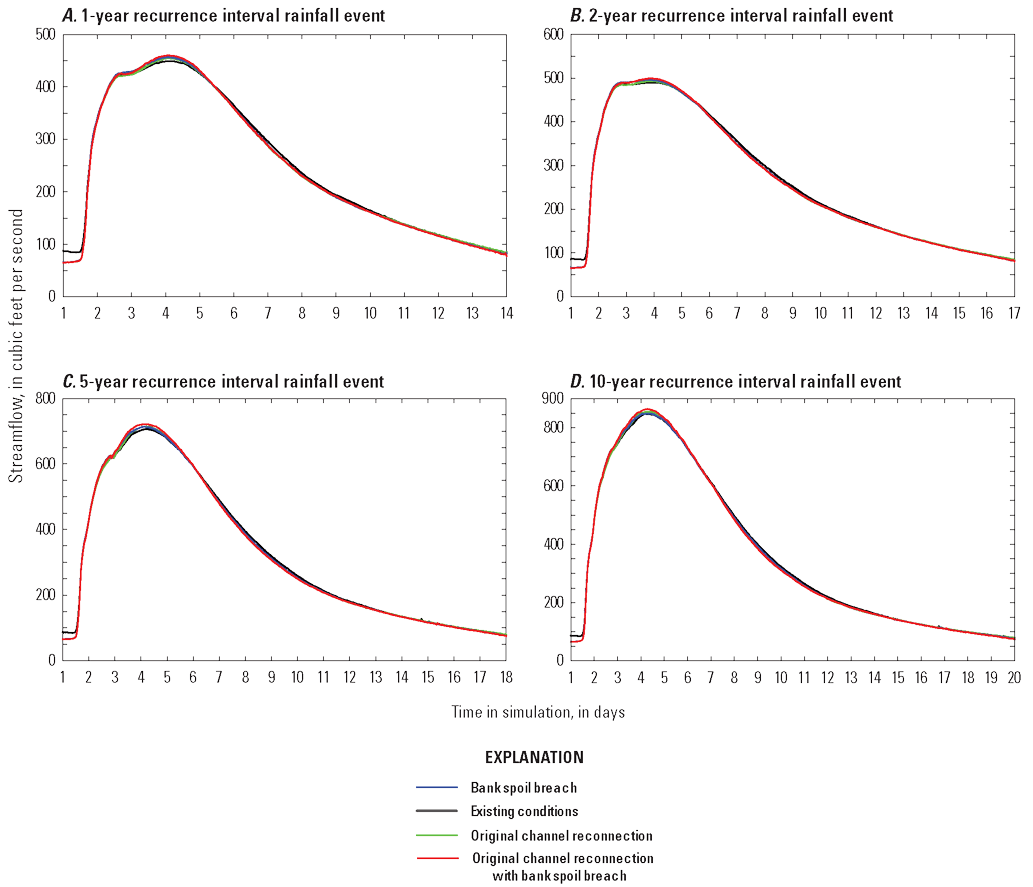
Flows at the Pine Drive bridge for channel modification alternatives and existing conditions during 24-hour duration for 1-, 2-, 5-, and 10-year recurrence interval rainfall events. A, 1-year recurrence interval rainfall event. B, 2-year recurrence interval rainfall event. C, 5-year recurrence interval rainfall event. D, 10-year recurrence interval rainfall event. Data from Cigrand (2024).
Effects of Channel Modification Alternatives on Floodplain Inundation Duration and Water Depths
For each of the four frequency rainfall events (1-, 2-, 5-, and 10-year recurrence intervals), the inundation extent, inundation duration, and water-depth distribution were assessed within selected areas Wetland Area 1, Wetland Area 2, and the Lower Stoney Brook Area (fig. 2). Developed inundation duration categories included 0 to 3 days, greater than 3 to 7 days, greater than 7 to 10 days, greater than 10 to 14 days, and greater than 14 days. Depth categories included 0 to 1 foot, greater than 1 to 2 feet, greater than 2 to 3 feet, greater than 3 to 4 feet, and greater than 4 feet. The duration categories have implications in determining changes in wetland classification for each modeled scenario depending on the classification method (Minnesota Department of Natural Resources, 2024) used in delineating a wetland. The depth categories combined with the duration information also has implications in terms of the wetland type, function, and the resilience and susceptibility of the wetland to changes in hydrologic conditions (Minnesota Board of Water and Soil Resources, 2018).
The simulated floodplain dynamics from channel modification alternatives indicated that the results varied by probabilistic event, management alternative, and duration and depth category. The most consistent increase in total inundated area was achieved through the spoil breach alternative, with changes in duration and depth subcategories yielding highly variable results for each probabilistic event. The maximum inundation condition for many area-subcategory conditions were achieved under existing conditions.
Results of the 1-year recurrence interval rainfall event indicate that there were minor changes in overall inundation extent in the three selected areas between the existing conditions and alternatives (table 9). The change in total inundation varied between channel modification alternatives and area of inundation. The bank spoil breach alternative in Wetland Area 1 provided the greatest increase in total inundated area (2.68 percent) with remaining alternatives providing changes of −0.84 to 1.46 depending on area and alternative. Although the overall changes in total inundation extent were minor, the changes in the areal extent by duration and depth category could be substantial (tables 9 and 10; figs. 11 and 12). The range in the change in inundation area from existing conditions by duration category ranged from −22.5 to 128 percent depending on duration category and channel modification alternative (table 9). The alternative providing the maximum inundation area for each duration category and in each area was determined. In several cases, the existing conditions provided the maximum inundation area. Similarly, the channel modification alternative providing the maximum inundation area by depth category varied by area and by depth category. The percent change in area from the existing conditions scenario ranged from −22.9 to 117 percent (table 10).
Table 9.
Effects of channel alterations on inundation duration characteristics of the Stoney Creek floodplain for the 1-year recurrence interval rainfall event. Data from Cigrand (2024).[>, greater than; --, no data]
Table 10.
Effects of channel alterations on inundation depth characteristics of the Stoney Creek floodplain for the 1-year recurrence interval rainfall event. Data from Cigrand (2024).[>, greater than; --, no data]
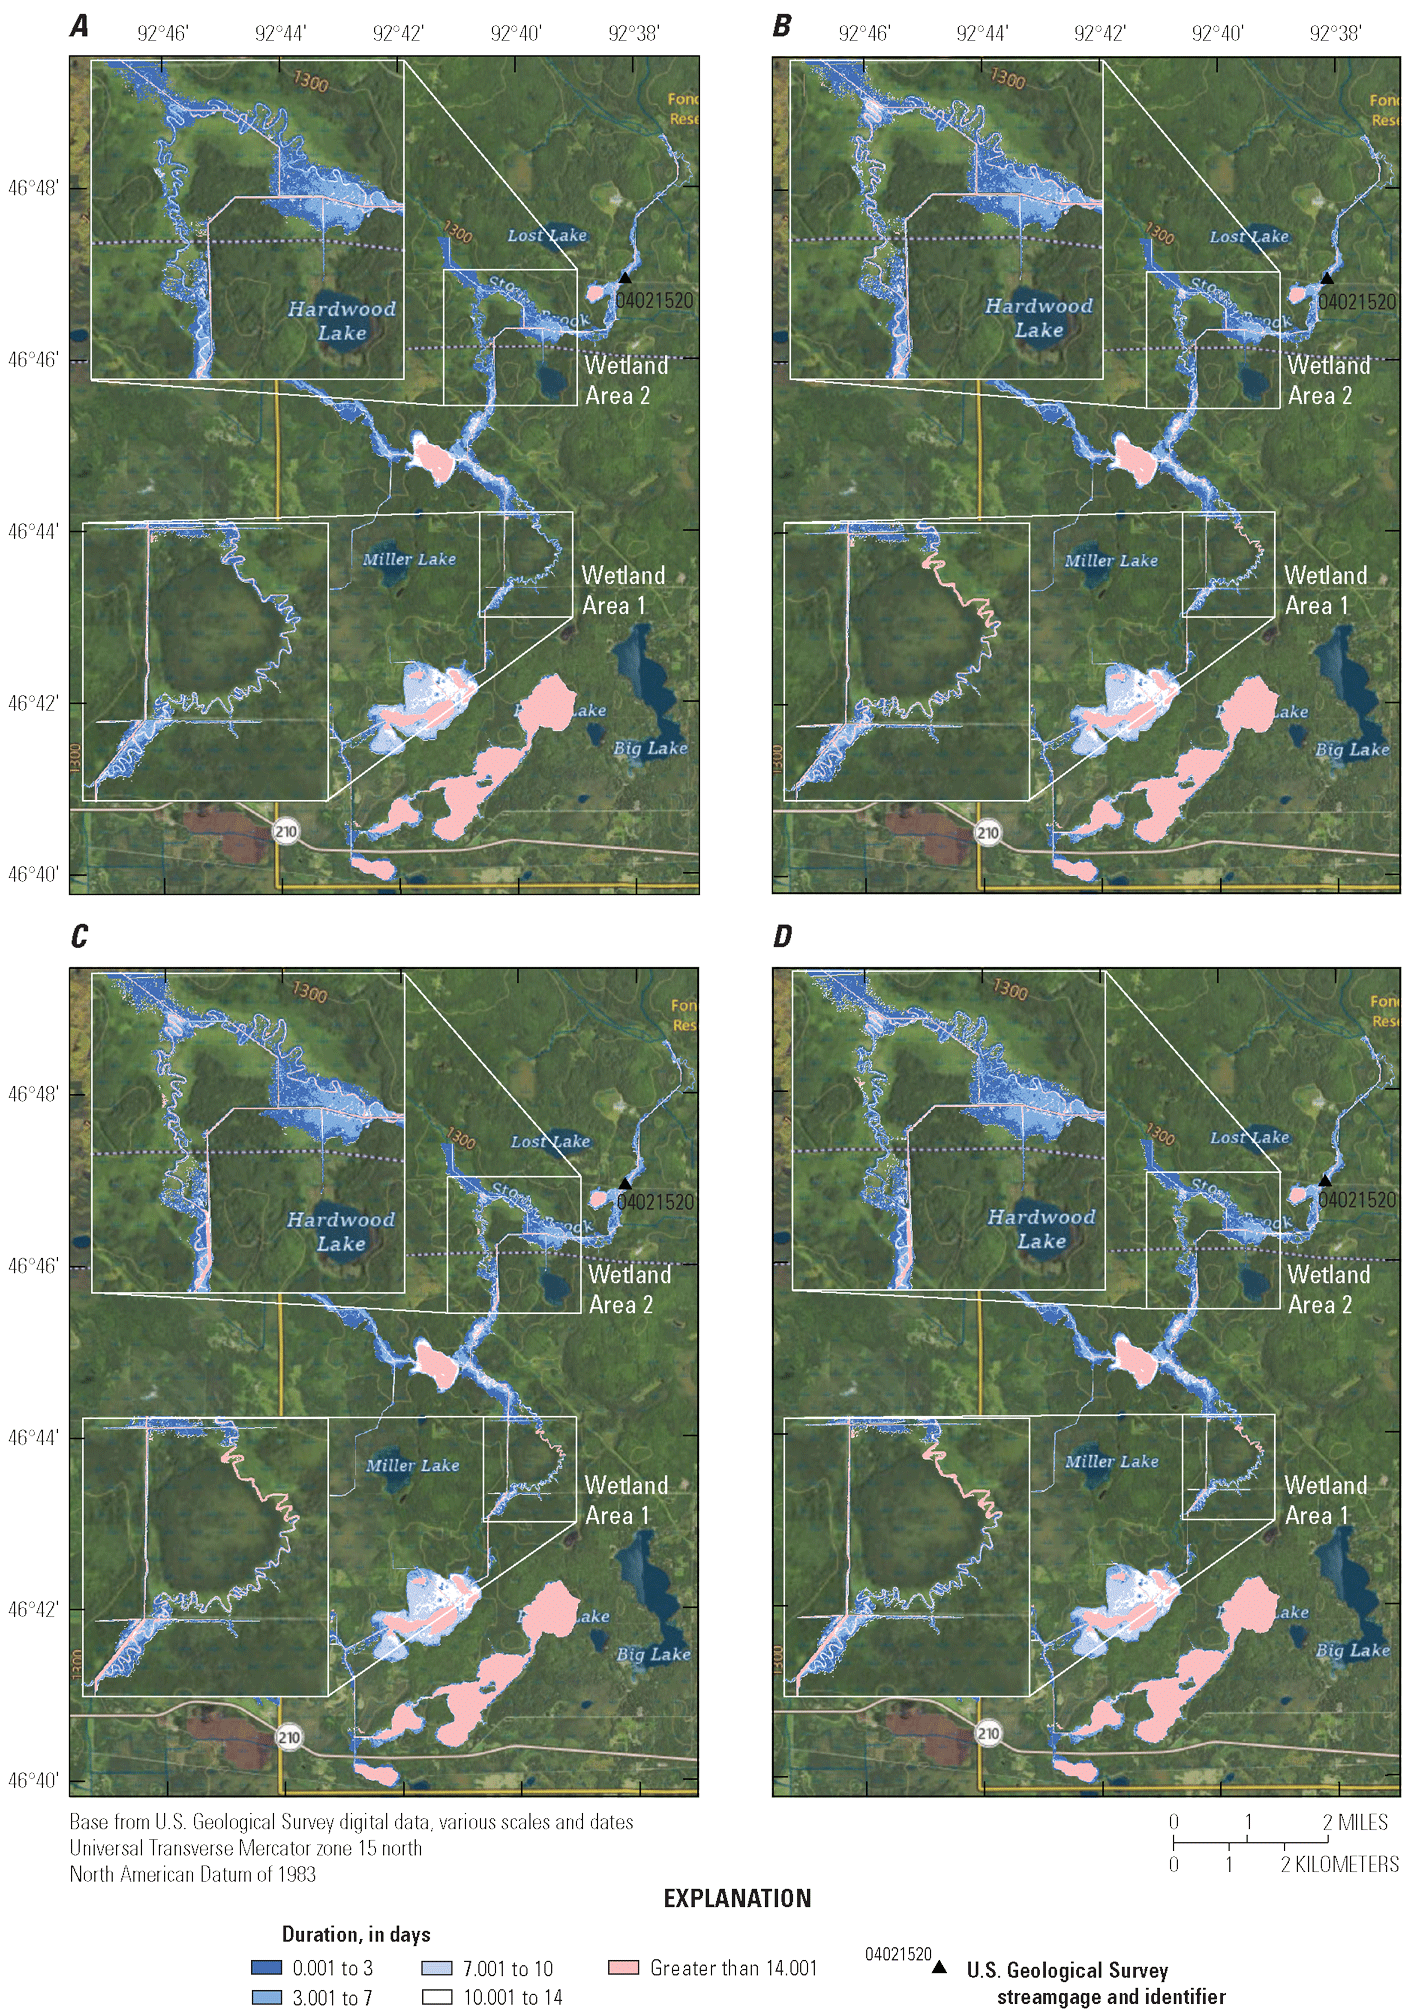
Duration of inundation during a 1-year recurrence interval rainfall event in the Stoney Brook watershed upstream from the U.S. Geological Survey streamgage Stoney Brook at Pine Drive near Brookston, Minnesota (station 04021520). A, Existing conditions. B, Original channel reconnection. C, Original channel reconnection with bank spoil breach. D, Bank spoil breach. Data from Cigrand (2024).
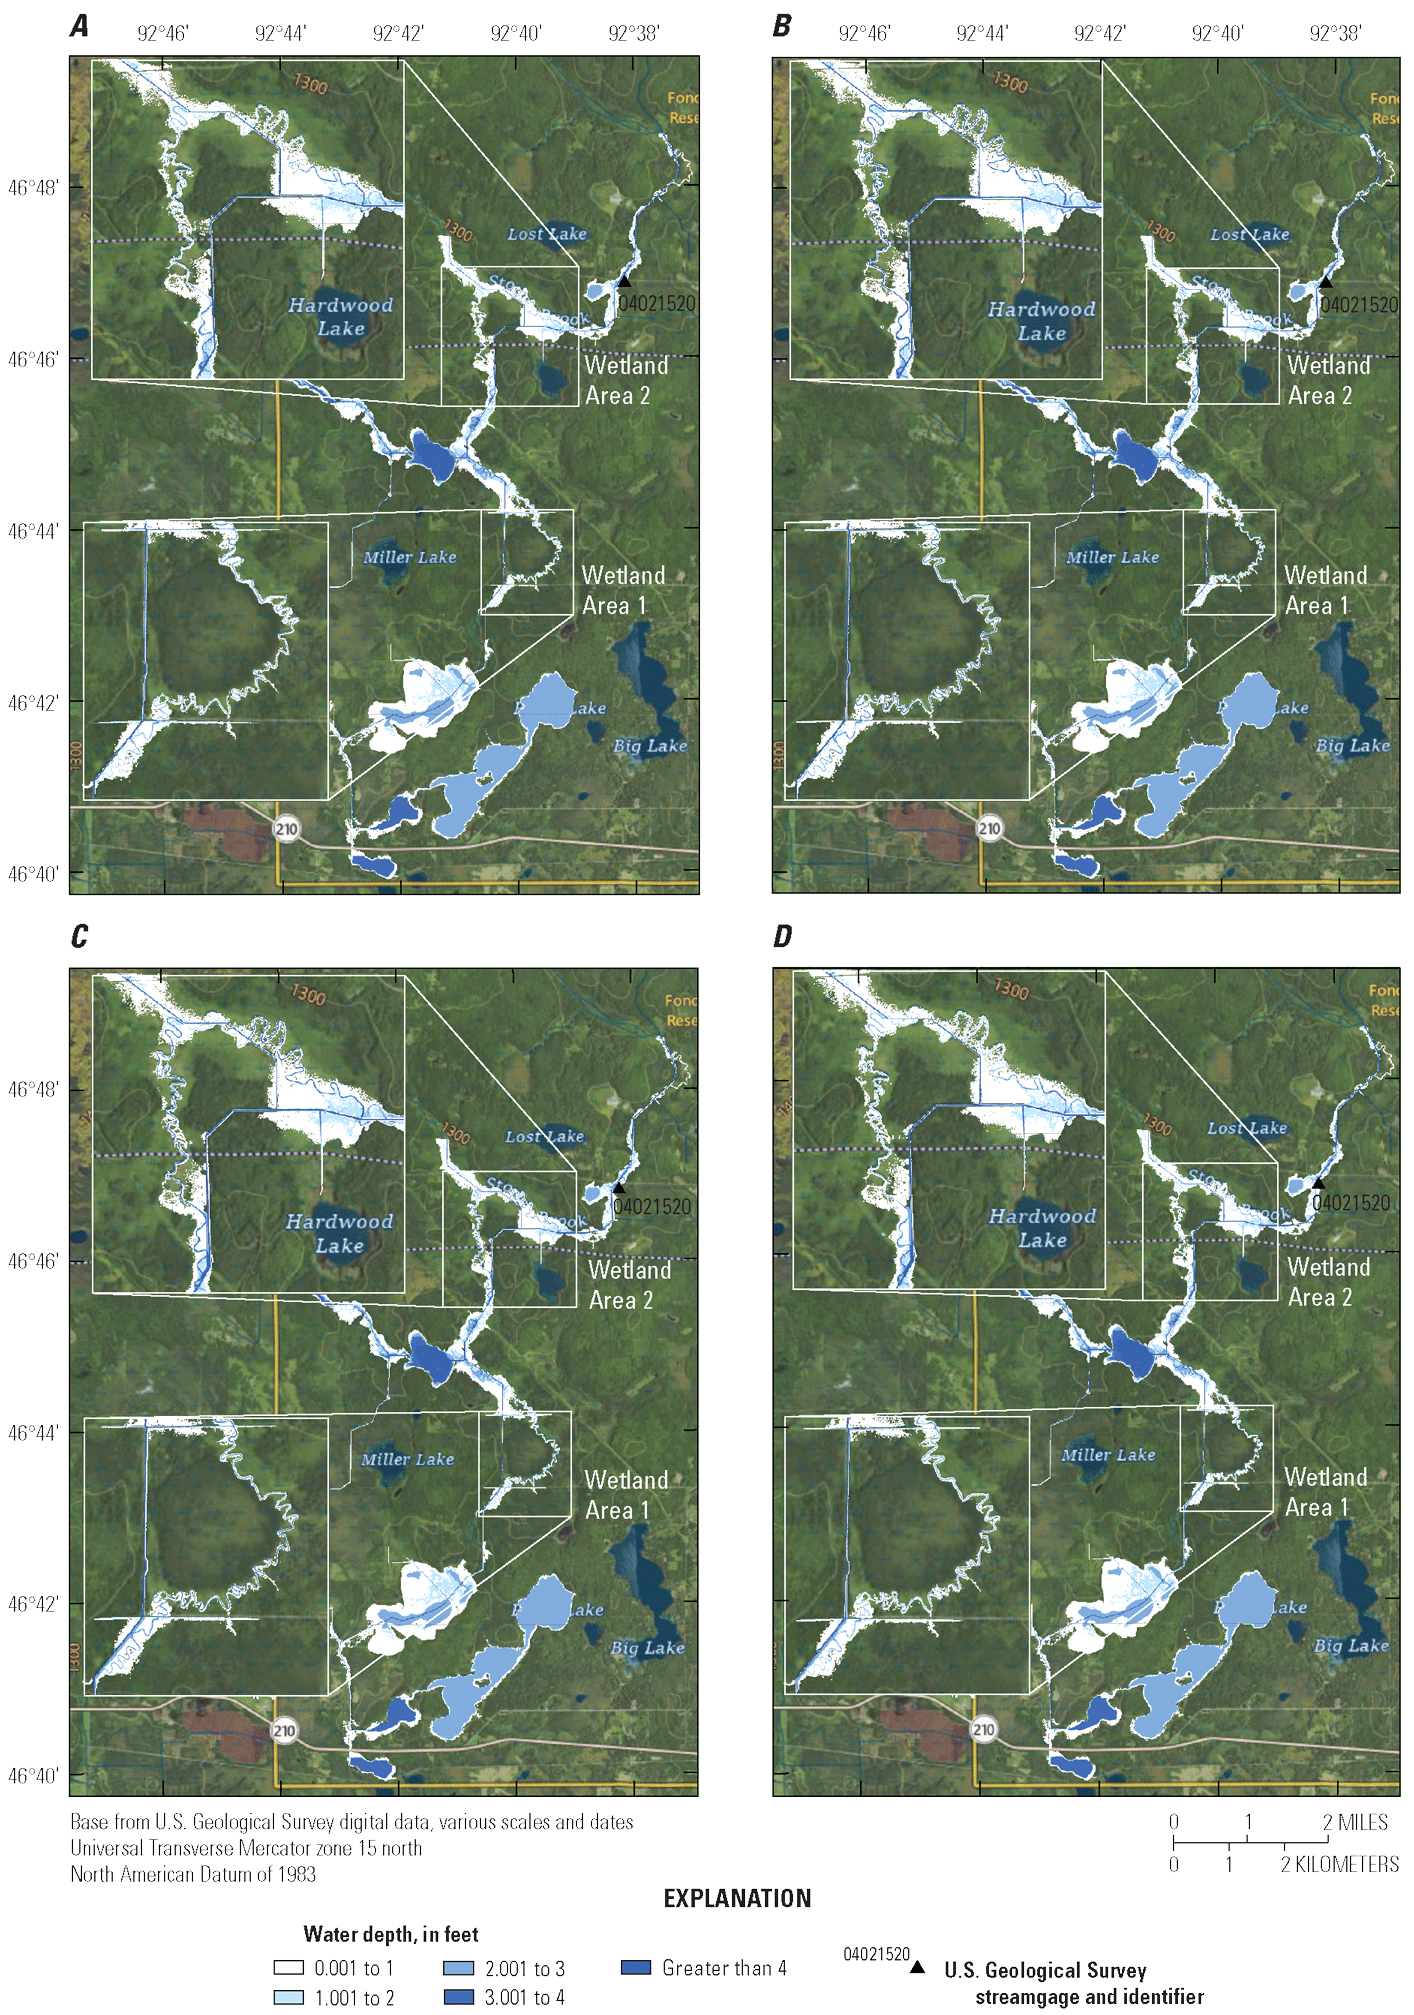
Depth of inundation during a 1-year recurrence interval rainfall event in the Stoney Brook watershed upstream from the U.S. Geological Survey streamgage Stoney Brook at Pine Drive near Brookston, Minnesota (station 04021520). A, Existing conditions. B, Original channel reconnection. C, Original channel reconnection with bank spoil breach. D, Bank spoil breach. Data from Cigrand (2024).
Results of the 2-year recurrence interval rainfall event indicated the changes in total inundation extent varied substantially by assessment area and the changes in the areal extent by duration and depth category also could be substantial (tables 11 and 12; figs. 13 and 14). The changes in overall inundation extent in Wetland Area 1 were the largest for any probabilistic event, with an increase in total inundation area of 13.7 percent (original channel reconnection) to 17.3 percent (bank spoil breach) for the channel modification alternatives relative to existing conditions (table 11). The changes in total inundation area for alternatives in Wetland Area 2 and the Lower Stoney Brook Area were minor (−3.61 to 1.45 percent). The change in inundation area again varied by duration and water depth category for the alternatives compared to existing conditions with a range of −15.6 to 55.3 percent (table 11) depending on area and duration category and −21.3 to 99.8 percent (table 12) depending on target area and depth category.
Table 11.
Effects of channel alterations on inundation duration characteristics of the Stoney Creek floodplain for the 2-year recurrence interval rainfall event. Data from Cigrand (2024).[>, greater than; --, no data]
Table 12.
Effects of channel alterations on inundation depth characteristics of the Stoney Creek floodplain for the 2-year recurrence interval rainfall event. Data from Cigrand (2024).[>, greater than; --, no data]
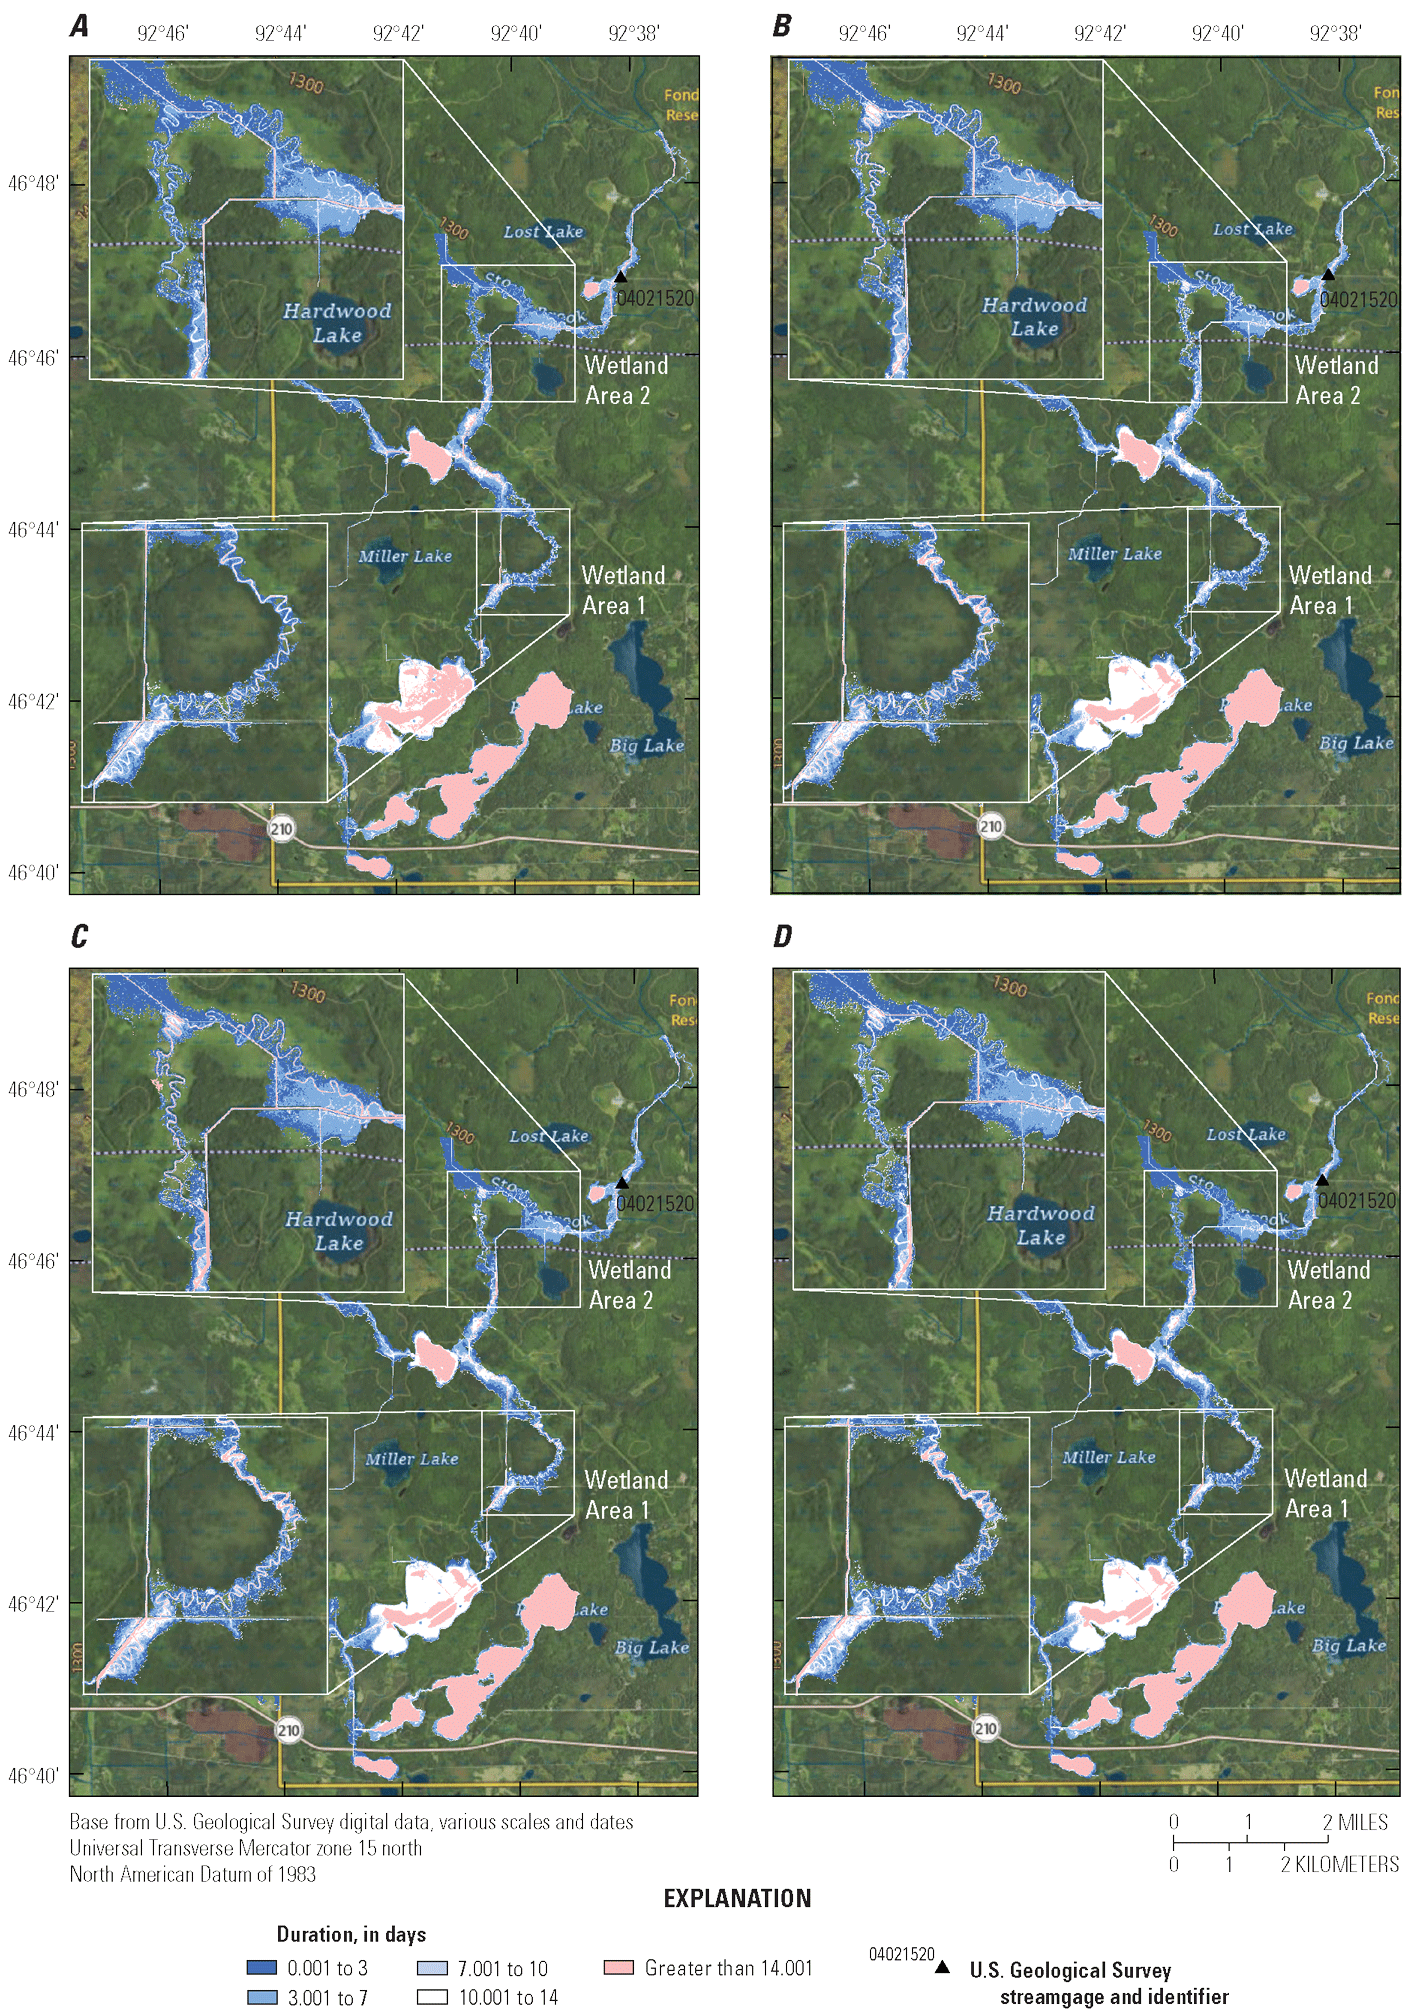
Duration of inundation during a 2-year recurrence interval rainfall event in the Stoney Brook watershed upstream from the U.S. Geological Survey streamgage Stoney Brook at Pine Drive near Brookston, Minnesota (station 04021520). A, Existing conditions. B, Original channel reconnection. C, Original channel reconnection with bank spoil breach. D, Bank spoil breach. Data from Cigrand (2024).
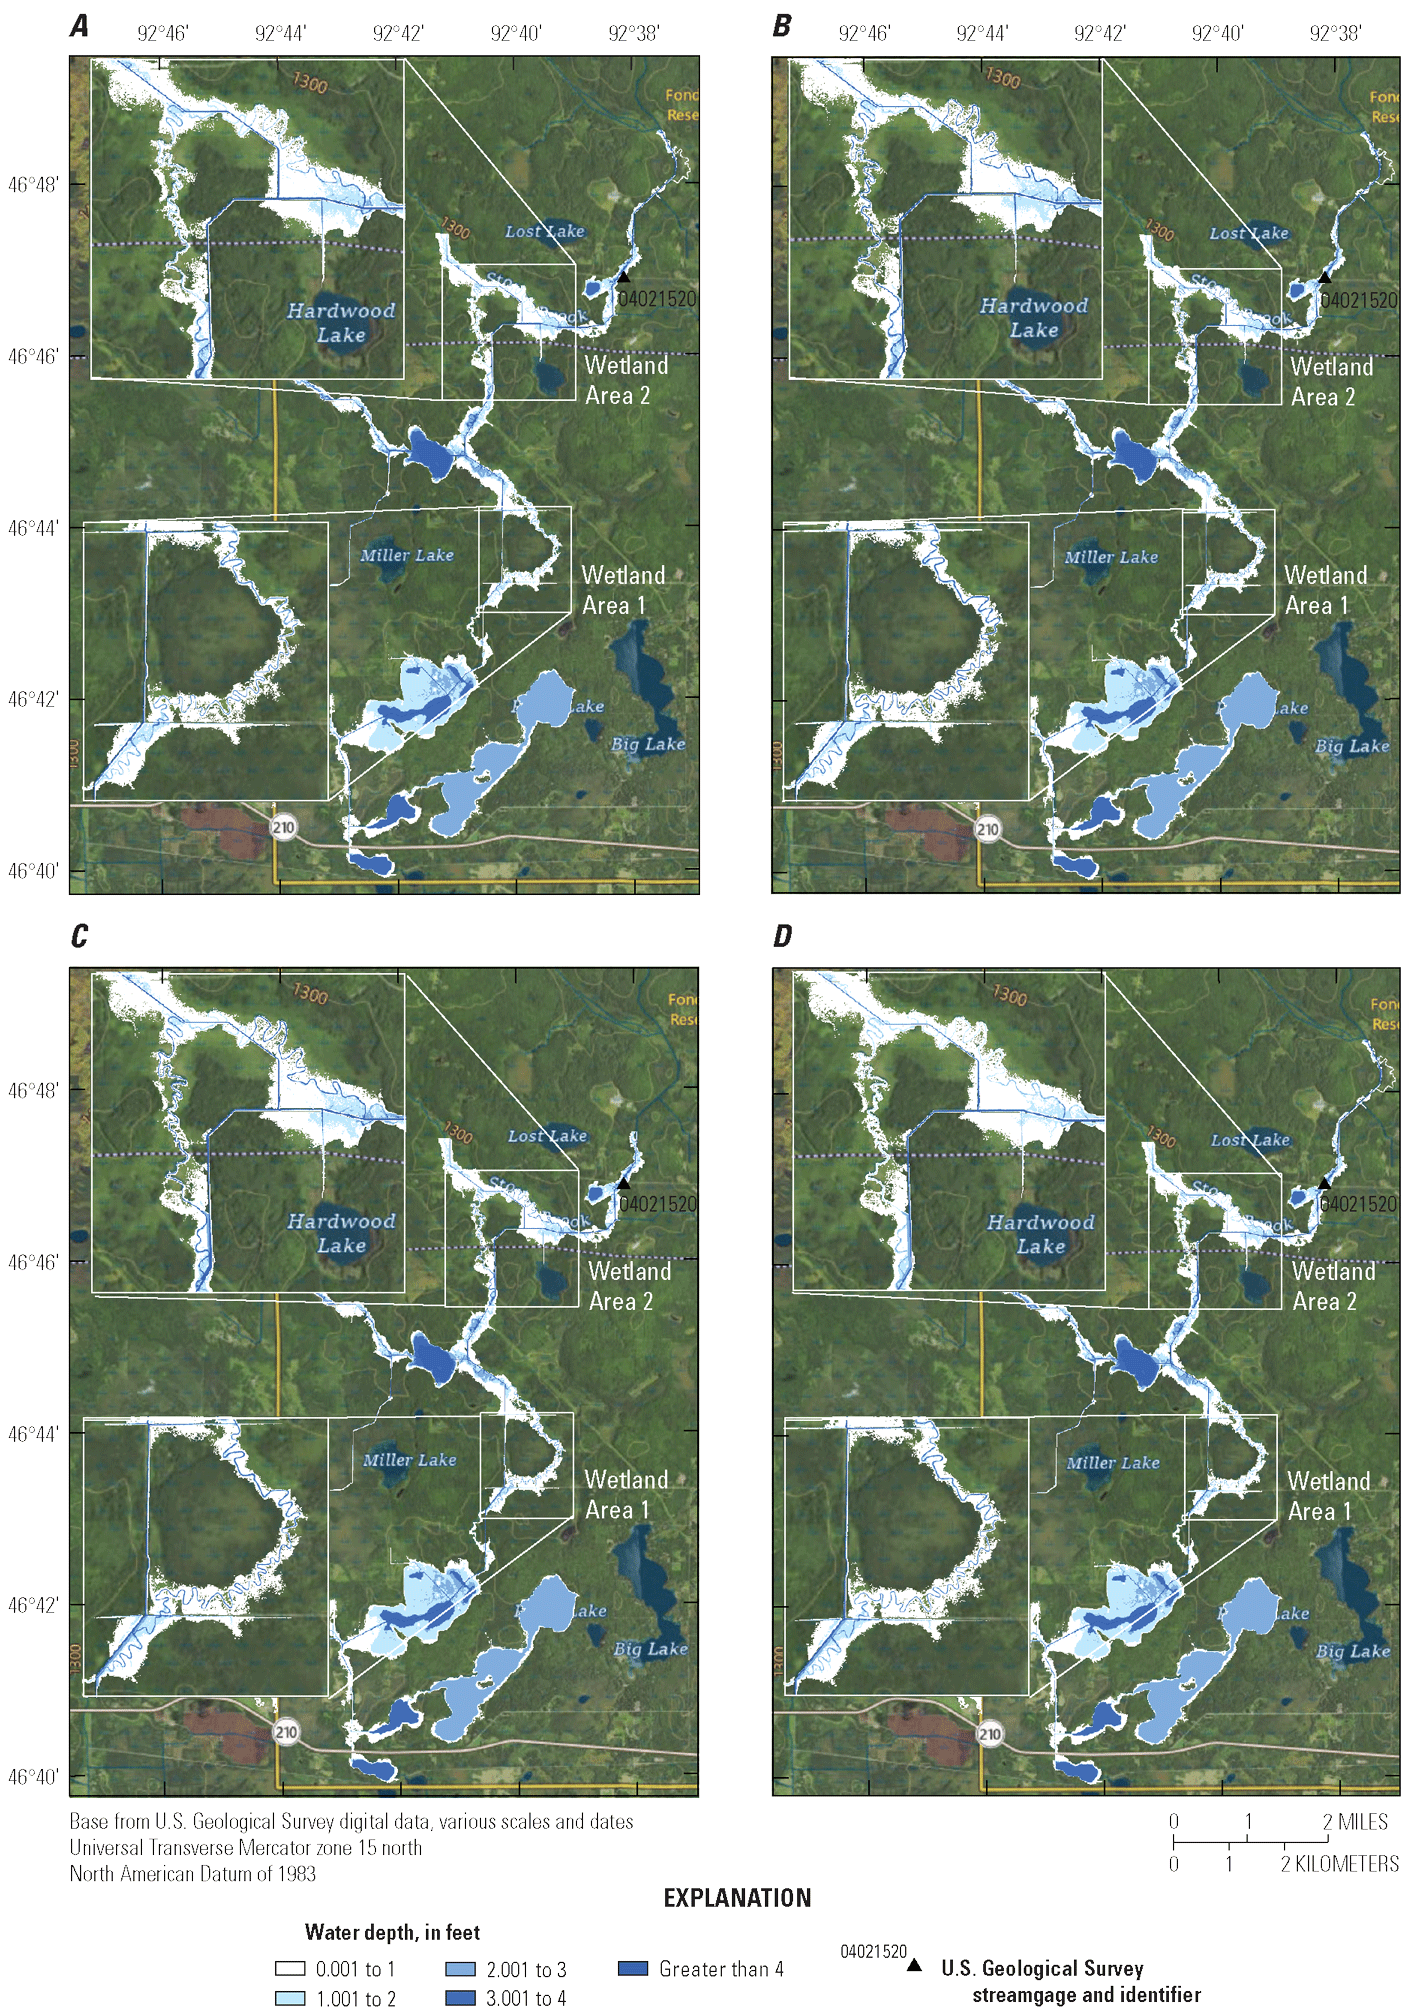
Depth of inundation during a 2-year recurrence interval rainfall event in the Stoney Brook watershed upstream from the U.S. Geological Survey streamgage Stoney Brook at Pine Drive near Brookston, Minnesota (station 04021520). A, Existing conditions. B, Original channel reconnection. C, Original channel reconnection with bank spoil breach. D, Bank spoil breach. Data from Cigrand (2024).
Results of the 5-year recurrence interval rainfall event indicated minor changes in overall inundation area by assessment area with greater changes by specified duration or depth category (table 13–14; figs. 15–16). The largest change in overall inundation extent was in Wetland Area 1 with an increase in total inundation area of 3.65 percent for the bank spoil breach alternative relative to existing conditions (table 13). The changes in total inundation area for alternatives in Wetland Area 2 and the Lower Stoney Brook Area relative to the existing conditions were negative and minor (−0.92 to −3.52 percent). The change in inundation area by duration and water depth category for the alternatives compared to existing conditions indicated a range of −16.7 to 47.3 percent (table 13) depending on area and duration category and −11.7 to 53.7 percent (table 14) depending on area and depth category.
Table 13.
Effects of channel alterations on inundation duration characteristics of the Stoney Creek floodplain for the 5-year recurrence interval rainfall event. Data from Cigrand (2024).[>, greater than; --, no data]
Table 14.
Effects of channel alterations on inundation depth characteristics of the Stoney Creek floodplain for the 5-year recurrence interval rainfall event. Data from Cigrand (2024).[>, greater than; --, no data]
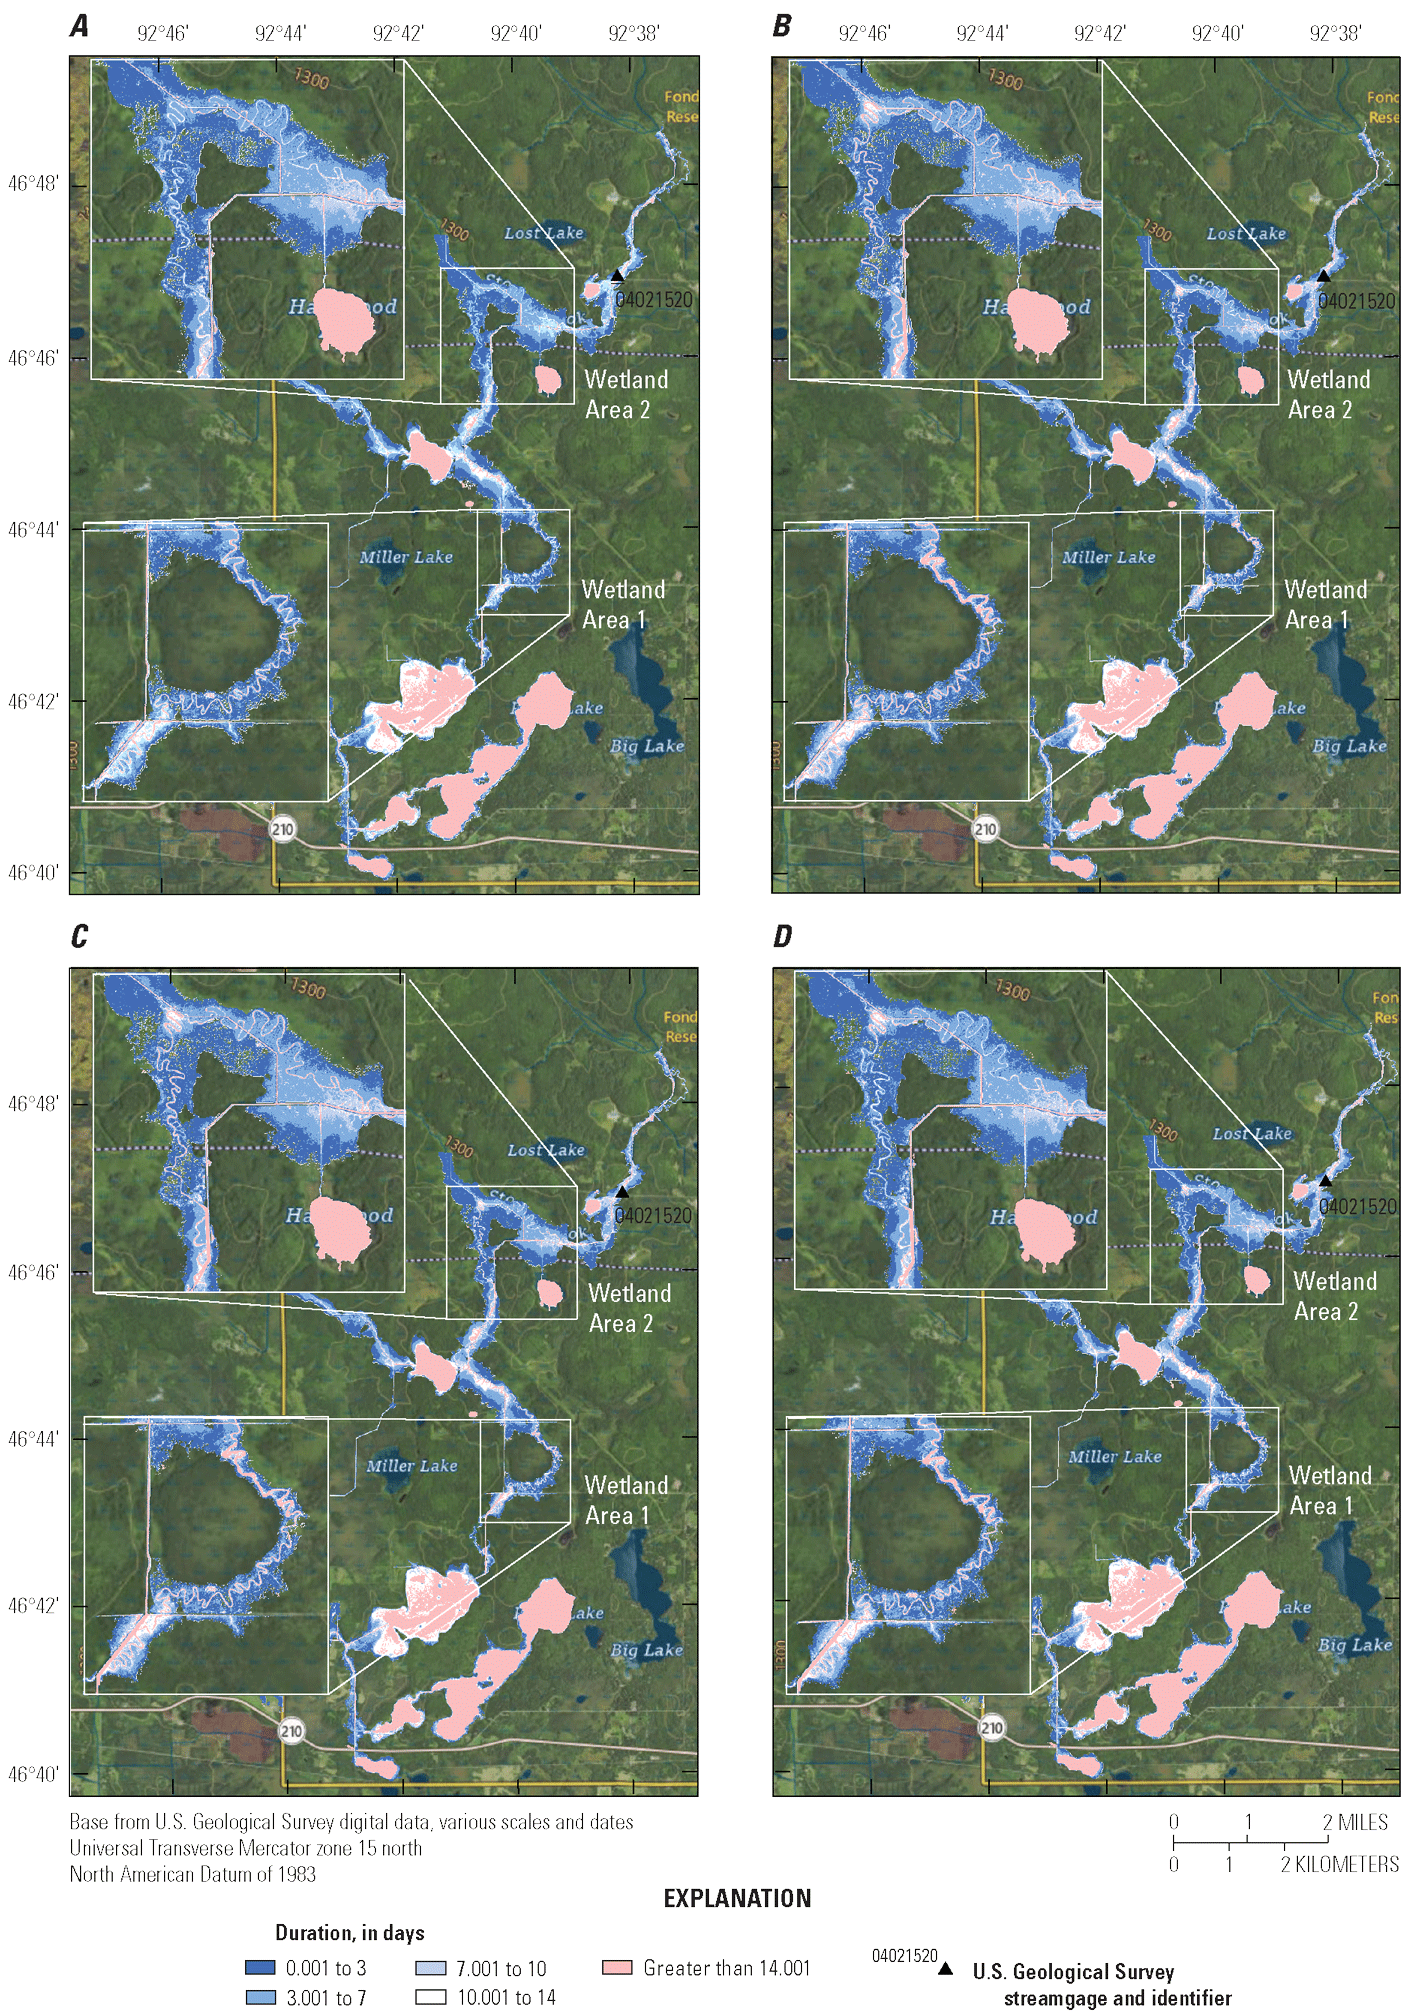
Duration of inundation during a 5-year recurrence interval rainfall event in the Stoney Brook watershed upstream from the U.S. Geological Survey streamgage Stoney Brook at Pine Drive near Brookston, Minnesota (station 04021520). A, Existing conditions. B, Original channel reconnection. C, Original channel reconnection with bank spoil breach. D, Bank spoil breach. Data from Cigrand (2024).
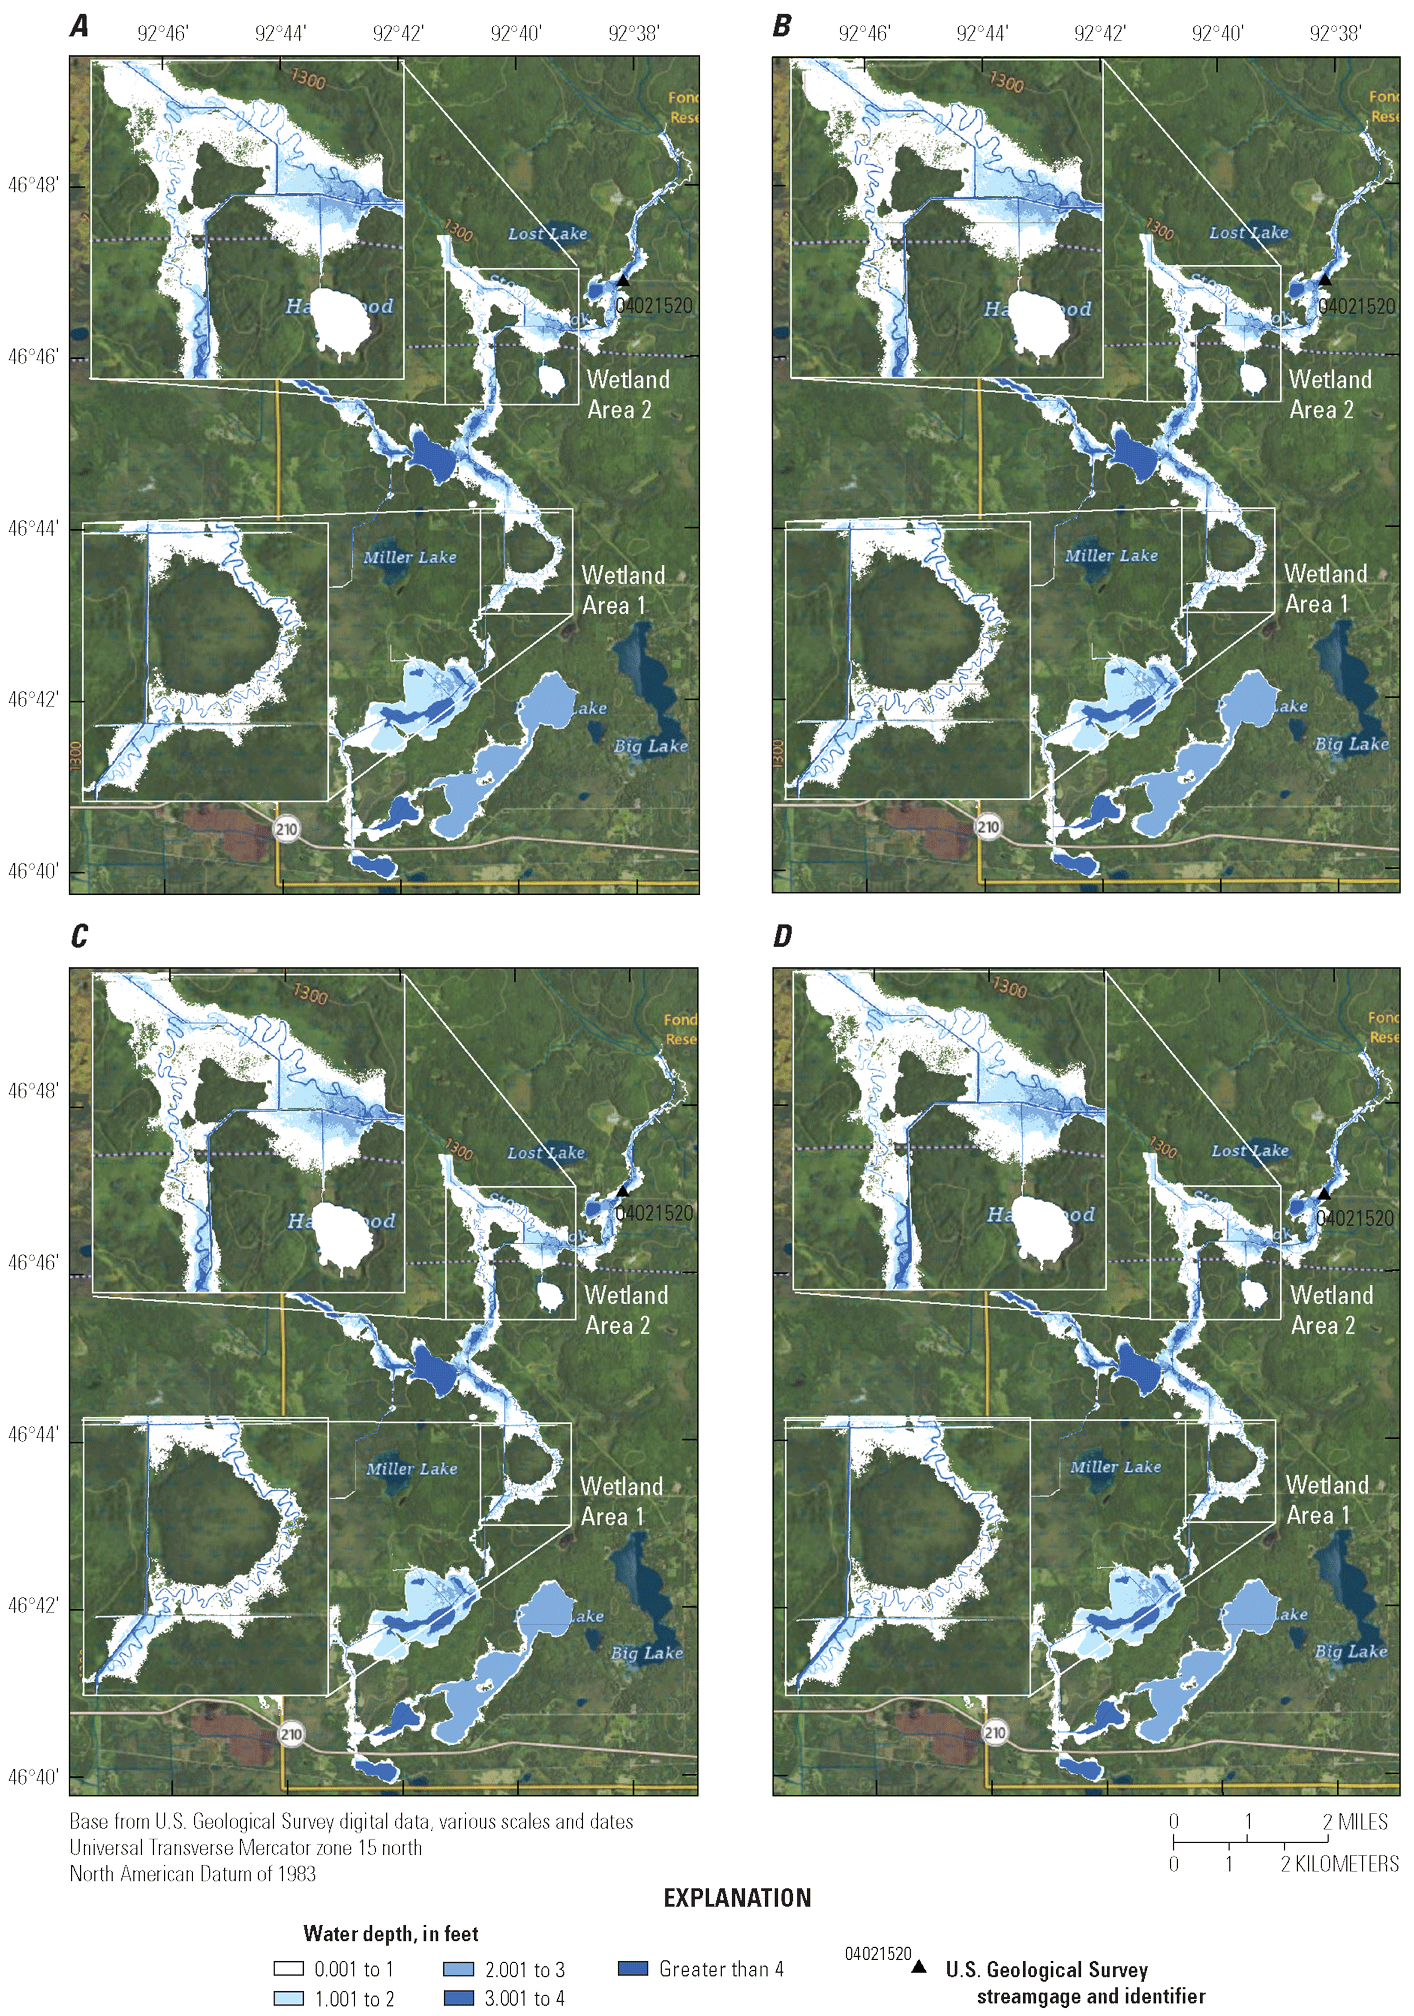
Depth of inundation during a 5-year recurrence interval rainfall event in the Stoney Brook watershed upstream from the U.S. Geological Survey streamgage Stoney Brook at Pine Drive near Brookston, Minnesota (station 04021520). A, Existing conditions. B, Original channel reconnection. C, Original channel reconnection with bank spoil breach. D, Bank spoil breach. Data from Cigrand (2024).
Results of the 10-year recurrence interval rainfall event indicated the minor changes in total inundation area was positive in Wetland Area 1 but negative in Wetland Area 2 and the Lower Stoney Brook Area, whereas changes by duration and depth category could again be substantial (tables 15–16; figs. 17–18). The largest change in overall inundation extent again was in Wetland Area 1 with an increase in total inundation area of 6.96 percent for the bank spoil breach alternative relative to existing conditions (table 15). The changes in total inundation area for alternatives in Wetland Area 2 and the Lower Stoney Brook Area were negative and minor (−0.16 to −1.77 percent). The change in inundation area by duration and water depth category for the alternatives compared to existing conditions indicated a range of −23.7 to 38.5 percent (table 15) depending on area and duration category and −17.7 to 45.5 percent (table 16) depending on area and depth category. Generally, the channel modification alternatives produced increases in the higher depth (3–4 ft and greater than 4 ft) and duration (10–14 days and greater than 14 days) categories for the Wetland Area 1, Wetland Area 2, and the Lower Stoney Brook Area, which could be beneficial to increases in wetland coverage and floodplain storage.
Table 15.
Effects of channel alterations on inundation duration characteristics of the Stoney Creek floodplain for the 10-year recurrence interval rainfall event. Data from Cigrand (2024).[>, greater than; --, no data]
Table 16.
Effects of channel alterations on inundation depth characteristics of the Stoney Creek floodplain for the 10-year recurrence interval rainfall event. Data from Cigrand (2024).[>, greater than; --, no data]
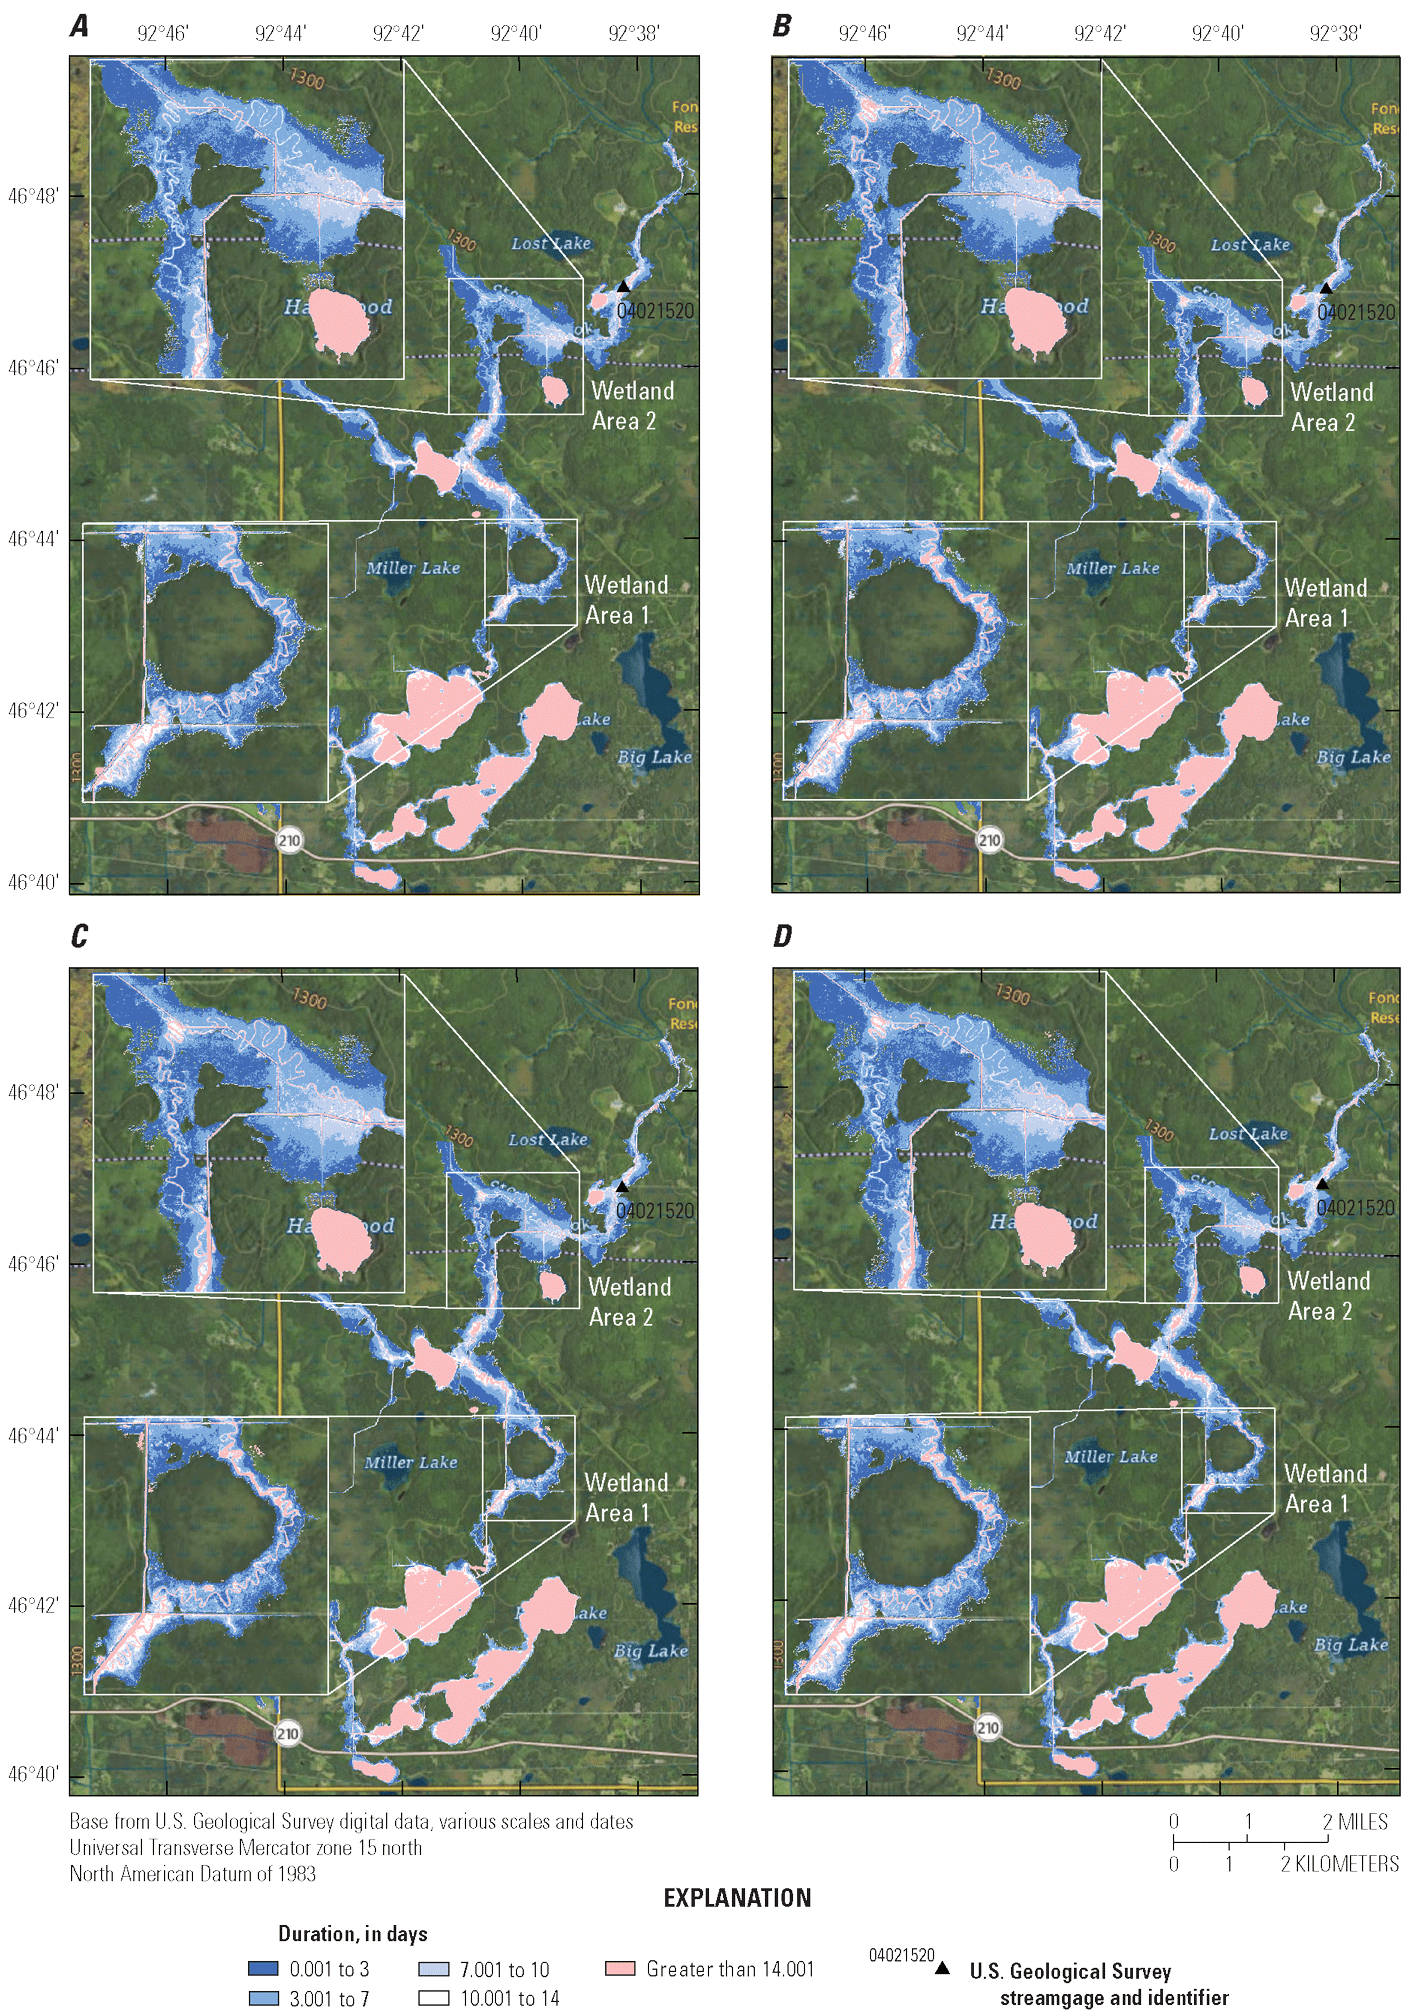
Duration of inundation during a 10-year recurrence interval rainfall event in the Stoney Brook watershed upstream from the U.S. Geological Survey streamgage Stoney Brook at Pine Drive near Brookston, Minnesota (station 04021520). A, Existing conditions. B, Original channel reconnection. C, Original channel reconnection with bank spoil breach. D, Bank spoil breach. Data from Cigrand (2024).
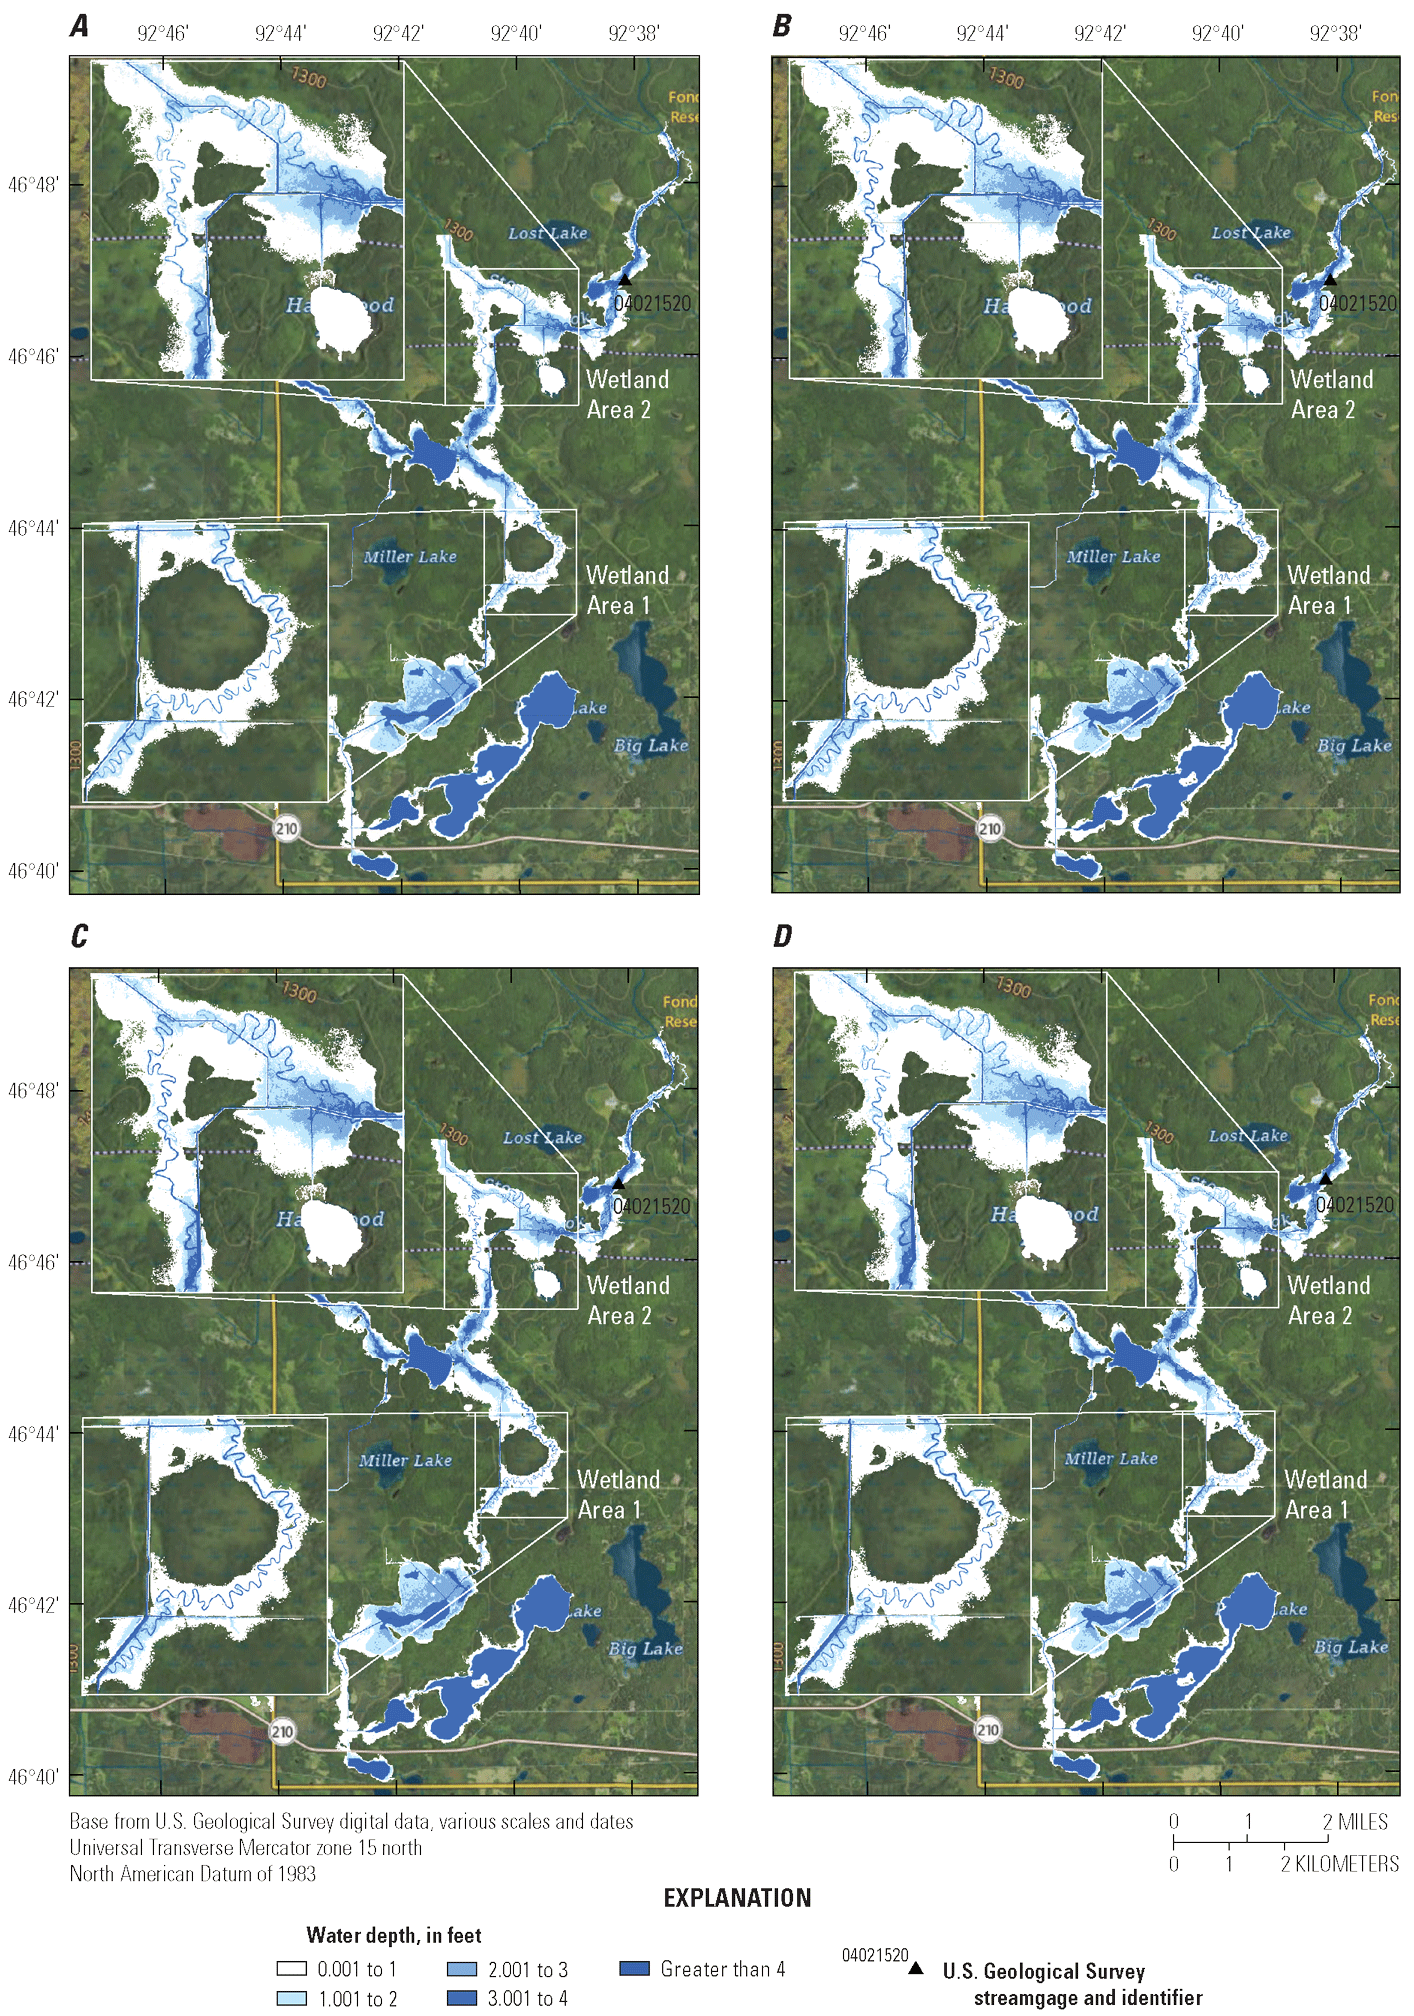
Depth of inundation during a 10-year recurrence interval rainfall event in the Stoney Brook watershed upstream from the U.S. Geological Survey streamgage Stoney Brook at Pine Drive near Brookston, Minnesota (station 04021520). A, Existing conditions. B, Original channel reconnection. C, Original channel reconnection with bank spoil breach. D, Bank spoil breach. Data from Cigrand (2024).
Sensitivity Analysis
The sensitivity of the Stoney Brook hydraulic model to modifications in channel conditions was assessed by quantifying the differences in selected lake water-level conditions and floodplain inundation conditions under alternatives. A baseline condition using the original channel with bank spoil breaches for the 10-year recurrence interval rainfall event was modified to develop six hydraulic sensitivity analysis scenarios:
-
1. 1-ft increase in the main channel checkdam height—This scenario increased checkdam heights in the main channel (Stoney Brook ditch) by 1 ft to equal the height of the spoil breaches.
-
2. 3-ft increase in the main channel checkdam height—This scenario increased checkdam heights in main channel (Stoney Brook ditch) by 3 ft.
-
3. No additional culverts on first and second bridge—For this scenario, no additional culverts were added for original channel reconnection that was used in scenario model runs.
-
4. No checkdams in main channel—For this scenario, no checkdams were in the main channel.
-
5. No checkdams in all channels—For this scenario, all checkdams were removed from the main and original channels.
-
6. Decreased bank spoil breach length to 300 ft—For this scenario, the length of the spoil breaches was shortened from 2,000 to 300 ft.
The sensitivity of selected lakes to changes in channel characteristics was assessed by comparing peak and ending lake-water levels of the baseline and sensitivity analysis scenarios. The sensitivity of the modeled Stoney Brook floodplain conditions was assessed by comparing total inundation area, inundation area by duration category, and inundation area by depth category for the baseline and six sensitivity analysis scenarios.
The peak WSEs in Deadfish Lake and Rice Portage Lake were insensitive to almost all the sensitivity analysis scenarios because only the 3-ft increase to the checkdam heights in the main channel (change of 0.1 ft) resulted in a WSE change of greater than plus or minus (±) 0.05 ft (table 17). The drawdown of the lake-water levels was more sensitive to the channel modifications because the 1-ft and 3-ft increases to the checkdam heights in the main channel resulted in an increase for the end of the 20-day simulation period of lake-water levels in Deadfish Lake by 0.35 ft and 1.75 ft, respectively, and the increase of water levels in Rice Portage Lake by 0.06 ft and 0.73 ft, respectively.
Table 17.
Sensitivity analysis of simulated lake water-surface elevations to modifications of the original channel with spoil breach alternative. Data from Cigrand (2024).[WSE, water-surface elevation (feet above the North American Datum of 1988); --, no data]
The management alternatives to which total wetland inundation was most sensitive included the “3-ft increase in the main channel checkdam height” and the scenario “No additional culverts on first and second bridges.” The “3-ft increase in the main channel checkdam height” resulted in an increase in total inundation area of 2.66 to 6.67 percent depending on area, and the “No additional culverts on first and second bridges” resulted in a change in inundation area of −6.97 to 0.79 depending on selected area (table 18). All other alternatives resulted in maximum change in total inundation area of −0.83 to 1.10 percent. The greatest percentage change in inundation by duration category and depth category also was primarily associated with the “3-ft increase in the main channel checkdam height.” Changes from the base condition for these two scenarios ranged from −24.7 to 42.7 for the duration categories (table 18) and −25.3 to 17.3 for depths (table 19). The changes in inundation area by duration and depth categories for other alternatives generally were less than ±5 percent for duration categories and less than ±2 percent for depth categories.
Table 18.
Sensitivity analysis of simulated floodplain inundation duration characteristics to modifications of the original channel with spoil breach alternative. Data from Cigrand (2024).[>, greater than; --, no data]
Table 19.
Sensitivity analysis of simulated floodplain inundation depth characteristics to modifications of the original channel with spoil breach alternative. Data from Cigrand (2024).[>, greater than; --, no data]
Uncertainties and Limitations Regarding Use of Hydrologic and Hydraulic Model Results
Although the generated flows represent the water elevations and boundaries of inundated areas with a distinct line, some uncertainty is associated with these simulations. The WSEs in the study area were estimated by unsteady-state hydraulic modeling, assuming unobstructed flow, and used flows and hydrologic conditions anticipated at the Stoney Brook main stem and tributaries. The hydraulic model reflects the land-cover characteristics and any bridge, culvert, bank spoil, gated lake outlet, or other hydraulic structures existing as of July 2021. Unique meteorological factors (timing and distribution of precipitation) may cause actual flows along the modeled reach to vary from those assumed during a flood, which may lead to deviations in the WSEs and areas of inundation boundaries shown. Additional areas may be flooded because of unanticipated conditions such as changes in the streambed elevation or roughness, backwater into major tributaries along a river main stem, or backwater from localized debris or ice jams. The accuracy of the water-elevation profiles and floodwater extent portrayed on these maps also will vary with the accuracy of the DEM used to simulate the land surface.
Additional uncertainties may be inherent or factored into the simulation of flows generated from rainfall-runoff simulations. A hydrologic model was used to simulate flows associated with various probabilistic precipitation amounts. The precipitation was assumed to follow a defined temporal distribution during the duration of the event and an even spatial distribution throughout the watershed. The actual temporal and spatial distribution of precipitation may vary, thereby affecting the timing and magnitude of the flows in the main stem or tributary. A single “simple” storm was simulated with a near-base-flow starting condition. For multiple compounding precipitation events, the starting flow condition may be considerably higher than base flow and, therefore, the peak condition also will be higher than simulated conditions. Other sources of uncertainty will arise from the selection of the appropriate antecedent runoff condition and the occurrence of atypical precipitation events including rainfall on frozen ground or on a substantial existing snowpack, all of which may affect the timing and magnitude of the simulated flows.
Summary
The U.S. Geological Survey, in cooperation with the Fond du Lac Band of Lake Superior Chippewa (FDLB), studied the effects of channel modification alternatives on lake levels and floodplain inundation in the Stoney Brook watershed in northeast Minnesota. Northern wild rice (Zizania palustris) also referred to as manoomin by the Ojibwe/Chippewa people, is a natural and cultural resource to the FDLB and is sensitive to water levels and rates of water-level changes, particularly during the early stages of growth. Drainage ditches constructed in the early 1900s in the Stoney Brook watershed lowered lake-water levels, caused greater fluctuations in lake levels, and created a loss in wetland coverage. The FDLB is committed to minimizing large fluctuations of the lakes with natural wild rice production in the Stoney Brook watershed and restoring lake levels to the previous conditions before the drainage ditch construction. The FDLB looks to restore a more natural hydrology to Stoney Brook by exploring alternatives utilizing the remnant Stoney Brook channel and increasing potential storage and wetland coverage in the Stoney Brook floodplain. The hydrologic response of these lakes and floodplain storage to simulated channel modification alternatives were examined.
Hydrologic and hydraulic models were developed for the watershed and calibrated to historical rainfall events. A hydrologic model, Hydrologic Engineering Center–Hydrologic Modeling System (HEC–HMS), was used to simulate the timing and magnitude of streamflow for the Stoney Brook watershed. An unsteady flow two-dimensional hydraulic model, Hydrologic Engineering Center–River Analysis System (HEC–RAS), was used to simulate streamflows and water levels in the lakes. The models used probabilistic frequency rainfall events of 24-hour duration for 1-, 2-, 5-, and 10-year annual recurrence intervals (100-, 50-, 20-, and 10-percent annual exceedance probability) to simulate watershed management scenarios with existing and alternative conditions. The hydraulic model outputs for peak flows, volume accumulation, water levels, and inundation duration and depths were assessed to quantify the effects of the channel modification alternatives.
For channel modification alternatives, three breaches to the bank spoils were made along Stoney Brook to reconnect the floodplain and not confine flows within the ditching and bank spoils. The original channel was reconnected to the main channel, cleared of silt and debris deposition, and furnished with additional culverts at road crossings. Five checkdams were added to the terrain to enable a flow diversion from the main channel to the original channel and to pool areas in the original channel. The channel modification alternatives were simulated with four different terrain conditions: existing conditions, bank spoil breach, original channel reconnection, and original channel reconnection with bank spoil breach. Hydrologic characteristics from six distinct areas were used in the model to evaluate the effects from the channel modification alternatives: Deadfish Lake, the Lower Stoney Brook Area, Pine Drive bridge, Rice Portage Lake, Wetland Area 1, and Wetland Area 2.
The simulated results of Deadfish Lake and Rice Portage Lake had small differences of peak water-surface elevations from the channel modification alternatives and existing conditions ranging from –0.09 to 0.03 foot (ft). Both lakes had higher water-surface elevations at the end of the 20-day simulation period under the alternatives, with Deadfish Lake varying from 0.34 to 0.73 ft and Rice Portage Lake varying from 0.04 to 0.13 ft higher than existing conditions. These results demonstrated that the lakes would take longer to draw down with the channel modification alternatives, especially water levels in Deadfish Lake.
Wetland Area 1 had an increase in flows for the channel modification alternatives that could be considered somewhat substantial when compared to the flows with existing conditions, and the increase in volume accumulations were more pronounced for the channel modification alternatives. Wetland Area 2 had a substantial increase in peak flows and volume accumulations with the original channel reconnection and the original channel reconnection with bank spoil breach. The results demonstrate there are little conveyance improvements at the Pine Drive bridge because the channel modification alternatives were within 2 percent of peak flows. Wetland Area 2 produced the largest increase in flows and conveyance for the alternative scenarios.
The inundation extent, duration, and water-depth distribution were assessed within selected floodplain areas: Wetland Area 1, Wetland Area 2, and the Lower Stoney Brook Area. The alternative scenarios of floodplain dynamics indicated that the results varied by probabilistic event, management alternative, and duration and depth category. The most consistent increase in total inundated area was achieved through the spoil breach alternative, with changes in duration and depth subcategories yielding highly variable results for each probabilistic event. With the 1-year recurrence interval rainfall event, the overall changes in total inundation extent were minor, but the changes in the areal extent by duration and depth category could be substantial (from −22.5 to 128 percent). Results of the 2-year recurrence interval rainfall event indicated the changes in total inundation extent varied substantially by assessment area and the changes in the areal extent by duration and depth category also could be substantial. The change in overall inundation extent in Wetland Area 1 were the largest for any probabilistic event with an increase in total inundation area of 13.7 percent (original channel reconnection) to 17.3 percent (bank spoil breach) for the channel modification alternatives relative to existing conditions. The changes in total inundation area for channel modification alternatives in Wetland Area 2 and the Lower Stoney Brook Area were minor. The change in inundation area again varied by duration and water depth category for the alternatives compared to existing conditions with a range of −21.3 to 99.8 percent depending on target area, depth category, and duration category. Results of the 5- and 10-year recurrence interval rainfall events indicated minor changes in overall inundation area by assessment area with greater changes (from −23.7 to 53.7 percent) by specified duration or depth category. Generally, the channel modification alternatives produced increases in the higher depth (3–4 ft and greater than 4 ft) and duration (10–14 days and greater than 14 days) categories for the Wetland Area 1, Wetland Area 2, and the Lower Stoney Brook Area, which may be beneficial to increases in wetland coverage and floodplain storage.
References Cited
Cigrand, C.V., 2024, Archive of hydraulic and hydrologic models used in the Stoney Brook watershed in Carlton and St. Louis Counties, Minnesota, 2008–2024: U.S. Geological Survey data release, accessed December 9, 2024, at https://doi.org/10.5066/P13KFQSL.
Clark, C.O., 1945, Storage and the unit hydrograph: Transactions of the American Society of Civil Engineers, v. 110, no. 1, p. 1419–1488. [Also available at https://doi.org/10.1061/TACEAT.0005800.]
Cloquet Forestry Center, 2021, Weather: University of Minnesota Cloquet Forestry Center web page, accessed August 2021 at https://cfc.cfans.umn.edu/weather.
Czuba, C.R., Fallon, J.D., and Kessler, E.W., 2012, Floods of June 2012 in northeastern Minnesota: U.S. Geological Survey Scientific Investigations Report 2012–5283, 42 p., with 3 app. [Also available at https://doi.org/10.3133/sir20125283.]
Dewitz, J., 2019, National Land Cover Database (NLCD) 2016 products (ver. 2.0, July 2020): U.S. Geological Survey data release, accessed October 20, 2021, at https://doi.org/10.5066/P96HHBIE.
Fisk, H.N., 1944, Geological investigation of the alluvial valley of the Lower Mississippi River: Vicksburg, Mississippi, The War Department, U.S. Army Corps of Engineers–conducted for the Mississippi River Commission, p. 5. [Also available at https://usace.contentdm.oclc.org/digital/collection/p266001coll1/id/10015/.]
Fleming, M.J., and Doan, J.H., 2013, HEC-GeoHMS—Geospatial hydrologic modeling extension (ver. 10.1, February 2013): Davis, Calif., U.S. Army Corps of Engineers, Institute for Water Resources, Hydrologic Engineering Center, 193 p. [Also available at https://www.hec.usace.army.mil/software/hec-geohms/documentation/HEC-GeoHMS_Users_Manual_10.1.pdf.]
Fond du Lac Band of Lake Superior Chippewa, 2008, Fond du Lac Resource Management—2008 Integrated Resource Management Plan: University of Minnesota, 91 p., accessed February 6, 2025, at https://hdl.handle.net/11299/189239.
Gupta, H.V., Sorooshian, S., and Yapo, P.O., 1999, Status of automatic calibration for hydrologic models—Comparison with multilevel expert calibration: Journal of Hydrologic Engineering, v. 4, no. 2, p. 135–143. [Also available at https://doi.org/10.1061/(ASCE)1084-0699(1999)4:2(135).]
Hedin, K.J., 2021, Fond du Lac Reservation nonpoint source management plan: Fond du Lac Environmental Program, prepared by Fond du Lac Office of Water Protection, Environmental Program, Resource Management Division, Cloquet, Minn., 96 p., accessed August 7, 2023, at https://cms3.revize.com/revize/fonddulac/Documents/Service/Resource%20Management/Water/NPSManagementPlan2021.pdf.
Heidemann, H.K., 2012, Lidar base specification (version 1.0, August 2012): U.S. Geological Survey Techniques and Methods, book 11, chap. B4, 63 p. [Also available at https://doi.org/10.3133/tm11B4.]
Minnesota Board of Water and Soil Resources, 2018, Wetland management classification system: Minnesota Board of Water and Soil Resources web page, 17 p., accessed May 8, 2024, at https://bwsr.state.mn.us/sites/default/files/2018-12/WETLANDS_Function_MnRAM_Wetland_Mgmt_Classification_Guidance.pdf.
Minnesota Department of Natural Resources, 2020, Lidar elevation, Arrowhead Region, NE Minnesota, 2011: Minnesota Department of Natural Resources database, accessed March 18, 2024, at https://resources.gisdata.mn.gov/pub/gdrs/data/pub/us_mn_state_mngeo/elev_lidar_arrowhead2011/metadata/metadata.html.
Minnesota Department of Natural Resources, 2024, Wetlands: Minnesota Department of Natural Resources web page, accessed May 6, 2024, at https://www.dnr.state.mn.us/wetlands/index.html#:~:text=Wetlands%20are%20classified%20based%20on,a%20number%20of%20Minnesota%20statutes.
Moriasi, D.N., Arnold, J.G., Van Liew, M.W., Bingner, R.L., Harmel, R.D., and Veith, T.L., 2007, Model evaluation guidelines for systematic quantification of accuracy in watershed simulations: Transactions of the ASABE, v. 50, no. 3, p. 885–900. [Also available at https://doi.org/10.13031/2013.23153.]
Nash, J.E., and Sutcliffe, J.V., 1970, River flow forecasting through conceptual models part 1—A discussion of principles: Journal of Hydrology, v. 10, no. 3, p. 282–290. [Also available at https://doi.org/10.1016/0022-1694(70)90255-6.]
National Oceanic and Atmospheric Administration, 2022, NEXRAD data archive, inventory and access: National Centers for Environmental Information, accessed October 10, 2022, at https://www.ncdc.noaa.gov/nexradinv/.
Natural Resources Conservation Service, 1986, Urban hydrology for small watersheds—TR-55: Washington, D.C., U.S. Department of Agriculture, 98 p. [Also available at https://www.nrc.gov/docs/ML1421/ML14219A437.pdf.]
Natural Resources Conservation Service, 2004, Estimation of direct runoff from storm rainfall, chap. 10 of the National Engineering Handbook, Part 630—Hydrology: Washington, D.C., U.S. Department of Agriculture, 51 p. [Also available at https://directives.nrcs.usda.gov/sites/default/files2/1712930608/7300.pdf.]
Palecki, M., Durre, I., Applequist, S., Arguez, A., and Lawrimore, J., 2021, U.S. Climate Normals 2020: U.S. Hourly Climate Normals (1991-2020). National Oceanic Atmospheric Administration, National Centers for Environmental Information, webpage accessed May 6, 2024, at https://www.ncei.noaa.gov/access/us-climate-normals/.
Perica, S., Martin, D., Pavlovic, S., Roy, I., St. Laurent, M., Trypaluk, C., Unruh, D., Yekta, M., and Bonnin, G., 2013, Precipitation-frequency atlas of the United States (Volume 8, Version 2.0—Midwestern States [Colorado, Iowa, Kansas, Michigan, Minnesota, Missouri, Nebraska, North Dakota, Oklahoma, South Dakota, Wisconsin]): Silver Spring, Md., U.S. Department of Commerce, National Oceanic and Atmospheric Administration, National Weather Service, National Oceanic and Atmospheric Administration Atlas 14, 295 p. [Also available at https://geodesy.noaa.gov/library/pdfs/NOAA_Atlas_0014_Vol_0008.pdf.]
Ruhl, J.F., 1989, Water resources of the Fond du Lac Indian Reservation, east-central Minnesota: U.S. Geological Survey Water-Resources Investigations Report 88–4114, 42 p. [Also available at https://doi.org/10.3133/wri884114.]
Rydlund, P.H., Jr., and Densmore, B.K., 2012, Methods of practice and guidelines for using survey-grade global navigation satellite systems (GNSS) to establish vertical datum in the United States Geological Survey: U.S. Geological Survey Techniques and Methods, book 11, chap. D1, 102 p. with appendixes. [Also available at https://doi.org/10.3133/tm11D1.]
U.S. Army Corps of Engineers, 1994, Engineering and design—Flood-runoff analysis [Engineer manual 1110–2–1417]: Washington D.C., Department of the Army, U.S. Army Corps of Engineers, 196 p. [Also available at https://www.publications.usace.army.mil/Portals/76/Publications/EngineerManuals/EM_1110-2-1417.pdf?ver=VFC-A5m2Q18fxZsnv19U8g%3d%3d.]
U.S. Army Corps of Engineers, 2018, Hydrologic Engineering Center Hydrologic Modeling System HEC–HMS 4.3 user’s manual: U.S. Army Corps of Engineers software release, accessed October 10, 2022, at https://www.hec.usace.army.mil/software/hec-hms/downloads.aspx.
U.S. Army Corps of Engineers, 2020, Energy loss coefficients, in U.S. Army Corps of Engineers, HEC–RAS—River analysis system—Hydraulic reference manual (ver. 6.0 Beta, December 2020): Davis, Calif., U.S. Army Corps of Engineers, Hydrologic Engineering Center, accessed October 2, 2023, at https://www.hec.usace.army.mil/confluence/rasdocs/ras1dtechref/latest/basic-data-requirements/geometric-data/energy-loss-coefficients.
U.S. Army Corps of Engineers, 2021, HEC–RAS 2D user’s manual: U.S. Army Corps of Engineers, 259 p., accessed October 2, 2023, at https://www.hec.usace.army.mil/confluence/rasdocs/r2dum/latest.
U.S. Army Corps of Engineers, 2023, HEC–RAS version 6.4.1: U.S. Army Corps of Engineers software release, accessed October 2, 2023, at https://www.hec.usace.army.mil/software/hec-ras/download.aspx.
U.S. Department of Agriculture, 2021, Geospatial data gateway: U.S. Department of Agriculture Natural Resources Conservation Service web page, accessed October 10, 2022, at https://datagateway.nrcs.usda.gov/.
U.S. Geological Survey, 2023a, Stoney Brook at Pine Drive near Brookston, MN—04021520, in USGS water data for the Nation: U.S. Geological Survey National Water Information System database, accessed October 2, 2023, at https://doi.org/10.5066/F7P55KJN. [Site information directly accessible at https://waterdata.usgs.gov/monitoring-location/04021520/#parameterCode=00065&showMedian=false&period=P7D.]
U.S. Geological Survey, 2023b, USGS water data for the Nation: U.S. Geological Survey National Water Information System database, accessed October 2, 2023, at https://doi.org/10.5066/F7P55KJN. [Surface-water data directly accessible at https://waterdata.usgs.gov/nwis/sw.]
Zepp, G., Harwood, J., and Somwaru, A., 1996, Wild rice—An economic assessment of the feasibility of providing multiple-peril crop insurance: U.S. Department of Agriculture, prepared by the Economic Research Service, U.S. Department of Agriculture for the Office of Risk Management, 39 p., accessed January 8, 2024, at https://legacy.rma.usda.gov/pilots/feasible/PDF/wildrice.pdf.
Conversion Factors
U.S. customary units to International System of Units
Datums
Vertical coordinate information is referenced to the North American Vertical Datum of 1988 (NAVD 88).
Horizontal coordinate information is referenced to the North American Datum of 1983 (NAD 83).
Elevation, as used in this report, refers to distance above vertical datum.
Abbreviations
2D
two-dimensional
AEP
annual exceedance probability
CN
Curve Number
CN(I)
dry soil conditions
CN(II)
average soil moisture conditions
CN(III)
saturated soil conditions
DEM
digital elevation model
FDLB
Fond du Lac Band of Lake Superior Chippewa
HEC–GeoHMS
Hydrologic Engineering Center-Geospatial Hydrologic Modeling System
HEC–HMS
Hydrologic Engineering Center–Hydrologic Modeling System
HEC–RAS
Hydrologic Engineering Center–River Analysis System
lidar
light detection and ranging
n-value
Manning’s roughness coefficient
NAD 83
North American Datum of 1983
NAVD 88
North American Vertical Datum of 1988
NEXRAD
Next Generation Weather Radar
NOAA
National Oceanic and Atmospheric Administration
NSE
Nash-Sutcliffe efficiency
PBIAS
percentage bias
R
storage coefficient
Tc
time of concentration
USGS
U.S. Geological Survey
WSE
water-surface elevation
For more information about this publication, contact:
Director, USGS Central Midwest Water Science Center
400 South Clinton Street, Suite 269
Iowa City, IA 52240
319–337–4191
For additional information, visit: https://www.usgs.gov/centers/cm-water
Publishing support provided by the
Rolla and Baltimore Publishing Service Centers
Disclaimers
Any use of trade, firm, or product names is for descriptive purposes only and does not imply endorsement by the U.S. Government.
Although this information product, for the most part, is in the public domain, it also may contain copyrighted materials as noted in the text. Permission to reproduce copyrighted items must be secured from the copyright owner.
Suggested Citation
Cigrand, C.V., 2025, Assessment of effects of channelization mitigation alternatives of Stoney Brook, Carlton and St. Louis Counties, Minnesota: U.S. Geological Survey Scientific Investigations Report 2025–5004, 44 p., https://doi.org/10.3133/sir20255004.
ISSN: 2328-0328 (online)
Study Area
| Publication type | Report |
|---|---|
| Publication Subtype | USGS Numbered Series |
| Title | Assessment of effects of channelization mitigation alternatives of Stoney Brook, Carlton and St. Louis Counties, Minnesota |
| Series title | Scientific Investigations Report |
| Series number | 2025-5004 |
| DOI | 10.3133/sir20255004 |
| Publication Date | March 10, 2025 |
| Year Published | 2025 |
| Language | English |
| Publisher | U.S. Geological Survey |
| Publisher location | Reston, VA |
| Contributing office(s) | Central Midwest Water Science Center |
| Description | Report: ix, 44 p.; Data Release; Dataset |
| Country | United States |
| State | Minnesota |
| County | Carlton County, St. Louis County |
| Other Geospatial | Stoney Brook watershed |
| Online Only (Y/N) | Y |
| Additional Online Files (Y/N) | N |