

Potential Water-Quality and Hydrology Stressors on Freshwater Mussels With Development of Environmental DNA Assays for Selected Mussels and Macroinvertebrates in Big Darby Creek Basin, Ohio, 2020–22
Links
- Document: Report (4.03 MB pdf) , HTML , XML
- Appendixes:
- Tables 1.1–1.17 (131 KB xlsx) Appendix 1. Quality Control and Summary Information for Analyses of Pesticides, Organic Wastewater Compounds, and Polycyclic Aromatic Hydrocarbons
- Tables 1.1–1.17 (CSV) (34.6 KB csv) Appendix 1. Quality Control and Summary Information for Analyses of Pesticides, Organic Wastewater Compounds, and Polycyclic Aromatic Hydrocarbons
- Data Releases:
- USGS data release - Annual streamflow statistics for selected streamgages on Big and Little Darby Creeks and Hellbranch Run, Ohio (through water year 2021)
- USGS data release - Pesticide, organic wastewater compound (OWC) and polycyclic aromatic hydrocarbon (PAH) data determined from samples collected with instream passive samplers in the Big Darby Creek Basin, Ohio, 2020–21
- NGMDB Index Page: National Geologic Map Database Index Page (html)
- Download citation as: RIS | Dublin Core
Acknowledgments
The authors would like to thank Dr. Ieva Roznere, Caitlin Byrne, and Trisha Gibson with The Ohio State University Museum of Biological Diversity, who provided access to water samples from the Columbus Zoo and Aquarium Freshwater Mussel Conservation and Research Facility for the initial optimization and validation for the kidneyshell mussel eDNA qPCR assay. We would also like to thank Anthony Sasson, with the Midwest Biodiversity Institute, and John Tetzloff, with the Darby Creek Association, for their wealth of knowledge about the Big Darby Creek Basin and for providing information on historical and current locations of freshwater mussels within the basin. Finally, we thank Phil Mathias, with EnviroScience, for providing stream-water samples used to validate the northern riffleshell mussel assay.
Abstract
The richness and abundance of freshwater mussels in the Big Darby Creek Basin has declined in recent decades, according to survey results published by the Ohio Biological Survey. In October 2016, a major mussel die-off of undetermined cause reportedly affected over 50 miles of Big Darby Creek; however, fishes and other wildlife were not noticeably impacted. Pollution, habitat destruction, climate change, and hydrologic modification have all been theorized as potential reasons for the widespread declines in freshwater mussel populations in North America. To better understand potential stressors to mussels and other aquatic organisms in the Big Darby Creek Basin, the U.S. Geological Survey, in cooperation with the Ohio Water Development Authority, evaluated water quality and temporal changes in hydrology at selected locations. In addition, environmental deoxyribonucleic acid (eDNA) quantitative polymerase chain reaction (qPCR) assays were developed to detect the presence of selected mussels and macroinvertebrates using stream water.
Time-weighted average concentrations of pesticides, organic wastewater compounds (OWCs), and polycyclic aromatic hydrocarbons (PAHs) were determined for selected locations within the Big Darby Creek Basin. Passive samplers designed to mimic the respiratory exposure of aquatic organisms and the bioconcentration of organic contaminants into their fatty tissues were deployed three times annually at three sites within the Big Darby Creek Basin in 2020 and 2021. Analyses were done for 204 pesticide compounds, 38 OWCs, and 33 PAHs. Of the 204 pesticide compounds, 70 were detected in at least one sample; 30 were detected in all samples. Herbicides and herbicide degradates were the pesticides most frequently detected and also had some of the highest concentrations of the pesticides detected in this study. Three herbicides (atrazine, ametryn, and metribuzin) were detected in at least 88 percent of samples and two fungicides (azoxystrobin and propiconazole) were detected in all samples. Of the 38 OWCs, 24 were detected in at least one sample; however, only one (N,N-diethyltoluamide [DEET]) was detected in all samples. Of the 33 PAHs, 29 were detected in at least one sample; 12 were detected in all samples.
A continuous water-quality monitor was operated seasonally on Big Darby Creek above Georgesville, Ohio, from 2020 to 2022. Dissolved oxygen concentrations generally followed a daily cycle, peaking in early evening and troughing around sunrise. There were occasional 24-hour swings in dissolved oxygen concentration that had a range exceeding 10 milligrams per liter. However, dissolved oxygen concentrations never fell below Ohio’s aquatic life criteria for warmwater habitats (outside of mixing zones) of 4.0 milligrams per liter as an instantaneous minimum and 5.0 milligrams per liter as a minimum 24-hour average. The Ohio water-quality criteria for temperatures are 29.4 degrees Celsius as an instantaneous maximum and 27.8 degrees Celsius as a 24-hour average maximum. In 2020, there were 10 days when the maximum instantaneous value for temperature was exceeded and 3 consecutive days when the maximum 24-hour average temperature was exceeded.
Streamflow time-series data from three gaging stations within the Big Darby Creek Basin were evaluated for trends in annual flow statistics and daily nonexceedance probabilities over time. In general, the evaluation of streamflow conditions at the Big Darby Creek gage (with 97 years of record) indicated that streamflow changed between water years 1922 and 2021. During that time span, flows in general increased, the number of high-flow pulses became more frequent, and low-flow pulses and extreme low-flow periods became less frequent. The only strong indication of trends over time in annual flow statistics for the relatively short records for the other two gages (on Little Darby Creek, with 25 years of record, and Hellbranch Run, with 29 years of record) was that as time went on, reversals between rising and falling periods became more frequent.
The U.S. Geological Survey Ohio Water Microbiology Laboratory developed eDNA qPCR assays to detect Epioblasma rangiana (northern riffleshell mussels), Chimarra obscura (a species of caddisfly), Maccaffertium pulchellum (a species of mayfly), and optimized a preexisting eDNA qPCR assay to detect for Ptychobranchus fasciolaris (kidneyshell mussels). The assays were validated by using environmental sampling methods. Assay sensitivity was established by determining the limits of detection and quantification. Water samples were collected at 12 sites in the Big Darby Creek Basin between 2020 and 2022 and analyzed for eDNA with the qPCR assays developed for this study.
Introduction
Freshwater mussels are declining in both abundance and species richness throughout North America (Strayer and others, 2004; Haag, 2012). About 80 freshwater mussel species have been reported in Ohio, and about half of those species have been found in the Big Darby Creek Basin (Watters, 1998; Tetzloff, 2000; Watters and others, 2009). Recent surveys (Watters, 1998; Tetzloff, 2000) suggest that both species richness and abundance of mussels have declined in the Big Darby Creek Basin. Watters (1998) found 39, 37, and 32 freshwater mussel species in the Big Darby Creek Basin in 1986, 1990, and 1996, respectively. A more recent survey from 2014–15 found 28 mussel species; 4 species were listed as endangered, 2 as threatened, and 7 as of special concern on State or Federal lists (EnviroScience, 2015). Seven species of mussels that had been found in previous surveys were not found in 2014–15 (Pyganodon grandis [giant floater], Pustulosa pustulosa [pimpleback], Toxolasma parvum [lilliput], Truncilla donaciformis [fawnsfoot], Utterbackia imbecillis [paper pondshell], Uniomerus tetralasmus [pondhorn], and Paetulunio fabalis [rayed bean]; EnviroScience, 2015); however, the most recent freshwater mussel survey was completed with fewer sites than in previous surveys and used a timed search method per site.
Several studies by the U.S. Geological Survey (USGS) and others describe ecology, water quality, and ecological restoration efforts important in Big Darby Creek Basin. Hambrook and others (1997) studied washout and recolonization of macroinvertebrates and algae associated with a spring and summer storm in the Big Darby Creek Basin in 1994. In 2013, the USGS conducted water-quality sampling in Big Darby Creek as part of the National Water-Quality Assessment regional Midwest Stream-Quality Assessment study (Garrett and others, 2017). In that study, data on nutrients, suspended sediment, and pesticide concentrations were collected from May through August 2013 at Big Darby Creek at Prairie Oaks near Lake Darby, Ohio (station 395942083151401). Sampling included weekly water-quality samples for 12 weeks, a month-long time-integrated water-quality sample collected with a passive sampler, and a fish survey (Garrett and others, 2017). Other studies on the Big Darby Creek Basin include those focusing on riparian buffers (Colwell, 2007); creating and restoring wetlands (Zhang and others, 2005); assessing ecological risk (Cormier and others, 2000); and evaluating status and trends in the basin using fish surveys and benthic macroinvertebrate surveys from 1979 through 1993 (Schubauer-Berigan and others, 2000).
Along with possible changes in water quality, hypotheses for contributing causes of the decline in mussel populations include changes in hydrology, possibly due to urbanization, and climate change (Ries and others, 2016). Mussels have a unique life cycle that includes a mobile larval stage, when they attach to a host fish, and a juvenile stage, when they drop off their host, settle into the streambed, and begin to mature into an adult. Each stage has its own habitat requirements and sensitivities to changes in water temperature, water chemistry, and flow characteristics (for example, changes in the magnitudes, rates of change, and the frequency, duration, and timing of high and low flows; Poff and others, 1997; Ostby, 2005; Gates and others, 2015; Drew and others, 2018). A modeling study (Daniel and others, 2018) found that the key predictors of habitat suitability for mussels were the amount of urban land use and median annual stream discharge.
Quantitative polymerase chain reaction (qPCR) assays for environmental deoxyribonucleic acid (eDNA) offer new and sensitive techniques that may improve the ability to detect and possibly quantify freshwater mussel populations. Mussels shed deoxyribonucleic acid (DNA) into the environment in the forms of sloughed tissue or cells, gametes, filter excreta (Henley and others, 2006), and shell material (Geist and others, 2008). While traditional biological sampling requires locating, hand-excavating, and handling of organisms to confirm visual identities, eDNA sampling only involves collecting a water sample, which is often already a component of water quality and ecological assessments for other analyses. This technology may provide a more timely and cost-effective mechanism for identifying future trends in mussel populations and species richness in the Big Darby Creek Basin. Molecular detection of species via eDNA is typically performed by one of two methods: metabarcoding or qPCR.
Metabarcoding uses taxon-specific primers (short nucleotide fragments used to help amplify or sequence a specific region of a target nucleotide) that allow for the detection of DNA from all the species within a taxonomic group; for example, all unionid mussels. The metabarcoding method can provide researchers with large amounts of data about which taxa live within a waterway but can potentially miss species that have low abundance and, thus, low quantities of DNA in the water sample. Additionally, taxon-specific primers may not amplify all species’ DNA equally well, leading to missed detections.
By contrast, qPCR uses species-specific primers and probes that provide a targeted approach for determining the presence or absence of individual species. The qPCR assays can detect specific DNA targets in minuscule quantities depending on the specifics of the assay. The ability to detect such small quantities of DNA in a sample gives researchers more confidence in assessing the presence or absence of a species.
The Ohio Environmental Protection Agency (OEPA) assesses the overall health of Ohio rivers and streams, in part by using a multimetric index referred to as an invertebrate community index (ICI). The ICI considers the types and counts of macroinvertebrate species (mayfly, caddisfly, and other flies in the order Diptera) present and a total of 10 metrics on which sampled sites are compared to relatively undisturbed sites with otherwise similar features (OEPA, 1988). To aid in the assessment of Ohio waterways, eDNA qPCR assays were developed to detect the presence of select macroinvertebrate species in stream water that are also targeted through traditional OEPA monitoring.
In 2014–15, researchers at The Ohio State University Museum of Biological Diversity developed polymerase chain reaction (PCR) endpoint assays (which indicate only presence or absence of target) for some mussels in the Big Darby Creek Basin but had issues with sampling methods and validating their assays in the environment (Dr. Thomas Watters, Dr. Ieva Roznere, Caitlin Byrnes, The Ohio State University Museum of Biological Diversity, oral commun., 2020; EnviroScience, 2015). eDNA methods using qPCR have not yet been developed and validated for many mussels and macroinvertebrates native to the Big Darby Creek Basin; however, USGS researchers have developed and tested eDNA qPCR assays for quantifying mussels in other locations. USGS eDNA research includes developing qPCR assays for the federally endangered Prolasmidonta heterodon (dwarf wedgemussel; Schill and Galbraith, 2019) in the Delaware River Basin and for the endangered Cumberlandia monodonta (spectaclecase mussel; Lor and others, 2020) in the Gasconade and Meramec Rivers in Missouri and the Saint Croix River in Wisconsin.
In October 2016, a mussel die-off of unknown cause affected more than 50 river miles (the distance measured from the mouth of the creek or river along the curving path of that river) along the Big Darby Creek (Renault, 2016). The 2016 die-off extended from the headwaters of Big Darby Creek, near the Union-Logan county line, to the Franklin-Pickaway county line and affected all species of mussels but did not noticeably impact other wildlife (Dr. G. Thomas Watters, The Ohio State University Museum of Biological Diversity, and Anthony Sasson, Midwest Biodiversity Institute, oral commun., 2018). Another die-off occurred along Big Darby Creek in July 2000 when a spill from an agribusiness caused low dissolved oxygen (DO) in the stream that extended for several miles and lasted about a week, killing thousands of fish and mussels (Tetzloff, 2001).
The declines and die-offs of mussels that have occurred in the Big Darby Creek Basin highlight how little we understand about stressors affecting mussels and other aquatic organisms in this basin. Given the multitude of potential stressors on aquatic organisms in the Big Darby Creek Basin, it would be beneficial to gather more information to better understand the water chemistry and hydrology of the basin. These data may help us understand the factors contributing to mussel decline and help in designing remediation that could help rebuild or sustain their populations. To help remedy the knowledge gap, the USGS, in cooperation with the Ohio Water Development Authority, partnered to study water-quality and temporal changes in hydrology for selected locations in the Big Darby Creek Basin and developed eDNA qPCR assays to detect the presence of selected mussels and macroinvertebrates using stream water.
Purpose and Scope
This report summarizes the methods and results of a USGS study to measure water quality and evaluate temporal trends in hydrology in the Big Darby Creek Basin. It also describes the development of eDNA qPCR assays to detect the presence of selected mussels and macroinvertebrates. These eDNA assays were developed to aid the OEPA in their stream health assessments using an Invertebrate Community Index that accounts for the types and abundance of various aquatic species present (DeShon, 1995). This aspect of the study was included as a pilot to determine the feasibility of using eDNA in lieu of traditional sampling for some species.
In the Big Darby Creek Basin between 2020 and 2022, continuous water quality was monitored at one site and passive water-quality samplers were deployed at three sites (one was collocated with a streamflow gage at Little Darby Creek near West Jefferson, Ohio, and one collocated at the continuous water-quality monitoring site at Big Darby Creek above Georgesville, Ohio). eDNA was sampled at 12 sites in the Big Darby Creek Basin. The passive samplers were designed to provide estimated time-weighted average concentrations of selected pesticides, organic wastewater compounds (OWCs), and polycyclic aromatic hydrocarbons (PAHs). Streamflow time-series data from three gages in the Big Darby Creek Basin (Big Darby Creek at Darbyville, Ohio, using 97 years of record; Little Darby at West Jefferson, Ohio, using 25 years of record; and Hellbranch Run near Harrisburg, Ohio, using 29 years of record) were evaluated for temporal trends. The water-quality data and trend evaluations are intended to provide information that may improve our understanding of potential stressors on the freshwater mussel population in the Big Darby Creek Basin.
Description of Study Area
The Big Darby Creek Basin is located in central Ohio, west of Columbus (fig. 1), and includes portions of Logan, Union, Champaign, Madison, Franklin, and Pickaway Counties. Big Darby Creek flows generally south or southeast from its headwaters in Logan and Union Counties to where it joins the Scioto River in Pickaway County (fig. 1). Major tributaries to Big Darby Creek include Little Darby Creek and Hellbranch Run.
Mean annual precipitation in the Big Darby Creek Basin is about 37.9 inches (in.) (National Oceanic and Atmospheric Administration, 2023). The average annual runoff at Big Darby Creek at Darbyville, Ohio, from water years 1922 to 2020 was 12.6 in. (USGS, 2024b). Annual runoff at Big Darby Creek at Darbyville, Ohio, was 13.7, 10.0, and 18.9 in., in water years 2020, 2021, and 2022, respectively (USGS, 2024b).
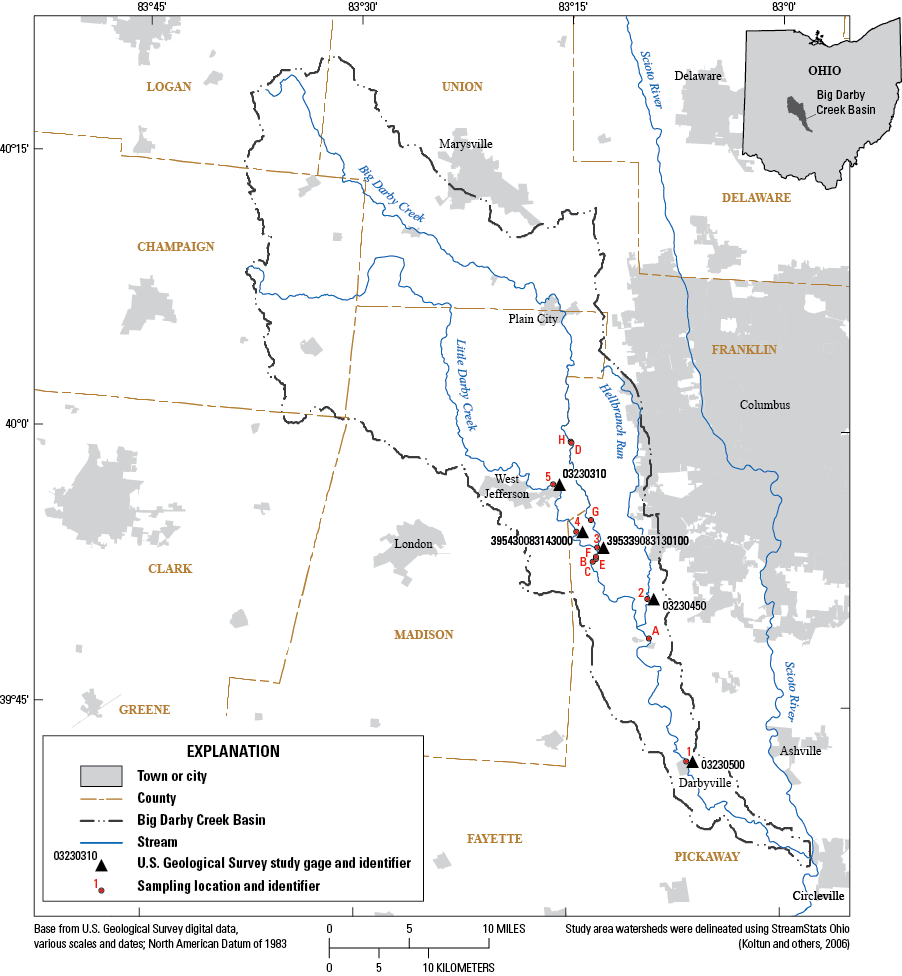
Map showing the Big Darby Creek Basin, the location of the continuous water-quality monitor, passive sampling locations, and other study gages in the study area of central Ohio, 2020–22. Study site names are in table 2.
Over 80 miles of Big and Little Darby Creeks were designated by the Ohio Department of Natural Resources as a “State Scenic River” in 1984 (Ohio Department of Natural Resources, 2024), as a “Last Great Place” by the Nature Conservancy in 1991 (The Nature Conservancy, 2024), and as a “National Wild and Scenic River” by the U.S. Department of Interior in 1994 (National Wild and Scenic Rivers System, 2019). The National Wild and Scenic River designation was given to Big and Little Darby Creeks because they are free-flowing rivers with an exceptional diversity of mussels and other aquatic organisms (National Wild and Scenic Rivers System, 2019). In 2019, Big Darby Creek was listed as one of the top 10 endangered rivers in the country due to urban sprawl (American Rivers, 2019; Berger, 2019).
The drainage area of Big Darby Creek Basin is approximately 556 square miles (mi2) and the Little Darby Creek Basin drainage area is approximately 179 mi2, as determined with use of StreamStats (Koltun and others, 2006). Land use in the Big Darby Creek Basin is predominantly agriculture (78.5 percent), followed by forest (10.3 percent) and developed lands (9.8 percent; Dewitz and USGS, 2021). There were small changes in land use between 2001, 2011, and 2019 (table 1). Agricultural land use decreased and developed land use increased between 2001 and 2019 in the Big Darby Creek Basin. At the time of this writing (2024), extensive development is occurring in the Plain City area, located in the upper third of the Big Darby Creek Basin (fig. 1), leading to concerns about the current and future effects of urban runoff on the health of this diverse stream ecosystem (American Rivers, 2019; Berger, 2019).
Table 1.
Percentage of land use calculated from the National Land Cover Database 2001, 2011, and 2019 for the Big Darby Creek Basin, Ohio.[Data from Dewitz and U.S. Geological Survey (2021). NLCD, National Land Cover Database]
In 2023, the USGS collected streamflow (hereafter referred to as “flow”) data at three USGS gages in the Big Darby Creek Basin: Big Darby Creek at Darbyville, Ohio (station 03230500), Little Darby Creek at West Jefferson, Ohio (station 03230310), and Hellbranch Run near Harrisburg, Ohio (station 03230450, a 37.7 mi2 basin that has been undergoing urbanization) (fig.1). Collectively, these three gages will be referred to as the “trend gages.” In addition to flow data, nutrient and suspended-sediment data have been collected in Hellbranch Run since 1992. The USGS estimates and publishes the daily mean concentrations and daily discharges of suspended sediment for the Hellbranch Run gage (USGS, 2024a). A continuous water-quality monitor was installed in April 2020 on Big Darby Creek above Georgesville, Ohio (station 395339083130100), just above the confluence with Little Darby Creek. Table 2 lists all sampling locations and trend gages in the Big Darby Creek Basin.
Table 2.
Study sites in the Big Darby Creek Basin, Ohio, 2020–22.[Locations shown in figure 1. Station data from U.S. Geological Survey (2024a); drainage area computed using StreamStats (Koltun and others, 2006). ID, identification; USGS, U.S. Geological Survey; RM, river mile (the distance measured from the mouth of the creek or river along the curving path of that river); mi2, square mile; eDNA, environmental deoxyribonucleic acid]
| Map ID (fig. 1) | USGS station number | USGS station name | Stream name and approximate RM distance upstream from mouth or location | Site activities | Latitude, decimal | Longitude, decimal | Drainage area (mi2) |
|---|---|---|---|---|---|---|---|
| 1 | 03230500 | Big Darby Creek at Darbyville, Ohio | Big Darby Creek at RM 13.4 | Study streamflow gage, eDNA sampling | 39.70062 | −83.11019 | 534 |
| 2 | 03230450 | Hellbranch Run near Harrisburg, Ohio | Hellbranch Run at RM 1.9 | Study streamflow gage | 39.84783 | −83.15733 | 35.8 |
| 3 | 395339083130100 | Big Darby Creek above Georgesville, Ohio | Big Darby Creek at RM 34.2 | Continuous water-quality monitor, passive and eDNA sampling | 39.89417 | −83.21694 | 253 |
| 4 | 395430083143000 | Little Darby Creek above Georgesville, Ohio | Little Darby Creek at RM 2.6 | Passive and eDNA sampling | 39.90833 | −83.24167 | 172 |
| 5 | 03230310 | Little Darby Creek at West Jefferson, Ohio | Little Darby Creek at RM 7.4 | Study streamflow gage and passive and eDNA sampling | 39.95117 | −83.26936 | 162 |
| A | 394843083091800 | Big Darby Creek at RM 25.1 near Orient, Ohio | Big Darby Creek at RM 25.1 | eDNA sampling on 11/8/2021 | 39.81194 | −83.15513 | 496 |
| B | 395253083131900 | Big Darby Creek at RM 33.2 near Georgesville, Ohio | Big Darby Creek at RM 33.2, Sycamore Run | eDNA sampling on 11/8/2021 | 39.88126 | −83.22197 | 434 |
| C | 395305083130600 | Big Darby Creek at RM 33.5 near Georgesville, Ohio | Big Darby Creek at RM 33.5, Voss Run Riffle | eDNA sampling on 11/8/2021 | 39.88470 | −83.21823 | 432 |
| D | 395924083145500 | Big Darby Creek at RM 42.6 near Georgesville, Ohio | Big Darby Creek, upstream from RM 42.4 | eDNA sampling on 11/8/2021 | 39.99007 | −83.24916 | 232 |
| E | 395302083130600 | Big Darby Creek at RM 33.4 near Georgesville, Ohio | Big Darby Creek, downstream from RM 33.5, Voss Lower | eDNA sampling on 4/29/2022 | 39.88377 | −83.21827 | 432 |
| F | 395309083130600 | Big Darby Creek at RM 33.6 near Georgesville, Ohio | Big Darby Creek, upstream from RM 33.5, Voss 2 | eDNA sampling on 4/29/2022 | 39.88577 | −83.21826 | 432 |
| G | 395509083132800 | Big Darby Creek at RM 36.2 near Georgesville, Ohio | Big Darby Creek at RM 36.2 | eDNA sampling on 4/29/2022 | 39.91907 | −83.22448 | 249 |
| H | 395917083144800 | Big Darby Creek at RM 42.4 near Georgesville, Ohio | Big Darby Creek at RM 42.4 | eDNA sampling on 4/29/2022 | 39.98900 | −83.24821 | 232 |
Methods
The following sections describe the methods used to evaluate the water chemistry, eDNA qPCR assays, and changes in hydrology in the Big Darby Creek Basin. The USGS Ohio Water Microbiology Laboratory (OWML) developed eDNA qPCR assays for one mussel species and two macroinvertebrate species. The OWML also optimized a previously published eDNA qPCR assay for a second mussel species.
Continuous Water-Quality Monitoring
Time series of water-quality data, including pH, DO, specific conductance, water temperature, and turbidity, were measured by installing and operating a continuous water-quality monitor (USGS, 2024a). The monitor, located on Big Darby Creek above Georgesville, Ohio (station 395339083130100), was installed in April 2020 and operated through November 2022, recording data at 15-minute intervals. The instream water-quality monitor was operated annually from March or April through November or December and deployed in a perforated pipe on the downstream side of the bridge. The monitor was moved from the initial location at the left bridge pier to the center bridge pier on October 13, 2020, so that it was located more mainstream during low flows. The site was visited every 3–4 weeks to clean and check the calibration of the water-quality sensors. Monitor data can be viewed or downloaded at USGS (2024a; station 395339083130100). Data were quality assured, finalized, and archived following USGS methods (Wagner and others, 2006). Some continuous water-quality processing steps include applying corrections to fouling or calibration drift when warranted, as described by Wagner and others (2006).
Passive Water-Quality Sampling
Because passive samplers contain absorbent media that integrates water quality over long time periods, they can detect compounds chronically present at very low concentrations and compounds that may be present episodically at higher concentrations (Alvarez, 2010). Estimated time-weighted average water concentrations for pesticides, OWCs, and PAHs determined from samples collected with instream passive samplers and quality assurance data are available in the associated data release (Koltun and others, 2025) and in appendix tables.
Polar organic chemical integrative samplers (POCIS) are passive samplers designed to sample for hydrophilic compounds, mimicking the respiratory exposure of aquatic organisms. The compounds that can be sampled with POCIS include pesticides and OWCs, some of which are potentially endocrine-disrupting or acutely toxic (Alvarez, 2010). Pesticides are defined as any substance or mixture of substances intended to prevent, destroy, repel, or mitigate any pest and include classes of compounds such as herbicides, insecticides, and fungicides. OWCs are defined as substances associated with liquid waste or sewage discharged from municipal wastewater treatment plants, also called effluents, and include prescription and over-the-counter drugs, steroids, hormones, antibiotics, and personal care products.
Semipermeable membrane devices (SPMDs) are passive samplers designed to mimic the bioconcentration of organic contaminants into fatty tissues of organisms. They can sample for lipid or fat-soluble (nonpolar or hydrophobic) semi-volatile organic compounds such as PAHs, polychlorinated biphenyls (PCBs), chlorinated pesticides, polybrominated diphenyl ethers (PBDEs), dioxins, and furans. Hydrophobic contaminants often present in wastewater effluents (such as fragrances, triclosan, and phthalates) are frequently detected with field-deployed SPMDs (Alvarez, 2010).
The passive samplers used in this study were constructed and processed by the USGS Columbia Environmental Research Center (CERC) in Missouri. Analyses of OWCs and PAHs were done at the CERC, while pesticide analyses were done at the USGS National Water Quality Laboratory (NWQL) in Colorado. The POCIS conformed to the standard size of 41 square centimeters (cm2) sampling surface area and contained 200 milligrams (mg) of Oasis hydrophilic-lipophilic-balanced (HLB) resin. The SPMDs conformed to the standard size of 91 centimeters (cm) long and 2.54 cm wide and contained 1 milliliter (mL) of purified triolein. Each SPMD was spiked with phenanthrene-d10, and pyrene-d10 to serve as performance reference compounds (PRCs). Dibenz[a,h]anthracene-d14 was also spiked into each SPMD as a photolysis marker, as PAHs can be photolyzed (decomposed by light or other radiant energy) inside the SPMD (Alvarez, 2010).
The passive sampling media were housed in a 3-in. (7.62-cm) diameter by approximately 6-in (15.24-cm) long polyvinyl chloride (PVC) casing with holes drilled through and slotted ends to facilitate water flow through the canister. Each sampler was shipped from the CERC on ice or with ice packs at 1–6 degrees Celsius (°C) in a metal can with a sealed top (similar to a paint can) to ensure no air contamination prior to deployment.
POCIS and SPMD passive samplers were deployed instream in 2020 and 2021. Each passive sampler was deployed instream secured to the top of a cinderblock in approximately 0.5 feet (0.3048 meters) to 3.0 feet (0.9144 meters) of flowing water. The cinderblock was then chained to a tree to prevent the sampler from being washed downstream if extremely high flows occurred during sample deployment. A multiparameter sonde was used to obtain water chemistry readings for temperature, specific conductance, pH, DO, and turbidity at the times of deployment and retrieval. After retrieval, the passive samplers were resealed in metal cans with limited air exposure, chilled, and shipped on ice to the CERC. Samplers were deployed at two sites on Little Darby Creek (located at station 03230310, upstream from the West Jefferson wastewater treatment plant, and station 395430083143000, downstream from the wastewater effluent outflow) and at another site on Big Darby Creek at the location of the continuous water-quality monitor (station 395339083130100; fig.1). Three consecutive deployments of 45 days were done yearly at each site from June through October, for a total of six deployments over 2 years at the three sites.
POCIS Processing for Pesticides
To check for pesticides, POCIS media were extracted by using 25 mL of methanol per POCIS. Extracts were evaporated by using rotary evaporation and high-purity nitrogen blowdown prior to being sealed in amber glass ampoules at a volume of 1.0 mL. The ampoules containing the extracts were shipped to the USGS NWQL for analysis by liquid chromatograph tandem mass spectrometry. The analyses were performed using NWQL lab codes 8238 and 8239 (Furlong and others, 2001; table 1.13; https://www.usgs.gov/labs/national-water-quality-laboratory).
The calculation of time-weighted average water concentrations from POCIS data uses a first-order linear uptake model where the estimated water concentration is equal to the amount of the compound measured in the POCIS divided by the product of the sampling rate of the compound and the length of the field deployment in days (Alvarez, 2010). This calculation is as follows:
where:Cw
estimated time-weighted average water concentration, in nanograms per liter (ng/L);
N
amount of compound measured in the POCIS, in nanograms (ng);
Rs
sampling rate for the compound, in liters per day; and
D
deployment length, in days.
Sampling rates for pesticides used in water concentration calculations are described in Alvarez and others (2004, 2007), Ahrens and others (2015), and Metcalfe and others (2016).
POCIS Processing for OWCs
To check for OWCs, POCIS media were extracted by using 25 mL of an 80:20 volume-per-volume mixture of dichloromethane:methyl-tert-butyl ether per POCIS. Extracts were evaporated by using rotary evaporation and high-purity nitrogen blowdown prior to being placed in chromatography vials. Five hundred ng of p-terphenyl-d14 was added to each vial as the instrumental internal standard and the volume was adjusted to 1.0 mL. Analyses were performed using a gas chromatograph mass spectrometer (Alvarez, 2010). The calculation of time-weighted average water concentrations of OWCs uses the same calculation (eq. 1) discussed previously for the pesticides POCIS data. Sampling rates used for OWCs in water concentration calculations are described in Alvarez and others (2007), Harman and others (2008), Li and others (2010), Bartelt-Hunt and others (2011), Ahrens and others (2015), and Poulier and others (2015).
SPMD Processing for PAHs
To check for PAHs, SPMD processing consisted of dialysis to extract chemicals from the media, followed by using size exclusion chromatography to isolate the PAHs. One PRC-fortified SPMD from each site was designated for PAH analyses. Processing the samples included isolation of the PAHs from potential interferences, cleanup of the extract using a reactive tri-adsorbent gravity-flow chromatography column, and analysis using a gas chromatograph mass spectrometer in full-scan mode (Alvarez and others, 2008).
The calculation of time-weighted average water concentrations of PAHs from SPMD data uses a series of polynomial regression models that take into account site-specific environmental factors affecting uptake as determined by the loss of the PRCs (Alvarez, 2010). These calculations of PAHs from SPMD data are described by Alvarez (2010). A detailed explanation of the theoretical aspects of uptake and derivation of the models has been described by Huckins and others (2006).
Quality Control for Passive Sampling
Quality control (QC) samples for the POCIS and SPMD passive samplers consisted of fabrication blanks and field blanks. Blank samples, also called blanks, are collected and analyzed alongside the environmental samples to help detect the presence of airborne contamination of the sampling media during construction in the laboratory and handling in the field during sampling trips. Fabrication blanks were processed concurrently with the field-deployed samplers. Fabrication blanks were exposed to the air at the CERC laboratory during the fabrication of the samplers and are used to account for the interferences or contamination that occurred from the sampler components, storage, processing, and analysis (Alvarez, 2010). For each of the six deployments, one POCIS and one SPMD field blank container was opened to the air at one of the three sites (chosen at random) just prior to the passive sampler being deployed in the water and closed after the sampler was submerged. The field blank passive sampler containers were also opened before retrieving the instream passive sampler and then closed when the retrieved passive sampler was resealed in its metal can. Between deployment and retrieval of the instream passive samplers, the sealed field blank sample containers were stored in a freezer at less than 0 °C. Blanks were processed and analyzed in the same fashion as the environmental samples. Instrument verification checks and reference standards were also employed.
Laboratory reporting levels for each pesticide measured in the POCIS were established by the NWQL based on instrumental limits accounting for any sample dilutions that may have been done. The CERC established reporting levels for the OWCs in POCIS as a function of method detection limits (MDLs) and method quantitation limits (MQLs) determined for each sampling year. The MDL is determined as the mean of chemical responses in the blanks plus three times the standard deviation of the blanks. The MQL is determined as the mean of the chemical responses in the blanks plus 10 times the standard deviation of the blanks or at the level of the lowest instrumental calibration level (whichever was highest). In cases where no chemical was measured in the blanks, the MQL was set at the lowest instrumental calibration level and the MDL was set at 20 percent of the MQL (Keith, 1991). The CERC set the MDL for analysis of SPMD samples for each analyte at an assumed value equal to the low sample reject for the instrumental method (operationally defined as 20 percent of the concentration of the lowest standard concentration used for the calibration curve), and the MQL was set at the lowest standard concentration of the calibration curve.
The concentration results from field and fabrication blanks were used to recensor environmental results in some cases. Concentrations of the environmental samples were recensored at the concentrations found in the blanks if they exceeded the MDL. The estimated water concentration of the fabrication blank for a given year was used to recensor results for all sites in that same year unless the site-specific field blank had a higher estimated water concentration and then it was used for recensoring results for the site at which the field blank was collected.
Assays for eDNA qPCR
The USGS OWML developed eDNA qPCR assays to detect Epioblasma rangiana (northern riffleshell mussels), Chimarra obscura (a species of caddisfly), and Maccaffertium pulchellum (a species of mayfly). An eDNA qPCR assay for Ptychobranchus fasciolaris (kidneyshell mussels) was adapted from Currier and others (2018) and optimized for use in this study. Because the common names “caddisfly” and “mayfly” refer to a whole group, not just a specific species, these species will be referred to by their abbreviated scientific names (C. obscura and M. pulchellum, respectively).
Assay Development
Species-specific DNA sequences were obtained from the open-source National Center for Biotechnology Information (NCBI) GenBank database (http://www.ncbi.nlm.nih.gov) and the open-source Barcode of Life Database (https://www.boldsystems.org/). The assays developed for this study target the cytochrome oxidase subunit I (COI) gene for each species. The many individual target sequences found for each species were aligned by using the open-source software MEGA-X (https://www.megasoftware.net), and a consensus sequence was created. Each consensus sequence was entered into the open-source Eurofins qPCR Primer & Probe Design Tool (https://eurofinsgenomics.eu/en/ecom/tools/qpcr-assay-design/), and a primer and probe set was chosen for each species from the output of possibilities. This chosen assay was then imported into the NCBI Primer-BLAST software (https://blast.ncbi.nlm.nih.gov/Blast.cgi), where in silico testing was conducted to check for cross-reactivity against available sequences for all biological organisms in the GenBank database (table 3). Specifically for mussels, 38 of 39 colocated mussel species in the Big Darby Creek Basin (from the taxon list taken from the four most recent surveys; EnviroScience, 2015) have at least one COI sequence represented in the GenBank database. After passing the in silico testing, all newly developed assays were optimized and validated at the OWML.
Table 3.
List of units and sequences of four target species for environmental deoxyribonucleic acid (eDNA) quantitative polymerase chain reaction (qPCR) assays developed at the U.S. Geological Survey Ohio Water Microbiology Laboratory.[fwd, forward primer; rev, reverse primer; prb, probe; μM, micromolar; sec, second; °C, degree Celsius]
Data from Currier and others (2018).
eDNA Field Sampling and Molecular Methods
For all eDNA samples, surface-water grab samples were collected in 1 liter, bleach-sterilized polypropylene bottles following the National Field Manual protocols (Myers and others, 2007). Each sample was brought to the OWML on ice and was prefiltered through a 47-millimeter diameter, 5-micrometer cellulose nitrate filter (Whatman; Florham Park, N.J.). The full 1-liter filtrate was then filtered through a 47-millimeter diameter, 0.45-micrometer cellulose nitrate filter (Whatman; Florham Park, N.J.). Afterward, filters were folded aseptically and put into 2-mL screw-cap vials with approximately 0.3 grams of acid-washed glass beads (bead beating is part of the extraction process; Sigma-Aldrich Corp.; St. Louis, Mo.). Each day that samples were processed, negative controls (filter blanks) were processed by using sterile buffered water. After being filtered, samples were kept at −70 °C pending analysis.
DNA was extracted from the samples by using DNA–EZ extraction kits from GeneRite (Monmouth Junction, N.J.). Extraction was performed following the manufacturer's directions, apart from not using a prefilter. Negative extraction controls (extraction blanks), which are 2-mL vials containing only acid-washed glass beads, were processed in parallel with each batch of extractions. Before qPCR analysis, DNA extracts were stored at 4 °C for no more than 5 days after extraction.
Sample extracts were analyzed for kidneyshell, northern riffleshell, C. obscura (a caddisfly), and M. pulchellum (a mayfly) DNA by using qPCR. The qPCR analyses were performed by using Applied Biosystems StepOne Plus or Applied Biosystems QuantStudio 3 Real-Time PCR System and their corresponding software packages. Thresholds were set manually for each assay. Each sample was analyzed in duplicate and run for 45 cycles. Duplicates of no-template controls (qPCR blanks), which contained molecular-grade sterile water rather than DNA extract, were included on each qPCR plate. For all samples, matrix inhibition was evaluated by using matrix spikes (a known-quantity target DNA extract spiked into the sample DNA extract). Samples were considered inhibited if the average cycle threshold value (Ct) was delayed more than two cycles from the spiked no-template control. Diluted sample DNA extracts were used for qPCR if the sample showed matrix inhibition.
Quantifying eDNA by qPCR
To quantify target sequences in unknown samples, seven-point standard curves were produced in parallel with each qPCR run using plasmids containing the sequences for each of the targeted eDNA COI genes. The lowest standard was 101 copies of the target gene, and the highest standard was 107 copies of the target gene. The slope of the log-linear component of the standard curve was used to compute amplification efficiency (Bustin and others, 2009) using the equation:
The amplification efficiency should be 90 to 110 percent; an efficiency of 100 percent means an exact doubling of the target DNA sequence at each cycle and, thus, a more accurate quantification of the target in the original sample. Guidelines for interpreting standard curve data are available in Bio-Rad Laboratories, Inc. Bulletin 5859 (Taylor and others, 2015). The qPCR result was converted to eDNA marker concentrations in copies per liter by interpolating from the standard curves. The coefficient of determination for the regression is used to assess the fit of the standard curve to the plotted data points. The closer the coefficient of determination is to 1, the better the fit. Standard curve characteristics are shown in table 4.Table 4.
Characteristics for the standard curve produced by each environmental deoxyribonucleic acid (eDNA) quantitative polymerase chain reaction (qPCR) assay for the freshwater mussel and macroinvertebrate species in the Big Darby Creek Basin, Ohio, 2020–22.[R2, coefficient of determination]
The limit of detection (LoD) is the lowest concentration of a target that can be identified with 95 percent confidence. The LoD is determined by performing a series of dilutions of the target with a minimum of 10 replicates per dilution. The dilutions used are based on the sensitivity of the assay. A standard curve, run alongside the dilution series, is used to validate the concentration of the dilutions, thus determining the limit of detection.
The lowest quantity of a target that can be accurately determined is known as the limit of quantification (LoQ). The LoQ is determined by performing a series of dilutions of the target with a minimum of 10 replicates per dilution. Which dilutions are used is based on the sensitivity of the assay. For the LoQ calculation, the dilution with the lowest concentration with a coefficient of variation below 35 percent and a Ct standard deviation at or below 0.5 is selected. The LoQ is calculated as the average Ct value (CtAVE) for the selected dilution subtracted by two times the associated standard deviation (σCt), which is then used to compute a concentration (copies per reaction) using the standard curve run with the dilution series.
Flow Trend Methods
The Exploration and Graphics for RivEr Trends (EGRET) R-package (Hirsch and De Cicco, 2015; R Core Team, 2017) provides a variety of tabular and graphical outputs that can be used to evaluate whether selected flow characteristics are changing over time. The EGRET analyses of long-term changes in flow characteristics are based on time-series smoothing methods pioneered by Cleveland (1979) and Cleveland and Devlin (1988). EGRET performs locally weighted scatterplot smoothing (lowess) on annual flow statistics (relevant to low, high, and mean or median flows) to produce plots that show patterns of change over time spans of about a decade or more. Lowess is a nonparametric method that can determine the coordinates of a smooth line (hereafter referred to as a “lowess smooth”) representing the central tendency of the relationship between dependent and independent variables. Plotting the lowess smooth along with annual time-series data makes it easier to visualize how the data change over time. A detailed description of the smoothing method can be found in Hirsch and others (2010).
Working in the EGRET framework and using methods described by Hirsch (2018), quantile-Kendall plots were prepared for each trend gage. In a quantile-Kendall plot, daily nonexceedance probabilities are plotted versus the trend slope for flows associated with those probabilities. Larger nonexceedance probabilities are associated with larger flows, and smaller nonexceedance probabilities are associated with smaller flows. The trend slope was determined with Sen's slope (the median of the slopes of all lines through pairs of points; Sen, 1968) and expressed in percent change per year. The statistical significance of the trend was determined with Mann-Kendall tests (Mann, 1945). Each point in the quantile-Kendall plot is color-coded according to the p-value for a test of the null hypothesis that the trend slope is zero. Points plotted in red indicate a statistically significant (unless stated otherwise, all tests of statistical significance discussed in this report were based on an alpha level of 0.05) likelihood that flows at those nonexceedance probabilities have nonzero trend slopes.
The Indicators of Hydrologic Alteration (IHA) software, version 7.1 (The Nature Conservancy, 2009), was used to compute 67 potentially ecologically relevant statistical parameters from the daily mean flow (hereafter referred to as “daily flow”) time series determined by the USGS for the trend gages. The statistics provide information on the following:
-
• magnitude of monthly median flows;
-
• magnitude of annual maxima and minima of n-day average flows (where n = 1, 3, 7, 30, and 90 days);
-
• timing of annual extreme water conditions;
-
• frequency and duration of annual high- and low-flow pulses;
-
• rate and frequency of water-condition changes (rise and fall rates and hydrologic reversals);
-
• median values of low flows during each calendar month;
-
• frequency, duration, and timing of extreme low flows during each water year;
-
• frequency, duration, and timing of high-flow pulses during each water year; and
-
• frequency, duration, and timing of small and large floods during each water year or season.
The classification of daily flow data into different flow categories was based on nonparametric criteria. The IHA software makes three passes through the daily flow data to assign each day to a flow class. During the first pass, each day was initially classified as a low or high flow. During the second pass, all days initially classified as high flows were reclassified as either a small flood, large flood, or high-flow pulse. During the third pass, some days initially classified as low flow were reclassified as extreme low flows. Flows that exceeded the 75th percentile of the daily flows for the period were classified as high flows. All flows below that level initially were classified as low flows; however, low flows were reclassified as extreme low flows if they were less than the 10th percentile of daily flows. High-flow pulses were defined as contiguous periods when the daily flow was greater than or equal to 75 percent of the flow values. Low-flow pulses were defined as contiguous periods when the daily flow was less than or equal to 25 percent of the flow values. A small flood was defined as an initial high flow with a peak having an annual exceedance probability of less than 0.5. A large flood was defined as an initial high flow with an annual exceedance probability of less than 0.1. All high flows not classified as small or large floods were reclassified as high-flow pulses. For more detail on the classification process, see the IHA user’s manual (The Nature Conservancy, 2009).
The Big Darby Creek gage had 97 years of record; the Hellbranch Run and Little Darby Creek gages had much shorter periods of record, with 29 and 25 years of record, respectively. In addition, the Little Darby Creek gage had a 4-year gap in flow record between water years 2005 and 2010, when flow determination was suspended due to lack of funding. The IHA user’s manual (The Nature Conservancy, 2009) suggests 20 years of record as a baseline requirement for the amount of data needed for an IHA analysis. However, more years of record may be needed depending on (1) the degree of climate variability, (2) the frequency or variability of the particular parameter, (3) the severity of the hydrologic alteration being detected, and (4) whether the goal is to characterize the central tendency or range of inter-annual variability (The Nature Conservancy, 2009).
R language scripts (R Core Team, 2017) were developed to process outputs from the IHA analyses and create time-series plots with lowess smooths overlaid on the annual IHA statistics. The lowess smooths were used to assess temporal trends in the IHA statistical parameters. Plots of selected flow-statistic time series computed for this study can be recreated with data and R scripts available in the data release associated with this report (Koltun, 2025).
Results and Discussion
The products of this study include continuous water-quality data collected on Big Darby Creek and time-weighted average concentration data on pesticides, OWCs, and PAHs collected at the three sites on Big and Little Darby Creeks. eDNA qPCR assays were developed for two mussel species and two macroinvertebrate species. Results of the assays on environmental water collected from Big and Little Darby Creeks were gathered. Finally, results are presented for analyses of temporal trends in annual flow statistics and non-exceedance probabilities for three streamflow gaging stations, and for trends in ecologically relevant annual flow statistics computed with the IHA software.
Continuous Water-Quality Monitor Data
Water-quality data measured with the monitors at Big Darby Creek above Georgesville, Ohio can be viewed or downloaded at the USGS National Water Information System database (USGS, 2024a; station 395339083130100). Summary statistics for turbidity, specific conductance, pH, DO, and water temperature measured on Big Darby Creek from April 2020 through November 2022 with the continuous water-quality monitor are shown in table 5. The monitor was deployed in the stream and operated seasonally, not collecting data during the typically coldest months (December through February) due to freezing water temperatures. The turbidity in Big Darby Creek responds quickly to increasing flow by spiking for a few hours and then decreasing to typical conditions of less than 15 Formazin Nephelometric Units. Specific conductance also responds quickly to flow increases by decreasing quickly (a specific conductance range of 250 to 350 microsiemens per centimeter [µS/cm]) and then slowly increasing to its typical range (600 to 800 µS/cm) when the flow recedes. The pH varied over a range (1.8 pH units) with the average and median instantaneous values of 8.2 pH units. DO concentrations generally followed a daily cycle, peaking in early evening and troughing around sunrise, sometimes resulting in swings of more than 10 milligrams per liter (mg/L) in a 24-hour period. For example, on April 20, 2021, DO ranged from 8.6 mg/L to 19.0 mg/L. The swings likely resulted from changes in water temperature, photosynthesis of aquatic plants and algae, and respiration of the entire aquatic community. The minimum instantaneous value of DO concentration recorded during the study was 5.1 mg/L, and the minimum 24-hour average was 6.4 mg/L. As Big Darby Creek is designated a warmwater habitat, the Ohio water-quality criteria for DO for the protection of aquatic life (outside of mixing zones from point discharges) are 4.0 mg/L as an instantaneous minimum and 5.0 mg/L as a minimum 24-hour average (OEPA, 2017). The Ohio water-quality criteria for temperature are 29.4 °C as an instantaneous maximum and 27.8 °C as a maximum 24-hour average (OEPA, 2017). In 2020, there were 10 days when the maximum instantaneous value for temperature recorded during the study exceeded the Ohio water-quality criteria; those temperatures ranged from 29.5 to 30.7 °C. There were three consecutive days in 2020 when the 24-hour average temperatures were 27.9, 28.0, and 28.5 °C, all exceeding the maximum 24-hour average criteria. Often, the days on which temperatures exceeded the threshold were consecutive. A study by Ganser and others (2013) showed negative effects on the survival and physiology of three species of juvenile mussels when exposed to high temperatures ranging from 25.3 to 30.3 °C, with some species experiencing increasing adverse effects over time. Another study showed that elevated water temperatures (25, 30, and 35 °C) in 21-day experiments negatively affected four adult mussel species by altering metabolic rates, consuming vital energy, and hindering survival, growth, and reproduction (Ganser and others, 2015).
Table 5.
Continuous water-quality data summary for Big Darby Creek above Georgesville, Ohio (station 395339083130100), April 2020 through November 2022.[Data from U.S. Geological Survey (2024a). FNU, Formazin Nephelometric Unit; µS/cm, microsiemens per centimeter at 25 degrees Celsius; mg/L, milligram per liter; °C, degree Celsius]
Passive Sampling
Using POCIS and SPMD passive samplers, compounds were detected in stream water. QC results with laboratory fabrication blanks and field blanks for the passive samplers are discussed. Results are broken out by classes of compounds, including pesticides, OWCs, and PAHs. The media used in the passive samplers is designed to integrate water quality over the period of deployment, permitting the computation of time-weighted average concentrations. Estimated time-weighted average water concentrations for pesticides, OWCs, and PAHs determined from samples collected with instream passive samplers and quality assurance data are available in the associated data release (Koltun and others, 2025) and in appendix tables.
QC Results for Passive Samplers
Although blank samples were collected for QC, not all were able to be successfully analyzed against the environmental samples. Two of the six POCIS field blanks were reported damaged during shipment (field blanks for deployments 2 and 3 in 2021). There were 20 pesticide compounds for which a concentration could not be determined in at least one blank due to matrix interference or a ruined sample (appendix table 1.1). Fourteen pesticide compound concentrations (totaling 56 observations, all in 2020) could not be determined in blank samples due to matrix interference and 19 pesticide compound concentrations (totaling 38 observations, all in 2021) could not be determined in blank samples because the samples were ruined during analyses (appendix table 1.1). These QC issues resulted in having 13 pesticide compounds with no field blank quality-control data; however, only 3 of those 13 pesticide compounds (alachlor sulfinylacetic acid [SAA], desulfinylfipronil amide, and fipronil sulfonate) were detected in environmental samples.
There was a total of four pesticide compounds detected in at least one POCIS field blank (all in 2020), and two of those compounds (atrazine and metolachlor) were also detected in the fabrication blank (appendix table 1.2). Those four pesticide compounds were either not detected in the environmental samples or were detected at concentrations lower than concentrations found in the QC samples (appendix tables 1.2 and 1.4). No pesticide compounds were detected in the field or fabrication blanks from 2021.
For OWCs in the POCIS, 35 compounds (92 percent of the 38 OWCs analyzed) were detected in at least one field or fabrication blank, and 11 compounds (29 percent of OWCs analyzed) were detected in all field and fabrication blanks (appendix table 1.5). The majority of the OWC detections in blanks occurred in 2020, when 35 compounds were detected in both field and fabrication blanks. In 2021, only 15 OWCs (39 percent of OWCs analyzed) were detected in at least one field or fabrication blank (appendix table 1.5). The estimated water concentrations of 21 OWCs detected in blanks exceeded at least one corresponding initially uncensored concentration measured in an environmental sample (appendix tables 1.6, 1.7, and 1.8), and so the concentrations of the environmental samples were recensored as described in the “Quality Control for Passive Sampling” section.
The plasticizer diethyl phthalate (DEP) had unusually high background contamination in all fabrication and field blanks across both sampling years. The CERC laboratory could not determine the cause of this contamination, which was a factor of 10–20 times higher than the historical background contamination detected in other studies (David Alvarez, USGS, CERC laboratory, written commun., November 2023). Due to the high blank concentrations and resulting MDL/MQL levels, the CERC laboratory recommended using diethyl phthalate (DEP) results cautiously; consequently, estimated water concentrations for diethyl phthalate (DEP) have been omitted from our summary tables and plots.
Two of the six SPMD field blanks sent for analysis were reported lost or damaged during shipment (field blanks for deployment 3 in 2020 and deployment 1 in 2021). Of the 33 PAHs analyzed in the SPMDs, 28 (85 percent) were detected in one or more field blanks. Seven compounds (1-methylfluorene, 2-methylnaphthalene, 4-methylbiphenyl, fluoranthene, naphthalene, phenanthrene, and pyrene) were detected in all field blanks (appendix table 1.9). Of the 28 PAHs detected in field blanks, 13 were also detected in one or more fabrication blanks. Estimated water concentrations of 10 compounds detected in blanks exceeded initially uncensored concentrations measured in environmental samples, and so their results were re-censored as described in the “Quality Control for Passive Sampling” section (appendix tables 1.10, 1.11, and 1.12).
POCIS Results for Pesticides
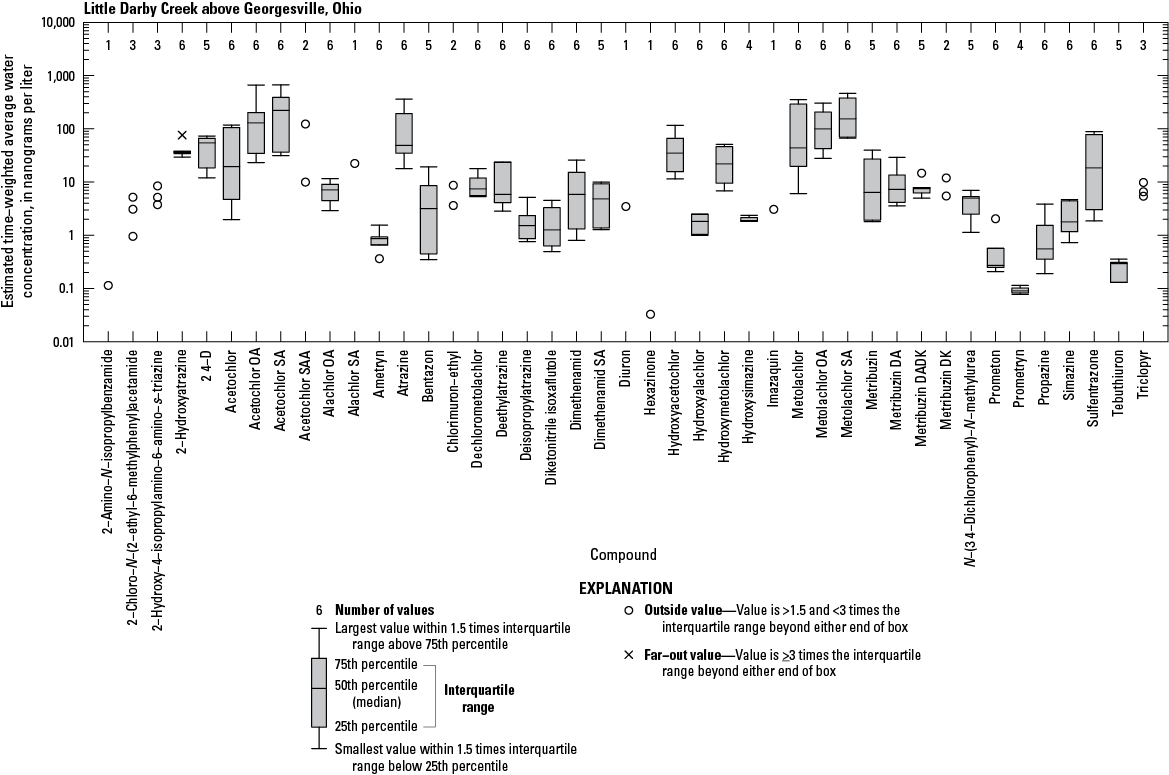
POCIS extracts were analyzed for a total of 204 pesticide and pesticide degradate compounds (appendix table 1.13); 70 pesticide compounds were detected in at least one sample, and 30 of those were detected in all samples (appendix table 1.3 and 1.14). The most detections (305) occurred at the Big Darby Creek above Georgesville, Ohio, site, followed by Little Darby at West Jefferson, Ohio (287), then Little Darby Creek above Georgesville, Ohio (283). Estimated time-weighted average water concentrations for pesticide compounds detected in all deployments are shown in figure 2 (appendix table 1.4). Most of the detections were for herbicides and herbicide degradates, followed by fungicides and fungicide degradates, then by insecticides and insecticide degradates (fig. 3). Some of the highest concentrations of pesticides detected in this study were for herbicides and herbicide degradates. The three highest concentrations of herbicides detected were metolachlor, acetochlor, and atrazine (or their degradates; figs. 4–6). All three compounds (and most of their degradates) were detected in all samples. The maximum time-weighted average concentration for metolachlor was 1,304 ng/L; the degradate, metolachlor oleic acid (OA), had a maximum of 710 ng/L. The maximum time-weighted average concentration for acetochlor was 118 ng/L; the degradate, acetochlor ethanesulfonic acid (SA), had a maximum of 670 ng/L. The maximum time-weighted average concentration for atrazine was 360 ng/L (appendix table 1.3).
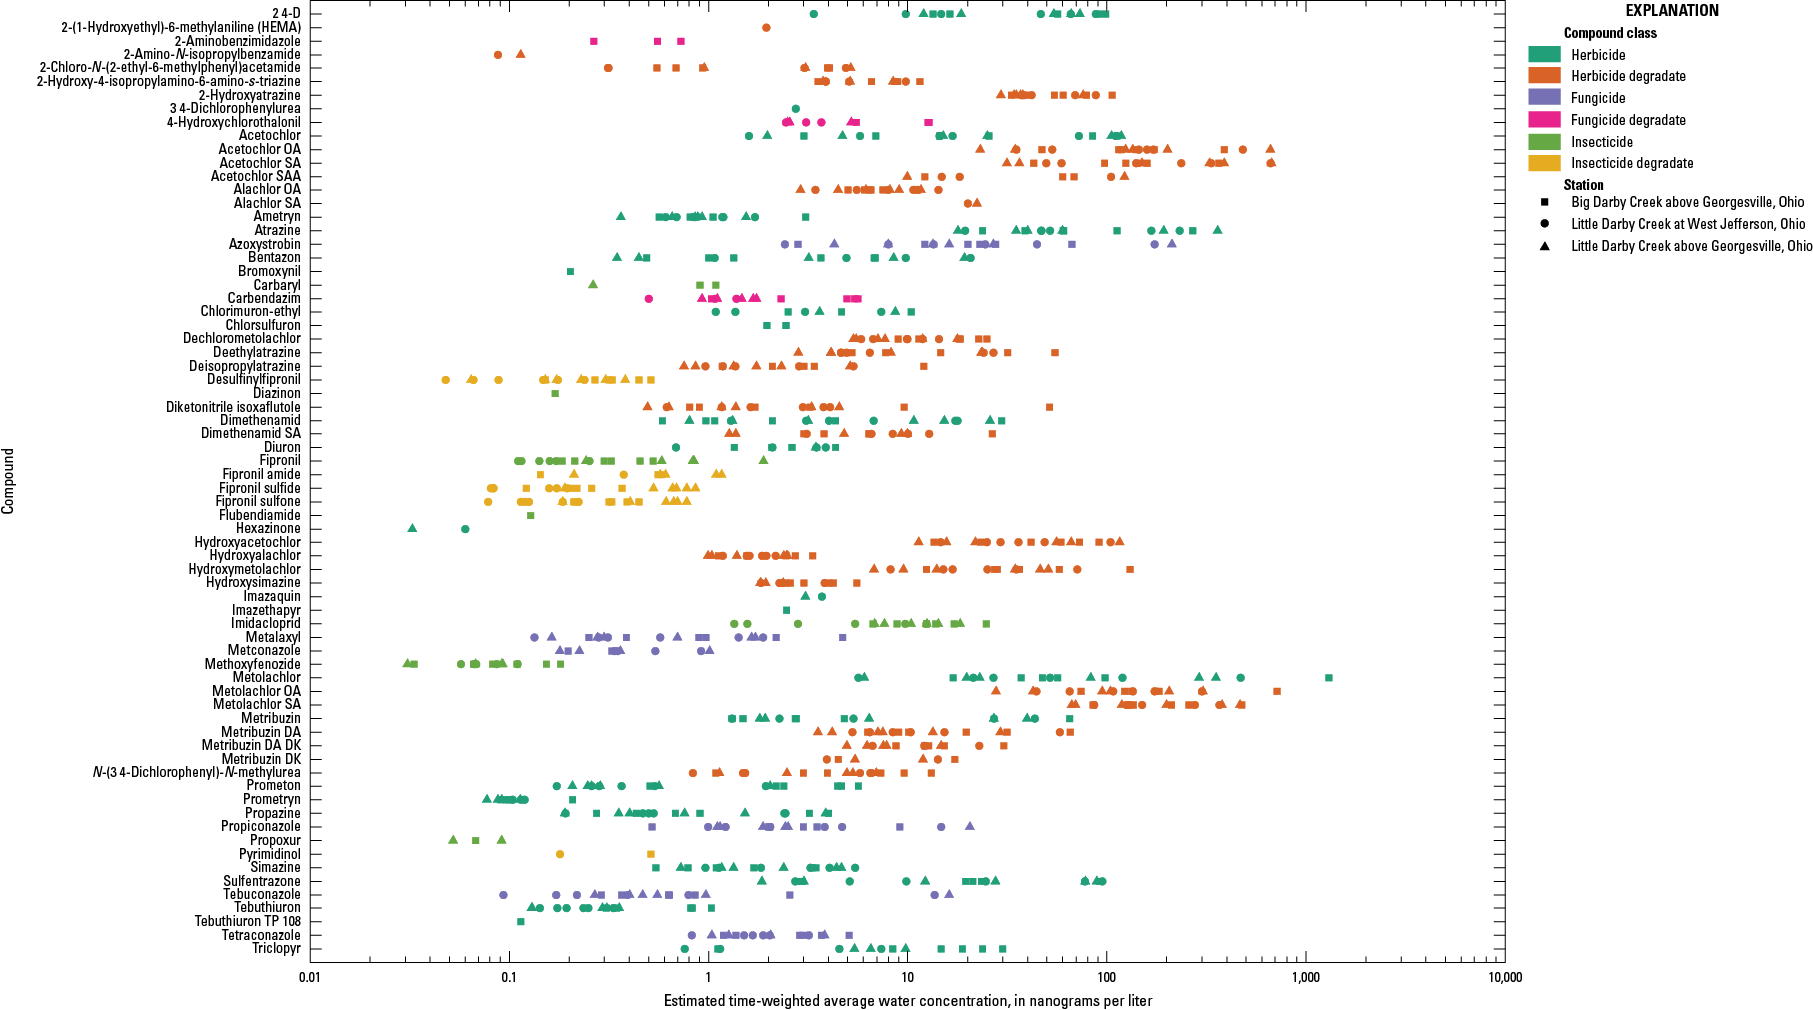
Plot showing the estimated time-weighted average water concentrations of 70 detected pesticide compounds from the polar organic integrative samplers (POCIS), 2020 and 2021.
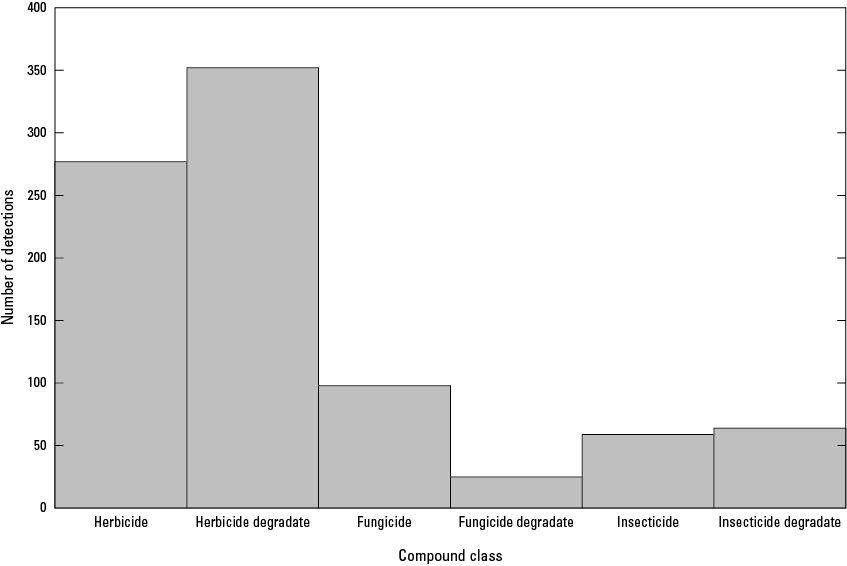
Bar graph showing the frequency of pesticide compound classes detected from the polar organic integrative samplers (POCIS), 2020 and 2021.
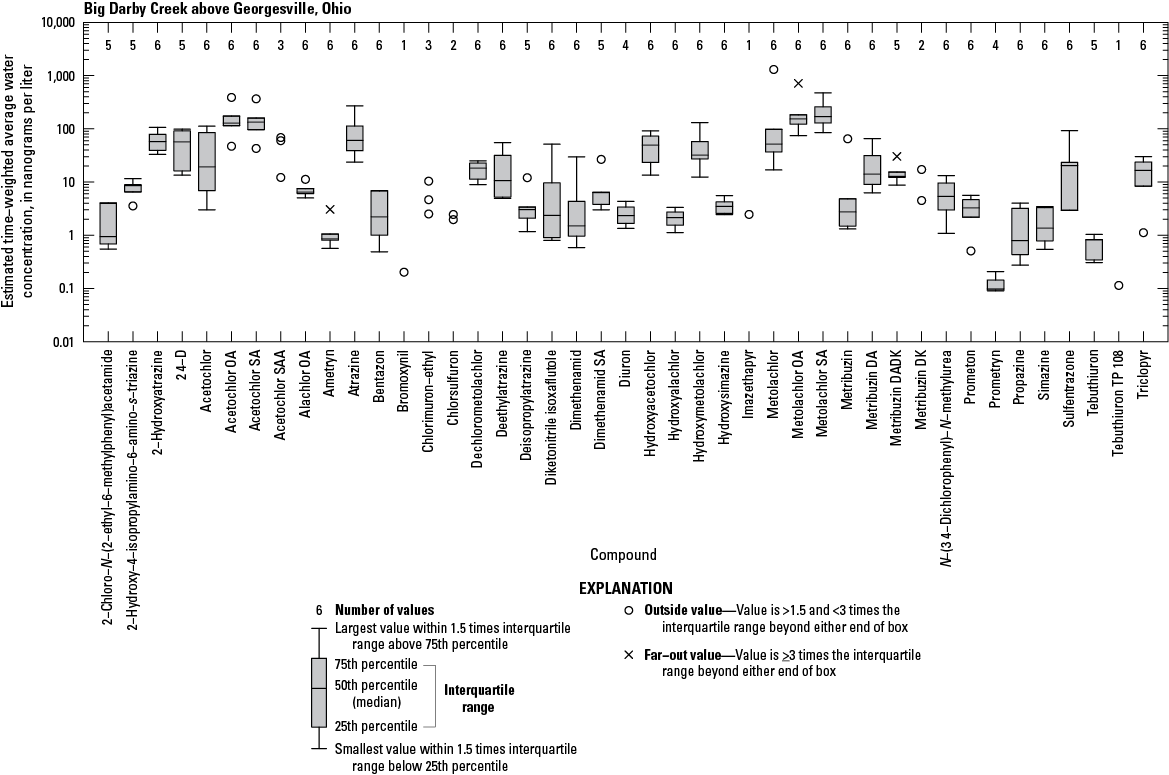
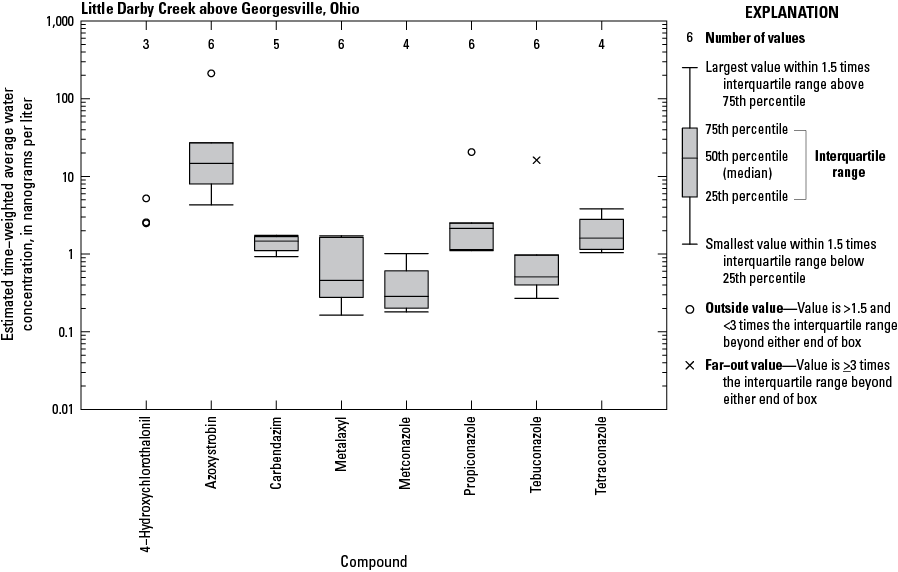
Boxplot showing the estimated time-weighted average water concentration of herbicides and herbicide degradates for Big Darby Creek above Georgesville, Ohio. Boxes are only drawn when there are more than three values; otherwise, individual values are plotted as open circles. 2,4–D, 2,4–dichlorophenoxyacetic acid; OA, olecic acid; SA, ethanesulfonic acid; SAA, sulfinylacetic acid; DA, dimer acid; >, greater than; <, less than; ≥, greater than or equal to.
Boxplot showing the estimated time-weighted average water concentration of herbicides and herbicide degradates for Little Darby Creek above Georgesville, Ohio. Boxes are only drawn when there are more than three values; otherwise, individual values are plotted as open circles. 2,4–D, 2,4–dichlorophenoxyacetic acid; OA, olecic acid; SA, ethanesulfonic acid; SAA, sulfinylacetic acid; DA, dimer acid; >, greater than; <, less than; ≥, greater than or equal to.
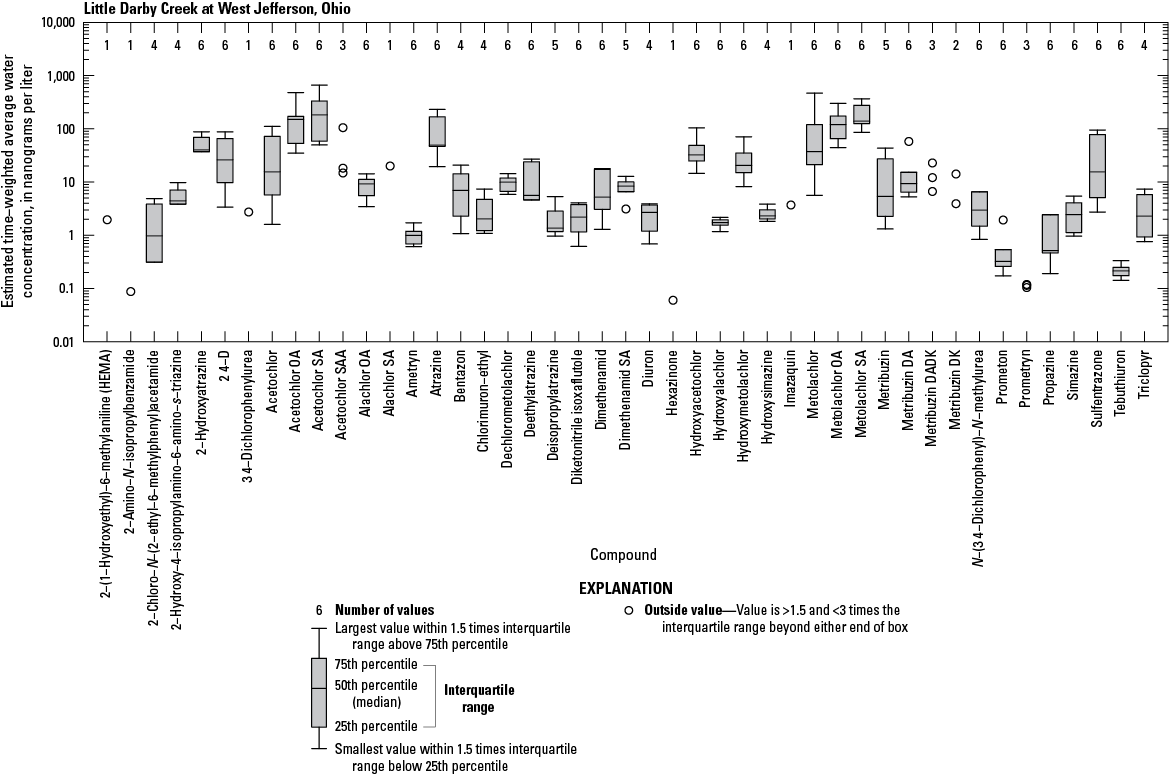
Boxplot showing the estimated time-weighted average water concentration of herbicides and herbicide degradates for Little Darby Creek at West Jefferson, Ohio. Boxes are only drawn when there are more than three values; otherwise, individual values are plotted as open circles. 2,4–D, 2,4–dichlorophenoxyacetic acid; OA, olecic acid; SA, ethanesulfonic acid; SAA, sulfinylacetic acid; DA, dimer acid; >, greater than; <, less than.
None of the pesticides detected in the POCIS with aquatic life benchmarks established by the U.S. Environmental Protection Agency (EPA) had concentrations that exceeded the chronic exposure benchmarks (EPA, 2023) for freshwater invertebrates. Three herbicides (atrazine, ametryn, and metribuzin) and one herbicide degradate (deethylatrazine [DEA or desethylatrazine]) were detected in at least 88 percent of samples (appendix tables 1.3 and 1.4). These same compounds have been found to strongly affect the physiology of the Pyganodon grandis (giant floater) mussels in Maumee River, Ohio (Roznere and others, 2023). The maximum concentrations detected in the Big Darby Creek Basin for selected compounds are within the range of the concentrations detected in the Maumee River study. Atrazine (detected in all samples in this study) was ranked 11 out of 44 compounds by Roznere and others (2023) as strongly correlated with changes in the mussel’s hemolymph metabolites, likely negatively impacting mussel health.
The fungicides with the highest median concentrations of detection were azoxystrobin and propiconazole (figs. 7–9), which were detected in all samples. Azoxystrobin and propiconazole are systemic fungicides frequently used to treat fungal lawn diseases, as well as some other fungal plant diseases. Bringolf and others (2007) found that propiconazole was acutely toxic to glochidia and juveniles of the Lampsilis siliquoidea (fatmucket) mussel species, with juveniles being more sensitive than glochidia.
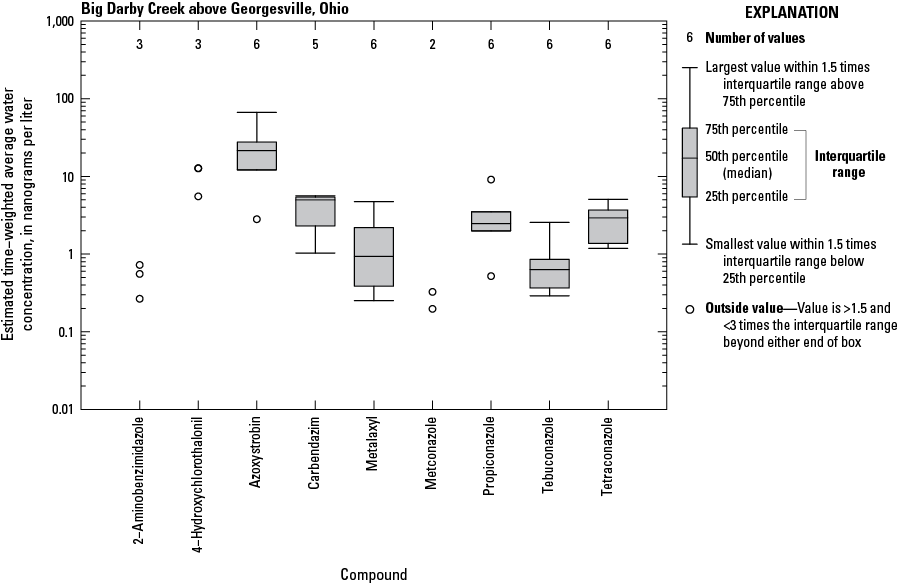
Boxplot showing the estimated time-weighted average water concentration of fungicide and fungicide degradates for Big Darby Creek above Georgesville, Ohio. Boxes are only drawn when there are more than three values; otherwise, individual values are plotted as open circles. >, Greater than; <, less than.
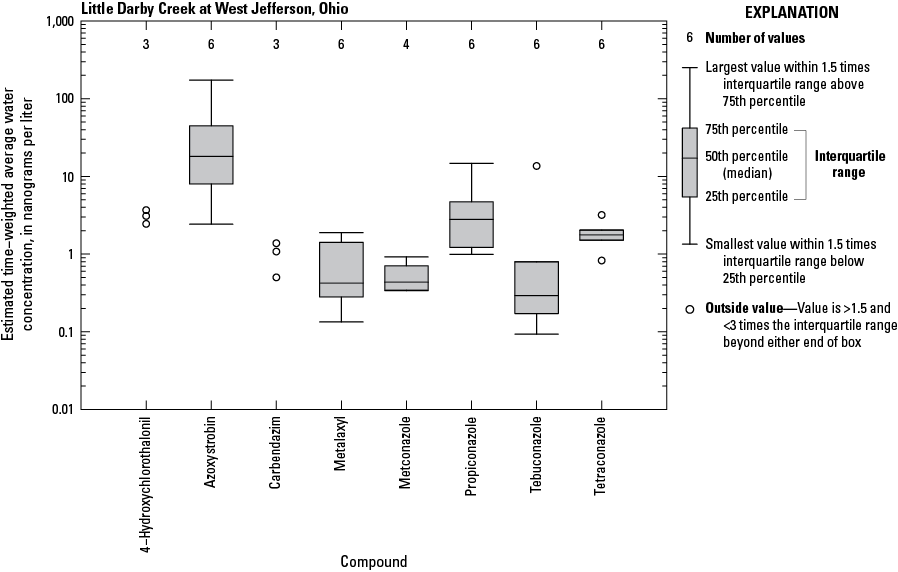
Boxplot showing the estimated time-weighted average water concentration of fungicide and fungicide degradates for Little Darby Creek at West Jefferson, Ohio. Boxes are only drawn when there are more than three values; otherwise, individual values are plotted as open circles. >, Greater than; <, less than.
Boxplot showing the estimated time-weighted average water concentration of fungicide and fungicide degradates for Little Darby Creek above Georgesville, Ohio. Boxes are only drawn when there are more than three values; otherwise, individual values are plotted as open circles. >, Greater than; <, less than; ≥, greater than or equal to.
Imidacloprid, a neonicotinoid insecticidal compound, was detected in all samples with maximum concentrations of 24.87, 12.43, and 18.33 ng/L at the three sites (figs. 10–12; appendix table 1.3). Imidacloprid has been shown to bioaccumulate in mussels and have a variety of effects on their behavior, physiology, and biochemistry; however, it generally had no negative effect on mortality (Ewere and others, 2021). Fipronil, an insecticide used in agriculture and veterinary medicine, was also detected in all samples. In a study conducted by Arslan and Günal (2023), fipronil was found to cause histopathological alterations to the gills and digestive glands of a freshwater mussel (the Unio delicatus) found in Turkey and Syria, and the authors concluded that sublethal concentrations of fipronil were toxic to freshwater mussels. Bringolf and others (2007) assessed the toxicities of various current-use pesticides to the glochidia and juveniles of several other freshwater mussel species and concluded that technical-grade fipronil was not acutely toxic to the mussels when exposed in 24-, 48-, and 96-hour tests. Fipronil is readily absorbed by sediment; however, little is known about sediment as a vector for exposure to juvenile mussels, which live one or more years buried in the substrate, nor is much known about the effects of chronic exposure to fipronil on mussels (chronic toxicity tests are 21 days; Bringolf and others, 2007).
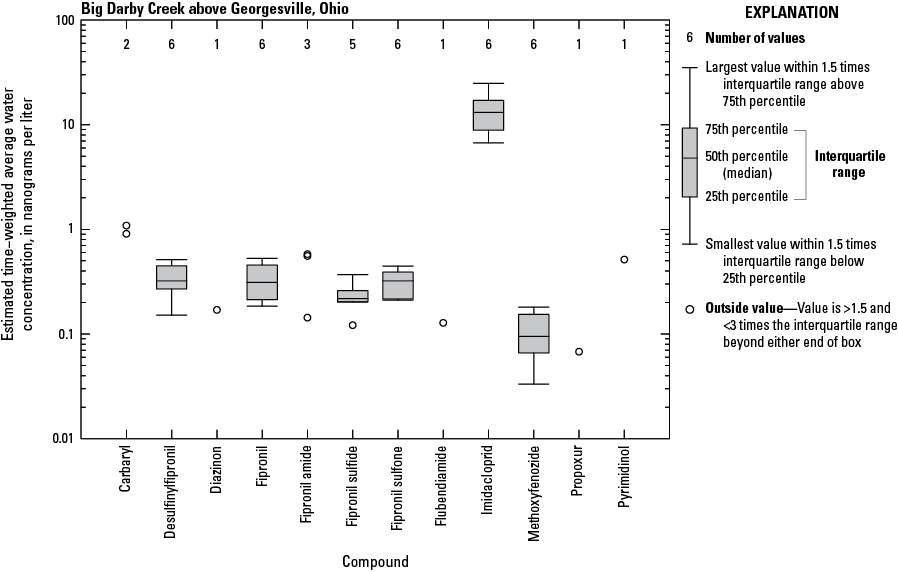
Boxplot showing the estimated time-weighted average water concentration of insecticide and insecticide degradates for Big Darby Creek above Georgesville, Ohio. Boxes are only drawn when there are more than three values; otherwise, individual values are plotted as open circles. >, Greater than; <, less than.
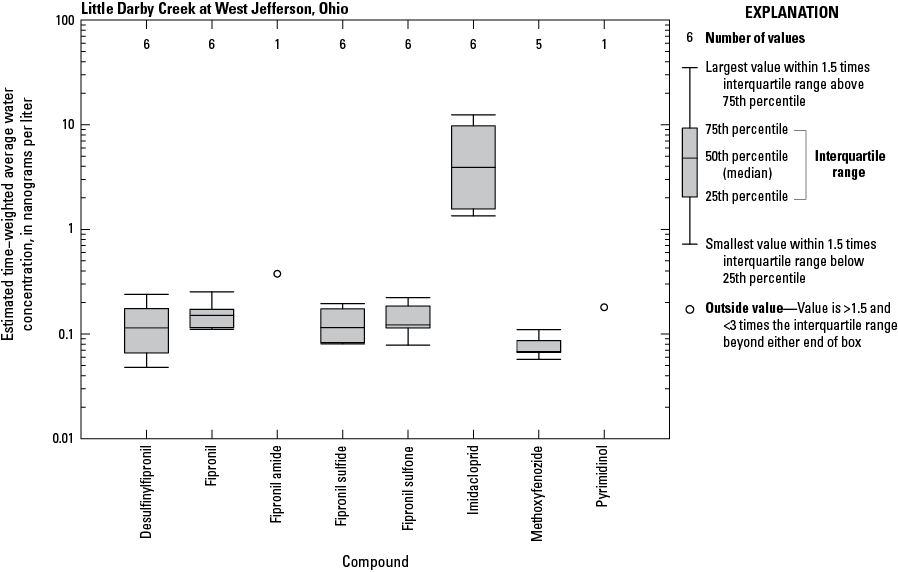
Boxplot showing the estimated time-weighted average water concentration of insecticide and insecticide degradates for Little Darby Creek at West Jefferson, Ohio. Boxes are only drawn when there are more than three values; otherwise, individual values are plotted as open circles. >, Greater than; <, less than.
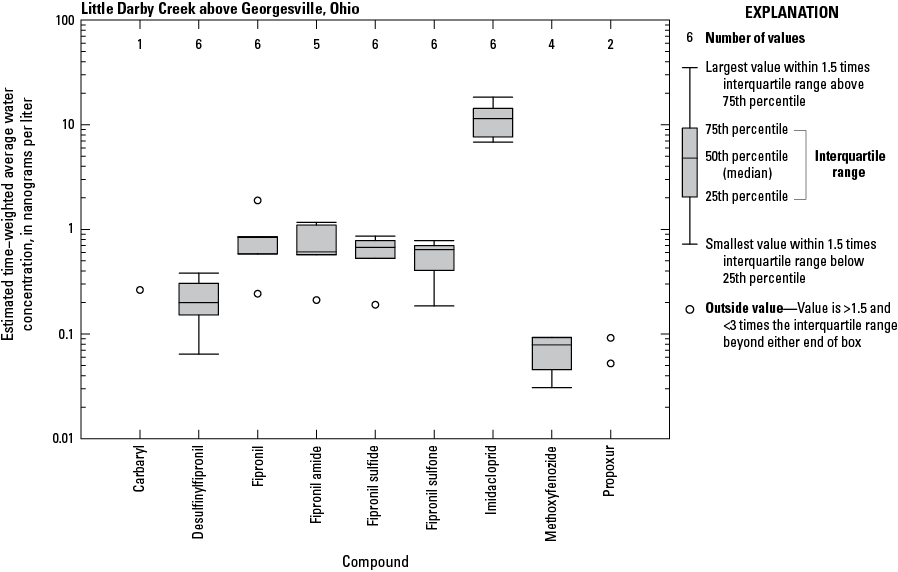
Boxplot showing the estimated time-weighted average water concentration of insecticide and insecticide degradates for Little Darby Creek above Georgesville, Ohio. Boxes are only drawn when there are more than three values; otherwise, individual values are plotted as open circles. >, Greater than; <, less than.
POCIS Results for OWCs
POCIS extracts were analyzed for a total of 38 OWCs (appendix table 1.15), and 24 compounds were detected in at least one sample (appendix tables 1.6 and 1.17). The most OWC detections (71) occurred at Little Darby Creek above Georgesville, Ohio, followed by Big Darby Creek above Georgesville, Ohio (64), and Little Darby Creek at West Jefferson, Ohio (63). Estimated time-weighted average water concentrations for OWCs detected in all deployments are shown in figure 13, and boxplots showing the distribution of estimated time-weighted average water concentrations for OWCs detected at each site are shown in figures 14–16 (appendix tables 1.7 and 1.8).
One of the OWCs, DEET, was detected in all samples. The maximum concentrations of DEET detected in the Big Darby Creek Basin are within the range of the concentrations detected by Roznere and others (2023) in the Maumee River study. Roznere and others (2023) ranked DEET as 8 out of 44 compounds found to be strongly correlated with changes in metabolites in mussels (table 6). N-Butylbenzenesulfonate was detected in 94 percent of samples, and four other compounds were detected in over 80 percent of the samples. Galaxolide and tonalide were detected in 89 and 61 percent of samples, respectively. Galaxolide and tonalide are fragrance compounds known to be endocrine disruptors and for bioaccumulating (Lefebvre and others, 2017). Other detections in the majority of samples included three flame retardants (Tris(1-chloro-2-propyl)phosphate, Tris(2-chloroethyl)phosphate, and Tris(1,3-dichloro-2-propyl)phosphate).
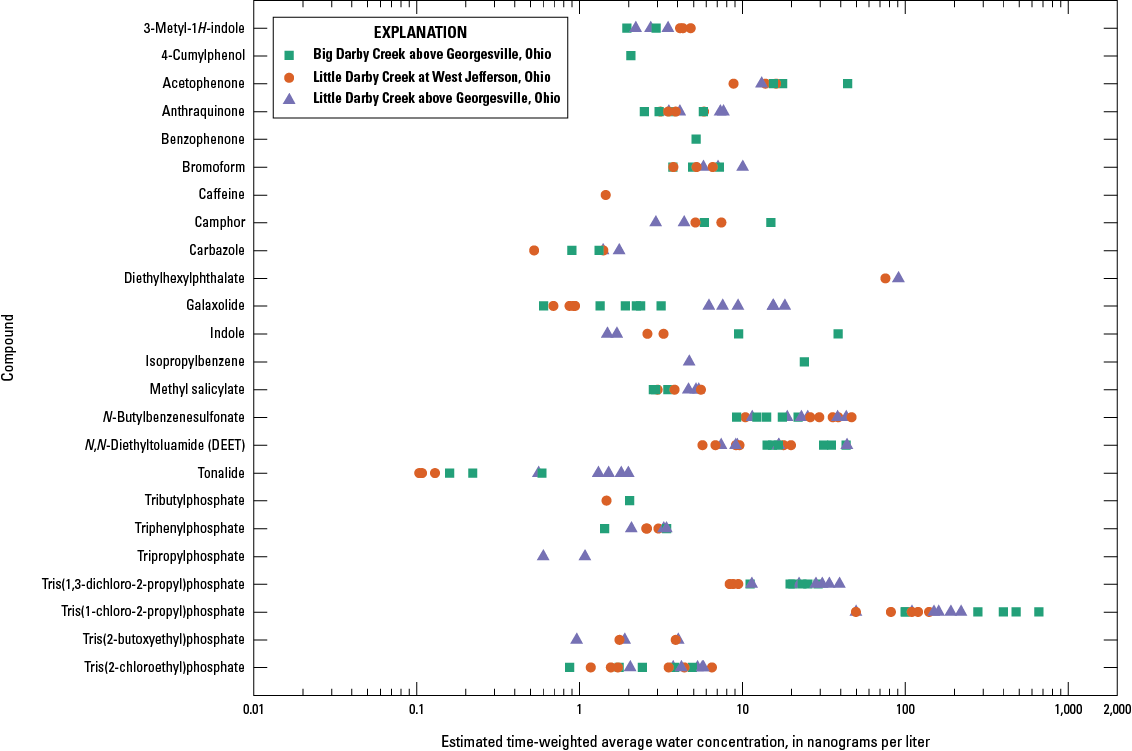
Plot showing the estimated time-weighted average water concentrations of 24 detected organic wastewater compounds from the polar organic integrative samplers (POCIS), 2020 and 2021.
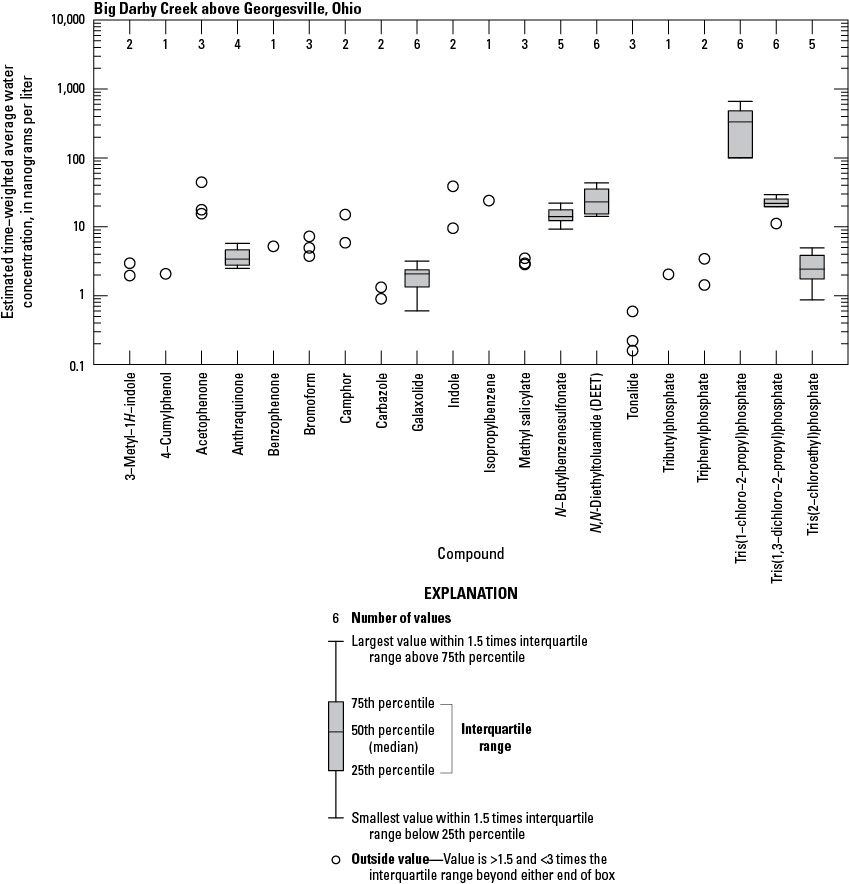
Boxplot showing the estimated time-weighted average water concentration of organic wastewater compounds for Big Darby Creek above Georgesville, Ohio. Boxes are only drawn when there are more than three values; otherwise, individual values are plotted as open circles. >, Greater than; <, less than.
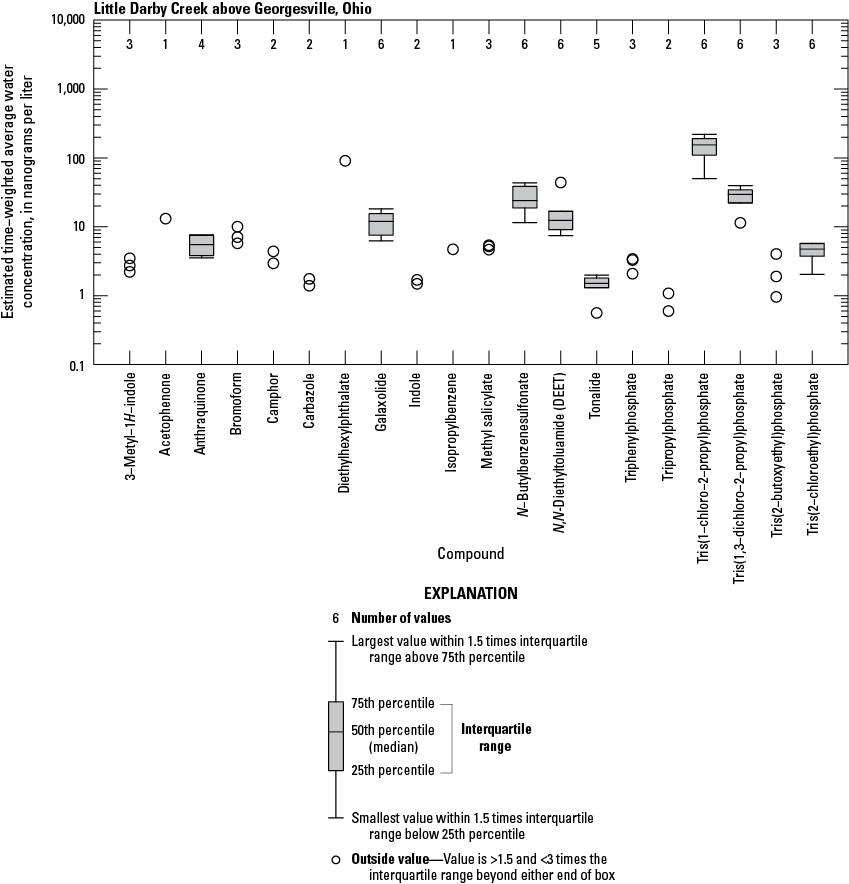
Boxplot showing the estimated time-weighted average water concentration of organic wastewater compounds for Little Darby Creek above Georgesville, Ohio. Boxes are only drawn when there are more than three values; otherwise, individual values are plotted as open circles. >, Greater than; <, less than.
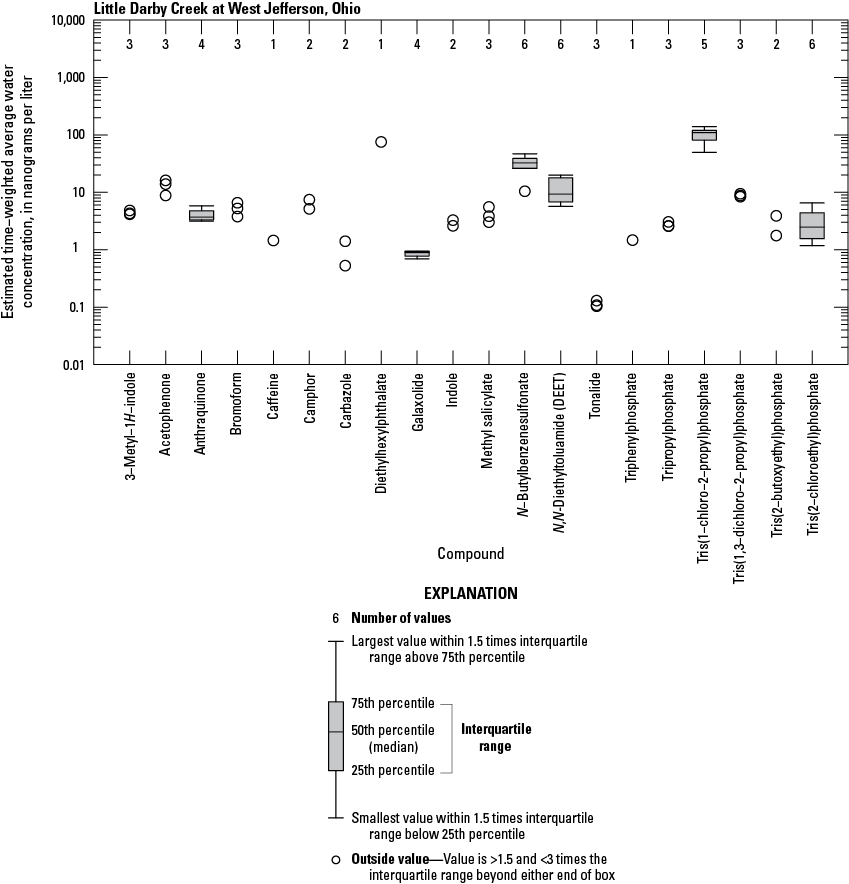
Boxplot showing the estimated time-weighted average water concentration of organic wastewater compounds for Little Darby Creek at West Jefferson, Ohio. Boxes are only drawn when there are more than three values; otherwise, individual values are plotted as open circles. >, Greater than; <, less than.
Table 6.
Ranges of at-site maximum concentrations of selected pesticides and organic wastewater compounds in the Big Darby Creek Basin and the Maumee River, Ohio.[Data from this study (Koltun and others, 2025); concentration results reported in parts per million by Roznere and others (2023) converted to nanograms per liter by multiplying by 1,000,000. ng/L, nanogram per liter of water; DEET, N,N-diethyltoluamide; nc, not computed]
Data from this study (Koltun and others, 2025).
Data from Roznere and others (2023).
Rankings of selected compounds whose concentrations significantly covaried with changes in mussel metabolite levels. Forty-four compounds were ranked, with a ranking of 1 indicating the strongest correlation. Contaminants that elicit the greatest biological response are most likely to have detrimental effects on mussel health.
SPMD Results for PAHs
SPMD media extracts were analyzed for 33 PAHs (appendix table 1.16); 29 compounds were detected in at least one sample, and 12 of those 29 were detected in all samples (appendix table 1.10). Of those 12 compounds detected in all samples, eight are on the EPA’s priority pollutant list (Hussar and others, 2012; EPA, 2024). The most PAH detections (133) occurred at Little Darby Creek at West Jefferson, Ohio, followed by Little Darby Creek above Georgesville, Ohio (131), and Big Darby Creek above Georgesville, Ohio (112). Estimated time-weighted average water concentrations for PAHs detected in all deployments are shown in figure 17. Of those PAHs detected in all samples, phenanthrene had the highest time-weighted average concentration (3,300 picograms per liter [pg/L]), followed by fluoranthene (2,100 pg/L). Nine other compounds had concentrations ranging between 50 and 800 pg/L (appendix tables 1.10, 1.11, 1.12; figs. 18–20). Fluoranthene is of environmental concern because of its potential toxicity to humans and other organisms and its prevalence and persistence in the environment. Some PAHs, like fluoranthene, can become several orders of magnitude more toxic in the presence of ultraviolet wavelengths of natural sunlight (Weinstein, 2002). A study involving the larval stages of a freshwater mussel (the Utterbackia imbecillis) found in some Ohio streams indicated they are very sensitive to ultraviolet-induced PAH toxicity (Weinstein, 2002).
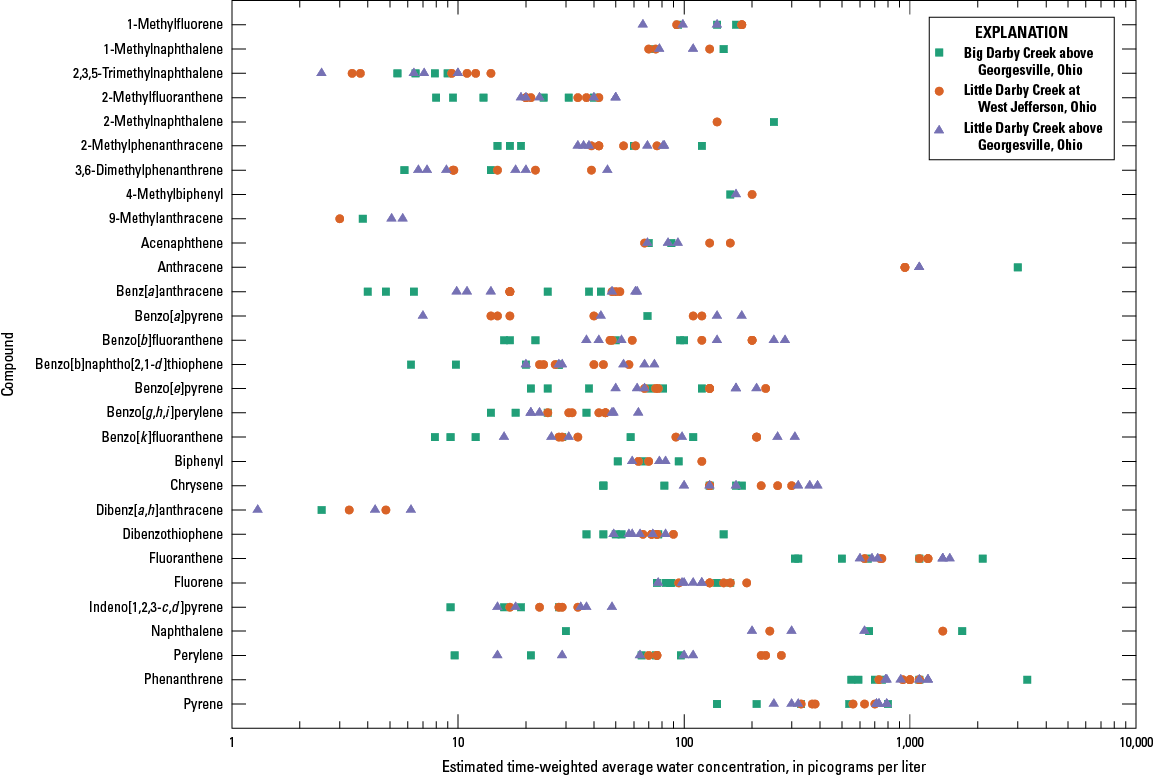
Plot showing estimated time-weighted average water concentration for 29 polycyclic aromatic hydrocarbons (PAHs) detected from the semipermeable membrane device (SPMD) passive samplers deployed during 2020 and 2021.
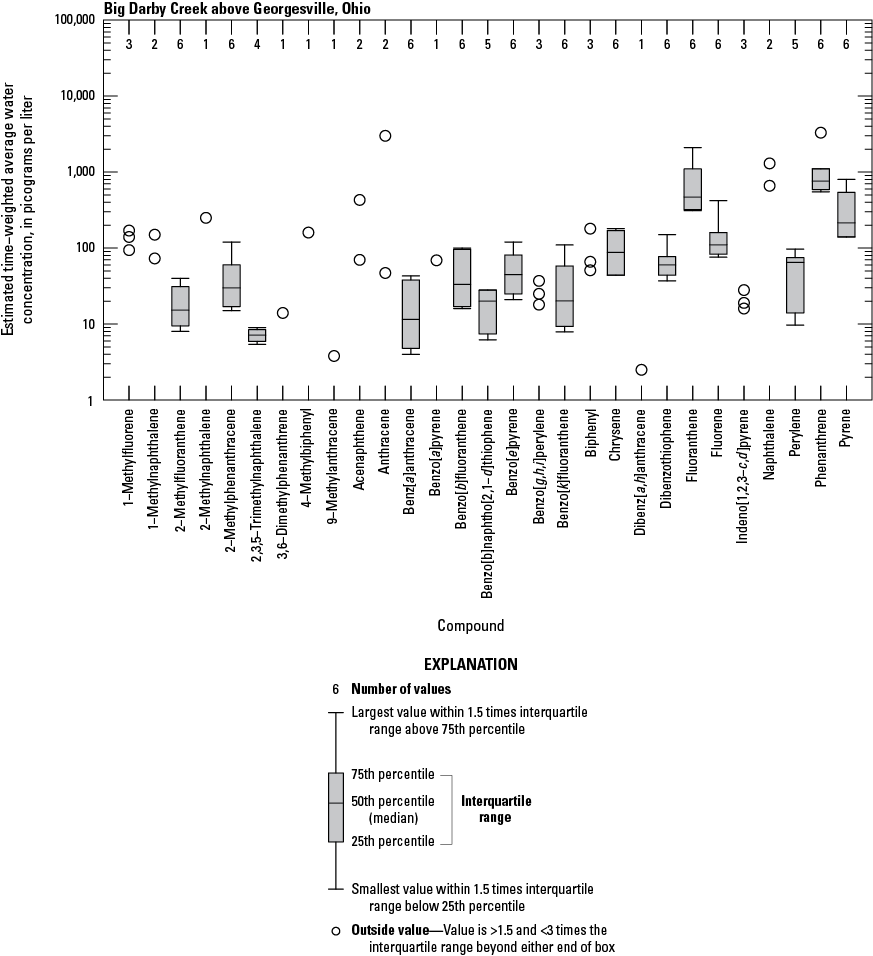
Boxplot showing the estimated time-weighted average water concentration of polycyclic aromatic hydrocarbons (PAHs) for Big Darby Creek above Georgesville, Ohio. Boxes are only drawn when there are more than three values; otherwise, individual values are plotted as open circles. >, Greater than; <, less than.
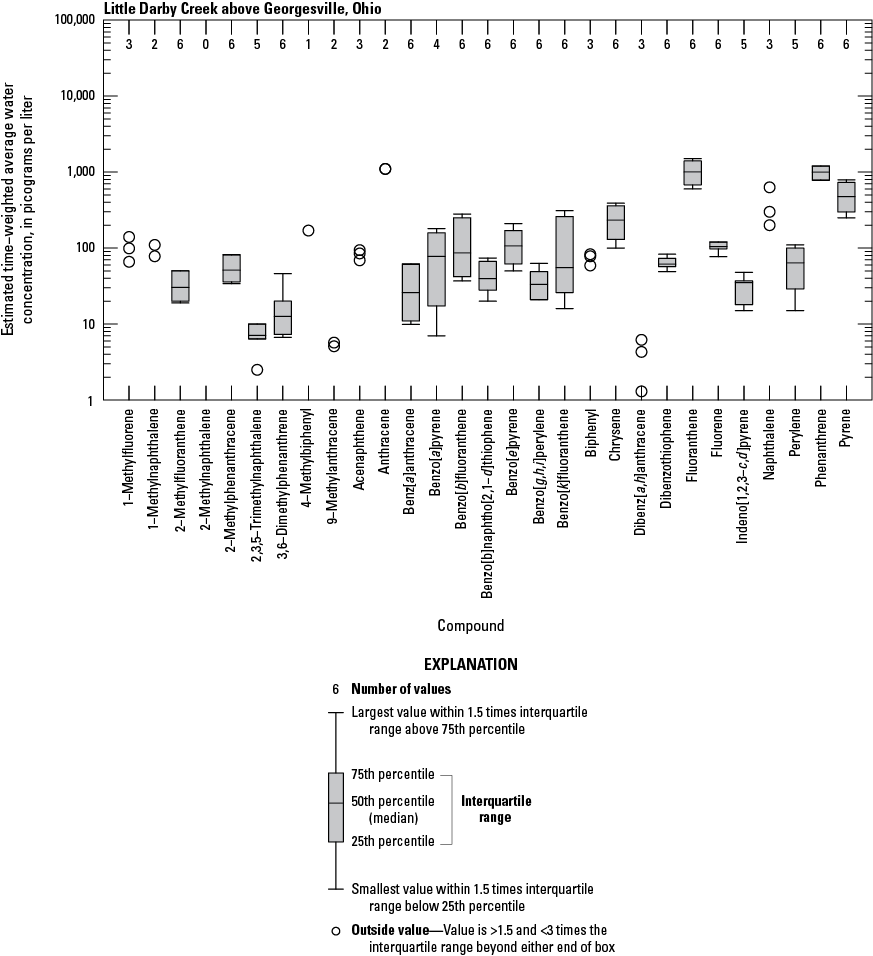
Boxplot showing the estimated time-weighted average water concentration of polycyclic aromatic hydrocarbons (PAHs) for Little Darby Creek above Georgesville, Ohio. Boxes are only drawn when there are more than three values; otherwise, individual values are plotted as open circles. >, Greater than; <, less than.
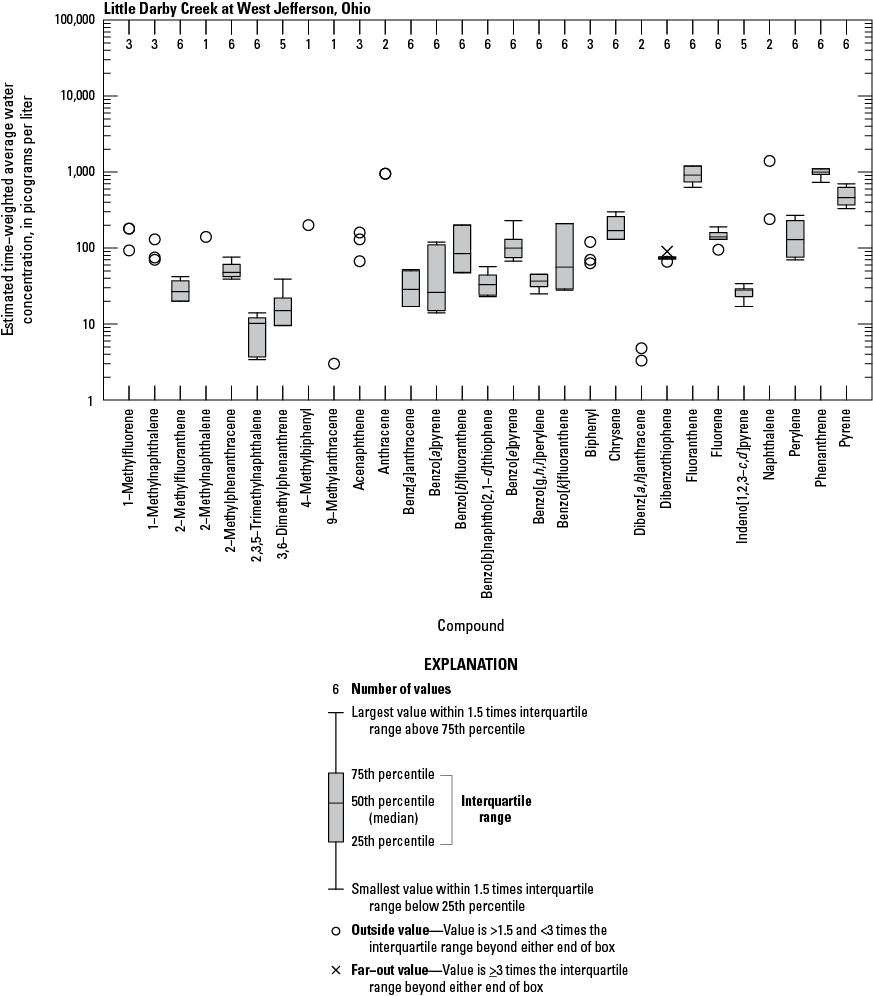
Boxplot showing the estimated time-weighted average water concentration of polycyclic aromatic hydrocarbons (PAHs) for Little Darby Creek at West Jefferson, Ohio. Boxes are only drawn when there are more than three values; otherwise, individual values are plotted as open circles. >, Greater than; <, less than; ≥, greater than or equal to.
eDNA qPCR Assay Validation
All eDNA qPCR assays that were developed and optimized at the OWML required validation to ensure the assays would work in the environment. To validate the kidneyshell eDNA qPCR assay, water samples were collected and analyzed from troughs at the Columbus Zoo and Aquarium Freshwater Mussel Conservation and Research Center that contained live kidneyshell mussel specimens. Every trough that contained kidneyshell mussels had detectable levels of kidneyshell COI genes, and the filtered intake water from the Scioto River that feeds the troughs within the facility had no detectable kidneyshell COI genes. This validated the kidneyshell eDNA qPCR assay and indicated no kidneyshell eDNA contamination was present from outside the facility.
The northern riffleshell eDNA qPCR assay was more difficult to validate in the environment due to the northern riffleshell being an endangered species. At the time of this study, the Columbus Zoo and Aquarium Freshwater Mussel Conservation and Research Center did not have live specimens of the northern riffleshell mussel. Water samples were collected from the Big and Little Darby Creeks near locations where specimens of northern riffleshell mussels were previously located based on detailed survey data from 2017 provided by the Midwest Biodiversity Institute and the Darby Creek Association. The Columbus Zoo and Aquarium Freshwater Mussel Conservation and Research Facility also provided additional detailed survey data for site locations with northern riffleshell mussels (Trisha Gibson, The Ohio State University Museum of Biological Diversity, written commun., 2022). No samples from the Big and Little Darby Creeks had detectable northern riffleshell COI genes; to confirm that these samples were truly negative, another location with a known population of northern riffleshell mussels was needed to validate this assay. A researcher working at French Creek near Meadville, Pennsylvania, knew of the location of an estimated population of 100 specimens of northern riffleshell mussels and agreed to collect and send water samples to the OWML (Philip Mathias, EnviroScience Inc., written commun., 2022). Two samples were collected and analyzed from French Creek; both samples had detectable levels of northern riffleshell COI genes, which validated the northern riffleshell eDNA qPCR assay.
To validate the C. obscura and M. pulchellum eDNA qPCR assays, water samples from the Big and Little Darby Creeks were collected slightly downstream from and concurrently with OEPA’s processing of Hester-Dendy substrate samplers. All OEPA Hester-Dendy substrate samplers contained C. obscura and M. pulchellum specimens, and all the associated water samples tested positive for both target species. Environmental nondetects occurred throughout the study for both targets. These confirmed detections support the effectiveness of these assays.
eDNA in Big and Little Darby Creeks
A total of 28 eDNA samples were collected between June and October in 2020 and 2021 at Big Darby Creek above Georgesville, Ohio (9 samples), Little Darby Creek above Georgesville, Ohio (8 samples), and Little Darby Creek at West Jefferson, Ohio (11 samples). An additional 20 eDNA samples were collected from other sites on Big Darby Creek in November 2021 and April 2022. Those additional 20 samples were collected at sites where northern riffleshell mussels had been found in the past in an attempt to obtain at least one sample that contained northern riffleshell COI genes. M. pulchellum and kidneyshell COI genes were detected most frequently. For M. pulchellum COI genes, the percentage of detections at sites ranged from 73 to 100 percent. Kidneyshell COI genes were detected in 100 percent of the samples from Big Darby Creek above Georgesville, Ohio, and Little Darby Creek at West Jefferson, Ohio, but in less than 50 percent of the samples from the other sites (table 7). By contrast, northern riffleshell COI genes were not detected in any samples from Big or Little Darby Creeks.
Table 7.
Percentage of detections of environmental deoxyribonucleic acid (eDNA) quantitative polymerase chain reaction (qPCR) assays for freshwater mussel and macroinvertebrate species by sampling location, Big Darby Creek Basin, Ohio, 2020–22.[Locations shown in figure 1 and table 2. Data from U.S. Geological Survey (2024a); ID, identification; n, number of samples]
Flow Trends
The ability to detect temporal trends in annual flow statistics depends on the amount of short-term temporal variation (noise) in the flow statistics, the length of record analyzed, and the strength of the trends. Because of the relatively short data records for the Hellbranch Run and Little Darby Creek gages, the bulk of the following trend discussions will focus on Big Darby Creek, except when indications of trend at Hellbranch Run and Little Darby Creek appeared to be strong enough to provide reasonable confidence that they were not an artifact of outlier values. For example, though zero-flow days were common for the Hellbranch Run gage (occurring in 20 out of 29 years), they were rare at the Little Darby Creek gage (occurring in only 2 out of 25 years) and did not occur at all at the Big Darby Creek gage.
Trends in Annual Flow Statistics
Trends in annual minimum daily flows were analyzed on a climatic year basis (April through March), and trends in all other annual statistics (mean, median, and maximum daily flows) were analyzed on a water year basis (October through September). The median trend slopes (Sen’s slopes) for these statistics for Big Darby Creek were positive (ranging from 0.4 to 0.8 percent change per year), indicating the statistics increased over time. Mann-Kendall test results indicated the trend slopes were statistically significant (indicating rejection of the zero-slope null hypothesis) for all the statistics except the annual maximum daily flow (figs. 21–24). For the Hellbranch Run and Little Darby Creek gages, trend slopes were positive for annual minimum, mean, and median daily flows and negative for annual maximum daily flows; however, none of the trend slopes at these sites were statistically significant.

Scatter plot of the annual minimum daily flow by climatic year (1921 to 2020) for Big Darby Creek at Darbyville, Ohio, where the Sen’s slope estimate is 0.83 percent per year and the p-value for the Mann-Kendall trend test is 0.018. Lowess smooth, locally weighted scatterplot smoothing line.
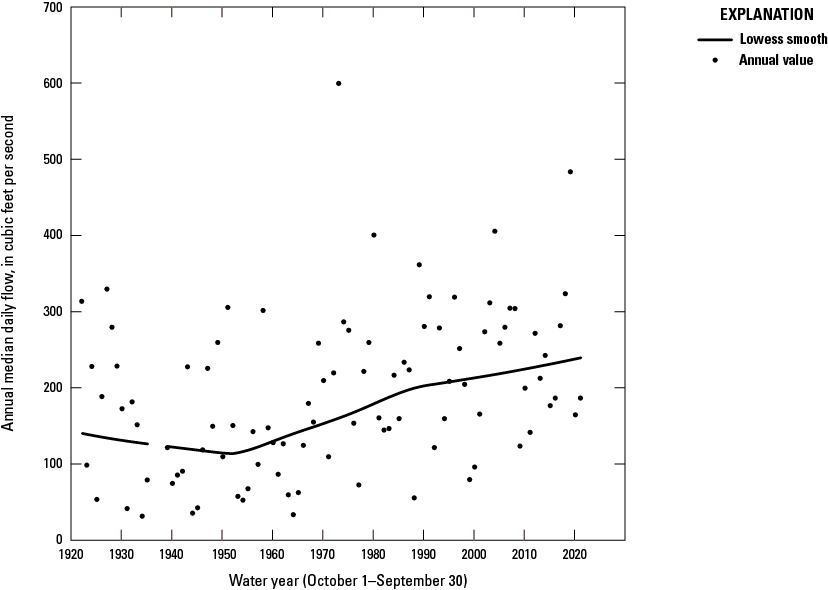
Scatter plot of the annual median daily flow by water year (1922 to 2021) for Big Darby Creek at Darbyville, Ohio, where the Sen’s slope estimate is 0.8 percent per year and the p-value for the Mann-Kendall trend test is 0.0015. Lowess smooth, locally weighted scatterplot smoothing line.
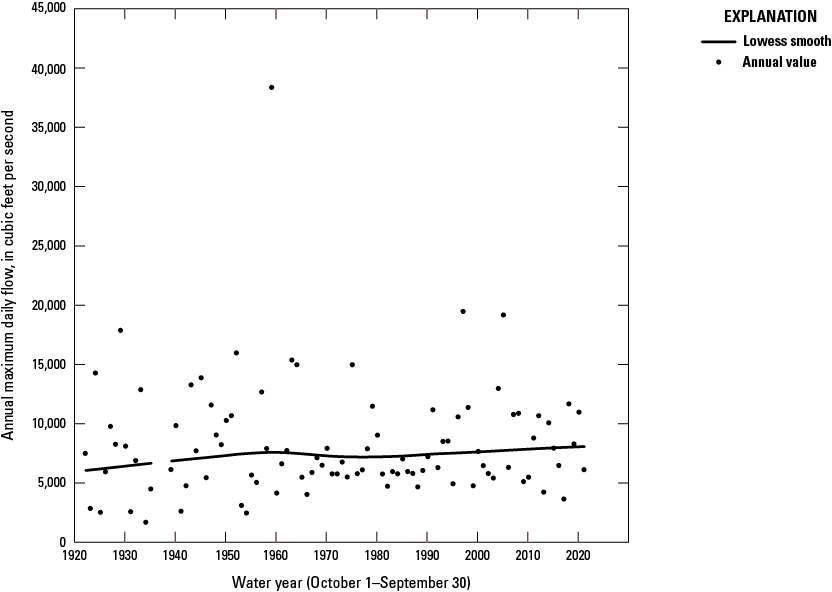
Scatter plot of the annual maximum daily flow by water year (1922 to 2021) for Big Darby Creek at Darbyville, Ohio, where the Sen’s slope estimate is 0.11 percent per year and the p-value for the Mann-Kendall trend test is 0.493. Lowess smooth, locally weighted scatterplot smoothing line.

Scatter plot of the annual mean daily flow by water year (1922 to 2021) for Big Darby Creek at Darbyville, Ohio, where the Sen’s slope estimate is 0.4 percent per year and the p-value for the Mann-Kendall trend test is 0.011. Lowess smooth, locally weighted scatterplot smoothing line.
Trends in Daily Nonexceedance Probabilities
Quantile-Kendall plots provide information on how flow trended over time that is different than the information provided by Mann-Kendall tests on annual flow statistics. To develop the Quantile-Kendall plot, flows associated with a series of daily nonexceedance probabilities are determined for each year of record. Trend slopes are then computed for the period of record for each nonexceedance probability. The trend slopes were evaluated for statistical significance with Mann-Kendall tests. Trend slopes were positive for all nonexceedance probabilities for the Big Darby Creek gage, indicating that the flow values associated with the daily nonexceedance probabilities are increasing over time. The trend slopes were largest, with average slopes greater than about 0.8 percent change per year, at lower nonexceedance probabilities (lower flows) and became gradually smaller but still positive at higher nonexceedance probabilities (fig. 25). The trend slopes were statistically significant except at nonexceedance probabilities greater than about 0.96. The trend slopes for the Hellbranch Run and Little Darby Creek gage records (figs. 26 and 27) for all nonexceedance probabilities were mostly positive or zero and predominantly not statistically significant. At both the Hellbranch Run and Little Darby Creek gages, some negative trend slopes were observed for higher flows with nonexceedance probabilities greater than 0.90.
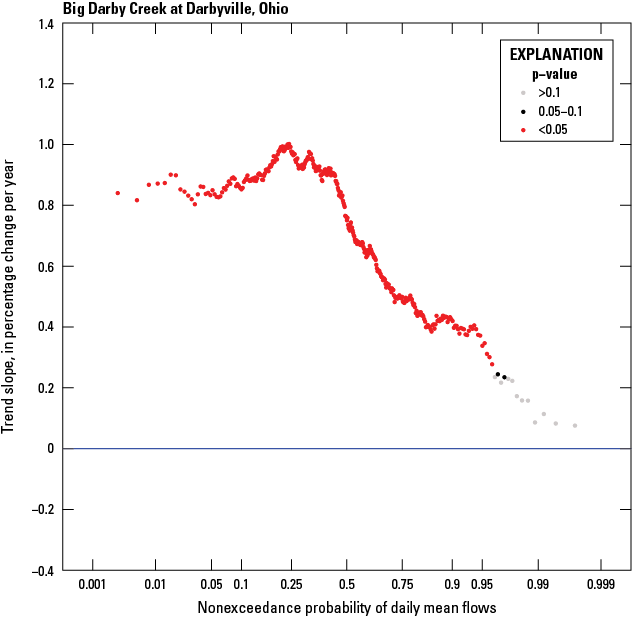
Quantile-Kendall plot for Big Darby Creek at Darbyville, Ohio, based on data from October 1, 1921, through September 30, 2021. >, Greater than; <, less than.

Quantile-Kendall plot for Hellbranch Run near Harrisburg, Ohio, based on data from October 1, 1992, through September 30, 2021. >, Greater than; <, less than.
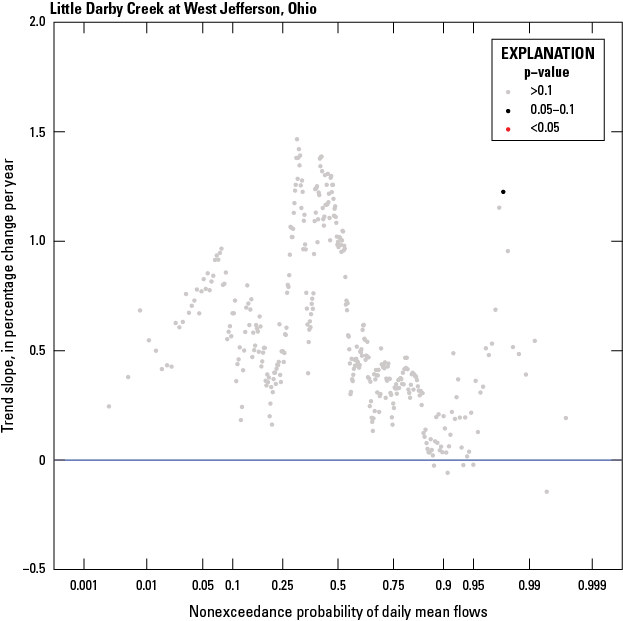
Quantile-Kendall plot for Little Darby Creek at West Jefferson, Ohio, based on data from October 1, 1992, through September 30, 2021 (with a 4-year gap in flow record between water years 2005 and 2010). >, Greater than; <, less than.
Trends in Indicators of Hydrologic Alteration Statistics
The lowess smooth line fit through the annual minimum 7-day average low flows (hereafter referred to as “annual 7-day low flows”) for Big Darby Creek indicates that the annual 7-day low flows were generally higher post-1970 than pre-1970 (fig. 28). This change is even more apparent when viewing boxplots of annual 7-day low flows by decade (fig. 29). Notably, McCabe and Wolock (2002) identified increases in annual minimum and median daily flow in several eastern U.S. streams and stated that the changes in flow appeared to occur as a step change around 1970, rather than as a gradual trend. Not only were the annual 7-day low flows higher post-1970 at the Big Darby Creek gage, but the number of annual low-flow pulses (periods when the flow fell below the 25th percentile of daily flows) and extreme low-flow periods (periods when flows fell below the 10th percentile of daily flows) appear to have decreased, as indicated by the typically lower median values post-1970 (figs. 30 and 31). These changes to low pulses and extreme low-flow periods can affect the availability of floodplain habitats for aquatic organisms and alter the nutrient and organic matter exchanges between the river and its floodplain (The Nature Conservancy, 2009).
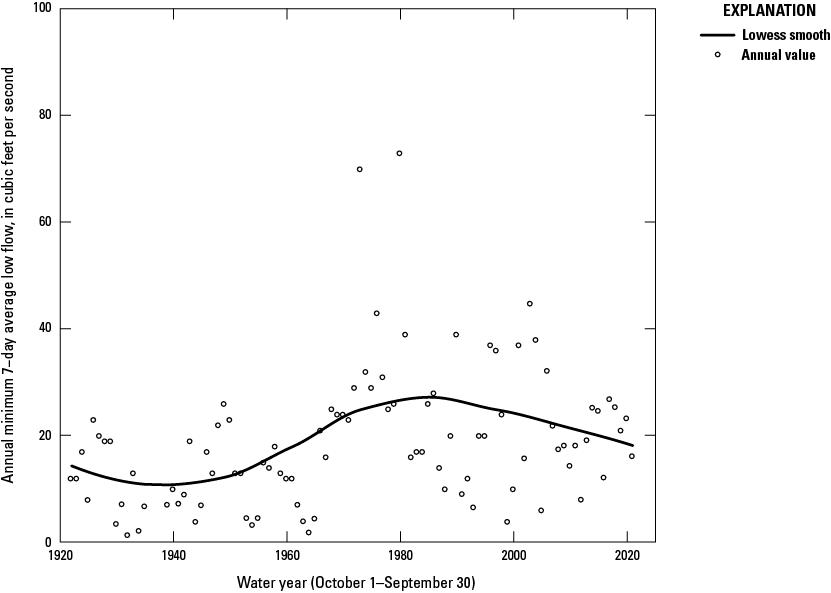
Scatter plot of the annual minimum 7-day average low flow by water year for Big Darby Creek at Darbyville, Ohio. Lowess smooth, locally weighted scatterplot smoothing line.
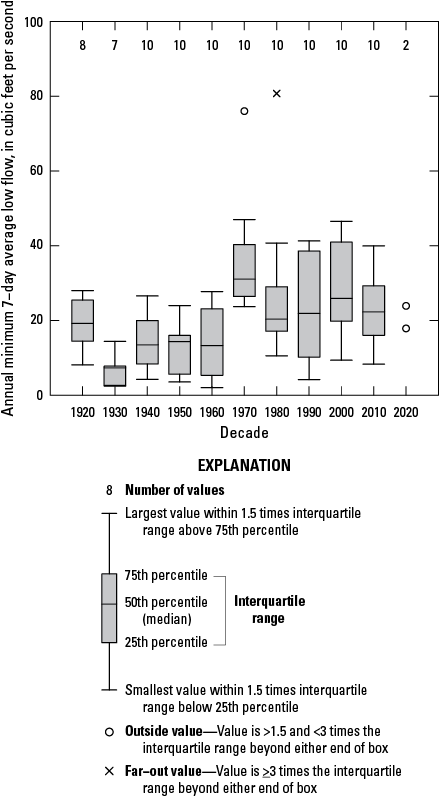
Boxplot of the annual minimum 7-day average low flows by decade for Big Darby Creek at Darbyville, Ohio. Boxes are only drawn when there are more than three values; otherwise, individual values are plotted as open circles. >, Greater than; <, less than; ≥, greater than or equal to.
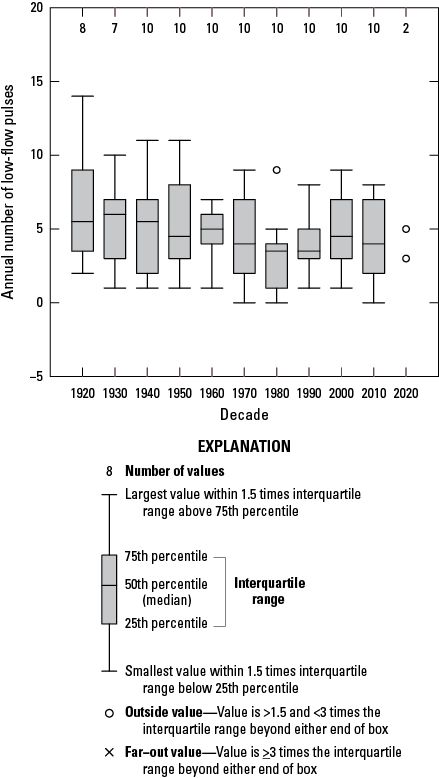
Boxplot of the annual number of low-flow pulses by decade for Big Darby Creek at Darbyville, Ohio. Boxes are only drawn when there are more than three values; otherwise, individual values are plotted as open circles. >, Greater than; <, less than; ≥, greater than or equal to.

Boxplot of the annual number of extreme low-flow periods by decade for Big Darby Creek at Darbyville, Ohio. Boxes are only drawn when there are more than three values; otherwise, individual values are plotted as open circles. >, Greater than; <, less than.
While the numbers of annual low-flow pulses and extreme low-flow periods have decreased in recent decades at the Big Darby Creek gage, the annual number of high-flow pulses (periods when the flow equals or exceeds the 75th percentile of daily flows) appear to have increased (fig. 32). Although the number of high-flow pulses has increased, there was no indication that the annual maximum 1-day flow increased over the period of record (fig. 33).
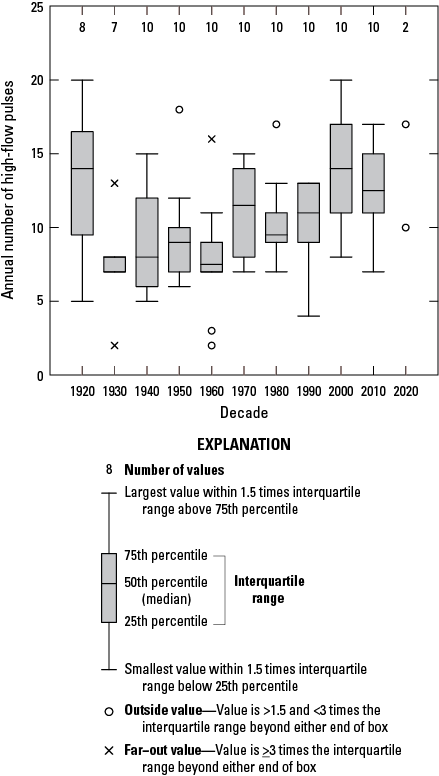
Boxplot of the annual number of high-flow pulses by decade for Big Darby Creek at Darbyville, Ohio. Boxes are only drawn when there are more than three values; otherwise, individual values are plotted as open circles. >, Greater than; <, less than; ≥, greater than or equal to.

Scatter plot of the annual maximum 1-day flow by water year (October 1–September 30) for Big Darby Creek at Darbyville, Ohio, 1922–2021. Lowess smooth, locally weighted scatterplot smoothing line.
The only strong indication of temporal trend in annual flow statistics for the relatively short records of the Little Darby Creek and Hellbranch Run gages was the number of reversals between rising and falling periods. A reversal occurs when there is a change of sign in the rate of change of daily flows (when daily flows transition from falling to rising or from rising to falling). At both gages, the annual number of reversals increased between water years 1993 and 2021 (figs. 34 and 35). The number of reversals also increased over the same period at the Big Darby Creek gage (fig. 36). However, the trend over the larger period of record at the Big Darby Creek gage was more complex, suggesting a downward trend in the number of reversals from water year 1922 to about water year 1980 followed by an upward trend between water years 1980 and 2021 (fig. 36). The rate and frequency of reversals can affect drought stress on plants, entrapment of organisms on islands or floodplains, and cause desiccation stress on low-mobility stream-edge organisms (The Nature Conservancy, 2009). Freshwater mussels have been shown to be sensitive to flow alterations (Vaughn and Taylor, 1999; Galbraith and Vaughn, 2011; Allen and others, 2013), including changes to the magnitudes, duration, and timing of high and low flows. The annual number of reversals was negatively correlated with the benthic index of biological integrity scores in one study of urbanizing streams in Washington State (DeGasperi and others, 2009).
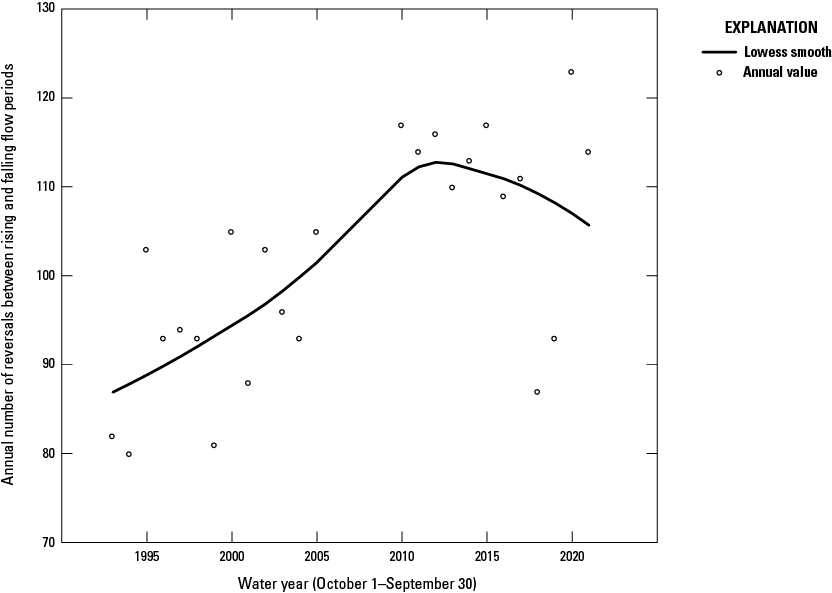
Scatter plot of the annual number of reversals between rising and falling flow periods for Little Darby Creek at West Jefferson, Ohio, 1993–2021. Lowess smooth, locally weighted scatterplot smoothing line.
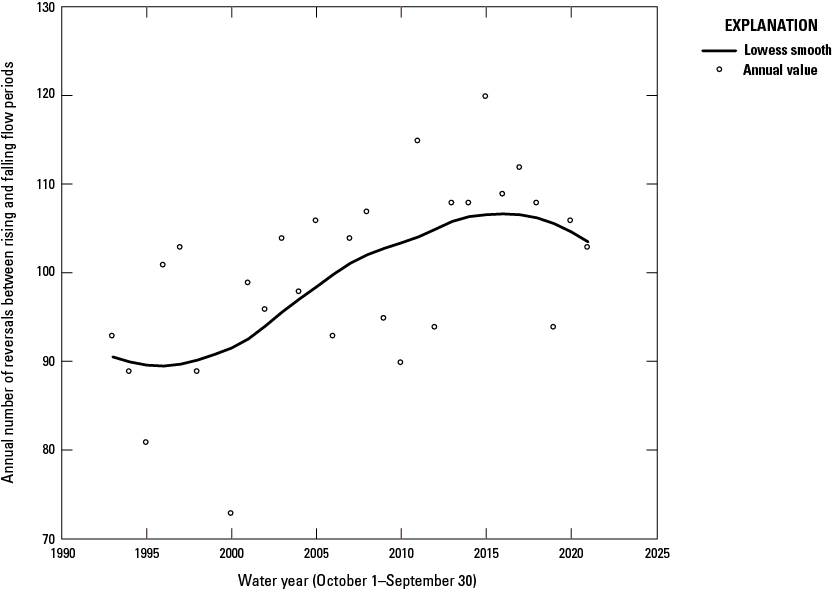
Scatter plot of the annual number of reversals between rising and falling flow periods for Hellbranch Run near Harrisburg, Ohio, 1993–2021. Lowess smooth, locally weighted scatterplot smoothing line.
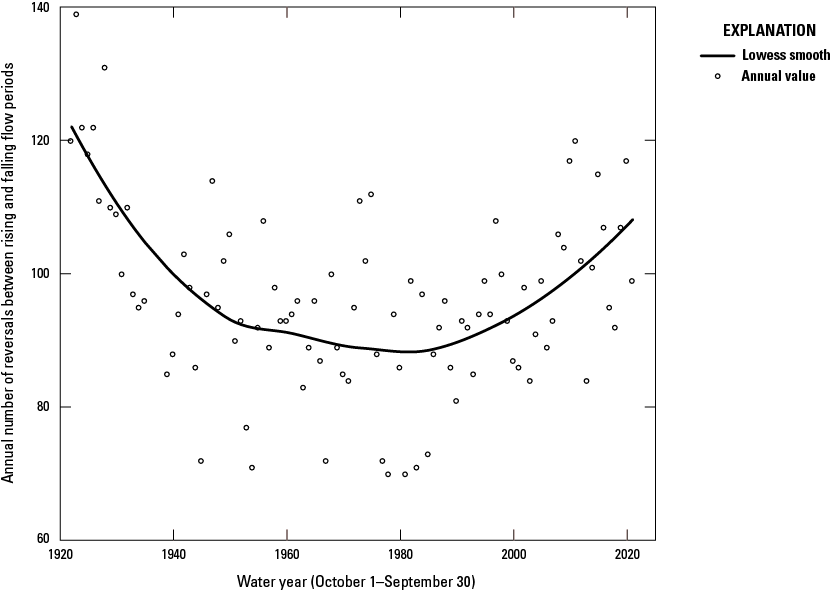
Scatter plot of the annual number of reversals between rising and falling flow periods for Big Darby Creek at Darbyville, Ohio, 1922–2021. Lowess smooth, locally weighted scatterplot smoothing line.
Summary
To better understand potential stressors to mussels and other aquatic organisms in the Big Darby Creek Basin, the U.S. Geological Survey, in cooperation with the Ohio Water Development Authority, partnered to study water quality and temporal changes in hydrology for selected locations. In addition, quantitative polymerase chain reaction (qPCR) assays for environmental deoxyribonucleic acid (eDNA) were developed to detect the presence of selected mussels and macroinvertebrates using stream water. Water-quality data were collected at one site on Big Darby Creek and two sites on Little Darby Creek. Temporal trends in hydrology were evaluated for one site each on Big Darby Creek, Little Darby Creek, and Hellbranch Run. Water samples were collected for eDNA qPCR analyses at 12 sites in the Big Darby Creek Basin and two sites in the French Creek Basin in Pennsylvania (to validate the northern riffleshell qPCR assay). Water quality and eDNA samples were collected between 2020 and 2022.
A continuous water-quality monitor was operated from 2020 to 2022 on Big Darby Creek above Georgesville, Ohio, to measure turbidity, specific conductance, pH, dissolved oxygen, and water temperature. There were occasional 24-hour swings in dissolved oxygen concentration that exceeded 10 milligrams per liter (mg/L). However, dissolved oxygen concentrations never fell below Ohio’s aquatic life criteria for warmwater habitats (outside of mixing zones) of 4.0 mg/L as an instantaneous minimum and 5.0 mg/L as a minimum 24-hour average. In 2020, there were 10 days when the maximum instantaneous value for temperature recorded during the study exceeded the Ohio water-quality criteria of 29.4 degrees Celsius (°C) as an instantaneous maximum and 3 consecutive days when the 24-hour average temperature exceeded the maximum 24-hour average criteria of 27.8 °C. Often, the exceedance of temperature thresholds occurred on consecutive days.
Other water-quality data were collected by using polar organic chemical integrative samplers (POCIS) and semipermeable membrane devices (SPMDs). These passive samplers were deployed three times per year at three sites within the Big Darby Creek Basin in 2020 and 2021. Analyses were done for 204 pesticide compounds, 38 organic wastewater compounds (OWCs), and 33 polycyclic aromatic hydrocarbons (PAHs). Of the 204 pesticide compounds, 70 were detected in at least one sample; 30 were detected in all samples. Three herbicides (atrazine, ametryn, and metribuzin) and one herbicide degradate (deethylatrazine [DEA or desethylatrazine]) were detected in at least 88 percent of samples. Most pesticide detections and some of the highest concentrations detected in this study were for herbicides and herbicide degradates. Metolachlor, acetochlor, and atrazine (and most of their degradates) were detected in all samples at high concentrations relative to the other detected pesticide compounds. Some other pesticides detected in all samples include azoxystrobin, propiconazole, imidacloprid, and fipronil. Twenty-four OWCs and 29 PAHs were detected in at least one sample. One of the OWCs (N,N-diethyltoluamide [DEET]) and 12 of the PAHs were detected in all samples.
The extent to which the detected compounds affect or have affected the well-being of mussel populations in the Big Darby Creek Basin cannot be easily evaluated. Previous studies on the effects of these compounds are based on just a few target mussel species, and, in some cases, results appeared to vary depending on the species chosen. Consequently, it is possible that detrimental effects may be seen in some mussel species and not in others. Additionally, mussels are simultaneously exposed to complex and varying mixtures of compounds that may cause more harm in combination over short or long time periods.
The use of eDNA qPCR assays for detecting the presence and abundance of mussel and macroinvertebrate species is an emerging science. The U.S. Geological Survey Ohio Water Microbiology Laboratory developed eDNA qPCR assays to detect Epioblasma rangiana (northern riffleshell mussels), Chimarra obscura (a species of caddisfly), and Maccaffertium pulchellum (a species of mayfly). The Ohio Water Microbiology Laboratory also optimized an eDNA qPCR assay for Ptychobranchus fasciolaris (kidneyshell mussels). Assays were validated by using environmental sampling methods, and assay sensitivity was established by determining the limit of detection and the limit of quantification. The results demonstrate the possibility of using eDNA qPCR assays to monitor for specific mussel and macroinvertebrate species that can be used to complement traditional field survey methods.
Streamflow time-series data from three gaging stations within the Big Darby Creek Basin were evaluated for temporal trends in annual flow statistics and daily nonexceedance probabilities. There were strong indications that flow conditions at the Big Darby Creek gage have changed between water years 1922 and 2021 (the period of record at the time of analysis), with flows in general and the number of high-flow pulses increasing, while low-flow pulses and extreme low-flow periods have become less frequent. The only strong indication of a temporal trend in flow statistics for the relatively short records for the other two trend gages (on Little Darby Creek and Hellbranch Run) was an increase in the annual number of reversals between rising and falling periods.
The relationship between the well-being of mussels and hydrology is complex. The mixed sedentary and mobile life histories of freshwater mussels are adapted to a flow regime that maintains wetted habitat for adults and host fish while also buffering water quality and providing adequate food replenishment. Freshwater mussels have been shown to be sensitive to flow alterations, including changes to the magnitudes, duration, and timing of high and low flows. If flow alterations are significant enough to disrupt mussel populations, they can be potentially catastrophic to their persistence because mussels generally are slow to recover from population declines. The extent to which the temporal flow alterations observed in the Big Darby Creek Basin have affected the freshwater mussel population is unknown; however, their occurrence is another potential stressor on the mussel population.
References Cited
Ahrens, L., Daneshvar, A., Lau, A.E., and Kreuger, J., 2015, Characterization of five passive sampling devices for monitoring of pesticides in water: Journal of Chromatography A, v. 1405, p. 1–11, accessed September 2023 at https://doi.org/10.1016/j.chroma.2015.05.044.
Allen, D.C., Galbraith, H.S., Vaughn, C.C., and Spooner, D.E., 2013, A tale of two rivers—Implications of water management practices for mussel biodiversity outcomes during droughts: Ambio, v. 42, no. 7, p. 881–891, accessed February 2024 at https://doi.org/10.1007/s13280-013-0420-8.
Alvarez, D.A., 2010, Guidelines for the use of the semipermeable membrane device (SPMD) and the polar organic chemical integrative sampler (POCIS) in environmental monitoring studies: U.S. Geological Survey Techniques and Methods, book 1, chap. D4, 28 p. [Also available at https://doi.org/10.3133/tm1D4.]
Alvarez, D.A., Cranor, W.L., Perkins, S.D., Clark, R.C., and Smith, S.B., 2008, Chemical and toxicological assessment of organic contaminants in surface water using passive samplers: Journal of Environmental Quality, v. 37, no. 3, p. 1024–1033, accessed September 2023 at https://doi.org/10.2134/jeq2006.0463.
Alvarez, D.A., Huckins, J.N., Petty, J.D., Jones-Lepp, T.L., Stuer-Lauridsen, F., Getting, D.T., Goddard, J.P., and Gravell, A., 2007, Tool for monitoring hydrophilic contaminants in water—Polar organic chemical integrative sampler (POCIS), chap 8 of Greenwood, R., Mills, G., and Vrana, B., eds., Passive sampling techniques: Comprehensive analytical chemistry, v. 48, p. 171–197, accessed September 2023 at https://doi.org/10.1016/S0166-526X(06)48008-9.
Alvarez, D.A., Petty, J.D., Huckins, J.N., Jones-Lepp, T.L., Getting, D.T., Goddard, J.P., and Manahan, S.E., 2004, Development of a passive, in situ, integrative sampler for hydrophilic organic contaminants in aquatic environments: Environmental Toxicology and Chemistry, v. 23, no. 7, p. 1640–1648, accessed September 2023 at https://doi.org/10.1897/03-603.
American Rivers, 2019, Big Darby Creek named one of America’s most endangered rivers of 2019: American Rivers, April 16, 2019, accessed July 19, 2023, at https://www.americanrivers.org/media-item/big-darby-creek-named-one-of-americas-most-endangered-rivers-of-2019/.
Arslan, P., Günal, A.Ç., 2023, Does fipronil affect on aquatic organisms? Physiological, biochemical, and histopathological alterations of non-target freshwater mussel species: Water, v. 15, no. 2, article 334, p. 1–14, accessed February 13, 2024, at https://doi.org/10.3390/w15020334.
Bartelt-Hunt, S.L., Snow, D.D., Damon-Powell, T., Brown, D.L., Prasai, G., Schwarz, M., and Kolok, A.S., 2011, Quantitative evaluation of laboratory uptake rates for pesticides, pharmaceuticals, and steroid hormones using POCIS: Environmental Toxicology and Chemistry, v. 30, no. 6, p. 1412–1420, accessed September 2023 at https://doi.org/10.1002/etc.514.
Berger, B., 2019, Big Darby Creek among most endangered rivers in nation: The Columbus Dispatch, April 16, 2019, accessed June 6, 2019, at https://www.dispatch.com/news/20190416/big-darby-creek-among-most-endangered-rivers-in-nation.
Bringolf, R.B., Cope, W.G., Eads, C.B., Lazaro, P.R., Barnhart, M.C., and Shea, D., 2007, Acute and chronic toxicity of technical-grade pesticides to glochidia and juveniles of freshwater mussels (unionidae): Environmental Toxicology and Chemistry, v. 26, no. 10, p. 2086–2093, accessed September 22, 2023, at https://doi.org/10.1897/06-522R.1.
Bustin, S.A., Benes, V., Garson, J.A., Hellemans, J., Huggett, J., Kubista, M., Mueller, R., Nolan, T., Pfaffl, M.W., Shipley, G.L., Vandesompele, J., and Wittwer, C.T., 2009, The MIQE guidelines—Minimum information for publication of quantitative real-time PCR experiments: Clinical Chemistry, v. 55, no. 4, p. 611–622, accessed August 2023 at https://doi.org/10.1373/clinchem.2008.112797.
Cleveland, W.S., 1979, Robust locally weighted regression and smoothing scatterplots: Journal of the American Statistical Association, v. 74, no. 368, p. 829–836. [Also available at https://doi.org/10.1080/01621459.1979.10481038.]
Cleveland, W.S., and Devlin, S.J., 1988, Locally weighted regression—An approach to regression analysis by local fitting: Journal of the American Statistical Association, v. 83, no. 403, p. 596–610. [Also available at https://doi.org/10.1080/01621459.1988.10478639.]
Colwell, S., 2007, The application of the QBR index to the riparian forests of central Ohio streams: The Ohio State University, School of Environment and Natural Resources, honors thesis, 44 p., accessed April 19, 2024, at https://kb.osu.edu/server/api/core/bitstreams/458bb291-68a8-5809-8ffb-330efc6780b9/content.
Cormier, S.M., Smith, M., Norton, S., and Neiheisel, T., 2000, Assessing ecological risk in watersheds—A case study of problem formulation in the Big Darby Creek watershed, Ohio, USA: Environmental Toxicology and Chemistry, v. 19, no. 4, p. 1082–1096, accessed April 17, 2024, at https://doi.org/10.1002/etc.5620190439.
Currier, C.A., Morris, T.J., Wilson, C.C., and Freeland, J.R., 2018, Validation of environmental DNA (eDNA) as a detection tool for at-risk freshwater pearly mussel species (Bivalvia—Unionidae): Aquatic Conservation, v. 28, no. 3, p. 545–558, accessed January 28, 2019, at https://doi.org/10.1002/aqc.2869.
Daniel, W.M., Cooper, A.R., Badra, P.J., and Infante, D.M., 2018, Predicting habitat suitability for eleven imperiled fluvial freshwater mussels: Hydrobiologia, v. 809, no. 1, p. 265–283, accessed August 13, 2021, at https://doi.org/10.1007/s10750-017-3473-z.
DeGasperi, C.L., Berge, H.B., Whiting, K.R., Burkey, J.J., Cassin, J.L., and Fuerstenberg, R.R., 2009, Linking hydrologic alteration to biological impairment in urbanizing streams of the Puget Lowland, Washington, USA: Journal of the American Water Resources Association, v. 45, no. 2, p. 512–533, accessed May 2024 at https://doi.org/10.1111/j.1752-1688.2009.00306.x.
Dewitz, J., and U.S. Geological Survey [USGS], 2021, National Land Cover Database (NLCD) 2019 products (ver. 2.0, June 2021): U.S. Geological Survey data release, accessed August 3, 2023, at https://doi.org/10.5066/P9KZCM54.
Drew, C.A., Eddy, M., Kwak, T.J., Cope, W.G., and Augspurger, T., 2018, Hydrologic characteristics of freshwater mussel habitat—Novel insights from modeled flows: Freshwater Science, v. 37, no. 2, p. 343–356, accessed January 30, 2024, at https://doi.org/10.1086/697947.
EnviroScience, 2015, Freshwater mussel surveys on the Big Darby system in Logan, Union, Champaign, Madison, Franklin and Pickaway Counties to monitor 40 sites previously surveyed by Watters (1998) September 2014 and May 2015: Ohio Department of Natural Resources, Division of Wildlife, prepared by EnviroScience, Inc., ES project 5904, 90 p.
Ewere, E.E., Reichelt-Brushett, A., and Benkendorff, K., 2021, Impacts of neonicotinoids on molluscs—What we know and what we need to know: Toxics, v. 9, no. 2, article 21, p. 1–21, accessed February 13, 2024, at https://doi.org/10.3390/toxics9020021.
Furlong, E.T., Anderson, B.D., Werner, S.L., Soliven, P.P., Coffey, L.J., and Burkhardt, M.R., 2001, Methods of analysis by the U.S. Geological Survey National Water Quality Laboratory—Determination of pesticides in water by graphitized carbon-based solid-phase extraction and high-performance liquid chromatography/mass spectrometry: U.S. Geological Survey Water-Resources Investigations Report 2001–4134, 73 p. [Also available at https://doi.org/10.3133/wri014134.]
Galbraith, H.S., and Vaughn, C.C., 2011, Effects of reservoir management on abundance, condition, parasitism and reproductive traits of downstream mussels: River Research and Applications, v. 27, no. 2, p. 193–201, accessed February 2024 at https://doi.org/10.1002/rra.1350.
Ganser, A.M., Newton, T.J., and Haro, R.J., 2013, The effects of elevated water temperature on native juvenile mussels—Implications for climate change: Freshwater Science, v. 32, no. 4, p. 1168–1177, accessed July 2023 at https://doi.org/10.1899/12-132.1.
Ganser, A.M., Newton, T.J., and Haro, R.J., 2015, Effects of elevated water temperature on physiological responses in adult freshwater mussels: Freshwater Biology, v. 60, no. 8, p. 1705–1716, accessed July 25, 2023, at https://doi.org/10.1111/fwb.12603.
Garrett, J.D., Frey, J.W., Van Metre, P.C., Journey, C.A., Nakagaki, N., Button, D.T., and Howell, L.H., 2017, Design and methods of the Midwest Stream Quality Assessment (MSQA), 2013: U.S. Geological Survey Open-File Report 2017–1073, 59 p., 4 app, accessed March 19, 2021, at https://doi.org/10.3133/ofr20171073.
Geist, J., Wunderlich, H., and Kuehn, R., 2008, Use of mollusc shells for DNA-based molecular analyses: The Journal of Molluscan Studies, v. 74, no. 4, p. 337–343 accessed June 2019 at https://doi.org/10.1093/mollus/eyn025.
Gates, K.K., Vaughn, C.C., and Julian, J.P., 2015, Developing environmental flow recommendations for freshwater mussels using the biological traits of species guilds: Freshwater Biology, v. 60, no. 4, p. 620–635, accessed February 29, 2024, at https://doi.org/10.1111/fwb.12528.
Haag, W.R., 2012, North American freshwater mussels—Natural history, ecology, and conservation: New York, Cambridge University Press, 505 p., accessed July 19, 2022, at https://srs.fs.usda.gov/pubs/books/2012/books_2012_haag_001.pdf.
Hambrook, J.A., Koltun, G.F., Palcszk, B.B., and Tertuliani, J.S., 1997, Hydrologic disturbance and response of aquatic biota in Big Darby Creek Basin, Ohio: U.S. Geological Survey Water-Resources Investigations Report 96–4315, 82 p. [Also available at https://doi.org/10.3133/wri964315.]
Harman, C., Tollefsen, K.-E., Bøyum, O., Thomas, K., and Grung, M., 2008, Uptake rates of alkylphenols, PAHs, and carbazoles in semipermeable membrane devices (SPMDs) and polar organic chemical integrative samplers (POCIS): Chemosphere, v. 72, no. 10, p. 1510–1516, accessed September 2023 at https://doi.org/10.1016/j.chemosphere.2008.04.091.
Henley, W.F., Grobler, P.J., and Neves, R.J., 2006, Non-invasive method to obtain DNA from freshwater mussels (Bivalvia: Unionidae): Journal of Shellfish Research, v. 25, no. 3, p. 975–977, accessed June 2019 at https://doi.org/10.2983/0730-8000(2006)25[975:NMTODF]2.0.CO;2.
Hirsch, R.M., 2018, Daily streamflow trend analysis: U.S. Geological Survey Water data for the Nation blog, May 29, 2018, accessed January 12, 2022, at https://waterdata.usgs.gov/blog/quantile-kendall/.
Hirsch, R.M., and De Cicco, L.A., 2015, User guide to Exploration and Graphics for RivEr Trends (EGRET) and dataRetrieval—R packages for hydrologic data (ver. 2.0, February 2015): U.S. Geological Survey Techniques and Methods, book 4, chap. A10, 93 p., accessed February 2018 at https://doi.org/10.3133/tm4A10.
Hirsch, R.M., Moyer, D.L., and Archfield, S.A., 2010, Weighted Regressions on Time, Discharge, and Season (WRTDS), with an application to Chesapeake Bay River inputs: Journal of the American Water Resources Association, v. 46, no. 5, p. 857–880, accessed February 2018 at https://doi.org/10.1111/j.1752-1688.2010.00482.x. [Also available at https://onlinelibrary.wiley.com/doi/full/10.1111/j.1752-1688.2010.00482.x.]
Hussar, E., Richards, S., Lin, Z., Dixon, R., and Johnson, K., 2012, Human health risk assessment of 16 priority polycyclic aromatic hydrocarbons in soils of Chattanooga, Tennessee, USA: Water, Air, & Soil Pollution, v. 223, p. 5535–5548, accessed April 2024 at https://doi.org/10.1007/s11270-012-1265-7.
Koltun, G.F., 2025, Annual streamflow statistics for selected streamgages on Big and Little Darby Creeks and Hellbranch Run, Ohio (through water year 2021): U.S. Geological Survey data release, at https://doi.org/10.5066/P1WELW7W.
Koltun, G.F., Huitger, C.A., Stelzer, E.A., and Lynch, L.D., 2025, Pesticide, organic wastewater compound (OWC) and polycyclic aromatic hydrocarbon (PAH) data determined from samples collected with instream passive samplers in the Big Darby Creek Basin, Ohio, 2020–21: U.S. Geological Survey data release, at https://doi.org/10.5066/P13GN45M.
Koltun, G.F., Kula, S.P., and Puskas, B.M., 2006, A streamflow statistics (StreamStats) web application for Ohio: U.S. Geological Survey Scientific Investigations Report 2006–5312, 62 p., accessed September 1, 2015, at https://doi.org/10.3133/sir20065312. [Used https://water.usgs.gov/osw/streamstats/ohio.html for 2022 site delineations in fig. 1.]
Lefebvre, C., Kimpe, L.E., Metcalfe, C.D., Trudeau, V.L., and Blais, J.M., 2017, Biocentration of polycyclic musks in fathead minnows caged in a wastewater effluent plume: Environmental Pollution, v. 231, p. 1593–1600, accessed January 26, 2024, at https://doi.org/10.1016/j.envpol.2017.09.062.
Li, H., Helm, P.A., and Metcalfe, C.D., 2010, Sampling in the Great Lakes for pharmaceuticals, personal care products, and endocrine-disrupting substances using the passive polar organic chemical integrative sampler: Environmental Toxicology and Chemistry, v. 29, no. 4, p. 751–762, accessed September 2023 at https://doi.org/10.1002/etc.104.
Lor, Y., Schreier, T.M., Waller, D.L., and Merkes, C.M., 2020, Using environmental DNA (eDNA) to detect the endangered Spectaclecase Mussel (Margaritifera monodonta): Freshwater Science, v. 39, no. 4, p. 837–847, accessed September 21, 2023, at https://doi.org/10.1086/711673.
Mann, H.B., 1945, Nonparametric tests against trend: Econometrica, v. 13, no. 3, p. 245–249. [Also available at https://doi.org/10.2307/1907187.]
McCabe, G.J., and Wolock, D.M., 2002, A step increase in streamflow in the conterminous United States: Geophysical Research Letters, v. 29, no. 24, article 2185, p. 38-1–38-4, accessed October 30, 2023, at https://doi.org/10.1029/2002GL015999.
Metcalfe, C.D., Sultana, T., Li, H., and Helm, P.A., 2016, Current-use pesticides in urban watersheds and receiving waters of western Lake Ontario measured using polar organic chemical integrative samplers (POCIS): Journal of Great Lakes Research, v. 42, no. 6, p. 1432–1442, accessed September 2023 at https://doi.org/10.1016/j.jglr.2016.08.004.
Myers, D.N., Stoeckel, D.M., Bushon, R.N., Francy, D.S., and Brady, A.M.G., 2007, Fecal indicator bacteria (ver. 2.0, February 2007): U.S. Geological Survey Techniques of Water-Resources Investigations, book 9, chap. A7.1, p. FIB-1–FIB-73, accessed April 2013 at https://pubs.water.usgs.gov/twri9A/.
National Wild and Scenic Rivers System, 2019, Wild and scenic river designation: National Wild and Scenic Rivers System web page, accessed March 22, 2019, at https://www.rivers.gov/designation.php.
National Oceanic and Atmospheric Administration, 2023, Climate at a glance—Statewide time series: National Oceanic and Atmospheric Administration, National Centers for Environmental Information database, accessed August 3, 2023, at https://www.ncei.noaa.gov/access/monitoring/climate-at-a-glance/statewide/time-series.
Ohio Department of Natural Resources, 2024, List of Ohio’s scenic rivers: Division of Natural Areas and Preserves webpage, accessed 2024 at https://ohiodnr.gov/discover-and-learn/safety-conservation/about-ODNR/nature-preserves/scenic-rivers/list-ohio-scenic-rivers.
Ohio Environmental Protection Agency [OEPA], 1988, Biological criteria for the protection of aquatic life: Ohio Environmental Protection Agency, v. 3, accessed May 31, 2024, at https://epa.ohio.gov/divisions-and-offices/surface-water/reports-data/biological-criteria-for-the-protection-of-aquatic-life.
Ohio Environmental Protection Agency [OEPA], 2017, Site-specific modifications to criteria and values, rule 3745–1–35 of Water quality standards: Ohio Administrative Code, chap. 3745–1, accessed April 23, 2024, at https://codes.ohio.gov/ohio-administrative-code/rule-3745-1-35.
Poff, N.L., Allan, J.D., Bain, M.B., Karr, J.R., Prestegaard, K.L., Richter, B.D., Sparks, R.E., and Stromberg, J.C., 1997, The natural flow regime—A paradigm for river conservation and restoration: BioScience, v. 47, no. 11, p. 769–784. [Also available at https://doi.org/10.2307/1313099.]
Poulier, G., Lissalde, S., Charriau, A., Buzier, R., Cleries, K., Delmas, F., Mazzella, N., and Guibaud, G., 2015, Estimates of pesticide concentrations and fluxes in two rivers of an extensive French multi-agricultural watershed—Application of the passive sampling strategy: Environmental Science and Pollution Research International, v. 22, no. 11, p. 8044–8057, accessed September 2023 at https://doi.org/10.1007/s11356-014-2814-y.
R Core Team, 2017, R—A language and environment for statistical computing: Vienna, Austria, R Foundation for Statistical Computing website, accessed February 2018 at https://www.R-project.org/.
Renault, M., 2016, Big Darby mussel die-off stretches 50 miles: The Columbus Dispatch, October 21, 2016, accessed August 18, 2023, at https://www.dispatch.com/story/news/environment/2016/10/21/big-darby-mussel-die-off/23972632007/.
Ries, P.R., Newton, T.J., Haro, R.J., Zigler, S.J., and Davis, M., 2016, Annual variation in recruitment of freshwater mussels and its relationship to river discharge: Aquatic Conservation, v. 26, no. 4, p. 703–714, accessed November 9, 2022, at https://doi.org/10.1002/aqc.2590.
Roznere, I., An, V., Robinson, T., Banda, J.A., and Watters, G.T., 2023, Contaminants of emerging concern in the Maumee River and their effects on freshwater mussel physiology: PLoS ONE, v. 18, no. 2, article e0280382, p. 1–19, accessed October 25, 2023, at https://doi.org/10.1371/journal.pone.0280382.
Schill, W.B., and Galbraith, H.S., 2019, Detecting the undetectable—Characterization, optimization, and validation of an eDNA detection assay for the federally endangered dwarf wedgemussel, Alasmidonta heterodon (Bivalvia: Unionoida): Aquatic Conservation, v. 29, no. 4, p. 603–611, accessed January 2024 at https://doi.org/10.1002/aqc.3069.
Schubauer-Berigan, M.K., Smith, M., Hopkins, J., and Cormier, S.M., 2000, Using historical biological data to evaluate status and trends in the Big Darby Creek watershed (Ohio, USA): Environmental Toxicology and Chemistry, v. 19, no. 4, p. 1097–1105. [Also available at https://doi.org/10.1002/etc.5620190440.]
Sen, P.K., 1968, Estimates of the regression coefficient based on Kendall’s tau: Journal of the American Statistical Association, v. 63, no. 324, p. 1379–1389. [Also available at https://doi.org/10.1080/01621459.1968.10480934.]
Strayer, D.L., Downing, J.A., Haag, W.R., King, T.L., Layzer, J.B., Newton, T.J., and Nichols, S.J., 2004, Changing perspectives on pearly mussels, North America’s most imperiled animals: BioScience, v. 54, no. 5, p. 429–439, accessed July 19, 2023, at https://doi.org/10.1641/0006-3568(2004)054[0429:CPOPMN]2.0.CO;2.
Taylor, S., Wakem, M., Dijkman, G., Alsarraj, M., and Nguyen, M., 2015, A practical approach to RT–qPCR—Publishing data that conform to the MIQE guidelines: Hercules, Calif., Bio-Rad Laboratories, bulletin 5859 version E, 8 p., accessed February 28, 2024, at https://www.bio-rad.com/webroot/web/pdf/lsr/literature/Bulletin_5859.pdf.
The Nature Conservancy, 2009, Indicators of Hydrologic Alteration—Version 7.1—User's manual: The Nature Conservancy, 76 p., accessed October 3, 2022, at https://www.conservationgateway.org/Documents/IHAV7.pdf.
The Nature Conservancy, 2024, Big Darby Creek State and National Scenic River is one of the most biologically diverse aquatic systems in the Midwest: The Nature Conservancy, accessed 2024, at https://www.nature.org/en-us/get-involved/how-to-help/places-we-protect/big-darby-headwaters-nature-preserve/.
U.S. Environmental Protection Agency [EPA], 2023, Aquatic life benchmarks and ecological risk assessments for registered pesticides: U.S. Environmental Protection Agency web page, EPA841F21007B, 4 p., accessed June 3, 2024, at https://www.epa.gov/pesticide-science-and-assessing-pesticide-risks/aquatic-life-benchmarks-and-ecological-risk.
U.S. Environmental Protection Agency [EPA], 2024, Toxic and priority pollutants under the clean water act: U.S. Environmental Protection Agency web page, accessed December 2024 at https://www.epa.gov/eg/toxic-and-priority-pollutants-under-clean-water-act#priority. [Priority Pollutant List available at https://www.epa.gov/sites/default/files/2015-09/documents/priority-pollutant-list-epa.pdf.]
U.S. Geological Survey [USGS], 2024a, USGS water data for the Nation: U.S. Geological Survey National Water Information System database, accessed May 31, 2024, at https://doi.org/10.5066/F7P55KJN. [Site information directly accessible at https://waterdata.usgs.gov/monitoring-location/03230310/, https://waterdata.usgs.gov/monitoring-location/03230450/, https://waterdata.usgs.gov/monitoring-location/03230500/, https://waterdata.usgs.gov/monitoring-location/395339083130100/, and https://waterdata.usgs.gov/monitoring-location/395430083143000/.]
U.S. Geological Survey [USGS], 2024b, Water-year summary for site USGS 03230500 Big Darby Creek at Darbyville OH: U.S. Geological Survey National Water Information System database, accessed May 31, 2024, at https://waterdata.usgs.gov/nwis/wys_rpt/?site_no=03230500&agency_cd=USGS. [Select the water year and check the box for mean discharge as the available parameter. Annual runoff for the selected water year and period of record through that water year will be listed in the summary statistics table.]
Vaughn, C.C., and Taylor, C.M., 1999, Impoundments and the decline of freshwater mussels—A case study of an extinction gradient: Conservation Biology, v. 13, no. 4, p. 912–920. [Also available at https://doi.org/10.1046/j.1523-1739.1999.97343.x.]
Wagner, R.J., Boulger, R.W., Jr., Oblinger, C.J., and Smith, B.A., 2006, Guidelines and standard procedures for continuous water-quality monitors—Station operation, record computation, and data reporting: U.S. Geological Survey Techniques and Methods, book 1, chap. D3, 51 p., 8 attachments, accessed April 10, 2006, at https://pubs.water.usgs.gov/tm1d3.
Weinstein, J.W., 2002, Photoperiod effects on the UV-induced toxicity of fluoranthene to freshwater mussel glochidia—Absence of repair during dark periods: Aquatic Toxicology, v. 59, no. 3–4, p. 153–161, accessed February 2024 at https://doi.org/10.1016/S0166-445X(01)00247-8.
Zhang, L., Mitsch, W.J., and Fink, D.F., 2005, Hydrology, water quality, and restoration potential for the Upper Big Darby Creek, Central Ohio: Ohio Journal of Science, v. 105, no. 3, p. 46–56, accessed April 19, 2024, at https://kb.osu.edu/server/api/core/bitstreams/bd143644-e084-5af2-bd64-6620e6bd56b7/content.
Appendix 1. Quality Control and Summary Information for Analyses of Pesticides, Organic Wastewater Compounds, and Polycyclic Aromatic Hydrocarbons
References Cited
Furlong, E.T., Anderson, B.D., Werner, S.L., Soliven, P.P., Coffey, L.J., and Burkhardt, M.R., 2001, Methods of analysis by the U.S. Geological Survey National Water Quality Laboratory—Determination of pesticides in water by graphitized carbon-based solid-phase extraction and high-performance liquid chromatography/mass spectrometry: U.S. Geological Survey Water-Resources Investigations Report 2001–4134, 73 p. [Also available at https://doi.org/10.3133/wri014134.]
Koltun, G.F., Huitger, C.A., Stelzer, E.A., and Lynch, L.D., 2025, Pesticide, organic wastewater compound (OWC) and polycyclic aromatic hydrocarbon (PAH) data determined from samples collected with instream passive samplers in the Big Darby Creek Basin, Ohio, USA, 2020–21: U.S. Geological Survey data release, at https://doi.org/10.5066/P13GN45M.
U.S. Environmental Protection Agency, 2024, Toxic and priority pollutants under the clean water act: U.S. Environmental Protection Agency web page, accessed December 2024 at https://www.epa.gov/eg/toxic-and-priority-pollutants-under-clean-water-act#priority. [Priority Pollutant List available at https://www.epa.gov/sites/default/files/2015-09/documents/priority-pollutant-list-epa.pdf.]
U.S. Geological Survey, 2024, USGS water data for the Nation: U.S. Geological Survey National Water Information System database, accessed May 31, 2024, at https://doi.org/10.5066/F7P55KJN. [Site information directly accessible at https://waterdata.usgs.gov/monitoring-location/03230310/, https://waterdata.usgs.gov/monitoring-location/03230450/, https://waterdata.usgs.gov/monitoring-location/03230500/, https://waterdata.usgs.gov/monitoring-location/395339083130100/, and https://waterdata.usgs.gov/monitoring-location/395430083143000/.]
Conversion Factors
Supplemental Information
Specific conductance is given in microsiemens per centimeter at 25 degrees Celsius (µS/cm at 25 °C).
Concentrations of chemical constituents are given in milligrams per liter (mg/L), nanograms per polar organic chemical integrative sampler (ng/POCIS), nanograms per liter (ng/L), and picograms per liter (pg/L).
A water year is the 12-month period from October 1 through September 30 of the following year and is designated by the calendar year in which it ends.
A climatic year is the 12-month period from April 1 through March 30 of the following year and is designated by the calendar year of the first month in the 12-month period.
Abbreviations
CERC
Columbia Environmental Research Center
COI
cytochrome oxidase subunit I
Ct
average cycle threshold value
DEET
N,N-diethyltoluamide
DNA
deoxyribonucleic acid
DO
dissolved oxygen
eDNA
environmental deoxyribonucleic acid
EGRET
Exploration and Graphics for RivEr Trends
EPA
U.S. Environmental Protection Agency
IHA
Indications of Hydrologic Alteration
LoD
limit of detection
LoQ
limit of quantification
lowess
locally weighted scatterplot smoothing
MDL
method detection limit
MQL
method quantification limit
NWQL
National Water Quality Laboratory
OEPA
Ohio Environmental Protection Agency
OWC
organic wastewater compound
OWML
Ohio Water Microbiology Laboratory
PAH
polycyclic aromatic hydrocarbon
PCR
polymerase chain reaction
POCIS
polar organic chemical integrative sampler
PRC
performance reference compounds
QC
quality control
qPCR
quantitative polymerase chain reaction
SPMD
semipermeable membrane device
USGS
U.S. Geological Survey
For more information about this report, contact:
Director, Ohio-Kentucky-Indiana Water Science Center
U.S. Geological Survey
6460 Busch Blvd, Suite 100
Columbus, OH 43229
gs-w-oki_director@usgs.gov
or visit our website at
https://www.usgs.gov/centers/oki-water
Publishing support provided by the Pembroke Publishing Service Center
Disclaimers
Any use of trade, firm, or product names is for descriptive purposes only and does not imply endorsement by the U.S. Government.
Although this information product, for the most part, is in the public domain, it also may contain copyrighted materials as noted in the text. Permission to reproduce copyrighted items must be secured from the copyright owner.
Suggested Citation
Huitger, C.A., Koltun, G.F., Stelzer, E.A., and Lynch, L.D., 2025, Potential water-quality and hydrology stressors on freshwater mussels with development of environmental DNA assays for selected mussels and macroinvertebrates in Big Darby Creek Basin, Ohio, 2020–22: U.S. Geological Survey Scientific Investigations Report 2025–5005, 59 p., https://doi.org/10.3133/sir20255005.
ISSN: 2328-0328 (online)
Study Area
| Publication type | Report |
|---|---|
| Publication Subtype | USGS Numbered Series |
| Title | Potential water-quality and hydrology stressors on freshwater mussels with development of environmental DNA assays for selected mussels and macroinvertebrates in Big Darby Creek Basin, Ohio, 2020–22 |
| Series title | Scientific Investigations Report |
| Series number | 2025-5005 |
| DOI | 10.3133/sir20255005 |
| Publication Date | April 14, 2025 |
| Year Published | 2025 |
| Language | English |
| Publisher | U.S. Geological Survey |
| Publisher location | Reston, VA |
| Contributing office(s) | Ohio-Kentucky-Indiana Water Science Center |
| Description | Report: ix, 59 p.; 2 Appendices; 2 Data Releases |
| Country | United States |
| State | Ohio |
| Other Geospatial | Big Darby Creek basin |
| Online Only (Y/N) | Y |
| Additional Online Files (Y/N) | Y |