

Characterization of Stream Water Quality and Groundwater Levels in the Central Pine Barrens Region, Suffolk County, New York, 2017–23
Links
- Document: Report (5.02 MB pdf) , HTML , XML
- Data Releases:
- USGS data release - 2018 Hydrologic data summary for the Central Pine Barrens Region, Suffolk County, New York (ver. 2.0, February 2024)
- USGS data release - 2019 Hydrologic data summary for the Central Pine Barrens Region, Suffolk County, New York (ver. 2.0, February 2024)
- USGS data release - 2020 Hydrologic data summary for the Central Pine Barrens Region, Suffolk County, New York (ver. 2.0, February 2024)
- USGS data release - 2021 Hydrologic data summary for the Central Pine Barrens Region, Suffolk County, New York
- USGS data release - 2022 Hydrologic data summary for the Central Pine Barrens Region, Suffolk County, New York
- NGMDB Index Page: National Geologic Map Database Index Page (html)
- Download citation as: RIS | Dublin Core
Abstract
The area locally known as the “Central Pine Barrens” region, located in Suffolk County, New York, contains most of Long Island’s preserved and undeveloped land. This region overlays an aquifer system that provides potable groundwater for residents of Suffolk County. Between 2017 and 2023, the U.S. Geological Survey, in cooperation with the Central Pine Barrens Joint Planning & Policy Commission and the Town of Brookhaven, monitored groundwater levels and stream water quality in this region. Groundwater levels were measured monthly at five wells and continuously (15-minute intervals) at a sixth well. Water quality was monitored at five locations in the Carmans River and at two locations in the Peconic River, and samples were analyzed for major ions, trace elements, nutrients, pharmaceuticals, and pesticides. The major ion compositions at the sites were mainly sodium-chloride type waters, and compositions varied the most at the furthest upstream sites in both streams. Concentrations above aquatic-life criteria thresholds also occurred most frequently at the furthest upstream sites. The seasonal patterns of nutrient loads and concentrations varied between the Carmans and Peconic Rivers. Several organic compounds including pharmaceuticals, domestic use products, and pesticides were detected at low concentrations in both streams. Metformin was the most frequently detected pharmaceutical compound, and herbicides were the most frequently detected pesticide class. Water-quality conditions influenced by anthropogenic contributions are a result of current and historical land use, and these contributions include onsite wastewater disposal systems, commercial or domestic fertilizers and pesticides, and urban or industrial contaminants in road runoff. This study characterizes and improves understanding of the current hydrologic conditions in the Central Pine Barrens region and the study findings can help inform the development of plans to manage, protect, and restore water resources.
Introduction
The U.S. Geological Survey (USGS), in cooperation with the Central Pine Barrens Joint Planning & Policy Commission and the Town of Brookhaven, New York, conducted a 5-year study to enhance groundwater-level monitoring and characterize the current water quality of the Carmans and Peconic Rivers in the region locally known as the “Central Pine Barrens” in Suffolk County, N.Y. Stream water-quality monitoring is important because there are concerns of declining water quality and aquatic health in the region from increased land development and wastewater inputs (Town of Brookhaven, 2013). Groundwater is a critical resource in the Central Pine Barrens region because it provides potable water for the residents of Suffolk County and supplies baseflow to streams. Groundwater-level monitoring is important to help understand the status and influences on the availability and sustainability of groundwater resources for the future.
The Central Pine Barrens region is a hydrologically and ecologically sensitive 431-square-kilometer (km2) protected landscape located in central and eastern Suffolk County, Long Island, New York (Central Pine Barrens Joint Planning & Policy Commission staff, 2022). The Long Island aquifer system underlying the Central Pine Barrens region is a sole-source aquifer for 1.5 million Suffolk County residents (U.S. Census Bureau, 2022). The Central Pine Barrens region is surrounded by urban and suburban areas. Increasing population and development present an increased risk to the region’s quality and quantity of groundwater, hydrologically linked surface water resources, and ecology. To preserve the hydrologic and ecologic resources of the region, the New York State Legislature passed the Long Island Pine Barrens Protection Act in 1993 (New York State Legislature, 1993), which established two zones within the Central Pine Barrens: a core preservation area, where limited new development is permitted, and a compatible growth area, where only environmentally compatible development is permitted (fig. 1, New York State Senate, 2014). Since the Act’s passage, more land area has been added, and as of 2023, the core preservation area is about 234 km2 and the compatible growth area is about 197 km2 (Central Pine Barrens Joint Planning & Policy Commission staff, 2022). The Central Pine Barrens Joint Planning & Policy Commission manages the land and protects its natural and recreational resources for Long Island residents.
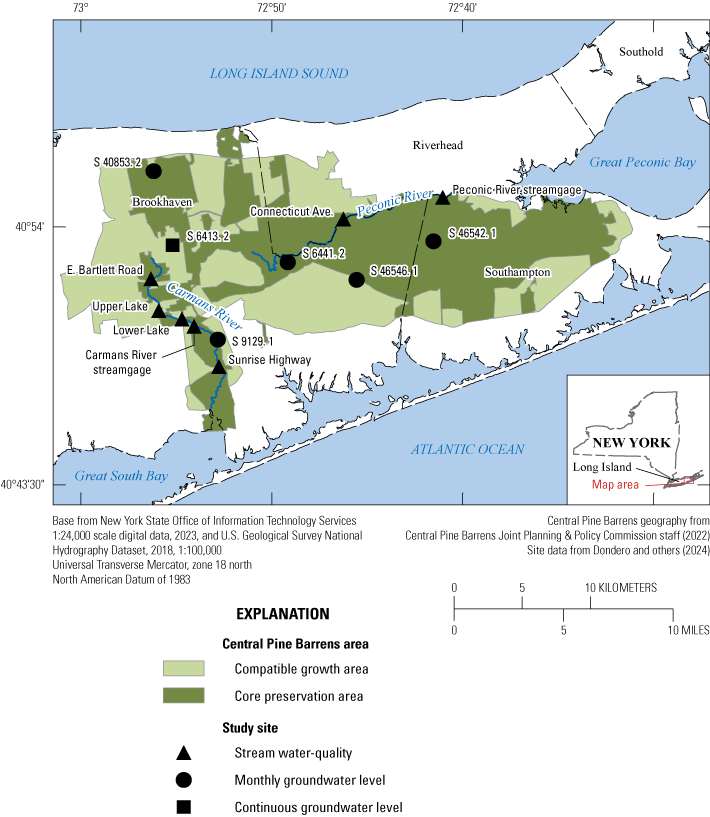
Map showing study area, monitoring sites, and type of preservation area in the Central Pine Barrens region in Suffolk County, New York. Site information is in table 1.
Description of Study Area and Previous Studies
The Central Pine Barrens region is in central and eastern Suffolk County and overlaps parts of the towns of Brookhaven, Riverhead, and Southampton (fig. 1). The Central Pine Barrens region is ecologically diverse, with habitats including vernal ponds, woodlands (hardwoods, pines, shrubs), swamp, marsh, wetlands, streams, and lakes (Town of Brookhaven, 2013). Some tree types in the Central Pine Barrens forests include Pinus strobus (white pine), Quercus alba (white oak), Acer rubrum (red maple), Nyssa sylvatica (black gum), and Pinus rigida (pitch pine). Rare or vulnerable plant species found in the Central Pine Barrens include the Carex bullata (button sedge), Carex collinsii (Collins’ sedge), Bartonia paniculata ssp. paniculata (twining screwstem), Crassula aquatica (water pygmyweed), and Scleria triglomerata (whip nutrush). There is a large diversity of animals in the Central Pine Barrens, and some rare species include Tyto alba (barn owl), Kinosternon subrubrum (eastern mud turtle), and Ambystoma tigrinum (eastern tiger salamander; Town of Brookhaven, 2013). The sensitive ecosystem of the Central Pine Barrens is reliant on the groundwater and freshwater streams within the region.
The Central Pine Barrens consists of two groundwater-fed freshwater streams, the Carmans and Peconic Rivers. In addition to the ecological importance of the two streams, the streams are important for recreational purposes including fishing and boating. To protect waters in New York State, water-quality standards are set for surface waters by the New York State Department of Environmental Conservation (NYSDEC) according to the waters' designated uses (NYSDEC, 1998). The Carmans and Peconic Rivers are classified as suitable for fish, shellfish, and wildlife propagation and survival by NYSDEC water-quality standards (class C; NYSDEC, 2015, 2021). The Carmans River is additionally classified for trout spawning (class TS), which applies additional stringent water-quality criteria for certain constituents (NYSDEC, 2021). Fish species in the Carmans River include Alosa pseudoharengus (alewife), Salvelinus fontinalis (brook trout), Salmo trutta (brown trout), Oncorhynchus mykiss (rainbow trout), Gasterosteus aculeatus (threespine stickleback), Morone americana (white perch), and Morone saxatilis (striped bass; Carlson and others, 2016). The Carmans River is actively stocked by the NYSDEC with rainbow trout and brown trout (NYSDEC, 2023c). Fish species in the Peconic River include alewife, Notropis bifrenatus (bridle shiner), Erimyzon oblongus (eastern creek chubsucker), Esox niger (chain pickerel), white perch, Enneacanthus obesus (banded sunfish), and Lepomis macrochirus (bluegill; Carlson and others, 2016). The Peconic River is not actively stocked for trout (NYSDEC, 2023c). Periodic water-quality impairments reported by the NYSDEC in both streams have been documented and, in some cases in the Peconic River, have resulted in fish kills (NYSDEC, 2015).
The headwaters of the Carmans and Peconic Rivers and most of the study watersheds, or areas that contribute to the stream baseflow, are within the Central Pine Barrens (fig. 1). Because these streams were mostly sampled during stable flow conditions when groundwater supplies baseflow to streams, the watershed delineations in this report from Misut and others (2021) only include areas contributing groundwater to the streams. The Carmans River watershed is about 93 km2, and the stream is about 17 kilometers (km) in length and flows southward from central Suffolk County into Great South Bay in Brookhaven (fig. 1). Land use within each watershed (fig. 2) was described using the National Land Cover Database (Dewitz and U.S. Geological Survey, 2021). The Carmans River watershed is approximately 49 percent developed (open space and low, medium, and high intensity), 38 percent undeveloped (forest and shrub land), 7 percent wetlands (woody and emergent herbaceous), and the remaining area comprises small amounts of open water, barren land, herbaceous land, and agricultural land (cultivated crops, hay, pasture; Dewitz and U.S. Geological Survey, 2021). Constructed impoundments along the Carmans River include those at Upper Lake, Lower Lake, and the water body locally known as “Hards lake.” Water-quality sampling locations in the Carmans River (USGS stations 01304995, 01304998, and 01305040; U.S. Geological Survey, 2023) are located immediately downstream from each impoundment, respectively. The Carmans River is tidally influenced at the farthest downstream site (01305040), and up to the “Hards lake” impoundment.
The Peconic River watershed is about 95 km2, and the stream is about 23 km in length and flows eastward from central Suffolk County into Great Peconic Bay (fig. 1; Misut and others, 2021). The Peconic River water-quality sampling locations at USGS stations 01304440 and 01304500 are also located immediately downstream from impoundments. The Peconic River watershed is approximately 61 percent undeveloped, 23 percent developed, 9 percent wetlands, 4 percent agriculture, and small percentages of other land use groupings (Dewitz and U.S. Geological Survey, 2021). Fisher and others (2021) reported that some land use areas as classified in the National Land Cover Database do not agree with field observations in Long Island, specifically regarding land use types for which fertilizers or pesticides are likely applied and managed. For example, sod farms in Long Island that were classified as “grassland/pasture” fit better in the “agricultural” category (Fisher and others, 2021). Furthermore, the National Land Cover Database categorizes golf courses and greenhouses in the “developed” land use category; but because golf courses and greenhouses have fertilizers and pesticides applied, the “agricultural” category would be a better fit in this study. Land use categories were not recalculated for this study; therefore, agricultural and pesticide management areas may be underestimated.
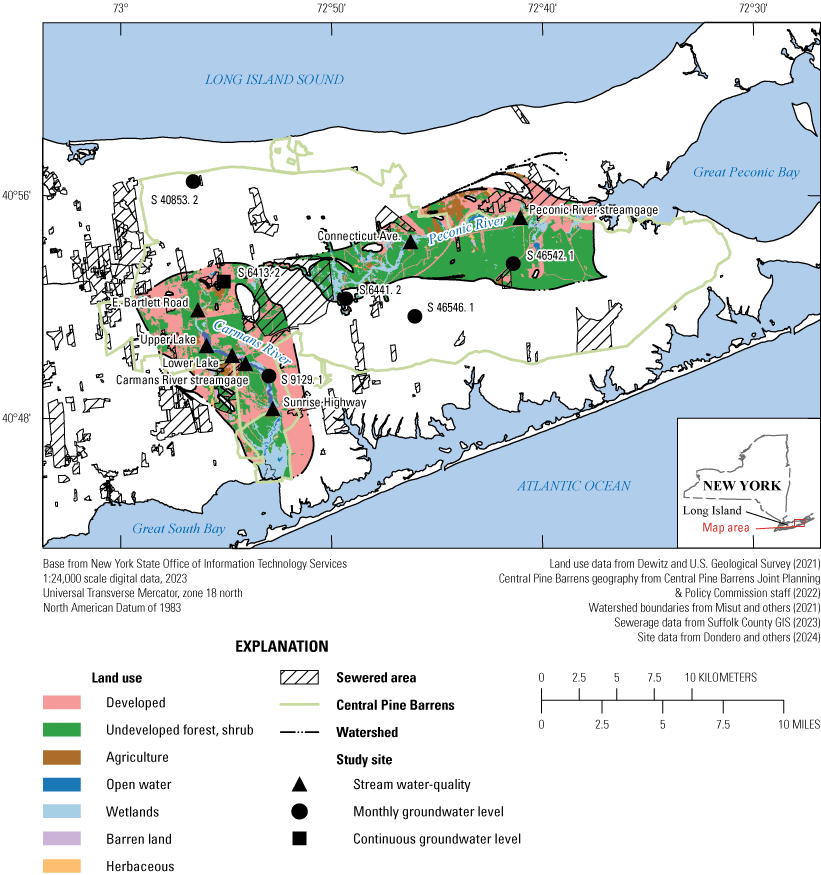
Map showing land uses and sewered areas in the Central Pine Barrens region, Suffolk County, New York. Site information is in table 1.
For both the Carmans and Peconic River watersheds about 70 percent of groundwater travel times to the stream are 50 years or less (Misut and others, 2021). Within 1 km of the Carmans and Peconic River, 86 percent and 82 percent of groundwater travel times to the streams are 10 years or less, respectively; therefore, baseflow to these groundwater-fed streams is dominated by contributions from shallow, young groundwater (Misut and others, 2021).
The Central Pine Barrens region of Long Island is underlain by Pleistocene unconsolidated, permeable glacial outwash sediments. These sediments, where saturated, make up the upper glacial aquifer, which is the most surficial unit of Long Island’s sole-source aquifer system. The recharge of the aquifer system is from precipitation. Water recharge flows vertically into deeper parts of the aquifer system or through the shallow part of the aquifer system and into the Carmans and Peconic Rivers, the two major freshwater rivers flowing through the Central Pine Barrens (Reynolds, 1982; Spinello and Simmons, 1992; O’Malley, 2008).
The Central Pine Barrens region is mostly unsewered and mainly served by residential onsite wastewater disposal systems. Many homes in the area still rely on a series of cesspools (unlined pits) for waste disposal rather than septic tanks. In the areas with groundwater travel times of 100 years or less to the Carmans River, it is estimated that out of a population of 32,700 about 25,300 people rely upon onsite wastewater disposal systems, and about 7,400 people live in homes that are connected to a sewage treatment plant (Town of Brookhaven, 2013). There are parts of the Central Pine Barrens that are sewered in the Towns of Brookhaven, Riverhead, and Southampton (Suffolk County GIS, 2023). Much of the developed land immediately north of the Peconic River is sewered (fig. 2). Within the two watersheds, wastewater facilities discharge treated wastewater into groundwaters or surface waters (NYSDEC, 2024); however, none discharge directly to the Carmans or Peconic Rivers upstream from the sampling locations in this study. Across Long Island, baseflow contribution from groundwater discharge is higher in unsewered, lesser developed areas (like near the Carmans and Peconic Rivers) and is lower in highly urbanized, sewered areas because more recharge water is intercepted or rerouted before entering the groundwater system in developed areas; likely by storm sewers, sanitary sewers, and impermeable surfaces (Spinello and Simmons, 1992; Monti and Scorca, 2003). Furthermore, groundwater levels can be affected by pumping for water supplies, precipitation fluctuations, or impervious surfaces (Scorca and others, 1999).
Long-term streamflow and stream water-quality data collected by the USGS in the Central Pine Barrens are publicly available (U.S. Geological Survey, 2023). USGS streamflow data are available for the Peconic River (01304500) and Carmans River (01305000) starting in 1942, and periodic water-quality data are available beginning in 1966 and can be retrieved from the National Water Information System (NWIS; U.S. Geological Survey, 2023). Groundwater levels have been routinely measured across Long Island for over a century (Busciolano, 2005; U.S. Geological Survey, 2017) and are periodically used to generate water-table maps, starting in 1903 (Burr and others, 1904; Veatch and others, 1906) and most recently in 2016 (Como and others, 2018). Historical groundwater levels are available for the wells measured for this study as early as 1972 and are reported in Scorca and others (1999) and are available in NWIS (U.S. Geological Survey, 2023). Groundwater quality in the Central Pine Barrens has also been measured and reported (Monti and Scorca, 2003; Fisher and others, 2021; DeSimone, 2023).
The surficial upper glacial aquifer is susceptible to contamination from onsite wastewater disposal systems in unsewered areas, and historical nitrogen contamination in this aquifer has been documented (Katz and others, 1980; Porter, 1980; Ragone and others, 1980). Nitrogen isotopes analyzed in shallow groundwater in Suffolk County suggest the nitrogen sources were from fertilizer, septic effluent, and animal waste (Abbene, 2010). Drinking water sources in Long Island are mainly from the Magothy aquifer which is beneath the upper glacial aquifer and is generally confined or semiconfined in the study area (Walter and others, 2024). Nitrate concentrations and other contaminants of emerging concern are typically lower in the Magothy aquifer than the upper glacial aquifer, and elevated concentrations of nitrate in deep groundwater are attributed to pumping that draws down shallow groundwater with nitrate that mixes into the deeper groundwater (Eckhardt and Pearsall, 1989; Monti and Scorca, 2003; Ayotte and others, 2011). Excess nitrogen or phosphorus loading to Great South Bay and Great Peconic Bay can cause excessive growth of algae that reduces dissolved oxygen levels, thus negatively affecting aquatic life. Furthermore, Fisher and others (2021) documented the occurrence and distribution of pesticides in shallow groundwater across Long Island and found that the highest concentrations and most frequent detections of pesticides occurred in agricultural and horticultural areas in eastern Long Island. The Fisher and others (2021) study also found that detection and patterns of pesticides in different regions in Long Island reflect land use.
The following statistics are from Monti and Scorca (2003), who computed nitrogen loads and assessed long-term trends for streams in Long Island, including the Carmans River, from 1972 to 1997. The annual average nitrogen load from 1972 to 1997 for the Carmans River (at USGS station 01305000) was 29,900 kilograms per year (kg/yr). Comparatively, nitrogen loads of nearby streams, such as the Carlls River (USGS station 01308500) and the Connetquot River (USGS station 01306500), were 94,300 kg/yr and 48,900 kg/yr, respectively. The median nitrogen concentration in the Carmans River (USGS station 01305000) during 1972 to 1997 was 1.25 milligrams per liter (mg/L; a range of 0.53 to 8.3 mg/L); this is the lowest median compared to the other 13 streams in Long Island in the 2003 study. Generally, streams in sewered districts showed decreasing nitrogen trends, and streams in largely unsewered areas, including the Carmans River, showed increasing trends (Monti and Scorca, 2003).
Studies of long-term nitrogen trends have not been published for the Peconic River, but monitoring of mid- and high-stage streamflow conditions and groundwater levels near the headwaters has been completed (Scorca and others, 1999; Schubert and others, 2006). Scorca and others (1999) also defined the geological stratigraphy around the Peconic River headwaters in detail and describe how the start of flow location of the Peconic River headwaters changes depending on water-table fluctuations.
Methods
Between 2017 and 2023, the U.S. Geological Survey monitored groundwater levels and stream water quality in the Central Pine Barrens region. Groundwater levels were measured monthly at five wells and continuously (15-minute intervals) at a sixth well. Water quality was monitored quarterly at five locations in the Carmans River and semiannually at two locations in the Peconic River.
Groundwater-Levels Monitoring
The USGS has a large groundwater monitoring network on Long Island and measures dozens of groundwater levels monthly and hundreds of groundwater levels annually (U.S. Geological Survey, 2017). For this project, monitoring frequency was increased at six wells (table 1) in the upper glacial aquifer, enhancing the existing network across Long Island. This report provides an assessment of groundwater levels from October 2017 to September 2022, including monthly measurements of groundwater levels at five wells, and, starting in February 2018, continuous measurements (15-minute interval) at a sixth well (table 1). The monthly water levels were measured with steel or electric tapes, using the standard USGS protocols outlined in Cunningham and Schalk (2011). The well with water levels recorded every 15 minutes was measured with a vented submersible pressure transducer attached to an electronic data logger. Occasional gaps in data at all six sites were due to issues such as equipment malfunctions or site accessibility. Hereafter, the groundwater level sites are referred to by their USGS station name (table 1). Groundwater level data are available in NWIS (U.S. Geological Survey, 2023) and various data releases (Fisher and others, 2019; Bayraktar and others, 2020; Bayraktar and others, 2021; May and others, 2022; and Dondero and others, 2024).
Table 1.
Stream water-quality sampling and groundwater-level monitoring sites in the Central Pine Barrens region, Suffolk County, New York, between 2017 and 2023.[Data from U.S. Geological Survey (2023). USGS, U.S. Geological Survey; NY, New York; —, not applicable]
In the R programming environment, the package “climb8” was used to retrieve monthly climate data (Palmer Drought Severity Index) in the region to assess if observed extremes in water levels occurred during dry and wet periods (National Oceanic and Atmospheric Administration, 2014; May and Levitt, 2022; R Core Team, 2023). The same package in R was used to retrieve daily precipitation data at S 6413. 2 (Abatzoglou, 2011).
Stream Water-Quality Sample Collection and Analysis
Stream water-quality samples were collected at five locations in the Carmans River and two locations in the Peconic River between 2017 and 2023 (fig. 1, table 1). Sites were sampled seasonally from fall 2017 through spring 2023, though the schedule varied by site (table 1). Hereafter, stream water-quality sites are referred to by their study site names (table 1). Sites were selected based on available historical data and were identified to have hydrologic and ecologic significance for monitoring stream water-quality management and restoration efforts (Town of Brookhaven, 2013). Multiple sampling locations along the Carmans River provide a spatial distribution of water quality from the headwaters to near the stream mouth. The surrounding area of the upstream Peconic River site (Connecticut Ave.) is less developed than the further downstream site (Peconic River streamgage) and provides a comparison of water-quality conditions in less developed and more developed areas (fig. 2). Water-quality samples were collected at each site for five years, but sampling began and ended later at three sites on the Carmans River (E. Bartlett Road, Lower Lake, and Sunrise Highway; table 1). Most samples were collected under stable, dry conditions when the stream stage was neither rising nor falling, which is when groundwater represented a substantial part of the streamflow (Winter, 2007). Carmans River sites were sampled in the spring, summer, fall, and winter, and Peconic River sites were sampled in the spring and fall. For each sampling season, fall sampling was generally in November, winter sampling in February (before the commercial application of lawn fertilizer is permitted), spring sampling in June, and summer sampling in September. Each sample collected was analyzed for nutrients (species of nitrogen and phosphorus) and other inorganics including major ions and trace elements (table 2). Constituents were chosen largely based on previous research in the study area (Monti and Scorca, 2003; O’Malley, 2008; Town of Brookhaven, 2013). Field measurements were made for dissolved oxygen, temperature, specific conductance, pH, and turbidity using a multiparameter instrument that was calibrated prior to data collection (U.S. Geological Survey, variously dated). Once per year, alternating each year in the spring or fall, samples were collected and analyzed for organic compounds at the two Peconic River sites (Connecticut Ave. and Peconic River streamgage) and Carmans River streamgage; the analytes include pharmaceuticals, domestic use products, pesticides, and one industrial byproduct (table 2). Because the furthest downstream site in the Carmans River (Sunrise Highway) is tidally influenced, all samples were collected at the site within two hours of low tide to collect a sample representative of freshwater flow and to minimize tidal influence in the water-quality sample.
Table 2.
List of field measurements and constituents detected in at least one sample collected in the Central Pine Barrens region, Suffolk County, New York, between 2017 and 2023.[Parameter codes and CAS Registry Numbers from U.S. Geological Survey (2023). A complete list of constituents analyzed for this project are available in data releases, including Fisher and others (2019), Bayraktar and others (2020), Bayraktar and others (2021), May and others (2022), and Dondero and others (2024). USGS; U.S. Geological Survey; ESA, ethanesulfonic acid; HCTL, 4-hydroxychlorothalonil; —, not applicable]
Stream water-quality samples were collected and processed following USGS protocols for the collection of water-quality data (U.S. Geological Survey, variously dated) with one modification. Because samples were not processed in a chamber, all field blank samples were also processed without a chamber. Sampling equipment was cleaned following field cleaning procedures after use (U.S. Geological Survey, variously dated).
All samples were analyzed by the USGS National Water Quality Laboratory in Lakewood, Colorado. Water-quality data are available in NWIS (U.S. Geological Survey, 2023) and various data releases (Fisher and others, 2019; Bayraktar and others, 2020; Bayraktar and others, 2021; May and others, 2022; and Dondero and others, 2024).
Quality Assurance
Quality assurance water-quality samples were collected throughout the study (Fisher and others, 2019; Bayraktar and others, 2020; Bayraktar and others, 2021; May and others, 2022; and Dondero and others, 2024). Quality-assurance samples analyzed for inorganics include 1 source solution blank, 5 field blanks, 6 equipment blanks, and 11 split replicates. A subset of these quality-assurance samples also included organic analyses and include four equipment blanks, two field blanks, three split replicate samples, and four field matrix spikes for pesticides. Blank samples estimate the potential for bias due to contamination introduced through sampling equipment, sampling procedures, or cleaning procedures. For this project, deionized water was used as the last step of cleaning the sampling equipment, so a source solution blank for deionized water was collected to test if that step may introduce contamination. The equipment and field blanks were prepared using organic-free water for organic analytes, and inorganic-free water for inorganic analytes, and used the same sampling equipment and sample-processing procedures for the collection of all environmental samples. Equipment blanks were collected in the lab, and the field blanks were collected in the field at a sampling site.
Overall, blank sample results were satisfactory, with most constituents not detected. Organic analytes were not detected in any blank samples. For inorganic constituents that were detected in the blank samples, none were consistently detected across blanks, so chronic contamination for any constituent was unlikely. Some constituents were detected at levels near the detection limit yet were substantially lower than the lowest environmental sample detection, so contamination of environmental samples was unlikely. Total phosphorus was detected once in a field blank sample at 0.042 mg/L on September 7, 2022, and copper was detected once in a field blank sample at 0.73 micrograms per liter (µg/L) on February 27, 2020; both samples were higher than most environmental samples collected around the same time. Phosphorus was not detected in other blank samples, and environmental sample concentrations during the same sampling event as the blank were within historical ranges or not detected. Copper was not detected in most environmental samples collected around the same time as the contaminated blank sample, and the samples with detections for copper were within historical ranges for the sites. Therefore, it does not appear that contamination of copper or phosphorus affected the environmental samples; thus, environmental data were not removed from the dataset.
For split replicate sample collection, a second bottle was collected after each environmental sample, also from the same churn splitter. The replicate samples were analyzed to assess variability in analytical methods. The variability was assessed by calculating and comparing the relative percent difference between pairs of samples. For sample pairs that both had detections of a given analyte, the relative percent difference was less than 10 percent for 85 percent of analytes, and the median relative percent difference was about 2.5 percent.
For split replicate samples analyzed for organics, instances where an analyte was detected in only one of the replicate pairs (‘unmatched pairs’) occurred for three pesticide analytes and three pharmaceutical analytes. The concentrations for the detections in the unmatched pairs were either between the reporting level and the method detection limit or below the method detection limit (detected, not quantified; DNQ); therefore, the relative percent difference was not calculated. The method detection limit (MDL) for a given constituent is the minimum concentration that can be measured and reported with 99 percent confidence that the concentration is greater than zero, and the reporting level (RL) is typically twice the method detection limit. The median relative percent difference for “matched pairs” of analytes in the pharmaceutical method was 15 percent, whereas the relative percent difference for matched pairs of analytes in the pesticide method was 9.9 percent.
Field matrix pesticide spikes were analyzed with four samples for this study, and expected concentrations and spike recoveries are available in Fisher and others (2019), Bayraktar and others (2020), Bayraktar and others (2021), and Dondero and others (2024). The spike recoveries were calculated by subtracting the environmental concentration from the reported spike concentration and dividing the total by the expected concentration, then converting to a percent (eq. 1).
whereCS
is the spike concentration;
CE
is the environmental concentration; and
Cexp
is the expected concentration.
The expected concentration (Cexp) was calculated by multiplying the spike concentration (CS) by the amount of spike solution added and dividing by the sample volume. For analytes not detected in the environmental sample, a zero value was used for the environmental concentration (CE) in the calculation. Median recoveries for the four spiked samples ranged between 93 and 102 percent. Most recoveries for the spiked samples were between 75 percent and 120 percent (10th and 90th percentiles, respectively, fig. 3), and few recoveries (<10 percent) fell outside of the laboratory performance method acceptance criteria (70 to 130 percent; Sandstrom and others, 2016).
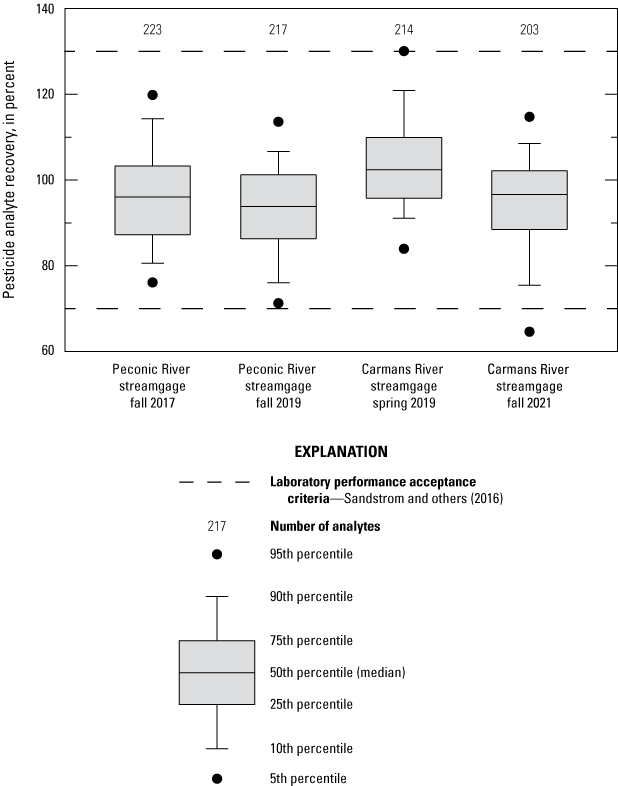
Boxplots showing pesticide analyte recoveries from spiked samples collected between 2017 and 2021 (Fisher and others, 2019; Bayraktar and others, 2020; Bayraktar and others, 2021; Dondero and others, 2024). Fall 2017 and 2019 samples were collected at Peconic River streamgage, and spring 2019 and fall 2021 samples were collected at Carmans River streamgage. Site information is in table 1.
Water-Quality Data Analysis
In the R programming environment, the package “dataRetrieval” was used to retrieve water-quality data from NWIS for water-quality data analysis (DeCicco and others, 2015; R Core Team, 2023; U.S. Geological Survey, 2023). Summary statistics (minimum, median, and maximum) were computed for select water-quality constituents (including some major ions, trace elements, and nutrients) in the R programming environment using the package “psych” (Revelle, 2007). The general stream chemistry was classified with a Piper diagram (Piper, 1944). Piper diagrams display the chemical composition of the major ions within a stream, divided into three subplots: a triangle plot comparing the contribution of cations (left), a second triangle plot comparing the contribution of anions (right), and a diamond plot comparing the dominance of the cations and anions (top). The concentrations of the major ions are converted to milliequivalents per liter, and the percent contributions of the total for each constituent is displayed in the diagram. The three plots are used to determine if the water chemistry is predominantly one dominant type, a mixed type, or of no dominant type. For example, if the dominant cations are sodium and potassium and the dominant anions are chloride, then the water is sodium-chloride type. The piper diagram presented in this report was generated in the R programming environment using the package “smwrBase” (Lorenz, 2015) and were graphed using the package “smwrGraphs” (Lorenz and Diekoff, 2017).
Five-year medians of water-quality analytes in this study were compared to historical medians of select water-quality analytes from water samples collected at Peconic River streamgage (01304500) and Carmans River streamgage (01305000; U.S. Geological Survey, 2023). In this study, most samples were collected during stable conditions. To calculate historical medians, environmental samples during storms were excluded to be consistent with the sampling design for this study. Historical median concentrations for Carmans River streamgage and Peconic River streamgage were calculated for both total phosphorus (1971–97) and chloride (1966–97; U.S. Geological Survey, 2023). Historical median total nitrogen for Peconic River streamgage was calculated (1971–97; U.S. Geological Survey, 2023), and for Carmans River streamgage, the historical median total nitrogen reported in Monti and Scorca (2003) was used.
Total pharmaceutical and total pesticide concentrations were calculated for each sample by summing the quantifiable concentrations of each analyte. Total concentrations of pharmaceuticals or pesticides are provided as the sum of quantified concentrations per sample to summarize the overall prevalence of the analyte group per sample. The analyte groups are total pharmaceuticals and total pesticides; the pesticides are subdivided into total herbicides, total fungicides, and total insecticides. To account for variability in replicate pairs for total pesticide and total pharmaceutical calculations, the total concentration was calculated for each sample, then the median total concentration was calculated between the pairs.
Statistical relations between concentrations of total nitrogen and total pharmaceuticals and pesticides were assessed using the nonparametric Spearman rank correlation coefficient and an alpha (α) threshold of 0.05 to evaluate the significance of results. Statistics were calculated in the R programming environment using the “stats” package (R Core Team, 2023). For these rank-based correlation statistics and related plots 5 nanograms per liter (ng/L) was substituted when the total concentration result was detected but not quantified, and 2.5 ng/L was substituted when none of the analytes were detected.
Daily Load Computations
Daily loads were computed for total nitrogen and total phosphorus transported in the Carmans River and Peconic River at their respective streamgages, in units of kilograms (kg) for the day a sample was collected. Daily loads were computed by multiplying the concentration of the constituents by the discharge at the time of sample collection. Because samples were collected during stable flow conditions, the discharge and analyte concentrations were assumed to be constant throughout the day, and therefore, the computed load reasonably represents the constituent mass transported past the site on that day. Annual loads were not computed due to the limited number of samples collected during the study. Continuous discharge data at Carmans River streamgage and Peconic River streamgage for the study period are available in NWIS (U.S. Geological Survey, 2023). In addition, discharge was usually measured at the time of sample collection by USGS personnel following USGS protocols (Turnipseed and Sauer, 2010). When discharge values using both methods were available at the time of sample collection, the measured discharge value was used. Daily load values, expressed as the constituent mass for the day the sample was collected, were estimated from the following equation.
whereDaily load
is the constituent mass transported past the sample location for the day the sample was collected, in kilograms;
C
is the concentration of the water-quality constituent, in milligrams per liter;
Q
is the stream discharge at the sample collection time, in cubic feet per second; and
Cf
is the conversion factor (2.44657).
Aquatic-Life Criteria Analysis
Aquatic-life criteria are concentration thresholds of water-quality constituents that if not exceeded are not expected to cause adverse effects to aquatic life. The two subsets of aquatic-life criteria are chronic (continuous exposure) and acute (short term exposure). The acute criteria are for fish survival; if the 1-hour average concentration does not exceed the acute criteria value more than once every 3 years, then “aquatic organisms and their uses” should not be negatively affected (U.S. Environmental Protection Agency [EPA], 1986). These criteria are to protect aquatic organisms against toxicity to animals and plants, bioaccumulation in the food chain, and impaired commercial and recreational uses of aquatic organisms (Stephen and others, 1985). The chronic criteria are for fish propagation; if the 4-day average concentration does not exceed the criteria value more than once every 3 years, then aquatic organisms and their uses should not be negatively affected (EPA, 1986). The combination of these criteria should provide appropriate protection of aquatic organisms and their uses. Because of the quarterly or biannual sampling frequency in this study, 4-day and 1-hour average concentrations could not be calculated; therefore, the aquatic life criteria only provide context for the sampled concentrations and the concentrations should not be viewed as formally meeting or exceeding the criteria.
Stream pH and concentrations of trace elements, chloride, and nitrite were compared to the chronic and acute aquatic-life criteria for freshwater. Many of the New York State aquatic water-quality standards used for comparisons (NYSDEC, 2023d) are derived from EPA standards, which were designed to protect all or almost all bodies of water (Stephen and others, 1985; EPA, 1986; Kaul, 1998). For a given constituent, because the study area is within New York State, the New York State criteria were used for the comparisons, unless unavailable, in which case the EPA criteria were used. To collect data that are representative of a stream’s actual conditions, the NYSDEC recommends a minimum of eight samples and at least 2 years of data for flowing waters (NYSDEC, 2023a). For this study, 10 samples from the Peconic River and 20 samples from the Carmans River were collected over 5 years; both sample sets meet the NYSDEC recommendations.
The analyzed trace elements include dissolved (smaller than 0.45-micrometer [µm] diameter) aluminum, arsenic, cadmium, chromium, copper, iron, lead, nickel, selenium, silver, and zinc. For many metals, hardness of the water sample is included in the calculation of the New York State chronic and acute aquatic-life criteria (eqs. 3–14; NYSDEC, 2023d). Water-sample hardness typically affects metal toxicity, and for metals with hardness-dependent aquatic-life criteria, higher hardness is associated with higher criteria values (EPA, 1986). Hardness was calculated by summing calcium and magnesium concentrations (reported as calcium carbonate; eq. 15; NYSDEC, 2023d) for water samples with detections of metals. Hardness was not calculated for samples without detections of metals.
The chromium concentrations in this study include all species of chromium. There are two New York State aquatic-life criteria available for chromium; one for hexavalent chromium only, and the other is for all species of chromium except hexavalent chromium (eqs. 5 and 6; NYSDEC, 2023d). The criteria including all species except hexavalent chromium was used in this study. New York State aquatic-life criteria that are not hardness-dependent include aluminum (chronic criterion: 100 µg/L), arsenic (chronic criterion: 150 µg/L; acute criterion: 340 µg/L), nitrite (chronic criterion for Peconic River: 0.1 mg/L, chronic criterion for Carmans River [trout spawning waters]: 0.02 mg/L), selenium (chronic criterion: 4.6 µg/L), and silver (chronic criterion: 0.1 µg/L; NYSDEC, 2023d). New York State standards for ionic aluminum and silver were considered to be dissolved for comparisons in this report. New York State aquatic-life criteria for chloride, iron, and pH are not available, so the values were compared to EPA aquatic-life criteria (EPA, 1986); chloride (chronic criterion: 860 mg/L; acute criterion: 230 mg/L), iron (chronic criterion: 1,000 µg/L), and pH (chronic criterion: less than 6.5 or greater than 9.0 pH units). Silver concentrations in water samples were compared to EPA acute aquatic-life criteria because there is not an acute standard for New York State (3.2 µg/L; EPA, 1986).
Equations for hardness-dependent New York State chronic aquatic-life criteria for freshwater are as follows (NYSDEC, 2023d):
where Hardness as calcium carbonate was calculated by the following equation: whereCharacterization of Groundwater Levels
For the duration of this 5-year study, groundwater levels were measured monthly at five wells and continuously (15-minute intervals) at one well (table 1), which provides a spatiotemporal dataset of groundwater levels in the Central Pine Barrens region. Groundwater-level monitoring is important because the groundwater in Long Island's aquifer system provides baseflow to streams and is used for potable water supplies (Busciolano, 2005). Groundwater levels are controlled by recharge to and discharge from the aquifer system. Recharge is mainly from infiltration of precipitation and snowmelt; impervious surfaces cause more overland runoff and less recharge to the aquifer. The aquifer discharges groundwater to streams and coastal areas, and the aquifer is pumped for water supply. Monthly groundwater-level measurements can be used to quantify variability in levels from seasonal changes and wet or dry periods; higher frequency data (that is, continuous monitoring) can be used to quantify localized aquifer response to short-term events like precipitation, snowmelt, or pumping for water supply.
Overall, groundwater-level fluctuation patterns were similar for each site during this study (table 3 and fig. 4). The range of groundwater levels varied from 1.8 feet to 6.4 feet in the study wells during the study period. Ranges of groundwater levels vary depending on well location. For example, if the well is near a groundwater-discharge zone, such as a stream or lake, smaller variations in groundwater level would be expected than if the well is near a groundwater-recharge zone or has tidal influence, where larger variations would be expected. Of the six wells in this study, the one that showed the least variability in groundwater levels was in S 9129. 1 (fig. 4), likely because of the well’s proximity to a groundwater-discharge zone, the Carmans River (fig. 1). These groundwater levels and variability were consistent with long-term observations at the nearby wells reported in Busciolano (2005).
Table 3.
Summary statistics for the minimum, maximum, and range of groundwater-level elevations at sites monitored in the Central Pine Barrens region, Suffolk County, New York, between 2017 and 2022.[Data from U.S. Geological Survey (2023). Site information is in table 1. USGS, U.S. Geological Survey; NGVD 29, National Geodetic Vertical Datum of 1929; —, not applicable]
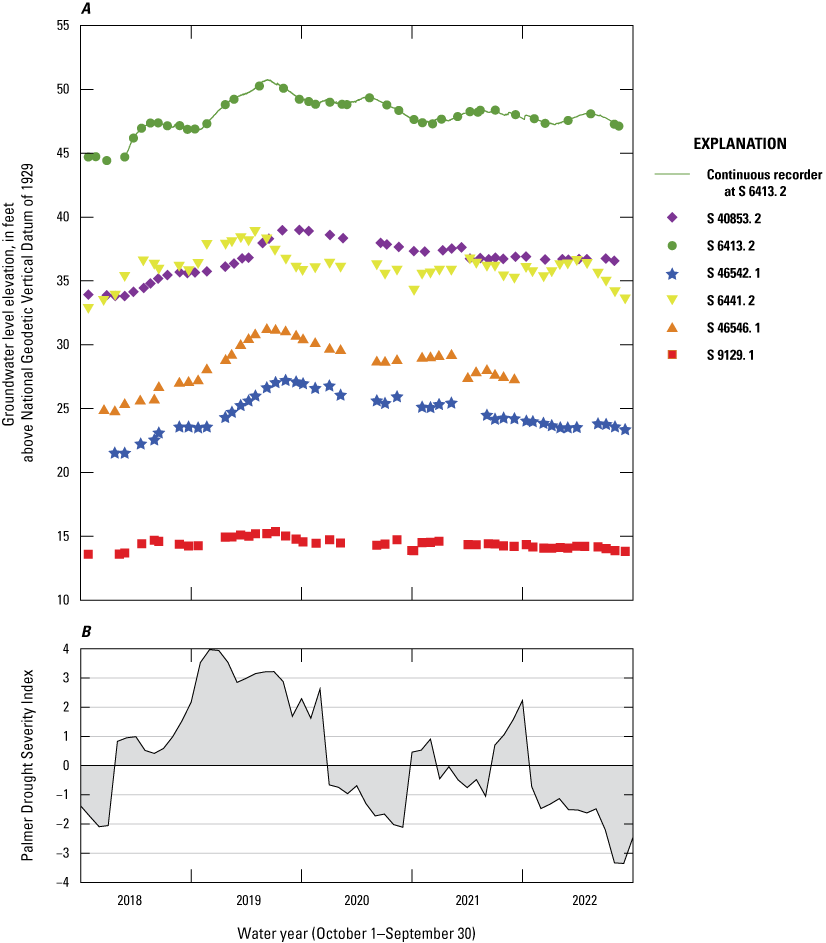
Graphs showing A, Discrete and continuous groundwater-level measurements in monitoring wells in the Central Pine Barrens region, Suffolk County, New York, between water years 2018 and 2022 (U.S. Geological Survey, 2023), and B, Palmer Drought Severity Index for the climate region of the study wells (site information is in table 1; National Oceanic and Atmospheric Administration, 2014).
To determine if minimum and maximum groundwater levels occurred during relatively dry and wet periods respectively, monthly Palmer Drought Severity Index (PDSI) data were assessed over the study period (fig. 4; National Oceanic and Atmospheric Administration 2014). Positive PDSI values correspond to wet periods, whereas negative values correspond to dry periods. A PDSI value of −3 represents drier conditions than −1. The minimum groundwater levels at all six wells occurred between October 2017 and February 2018 (table 3), which correspond to PDSI values from −1.4 to −2.1, indicating a dry period. The maximum groundwater levels occurred between May and August 2019 (table 3), which correspond to PDSI values from 2.9 to 3.2, indicating a wet period. Therefore, as expected, the minimum levels occurred during a relatively dry period, and the maximum levels occurred during a relatively wet period (fig. 4). Minimum and maximum groundwater-levels occurred during different times of the year; therefore, monthly or high-frequency (continuous) measurements add value to groundwater-level monitoring by documenting the year-round, short-term variability of groundwater levels.
The highest single day rain event during the study period was between October 25 and 26, 2021, with about 120 millimeters of rainfall (Abatzoglou, 2011). Continuous (15-minute interval) measurements show that the rain event increased daily mean groundwater levels at S 6413. 2 from 47.63 feet on October 25 to 47.97 feet on October 31, 2021; however, this brief event was not captured by the discrete groundwater-level measurements at the same site (fig. 5). For this same location, continuous monitoring data also documented a groundwater level 0.44 feet higher than the closest-in-time discrete measurement. The maximum groundwater level at S 6413. 2 occurred in June 2019 (50.70 feet), and the maximum groundwater level recorded by discrete measurement occurred in May 2019 (50.26 feet). The continuous groundwater level monitoring at S 6413. 2 better described short-term variability and rapid changes in groundwater availability at this location than the discrete measurements. Therefore, the monthly groundwater level measurements at the other five wells likely underestimate the range of water levels during the study period.
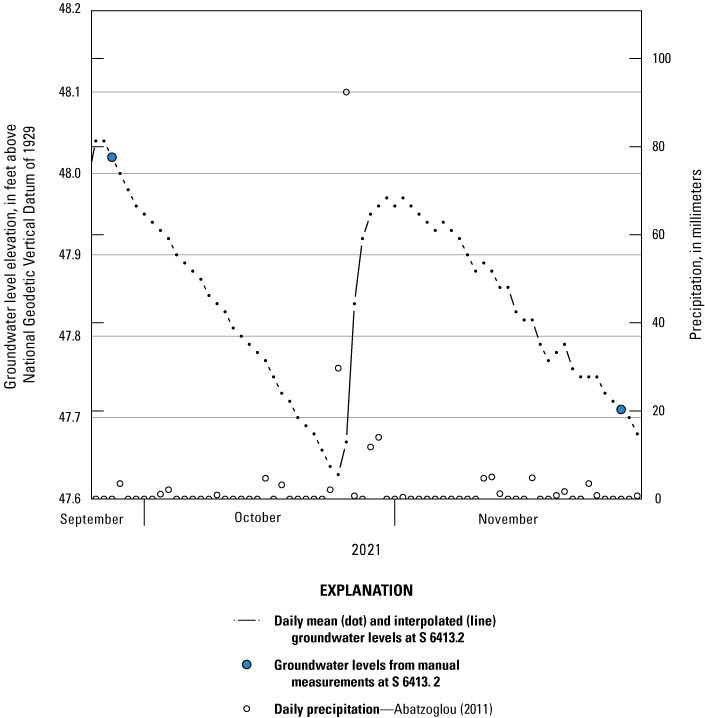
Graph showing daily mean groundwater level elevations and discrete measurements at S 6413. 2 (U.S. Geological Survey, 2023), compared to daily precipitation (Abatzoglou, 2011) from October 1, 2021, to December 1, 2021.
Characterization of Water Quality in the Carmans and Peconic Rivers
The following sections provide a current (2017 to 2023) characterization of water quality in the Carmans and Peconic Rivers, including the general stream chemistry, comparisons to aquatic-life criteria for several constituents, and anthropogenic influences on water quality such as urbanization, wastewater inputs, and fertilizer and pesticide uses.
General Stream Chemistry
Major ions such as sulfate, chloride, sodium, calcium, magnesium, potassium, and alkalinity are naturally abundant, essential for plants and animals, and are major constituents of many rock-forming minerals (Hem, 1985). Weathering of rocks and soils is a substantial source of major ions in water. Anthropogenic sources of these major ions to surface water and groundwater can include wastewater discharge, road salt runoff, or agricultural runoff.
For Carmans River streamgage, the recent median chloride concentration of 32.9 mg/L (table 4) was about 2.5 times higher than the historical (1966 to 1997) median chloride concentration of 13 mg/L (257 samples). Similarly, for Peconic River streamgage, the recent median chloride concentration of 29.7 mg/L was about 2.5 times higher than the historical (1966 to 1997) median of 12 mg/L (194 samples). Although the historical median does not include data from 1998 to 2016, a higher median chloride concentration during the recent period is consistent with increasing chloride concentrations in groundwater and surface water in urban areas in the northern United States (Mullaney and others, 2009). Increasing chloride concentrations in surface waters may be attributed to road salt applied for deicing and to discharge from wastewater disposal systems (Mullaney and others, 2009).
Table 4.
Summary statistics for selected constituents from samples collected at U.S. Geological Survey stations in the Carmans and Peconic Rivers in the Central Pine Barrens region, Suffolk County, New York, between 2017 and 2023.[Data from U.S. Geological Survey (2023). Site information is in table 1. USGS, U.S. Geological Survey; ND, not detected]
The sample compositions of major cations and anions at each site were similar for both streams and were mostly sodium-chloride type waters. Upper Lake and Lower Lake were partially mixed type waters, with higher percent contributions of calcium than the other sites (fig. 6). The furthest upstream sites on each stream, Carmans River at E. Bartlett Road and Peconic River at Connecticut Ave., had major ion compositions that varied slightly throughout the study period, whereas the other sites had compositions that were more consistent. Generally, for the four furthest downstream sites in the Carmans River (Upper Lake, Lower Lake, Carmans River streamgage, Sunrise Highway), the composition becomes more sodium-chloride dominant the further downstream the site. Salt spray from seawater bordering Long Island has contributed to the background sodium-chloride concentration in Long Island groundwater; predevelopment (1940s) concentrations for sodium and chloride are less than 10 mg/L (Franke and McClymonds, 1972; Buxton and Shernoff, 1995). The dominance in sodium-chloride type water increasing in the downstream direction is likely due to more anthropogenic inputs further downstream in the watershed, which coincides with a higher proportion of developed areas along the downstream reaches of the Carmans River than the upstream reaches. The Sunrise Highway site on the Carmans River has tidal influence, and although samples were collected during low tide, the site may have remnant influence from the salt water, which potentially increases the dominance of sodium and chloride relative to the other ions. At the furthest upstream sites, a larger range in concentrations of trace elements than at downstream sites were also observed (table 4). Variations in composition at the upstream sites may be in part related to the proximity of these sampling locations to roads. Road runoff contributes several contaminants to receiving surface waters, including metals, industrial contaminants, and road salts (Harned, 1988; Göbel and others, 2007; Smith and Granato, 2010; Corsi and others, 2010, Wu and others, 2021).
The sample composition variations may also be because of site proximity to stream headwaters. The start of flow location in headwaters can change with groundwater levels (Scorca and others, 1999); in other words, groundwater levels affect the areas where groundwater discharges to the stream (Winter, 2007). Depending on the start of flow location, groundwater flow paths through variable rocks and sediments or with different overlying land uses can produce groundwater discharge with different chemistry (Zimmer and others, 2012; Gómez and others, 2017; Zimmer and McGlynn, 2018). In studies documenting high-resolution spatial variations of stream water chemistry, the variability of solute concentrations was higher in the intermittent and ephemeral stream reaches compared to perennial reaches, and variation of water chemistry generally decreased with increasing upstream catchment area (Zimmer and others, 2012; Gómez and others, 2017). Therefore, the water chemistry of the E. Bartlett Road and Connecticut Ave. sites may be more variable than the other sites because of the susceptibility of varying groundwater flow paths that contribute different inputs to the stream, which could alter the water chemistry. Furthermore, Zimmer and others (2012) describes a “representative elementary area” as a threshold where variations of solute concentrations are minimal and the upstream water chemistry ranges can be used to predict downstream water chemistry variations. A “representative elementary area” was not determined for this study; but based on the piper diagram (fig. 6), the threshold area may be between E. Bartlett Road and Upper Lake, because the water chemistry of the Carmans River appears to follow a similar pattern from Upper Lake to Sunrise Highway.
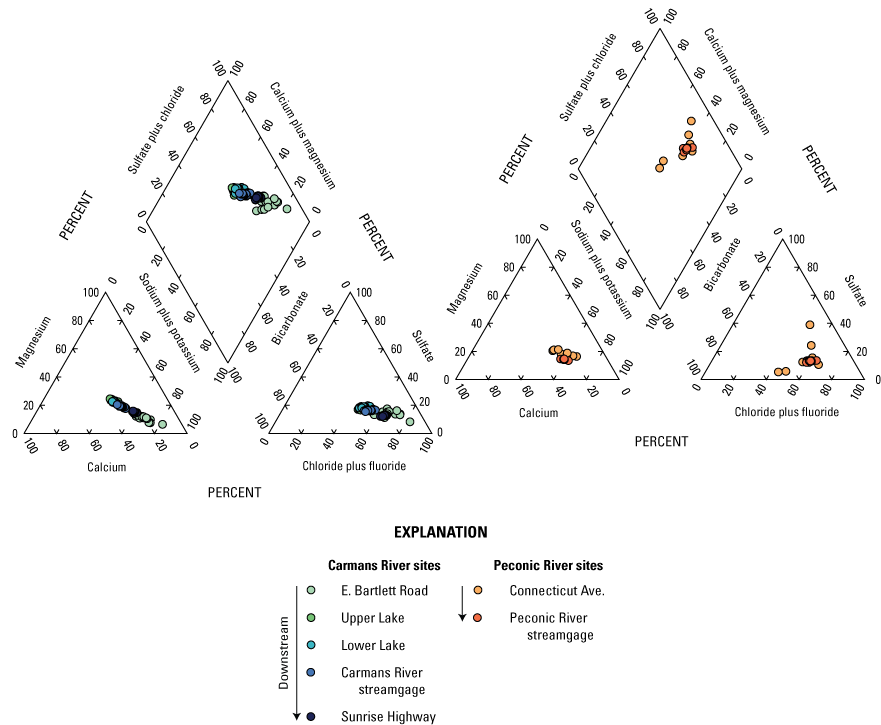
Piper diagram showing the percentage contributions of major ions in water samples collected in the Carmans and Peconic Rivers in the Central Pine Barrens region, Suffolk County, New York, between 2017 and 2023 (U.S. Geological Survey, 2023). Site information is in table 1 and site locations are shown in figure 1.
Comparisons of Constituent Concentrations to Aquatic-Life Criteria
In this section, sample concentrations of aluminum, arsenic, cadmium, chromium, chloride, copper, iron, pH, lead, nickel, nitrite, selenium, silver, and zinc are compared to New York State or EPA aquatic-life criteria. The dissolved fraction of constituents in water (the fraction that is bioavailable to aquatic organisms) were compared to chronic and acute criteria. Water-quality constituents that affect the toxicity of certain metals in water include the hardness, pH, temperature, and dissolved organic carbon (EPA, 2021).
Constituents with all detections below chronic or acute aquatic-life criteria include arsenic, cadmium, chloride, chromium (all species except hexavalent chromium), nickel, nitrite, selenium, and zinc. Copper was the only constituent with detections above the New York State acute aquatic-life criterion, and aluminum, copper, iron, lead, and silver had concentrations that were above New York State or EPA chronic aquatic-life criteria in at least one sample (fig. 7). pH was also measured below the range of the EPA chronic aquatic-life criteria in at least one sample.
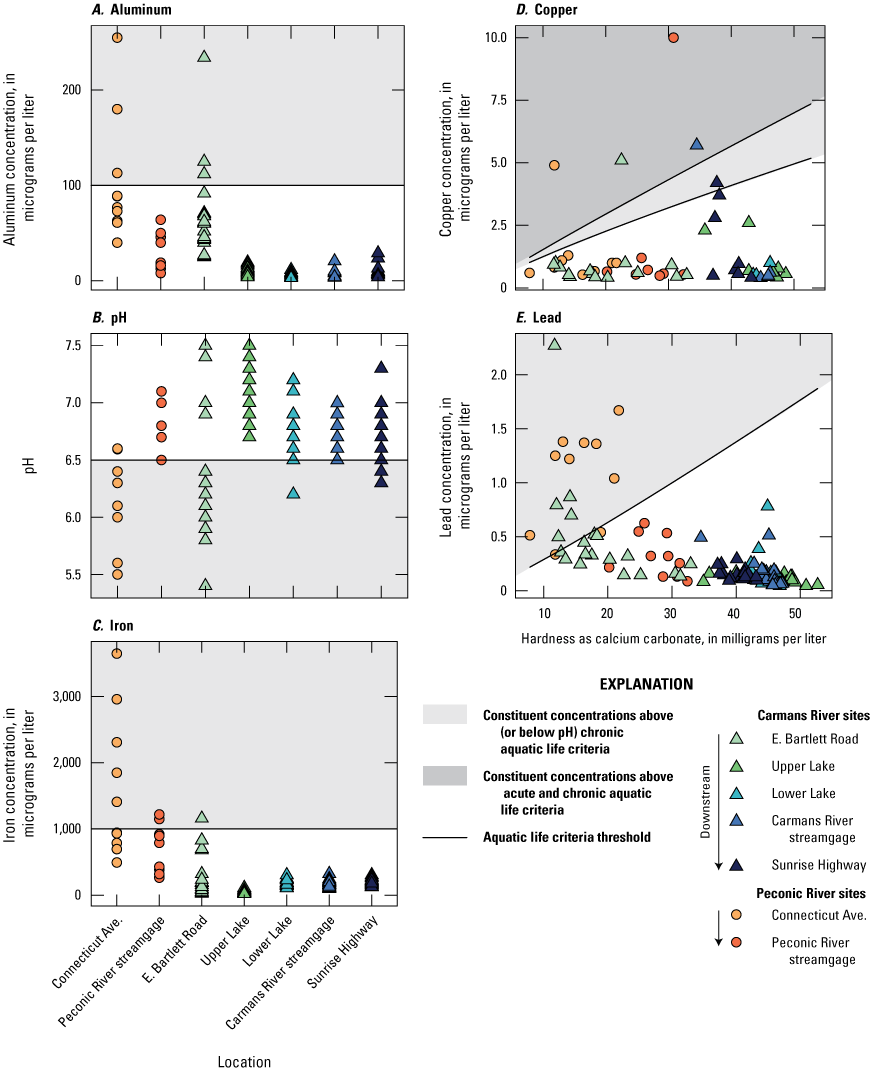
Graphs showing A, Aluminum, B, pH, C, Iron, D, Copper, and E, Lead in water samples collected in the Carmans and Peconic Rivers in the Central Pine Barrens region, Suffolk County, New York, between 2017 and 2023 (U.S. Geological Survey, 2023). Constituent concentrations were compared to New York State Department of Environmental Conservation (2023d) or U.S. Environmental Protection Agency (1986) aquatic-life criteria. Copper and lead hardness-dependent equations for determining chronic aquatic-life criteria values are provided in equations 8 and 10. Site information is in table 1 and site locations are shown in figure 1. Samples without a detection of a given analyte are not included. There are several pH values that overlap per site.
The EPA chronic aquatic-life criterion for pH is a range, for which below 6.5 or above 9.0 pH units is outside the criterion. pH was never above 9.0 pH units but was occasionally below 6.5 pH units (fig. 7B). In general, shallow groundwater in Long Island is acidic, with pH values generally ranging between 5.5 to 6.5 (Buxton and Shernoff, 1995; DeSimone and others, 2020; U.S. Geological Survey, 2023). pH was below 6.5 pH units during 7 out of 10 sampling events at Connecticut Ave. on the Peconic River (median 6.2 pH units; table 4). For the Carmans River, 14 out of 19 sampling events at E. Bartlett Road were below 6.5 pH (median 6.1 pH units), 1 out of 20 for Lower Lake (median 6.7 pH units), and 4 out of 20 at Sunrise Highway (median 6.8 pH units).
Aluminum detections above the New York State chronic aquatic-life criterion (100 µg/L) occurred most frequently in the Peconic River at Connecticut Ave. At this site, 3 out of 10 samples were above the criterion (median 82.8 µg/L; table 4), whereas no samples at the downstream site at the Peconic River streamgage were above the aluminum criterion (median 19 µg/L; fig. 7A). In the Carmans River at E. Bartlett Road, 3 out of 20 samples (median 56 µg/L) were above the chronic aquatic-life criterion for aluminum. No samples collected at the further downstream sites on the Carmans River were above any aluminum criterion. Aluminum is abundant in Earth’s outer crust and in silicate minerals, therefore most natural waters have a natural source of aluminum. Lower pH is typically associated with higher aluminum concentrations (Hem, 1985).
Iron concentrations in samples were above the chronic aquatic-life criterion (1,000 µg/L) in samples collected at both Peconic River sites (Connecticut Ave. and Peconic River streamgage; fig. 7C). Iron concentrations in 5 out of 10 samples collected at Connecticut Ave. were above the chronic aquatic-life criterion (median 1,177 µg/L; table 4), whereas 2 out of 10 samples were above the criterion for the further downstream site (Peconic River streamgage; median: 610.5 µg/L). In the Carmans River, iron concentrations were above the chronic aquatic-life criterion only at E. Bartlett Road, with 1 out of 20 samples above the chronic aquatic-life criterion for iron. Iron is abundant in Earth’s outer crust in igneous rocks and is an essential element in plant and animal metabolisms, but elevated levels can be toxic to aquatic organisms. Solubility in water is strongly influenced by the pH and the degree of oxidation in the system (Hem, 1985).
Copper concentrations in water samples were compared to New York State chronic and acute aquatic-life criteria for freshwater, which are hardness-dependent (eqs. 7 and 8; NYSDEC, 2023d). Copper was not detected in 53 percent of the water samples collected; however, five samples at different sites were measured at concentrations above the chronic criterion, and four of those samples were also above the acute criterion (fig. 7D). Copper is essential for plant and animal metabolism, but elevated concentrations can be harmful to aquatic organisms. Copper occurs naturally in Earth’s crust, and anthropogenically from water pipes and plumbing fixtures, pesticide sprays, or acid drainage from mines. Lower pH waters dissolve copper more easily, and toxicity is higher in waters with lower hardness (Hem, 1985; EPA, 1986).
Lead concentrations in water samples were compared with the New York State chronic aquatic-life criterion for freshwater, which is hardness-dependent (eq. 10; NYSDEC, 2023d). The two sites with detections above the aquatic-life criterion for lead were Peconic River at Connecticut Ave. and Carmans River at E. Bartlett Road. Out of the two sites in the Peconic River, lead at Peconic River at Connecticut Ave. was detected above the chronic criterion in 8 out of 10 samples with a median of 1.24 µg/L (table 4), whereas the downstream site (Peconic River streamgage) had a median of 0.287 µg/L and no detections above the chronic aquatic-life criterion (fig. 7E). At Carmans River at E. Bartlett Road, 5 out of 10 samples analyzed were above the chronic aquatic-life criterion (median 0.332 µg/L). Lead is neither essential nor beneficial to living organisms, and even low concentrations of lead are toxic. In freshwater, toxicity is higher in waters with lower hardness, and low pH and alkalinity may dissolve considerable amounts of lead in waters (Hem, 1985; EPA, 1986). Lead can be naturally sourced in water systems from weathering of sedimentary rocks. Current or historical anthropogenic sources can include lead pipes, leaded gasoline, or the burning of coal (Hem, 1985).
Silver was detected in only one sample throughout the study period, collected on June 3, 2019, at Carmans River streamgage, measuring 1.1 µg/L. The detection was above the New York State chronic aquatic-life criterion of 0.1 µg/L but below the EPA acute criterion of 3.2 µg/L.
Sites with the most detections of the aforementioned constituents above aquatic-life criteria were E. Bartlett Road in the Carmans River and Connecticut Ave. in the Peconic River, which are both the furthest upstream sites on each stream. Waters with low pH can dissolve metals such as aluminum, copper, iron, and lead more easily (Hem, 1985), and these two sites also had several measurements of pH less than 6.5 pH units, which is consistent with shallow groundwater in Long Island (fig. 7; Buxton and Shernoff, 1995; DeSimone and others, 2020; U.S. Geological Survey, 2023). Therefore, pH may be lower in the upstream locations than the downstream locations because of the proximity of upstream sites to groundwater discharge with relatively low pH, and the significant contributions of groundwater discharge relative to streamflow (Buxton and Shernoff, 1995; Fisher and Bayraktar, 2020). Furthermore, intermittent streams are vulnerable to anthropogenic inputs, especially during lower flows when the dilution capacity is limited (Gómez and others, 2017). The headwaters of the Carmans River at E. Bartlett Road may be vulnerable to anthropogenic inputs, which is supported by a relatively higher dominance of sodium and chloride, and some metals that were detected above aquatic-life criteria at the site. The pH of waters with low buffering capacity can change rapidly under different conditions, and the alkalinity (the capacity of resistance to acidification) measured in both streams for this study were all low, less than 31 mg/L as calcium carbonate.
The downstream sampling locations in the two streams typically had relatively higher pH and hardness, and fewer detections above the different aquatic-life criteria than the upstream sampling locations. Because metals are generally more soluble in low pH waters, and because the pH is typically higher in the downstream sites, the metals may be removed from solution by precipitation processes when the pH is near neutrality, lowering the concentration of the dissolved part of the constituent in water in the downstream areas (Hem, 1985). Additionally, because hardness was typically higher at the downstream sites, and because some aquatic life-criteria for metals are dependent on hardness, those aquatic-life criteria would also be higher for metals. Hardness concentrations at the furthest upstream sites are comparable to shallow groundwater in Long Island as reported in Buxton and Shernoff (1995). Another factor that could affect metal concentrations is that the sampling locations at the Connecticut Ave. and E. Bartlett Road sites were a few feet downstream from road-stream crossings, so these sites likely receive direct road runoff that may contribute to higher metal concentrations (Harned, 1988; Göbel and others, 2007). However, Upper Lake is similarly close to a road, and metal concentrations were not high at the site relative to other study sites. In summary, pH and concentrations of copper, aluminum, iron, lead, and silver may contribute to chronic or acute aquatic-life concerns, particularly at the upstream locations in the Carmans and Peconic Rivers.
Nitrogen and Phosphorus Concentrations and Daily Loads
Nutrients are essential for plant growth and survival and occur naturally in the environment. However, an overabundance of nutrients, typically sourced from human activities, can degrade water-quality conditions by increasing algae production, which can lead to hypoxic conditions in surface waters. In undeveloped areas, major sources of nutrients include atmospheric deposition, weathering of soils, and decomposition of plant material (Puckett, 1994; Weigelhofer and others, 2018). In urban or agricultural settings, agricultural or domestic fertilizer, manure, pesticides, wastewater effluent, deposition from burning fossil fuels, and industrial effluents can be major sources of nutrients (Flipse and others, 1984; Puckett, 1994; Dubrovsky and others, 2010; Weigelhofer and others, 2018). Nutrients can enter waterbodies through wastewater outfalls, overland flow, shallow groundwater inputs, or atmospheric deposition.
In Long Island, onsite wastewater disposal system effluent and fertilizers have been identified as a contributor of nitrogen to groundwater and streams (Katz and others, 1980; Porter, 1980; Ragone and others, 1980; Flipse and others, 1984; Eckhardt and others, 1989; Fisher and others, 2016; Fisher and others, 2021). The Carmans River watershed is predominantly developed and mostly unsewered, with residents relying on onsite wastewater disposal systems, whereas the areas near the stream upgradient from the Sunrise Highway site are mostly preserved and undeveloped (fig. 2; Dewitz and U.S. Geological Survey, 2021; Suffolk County GIS, 2023). In the Peconic River watershed south of the Peconic River, the town of Southampton is mostly undeveloped (predominantly core preservation area), and north of the stream, much of the Town of Riverhead is sewered. However, there are some unsewered areas along the stream and upgradient from Peconic River streamgage (fig. 2; Dewitz and U.S. Geological Survey, 2021; Suffolk County GIS, 2023). Fertilizers are used on large scales in agriculture or golf courses and fertilizers are commonly used commercially and domestically for lawns or gardens in the Central Pine Barrens region and in Long Island more broadly (Flipse and others, 1984; Fisher and others, 2021). Fertilizers may be a main source of nutrients in both watersheds, and wastewater from onsite wastewater disposal systems is likely to be more of a main source for the Carmans River than Peconic River because more of the surrounding area of the Carmans River is developed and unsewered than around the Peconic River (Ragone and others, 1980; Eckhardt and others, 1989; Flipse and others, 1984; Abbene, 2010). Inputs of onsite wastewater disposal system effluent are year round, but inputs of fertilizer runoff are likely seasonal because fertilizer is predominantly applied from early spring to late summer (Carpenter and others, 1998; NYSDEC, undated).
For the Carmans River streamgage, the median total nitrogen concentration for this study was 2.06 mg/L (table 4, fig. 8), which is about 1.6 times higher than the historical median concentration (1971–97) of 1.25 mg/L total nitrogen (241 samples; Monti and Scorca, 2003). In contrast, for Peconic River streamgage, the median total nitrogen concentration for this study is 0.58 mg/L, which is slightly lower than the historical median concentration (1971–97) of 0.70 mg/L total nitrogen (121 samples). Known differences in analytical methods over time may affect direct comparison of total nitrogen over time (Rus and others, 2013). Nonetheless, the historical total nitrogen medians provide context and a general comparison with the current medians. For total phosphorus at Carmans River streamgage, the recent and historical (1971–97, 214 samples) median total phosphorus concentrations were the same, 0.019 mg/L. For Peconic River streamgage, the recent median total phosphorus concentration of 0.063 mg/L was slightly lower than the historical median concentration (1971–97) of 0.078 mg/L total phosphorus (156 samples).
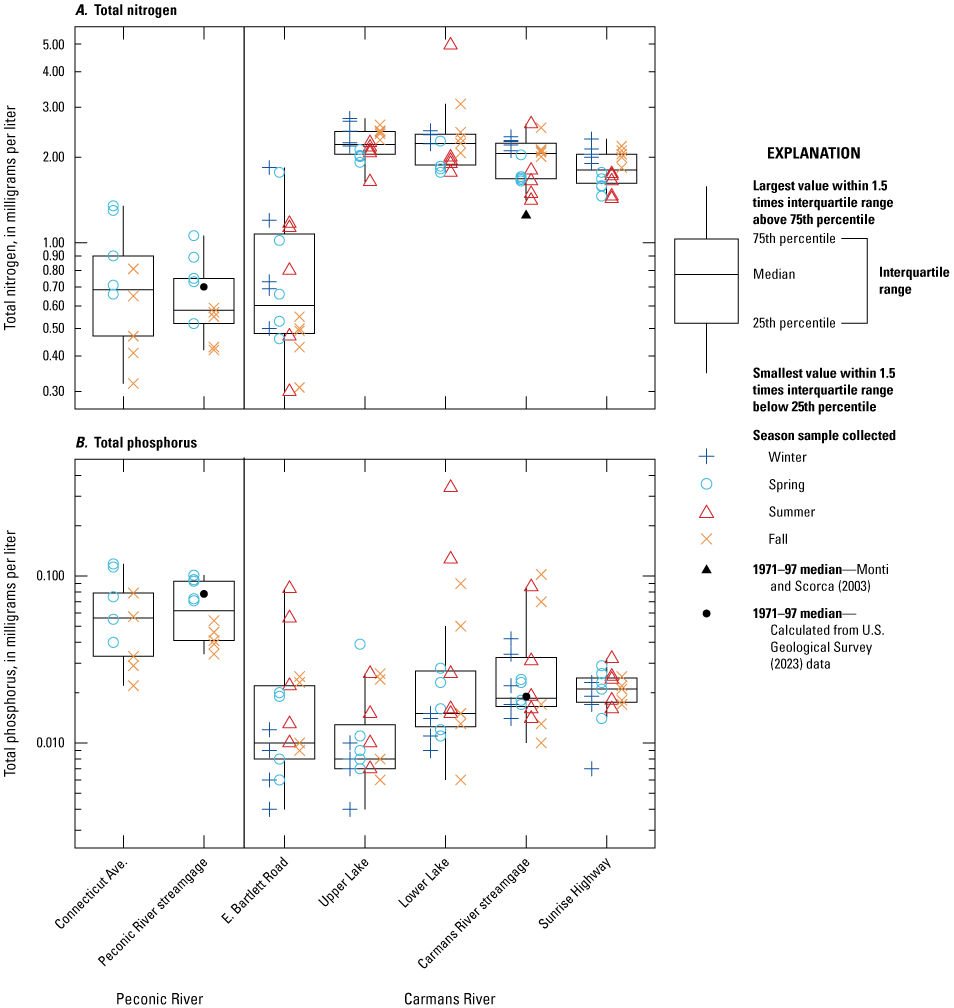
Boxplots showing concentrations of A, Total nitrogen, and B, Total phosphorus in water samples collected in the Carmans and Peconic Rivers in the Central Pine Barrens region, Suffolk County, New York, between 2017 and 2023 (U.S. Geological Survey, 2023). Site information is in table 1 and site locations are shown in figure 1. Total phosphorus was not detected in one E. Bartlett Road sample and is plotted at the detection limit of 0.004 mg/L.
The highest total nitrogen (4.96 mg/L) and total phosphorus (0.338 mg/L) concentrations were measured on September 21, 2018, in the Carmans River at Lower Lake. On this day, streamflow conditions were stable, but turbidity was 130 formazin nephelometric units (FNU), compared to turbidity levels less than 10 FNU during all other sampling events for this study. Lower Lake, which is immediately upstream from the sampling location, was being drained for dredging during sample collection, which likely released sediment and nutrients that increased the turbidity and the nitrogen and phosphorus concentrations (Lessels and Bishop, 2013). Carmans River streamgage, the next sampling location downstream from Carmans River at Lower Lake, was also sampled on the same day. Despite stable streamflow, turbidity was also higher than typical sampling conditions in this study, at 35 FNU, and the highest total nitrogen concentration for this site also occurred on this day, at 2.62 mg/L.
Total nitrogen concentrations were generally lower at the two Peconic River sites (Connecticut Ave. and Peconic River streamgage) than at the sampling sites in the Carmans River (with the exception of E. Bartlett Road; fig. 8). Median total nitrogen concentrations were 0.58 and 0.69 mg/L at the two sites in the Peconic River, and 0.61–2.24 mg/L at the five sites in the Carmans River. The greatest increase in total nitrogen concentrations was between E. Bartlett Road and Upper Lake, where the median increased by 264 percent (fig. 8A). The median total nitrogen concentration at the downstream Peconic River streamgage is 16 percent lower than the total nitrogen concentration at the upstream Connecticut Ave site on the Peconic River; this shows that median total nitrogen decreases in the downstream direction in the Peconic River in this study.
Total phosphorus concentrations were generally higher in the Peconic River than in the Carmans River (fig. 8). Median total phosphorus concentrations were 0.056 and 0.063 mg/L in the Peconic River, and 0.008–0.021 mg/L in the Carmans River. Moving from the upstream Connecticut Ave. site to the downstream Peconic River streamgage, the median total phosphorus concentrations increased by 13 percent in the Peconic River. Moving from the upstream E. Bartlett Road site to the downstream Sunrise Highway site, median concentrations increased by 110 percent in the Carmans River. These results show that in the Carmans and Peconic Rivers, median total phosphorus concentrations generally increase in the downstream direction. The trend of the median concentrations of total phosphorus and total nitrogen in the downstream direction are opposite; total phosphorus increases whereas total nitrogen decreases in both the Carmans and Peconic Rivers (with the exception of E. Bartlett Road).
For the Carmans River and Peconic River streamgages, load estimates for each day of sample collection were calculated and compared to help understand the seasonal differences of nutrient loads (eq. 2, fig. 9). On days of sample collection, the streamflow at Carmans River streamgage ranged from 12 to 32 cubic feet per second, the nitrogen load ranged from 62 to 174 kg, and the phosphorus load ranged from 0.6 to 4.8 kg. The streamflow at the Peconic River streamgage on days of sample collection ranged from 18 to 62 cubic feet per second, and the nitrogen load ranged from 22 to 115 kg, and the phosphorus load ranged from 1.8 to 12 kg. At the Peconic River streamgage, total nitrogen loads were typically lower and total phosphorus loads were typically higher than at the Carmans River streamgage, which is like the patterns of nutrient concentration in this study. For both streamgages, higher streamflow is typically associated with higher nutrient loads (fig. 9).
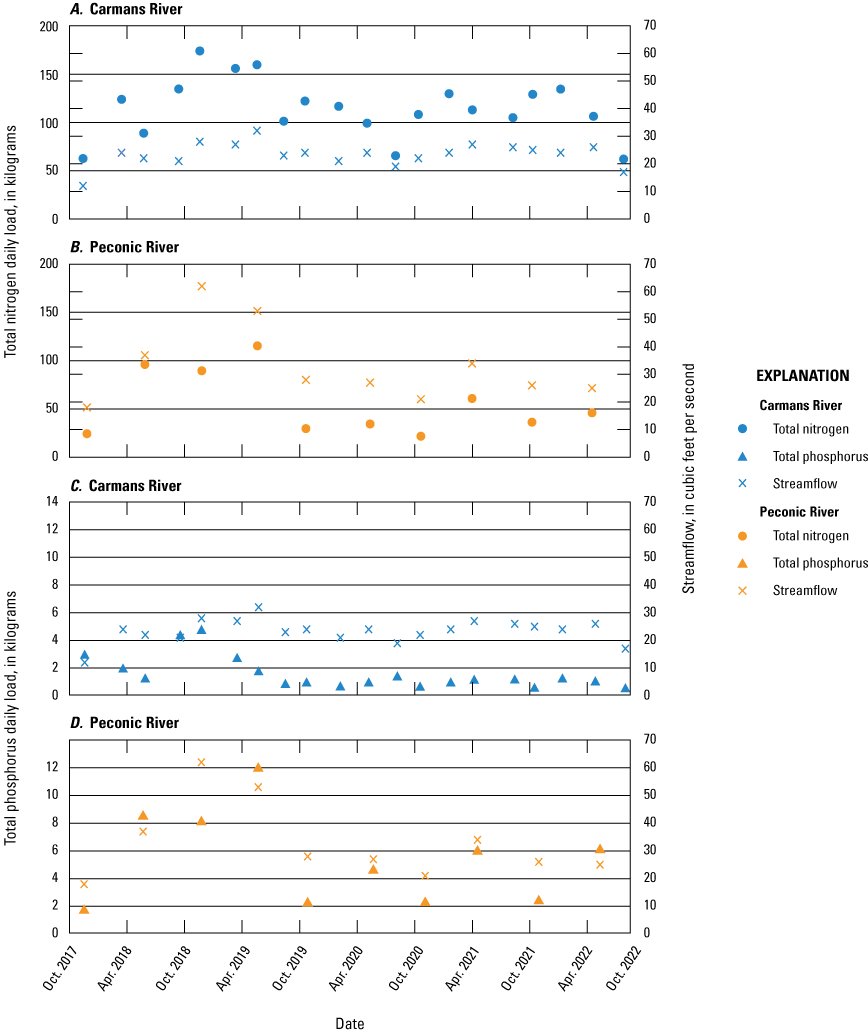
Graphs showing streamflow and estimated daily loads in kilograms for A, Total nitrogen in the Carmans River, B, Total nitrogen in the Peconic River, C, Total phosphorus in the Carmans River, and D, Total phosphorus in the Peconic River in the Central Pine Barrens region, Suffolk County, New York, between 2017 and 2022 (U.S. Geological Survey, 2023). Site information is in table 1.
The median daily loads were calculated by season for the Carmans River streamgage site and Peconic River streamgage site (U.S. Geological Survey, 2023). For Carmans River streamgage, the median daily loads of total nitrogen were highest in the winter and lowest in the spring and summer, whereas median daily loads of total phosphorus were slightly higher in the winter than the other seasons (fig. 9). For the Carmans River streamgage, the median total nitrogen daily load was about 1.2 times higher in the fall (122 kg) than spring (106 kg), whereas the median total phosphorus daily load was 1.2 times higher in the spring (1.2 kg) than fall (1.0 kg). Only spring and fall seasonal load data are available for the Peconic River. For Peconic River streamgage, the daily loads of total nitrogen and total phosphorus were higher in the spring than fall (fig. 9). The magnitude of load differences between spring and fall were higher at the Peconic River streamgage than at the Carmans River streamgage (fig. 9). For the Peconic River streamgage, the median total nitrogen daily load was about 2.0 times higher in the spring (61 kg) than in the fall (30 kg), and the median total phosphorus daily load was about 2.6 times higher in the spring (6.2 kg) than in the fall (2.4 kg).
There are several processes that can influence the patterns and controls of nitrogen and phosphorus in streams (Bernot and Dodds, 2005; Burgin and Hamilton, 2007; Weigelhofer and others, 2018; Maavara and others, 2020). Nitrate is highly soluble, easily leaches into groundwater, and is largely transported to rivers through subsurface flow (Weigelhofer and others, 2018). Nitrogen loads were higher at Carmans River streamgage than at Peconic River streamgage, which may be because of the higher development in the surrounding area of Carmans River streamgage and the predominant use of onsite wastewater disposal systems, which is likely a source of nitrogen leaching into the groundwater and then to the Carmans River (Monti and Scorca, 2003). Most nonpoint sources of nutrients are transported to streams during high flow events through soil erosion and surface runoff, especially so for phosphorus given that it easily adsorbs to soil particles (Weigelhofer and others, 2018), and soil erosion is prevalent during high flow events. However, the presented results are representative of nutrients during stable streamflow conditions. Nonetheless, similar to nitrogen, fertilizers and wastewater are sources of phosphorus in streams, and the dissolved form of phosphorus can be transported to streams by wastewater (Weigelhofer and others, 2018). Phosphorus loads were higher at the Peconic River streamgage than the Carmans River streamgage. The difference in phosphorus loads between the two rivers is consistent with the amount of agricultural land around the two rivers; the Peconic River watershed contains more agricultural land than the Carmans River watershed (Dewitz and U.S. Geological Survey, 2021), so the Peconic River may have more runoff inputs from applied fertilizers that commonly contains phosphorus than the Carmans River.
In Long Island, nitrogen concentrations were higher in the winter than summer for all 13 south-shore streams reported in Monti and Scorca (2003), which were in both sewered and unsewered areas and included the Carmans River. Median nitrogen concentrations from 2017 to 2023 in the Carmans River generally follow the same pattern (fig. 8) as in Monti and Scorca (2003). For the Carmans River streamgage, higher concentrations and loads of nutrients in the winter may be because of less biological uptake of nutrients while it is not the growing season, which was also reported in Monti and Scorca (2003). The Peconic River streamgage, however, had higher concentrations and loads of nutrients in the spring than fall, perhaps because of seasonal fertilizer use combined with higher spring streamflow, increasing nutrient transport. The Carmans River has a smaller magnitude of difference between its spring and fall nutrient loads than the Peconic River, perhaps because the Carmans River likely receives consistent and substantial year-round onsite wastewater disposal system effluent because the watershed is predominantly developed and unsewered (Monti and Scorca, 2003; Dewitz and U.S. Geological Survey, 2021; Suffolk County GIS, 2023). The seasonal patterns and differences of nutrients in the Carmans and Peconic Rivers may be related to these explanations. Additional research could help fully understand the patterns and controls of nutrients in these streams.
Pharmaceuticals and Domestic-Use Products
Annual water samples at both Peconic River sites (upstream site, Connecticut Ave.; downstream site, the Peconic River streamgage) and the Carmans River streamgage were analyzed for pharmaceuticals and domestic-use products. Nine pharmaceuticals and 2 domestic-use products out of 109 constituents analyzed were detected in 18 stream samples collected at the 3 sites (tables 5 and 6). Metformin, an antidiabetic medication, was the most frequently detected pharmaceutical, and it was detected in about 60 percent of the samples, including every sample at the downstream Peconic River site (Peconic River streamgage). Other frequently detected pharmaceuticals include meprobamate (27 percent of samples), lidocaine (20 percent), and carbamazepine (20 percent); all have been frequently detected in Long Island groundwater (Fisher and others, 2016). It should be noted, however, that concentrations in samples collected for this project were often at or below the method detection limit (tables 5 and 6). The pharmaceuticals acyclovir, fluconazole, ketoconazole, methocarbamol, and nevirapine, and the domestic-use products nicotine and cotinine (a nicotine degradation product) were also detected in one to two stream samples during this study (tables 5 and 6).
Table 5.
Concentrations of pharmaceuticals and domestic-use products detected in the Peconic River in the Central Pine Barrens region, Suffolk County, New York, between 2017 and 2021.[Data from U.S. Geological Survey (2023). Site information is in table 1. ND, not detected; DNQ, detected, but not quantified, and below the method detection limit; —, no data]
Table 6.
Concentrations of pharmaceuticals and domestic-use products detected in the Carmans River in the Central Pine Barrens region, Suffolk County, New York, between 2017 and 2021.[Data from U.S. Geological Survey (2023). Site information is in table 1. ND, not detected; DNQ, detected, but not quantified, and below the method detection limit; —, no data]
Although pharmaceutical and domestic-use product concentrations were low in the Pine Barrens streams, the presence of these analytes indicates that these streams are influenced by human activity. Detections were summed for pharmaceuticals and domestic-use products (herein referred to as pharmaceuticals) for analysis because summed concentrations may be easily compared between sites or between samples. This is a typical approach where the likely source of all analytes is from a single source, in this case wastewater (Fisher and others, 2016; Battaglin and others, 2018; Bradley and others, 2020). Overall, all but 2 of the 10 samples with quantifiable pharmaceutical concentrations were primarily composed of metformin (83 to 100 percent of the total pharmaceutical concentration). One sample collected at the upstream Peconic River site (Connecticut Ave.) in fall 2017 had a total concentration of 218 ng/L and was mostly composed of acyclovir, an antiviral (99 percent of the total pharmaceutical concentration; table 5 and fig. 10). Except for the aforementioned sample, summed pharmaceutical concentrations for quantifiable detections ranged from 7.14 ng/L to 17.8 ng/L. Acyclovir has been detected in groundwater samples collected near areas of wastewater effluent (Fisher and others, 2016). However, matrix enhancement, where the matrix (components of a sample) causes instruments to measure a higher concentration of an analyte than what exists in the sample, has been observed in fortified (spiked) surface water, effluent, and influent samples analyzed following the USGS pharmaceutical method (Furlong and others, 2014). Therefore, the detection in the upstream Peconic River sample may be an overestimate of the true concentration.
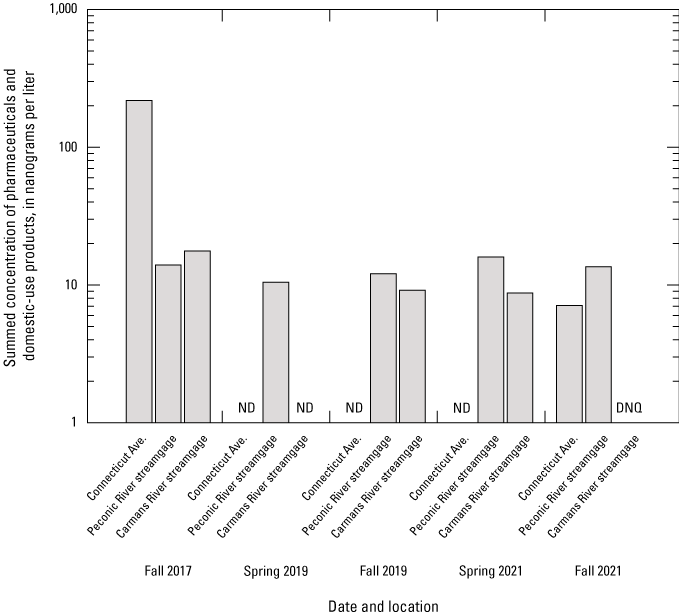
Bar chart showing summed concentrations of pharmaceuticals and domestic-use products in water samples collected in the Carmans and Peconic Rivers in the Central Pine Barrens region, Suffolk County, New York, between 2017 and 2021 (U.S. Geological Survey, 2023). Site information is in table 1. ND, not detected; DNQ, detected, but not quantified, and below the method detection limit.
The downstream Peconic River site (Peconic River streamgage) was the only sampling location that had a quantifiable concentration of a pharmaceutical for each sampling event, meaning at least one analyte was detected above the method detection limit in each sample. The consistent detection of pharmaceuticals at the downstream Peconic River site likely is a result of the upgradient land use. Most of the land area upgradient and north of the Peconic River streamgage site in the town of Riverhead is categorized as high intensity developed (Dewitz and U.S. Geological Survey, 2021). Although much of the town is sewered, the area immediately surrounding the stream near the sampling site is unsewered (Suffolk County GIS, 2023). Similarly, pharmaceuticals were detected frequently at the Carmans River streamgage site, which is mostly unsewered, is predominantly open space to low intensity developed, and is in an area where a majority of residents have onsite wastewater disposal systems (Town of Brookhaven, 2013).
Although groundwater is the principal source of streamflow in the Carmans and Peconic Rivers, there are fewer pharmaceutical analytes detected and lower total concentrations in the Central Pine Barrens stream samples than in the shallow groundwater in Long Island (Benotti and others, 2006; Fisher and others, 2016; U.S. Geological Survey, 2023). However, some detections and mixtures of pharmaceuticals and domestic-use products in Central Pine Barrens stream samples are similar to stream water-quality from national studies of urban sites across the United States (Kolpin and others, 2002; Bradley and others, 2020). Many studies focus on the presence of pharmaceuticals in streams downgradient from treated wastewater effluent discharge or highly urbanized areas (Kolpin and others, 2002). However, as found in these stream sites, several studies have documented pharmaceuticals and other wastewater-derived contaminants (including metformin, nicotine, carbamazepine, and lidocaine) in rural and urban streams where there were no permitted, treated wastewater effluent discharges (Phillips and Chalmers, 2009; Bradley and others, 2020; Kondor and others, 2022; Opsahl and Musgrove, 2023). Therefore, pharmaceuticals that are typically found in wastewater effluent can be found in a stream even when there is no direct wastewater effluent discharge to that stream. In some studies of pharmaceuticals in surface water, the potential risk of unintended exposure affecting human and aquatic health was a concern (Pronschinske and others, 2022; Bradley and others, 2020), but total concentrations for pharmaceuticals in the Pine Barrens streams (<300 ng/L) were relatively lower in comparison to other urban stream study results.
Pesticides
Fifteen pesticides out of 224 analyzed pesticides and degradation products were detected at least once in the Carmans and Peconic Rivers. Detections for individual quantifiable pesticides or pesticide degradation products ranged from 1.59 to 108 ng/L (tables 7 and 8). These detections included three fungicides, three insecticides, and nine herbicides (including degradation products of each pesticide class). Pesticides were rarely detected in samples collected from the upstream Peconic River site (Connecticut Ave.), whereas pesticides were detected in every sample collected at the downstream Peconic River (Peconic River streamgage) and Carmans River sites (Carmans River streamgage). The land use within the watershed contributing to the downstream Peconic River and Carmans River streamgage sites includes areas of open space development (<20 percent impervious surfaces) to high density development (>80 percent impervious surfaces; Dewitz and U.S. Geological Survey, 2021). The downstream Peconic River streamgage site has a higher percentage of agricultural land in the surrounding watershed, and herbicides were detected more frequently than at the upstream Peconic River site and the Carmans River streamgage site (Dewitz and U.S. Geological Survey, 2021).
Table 7.
Pesticide detections in the Peconic River in the Central Pine Barrens region, Suffolk County, New York between 2017 and 2021.[Data from U.S. Geological Survey (2023). Site information is in table 1. ND, not detected; DNQ, detected, but not quantified, and below the method detection limit; ESA, ethanesulfonic acid]
Table 8.
Pesticide detections in the Carmans River in the Central Pine Barrens region, Suffolk County, New York between 2017 and 2021.[Data from U.S. Geological Survey (2023). Site information is in table 1. ND, not detected; DNQ, detected, but not quantified, and below the method detection limit; ESA, ethanesulfonic acid]
Herbicides and their degradation products were the most frequently detected pesticide class (73 percent of samples had at least one herbicide analyte detected). Even though herbicides were the most frequently detected pesticide class in these streams, no single herbicide analyte was detected at all sampling locations. Most of the herbicides detected are associated with weed control in corn and potato agriculture (acetanilides and triazines), which are common crops in Long Island. Triazines and their degradation products were only detected in Peconic River samples, (tables 7 and 8) and acetanilide and their degradation products were detected in the downstream Peconic River and Carmans River streamgage sites. A metolachlor degradation product, metolachlor ethanesulfonic acid (ESA), was detected at the downstream Peconic River site at 63.4 ng/L, the highest detected concentration of an herbicide in this study. Metolachlor ESA concentrations were commonly one to two orders of magnitude higher in other water-quality studies in largely agricultural areas (Fisher and others, 2021; Thompson and others, 2021).
The herbicides atrazine, metolachlor, and prometon were detected in water samples collected in 1997 at the Peconic River and Carmans River streamgages at similar concentrations as this study (Phillips and others, 1998). Other herbicides detected in the 1997 stream samples include simazine and one triazine degradation product, deethylatrazine. Metolachlor and alachlor (acetanilides) have not been used in Long Island corn agriculture since 1999 and are no longer registered for use in Long Island (NYSDEC, 2014, 2023b). Although those acetanilides are no longer in use today, metolachlor ESA (a metolachlor degradation product) and alachlor oxanilic acid (an alachlor degradation product) were detected in Central Pine Barrens samples, and at higher concentrations than the parent (legacy) compounds (tables 7 and 8). Metolachlor was still in use during the 1997 study, and the 1997 concentrations were less than the concentrations in some water samples from this study (1997 study: 4 ng/L at Carmans River streamgage site, 5 ng/L at downstream Peconic River site). Atrazine has the opposite pattern; most atrazine concentrations in the current study are less than the atrazine concentrations in 1997 (1997 study: 3 ng/L at Carmans River streamgage, 5 ng/L at the Peconic River streamgage; Phillips and others, 1998). However, the differences between the concentrations of metolachlor and atrazine in the 1997 study and in this study are minimal; most differences are less than 10 ng/L. Atrazine is still registered for use in Long Island for sweet corn and other field crops; however, local pesticide management efforts have focused on reducing the use of the herbicide (NYSDEC, 2014) and may have resulted in lower concentrations (Fisher and others, 2021). Prometon is a broad-leaved weed herbicide associated with suburban and urban weed control that is still in use today (Capel and others, 1999; Ryberg and others, 2014; Pesticide Properties Database, 2019; Fisher and others, 2021; Nowell and others, 2021). Prometon was detected in both streams in 1997 (Carmans River streamgage: 4 ng/L; Peconic River streamgage: 14 ng/L), though in the current study it was detected at lower concentrations (≤3 ng/L) than in 1997 and only at the Peconic River streamgage. The detection of prometon at the downstream Peconic River streamgage may represent influence from the nearby suburban mixed residential and commercial land use. Even though there were generally fewer detections and lower concentrations of herbicides and their degradation products in this study than in 1997, these detections indicate the persistence of the herbicides within the watersheds.
Fungicides were commonly detected in Central Pine Barrens stream samples; 60 percent of all samples had at least one fungicide detected. The highest concentration of a pesticide measured in this study was 4-hydroxychlorothalonil (108 ng/L), a degradation product of the fungicide chlorothalonil. 4-hydroxychlorothalonil was detected at least once at each of the three stream sampling locations. Chlorothalonil is a pesticide that is used as a fungicide and bactericide on several agricultural crops, including ornamental plants, sod, and turf. 4-hydroxychlorothalonil was detected in shallow Long Island groundwater at high concentrations (368,000 ng/L) in monitoring wells located near a golf course (Fisher and others, 2021) and downgradient from golf courses in urban areas as reported in a USGS Regional Stream Quality Assessment study (Nowell and others, 2021). Metalaxyl, a fungicide commonly used on a variety of agricultural crops and for seed treatment, was also detected at each of the sampling locations and in every sample collected at the Carmans River streamgage site. Quantifiable concentrations for metalaxyl ranged from 3.13 to 16.1 ng/L, which are less than measured concentrations in groundwater samples from the agricultural land use areas in the Fisher and others (2021) study. 1H-1,2,4-Triazole is a degradation product of the fungicide conazole. 1H-1,2,4-Triazole was detected once at the Carmans River streamgage site, and its detection may be attributed to a variety of pesticide applications such as residential or other nonagricultural applications (PubChem, 2020). Multiple fungicides have been documented in other studies in areas of intensive pesticide use, including urban streams. Nowell and others (2021) reported a strong relation between total fungicide concentrations and urban recreational areas (for example, golf courses, cemeteries, and parks) and residential land use. Pesticides including fungicides used in building materials to increase protection from bacterial or fungi growth may enter the aquatic environment either through direct runoff from precipitation or from leaching into groundwater (Burkhardt and others, 2012). Fungicides, among other pesticides, can be toxic to a wide range of aquatic organisms (Zubrod and others, 2019; Stackpoole and others, 2021).
Though only 3 insecticides were detected, 60 percent of stream samples had detections of at least one of those 3 insecticides (tables 7 and 8, fig. 11). Insecticides were not detected at the upstream Peconic River site but were detected at the downstream Peconic River streamgage and Carmans River streamgage. One of these insecticides, imidacloprid, was detected once below the method detection limit (tables 7 and 8, fig. 11) in a sample collected at Carmans River streamgage. Two analytes that were detected are degradation products of the insecticide aldicarb: aldicarb sulfoxide and aldicarb sulfone. Aldicarb was last used on Long Island potato fields in 1979 and was not detected in any samples during this study. Aldicarb sulfoxide was the most frequently detected pesticide analyte (60 percent of samples; range: 2.33 to 15.4 ng/L) for this study and was detected in every downstream Peconic River site sample and in all Carmans River streamgage samples but the fall 2021 sample.
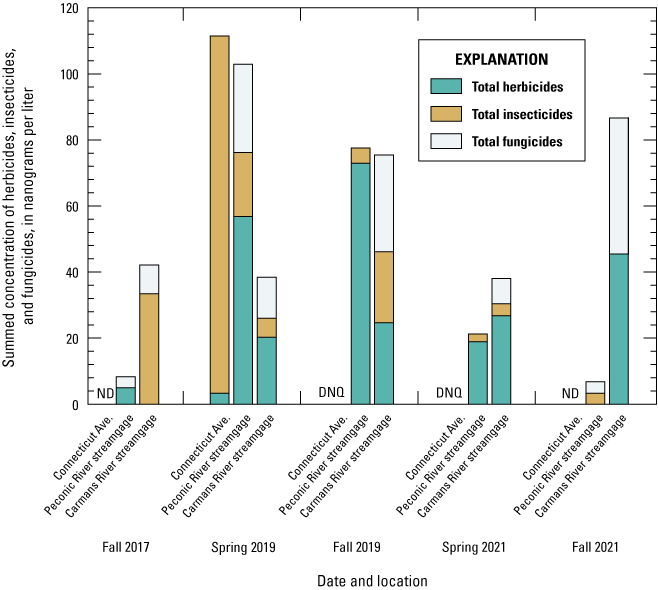
Bar chart showing summed concentrations of pesticides (herbicides, insecticides, and fungicides) in water samples collected in the Carmans and Peconic River in the Central Pine Barrens region, Suffolk County, New York, between 2017 and 2021 (U.S. Geological Survey, 2023). Site information is in table 1. ND, not detection; DNQ, detected, but not quantified, and below the method detection limit.
Although pesticides were detected at least once at each sample location, total pesticide concentrations were low (ranging from not detected to 111 ng/L, fig. 11) in comparison to a recent regional shallow Long Island groundwater study that analyzed for the same pesticides (pesticide concentrations ranging from 3 to 368,000 ng/L; Fisher and others, 2021). Nonetheless, the variety of pesticide detections within the Pine Barrens streams provides evidence of a mixture of land use settings, primarily mixed suburban/urban residential-commercial and agricultural. Several pesticide degradation products were detected in stream samples, including past-use degradation products (and at concentrations higher than active [parent] ingredients). These detections of pesticide degradation products demonstrate the importance of monitoring water quality for pesticide degradation products in addition to their parent pesticides. Of the 15 pesticide analytes detected, 9 were degradation products, and 4 of those (aldicarb sulfone, aldicarb sulfoxide, alachlor oxanilic acid, and metolachlor ESA) are degraded from active (parent) pesticides (aldicarb, alachlor, and metolachlor) that are no longer registered for use in Long Island. Given that 70 percent of the watershed has a groundwater travel time to these two streams of up to 50 years (Misut and others, 2021), these historically used pesticides (aldicarb, metolachlor and alachlor) and their associated degradation products could be present in the Pine Barrens streams for several more years.
Industrial Contributions
The industrial byproduct methyl-1H-benzotriazole (also referred to as tolyl triazole) was detected in all but one of the Peconic River samples (Connecticut Ave.) and in none of the Carmans River streamgage samples (U.S. Geological Survey, 2023). Quantifiable concentrations of methyl-1H-benzotriazole ranged from 31.6 to 759 ng/L, where the highest concentration was at the upstream Peconic River site and the lowest was at the downstream Peconic River streamgage. The presence of methyl-1H-benzotrizole in the Peconic River samples may indicate the influence of urban runoff. There are several sources of methyl-1H-benzotrizole, and its detection in the Peconic River samples could be related to historical or current land use. The range in concentrations measured in this study is similar to concentrations from a Canadian study that found major contributions of benzotrizoles in urban and agricultural streams may be from vehicle emissions (Parajulee and others, 2017). In this study, Peconic River samples were collected near roads and the methyl-1H-benzotrizole detections could also be related to road runoff (Wu and others, 2021). Detections of methyl-1H-benzotrizole suggest that the Carmans and Peconic Rivers may have contributions from industrial sources and road runoff.
Relation of Total Nitrogen to Pharmaceuticals and Pesticides
Total nitrogen concentrations were compared with total pesticide and total pharmaceutical concentrations to determine if there was a relation between these contaminants within the Carmans and Peconic Rivers (fig. 12). There was little variation in total pharmaceutical concentrations among sampling locations in the Central Pine Barrens streams (tables 5 and 6, fig. 12). Overall, total pesticide concentrations were higher than total pharmaceutical concentrations in the Carmans and Peconic Rivers (tables 5, 6, 7, and 8). Excessive amounts of nitrogen can be introduced into the environment through wastewater and fertilizer applications, which can also be sources for pharmaceuticals and pesticides (Zhao and others, 2011; Fisher and others, 2021). There are multiple sources of nitrogen contamination in Long Island which can make correlations between observed concentrations complex and variable, depending on land use. Because there were only five samples per stream that were analyzed for pharmaceuticals and pesticides, all results were analyzed together and discussed as a regional observation.
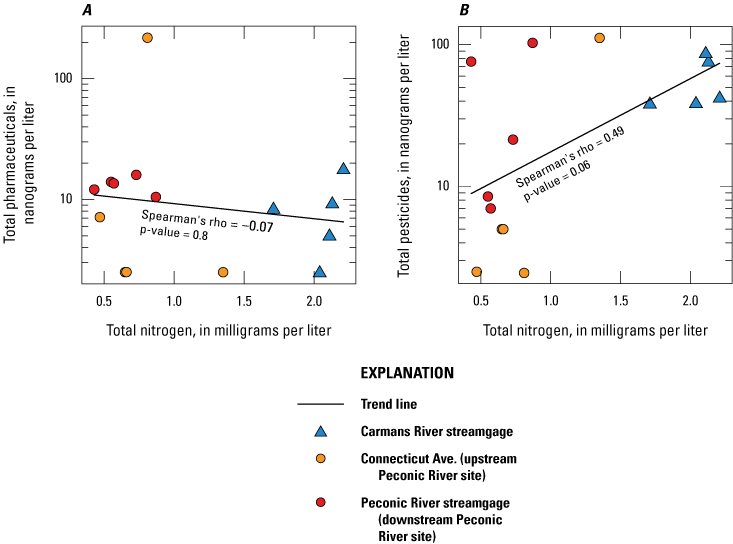
Graphs showing total nitrogen concentrations compared with A, Total pharmaceutical concentrations and B, Total pesticide concentrations in water samples collected in the Carmans and Peconic Rivers in the Central Pine Barrens region, Suffolk County, New York, between 2017 and 2021 (U.S. Geological Survey, 2023). Site information is in table 1.
Fisher and others (2021) documented a correlation between total pesticide concentrations and total nitrogen concentrations in agricultural areas in Long Island and found weaker correlations between total pesticide and total nitrogen concentrations in nonagricultural areas. In this study, the overall relation between total pharmaceutical concentrations and total nitrogen was weak and not statistically significant (Spearman’s rho=−0.07, p=0.8). There was a stronger correlation between total pesticide concentrations and total nitrogen concentrations, but this relation was also not statistically significant (Spearman’s rho=0.49, p=0.06). Therefore, there was no strong correlation between total pesticide or total pharmaceutical concentrations and total nitrogen concentrations in this study. The lack of a strong correlation between the contaminant classes for this study may be the result of too few observations or the complex mixture of land use and contaminants that contribute to the conditions observed at each sample site. Nonetheless, these results represent an initial assessment of the status of these organic contaminant classes in the Central Pine Barrens streams.
These study results could help stakeholders evaluate or develop programs designed to mitigate ecological and hydrological impairments in the Central Pine Barrens region. Continued monitoring may help water-resource managers assess land management or preservation efforts and make scientifically based decisions for future development or preservation in the Central Pine Barrens as the landscape and land uses continue to change.
Summary
The U.S. Geological Survey, in cooperation with the Central Pine Barrens Joint Planning & Policy Commission and the Town of Brookhaven, monitored groundwater levels and stream water quality in the Central Pine Barrens region of Suffolk County in Long Island, New York between 2017 to and 2023. The results show a current-day characterization of water resources in the Central Pine Barrens region.
The Central Pine Barrens region in central and eastern Suffolk County, New York, contains most of the undeveloped and protected land in Long Island and overlays a part of the aquifer that provides potable water for residents of Suffolk County. Development and population growth accelerated in the 1970s in Long Island, increasing the drinking water-supply demand and anthropogenic influence on water resources. Long Island is densely developed and populated, and much of Suffolk County is unsewered; Suffolk County residents rely on onsite wastewater disposal systems such as septic systems or cesspools. Development is expected to continue to increase across Long Island. Two out of four of Long Island's largest streams are within the Central Pine Barrens region: the Carmans River that flows into the Great South Bay, and the Peconic River that flows into Great Peconic Bay. The Carmans and Peconic Rivers are predominantly groundwater-fed, with shallow groundwater providing baseflow to the streams. These streams and the waterbodies they flow into are frequently used for recreation such as fishing, shellfishing, or boating, and are important resources to the local community.
Discrete groundwater-level data were collected and reported between 2017 and 2022 at five wells, and continuous groundwater-level data (15-minute intervals) were collected at one well. Groundwater-level monitoring provides information on short- or long-term changes in groundwater levels whether due to recharge, drought, or from human activity such as well pumping. The six wells studied for groundwater levels provide spatial groundwater level data for the Central Pine Barrens region. The six wells showed similar patterns. The well near the Carmans River, S 9129. 1, had the lowest range of water levels, likely because it is near a groundwater discharge zone. The 15-minute interval data at well S 6413. 2 best showed the short-term variations of groundwater level in the region.
Stream water-quality data were collected and reported between 2017 and 2023. Discrete water-quality samples were collected at five locations in the Carmans River seasonally (four times per year) and at two locations in the Peconic River in the fall and spring throughout the study period. The discrete samples were analyzed for major ions, trace elements, and nutrients. Annually, water samples at both Peconic River sites (Connecticut Ave. and Peconic River streamgage) and one Carmans River site (Carmans River streamgage) were also analyzed for pharmaceuticals, domestic-use products, pesticides, and one industrial byproduct. The water-quality dataset was assessed to provide a current characterization of conditions throughout the Central Pine Barrens region and an understanding of the anthropogenic influences on the water resources within it.
The concentrations of nutrients, metals, pharmaceuticals, pesticides, and other water-quality parameters of the Carmans and Peconic Rivers are likely influenced by several factors. These factors include natural inputs such as from the weathering of rocks and soils or atmospheric deposition, and human inputs such as wastewater effluent, use of fertilizers or pesticides, road runoff, and urban or industrial sources. This study documents the presence of several pharmaceuticals and pesticides in the Central Pine Barrens region that are a result of current and historical land use.
The composition of major ions in the Carmans and Peconic Rivers were comparable across all sites, and the dominant dissolved ions were sodium and chloride. Sodium and chloride were more dominant in the Carmans River moving downstream from Upper Lake to Sunrise Highway, and in the Peconic River moving downstream from Connecticut Ave. to the Peconic River streamgage. The increasing prevalence of sodium and chloride ions while moving in the downstream direction may be from additional anthropogenic inputs entering the streams, such as wastewater or road salt.
In comparison to the downstream sites, there was more variation of trace element concentrations at the furthest upstream sites of the Carmans and Peconic Rivers. The water chemistry variation at the furthest upstream sites may be related to road runoff or that those sites are near the stream headwaters, where groundwater flow paths can be variable. Depending on the start of flow location of the headwaters, groundwater flow paths through variable rocks or sediments or with different overlying land uses can produce different chemistries of the groundwater discharged to the stream. The streams have little capacity to dilute inputs in the headwaters because of low flow; as a result, the water chemistry may be more variable in that section of the streams. The variable flow paths that contribute different inputs and the low dilution capacity of the headwater areas may influence the variable water chemistry, particularly at the furthest upstream Carmans River site.
Trace element concentrations of water samples were compared to U.S. Environmental Protection Agency and New York State Department of Environmental Conservation chronic and acute aquatic-life criteria thresholds. Constituents with detections above chronic criteria (or below for pH) in at least two samples include aluminum, copper, iron, lead, and pH. Some criteria for metals are dependent on hardness; with higher hardness, the aquatic-life criteria would also be higher. Copper was the only constituent with a detection above an acute criterion. The E. Bartlett Road and Connecticut Ave. sites, the furthest upstream sampling locations at each stream, had the most detections above aquatic-life criteria out of the seven stream sites sampled in this study. In comparison to these two sites, the further downstream sampling locations had far fewer detections above the aquatic-life criteria, and higher pH levels and hardness. pH is lower near the headwaters because a greater proportion of the total flow is from groundwater-discharge of low-pH waters. Because metals are generally more soluble in low pH waters and the pH is typically higher in the downstream sites, the metals may be removed from solution by precipitation processes when the pH is near neutrality, lowering the concentration of the dissolved portion of the constituent in water. Furthermore, intermittent streams are vulnerable to anthropogenic inputs, especially during lower flows when the dilution capacity is limited. All of these factors may explain why the headwaters of the Carmans River at E. Bartlett Road have a relatively higher dominance of sodium and chloride than other sites, and that there are some metals detected at levels above aquatic-life criteria. Given the data available, aluminum, copper, iron, lead, and pH may cause chronic or acute aquatic-life concerns, particularly at the upstream locations in the Carmans and Peconic Rivers.
Patterns of total phosphorus and total nitrogen concentrations and loads varied between the Carmans and Peconic River. Total nitrogen concentrations were lowest at the two Peconic River sites (Connecticut Ave. and Peconic River streamgage) and at E. Bartlett Road site in the Carmans River. Total nitrogen concentrations were similar at the other four furthest downstream sites in the Carmans River (Upper Lake, Lower Lake, Carmans River streamgage, and Sunrise Highway). Median concentrations of total nitrogen in the Carmans River were about 1.6 times higher in this study period than between 1971 and 1997. The two Peconic River sites had median concentrations of 0.58 to 0.69 mg/L total nitrogen and 0.056–0.063 mg/L total phosphorus. The Carmans River sites had median concentrations of 0.61–2.24 mg/L total nitrogen and 0.008–0.021 mg/L total phosphorus. Higher nitrogen concentrations and loads in the Carmans River than the Peconic River may be from relatively higher onsite wastewater disposal system effluent, given that the Carmans River watershed is more developed than the Peconic River watershed and also largely unsewered. For the Carmans River streamgage, higher concentrations and loads of nutrients in the winter may be due to less biological uptake of nutrients in this period. For the Peconic River streamgage, higher phosphorus concentrations and loads in the Peconic River than in the Carmans River may be due to more agricultural land in the Peconic watershed than in the Carmans River watershed. More agricultural land indicates that there is a higher potential for fertilizer runoff that contains phosphorus. Also, for the Peconic River streamgage, higher concentrations and loads of nutrients in the spring than fall may be due to seasonal fertilizer use and higher streamflow in the spring that increases the nutrient load in the river. The seasonal patterns and differences in nutrient levels in the Carmans and Peconic Rivers may be related to these factors, but more research could help fully understand the patterns and controls of nutrients in these streams.
Nine pharmaceuticals and two domestic-use products were detected in the Carmans and Peconic Rivers. Total concentrations of the pharmaceuticals and domestic-use products were generally low and ranged from not detected to 218 ng/L. Pharmaceuticals were detected most frequently at the downstream Peconic River streamgage and Carmans River streamgage sites, and infrequently at the upstream Peconic River site at Connecticut Ave. The land use upgradient from the upstream Peconic River site is minimally developed, whereas the land upgradient of the downstream Peconic River site is more heavily developed. The differences in development may explain why the Peconic River had more pharmaceutical detections at its downstream site. Metformin, an antidiabetic medication, was the most frequently detected pharmaceutical and was detected in every sample collected at the downstream Peconic River streamgage during the study and most samples collected at Carmans River streamgage. The presence of pharmaceuticals are indicative of wastewater inputs to the streams.
Fifteen pesticides were detected in the Carmans and Peconic Rivers, which includes nine herbicides, three insecticides, and three fungicides. Nine of the pesticides were degradation products of pesticides used in the past but are not used today in Long Island and were at concentrations higher than the concentrations of the parent products. This study finding emphasizes the importance of monitoring water quality for pesticide degradation products in addition to their parent pesticides. Some uses of the pesticides detected during this study include those used in urban and suburban applications, such as for weed control, prevention of fungal and bacterial diseases in crops, and seed treatment for crops. Concentrations were generally low, ranging from not detected to 108 ng/L. The detection of various pesticides indicates influence from a mixture of land use settings, primarily mixed residential-commercial and agricultural, on stream water quality in the Central Pine Barrens region.
Although much of the land in the Central Pine Barrens region is preserved and undeveloped relative to other areas in Long Island, there were detections of organic constituents that indicate human activity. Consistent detections of methyl-1H-benzotrizole in the Peconic River suggests contributions from industrial sources and road runoff.
Total nitrogen concentrations were compared to total pesticide and total pharmaceutical concentrations to determine if there was a relation between these contaminants within the Carmans River and within the Peconic River. Excessive amounts of nitrogen in the environment can be from fertilizer applications and wastewater effluent, which can also be sources for pharmaceuticals and pesticides. There is no strong correlation between total pesticide or total pharmaceutical concentrations and total nitrogen concentrations in this study, which may be the result of too few observations or the complex mixture of land use and contaminants that contribute to the conditions observed at each sample site. Nonetheless, these results represent an initial assessment of the status of these organic contaminant classes in the Central Pine Barrens streams.
These study results can help stakeholders evaluate or develop programs designed to mitigate ecological and hydrological impairments in the Central Pine Barrens region. Continued monitoring may help water-resource managers assess land management or preservation efforts and make scientifically based decisions for future development or preservation in the Central Pine Barrens as the landscape and land uses continue to change.
Acknowledgments
The authors would like to recognize the dedicated U.S. Geological Survey staff who collected the groundwater-level and water-quality data used in this report, including but not limited to Kaitlyn Cunningham, Emily Krsnak, Natalie Cheung, Dave Fulcher, Marie Zuck, and Brendan McCarthy.
References Cited
Abatzoglou, J.T., 2011, Development of gridded surface meteorological data for ecological applications and modelling: International Journal of Climatology, v. 33, no. 1, p. 121–131, accessed October 15, 2024, at https://doi.org/10.1002/joc.3413.
Abbene, I.J., 2010, Shallow groundwater quality in the Village of Patchogue, Suffolk County, New York: U.S. Geological Survey Scientific Investigations Report 2010–5132, 19 p. [Also available at https://doi.org/10.3133/sir20105132.]
Ayotte, J.D., Szabo, Z., Focazio, M.J., and Eberts, S.M., 2011, Effects of human-induced alteration of groundwater flow on concentrations of naturally-occurring trace elements at water-supply wells: Applied Geochemistry, v. 26, no. 5, p. 747–762, accessed October 15, 2024, at https://doi.org/10.1016/j.apgeochem.2011.01.033.
Battaglin, W.A., Bradley, P.M., Iwanowicz, L., Journey, C.A., Walsh, H.L., Blazer, V.S., 2018, Pharmaceuticals, hormones, pesticides, and other bioactive contaminants in water, sediment, and tissue from Rocky Mountain National Park, 2012–2013: Science of The Total Environment, v. 643, p. 651–673, accessed February 12, 2025, at https://doi.org/10.1016/j.scitotenv.2018.06.150.
Bayraktar, B.N., Fisher, I.J., and Simonson, A.E., 2020, 2019 Hydrologic data summary for the Central Pine Barrens region, Suffolk County, New York (ver. 2.0, February 2024): U.S. Geological Survey data release, accessed October 15, 2024, at https://doi.org/10.5066/P9KODN4C.
Bayraktar, B.N., Fisher, I.J., and Simonson, A.E., 2021, 2020 Hydrologic data summary for the Central Pine Barrens Region, Suffolk County, New York (ver. 2.0, February 2024): U.S. Geological Survey data release, accessed October 15, 2024, at https://doi.org/10.5066/P9SLP8FX.
Benotti, M.J., Fisher, S.C., and Terracciano, S.A., 2006, Occurrence of pharmaceuticals in shallow ground water of Suffolk County, New York, 2002–2005: U.S. Geological Survey Open-File Report 2006–1297, 5 p., accessed October 15, 2024, at https://doi.org/10.3133/ofr20061297.
Bernot, M.J., and Dodds, W.K., 2005, Nitrogen retention, removal, and saturation in lotic ecosystems: Ecosystems, v. 8, no. 4, p. 442–453, accessed October 15, 2024, at https://doi.org/10.1007/s10021-003-0143-y.
Bradley, P.M., Journey, C.A., Button, D.T., Carlisle, D.M., Huffman, B.J., Qi, S.L., Romanok, K.M., and Van Metre, P.C., 2020, Multi-region assessment of pharmaceutical exposures and predicted effects in USA wadeable urban-gradient streams: PLoS One, v. 15, no. 1, 25 p., article e0228214, accessed October 15, 2024, at https://doi.org/10.1371/journal.pone.0228214.
Burgin, A.J., and Hamilton, S.K., 2007, Have we overemphasized the role of denitrification in aquatic ecosystems? A review of nitrate removal pathways: Frontiers in Ecology and the Environment, v. 5, no. 2, p. 89–96, accessed October 15, 2024, at https://doi.org/10.1890/1540-9295(2007)5[89:HWOTRO]2.0.CO;2.
Burkhardt, M., Zuleeg, S., Vonbank, R., Bester, K., Carmeliet, J., Boller, M., and Wangler, T., 2012, Leaching of biocides from façades under natural weather conditions: Environmental Science & Technology, v. 46, no. 10, p. 5497–5503, accessed October 15, 2024, at https://doi.org/10.1021/es2040009.
Busciolano, R., 2005, Statistical analysis of long-term hydrologic records for selection of drought-monitoring sites on Long Island, New York: U.S. Geological Survey Scientific Investigations Report 2004–5152, 46 p. [Also available at https://doi.org/10.3133/sir20045152.]
Buxton, H.T., and Shernoff, P.K., 1995, Ground-water resources of Kings and Queens Counties, Long Island, New York: U.S. Geological Survey Open-File Report 92–76, 111 p., 8 pls. [Also available at https://doi.org/10.3133/ofr9276.]
Capel, P.D., Spexet, AM.H., and Larson, S.J., 1999, Occurrence and behavior of the herbicide prometon in the hydrologic system: Environmental Science & Technology, v. 33, no. 5, p. 674–680, accessed October 15, 2024, at https://doi.org/10.1021/es9807340.
Carlson, D.M., Daniels, R.A., and Wright, J.J., 2016, Atlas of inland fishes of New York (New York State Museum Record 7): New York State Education Department and New York State Department of Environmental Conservation, 362 p., accessed July 11, 2023, at https://www.nysm.nysed.gov/sites/default/files/atlasofinlandfishes.pdf.
Carpenter, S.R., Caraco, N.F., Correll, D.L., Howarth, R.W., Sharpley, A.N., and Smith, V.H., 1998, Nonpoint pollution of surface waters with phosphorous and nitrogen: Ecological Applications, v. 8, no. 3, p. 559–568, accessed October 15, 2024, at https://doi.org/10.1890/1051-0761(1998)008[0559:NPOSWW]2.0.CO;2.
Central Pine Barrens Joint Planning & Policy Commission staff, 2022, Long Island, New York central pine barrens: Central Pine Barrens Joint Planning & Policy Commission map, 1 sheet, accessed November 21, 2024, at https://pb.state.ny.us/assets/1/6/MainFCKEditorDimension/Northeast_core_cga_map_11.jpg.
Como, M.D., Finkelstein, J.S., Rivera, S.L., Monti, J., Jr., and Busciolano, R., 2018, Water-table and potentiometric-surface altitudes in the upper glacial, Magothy, and Lloyd aquifers of Long Island, New York, April–May 2016: U.S. Geological Survey Scientific Investigations Map 3398, 4 sheets, scale 1:125,000, 5-p. pamphlet, accessed October 15, 2024, at https://doi.org/10.3133/sim3398.
Corsi, S.R., Graczyk, D.J., Geis, S.W., Booth, N.L., and Richards, K.D., 2010, A fresh look at road salt—Aquatic toxicity and water-quality impacts on local, regional, and national scales: Environmental Science & Technology, v. 44, no. 19, p. 7376–7382, accessed October 15, 2024, at https://doi.org/10.1021/es101333u.
Cunningham, W.L., and Schalk, C.W., comps., 2011, Groundwater technical procedures of the U.S. Geological Survey: U.S. Geological Survey Techniques and Methods 1–A1, 151 p., accessed October 15, 2024, at https://doi.org/10.3133/tm1A1.
DeCicco, L.A., Hirsch, R.M., Lorenz, D., Watkins, W.D., Johnson, M., 2015, dataRetrieval—R packages for discovering and retrieving water data available from Federal hydrologic web services (ver. 2.7.12, 2022): U.S. Geological Survey software release, accessed February 23, 2023, at https://doi.org/10.5066/P9X4L3GE.
DeSimone, L.A., 2023, Preliminary machine learning models of manganese and 1,4-dioxane in groundwater on Long Island, New York: U.S. Geological Survey Scientific Investigations Report 2022–5120, 34 p., accessed October 15, 2024, at https://doi.org/10.3133/sir20225120.
DeSimone, L.A., Pope, J.P., and Ransom, K.M., 2020, Machine-learning models to map pH and redox conditions in groundwater in a layered aquifer system, Northern Atlantic Coastal Plain, eastern USA: Journal of Hydrology: Regional Studies, v. 30, accessed October 15, 2024, at https://doi.org/10.1016/j.ejrh.2020.100697.
Dewitz, J., and U.S. Geological Survey, 2021, National Land Cover Database (NLCD) 2019 products (ver. 2.0, June 2021): U.S. Geological Survey data release, accessed February 25, 2025, at https://doi.org/10.5066/P9KZCM54.
Dondero, A.M., Simonson, A.E., and Fisher, I.J., 2024, 2022 Hydrologic data summary for the Central Pine Barrens Region, Suffolk County, New York: U.S. Geological Survey data release, accessed November 21, 2024, at https://doi.org/10.5066/P9YH7FTL.
Dubrovsky, N.M., Burow, K.R., Clark, G.M., Gronberg, J.M., Hamilton, P.A., Hitt, K.J., Mueller, D.K., Munn, M.D., Nolan, B.T., Puckett, L.J., Rupert, M.G., Short, T.M., Spahr, N.E., Sprague, L.A., and Wilber, W.G., 2010, The quality of our Nation’s waters—Nutrients in the Nation’s streams and groundwater, 1992–2004: U.S. Geological Survey Circular 1350, 174 p. [Also available at https://doi.org/10.3133/cir1350.]
Eckhardt, D.A.V., Flipse, W.J., and Oaksford, E.T., 1989, Relation between land use and ground-water quality in the upper glacial aquifer in Nassau and Suffolk Counties, Long Island, New York: U.S. Geological Survey Water-Resources Investigation Report 86–4142, 35 p. [Also available at https://doi.org/10.3133/wri864142.]
Eckhardt, D.A.V., and Pearsall, K.A., 1989, Chlorinated organic compounds in ground water at Roosevelt Field, Nassau County, Long Island, New York: U.S. Geological Survey Water-Resources Investigations Report 86–4333, 62 p. [Also available at https://doi.org/10.3133/wri864333.]
Fisher, I.J., and Bayraktar, B.N., 2020, Pesticides, nutrients, and inorganics in shallow groundwater, Long Island, NY, 2016–2018: U.S. Geological Survey data release, accessed February 25, 2025, at https://doi.org/10.5066/P9TQ058W.
Fisher, I.J., Bayraktar, B.N., and Simonson, A.E., 2019, 2018 Hydrologic data summary for the Central Pine Barrens Region, Suffolk County, New York (ver. 2.0, February 2024): U.S. Geological Survey data release, accessed November 21, 2024, at https://doi.org/10.5066/P9JU6S00.
Fisher, I.J., Phillips, P.J., Bayraktar, B.N., Chen, S., McCarthy, B.A., and Sandstrom, M.W., 2021, Pesticides and their degradates in groundwater reflect past use and current management strategies, Long Island, New York, USA: Science of the Total Environment, v. 752, 13 p., accessed October 15, 2024, at https://doi.org/10.1016/j.scitotenv.2020.141895.
Fisher, I.J., Phillips, P.J., Colella, K.M., Fisher, S.C., Tagliaferri, T., Foreman, W.T., and Furlong, E.T., 2016, The impact of onsite wastewater disposal systems on groundwater in areas inundated by Hurricane Sandy in New York and New Jersey: Marine Pollution Bulletin, v. 107, no. 2, p. 509–517, accessed October 15, 2024, at https://doi.org/10.1016/j.marpolbul.2016.04.038.
Flipse, W.J., Jr., Katz, B.G., Lindner, J.B., and Markel, R., 1984, Sources of nitrate in ground water in a sewered housing development, Central Long Island, New York: Ground Water, v. 22, no. 4, p. 418–426, accessed October 15, 2024, at https://doi.org/10.1111/j.1745-6584.1984.tb01412.x.
Franke, O.L., and McClymonds, N.E., 1972, Summary of the hydrologic situation on Long Island, New York, as a guide to water-management alternatives: U.S. Geological Survey Professional Paper 627–F, 58 p. [Also available at https://doi.org/10.3133/pp627F.]
Furlong, E.T., Noriega, M.C., Kanagy, C.J., Kanagy, L.K., Coffey, L.J., and Burkhardt, M.R., 2014, Determination of human-use pharmaceuticals in filtered water by direct aqueous injection-high-performance liquid chromatography/tandem mass spectrometry: U.S. Geological Survey Techniques and Methods, book 5, chap. B10, 49 p., accessed October 15, 2024, at https://doi.org/10.3133/tm5B10.
Göbel, p., Dierkes, C., and Coldewey, W.G., 2007, Storm water runoff concentration matrix for urban areas: Journal of Contaminant Hydrology, v. 91, no. 1–2, p. 26–42, accessed October 15, 2024, at https://doi.org/10.1016/j.jconhyd.2006.08.008.
Gómez, R., Arce, M.I., Baldwin, D.S., and Dahm, C.N., 2017, Water physicochemistry in intermittent rivers and ephemeral streams, chap. 3.1 of Datry, T., Bonada, N., and Boulton, A., eds., Intermittent rivers and ephemeral streams: London, Academic Press, p. 109–134. [Also available at https://doi.org/10.1016/B978-0-12-803835-2.00005-X.]
Harned, D.A., 1988, Effects of highway runoff on streamflow and water quality in the Sevenmile Creek basin, a rural area in the Piedmont Province of North Carolina, July 1981 to July 1982: U.S. Geological Survey Water-Supply Paper 2329, 33 p. [Also available at https://doi.org/10.3133/wsp2329.]
Hem, J.D., 1985, Study and interpretation of the chemical characteristics of natural water: U.S. Geological Survey Water-Supply Paper 2254, 263 p. [Also available at https://doi.org/10.3133/wsp2254.]
Katz, B.G., Lindner, J.B., and Ragone, S.E., 1980, A comparison of nitrogen in shallow ground water from sewered and unsewered areas, Nassau County, New York, from 1952 through 1976: Ground Water, v. 18, no. 6, p. 607–616, accessed October 15, 2024, at https://doi.org/10.1111/j.1745-6584.1980.tb03655.x.
Kaul, N.G., 1998, Procedures for derivation of site-specific standards and guidance values for protection of aquatic life: New York State Department of Environmental Conservation Technical and Operational Guidance Series memorandum 1.1.3, 3 p., accessed September 17, 2024, at https://extapps.dec.ny.gov/docs/water_pdf/togs113.pdf.
Kolpin, D.W., Furlong, E.T., Meyer, M.T., Thurman, E.M., Zaugg, S.D., Barber, L.B., and Buxton, H.T., 2002, Pharmaceuticals, hormones, and other organic wastewater contaminants in U.S. streams, 1999–2000—A national reconnaissance: Environmental Science & Technology, v. 36, no. 6, p. 1202–1211, accessed October 15, 2024, at https://doi.org/10.1021/es011055j.
Kondor, A.C., Molnár, E., Jakab, G., Vancsik, A., Filep, T., Szeberényi, J., Szabó, L., Maász, G., Pirger, Z., Weiperth, A., Ferincz, A., Staszny, Á., Dobosy, p., Kiss, K.H., Hatvani, I.G., and Szalai, Z., 2022, Pharmaceuticals in water and sediment of small streams under the pressure of urbanization—Concentrations, interactions, and risks: Science of the Total Environment, v. 808, 11 p., accessed October 15, 2024, at https://doi.org/10.1016/j.scitotenv.2021.152160.
Lessels, J.S., and Bishop, T.F.A., 2013, Estimating water quality using linear mixed models with stream discharge and turbidity: Journal of Hydrology, v. 498, p. 13–22, accessed October 15, 2024, at https://doi.org/10.1016/j.jhydrol.2013.06.006.
Lorenz, D.L., 2015, smwrBase—An R package for managing hydrologic data, version 1.1.1: U.S. Geological Survey Open-File Report 2015–1202, 7 p., 3 app., accessed October 15, 2024, at https://doi.org/10.3133/ofr20151202.
Lorenz, D.L., and Diekoff, A.L., 2017, smwrGraphs—An R package for graphing hydrologic data, version 1.1.2: U.S. Geological Survey Open-File Report 2016–1188, 17 p., 9 app., accessed October 15, 2024, at https://doi.org/10.3133/ofr20161188. [Supersedes USGS Open-File Report 2015–1202.]
Maavara, T., Chen, Q., Van Meter, K., Brown, L.E., Zhang, J., Ni, J., and Zarfl, C., 2020, River dam impacts on biogeochemical cycling: Nature Reviews Earth & Environment, v. 1, no. 2, p. 103–116, accessed October 15, 2024, at https://doi.org/10.1038/s43017-019-0019-0.
May, A.N., Fisher, I.J., and Simonson, A.E., 2022, 2021 Hydrologic data summary for the Central Pine Barrens region, Suffolk County, New York: U.S. Geological Survey data release, accessed November 21, 2024, at https://doi.org/10.5066/P9MMZ34Z.
May, A.N., and Levitt, J.P., 2022, climb8—An R package for querying and joining climate or meteorological data with USGS hydrologic data (ver. 0.1.1, February 11, 2022): U.S. Geological Survey software release, accessed November 7, 2023, at https://doi.org/10.5066/P9N6MIR3.
Misut, P.E., Casamassina, N.A., and Walter, D.A., 2021, Delineation of areas contributing groundwater and travel times to receiving waters in Kings, Queens, Nassau, and Suffolk Counties, New York: U.S. Geological Survey Scientific Investigations Report 2021–5047, 61 p., accessed October 15, 2024, at https://doi.org/10.3133/sir20215047.
Monti, J., Jr., and Scorca, M.P., 2003, Trends in nitrogen concentration and nitrogen loads entering the South Shore Estuary Reserve from streams and ground-water discharge in Nassau and Suffolk Counties, Long Island, New York, 1952–97: U.S. Geological Survey Water-Resources Investigations Report 02–4255, 36 p. [Also available at https://doi.org/10.3133/wri024255.]
Mullaney, J.R., Lorenz, D.L., and Arntson, A.D., 2009, Chloride in groundwater and surface water in areas underlain by the glacial aquifer system, northern United States: U.S. Geological Survey Scientific Investigations Report 2009–5086, 41 p. [Also available at https://doi.org/10.3133/sir20095086.]
National Oceanic and Atmospheric Administration, 2014, Index of /pub/data/cirs/climdiv: National Oceanic and Atmospheric Administration web page, accessed November 7, 2023, at https://www.ncei.noaa.gov/pub/data/cirs/climdiv/.
New York State Department of Environmental Conservation [NYSDEC], [undated], Timing fertilizer application on Long Island—Green practices for green grass: New York State Department of Environmental Conservation, 2 p., accessed January 10, 2024, at https://extapps.dec.ny.gov/docs/water_pdf/ffstiming.pdf.
New York State Department of Environmental Conservation [NYSDEC], 1998, Ambient water quality standards and guidance values and groundwater effluent limitations: New York State Department of Environmental Conservation memorandum, 124 p., accessed September 29, 2023, at https://www.dec.ny.gov/docs/water_pdf/togs111.pdf.
New York State Department of Environmental Conservation [NYSDEC], 2014, Long Island pesticide pollution prevention strategy: New York State Department of Environmental Conservation report, [variously paged], accessed October 2, 2023, at https://dec.ny.gov/docs/materials_minerals_pdf/fullstrategy.pdf.
New York State Department of Environmental Conservation [NYSDEC], 2015, Peconic River, Upper, and tribs (1701-0108): New York State Department of Environmental Conservation water bodies assessment, 2 p., accessed July 14, 2023, at https://www.dec.ny.gov/data/WQP/PWL/1701-0108.pdf.
New York State Department of Environmental Conservation [NYSDEC], 2021, Carmans River, upper, and tribs (segment ID 1701-0102): New York State Department of Environmental Conservation webpage, accessed July 14, 2023, at https://www.dec.ny.gov/data/WQP/PWL/1701-0102.html.
New York State Department of Environmental Conservation [NYSDEC], 2023a, Consolidated assessment and listing methodology—May 2023: New York State Department of Environmental Conservation report, 32 p., accessed December 29, 2023, at https://extapps.dec.ny.gov/docs/water_pdf/calm.pdf.
New York State Department of Environmental Conservation [NYSDEC], 2023b, New York State specific language or restricted use status (updated May 18, 2023): New York State Department of Environmental Conservation report, 23 p., accessed September 27, 2023, at https://extapps.dec.ny.gov/docs/materials_minerals_pdf/nysactiveingredrev.pdf.
New York State Department of Environmental Conservation [NYSDEC], 2023c, Spring 2023 trout stocking for Suffolk County: New York State Department of Environmental Conservation web page, accessed July 11, 2023, at https://www.dec.ny.gov/outdoor/23286.html. [As of 2024, available at https://dec.ny.gov/sites/default/files/2024-07/actualstocking.pdf.]
New York State Department of Environmental Conservation [NYSDEC], 2023d, Water quality standards for taste-, color- and odor-producing, toxic and other deleterious substances, section 703.5 of Article 2, Classifications and standards of quality and purity of Chapter X, Division of water resources of Title 6, Department of Environmental Conservation of New York codes, rules and regulations: New York State, accessed July 13, 2023, at https://govt.westlaw.com/nycrr/Document/I4ed90418cd1711dda432a117e6e0f345.
New York State Department of Environmental Conservation [NYSDEC], 2024, DECinfo locator [wastewater facilities (SPDES)]: New York State Department of Environmental Conservation database, accessed January 25, 2024, at https://gisservices.dec.ny.gov/gis/dil/.
New York State Legislature, 1993, Chaps. 262–263 of Volume III of Laws of the State of New York passed at the two hundred and sixteenth session: New York State Legislature, prepared by The New York State Legislative Bill Drafting Commission, p. 2998–3027, accessed August 15, 2024, at https://nysl.ptfs.com/aw-server/rest/product/purl/NYSL/f/8f01db82-bcf0-427c-9a16-7367bf95f250.
New York State Office of Information Technology Services, 2021, New York State civil boundaries: New York State Office of Information Technology Services dataset, accessed July 13, 2023, at https://data.gis.ny.gov/maps/nys-civil-boundaries.
New York State Senate, 2014, Long Island Pine Barrens maritime reserve act, (updated November 8, 2024), Title 1 of Environmental conservation, chap. 43-B: Consolidated Laws of New York, sections 57-0101–57-0137, accessed November 14, 2024, at https://www.nysenate.gov/legislation/laws/ENV/A57T1.
Nowell, L.H., Moran, P.W., Bexfield, L.M., Mahler, B.J., Van Metre, P.C., Bradley, P.M., Schmidt, T.S., Button, D.T., and Qi, S.L., 2021, Is there an urban pesticide signature? Urban streams in five U.S. regions share common dissolved-phase pesticides but differ in predicted aquatic toxicity: Science of the Total Environment, v. 793, 18 p., accessed October 15, 2024, at https://doi.org/10.1016/j.scitotenv.2021.148453.
O’Malley, T.M., 2008, Analysis of surface water quality and ground water flow in the Carmans River watershed, Long Island, New York: Syracuse, N.Y., State University of New York, College of Environmental Science and Forestry, Master’s thesis, 24 p. [Also available at https://www.proquest.com/dissertations-theses/analysis-surface-water-quality-ground-flow/docview/193995234/se-2.]
Opsahl, S.P., and Musgrove, M., 2023, Occurrence of pharmaceutical compounds in the San Antonio segment of the Edwards (Balcones fault zone) aquifer, south-central Texas, June 2018–August 2020: U.S. Geological Survey Scientific Investigations Report 2023–5069, 31 p., accessed October 15, 2024, at https://doi.org/10.3133/sir20235069.
Parajulee, A., Lei, Y.D., De Silva, A.O., Cao, X., Mitchell, C.P.J., and Wania, F., 2017, Assessing the source-to-stream transport of Benzotriazoles during rainfall and snowmelt in urban and agricultural watersheds: Environmental Science & Technology, v. 51, no. 8, p. 4191–4198, accessed October 15, 2024, at https://doi.org/10.1021/acs.est.6b05638.
Pesticide Properties Database, 2019, Prometon (ref: G 31435; updated February 2, 2024): Pesticide Properties Database web page, accessed October 5, 2023, at https://sitem.herts.ac.uk/aeru/ppdb/en/Reports/541.htm.
Phillips, p., and Chalmers, A., 2009, Wastewater effluent, combined sewer overflows, and other sources of organic compounds to Lake Champlain: Journal of the American Water Resources Association, v. 45, no. 1, p. 45–57, accessed October 15, 2024, at https://doi.org/10.1111/j.1752-1688.2008.00288.x.
Phillips, P.J., Wall, G.R., Eckhardt, D.A., Freehafer, D.A., and Rosenmann, L., 1998, Pesticide concentrations in surface waters of New York State in relation to land use—1997: U.S. Geological Survey Water Resources Investigations Report 98–4104, 9 p. [Also available at https://doi.org/10.3133/wri984104.]
Piper, A.M., 1944, A graphic procedure in the geochemical interpretation of water-analyses: Transactions—American Geophysical Union, v. 25, no. 6, p. 914–928, accessed October 15, 2024, at https://doi.org/10.1029/TR025i006p00914.
Porter, K.S., 1980, An evaluation of sources of nitrogen as causes of ground-water contamination in Nassau County, Long Island: Ground Water, v. 18, no. 6, p. 617–625, accessed October 15, 2024, at https://doi.org/10.1111/j.1745-6584.1980.tb03656.x.
Pronschinske, M.A., Corsi, S.R., DeCicco, L.A., Furlong, E.T., Ankley, G.T., Blackwell, B.R., Villeneuve, D.L., Lenaker, P.L., and Nott, M.A., 2022, Prioritizing pharmaceutical contaminants in Great Lakes tributaries using risk‐based screening techniques: Environmental Toxicology and Chemistry, v. 41, no. 9, p. 2221–2239, accessed October 15, 2024, at https://doi.org/10.1002/etc.5403.
PubChem, 2020, 1,2,4-Triazole: National Library of Medicine web page, accessed October 5, 2023, at https://pubchem.ncbi.nlm.nih.gov/compound/9257.
Puckett, L.J., 1994, Nonpoint and point sources of nitrogen in major watersheds of the United States: U.S. Geological Survey Water-Resources Investigations Report 94–4001, 9 p. [Also available at https://doi.org/10.3133/wri944001.]
R Core Team, 2023, R—A language and environment for statistical computing, version 4.3.0 (Already Tomorrow): R Foundation for Statistical Computing software release, accessed June 2023, at http://www.R-project.org/ and https://cran.r-project.org/src/base/R-4/.
Ragone, S.E., Katz, B.G., Kimmel, G.E., and Linder, J.B., 1980, Nitrogen in ground water and surface water from sewered and unsewered areas, Nassau County, Long Island, New York: U.S. Geological Survey Water-Resources Investigations Report 80–21, 64 p.[Also available at https://doi.org/10.3133/wri8021.]
Revelle, W., [2007], psych—Procedures for psychological, psychometric, and personality research (ver. 2.3.6, 2023): R Foundation for Statistical Computing software release, accessed September 9, 2023, at https://CRAN.R-project.org/package=psych.
Reynolds, R.J., 1982, Base flow of streams on Long Island, New York: U.S. Geological Survey Water-Resources Investigations Report 81–48, 33 p. [Also available at https://doi.org/10.3133/wri8148.]
Rus, D.L., Patton, C.J., Mueller, D.K., and Crawford, C.G., 2013, Assessing total nitrogen in surface-water samples—Precision and bias of analytical and computational methods: U.S. Geological Survey Scientific Investigations Report 2012–5281, 38 p. [Also available at https://doi.org/10.3133/sir20125281.]
Ryberg, K.R., Vecchia, A.V., Gilliom, R.J., and Martin, J.D., 2014, Pesticide trends in major rivers of the United States, 1992–2010: U.S. Geological Survey Scientific Investigations Report 2014–5135, 63 p., accessed October 15, 2024, at https://doi.org/10.3133/sir20145135.
Sandstrom, M.W., Kanagy, L.K., Anderson, C.A., and Kanagy, C.J., 2016, Determination of pesticides and pesticide degradates in filtered water by direct aqueous-injection liquid chromatography-tandem mass spectrometry: U.S. Geological Survey Techniques and Methods, book 5, chap. B11, 54 p., accessed October 15, 2024, at https://doi.org/10.3133/tm5B11.
Schubert, C.E., Sullivan, T.M., and Medeiros, W.H., 2006, Analysis of mid- and high-stage conditions for the Peconic River at the eastern boundary of Brookhaven National Laboratory, Suffolk County, New York: U.S. Geological Survey Scientific Investigations Report 2005–5292, 18 p., accessed October 15, 2024, at https://doi.org/10.3133/sir20055292.
Scorca, M.P., Dorsch, W.R., and Paquette, D.E., 1999, Stratigraphy and hydrologic conditions at the Brookhaven National Laboratory and vicinity, Suffolk County, New York, 1994–97: U.S. Geological Survey Water-Resources Investigations Report 99–4086, 55 p. [Also available at https://doi.org/10.3133/wri994086.]
Smith, K.P., and Granato, G.E., 2010, Quality of stormwater runoff discharged from Massachusetts highways, 2005–07: U.S. Geological Survey Scientific Investigations Report 2009–5269, 198 p. [Also available at https://doi.org/10.3133/sir20095269.]
Spinello, A.G., and Simmons, D.L., 1992, Base flow of 10 south-shore streams, Long Island, New York, 1976–85, and the effects of urbanization on base flow and flow duration: U.S. Geological Survey Water-Resources Investigations Report 90–4205, 34 p. [Also available at https://doi.org/10.3133/wri904205.]
Stackpoole, S.M., Shoda, M.E., Medalie, L., and Stone, W.W., 2021, Pesticides in US Rivers—Regional differences in use, occurrence, and environmental toxicity, 2013 to 2017: Science of the Total Environment, v. 787, 11 p., accessed October 15, 2024, at https://doi.org/10.1016/j.scitotenv.2021.147147.
Stephen, C.E., Mount, D.I., Hansen, D.J., Gentile, J.R., Chapman, G.A., and Brungs, W.A., 1985, Guidelines for deriving numerical national water quality criteria for the protection of aquatic organisms and their uses: U.S. Environmental Protection Agency report PB85–227049, 54 p. [Also available at https://www.epa.gov/sites/default/files/2016-02/documents/guidelines-water-quality-criteria.pdf.]
Suffolk County GIS, 2023, Sewer district boundaries for Suffolk County: Suffolk County GIS dataset, accessed January 16, 2024, at https://gis.suffolkcountyny.gov/portal/home/item.html?id=52b33d49818f46e4b4a55778be0e1ad0.
Thompson, T.J., Briggs, M.A., Phillips, P.J., Blazer, V.S., Smalling, K.L., Kolpin, D.W., and Wagner, T., 2021, Groundwater discharges as a source of phytoestrogens and other agriculturally derived contaminants to streams: Science of the Total Environment, v. 755, pt. 1, 11 p., accessed October 15, 2024, at https://doi.org/10.1016/j.scitotenv.2020.142873.
Town of Brookhaven, 2013, The Carmans River conservation and management plan: Town of Brookhaven report, 413 p., accessed August 29, 2023, at https://www.brookhavenny.gov/DocumentCenter/View/733/2013-Carmans-River-Conservation-and-Management-Plan-PDF.
Turnipseed, D.P., and Sauer, V.B., 2010, Discharge measurements at gaging stations: U.S. Geological Survey Techniques and Methods, book 3, chap. A8, 87 p. [Also available at https://doi.org/10.3133/tm3A8.]
U.S. Census Bureau, 2022, QuickFacts—United States [Population estimates, July 1, 2022, (V2022)] (updated August 18, 2023): U.S. Census Bureau database, accessed August 30, 2023, at https://www.census.gov/quickfacts/.
U.S. Environmental Protection Agency [EPA], 1986, Quality criteria for water 1986: U.S. Environmental Protection Agency report EPA 440/5–86–001, 395 p. [Also available at https://www.epa.gov/sites/default/files/2018-10/documents/quality-criteria-water-1986.pdf.]
U.S. Environmental Protection Agency [EPA], 2021, Factsheet on water quality parameters—Metals: U.S. Environmental Protection Agency factsheet EPA 841F21007J, 4 p. [Also available at https://www.epa.gov/system/files/documents/2022-01/parameter-factsheet_metals_508.pdf.]
U.S. Geological Survey, 2017, Long Island groundwater network: U.S. Geological Survey web page, accessed September 21, 2023, at https://www.usgs.gov/centers/new-york-water-science-center/science/long-island-groundwater-network.
U.S. Geological Survey, 2018, NHDPlus high resolution [hydrologic unit code 0203]: U.S. Geological Survey National Hydrography database, accessed July 13, 2023, at https://www.usgs.gov/national-hydrography/access-national-hydrography-products.
U.S. Geological Survey, 2023, USGS water data for the Nation: U.S. Geological Survey National Water Information System database, accessed August 8, 2023, at https://doi.org/10.5066/F7P55KJN.
U.S. Geological Survey, [variously dated], National field manual for the collection of water-quality data, section A of Handbooks for water-resources investigations: U.S. Geological Survey Techniques of Water-Resources Investigations, book 9, 10 chap. (A0–A8, A10), accessed October 16, 2024, at https://pubs.water.usgs.gov/twri9A.
Veatch, A.C., Slichter, C.S., Bowman, I., Crosby, W.O., and Horton, R.E., 1906, Underground water resources of Long Island, New York: U.S. Geological Survey Professional Paper 44, 394 p., 3 pls., accessed October 16, 2024, at https://pubs.usgs.gov/publication/pp44.
Walter, D.A., Jahn, K.L., Masterson, J.P., Dressler, S.E., Finkelstein, J.S., and Monti, J., Jr., 2024, Simulation of groundwater flow in the Long Island, New York regional aquifer system for pumping and recharge conditions from 1900 to 2019: U.S. Geological Survey Scientific Investigations Report 2024–5044, 113 p. [Also available at https://doi.org/10.3133/sir20245044.]
Weigelhofer, G., Hein, T., and Bondar-Kunze, E., 2018, Phosphorus and nitrogen dynamics in riverine systems—Human impacts and management options, chap. 10 of Schmutz, S., and Sendzimir, J., eds., Riverine ecosystem management—Science for governing towards a sustainable future: Cham, Switzerland, Springer, Aquatic Ecology Series, v. 8., p. 187–202, accessed October 16, 2024, at https://doi.org/10.1007/978-3-319-73250-3_10.
Winter, T.C., 2007, The role of ground water in generating streamflow in headwater areas and in maintaining base flow: Journal of the American Water Resources Association, v. 43, no. 1, p. 15–25, accessed October 16, 2024, at https://doi.org/10.1111/j.1752-1688.2007.00003.x.
Wu, L., Suchana, S., Flick, R., Kümmel, S., Richnow, H., and Passeport, E., 2021, Carbon, hydrogen and nitrogen stable isotope fractionation allow characterizing the reaction mechanisms of 1H-benzotriazole aqueous phototransformation: Water Research, v. 203, 9 p., article 117519, accessed October 16, 2024, at https://doi.org/10.1016/j.watres.2021.117519.
Zhao, S., Zhang, p., Crusius, J., Kroeger, K.D., and Bratton, J.F., 2011, Use of pharmaceuticals and pesticides to constrain nutrient sources in coastal groundwater of northwestern Long Island, New York, USA: Journal of Environmental Monitoring, v. 13, no. 5, p. 1337–1343, accessed October 16, 2024, at https://doi.org/10.1039/c1em10039d.
Zimmer, M.A., Bailey, S.W., McGuire, K.J., and Bullen, T.D., 2012, Fine scale variations of surface water chemistry in an ephemeral to perennial drainage network: Hydrological Processes, v. 27, no. 24, p. 3438–3451, accessed October 16, 2024, at https://doi.org/10.1002/hyp.9449.
Zimmer, M.A., and McGlynn, B.L., 2018, Lateral, vertical, and longitudinal source area connectivity drive runoff and carbon export across watershed scales: Water Resources Research, v. 54, no. 3, p. 1576–1598, accessed October 16, 2024, at https://doi.org/10.1002/2017WR021718.
Zubrod, J.P., Bundschuh, M., Arts, G., Brühl, C.A., Imfeld, G., Knäbel, A., Payraudeau, S., Rasmussen, J.J., Rohr, J., Scharmüller, A., Smalling, K., Stehle, S., Schulz, R., and Schäfer, R.B., 2019, Fungicides—An overlooked pesticide class?: Environmental Science & Technology, v. 53, no. 7, p. 3347–3365, accessed October 16, 2024, at https://doi.org/10.1021/acs.est.8b04392.
Conversion Factors
Datum
Vertical coordinate information is referenced to the National Geodetic Vertical Datum of 1929 (NGVD 29).
Supplemental Information
A water year is the 12-month period from October 1 through September 30 of the following year and is designated by the calendar year in which it ends.
Concentrations of chemical constituents in water are given in milligrams per liter (mg/L), micrograms per liter (µg/L), nanograms per liter (ng/L), or milliequivalents per liter (mEq/L).
Loads of chemical constituents are given as mass in kilograms (kg) for the day the sample was collected or in kilograms per year (kg/yr).
For more information about this report, contact:
Director, New York Water Science Center
U.S. Geological Survey
425 Jordan Road
Troy, NY 12180–8349
dc_ny@usgs.gov
or visit our website at
https://www.usgs.gov/centers/ny-water
Publishing support provided by the Pembroke and Baltimore Publishing Service Centers
Disclaimers
Any use of trade, firm, or product names is for descriptive purposes only and does not imply endorsement by the U.S. Government.
Although this information product, for the most part, is in the public domain, it also may contain copyrighted materials as noted in the text. Permission to reproduce copyrighted items must be secured from the copyright owner.
Suggested Citation
Dondero, A.M., Fisher, I.J., Simonson, A.E., and Bayraktar, B.N., 2025, Characterization of stream water quality and groundwater levels in the Central Pine Barrens region, Suffolk County, New York, 2017–23: U.S. Geological Survey Scientific Investigations Report 2025–5010, 47 p., https://doi.org/10.3133/sir20255010.
ISSN: 2328-0328 (online)
Study Area
| Publication type | Report |
|---|---|
| Publication Subtype | USGS Numbered Series |
| Title | Characterization of stream water quality and groundwater levels in the Central Pine Barrens region, Suffolk County, New York, 2017–23 |
| Series title | Scientific Investigations Report |
| Series number | 2025-5010 |
| DOI | 10.3133/sir20255010 |
| Publication Date | March 11, 2025 |
| Year Published | 2025 |
| Language | English |
| Publisher | U.S. Geological Survey |
| Publisher location | Reston, VA |
| Contributing office(s) | New York Water Science Center |
| Description | Report: v, 47 p.; 5 Data Releases |
| Country | United States |
| State | New York |
| County | Suffolk County |
| Other Geospatial | Central Pine Barrens region |
| Online Only (Y/N) | Y |
| Additional Online Files (Y/N) | N |