

A Framework for Understanding the Effects of Subsurface Agricultural Drainage on Downstream Flows
Links
- Document: Report (34 MB pdf) , HTML , XML
- Download citation as: RIS | Dublin Core
Acknowledgments
Funding for this project was provided by the Transportation Pooled Fund-5(460) project, in cooperation with the following State agencies: Illinois Department of Transportation, Iowa Department of Transportation, Michigan Department of Transportation, Minnesota Department of Transportation, Missouri Department of Transportation, Montana Department of Natural Resources and Conservation, North Dakota Department of Water Resources, South Dakota Department of Transportation, and Wisconsin Department of Transportation.
Members of the project stakeholder group from the cooperating agencies and other interested State and Federal agencies, and U.S. Geological Survey colleagues contributed to discussions of this work.
Abstract
Understanding controls on streamflow volume and magnitude is important to water resource management applications, such as critical water and transportation structure design and floodplain mapping. Changes in land use and agricultural practices, such as subsurface agricultural drainage, may be contributing to changes in streamflow characteristics. Subsurface agricultural drainage, also known as tile drainage, is the practice of installing drains in the subsurface of agricultural fields to improve productivity. Because of the complex interactions between subsurface drainage systems, precipitation, local soil conditions, and land management practices, it is difficult to determine how subsurface agricultural drainage affects downstream flow. Previously developed subsurface agricultural drainage conceptual models under dry, saturated, and winter conditions are summarized, and current literature on the effects of subsurface agricultural drainage on downstream flows, focusing on peak flow, non-event flow, and total flow to develop frameworks for discussing these systems is compiled.
The effects that subsurface drainage has on hydrologic systems are expected to vary by site and are seasonally based on system design, soil type, moisture conditions, precipitation characteristics, and land conditions. Subsurface drainage can affect the magnitude of peak flow by converting surface runoff from a storm event to subsurface runoff. By increasing hydrologic connectivity of a catchment, subsurface drainage can increase non-event flow or the flow between two storm events, typically dependent on lateral flow through the subsurface and groundwater. Theoretically, by diverting water from groundwater recharge or by reducing water available for evapotranspiration, subsurface drainage may increase the total volume of flow. Precipitation changes may increase infiltration, excess overland flow, and flood risk regardless of the presence or absence of subsurface drainage.
Introduction
Subsurface agricultural drainage, also known as tile drainage, are systems of underground drains that remove excess water from the subsurface to increase agricultural productivity. Subsurface agricultural drainage may alter streamflow characteristics downstream by modifying the flow paths of surface and subsurface runoff. Subsurface drainage has a complex relationship to streamflow characteristics (such as peak-flow magnitude) and has been hypothesized as a potential driver of changes in peak flow (Barth and others, 2022).
Understanding peak-flow frequency is essential to water resource management applications, such as critical water and transportation structure design and floodplain mapping (Ryberg and others, 2017). Trends in peak flow, and other streamflow characteristics, have been identified in previous studies across the United States (Schilling and Libra, 2003; Hirsch and Ryberg, 2012; Hirsch and Archfield, 2015; Dudley and others, 2018; Hodgkins and others, 2019; Norton and others, 2022). Evidence supports the hypothesis that these trends are due to long-term persistent regional hydroclimatic shifts within the central United States where the hydroclimate consists of precipitation, evapotranspiration, and imbalances between them (Ryberg and others, 2024). However, changes in land use and agricultural practices may also be contributing to these trends. Understanding how subsurface drainage affects downstream flow characteristics may help untangle the cause of trends in streamflow characteristics. This report starts this process by reviewing previous research that analyzed the relation between subsurface drainage and streamflow and highlights difficulties of studying subsurface drainage.
Study Area
Use of subsurface drainage is concentrated in the Midwest region of the United States. For this study, the focus is on subsurface agricultural drainage in nine States that are part of a comprehensive peak-flow trends study (Ryberg and others, 2024; fig. 1): Illinois, Iowa, Michigan, Minnesota, Missouri, Montana, North Dakota, South Dakota, and Wisconsin. These States represent a region with diverse topography, climates, and hydrologic regimes.
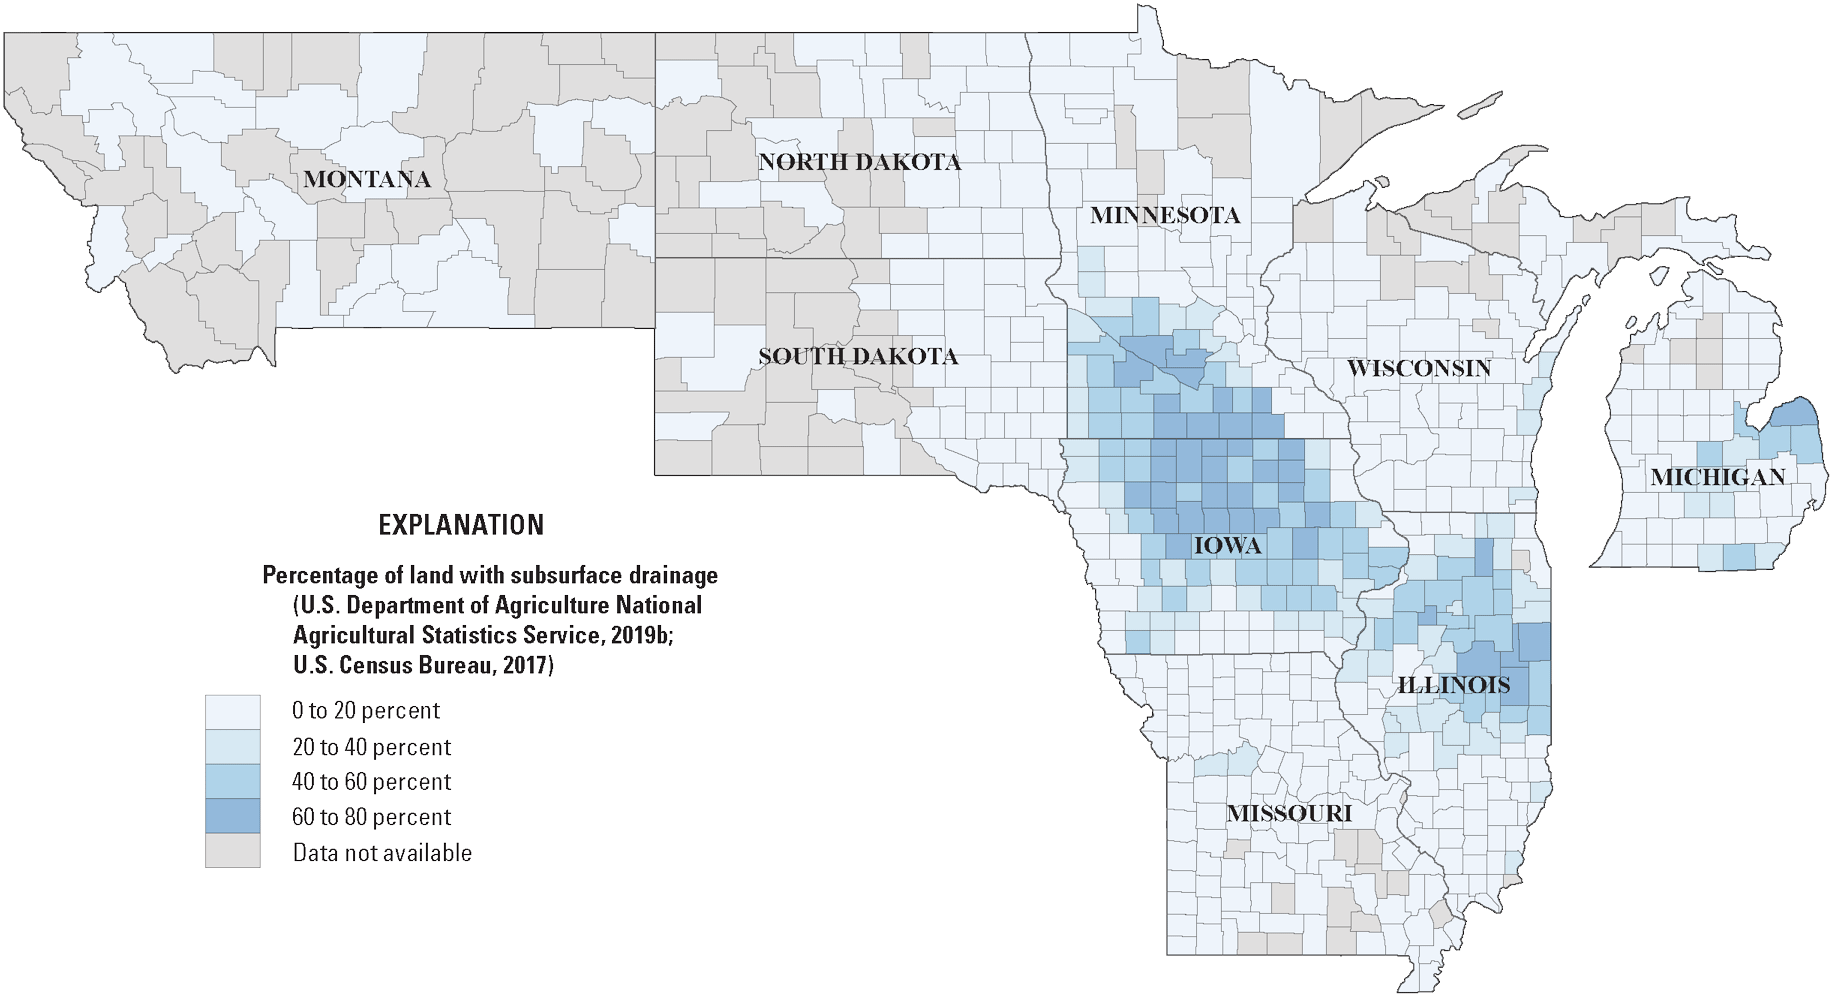
Map showing the percentage of land by county with subsurface agricultural drainage in the nine-State study region (U.S. Department of Agriculture National Agricultural Statistics Service [USDA NASS], 2019b; U.S. Census Bureau, 2017). Subsurface agricultural drainage data are from the 2017 U.S. Department of Agriculture (USDA) Census of Agriculture (USDA NASS, 2019a).
Regional maps of cropland, hydrologic soil groups, and annual precipitation show that subsurface drainage, in the defined study area, is concentrated in areas with cropland, poorly drained soils, and humid climates. Cropland is distributed throughout the study area (fig. 2); however, data from the 2017 U.S. Department of Agriculture (USDA) Census of Agriculture indicate that counties with the greatest percentage of subsurface drainage are concentrated in southern Minnesota, north central Iowa, central Illinois, and parts of Michigan (fig. 1).
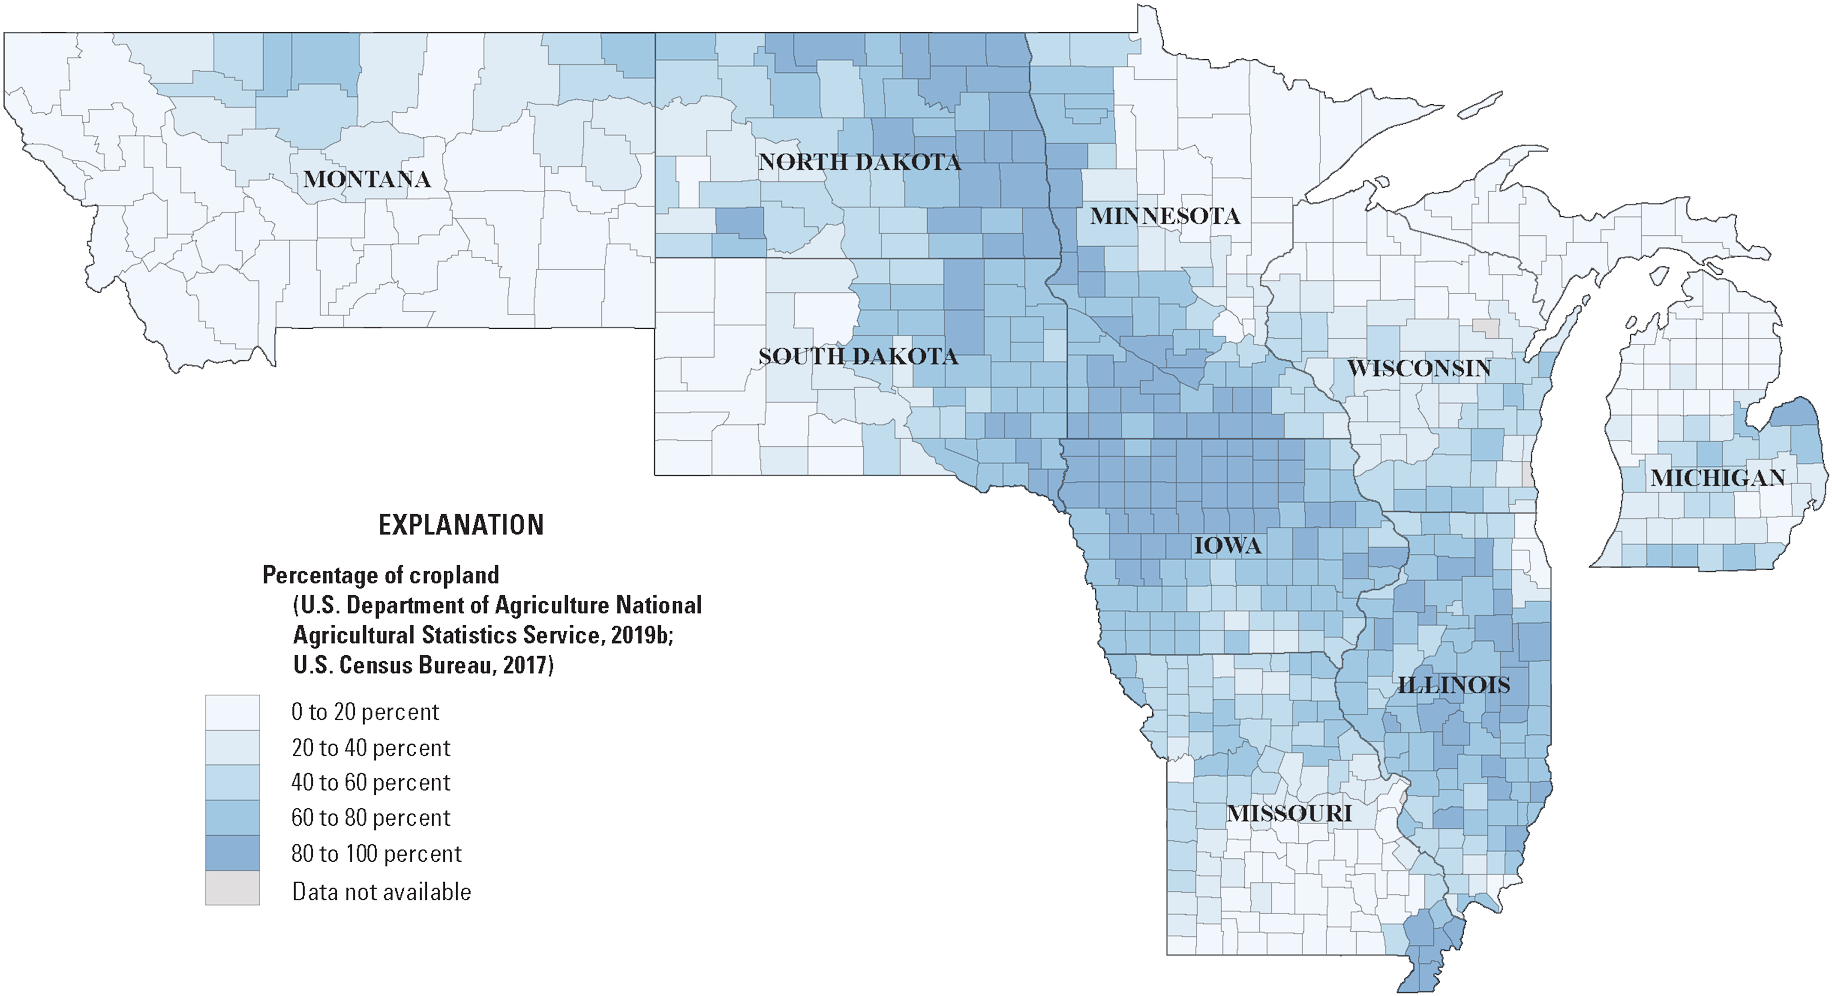
Map showing the percentage of land by county with cropland in the nine-State study region (U.S. Department of Agriculture National Agricultural Statistics Service [USDA NASS], 2019b; U.S. Census Bureau, 2017). Cropland data are from the 2017 USDA Census of Agriculture (USDA NASS, 2019a).
Counties with higher percentages of subsurface drainage overlap with dominant hydrologic soil groups that have high or moderately high runoff potential (fig. 3). Soils in hydrologic group A have low runoff potential when thoroughly wet; group B soils have moderately low runoff potential when thoroughly wet; group C soils have moderately high runoff potential when thoroughly wet; and group D soils have high runoff potential when thoroughly wet (U.S. Department of Agriculture Natural Resources Conservation Service, 2009).
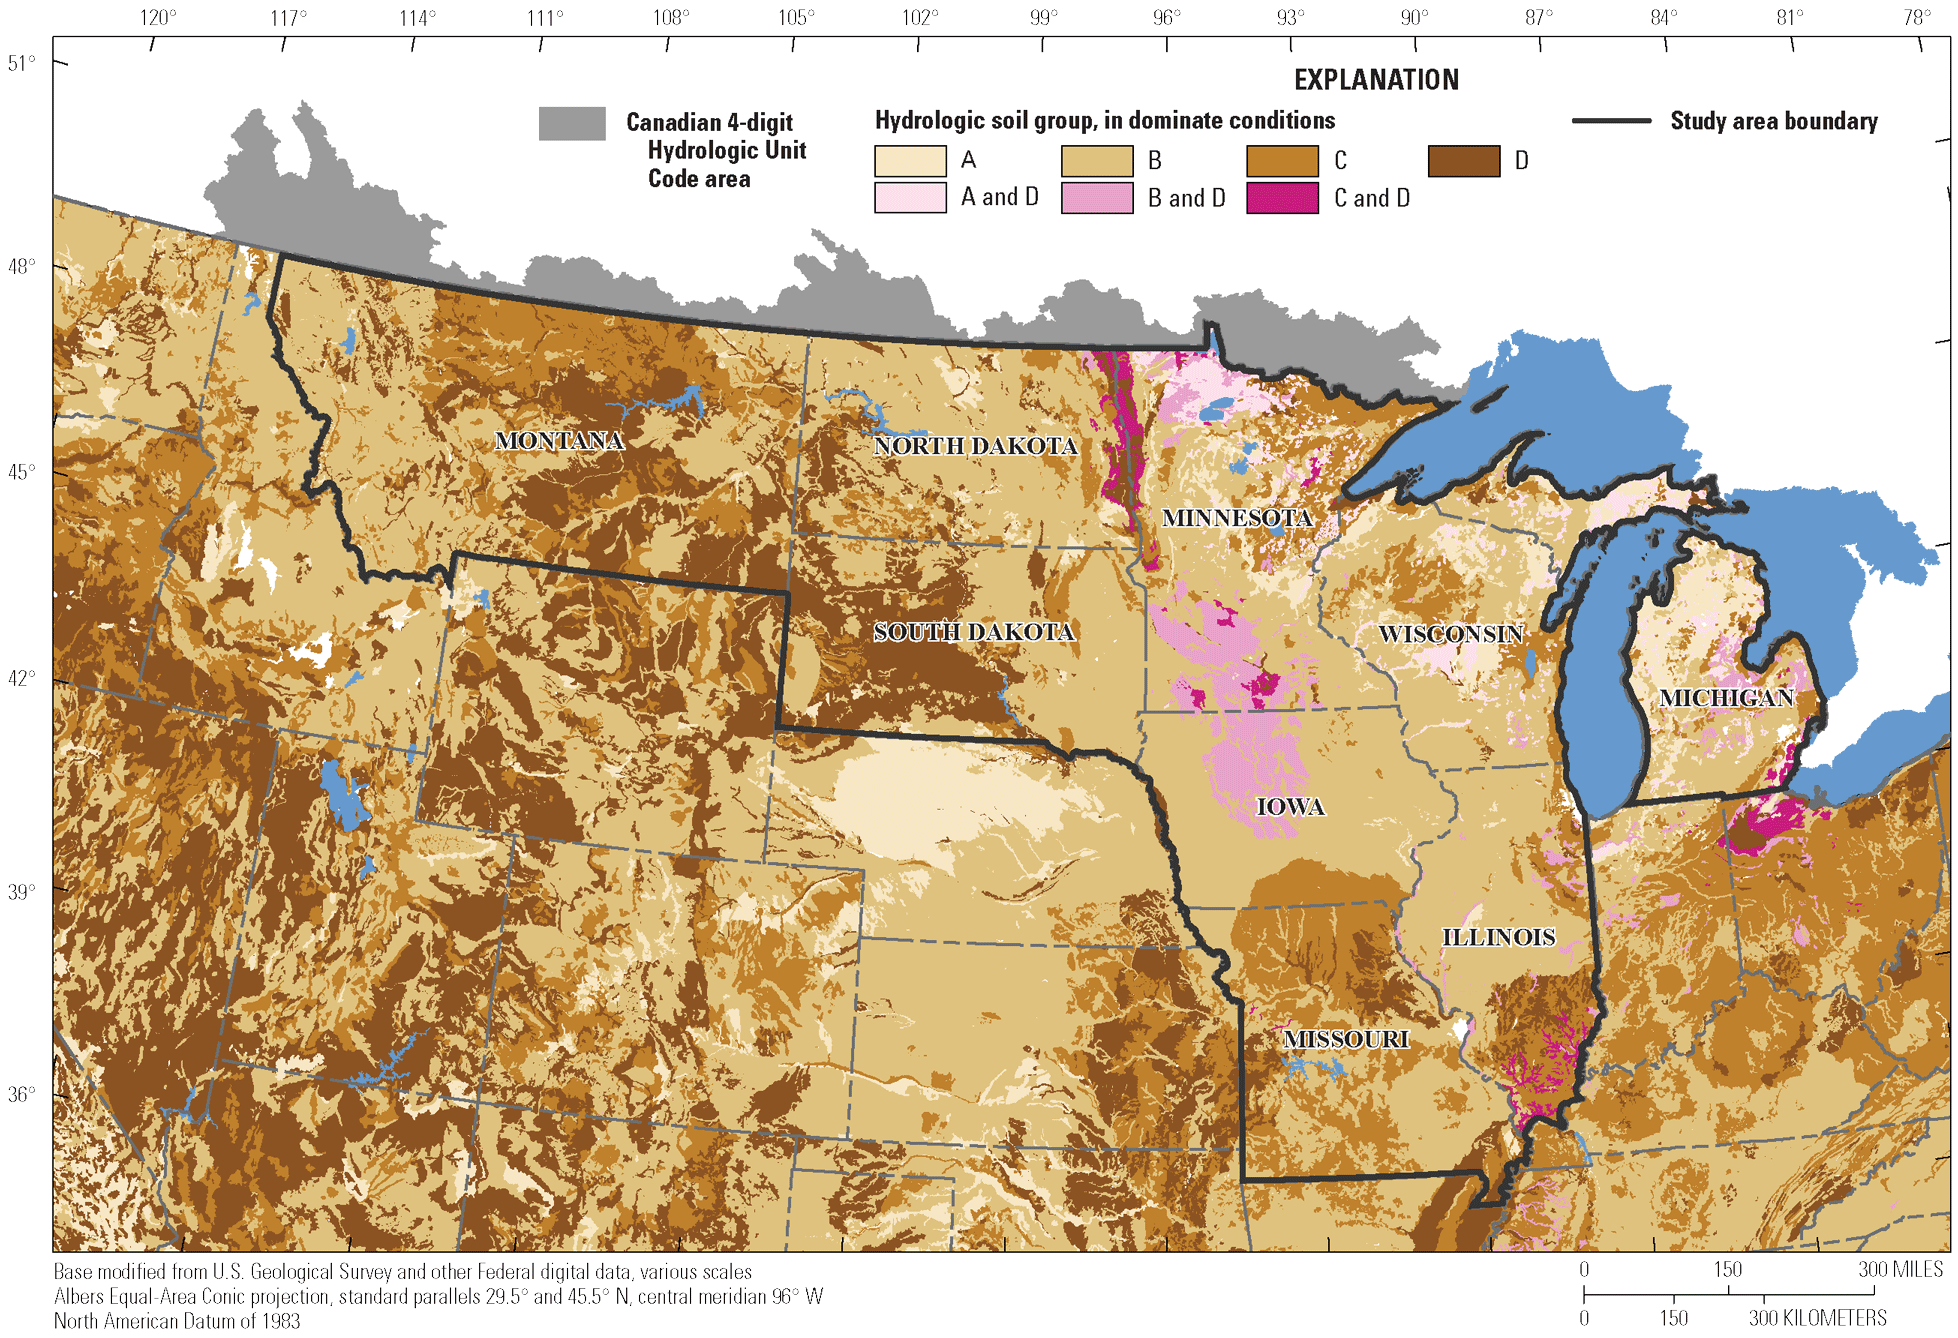
Map showing the dominant hydrologic soil groups across the study area (U.S. Department of Agriculture Natural Resources Conservation Service, 2009). Modified from Ryberg and others (2024). [A, low runoff potential when thoroughly wet; B, moderately low runoff potential when thoroughly wet; C moderately high runoff potential when thoroughly wet; D, high runoff potential when thoroughly wet.]
Note that the hydrologic soil groups A and D, B and D, and C and D in figure 3 are dual hydrologic soil groups where the first letter refers to the drained condition and the second to the undrained condition (U.S. Department of Agriculture Natural Resources Conservation Service, 2009). These hydrologic soil groups indicate that the soils, when adequately drained, may functionally move from the D group (high runoff potential) to the A (low runoff potential), B (moderately low runoff potential), or C (moderately high runoff potential) group. The dual hydrologic soil groups are in shades of pink to distinguish them from the other soil groups (in shades of brown). Finally, counties with higher percentages of subsurface drainage also receive an average annual precipitation greater than 20 inches (fig. 4). Figures 1–4 together demonstrate that subsurface drainage in the study area is concentrated in regions of cropland where soil types have high or moderately high runoff potential and average annual precipitation greater than 20 inches.
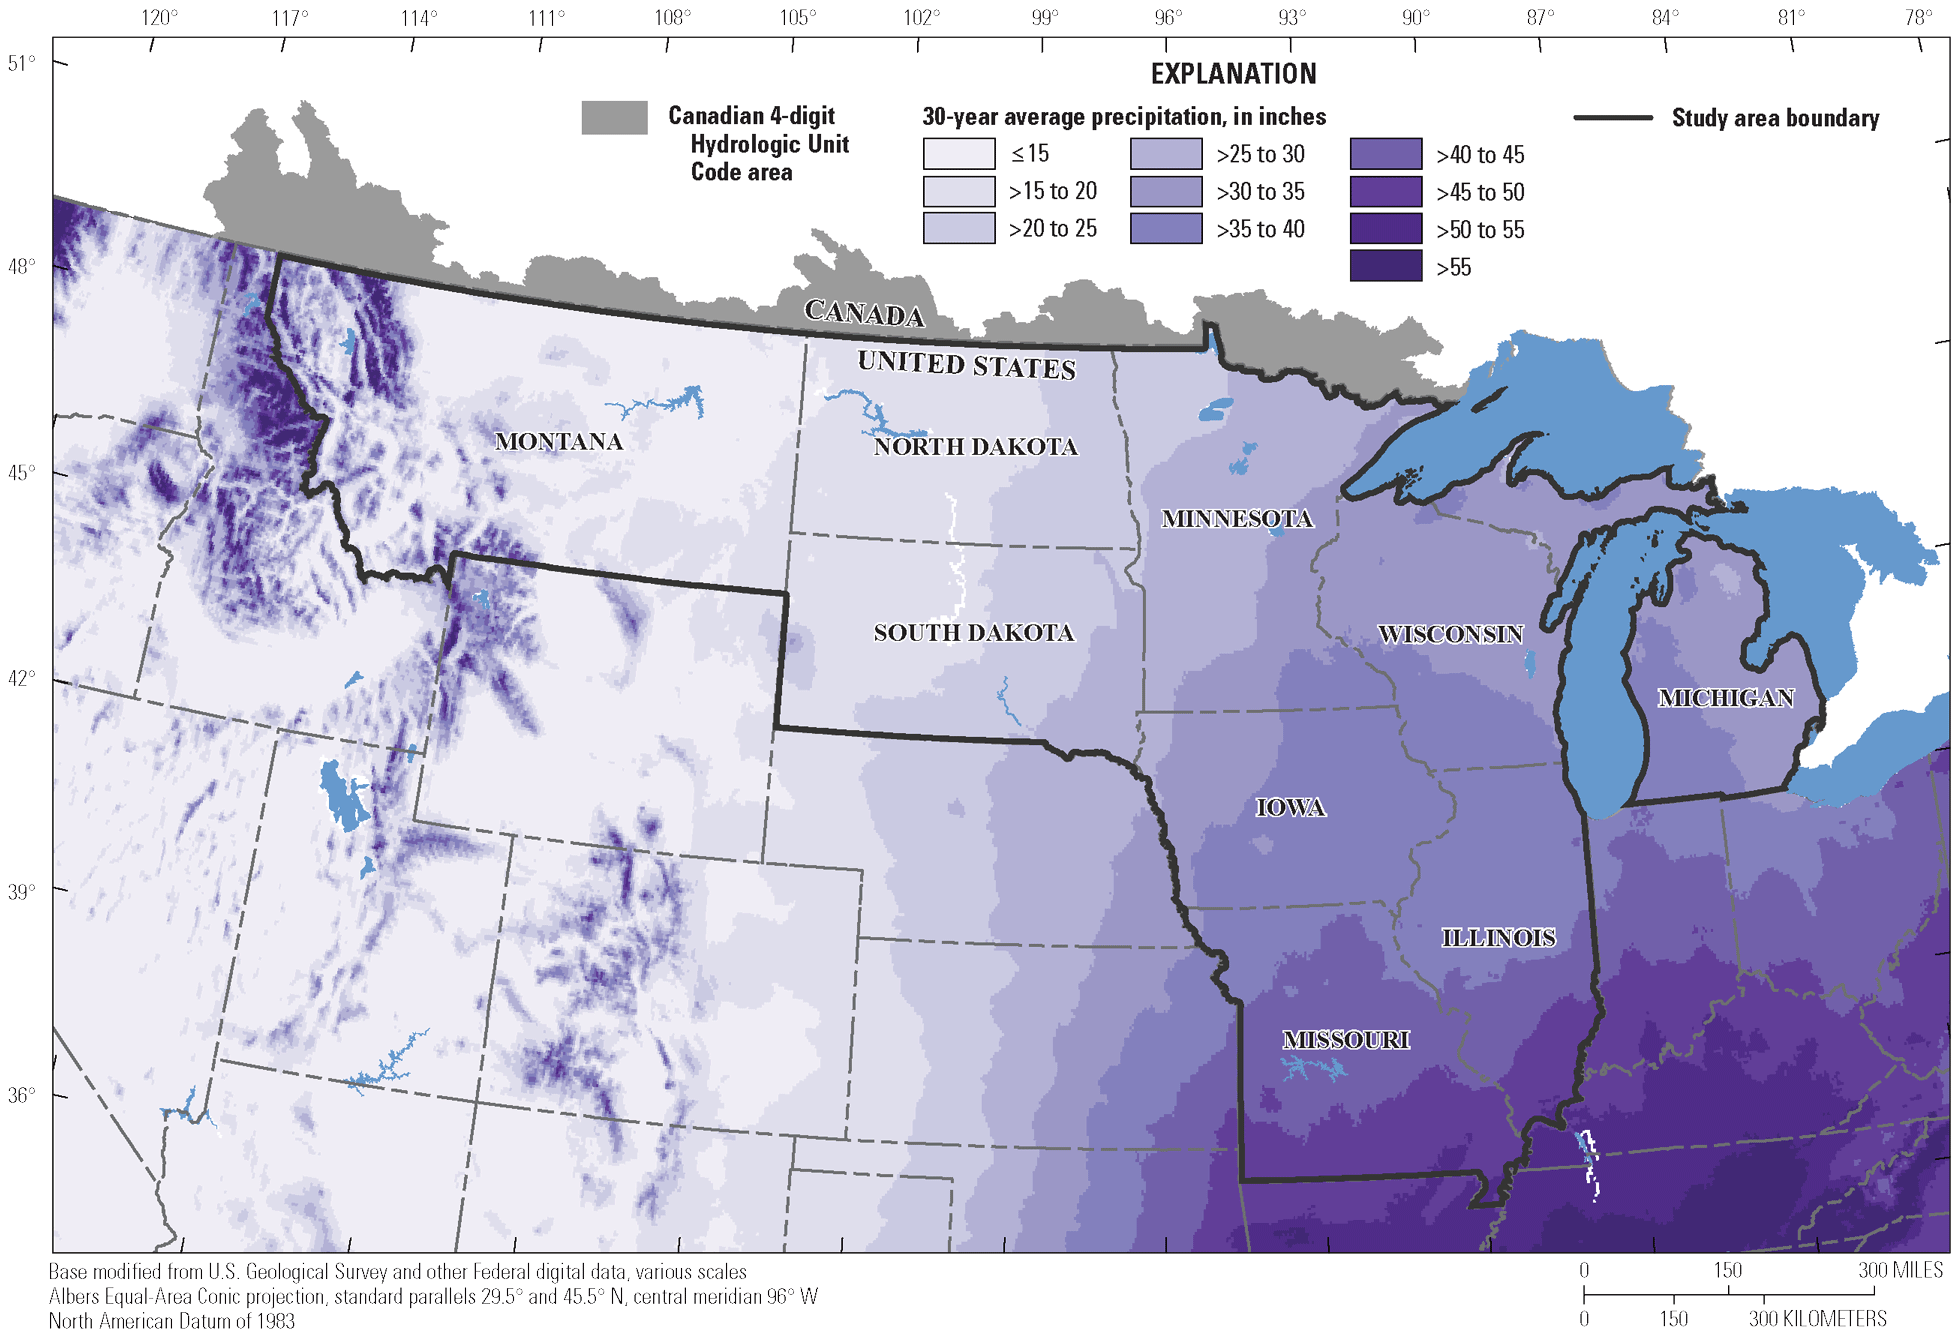
Map showing the average annual precipitation from 1991 to 2020 for the study area (National Oceanic and Atmospheric Administration [NOAA] National Centers for Environmental Information, 2022). Modified from Ryberg and others (2024).
Terminology used to refer to subsurface drains varies by region and discipline; depending on the region, tile drain or drain tile may be the preferred term for agriculturists. Until the 1970s, clay or concrete tiles placed end-to-end were used for subsurface drainage, which is where the term tile drain originates (Sands, 2018). Today, perforated corrugated plastic tubing is preferred because of its improved performance and easier transport and installation (Hitz and Cruse, 2008). In academia, the term subsurface agricultural drain is used because it better represents the system, and for individuals unfamiliar with agricultural practices, it is easier to understand. In this report, the term subsurface agriculture drain is used to make it more accessible to a general audience.
Purpose and Scope
The purpose of this report is to synthesize the understanding of the relation between subsurface agricultural drainage and streamflow. This report
-
1. provides a general overview of how subsurface agriculture drainage systems are used,
-
2. reviews what subsurface agricultural drainage data are available publicly,
-
3. reviews subsurface agricultural drainage conceptual models from previous literature to demonstrate how these systems operate under saturated, dry, and winter conditions, and
-
4. compiles literature on and theoretically explores, through conceptual frameworks, how subsurface agricultural drainage systems affect peak flow, non-event flow (that is, low flow), and total flow, at the field-scale and catchment-scale.
This report identifies the potential challenges when studying subsurface agricultural drainage and the gaps in the current research.
Overview of Subsurface Agricultural Drainage
Subsurface agricultural drainage systems are designed to improve the hydrologic connectivity between surface water and subsurface water. Effective design depends on surface terrain, soil type, crop type, local climate, overall cost benefits, and proper maintenance. This improved connectivity may increase agricultural productivity by improving crop health and increasing times when the fields are accessible by farm equipment.
Benefits
Subsurface agricultural drainage improves crop health, leading to increased agricultural productivity. By lowering the water table, drainage prevents saturation around the root zone and allows crop roots access to oxygen for respiration. A lack of oxygen can affect root growth and the plant’s ability to absorb nutrients (Kanwar and others, 1988). The diffusion rate of oxygen through soil pores is a limiting factor in root respiration, and oxygen diffuses through air-filled pores 10,000 times faster than water-filled pores (Clark and Kemper, 2015). In addition, saturation around root zone can restrict root growth, putting the plant at an increased risk of disease, nutrient deficiency, and drought, and, if saturation continues, can kill younger plants (Kanwar and others, 1988). In addition, by facilitating the movement of water through the soil, subsurface agricultural drainage prevents the buildup of salinity in soil water caused by evapotranspiration (Skaggs and others, 1994).
Subsurface agricultural drainage also increases agricultural productivity by speeding up field dry out times. This earlier access to fields after rain events facilitates planting in the spring and harvesting in the fall. This increase in accessibility may extend the growing season. In addition, drainage systems can be customized to allow for even drying throughout the field and prevent ponding (Scherer and others, 2015). Reducing soil saturation is especially important during planting because soil saturation can prevent seeds from germinating (Kanwar and others, 1988). Finally, subsurface agricultural drainage may help prevent soil erosion by converting surface runoff to subsurface runoff.
Design of Systems
Subsurface agricultural drainage system designs vary widely and depend on the surface terrain, soil type, crop type, and local climate. A basic system includes laterals that are small (3- to 6-inch diameter) corrugated plastic tubing that connect to larger mains (12- to 48-inch diameter; fig. 5). Mains then drain to an outlet, typically in an agriculture drainage ditch, wetland, or pond (Minnesota Groundwater Association, 2018).
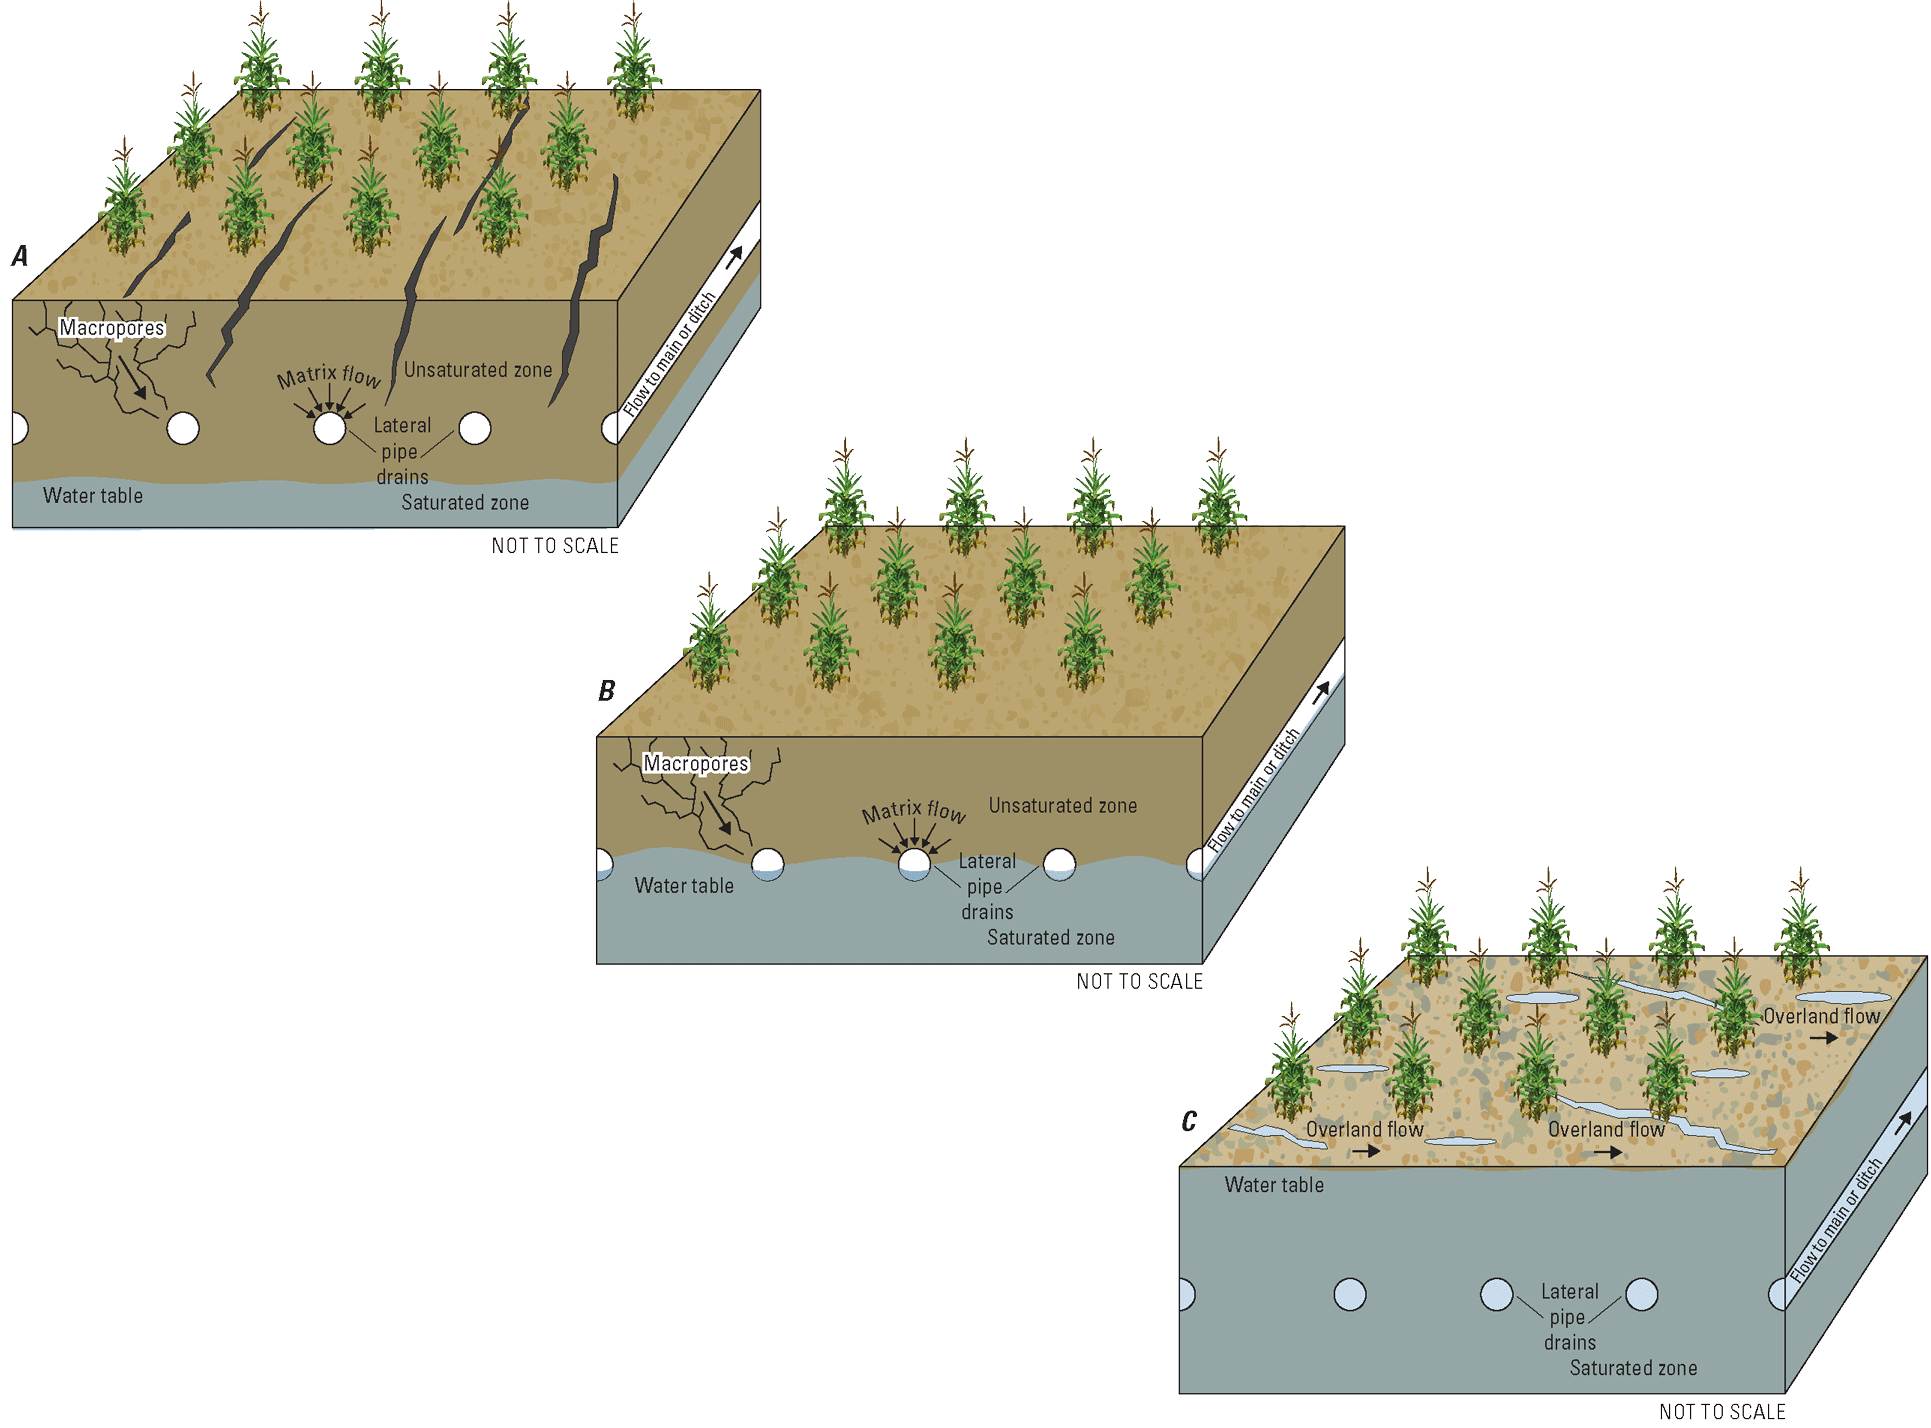
Diagram showing an example subsurface agricultural drainage system under different hydrologic conditions, including A. dry, B. saturated, and C. fully saturated conditions. Included in these figures are possible flow paths for storm water including overland flow, matrix flow, and flow through macropores.
Perforated corrugated plastic tubing is preferred for pipe drain laterals over clay or concrete tiles, because of its improved performance, and is easier to transport and install (Hitz and Cruse, 2008). Older clay drainage systems still exist in the Midwest and many still function; however, landowners are sometimes unaware of their existence because drainage records were rarely kept (Hitz and Cruse, 2008). Most pipe drain laterals are installed directly in stable soil; however, in some situations, such as when soil is fine-grained sands or silts, additional stabilizing material may be installed around the pipe drain to provide stability and improve hydraulic performance as the pipe drain diverts soil water moving down through the subsurface (American Society of Agricultural and Biological Engineers [ASABE], 2015). Some subsurface agricultural drainage systems may include inlets that allow surface water to drain directly to the underground pipe drains, in addition to soil water being diverted (ASABE, 2015). These surface water inlets may be vertical pipes installed between the surface and the horizontal pipe drains in the subsurface or areas above the horizontal pipe drains that have been back filled with coarser sediment that enhance vertical drainage (Minnesota Groundwater Association, 2018).
The depth that subsurface pipe drains are installed below the ground surface and the diameter of the laterals and mains are determined by the surface terrain, soil type, crop type, local climate, surface drainage, and cost. Pipe drains are typically installed at a depth of 3 to 4 feet below ground surface (ASABE, 2015). For gravity-controlled systems, depth is also dependent on the recommended grade to move water through the pipe drains and the surface terrain. In cold regions, pipe drains should be installed below the frost line (Minnesota Groundwater Association, 2018). The size of the mains and laterals installed is determined by the system’s drainage coefficient, or the rate of water removal in 24 hours, which is dependent on precipitation characteristics and soil properties (ASABE, 2015).
The spacing between lateral pipe drains and their arrangement can also vary. The spacing between laterals is controlled by pipe drain depth, soil type, saturated hydraulic conductivity, surface drainage, and crop type (ASABE, 2015). On average, the spacing between lateral pipe drains is 30 to 100 feet but can increase up to 300 feet between laterals in very permeable soil (ASABE, 2015). Laterals are recommended to be installed perpendicular to surface flow to allow for maximum potential for the water to be intercepted by the system (ASABE, 2015). For fields with only a few wet areas, custom designs are used to target low lying areas. More commonly, subsurface agricultural drainage is installed in a grid or parallel pattern (fig. 6).
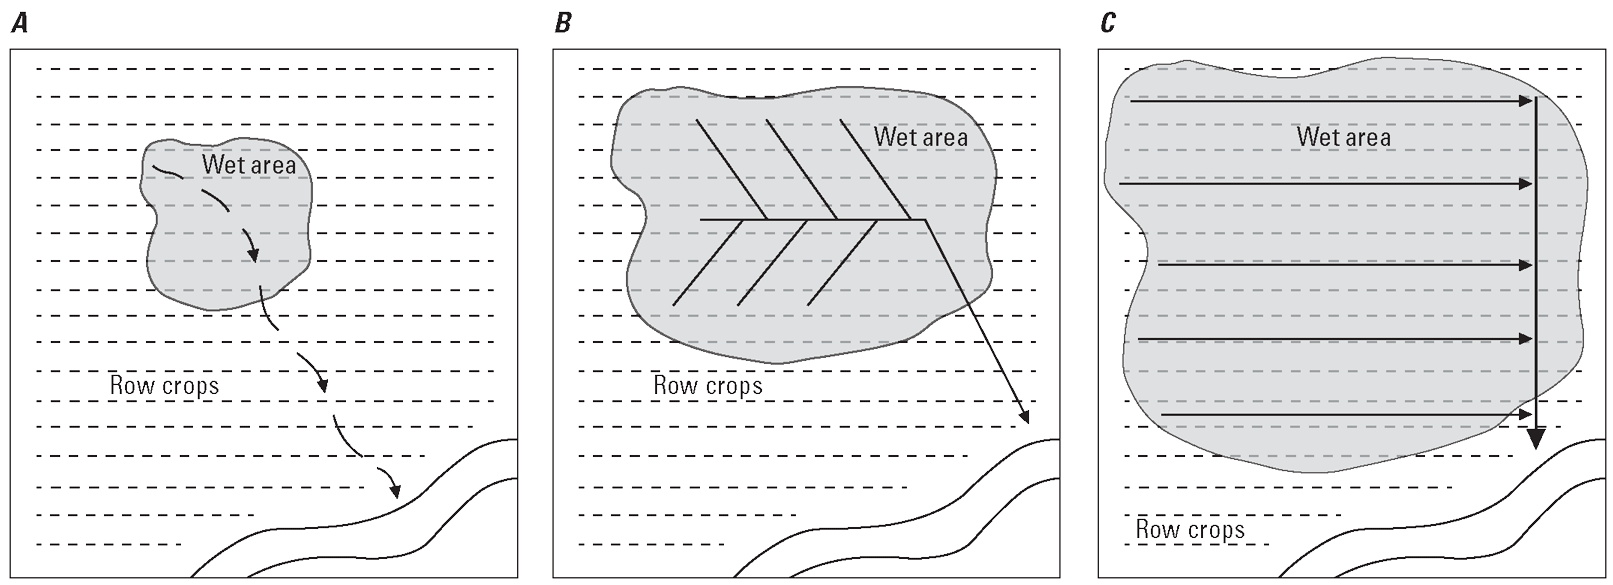
Diagram showing examples of pipe drain patterns in subsurface agricultural drainage systems. A, Custom pattern to target wet areas within a field of row crops. B, The herringbone design. C, the grid pattern that uses laterals connected to a main pipe drain to uniformly drain a large area. Modified from figure 4 (Minnesota Groundwater Association, 2018).
Parallel patterns include equally spaced laterals at a uniform depth that gradually slope toward the main or multiple sub-mains for larger systems. This pattern is especially useful in wet, low-permeability soils because it allows for uniform drainage throughout a field (Minnesota Groundwater Association, 2018). For less permeable and more humid climates, laterals may need to be installed closer together and at a shallower depth to get the desired results. Soil can be drained regardless of soil type; however, special consideration is given to very fine or very coarse soils (ASABE, 2015; Scherer and others, 2015).
Flow through subsurface agricultural drainage systems were traditionally gravity driven but adding structures to control the flow through the system is becoming more common (Minnesota Groundwater Association, 2018). If the surface terrain does not allow for a gravity driven system, a lift station can be used to pump water through the pipe drains. Pumping systems allow operators to control the amount of water flowing through the system by turning on and off the pumps. In gravity-controlled systems, a water control system can be added to control flow. This is done by raising the outlet elevations using stoplogs or baffles. Raising the outlet elevation allows operators to maintain a shallower water table in their system or they can stop water from flowing out of the system all together (Scherer and others, 2015). Subsurface agricultural drainage systems can also be designed to irrigate crops through the subsurface, a practice known as subirrigation, by adding water to control structures, special inlets, or sumps of pumped outlets; these systems are specially designed for subirrigation and typically require closer spaced laterals (Scherer and others, 2015).
Subsurface agricultural drainage systems require maintenance. The buildup of plant and soil material within the subsurface drainage system can lead to a reduction in the capacity of a system (Augeard and others, 2008). To prevent sediment accumulation, an envelope can be installed around the drainpipe (ASABE, 2015). Also, monitoring of system outlets to ensure they stay clear of debris, vegetation, and are not submerged is warranted. Blockage of flow at the outlet can restrict water flow through a system reducing its capacity. As subsurface drainage systems age, their performance may decrease because of deterioration, lack of maintenance, and insufficient capacity (Brandel, 2016).
Data on Subsurface Agricultural Drainage
Data on the presence of subsurface agricultural drainage are limited spatially and temporally. Historically records have not always been kept during installation of these systems. The collection of information on the presence of subsurface agricultural drainage has mostly been left up to a local governing body, such as a county or drainage district, and most often is dependent on an individual’s knowledge of their farm. More recently, aerial imagery has also been used to identify the presence of tile drainage. Due to the incomplete nature of this information, this section will also present surrogate methods often used to estimate their presence, and considerations when using these methods or datasets. Table 1 includes examples of publicly available datasets on subsurface agricultural drainage.
Table 1.
Publicly available subsurface agricultural drainage datasets.[USGS, U.S. Geological Survey; USDA, U.S. Department of Agriculture; NASS, National Agricultural Statistics Service; DNR, Department of Natural Resources; NLCD, National Land Cover Dataset; NRCS, Natural Resources Conservation Service; US, United States; ND, North Dakota; SD, South Dakota; CONUS, contiguous United States; STATSGO, State Soil Geographic dataset; NA, not applicable; *, available as sd file type]
| Source | Type | Description | Area | Units |
|---|---|---|---|---|
| Schwartz (2014)* | County | Estimates of county tile drainage | Upper Mississippi River Basin | Area (acres) and percent |
| Falcone (2017) | Watershed | Estimated percentage of watershed with tile drains | US | Percent |
| Finocchiaro and Northern Prairie Wildlife Research Center - USGS (2014a) | Permits | Area where drain tile was permitted | ND, eastern edge | Area |
| Finocchiaro and Northern Prairie Wildlife Research Center - USGS (2014b) | Permits | Area where drain tile was permitted | SD, eastern edge | Area |
| Valayamkunnath and others (2020a) | Estimate grid | Estimated 30-meter resolution based on 2017 USDA census data, cropland data, soil drainage, and land slope | CONUS | Integer (0, no tile/1, tile) |
| Nakagaki and others (2016) | Estimate grid | Estimated 30-meter resolution based on 1990s county areas of tile drains, cropland, and poorly drained soils | CONUS | Area in square meter per grid |
| USDA NASS (2024) | County | USDA census data | US | Area (hectare) |
| Jaynes and James, (2007) | County/State | Estimated 30-meter resolution based on NLCD 1992 cropland data and soil drainage from NRCS STATSGO | CONUS | Percentage |
| Sugg (2007) | Estimate county | Estimated to county level based on crops and soil drainage characteristics | Midwest | Area |
| Cho and others (2019a) | Estimate grid | Estimated annual subsurface drainage for 2009, 2011, 2014, and 2017 using random forest machine learning | Bois de Sioux watershed, Minnesota, and the Red River of the North Basin | Integer (0, no tile/1, tile) |
| Iowa Geological Survey, Department of Natural Resources (2020) | Drainage records | Drainage districts in Iowa, including infrastructure (tiles and ditches) | Iowa | NA |
| Minnesota Geospatial Information Office (2024) | Drainage records | Drainage records from select local drainage authorities, including infrastructure (tiles and ditches) | Minnesota | NA |
| North Dakota Department of Water Resources (2024) | Drainage permits | Drainage permits for systems 80 acres or more | North Dakota | NA |
Records of Systems
No complete record of installed subsurface agricultural drainage systems exists within the study area, and the records that do exist vary in detail and were collected by a variety of agencies. Some States or local agencies retain permits for the installation of subsurface agricultural drainage. North Dakota, for example, requires permits for subsurface water management systems of 80 acres or more (North Dakota Department of Water Resources, 2021). The North Dakota Department of Water Resources has agricultural drainage permit records going back to 1975 (Finocchiaro, 2014a; North Dakota Department of Water Resources, 2024). Permit records in South Dakota come from county and local water boards, so the requirements and information included in the permits vary by county (Finocchiaro, 2014b). It is also known that clay tiles still exist and function in the Midwest, with few records of their installation (Hitz and Cruse, 2008).
Some States have started to centralize and digitize drainage records, maintained by either drainage districts or counties. Iowa, through Iowa’s Department of Natural Resources, has compiled the data on public drainage districts, which includes infrastructure within the drainage districts such as subsurface agricultural drainage and ditches (Iowa Geological Survey, Department of Natural Resources, 2020). These data come with a disclaimer that the coverage varies, and the information should only be used as a guide. Minnesota has also made efforts to digitize drainage records (Minnesota Board of Water and Soil Resources, 2024). Currently, only 13 watershed districts or counties in Minnesota submitted records to the geospatial public drainage system records (Minnesota Geospatial Information Office, 2024).
Census Data
Starting in the early 1900s, data on agricultural drainage were collected using censuses with varying results (Jaynes and James, 2007). Swings in total drained areas between census years led to a push to improve estimates in the 1970s (Jaynes and James, 2007). The Nation Resources Inventory, with help from the USDA, ran a census in 1982 and 1992 to collect information on subsurface and surface drainage by State and county (Jaynes and James, 2007). Today, a question on subsurface drainage is included in the USDA Census of Agriculture, which is run every 5 years. Data on total acres with subsurface agricultural drainage are currently available for the 2012, 2017, and 2022 censuses by State and county (https://quickstats.nass.usda.gov/). To access this data, filter Program for “CENSUS,” Commodity for “PRACTICES,” and Data Item for “PRACTICES, LAND USE, DRAINED BY TILE – ACRES.”
The USDA Census of Agriculture is considered the most complete dataset on subsurface agricultural drainage in the United States; however, it is widely accepted that it underestimates the number of acres of subsurface drains (Kelly and others, 2017) because of nonresponse, undercoverage, and misclassification (USDA NASS, 2019a). For the 2017 Census, the response rate was 71.8 percent, and in 2012 the response rate was 74.6 percent (USDA NASS, 2022). One of the main causes of undercoverage and misclassification is farming operations not being included on the census mailing list or being classified as a nonfarm (USDA NASS, 2022). The USDA does consider these errors and estimates uncertainty associated with each measurement, using the coefficient of variation. Importantly, the USDA also does not report results that could identify a respondent (USDA NASS, 2019a). Figure 1 shows the percentage of land in each county with subsurface agricultural drainage based on the total acres reported in the 2017 Census of Agricultural.
Aerial Imagery
Aerial imagery can be used to determine where subsurface agricultural drainage systems have been installed (Northcott and others, 2000; Redoloza and others, 2023). Because the land above subsurface pipe drains dries out faster than other areas in a field, the general pattern of subsurface drainage system can be identified in aerial and satellite imagery during certain times of the year. Subsurface drainage systems are easiest to see during specific moisture, seasonal, and field conditions. The best conditions are when minimal crop cover is present, after a rainfall event, and in the spring when solar radiation is high and soil-water content is high but below saturation (Valayamkunnath and others, 2020b; Redoloza and others, 2023). Additionally, soil parameters measured through satellite imagery may be useful for identifying drainage (Cho and others, 2019b). Although data using aerial imagery can be accurate, they are computationally and (or) labor intensive to obtain, making this method best for small areas, such as one field or one small watershed. Aerial imagery allows the creation of a time series of tile-drain extent (Redoloza and others, 2023); however, the time series is limited to the period of imagery available.
Modeling Presence of Subsurface Drainage
To fill in data gaps, researchers have estimated the potential location of subsurface agricultural drainage systems based on where installing a system would be beneficial (Ale and Bowling, 2010; Schilling and others, 2012; Valayamkunnath and others, 2020b). Researchers define a set of criteria (soil type, soil drainage, land slope, and land cover) where these systems would be beneficial. Rarely do these methods account for economic benefits. Compared to machine learning methods, these methods can be computationally lighter and may be used to approximate subsurface drainage across larger regions.
More recently, machine learning techniques have also been used to estimate the location of subsurface agricultural drainage systems (Naz and others, 2009; Brown, 2013; Cho and others, 2019b; Redoloza and others, 2023). Supervised machine learning methods are commonly used, which require a training dataset where subsurface agricultural drainage systems have been identified. A benefit of these methods is that the algorithm selects important variables for determining the presence of these systems, which can limit bias in variable selection. However, they tend to be computationally intensive and require ground truth data to train the models, which is difficult to obtain. To overcome the lack of ground truth data, human experts can be used to interpret imagery for the training library (Redoloza and others, 2023). Because of these limitations, this method is often limited to smaller regions.
Consideration When Using Subsurface Agricultural Drainage Data
Most data sources report just the presence of subsurface drainage systems, and no information on the age or design of the system. Because of this missing information, studies often use the presence of subsurface agricultural drainage systems with no consideration for how these systems may differ. To clarify how subsurface drainage alters the hydrology of its environment and the effect on streamflow characteristics, an understanding of how effective the system is at moving water through the subsurface or improving the hydrologic connectivity of the subsurface would be beneficial. The effectiveness of a subsurface agricultural drainage system is related not just to the capacity of the system or the drainage rate, but also the precipitation timing and intensity, surface drainage, land management practices, surface terrain, and antecedent soil moisture. Because of these multiple confounding factors (for example, soil type will influence design of the system and how water is moved through the subsurface), all subsurface agricultural drainage systems are not expected to have the same effects on streamflow characteristic.
Conceptual Models for Subsurface Agricultural Drainage at the Field-Scale
Multidisciplinary studies have developed conceptual models for agricultural fields with subsurface drainage systems to show how water moves through the fields with subsurface drains and where that water originates. The goal of these conceptual models is to understand how subsurface drainage alters flow pathways in the subsurface. Many of these studies use geochemistry techniques to support these conceptual models (Van Stempvoort and others, 2021; Williams and McAfee, 2021; Gaillot and others, 2023). One common technique is to use the stable isotopes of hydrogen and oxygen, δ2H, deuterium, and δ18O, oxygen 18, as conservative tracers to identify the source of water within the system (Klaus and McDonnell, 2013). The isotopes δ2H and δ18O are naturally occurring and are a function of atmospheric conditions during rainfall and snowfall (Blasch and Bryson, 2007). The isotopic signatures vary over time and seasonally and can change through mixing, changes in phase, or chemical reactions (Clark and Fritz, 1997; Blasch and Bryson, 2007). By identifying the isotopic signature of different end members in a system, such as event water and pre-event water, the proportion of end members within a sample may be determined. Although there are limitations, typically due to the accuracy of identifying the end member signatures, this method has been used to evaluate how land-use changes affect hydrologic processes (Klaus and McDonnell, 2013).
Conceptual Models from Literature
For this report, conceptual models from Gaillot and others (2023) and Van Stempvoort and others (2021) were compared. Gaillot and others (2023) quantified water partitions among surface drainage, subsurface drainage, and soil water at the field-scale by combining water balance and stable isotopes methods. Their study looked at surface and subsurface drainage during saturated and dry conditions, and they determined that antecedent moisture conditions played a large role in how subsurface drains respond to storm events. During storm events, macropores directly transferred event water to subsurface pipe drains under dry conditions, whereas pre-event water made up most of the water flowing through the subsurface drainage system under saturated conditions. Overall, the subsurface agricultural drainage system was more reactive to lower intensity or low cumulative storm events under saturated conditions (Gaillot and others, 2023).
Van Stempvoort and others (2021) created a conceptual model for tile-drained, confining-layer-dominated catchments with a focus on shallow subsurface transport pathways. Their study used chemical and isotopes tracers to support their catchment-scale conceptual model, and they determined that pre-event water in stormflow dominated in subsurface drainage systems and in streamflow. In addition, Van Stempvoort and others (2021) concluded that flow paths of stormwater changed with rate of discharge. As with Gaillot and others (2023), Van Stempvoort and others (2021) also noted the importance of macropore flow and matrix flow.
Both studies are limited by their sample size and are located outside our study area. Gaillot and others (2023) collected data from one 5-hectare (ha) cultivated field in Loire, France, and Van Stempvoort and others (2021) collected data from a 3,090-ha catchment in southern Ontario, Canada. However, both studies present evidence of important processes that warrant consideration when evaluating methods and models for understanding subsurface agricultural drainage effect on streamflow in other regions.
Conceptual Models Under Different Conditions
Using evidence presented in these studies, a simplified field-scale conceptual model of a subsurface agricultural drainage system was developed to illustrate the dominant hydrologic processes involved and how the interplay of many factors can affect how subsurface drainage systems behave (fig. 5). To constrain some of the variables, simplifying assumptions were made about the design including (1) the system is free flowing with no control structures, (2) the system is installed in native soil, and (3) no open inlets are connected directly to the subsurface drains meaning water must flow through the soil to reach the subsurface pipe drains. This conceptual model focuses on the subsurface only and does not include artificial surface drainage.
Because studies (Williams and McAfee, 2021; Gaillot and others, 2023) have shown the importance of antecedent moisture conditions on how subsurface agricultural drainage affects downstream flow, three scenarios, saturated, dry, and winter conditions, are examined. In the midwestern United States, dry conditions are most likely to occur during the growing season in the summer months, whereas the saturated conditions tend to occur outside the growing season in early spring and late fall; however, these conditions can occur any time of year and will be dependent on whether drainage, surface or subsurface, is present. These three scenarios consider soil moisture extremes and show how these moisture conditions can alter how subsurface agricultural drainage systems affect streamflow.
Subsurface Agricultural Drainage Conceptual Model Under Saturated Conditions
Under saturated conditions the conceptual model has a water table close to or at the ground surface and high soil moisture content in the unsaturated zone (figs. 5B and 5C). Surface ponding in depressions or overland flow may occur if the water table intersects the ground surface (fig. 5C). When the water table is above the subsurface pipe drains, the water will flow continuously through the system. In this situation, flow predominately occurs as matrix flow that is controlled by soil permeability (Gaillot and others, 2023).
When a storm event occurs, the predominance of pre-event water produces more surface runoff and runoff from subsurface drains. At the beginning of a storm event, the saturated zone will continue to rise and surface runoff will occur. The increased pressure on pre-event water in the subsurface leads to increasing discharge from subsurface drains. Event water is transferred to the subsurface drains through macropores (Van Stempvoort and others, 2021; Gaillot and others, 2023). As the storm continues, the saturated zone will continue to rise until it intersects the ground surface, and then most event water will be conveyed through overland flow. As pre-event water is drained from the system, the proportion of event water in subsurface drain increases (Gaillot and others, 2023). At the end of the event, the subsurface will continue to drain until pre-event conditions return.
Subsurface Agricultural Drainage Conceptual Model Under Dry Conditions
Under dry conditions the saturated zone in the conceptual model will be low, close to, or below subsurface drainage, with low soil moisture content in the unsaturated zone (fig. 5A). The soil at the surface may crack due to the dry conditions. There is no overland flow or discharge from subsurface drains.
When a storm event occurs with these antecedent conditions, all water that flows through the subsurface agricultural drainage system will be predominately event water. Macropores will transport event water directly to subsurface drains, and a saturated zone will begin to form (Van Stempvoort and others, 2021; Gaillot and others, 2023). Over the course of the storm, the saturated zone will continue to rise. At the end of the storm, both surface runoff and subsurface drain runoff will stop, and the saturated zone will return to pre-event conditions. Because of the lack of pre-event water, the total volume of water drained through subsurface drains is much less than with saturated antecedent conditions (Gaillot and others, 2023).
Subsurface Agricultural Drainage Under Winter Conditions
In cold regions, such as the Great Lakes and northern prairie regions of North America, seasonal considerations are important for understanding flow from subsurface drainage. These considerations include the degree to which soils are frozen, and the degree to which macropore flow, snowmelt, rain on snow, and runoff exists and infiltrates or runs over partially frozen or frozen soil (Mohammed and others, 2018; Kompanizare and others, 2023). Observations and simulation results from the Cold Regions Hydrological Model show that flow from subsurface agricultural drainage systems can happen during the winter because of a seasonal increase in the groundwater table and soil water (Kompanizare and others, 2023). Observations in southern Ontario show that subsurface drainage flows occurred during snowmelt events as evidenced by synchrony between snow water equivalent decrease and subsurface drainage flow (Kompanizare and others, 2023). Field observations of flow through subsurface drains in central Michigan and northern Ohio also indicated flow occurred at times throughout the winter months (Merriman and others, 2018a, 2018b). Additional studies in cold regions have shown that macropores enhance hydraulic conductivity in frozen soil, channel snowmelt to groundwater, and have pipe-like snowmelt infiltration to deeper soil layers (Mohammed and others, 2018).
A study of the infiltration of snowmelt into frozen, uncracked prairie soils in Canada determined that soil texture and land use were less important than the moisture regime at the time of the melt; infiltration is directly related to the “effective” or “air-filled porosity of the zone of infiltration” (Granger and others, 1984). Canadian Prairie soils were divided into three categories of infiltration: unlimited, limited, and restricted. Snowmelt infiltration can be unlimited in severely cracked soils, which is common in heavy clays, under dry antecedent conditions. Infiltration is limited in uncracked soils without an impervious layer in the zone of infiltration. Infiltration is restricted by an impervious ice layer at the soil surface or within the zone of infiltration (Granger and others, 1984). These complexities related to snowmelt and snow exemplify difficulties in attributed increases or decreases in runoff to subsurface drains for snowmelt-driven flooding. The contribution of subsurface drainage is dependent on antecedent moisture conditions, winter temperatures that affect the depth and degree of frost in the soil, and the speed of the snowmelt.
Limitations of Conceptual Model
These conceptual models were developed to illustrate the various hydrologic processes that can determine subsurface agricultural drainages’ effect on downstream flow, including changes in magnitude, volume, and timing, and highlight important factors, such as antecedent moisture conditions and storm characteristics that can alter these effects (fig. 5). It does not consider all scenarios, especially those related to other land-use practices and surface terrain. For example, the presence of artificial surface drainage, such as ditches, may limit the effects from subsurface drainage because event water will be more efficiently removed by surface drainage (Robinson and Rycroft, 1999). In addition, the presence of surface depressions, either artificial or natural, will allow more event water to infiltrate and prevent overland flow, which may amplify the effects of subsurface drainage. These conceptual models may be used as a communication tool to explain how subsurface drainage systems can affect downstream flow. These effects are expected to vary by site and season, with compounding influences from subsurface agricultural drainage design, soil conditions, including antecedent moisture conditions and changes in soil texture that may occur seasonally, precipitation characteristics, and land conditions (for example, topography and agricultural land-use practices).
Subsurface Agricultural Drainage’s Effects on Downstream Flow
The installation of subsurface agricultural drainage alters water storage patterns and streamflow characteristics by changing hydrologic connectivity of the subsurface. However, the effects are dependent on complex interactions among subsurface drain design, surface drainage and storage, precipitation, soil type and conditions, and land use/land cover. In addition, literature on subsurface agricultural drainage shows how the downstream effects can vary widely at different scales and over different time periods (Robinson and Rycroft, 1999; Schilling and Helmers, 2008; Blann and others, 2009). Because of these complex relationships, confounding variables, and lack of necessary data, separating out the individual effects that subsurface drainage has on streamflow experimentally is difficult but may be possible theoretically. Using the conceptual model as a starting point, how subsurface drainage could affect streamflow characteristics under different scenarios and variables, such as soil conditions and climate, is further investigated.
Literature that examined subsurface agricultural drainages’ effect on three streamflow characteristics—peak streamflow, non-event flow (in other words, low flow), and total flow—was compiled. This study will focus on the effects of installing subsurface drainage on land already developed for agricultural use, not the effects of cultivating natural land, and make the same assumptions for subsurface agricultural drainage design for the conceptual model. The type of study (experimental or simulated), the spatial and temporal scale of the study, relative details that may influence the effect subsurface agricultural drainage has on the streamflow characteristics, and the main results of the study are provided in table 2. The information in table 2 and the conceptual model discussed in the previous section may be useful to demonstrate how subsurface agricultural drainage may alter downstream flow.
Table 2.
Various studies that examine the effect of subsurface agricultural drainage on peak flow, non-event flow, and total flow.[km2, square kilometer; NA, not applicable; m, meter]
| Study | Study type | Spatial scale | Temporal scale | Soil type | Drain spacing | Drain depth | Peak streamflow | Non-event streamflow | Total streamflow |
|---|---|---|---|---|---|---|---|---|---|
| Schilling and others (2012) | Model | Walnut Creek watershed (52 km2) | Varied | Loess/till | NA | 0.3 m–2.7 m | Not discussed | Increased base-flow fraction | Not discussed |
| King and others (2014) | Experimental | Watershed (492 km2) | 6 years | Silt loam/clay loam | 15 m | 1 m | Not discussed | Annual tile discharge is similar to the total base-flow volume in the watershed. | Tile drainage accounted for 41 percent of the annual total watershed discharge. |
| Schilling and Helmers (2008) | Model | Watershed (5,130 hectare) | 7 years | Webster soil (fine and loamy/ mixed, superactive/ mesic) | 24 m | 1.06 m | Not discussed | Threefold increase in base flow in drained simulation compared to undrained | Average annual streamflow was similar between drained and undrained simulations. |
| Schilling and Helmers (2008) | Experimental | Walnut Creek watershed drained (5,130 hectare) | 5 years (1994–1999) | Des Moines lobe (till) | NA | NA | Not discussed | Increased base flow was observed in portions of the watershed with a greater proportion of subsurface drainage. | Increased total streamflow was observed in portions of the watershed with a greater proportion of subsurface drainage. |
| Rahman and others (2014) | Model | Upper Red River of the North Basin, a 17,000-km2 drainage area | 20 years | Varied (clay and silt and till) | Not used | 1.18 m (calibrated value) | Model indicated extensive subsurface drainage increased the magnitude of smaller peak flows, whereas it decreased the magnitude of larger peak flows. | Not discussed | The addition of tile drainage increased water yield (sum of surface and subsurface runoffs) by 10 percent. |
| Sloan and others (2016) | Model | Field-scale | 30 years (1981–2010) | Varied (silty clay loam, loam, silt loam, clay, silt, loamy sand) | 20 m (5 –50 m) | 1 m | No difference in annual peak flow between drained and undrained. Effect on peak flow was dependent on the size of the rainfall event (increasing or decreasing for small events dependent on antecedent moisture conditions, decreasing for medium events, minimal effect at large events). The threshold rainfall, which resulted in minimal effects was dependent on soil type. | Increased low flows in low hydraulic conductivity soils | Not discussed |
| Valayamkunnath and others (2022) | Model | Upper Mississippi River Basin and Ohio River Basin | 6 years (2013–2019) | Varied | 10 m–60 m | 1.2 m | Adding tile drainage to model increased streamflow peaks by 14 percent. | Adding tile drainage to model increased base flow by 11 percent. | Adding tile drainage to model increased volume by 2.3 percent. |
Effect on Magnitude of Peak Streamflow
The addition of subsurface agricultural drains may alter the magnitude of peak streamflow after a storm event at the field-scale, depending on the precipitation event and soil conditions (Skaggs and others, 1994; Robinson and Rycroft, 1999). Peak streamflow is the highest magnitude flow occurring within a set period, typically measured annually or for a single precipitation event. The conceptual framework can be used to look at the effects subsurface agricultural drainage has on peak streamflow during one precipitation event at the field-scale. The field-scale is defined as streamflow from a stream or ditch that drains a small agricultural field, which includes outflow from the subsurface agricultural drainage system, surface runoff, and lateral flow.
Subsurface agricultural drainage may affect the magnitude of peak streamflow by converting surface runoff from a storm event to subsurface runoff. This ability is controlled by infiltration and the amount of water the subsurface can hold or the soil water storage capacity (fig. 7).
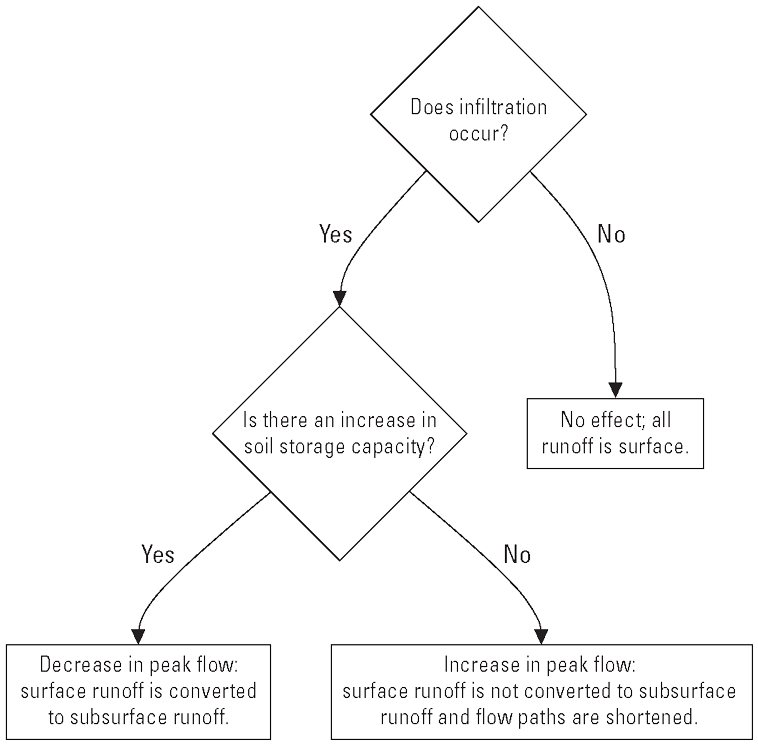
Diagram showing effects of subsurface agricultural drainage on downstream peak flows at the field-scale after one storm event.
Soil infiltration is the movement of water through the unsaturated zone of the subsurface. The rate of soil infiltration depends on multiple factors; the key factors controlling infiltration are the amount of precipitation and its intensity and duration. Precipitation intensity is a rate, such as inches per hour, whereas precipitation duration is the length of the precipitation event (U.S. Geological Survey, 2018). Additional factors, such as soil characteristics, soil moisture, land cover, and land slope, also play a role. Soil characteristics, such as porosity and permeability, control how much water can flow through the subsurface and at what rate. Soil moisture controls how much additional water the subsurface can hold. Land cover and slope control the amount of time runoff is in contact with soil. Terrain with vegetation and a shallow slope slows the movement of water over the surface increasing infiltration. Most importantly, soil infiltration is not constant throughout a precipitation event. If the rate of precipitation exceeds the infiltration rate, ponding and surface runoff may occur reducing the movement of water through the subsurface.
Soil storage capacity is the amount of water that can be held within the unsaturated zone. This amount is dependent on the soil type, porosity of the soil, thickness of unsaturated zone, and the antecedent soil moisture. Installing agricultural subsurface drains in low permeability soils, such as clays, increases the soil storage by allowing water to drain through the system faster (fig. 3). Regardless of the soil type in which the subsurface agricultural drainage systems are installed, the drains provide a preferential flow path for soil water and decrease the time it takes for subsurface runoff to reach surface water outlets. However, these times are still slower than flow over the surface.
If infiltration cannot occur, or is greatly reduced, subsurface drainage may have little to no effect on peak streamflow (fig. 7). Examples of conditions in which infiltration is reduced or prevented include frozen or snow-covered ground, precipitation occurring at a rate that is greater than the infiltration rate, or periods when the subsurface drainage system has reached capacity. This is further complicated by the fact that the presence of subsurface agricultural drainage may affect conditions that control infiltration over the long-term. For example, the presence of subsurface agricultural drainage may increase the infiltration rate by increasing soil storage capacity.
Because of the relation between infiltration and precipitation intensity, subsurface agricultural drainage may have minimal effect on peak flow for storm events with high precipitation intensity (when infiltration excess overland flow occurs). Sloan and others (2016) concluded that subsurface agricultural drainage has a minimal effect on peak flow greater than a threshold storm size. Typically, peak streamflow is reported as an annual value. However, annual peak streamflow corresponds to different precipitation intensity events, and many of these events may be greater than the precipitation intensity threshold where subsurface drainage will have an effect. For this reason, looking at peak streamflow around one precipitation event, instead of annually, can tell more about how subsurface agricultural drainage affects downstream flow.
If infiltration can occur and soil water storage capacity increases after the installation of subsurface agricultural drainage, surface runoff is converted to subsurface runoff and peak streamflow may decrease (fig. 7). Runoff that flows through the subsurface takes longer to reach the discharge point, compared to surface runoff (Robinson and Rycroft, 1999). By slowing down and dispersing runoff, peak streamflow magnitude may be reduced by preventing water from reaching a discharge point all at once. An increase in soil water storage capacity is typically observed when subsurface drainage is installed in low permeability soils, such as clays. Refer to hydrologic soil types D, A and D, B and D, and C and D in figure 3 where group D soils, typically characterized by greater than 40 percent clay, have high runoff potential when thoroughly wetted as water movement through the soil is restricted or very restricted (U.S. Department of Agriculture Natural Resources Conservation Service, 2009).
If soil water storage remains unchanged, the proportion of surface runoff and subsurface runoff will remain the same before and after the installation of subsurface agricultural drainage, and peak streamflow may increase (fig. 7). The addition of subsurface agricultural drainage will instead decrease the travel time it takes subsurface runoff to reach the discharge point shortening the amount of time the water is moving through the system and increasing the magnitude of peak streamflow. This may occur if subsurface agricultural drainage is installed in more permeable soils, such as sands, which are not frequently saturated (Robinson and Rycroft, 1999).
The effect of subsurface agricultural drainage on peak streamflow can differ at the catchment-scale compared to the field-scale (Robinson and Rycroft, 1999; Sloan and others, 2017). Moving to a smaller scale requires the addition of spatial and temporal components to the field-scale conceptual framework. The effects are dependent on what else occurs in the catchment as the parcel of water from the field-scale model moves through the catchment. The effects are also dependent on the density of subsurface agricultural drainage systems in the catchment, their relative location to each other, and the point where the streamflow characteristics are measured. These spatial and temporal components may magnify or diminish the effects of subsurface agricultural drainage on peak flow.
The dilution and lagging of field-scale effects, called the distribution effect (Robinson and Rycroft, 1999), can change how subsurface drainage effects peak flow. For example, if the rate at which water moves through the drained field is faster than the rest of the catchment, the water parcel will reach the measuring point before most of the water in the catchment, which could decrease peak streamflow at the catchment-scale, even if peak streamflow increased at the field-scale.
The effects of subsurface agricultural drainage may be enhanced or diminished based on the placement within the catchment. Based on simulated results, Sloan and others (2017) determined that drainage systems that are clustered together close to the point of measurement enhance the effect on peak streamflow compared to systems located farther away from the point of measurement. Sloan and others (2017) also concluded that effects from subsurface agricultural drains were reduced at the basin scale compared to the field-scale.
Previous studies have indicated that subsurface drainage may increase, decrease, or have minimal effect on peak streamflow (Robinson and Rycroft, 1999; Blann and others, 2009; Rahman and others, 2014; Sloan and others, 2016). At the field-scale, the effect may depend on soil conditions (Robinson and Rycroft, 1999; Blann and others, 2009), precipitation intensity (Sloan and others, 2016), or flow volume (Rahman and others, 2014). At the catchment-scale, the effects of subsurface agricultural drainage may be diminished or enhanced causing streamflow characteristics at the catchment-scale to behave differently than at the field-scale (Schilling and Helmers, 2008; Sloan and others, 2017). Studies have shown that subsurface agricultural drainage may have minimal effect on annual peak streamflow, which may be because annual peak streamflows correspond with events that have high precipitation intensity (Rahman and others, 2014; Sloan and others, 2016).
Effect on Magnitude of Non-Event Streamflow
By increasing hydrologic connectivity of a catchment, subsurface agricultural drainage may increase non-event flow or the streamflow between storm events, typically dependent on lateral flow through the subsurface and groundwater. In the conceptual model at the field-scale, discharge from subsurface drains is continuous under saturated conditions. In the Midwest, these conditions are typically seen in the early spring and late fall, outside of the growing season when crops have not yet been planted or have been harvested. During this time, there is a reduction in evapotranspiration allowing the saturation zone to move closer to the surface (Gaillot and others, 2023). However, when looking at increases in non-event flow at the catchment-scale, it is difficult to pick out the effects that subsurface agricultural drainage has on non-event flow due to conflicting factors that may also increase non-event flow at the catchment-scale. In addition, less research has been done on subsurface agricultural drainage effects on non-event flow, compared to event flow.
Studies use both simulated and field observations to provide evidence that the installation of subsurface agricultural drainage can increase baseflow at both the field and watershed scales (Schilling and Libra, 2003; Schilling and others, 2008; Schilling and others, 2012; King and others, 2014; Sloan and others, 2017; Valayamkunnath and others, 2022). Effects of subsurface agricultural drainage on non-event flow may be related to soil type, and soil moisture conditions, with the installation of subsurface drains in soils with low hydraulic conductivity increasing low flows (Sloan and others, 2016).
Effect on Total Volume of Streamflow
Theoretically, by diverting water from groundwater recharge or by reducing water available for evapotranspiration, subsurface agricultural drainage may increase the total volume of streamflow. Total volume streamflow is the total cumulative amount of water that moves through a system, typically measured on an annual scale. By creating a preferential flow path to a surface outlet from soil water, water is being diverted from long-term groundwater storage. It is estimated, based on a study of northwest Minnesota, that only a small percentage (less than 1 to 3 percent) of water is diverted to deep groundwater recharge (Minnesota Groundwater Association, 2018). However, systems installed below the natural water table, and that continuously drain regardless of precipitation events or season, have a greater effect on the groundwater recharge. If a drainage system is diverting water from a perennial aquifer, discharge from that system will never be zero and will have relativity constant lower discharge values (Dolezal and others, 2001). In addition, subsurface agricultural drainage systems may reduce the water available for evapotranspiration by facilitating the movement of water through the subsurface, which prevents surface water ponding, thereby increasing total annual streamflow (fig. 8).
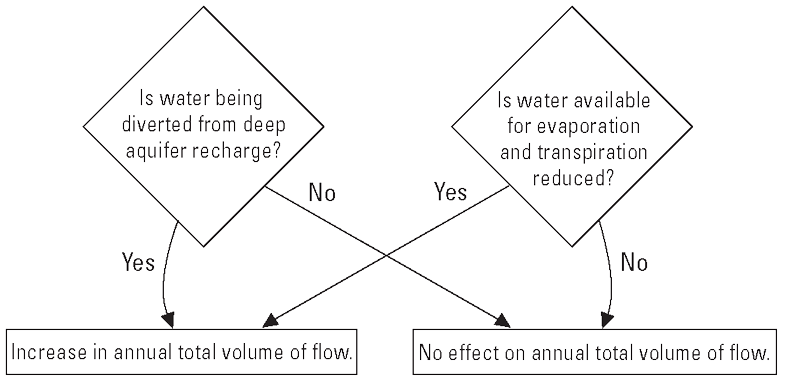
Diagram showing effects of subsurface agricultural drainage on downstream annual total flow at the catchment-scale.
The effects of subsurface agricultural drainage on annual total flow vary across literature. Field observations indicate that total annual streamflow is greater in watersheds heavily drained with subsurface agricultural drainage (Schilling and Helmers, 2008). Schilling and Helmers (2008) used DRAINMOD, a common field-scale deterministic hydrologic model, to compare two end-points, drained and undrained, and over the 7-year simulation time period their average annual streamflows were similar. Whereas other models have determined a small increase in total volume (Valayamkunnath and others, 2022), simulated results also have conflicting results for the effect of subsurface agricultural drainage on evapotranspiration. Some show no change (Rahman and others, 2014), and others show evapotranspiration is reduced (Valayamkunnath and others, 2022).
Considerations for the Future
Subsurface agricultural drainage is more apt to occur in parts of the study area with greater precipitation. Changes in precipitation amount, frequency, and timing affect the need for and performance of subsurface agricultural drainage. When discussing changes in precipitation, the terms intense, heavy, and extreme precipitation are often used without definition and interchangeably. For clarity in this study, intensity of precipitation is a rate, such as inches per hour (U.S. Geological Survey, 2018). An increase in precipitation intensity is an increase in the rate of precipitation, whereas an increase in intense precipitation may be an increase in frequency of events at or greater than a given rate. Heavy precipitation is an amount of liquid or solid precipitation that substantially exceeds what is considered normal for a location and season (U.S. Environmental Protection Agency, 2023). An increase in heavy precipitation may or may not be associated with an increase in annual or seasonal total precipitation. Extreme precipitation in some cases is used interchangeably with heavy precipitation (U.S. Environmental Protection Agency, 2023). A particular location may have a definition of extreme precipitation, such as days with precipitation of 2 inches or more (Frankson and others, 2022g). There also are definitions for national or international studies. For example, the U.S. Global Change Research Program defines extreme precipitation as days with precipitation in the top 1 percent of all days with precipitation (U.S. Global Change Research Program, [undated]). Additional definitions of extreme precipitation exist, such as days with precipitation in the top 5 percent of all days in a year, and the definition selected may affect analysis and scientific interpretations (Pendergrass, 2018).
The Fifth National Climate Assessment states that rainfall has become more extreme in recent decades, especially east of the Rockies (Marvel and others, 2023) and that heavier rainfall events are expected to increase across the Nation (Payton and others, 2023). States in this study area are projected to have increases in precipitation extremes (Frankson and Kunkel, 2022; Frankson and others, 2022a, b, c, d, e, f, g; Runkle and others, 2022). This occurs because precipitation from extreme events almost doubles per degree of warming. This change is mainly observed in increases in frequency of extreme events, as opposed to intensity changes (Myhre and others, 2019). This shift toward more of total precipitation coming from extreme events is seen in observations and climate models. Myhre and others (2019) predict that “if historical trends continue, the most intense precipitation events observed today are likely to almost double in occurrence for each degree of further global warming. Changes to extreme precipitation of this magnitude are dramatically stronger than the more widely communicated changes to global mean precipitation” (Myhre and others, 2019, p. 1).
For parts of the study area, subsurface drainage has been an agricultural adaptation strategy in response to increased rainfall and excess water in farm fields (Knapp and others, 2023). The precipitation changes already experienced and likely to happen in the future may increase infiltration excess overland flow and increase flood risk regardless of the presence or absence of subsurface agricultural drainage. Those unfamiliar with soil-water interaction and hydrology may point to subsurface agricultural drainage as exacerbating flood risk in these areas. This exemplifies why it is important to have a general framework for conceptualizing the mechanisms of subsurface agricultural drainage and water movement through the environment. At the same time, warming is projected to increase evapotranspiration, which may lead to drier soils later in the growing season (Knapp and others, 2023), and drought risk is projected to increase for the Northern Great Plains (including the study area States of Montana, North Dakota, and South Dakota) and the Midwest (including the study area States of Minnesota, Iowa, Missouri, Wisconsin, Illinois, and Michigan) (Knapp and others, 2023; Wilson and others, 2023). Theories and application of subsurface agricultural drainage may evolve to address the effects of changing climate.
Summary
Understanding streamflow characteristics, such as peak streamflow, non-event streamflow, and total streamflow, is essential to water resource management applications. Evidence supports the hypothesis that changing trends in these streamflow characteristics are due to long-term persistent regional hydroclimatic changes in precipitation and evapotranspiration, and imbalances between them, that occur within the study area. However, changes in land use and agricultural practices, such as the installation of subsurface agricultural drainage, may also contribute to these trends. Because of the complex interactions between subsurface agricultural drains, precipitation, local soil conditions, and land management practices, subsurface drainage affects downstream flow in a variety of ways. Current literature on the subsurface agricultural drainage conceptual models that have been developed and the effects these drains have on downstream flows have been compiled and summarized to better understand how streamflow characteristics may be altered.
Subsurface agricultural drainage may improve crop health and access to fields at critical planting and harvesting times. One major obstacle in studying how subsurface agricultural drainage affects downstream flow is the lack of data on where subsurface drainage systems are located and details on their design; data coverage is limited both spatially and temporally. Most subsurface agricultural drainage databases only include the presence or absence of subsurface drainage and no additional information about the infrastructure design. In addition, design of these systems using new technologies, such as controlled systems and subirrigation, are increasing in popularity.
Under saturated conditions, when a storm event occurs, the predominance of pre-event water produces more runoff, including surface runoff and runoff from subsurface drains. Under dry conditions, when a storm event occurs, all water that flows through the subsurface agricultural drainage system will be predominately event water. Under winter conditions, flow from subsurface agricultural drainage systems may happen because of a seasonal increase in the groundwater table and soil water. Snowmelt infiltration may be unlimited in severely cracked soils, limited in uncracked soils without an impervious layer in the zone of infiltration, and restricted by an impervious ice layer at the soil surface or within the zone of infiltration. The contribution of subsurface agricultural drainage in winter or during snowmelt depends on antecedent moisture conditions, winter temperatures that affect the depth and degree of frost in the soil, and the speed of the snowmelt.
The effectiveness of a subsurface agricultural drainage system at moving water through the subsurface is related to precipitation timing and intensity, surface drainage, land management practices, and antecedent soil conditions. The system’s effect on downstream flow, therefore, has the potential to vary greatly seasonally and by storm events. Not all systems are expected to have the same effects. Subsurface agricultural drainage can affect the magnitude of peak streamflow by converting surface runoff from a storm event to subsurface runoff. This ability is controlled by infiltration and the amount of water the subsurface can hold or the soil water storage capacity. Subsurface agricultural drainages’ effect on peak streamflow can differ at the field-scale as compared to the catchment-scale. The effects are dependent on what else occurs in the catchment as the parcel of water from the field-scale model moves through the catchment.
By increasing hydrologic connectivity of a catchment, subsurface agricultural drainage may increase non-event flow or the streamflow among storm events, typically dependent on lateral flow through the subsurface and groundwater. Effects on non-event flow may be related to soil type, and soil moisture conditions, with the installation of subsurface drains in soils with low hydraulic conductivity increasing low streamflow.
Theoretically, by diverting water from groundwater recharge or by reducing water available for evapotranspiration, subsurface agricultural drainage may increase the total volume of streamflow. By creating a preferential flow path to a surface outlet from soil water, water is being diverted from long-term groundwater storage. By facilitating the movement of water through the subsurface, subsurface agricultural drainage can reduce the water available for evapotranspiration and thereby increase total annual flow. Simulated studies show no change or very small increases in total streamflow after the installation of subsurface agricultural drainage, whereas experimental studies that used only field observations show an increase.
Subsurface agricultural drainage is more apt to occur in parts of the study area with greater precipitation. Changes in precipitation amount, frequency, and timing affect the need for and performance of subsurface agricultural drainage. States in the study area (Illinois, Iowa, Michigan, Minnesota, Missouri, Montana, North Dakota, South Dakota, and Wisconsin) are projected to have increases in precipitation extremes. These precipitation changes may result in the expanded use of subsurface agricultural drainage. In addition, changes in precipitation characteristics may increase infiltration excess overland flow thereby increasing flood risk regardless of the presence or absence of subsurface agricultural drainage.
References Cited
Ale, S., and Bowling, L.C., 2010, Estimation of potentially subsurface drained areas in Indiana and their influence on streamflow pattern: National Water Conference, Hilton Head, South Carolina, accessed June 23, 2014, at http://www.usawaterquality.org/conferences/2010/PosterPDF/Ale.pdf.
American Society of Agricultural and Biological Engineering [ASABE], 2015, Design and construction of subsurface drainage systems on agricultural lands in humid areas: American Society of Agricultural and Biological Engineers EP260.5, p. 1–30, accessed February 6, 2024, at https://elibrary.asabe.org/abstract.asp?aid=45405&t=2&redir=&redirType=.
Augeard, B., Nédélec, Y., Birgand, F., Chaumont, C., Ansart, P., and Kao, C.M., 2008, Effect of a nonlinear runoff response on flood statistical properties—The case of a tile-drained watershed, in Abesser, C., Wagener, T, Nuetzmann, G., eds., Groundwater-surface water interaction—Process understanding, conceptualization and modelling—Proceedings of International Union of Geodesy and Geophysics XXIV General Assemble—A new focus on integrated analysis of groundwater/surface water systems, Perugia, Italy, July 11–13, 2007: IAHS Press, Wallingford, United Kingdom, accessed February 27, 2024, at https://www.researchgate.net/publication/281663053_Effect_of_a_nonlinear_runoff_response_on_flood_statistical_properties_The_case_of_a_tile-drained_wa tershed.
Barth, N.A., Ryberg, K.R., Gregory, A., and Blum, A.G., 2022, Introduction to attribution of monotonic trends and change points in peak streamflow across the conterminous United States using a multiple working hypotheses framework, 1941–2015 and 1966–2015, chap. A of Ryberg, K.R., ed., Attribution of monotonic trends and change points in peak streamflow across the conterminous United States using a multiple working hypotheses framework, 1941–2015 and 1966–2015: U.S. Geological Survey Professional Paper 1869, p. A1–A29, accessed October 4, 2022, at https://doi.org/10.3133/pp1869.
Blann, K.L., Anderson, J.L., Sands, G.R., and Vondracek, B., 2009, Effects of agricultural drainage on aquatic ecosystems—A review: Critical Reviews in Environmental Science and Technology, v. 39, no. 11, p. 909–1001, accessed January 9, 2023, at https://doi.org/10.1080/10643380801977966.
Blasch, K.W., and Bryson, J.R., 2007, Distinguishing sources of ground water recharge by using δ2H and δ18O: Groundwater, v. 45, no. 3, p. 294–308, accessed February 16, 2024, at https://doi.org/10.1111/j.1745-6584.2006.00289.x.
Brandel, C., 2016, Implementing a multi-purpose drainage management plan, in 2016 10th International Drainage Symposium Conference, Minneapolis, Minn., September 6–9, 2016: American Society of Agricultural and Biological Engineers, p. 1–7, accessed April 25, 2023, at https://doi.org/10.13031/IDS.20162493344.
Brown, D.C., 2013, Applying a model to predict the location of land drained by subsurface drainage systems in central Minnesota: Saint Mary’s University of Central Services Press, Papers in Resource Analysis, v. 11, 14 p., accessed March, 8, 2023, at https://gis.smumn.edu/GradProjects/BrownC.pdf.
Cho, E., Jacobs, J.M., Jia, X., and Kraatz, S., 2019a, Annual subsurface drainage map (Red River of the North Basin; Cho et al., 2019): HydroShare, accessed February 15, 2023, at http://www.hydroshare.org/resource/f2f7a9cfbae1451f85b5c0dc3938b9a1.
Cho, E., Jacobs, J.M., Jia, X., and Kraatz, S., 2019b, Identifying subsurface drainage using satellite big data and machine learning via Google Earth Engine: Water Resources Research, v. 55, no. 10, p. 8028–8045, accessed February 15, 2023, at https://doi.org/10.1029/2019WR024892.
Clark, I.D., and Fritz, P., 1997, Environmental isotopes in hydrogeology: CRC Press, Boca Raton, Florida, 342 p., accessed February 16, 2024, at https://doi.org/10.1201/9781482242911.
Clark, F.E., and Kemper, W.D., 2015, Microbial activity in relation to soil water and soil aeration, chap. 25 of Hagan, R.M., Haise, H.R., and Edminster, T.W., eds., Irrigation of agricultural lands: American Society of Agronomy, Agronomy Monographs, v. 11, p. 472–480, accessed July 26, 2023, at https://doi.org/10.2134/agronmonogr11.c26.
Dolezal, F., Kulhavy, Z., Soukup, M., and Kodesova, R., 2001, Hydrology of tile drainage runoff: Physics and Chemistry of the Earth, Part B—Hydrology, Oceans and Atmosphere, v. 26, nos. 7–8, p. 623–627, accessed February 27, 2023, at https://doi.org/10.1016/S1464-1909(01)00059-4.
Dudley, R.W., Archfield, S.A., Hodgkins, G.A., Renard, B., and Ryberg, K.R., 2018, Peak-streamflow trends and change-points and basin characteristics for 2,683 U.S. Geological Survey streamgages in the conterminous U.S.: U.S. Geological Survey data release, accessed June 6, 2019, at https://doi.org/10.5066/P9AEGXY0.
Falcone, J.A., 2017, Watershed characteristics for study sites of the Surface Water Trends project, National Water Quality Program: U.S. Geological Survey data release, accessed March 14, 2023, at https://doi.org/10.5066/F7TX3CKP.
Finocchiaro R., 2014a, North Dakota drainage tile permits: U.S. Geological Survey Northern Prairie Wildlife Research Center, ScienceBase catalog data release, accessed November 21, 2022, at https://www.sciencebase.gov/catalog/item/5616ae3ae4b0ba4884c61556?community=Northern+Prairie+Wildlife+Research+Center.
Finocchiaro, R., 2014b, South Dakota drainage tile permits: U.S. Geological Survey Northern Prairie Wildlife Research Center, ScienceBase catalog data release, accessed November 21, 2022, at https://www.sciencebase.gov/catalog/item/5616ae79e4b0ba4884c61559?community=Northern+Prairie+Wildlife+Research+Center.
Frankson, R., and Kunkel, K.E., 2022, Michigan—NOAA National Centers for Environmental Information, State Climate Summaries 2022, NOAA Technical Report NESDIS 150–MI: National Oceanic and Atmospheric Administration, 4 p., accessed June 27, 2023, at https://statesummaries.ncics.org/downloads/Michigan-StateClimateSummary2022.pdf.
Frankson, R., Kunkel, K.E., Champion, S.M., Easterling, D.R., and Jencso, K., 2022a, Montana—NOAA National Centers for Environmental Information, State Climate Summaries 2022, NOAA Technical Report NESDIS 150–MT: National Oceanic and Atmospheric Administration, 5 p., accessed January 31, 2022, at https://statesummaries.ncics.org/chapter/mt/.
Frankson, R., Kunkel, K.E., Champion, S.M., Easterling, D.R., Umphlett, N.A., and Stiles, C.J., 2022b, South Dakota—NOAA National Centers for Environmental Administration, State Climate Summaries 2022, NOAA Technical Report NESDIS 150–SD, 5 p., accessed January 31, 2022, at https://statesummaries.ncics.org/chapter/sd/.
Frankson, R., Kunkel, K.E., Champion, S.M., and Runkle, J., 2022c, Iowa—NOAA National Centers for Environmental Information, State Climate Summaries 2022, Technical Report NESDIS 150–IA: National Oceanic and Atmospheric Administration, accessed March 23, 2022, at https://statesummaries.ncics.org/chapter/ia/.
Frankson, R., Kunkel, K.E., Champion, S.M., and Stewart, B.C., 2022d, Missouri—NOAA National Centers for Environmental Information, State Climate Summaries 2022, Technical Report NESDIS 150–MO: National Oceanic and Atmospheric Administration, 5 p., accessed March 18, 2023, at https://statesummaries.ncics.org/downloads/Missouri-StateClimateSummary2022.pdf.
Frankson, R., Kunkel, K.E., Champion, S.M., Stewart, B.C., Easterling, D.R., Hall, B., Angel, J.R., and Timlin, M.S., 2022e, Illinois—NOAA National Centers for Environmental Information, State Climate Summaries 2022, Technical Report NESDIS 150–IL: National Oceanic and Atmospheric Administration, 6 p., accessed March 11, 2021, at https://statesummaries.ncics.org/downloads/Illinois-StateClimateSummary2022.pdf.
Frankson, R., Kunkel, K.E., Champion, S.M., and Sun, L., 2022f, Wisconsin—NOAA National Centers for Environmental Information, State Climate Summaries 2022, Technical Report NESDIS 150–WI: National Oceanic and Atmospheric Administration, 6 p., accessed March 18, 2023, at https://statesummaries.ncics.org/chapter/wi/.
Frankson, R., Kunkel, K.E., Stevenes, L.E., Easterling, D.R., Shulski, M., Akyuz, A., Umphlett, N.A., and Stiles, C.J., 2022g, North Dakota—NOAA National Centers for Environmental Information, State Climate Summaries 2022, Technical Report NESDIS 150–ND: National Oceanic and Atmospheric Administration, 5 p., accessed January 31, 2022, at https://statesummaries.ncics.org/chapter/nd/.
Gaillot, A., Delbart, C., Salvador-Blanes, S., Vanhooydonck, P., Desmet, M., Grangeon, T., Noret, A., and Cerdan, O., 2023, Analysis of seasonal variation in the hydrological behaviour of a field combining surface and tile drainage: Agricultural Water Management, v. 285, 108329, accessed December 12, 2023, at https://doi.org/10.1016/j.agwat.2023.108329.
Granger, R.J., Gray, D.M., and Dyck, G.E., 1984, Snowmelt infiltration to frozen Prairie soils: Canadian Journal of Earth Sciences, v. 21, no. 6, p. 669–677, accessed December 19, 2023, at https://doi.org/10.1139/e84-073.
Hirsch, R.M., and Archfield, S.A., 2015, Flood trends—Not higher but more often: Nature Climate Change, v. 5, no. 3, p. 198–199, accessed December 22, 2020, at https://doi.org/10.1038/nclimate2551.
Hirsch, R.M., and Ryberg, K.R., 2012, Has the magnitude of floods across the USA changed with global CO2 levels?: Hydrological Sciences Journal, v. 57, no. 1, p. 1–9, accessed December 1, 2022, at https://doi.org/10.1080/02626667.2011.621895.
Hitz, M., and Cruse, R., 2008, Subsurface drainage in the Midwest: Iowa State University, Crop Adviser Institute, accessed December 19, 2023, at https://masters.agron.iastate.edu/files/hitzmark-cc.pdf.
Hodgkins, G.A., Dudley, R.W., Archfield, S.A., and Renard, B., 2019, Effects of climate, regulation, and urbanization on historical flood trends in the United States: Journal of Hydrology, v. 573, p. 697–709, accessed November 12, 2021, at https://doi.org/10.1016/j.jhydrol.2019.03.102.
Iowa Geological Survey, Department of Natural Resources, 2020, Drainage Districts in Iowa [vector digital data]: Iowa Department of Natural Resources, Geological Survey, Iowa City, Iowa, accessed December 10, 2024, at https://www.arcgis.com/home/item.html?id=fd42f39703d84dffb73c99dfcfc70c85.
Jaynes, D.B., and James, D.E., 2007, The extent of farm drainage in the United States, in Annual Meeting of the Soil and Water Conservation Society–USDA-ARS-NSTL, Saddlebrook Resort, Tampa, Florida, accessed December 3, 2024, at https://www.ars.usda.gov/ARSUserFiles/50301500/theextentoffarmdrainageintheunitedstates.pdf.
Kanwar, R.S., Baker, J.L., and Mukhtar, S., 1988, Excessive soil water effects at various stages of development on the growth and yield of corn: American Society of Agricultural and Biological Engineers, Transactions of the ASAE, v. 31, no. 1, p. 0133–0141, accessed April 25, 2023, at https://doi.org/10.13031/2013.30678.
Kelly, S.A., Takbiri, Z., Belmont, P., and Foufoula-Georgiou, E., 2017, Human amplified changes in precipitation-runoff patterns in large river basins of the Midwestern United States: Hydrology and Earth System Sciences, v. 21, no. 10, p. 5065–5088, accessed March 8, 2023, at https://doi.org/10.5194/hess-21-5065-2017.
King, K.W., Fausey, N.R., and Williams, M.R., 2014, Effect of subsurface drainage on streamflow in an agricultural headwater watershed: Journal of Hydrology, v. 519, part A, p. 438–445, accessed December 12, 2022, at https://doi.org/10.1016/j.jhydrol.2014.07.035.
Klaus, J., and McDonnell, J.J., 2013, Hydrograph separation using stable isotopes—Review and evaluation: Journal of Hydrology, v. 505, p. 47–64, accessed December 14, 2023, at https://doi.org/10.1016/j.jhydrol.2013.09.006.
Knapp, C.N., Kluck, D.R., Guntenspergen, G., Ahlering, M.A., Aimone, N.M., Bamzai-Dodson, A., Basche, A., Byron, R.G., Conroy-Ben, O., Haggerty, M.N., Haigh, T.R., Johnson, C., Mayes Boustead, B., Mueller, N.D., Ott, J.P., Paige, G.B., Ryberg, K.R., Schuurman, G.W., Tangen, S.G., 2023, 25. Northern Great Plains, chap. 25 of Crimmins, A.R., Avery, C.W., Easterling, D.R., Kunkel, K.E., Stewart, B.C., and Maycock, T.K. eds., Fifth National Climate Assessment: U.S. Global Change Research Program, Washington, D.C, accessed December 19, 2023, at https://doi.org/10.7930/NCA5.2023.CH25.
Kompanizare, M., Costa, D., Macrae, M., Pomeroy, J., and Petrone, R., 2023, Developing a tile drainage module for Cold Regions Hydrological Model—Lessons from a farm in Southern Ontario, Canada: EGUsphere, preprint posted March 3, 2023, v. 2023, p. 1–57, accessed December 19, 2023, at https://doi.org/10.5194/egusphere-2023-142.
Marvel, K., Su, W., Delgado, R., Aarons, S., Chatterjee, A., Garcia, M.E., Hausfather, Z., Hayhoe, K., Hence, D.A., Jewett, E.B., Robel, A., Singh, D., Tripati, A., and Vose, R.S., 2023, 2. Climate trends, chap. 2 in Crimmins, A.R., Avery, C.W., Easterling, D.R., Kunkel, K.E., Stewart, B.C., and Maycock, T.K. eds., Fifth National Climate Assessment: U.S. Global Change Research Program, Washington, D.C, accessed December 19, 2023, at https://doi.org/10.7930/NCA5.2023.CH2.
Merriman, K.R., Daggupati, P., Srinivasan, R., Toussant, C., Russell, A.M., and Hayhurst, B., 2018a, Assessing the impact of site-specific BMPs using a spatially explicit, field-scale SWAT model with edge-of-field and tile hydrology and water-quality data in the Eagle Creek watershed, Ohio: Water, v. 10, no. 10, p. 1299, accessed August 19, 2024, at https://doi.org/10.3390/w10101299.
Merriman, K.R., Russell, A.M., Rachol, C.M., Daggupati, P., Srinivasan, R., Hayhurst, B., and Stuntebeck, T., 2018b, Calibration of a field-scale soil and water assessment tool (SWAT) model with field placement of best management practices in Alger Creek, Michigan: Sustainability, v. 10, no. 3, p. 851, accessed August 19, 2024, at https://doi.org/10.3390/su10030851.
Minnesota Board of Water and Soil Resources, 2024, Drainage Records Modernization, accessed December 11, 2024, at https://bwsr.state.mn.us/drainage-records-modernization.
Minnesota Geospatial Information Office, 2024, Public Drainage Systems, Minnesota, accessed December 10, 2024, at https://gisdata.mn.gov/dataset/water-public-drainage-systems.
Minnesota Groundwater Association, 2018, Drain tiles and groundwater resources—Understanding the relations: Minnesota Groundwater Association, white paper 3, accessed February 27, 2023, accessed November 21, 2022, at https://mgwa.org/documents/whitepapers/Drain_Tiles_and_Groundwater_Resources.pdf.
Mohammed, A.A., Kurylyk, B.L., Cey, E.E., and Hayashi, M., 2018, Snowmelt infiltration and macropore flow in frozen soils—Overview, knowledge gaps, and a conceptual framework: Vadose Zone Journal, v. 17, no. 1, p. 1–15, accessed December 19, 2023, at https://doi.org/10.2136/vzj2018.04.0084.
Myhre, G., Alterskjær, K., Stjern, C.W., Hodnebrog, Ø., Marelle, L., Samset, B.H., Sillmann, J., Schaller, N., Fischer, E., Schulz, M., and Stohl, A., 2019, Frequency of extreme precipitation increases extensively with event rareness under global warming: Scientific Reports, v. 9, no. 1, article 16063, accessed March 19, 2023, at https://doi.org/10.1038/s41598-019-52277-4.
Nakagaki, N., Wieczorek, M.E., and Qi, S.L., 2016, Estimates of subsurface tile drainage extent for the conterminous United States, early 1990s: U.S. Geological Survey data release, accessed February 27, 2023, at https://doi.org/10.5066/F7RB72QS.
National Oceanic and Atmospheric Administration [NOAA] National Centers for Environmental Information, 2022, U.S. climate normals: National Oceanic Atmospheric Administration National Centers for Environmental Information web page, accessed December 1, 2022, at https://www.ncei.noaa.gov/products/land-based-station/us-climate-normals#:~:text=NCEI%20generates%20the%20official%20U.S.%20normals%20every%2010,of%20 decadal%20normals%20first%20produced%20in%20the%201950s.
Naz, B.S., Ale, S., and Bowling, L.C., 2009, Detecting subsurface drainage systems and estimating drain spacing in intensively managed agricultural landscapes: Agricultural Water Management, v. 96, no. 4, p. 627–637, accessed February 27, 2023, at https://doi.org/10.1016/j.agwat.2008.10.002.
North Dakota Department of Water Resources, 2021, Regulatory program—Drainage and water management: Department of Water Resources website, accessed December 19, 2023, at https://www.dwr.nd.gov/reg_approp/drainage_water_management/.
North Dakota Department of Water Resources, 2024, Drains, accessed December 10, 2024, at https://www.swc.nd.gov/info_edu/map_data_resources/drains/.
Northcott, W.J., Verma, A.K., Cooke, R.A., 2000, Mapping subsurface drainage systems using remote sensing and GIS, in ASAE Annual International Meeting, Technical Papers: Engineering Solutions for a New Century, Milwaukee, Wis., July 9–12, v. 2, p. 2625–2634, accessed February 29, 2024, at https://www.scopus.com/record/display.uri?eid=2-s2.0-2342627418&origin=inward&txGid=57498407f1e37412ce339bcf64b55252.
Norton, P.A., Delzer, G.C., Valder, J.F., Tatge, W.S., and Ryberg, K.R., 2022, Assessment of streamflow trends in the eastern Dakotas, water years 1960–2019: Scientific Investigations Report 2022–5055, 20 p., accessed October 3, 2022, at https://doi.org/10.3133/sir20225055.
Payton, E.A., Pinson, A.O., Asefa, T., Condon, L.E., Dupigny-Giroux, L.-A.L., Harding, B.L., Kiang, J., Lee, D.H., McAfee, S.A., Pflug, J.M., Rangwala, I., Tanana, H.J., and Wright, D.B., 2023, 4. Water, chap. 4 of Crimmins, A.R., Avery, C.W., Easterling, D.R., Kunkel, K.E., Stewart, B.C., and Maycock, T.K. eds., Fifth National Climate Assessment: U.S. Global Change Research Program, Washington, D.C, accessed December 19, 2023, at https://doi.org/10.7930/NCA5.2023.CH4.
Pendergrass, A.G., 2018, What precipitation is extreme?: Science, v. 360, no. 6393, p. 1072–1073, accessed March 18, 2023, at https://doi.org/10.1126/science.aat1871.
Rahman, M.M., Lin, Z., Jia, X., Steele, D.D., and DeSutter, T.M., 2014, Impact of subsurface drainage on streamflows in the Red River of the North basin: Journal of Hydrology, v. 511, p. 474–483, accessed February 27, 2023, at https://doi.org/10.1016/j.jhydrol.2014.01.070.
Redoloza, F.S., Williamson, T.N., Headman, A.O., and Allred, B.J., 2023, Machine‐learning model to delineate sub‐surface agricultural drainage from satellite imagery: Journal of Environmental Quality, v. 52, no. 4, p. 907–921, accessed September 21, 2023, at https://doi.org/10.1002/jeq2.20493.
Robinson, M., and Rycroft, D.W., 1999, The impact of drainage on streamflow, chap. 23 of Skaggs, R.W. and van Schilfgaarde, J. eds., Agronomy Monographs, Agricultural Drainage, v. 38: American Society of Agronomy, Crop Science Society of America, Soil Science Society of America, Madison, Wis., p. 767–800, accessed March 7, 2023, at http://doi.wiley.com/10.2134/agronmonogr38.c23.
Runkle, J., Kunkel, K.E., Frankson, R., Easterling, D.R., and Champion, S.M., 2022, Minnesota—NOAA National Centers for Environmental Information, State Climate Summaries 2022, Technical Report NESDIS 150–MN: National Oceanic and Atmospheric Administration, 4 p., accessed March 6, 2023, at https://statesummaries.ncics.org/chapter/mn/.
Ryberg, K.R., Goree, B.B., Williams-Sether, T., and Mason, R.R., Jr., 2017, The U.S. Geological Survey peak-flow file data verification project, 2008–2016: U.S. Geological Survey Scientific Investigations Report 2017–5119, 61 p., accessed November 6, 2017, at https://doi.org/10.3133/sir20175119.
Ryberg, K.R., Over, T.M., Levin, S.B., Heimann, D.C., Barth, N.A., Marti, M.K., O’Shea, P.S., Sanocki, C.A., Williams-Sether, T.J., Wavra, H.N., Sando, T.R., Sando, S.K., and Liu, M.S., 2024, Introduction and methods of analysis for peak streamflow trends and their relation to changes in climate in Illinois, Iowa, Michigan, Minnesota, Missouri, Montana, North Dakota, South Dakota, and Wisconsin, chap. A of Ryberg, K.R., comp., Peak streamflow trends and their relation to changes in climate in Illinois, Iowa, Michigan, Minnesota, Missouri, Montana, North Dakota, South Dakota, and Wisconsin: U.S. Geological Survey Scientific Investigations Report 2023–5064–A, 27 p., accessed January 25, 2024, at https://doi.org/10.3133/sir20235064A.
Sands, G.R., 2018, How agricultural drainage works: University of Minnesota Extension website, accessed December 19, 2023, at https://extension.umn.edu/agricultural-drainage/how-agricultural-drainage-works.
Scherer, T., Kandel, H., Sands, G., and Hay, C., 2015, Frequently asked questions about subsurface (tile) drainage (revised): North Dakota State University Extension Service, AE1690, accessed November 1, 2022, at https://www.ag.ndsu.edu/tiledrainage/documents/faq-about-subsurface-tile-drainage.
Schilling, K.E., and Helmers, M., 2008, Effects of subsurface drainage tiles on streamflow in Iowa agricultural watersheds—Exploratory hydrograph analysis: Hydrological Processes, v. 22, no. 23, p. 4497–4506, accessed January 15, 2023, at https://doi.org/10.1002/hyp.7052.
Schilling, K.E., Jha, M.K., Zhang, Y.-K., Gassman, P.W., and Wolter, C.F., 2008, Impact of land use and land cover change on the water balance of a large agricultural watershed—Historical effects and future directions: Water Resources Research, v. 44, no. 7, W00A09, accessed December 22, 2020, at https://doi.org/10.1029/2007WR006644.
Schilling, K.E., Jindal, P., Basu, N.B., and Helmers, M.J., 2012, Impact of artificial subsurface drainage on groundwater travel times and baseflow discharge in an agricultural watershed, Iowa (USA): Hydrological Processes, v. 26, no. 20, p. 3092–3100, accessed December 12, 2023, at https://doi.org/10.1002/hyp.8337 [first published 2011.]
Schilling, K.E., and Libra, R.D., 2003, Increased baseflow in Iowa over the second half of the 20th century: Journal of the American Water Resources Association, v. 39, no. 4, p. 851–860, accessed December 12, 2022, at https://doi.org/10.1111/j.1752-1688.2003.tb04410.x.
Schwartz, M., 2014, County Tile Drainage - Mississippi River Basin: United States Geological Survey: ScienceBase Catalog web page, accessed November 21, 2022, at https://www.sciencebase.gov/catalog/item/561809a4e4b0cdb063e3fd56.
Skaggs, R.W., Brevé, M.A., and Gilliam, J.W., 1994, Hydrologic and water quality impacts of agricultural drainage*: Critical Reviews in Environmental Science and Technology, v. 24, no. 1, p. 1–32, accessed January 10, 2023, at https://doi.org/10.1080/10643389409388459.
Sloan, B.P., Basu, N.B., and Mantilla, R., 2016, Hydrologic impacts of subsurface drainage at the field-scale—Climate, landscape and anthropogenic controls: Agricultural Water Management, v. 165, p. 1–10, accessed February 27, 2023, at https://doi.org/10.1016/j.agwat.2015.10.008.
Sloan, B.P., Mantilla, R., Fonley, M., and Basu, N.B., 2017, Hydrologic impacts of subsurface drainage from the field to watershed scale: Hydrological Processes, v. 31, no. 17, p. 3017–3028, accessed December 12, 2022, at https://doi.org/10.1002/hyp.11218.
Sugg Z., 2007, Assessing U.S. farm drainage—Can GIS lead to better estimates of subsurface drainage extent?: World Resources Institute, Washington, D.C., accessed June 3, 2021, at https://www.wri.org/research/assessing-us-farm-drainage.
U.S. Census Bureau, 2017, Cartographic Boundary Files – Shapefile, accessed June 13, 2023, at https://www.census.gov/geographies/mapping-files/time-series/geo/carto-boundary-file.2017.html#list-tab-1556094155.
U.S. Department of Agriculture National Agricultural and Statistics Service [USDA NASS], 2019a, 2017 Census of agriculture: United States Department of Agriculture and National Agricultural Statistics Service, United States Summary and State Data, v. 1, Geographic Area Series, Part 51, AC–17–A–51, accessed September 6, 2023, at https://www.nass.usda.gov/Publications/AgCensus/2017/Full_Report/Volume_1,_Chapter_1_US/usv1.pdf.
U.S. Department of Agriculture National Agricultural and Statistics Service [USDA NASS], [2019b], Quick Stats, accessed June 13, 2023, at https://quickstats.nass.usda.gov/.
U.S. Department of Agriculture National Agricultural and Statistics Service USDA NASS, 2022, 2017 Census of Agriculture: United States Department of Agriculture and National Agricultural Statistics Service, history document, v. 2, subject series, part 7, AC–17–S–7, 429 p., accessed September 6, 2023, at https://www.nass.usda.gov/Publications/AgCensus/2017/Online_Resources/2017%20History-Final.pdf.
U.S. Department of Agriculture National Agricultural and Statistics Service [USDA NASS], [2024], Quick Stats, accessed December 10, 2024, at https://quickstats.nass.usda.gov/.
U.S. Department of Agriculture Natural Resources Conservation Service, 2009, Hydrologic soil groups, chap. 7 of National engineering handbook—Part 630 hydrology: U.S. Department of Agriculture and Natural Resources Conservation Service, p. 5. [Reprint of original prepared by Victor Mockus in 1972. Also available at https://directives.nrcs.usda.gov/sites/default/files2/1712930597/11905.pdf.]
U.S. Environmental Protection Agency, 2023, Climate change indicators—Heavy precipitation: U.S. Environmental Protection Agency database, accessed February 13, 2024, at https://www.epa.gov/climate-indicators/climate-change-indicators-heavy-precipitation.
U.S. Geological Survey, 2018, Floods—Things to know: Water Science School, U.S. Geological Survey webpage, accessed February 13, 2024, at https://www.usgs.gov/special-topics/water-science-school/science/floods-things-know.
U.S. Global Change Research Program, [undated], Heavy precipitation: U.S. Global Change Research Program webpage, accessed February 13, 2024, at https://www.globalchange.gov/indicators/heavy-precipitation.
Valayamkunnath, P., Barlage, M., Chen, F., Gochis, D.J., and Franz, K.J., 2020a, AgTile-US: figshare, accessed February 14, 2023, at https://doi.org/10.6084/m9.figshare.11825742.v1.
Valayamkunnath, P., Barlage, M., Chen, F., Gochis, D.J., and Franz, K.J., 2020b, Mapping of 30-meter resolution tile-drained croplands using a geospatial modeling approach: Scientific Data, v. 7, no. 1, article 257, accessed February 14, 2023, at https://doi.org/10.1038/s41597-020-00596-x.
Valayamkunnath, P., Gochis, D.J., Chen, F., Barlage, M., and Franz, K.J., 2022, Modeling the hydrologic influence of subsurface tile drainage using the national water model: Water Resources Research, v. 58, no. 4, accessed December 12, 2022, at https://doi.org/10.1029/2021WR031242.
Van Stempvoort, D.R., MacKay, D.R., Koehler, G., Collins, P., and Brown, S.J., 2021, Subsurface hydrology of tile‐drained headwater catchments—Compatibility of concepts and hydrochemistry: Hydrological Processes, v. 35, no. 9, article e14342, accessed December 12, 2023, at https://doi.org/10.1002/hyp.14342.
Williams, M.R., and McAfee, S.J., 2021, Water storage, mixing, and fluxes in tile-drained agricultural fields inferred from stable water isotopes: Journal of Hydrology, v. 599, article 126347, accessed December 12, 2023, at https://doi.org/10.1016/j.jhydrol.2021.126347.
Wilson, A.B., Baker, J.M., Ainsworth, E.A., Andresen, J., Austin, J.A., Dukes, J.S., Gibbons, E., Hoppe, B.O., LeDee, O.E., Noel, J., Roop, H.A., Smith, S.A., Todey, D.P., Wolf, R., and Wood, J.D, 2023, 24. Midwest: chap. 24 of Crimmins, A.R., Avery, C.W., Easterling, D.R., Kunkel, K.E., Stewart, B.C., and Maycock, T.K. eds., Fifth National Climate Assessment: U.S. Global Change Research Program, Washington, D.C, accessed December 19, 2023, at https://doi.org/10.7930/NCA5.2023.CH24.
For more information about this publication, contact:
Director, USGS Central Midwest Water Science Center
400 South Clinton Street, Suite 269
Iowa City, IA 52240
319–337–4191
For additional information, visit: https://www.usgs.gov/centers/cm-water.
Publishing support provided by the
Rolla Publishing Service Center
Disclaimers
Any use of trade, firm, or product names is for descriptive purposes only and does not imply endorsement by the U.S. Government.
Although this information product, for the most part, is in the public domain, it also may contain copyrighted materials as noted in the text. Permission to reproduce copyrighted items must be secured from the copyright owner.
Suggested Citation
Podzorski, H.L., and Ryberg, K.R., 2025, A framework for understanding the effects of subsurface agricultural drainage on downstream flows: U.S. Geological Survey Scientific Investigations Report 2025–5023, 24 p., https://doi.org/10.3133/sir20255023.
ISSN: 2328-0328 (online)
Study Area
| Publication type | Report |
|---|---|
| Publication Subtype | USGS Numbered Series |
| Title | A framework for understanding the effects of subsurface agricultural drainage on downstream flows |
| Series title | Scientific Investigations Report |
| Series number | 2025-5023 |
| DOI | 10.3133/sir20255023 |
| Publication Date | April 17, 2025 |
| Year Published | 2025 |
| Language | English |
| Publisher | U.S. Geological Survey |
| Publisher location | Reston, VA |
| Contributing office(s) | Dakota Water Science Center, Central Midwest Water Science Center |
| Description | vi, 24 p. |
| Country | United States |
| State | Illinois, Iowa, Michigan, Minnesota, Missouri, Montana, North Dakota, South Dakota, Wisconsin |
| Online Only (Y/N) | Y |
| Additional Online Files (Y/N) | N |