

Managing Water for Birds—A Tool for the Malheur National Wildlife Refuge, Southeastern Oregon
Links
- Document: Report (3.7 MB pdf) , HTML , XML
- Data Release: USGS data release - Water for Birds—A spreadsheet-based tool for the Malheur National Wildlife Refuge for irrigation months in 2021–2024
- Superseded Publications:
- Download citation as: RIS | Dublin Core
Acknowledgments
The author would like to thank John W. Jones and Anteneh Sarbanes of the U.S. Geological Survey (USGS) for generating satellite-based inundation data for the project area. Josh Price and Jeremiah Drewel (USGS) trained U.S. Fish and Wildlife (FWS) staff to collect streamflow measurements using an acoustic Doppler current profiler, following USGS guidelines. FWS personnel, including Travis Miller, Sarah Weber, Kris Kannarr, Rachel Esralew, and Mary Lindenberg, collected streamflow measurements or archived streamflow data that were used in this tool. Zach Freed (The Nature Conservancy) provided insightful feedback and support.
Abstract
The “Water for Birds Tool” is a spreadsheet-based tool (using Microsoft Excel) designed to help resource managers assess the spatial extent and types of bird habitats in the Malheur National Wildlife Refuge, southeastern Oregon. The tool quantifies the areas of open water, partial water, and water depths on a monthly timescale during the irrigation season (April–July) from 2021 to 2024. This tool combines previously published datasets and models but also incorporates new measurements collected by partners. Results show that the relation between the amount of bird habitat and the extent (partial and open water) of Malheur Lake varies by bird guild. The Donner und Blitzen River supplied all or most of the surface water inflow to Malheur Lake during the analysis years, emphasizing the importance of informed management of the river. Additional gaging of inflows and diversions and better estimates of recharge and irrigated areas can help refine estimates of water use on the refuge.
Introduction
The Malheur National Wildlife Refuge, in the Harney Basin of southeastern Oregon, covers about 187,000 acres of riverine, irrigated wet meadow, sagebrush and grass uplands, and terminal lake habitats (Cornely, 1982; U.S. Fish and Wildlife Service, 2013). The U.S. Fish and Wildlife Service (FWS) uses various approaches to manage the refuge for migratory and resident bird species. To create seasonally flooded wet meadows in the Donner und Blitzen River Valley, water is diverted through earthen canals to flood-irrigate beginning in March and continuing through July or August each year. Some birds such as Dolichonyx oryzivorus (bobolinks) depend on these wet meadows, and other birds (Grus canadensis spp. [sandhill cranes], waterfowl, and shorebirds) use these habitats to forage and breed (U.S. Fish and Wildlife Service, 2013). Malheur Lake, the terminus of the Donner und Blitzen River, provides crucial habitat for waterbirds and waterfowl along the Pacific Flyway. Malheur Lake is not heavily managed, but it is affected by upstream diversions (U.S. Fish and Wildlife Service, 2013).
Since the beginning of this study period (2021), the Harney Basin has had wet and dry water years that have affected the quantity of water flowing into the refuge (Natural Resource Conservation Service, 2024). FWS manages a complex series of diversion dams and canals each irrigation season to maximize the extent of irrigated wet meadows; these management actions can also affect the quantity and quality of water available for other habitat types on the refuge. FWS continuously monitors two of the seven major diversions from the Donner und Blitzen River (East Canal and West Canal; fig. 1). In 2023, FWS began monitoring two more locations, and additional diversion data became available. As of 2024, it is unclear how water management on the Malheur National Wildlife Refuge is affecting aquatic habitats and how much water is diverted from the Donner und Blitzen River for flood irrigation. The inputs to Malheur Lake and the resulting lake area, lake depths, and habitat types are not systematically assessed.
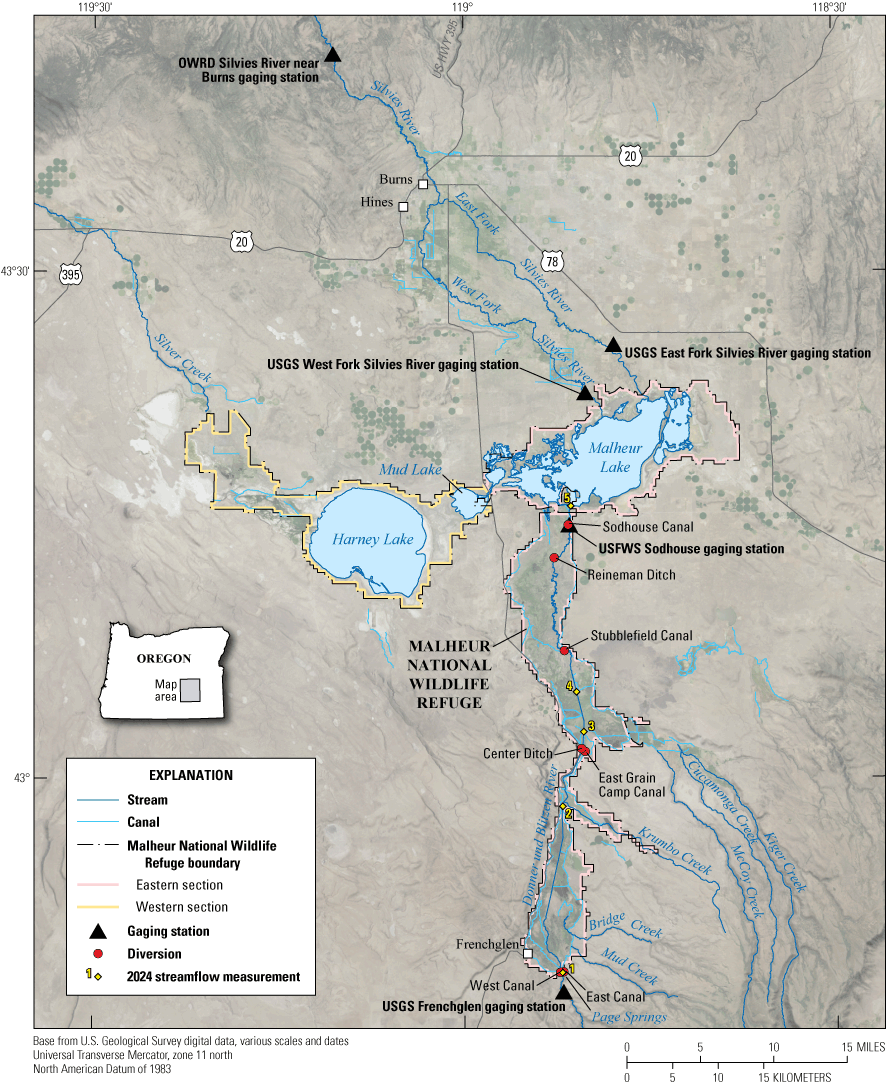
Malheur National Wildlife Refuge in southeastern Oregon. Hydrography, including canal lines, are from the U.S. Geological Survey National Hydrography Dataset (U.S. Geological Survey, 2023) and are not a complete representation of the hydrologic network throughout the refuge. OWRD, Oregon Water Resources Department; USGS, U.S. Geological Survey; FWS, Fish and Wildlife Service.
Purpose and Scope
Since 2016, multiple scientific studies have been focused on the Harney Basin, increasing the number of published datasets and peer-reviewed models. These studies have varied in spatial extent, timing, and topic. Studies were done in the headwaters of the Donner und Blitzen River (Thorson and others, 2022; Simeone and others, 2024), within Malheur Lake (Wood and Smith, 2022; Smith and Wood, 2023), or have encompassed the Harney Basin (Garcia and others, 2022a; Gingerich and others, 2022; Laramie and others, 2023). Models have also been generated to estimate water-budget components (Garcia and others, 2022a), factors affecting water quality (Smith and Wood, 2023), and the responses of organisms (Cyprinus carpio [invasive common carp], Pearson and others, 2019; Oncorhynchus mykiss [native redband trout], Benjamin and others, 2023) to environmental conditions.
The purpose of this project was to integrate published information into a usable tool of the Malheur National Wildlife Refuge for FWS resource managers. The goals were (1) to quantify the extent of various habitat types (including partially inundated habitat, open-water habitat, and habitat for various bird guilds) during the 2021–24 irrigation seasons and (2) to estimate the major water inputs and outputs to the refuge. The resulting spreadsheet-based “Malheur National Wildlife Refuge Water for Birds Tool” incorporates existing datasets and models from past studies and new diversion measurements collected by FWS staff. This tool was not intended to create a closed water budget, and values reported herein are a combination of measured values and modeled estimates. Through the development of this tool, data gaps were identified that hinder the ability of refuge managers to make informed decisions.
Spatial Extent
The Malheur National Wildlife Refuge can be divided into two hydrologically distinct sections: (1) the eastern section that includes the Donner und Blitzen River Valley with its major diversions and irrigated wet meadows, springs, and Malheur Lake and (2) the western section that includes the Silver Creek drainage basin, springs, and Harney Lake (fig. 1). During very wet years, Malheur Lake can flow into Harney Lake through Mud Lake, connecting those two sections through surface water. In all other years, Harney and Malheur Lakes are terminal and have no surface-water outflows.
Multiple springs discharge in the western section of the refuge, and that surface flow creates important wetland bird habitat. Although those springs are managed with water control infrastructure, the western section of the refuge is not managed as intensively as the Donner und Blitzen River Valley (U.S. Fish and Wildlife Service, 2013). In this tool, habitat throughout the Malheur National Wildlife Refuge (including the western section) was quantified. However, estimates of water inputs and water use were focused on the Donner und Blitzen River Valley and not quantified for the western section of the refuge.
For a complete description of the water budget of the Harney Basin, refer to Garcia and others (2022a). The major rivers flowing into the Malheur National Wildlife Refuge include the Donner und Blitzen River from the south, the East Fork Silvies and West Fork Silvies Rivers from the north, and intermittently, Silver Creek from the northwest. Other streams, including Mud Creek, Bridge Creek, Krumbo Creek, McCoy Creek, and Kiger Creek flow into the Donner und Blitzen River within the refuge boundaries and downstream from the continuous U.S. Geological Survey (USGS) streamgaging station, Donner und Blitzen River near Frenchglen, Oregon (U.S. Geological Survey, 2024). Currently (2024), very few continuous gages are operational in the basin (fig. 1), and only data from two gages (USGS Frenchglen and OWRD Silvies River near Burns) are transmitted and available to the public in near-real time.
Methods and Approach
This report describes the methodology needed to use the spreadsheet-based tool (Microsoft Excel; Microsoft Corporation, 2024) that was developed in this study. This methodology follows the order of the spreadsheet tabs within the workbook, which can be downloaded from Smith and Jones (2024). The tool was designed to run on a monthly timescale for a given month during the irrigation season for years 2021–24. Although irrigation can begin in March and continue into August, fields are consistently irrigated April through July; the tool and report define the irrigation season as April–July. Many aspects of the tool autopopulate. The steps to add new data are described under the “Integrating New Data” subheadings.
Input Methods
Donner und Blitzen River
The USGS has a long-running streamgage along the Donner und Blitzen River near Frenchglen, Oregon (USGS ID 10396000; U.S. Geological Survey, 2024). The site is about 2.6 river kilometers (1.6 river miles) upstream from the refuge boundary; mean daily discharge data are publicly available through National Water Information System (U.S. Geological Survey, 2024) Web interface, starting from the year 1911. For this analysis, mean daily discharge data, in cubic feet per second, downloaded from the streamgaging station at Donner und Blitzen River near Frenchglen, represent how much water is flowing into the refuge from the Donner und Blitzen River. Streamflow measured near Frenchglen is also used to estimate inflows from other tributaries that are not monitored.
Integrating New Data
To add Donner und Blitzen River near Frenchglen, Oregon, streamflow data to the spreadsheet tool, do the following:
-
1. Download the “Water for Birds Tool_blank” spreadsheet from https://doi.org/10.5066/P1AJAYVS.
-
2. Navigate to https://waterdata.usgs.gov/nwis/inventory/?site_no=10396000&agency_cd=USGS.
-
3. Select “Daily Data” and “00060 Discharge (Mean)” as the “Available Parameter.”
-
4. Select “Tab-separated” as the “Output format.”
-
5. Change the dates to the first and last days of the month of interest and click “GO.”
-
6. Copy and paste the data into a blank Excel file.
-
7. Select column A. Click “Data,” then “Text to columns.”
-
8. In the pop-up box, select “Fixed” with “→ Next→Next→Finish.”
-
9. Column D is the mean daily discharge data in cubic feet per second. Copy that column and paste as values in column B (starting with B1) of the “Inputs” tab of the “Water for Birds” spreadsheet.
-
10. Check the number of values for the month. Because these are daily means, there should be 30 or 31 values.
Donner und Blitzen River Tributaries—Mud, Bridge, and McCoy Creeks
FWS has continuously monitored streamflow in Bridge Creek since 2002, and they estimate streamflow in McCoy Creek using approximately two discrete measurements per year. However, Bridge and McCoy Creek streamflows are not available in realtime, and Mud Creek is not monitored. Therefore, data from the Donner und Blitzen River near Frenchglen were correlated to Mud, Bridge, and McCoy Creek streamflows by Garcia and others (2022a).
Columns E, G, and I of the “Inputs” tab are locked and should not be manipulated. Streamflow values for Mud, Bridge, and McCoy Creeks are calculated based on regressions developed by Garcia and others (2022a; table 1). The input (x) is the mean daily discharge near Frenchglen, and regression equations for each tributary varied based on the input value. For example, one regression is applied to calculate Mud Creek streamflow when the log (base 10) transformation of mean daily Donner und Blitzen River near Frenchglen streamflow is 1.398–2.577 ft3/s, whereas another regression is applied when the log of mean daily Donner und Blitzen River near Frenchglen streamflow is 2.577–3.260 ft3/s (table 1). Values in columns E, G, and I update automatically as values are added to column B. Equation 1 is applied in Excel, and then the computed streamflow value for the tributary (log[y]) is transformed from log to normal values (10^log[y]) and multiplied by the applicable bias correction factor (y×BCF) to adjust for bias when transforming values.
Table 1.
Equation variables used to calculate mean daily streamflow in tributaries of the Donner und Blitzen River, southeastern Oregon.[Minimum and maximum inputs are the logarithms of mean daily streamflow measured at the U.S. Geological Survey Donner und Blitzen River gage near Frenchglen, Oregon. Values obtained from Garcia and others (2022a). ft3/s, cubic foot per second; BCF, bias correction factor]
y
is the mean daily discharge for Mud Creek, Bridge Creek, or McCoy Creek, in cubic feet per second;
m
is the slope;
x
is the mean daily discharge for the Donner und Blitzen River near Frenchglen, in cubic feet per second; and
b
is the intercept.
A warning appears in the “Monthly Summary” if Donner und Blitzen River streamflows were outside the modeled range reported in Garcia and others (2022a). This warning indicates that there is higher uncertainty in the streamflow estimates because they were outside the modeled ranges. Although this is important to acknowledge, no action can be taken because these regressions are the best available information.
Donner und Blitzen River Tributaries—Krumbo, Kiger, and Cucamonga Creeks
Krumbo Creek streamflow is measured by the FWS downstream from the reservoir at the Krumbo Creek flume, but these measurements are not available in near realtime and, therefore, were not used in this tool. Garcia and others (2022a) used two methods to estimate inflows from Krumbo Creek to the refuge. The mean annual streamflow (3.7 ft3/s) that was calculated using measured and estimated values was used in this tool. Krumbo Creek's monthly total streamflow automatically populates in the “Monthly Summary” tab, assuming 3.7 ft3/s and multiplying by the number of days in the month.
Neither Kiger Creek nor Cucamonga Creek is monitored. Based on Garcia and others (2022a), Kiger Creek has a mean annual estimated streamflow of 61.8 ft3/s, and Cucamonga Creek has a mean annual estimated streamflow of 7.5 ft3/s. Those values were used to estimate monthly total streamflow for the two creeks, and estimates automatically populate in the “Monthly Summary” tab.
Springs
Page Springs flow was periodically estimated by FWS from 1997 through 2016 (n=34), and estimates are documented in Garcia and others (2022b). FWS estimated flow by subtracting upstream flow from downstream flow and attributing the difference to input from Page Springs. This method has multiple potential sources of error, and Page Springs flow estimates should be used with caution. For this tool, an average of all estimated values documented in Garcia and others (2022b; 11.5 ft3/s) was used to estimate flow from Page Springs.
Four other springs discharge into the Donner und Blitzen River Valley near Frenchglen (Garcia and others; 2022a). Those springs have a combined mean flow of 5.3 ft3/s. The total constant spring input (16.8 ft3/s) automatically populates as monthly total streamflow in the “Monthly Summary” tab based on whether there are 30 or 31 days in the month.
Diversion Methods
FWS has used multiple methods at varying locations over the past few years to measure the amount of water diverted from the Donner und Blitzen River for irrigation. At a minimum, FWS collects discrete streamflow measurements at East and West Canals (fig. 1) three times a year. However, there are seven major points of diversion along the Donner und Blitzen River on the refuge. Many of the diversion canals are too deep to wade or do not have a suitable cross section, and measurements can only be collected from some of the diversions under certain conditions. The lack of data from a canal during the irrigation season does not mean that the canal was not flowing, but that a measurement was not collected. Therefore, the diversion data are an underestimation of water diverted from the Donner und Blitzen River, but they are the best available information for the development of the tool.
In 2021 and 2022, three streamflow measurements were collected each year using a FlowTracker2 at East Canal and a weir stick at West Canal, totaling 12 measurements (U.S. Fish and Wildlife Service, 2024b). In 2023, FWS staff collected streamflow measurements at four points of diversion using a FlowTracker2: East Canal, West Canal, Center Ditch, and Sodhouse Canal (U.S. Fish and Wildlife Service, 2024b). In 2024, an acoustic Doppler current profiler was used at five locations along the main stem of the Donner und Blitzen River to collect discrete streamflow measurements (fig. 1). Streamflow was measured approximately 7 times at each of the 5 locations from late March through mid-August 2004. Monthly streamflow estimates were applied to site-specific equations in 2024 to determine net loss (attributed to diversions) in the five reaches (Water for Birds Tool_Supplemental_2024 diversions; Smith and Jones, 2024).
Integrating New Data
In this tool, streamflow was linearly interpolated at a daily time interval between discrete measurements collected from diversion canals. Daily interpolations were done outside the spreadsheet tool, and then these values were pasted into the applicable column in the “Diversions” tab. Partial data (for example, for 10 days of the month) can be pasted into this tab, and all available data will be used. Monthly streamflow from each site is automatically calculated by summing daily streamflows, and a warning appears in the “Monthly Summary” tab if the diversion is missing some or all data from the month. Since the 2024 method differed from previous years—the main-stem Donner und Blitzen River was measured instead of the diversions—the site-specific equations and monthly calculations are included as supplemental information (Smith and Jones, 2024).
Malheur Lake Methods
Donner und Blitzen River at Sodhouse Dam
FWS continuously measures streamflow just downstream from Sodhouse Dam, about 7 river kilometers upstream from Malheur Lake. The streamflow measured at this location represents the water flowing into Malheur Lake from the Donner und Blitzen River. Data are telemetered to FWS and then are published through ServCat (U.S. Fish and Wildlife Service, 2024a). Federal partners may need to pause their Virtual Private Network to access ServCat.
Integrating New Data
To add Sodhouse Dam streamflow data to the spreadsheet tool, do the following:
-
1. Access ServCat at https://ecos.fws.gov/ServCat/Reference/Profile/142076 (U.S. Fish and Wildlife Service, 2024a) and download the comma-separated values (csv) file containing the 15-minute streamflow data.
-
2. Select the 15-min data for the month of interest (in column C) and paste as values in column B (starting with B1) of the “Malheur Lake” tab of the spreadsheet.
-
3. Check the number of values for the month. There should be 96 values per day, 2,880 values for a 30-day month, and 2,976 values for a 31-day month.
Satellite Imagery
Neither the West Fork Silvies River nor the East Fork Silvies River is gaged near their connection with Malheur Lake, and satellite images must be assessed to determine if streamflow from the rivers was reaching Malheur Lake. In typical dry years, neither fork reaches the lake. Occasionally, the West Fork Silvies River connects with Malheur Lake while the East Fork Silvies River is not connected, such as in water year 2020 (Smith and Wood, 2023); however, this connection is often short-lived and results in a relatively small amount of flow. For example, the flow from the West Fork Silvies River in 2020 was 3 percent of the combined flow from both forks of the river in 2019 (Smith and Wood, 2023). Therefore, this spreadsheet only has options for when both are connected or when both are disconnected from Malheur Lake. Satellite imagery is used to assess connectivity during a given month.
Integrating New Data
To determine if the Silvies River reached Malheur Lake in the month of interest, do the following:
-
1. Navigate to “LandsatLook” (https://landsatlook.usgs.gov/) and click “Explore.”
-
2. Zoom to Malheur Lake and change the date range to the first and last day of the month of interest. Select “Apply.”
-
a. If the month of interest is before October 1, 2021, change the default satellites to also include Landsat 8 and Landsat 7.
-
b. Clouds obscure some monthly images in LandsatLook. In these cases, toggle off one or more satellite. Imagery from Landsat 9 may have been clouded while Landsat 8 was clear (example, April 2022). All satellite imagery during April–July 2021–24 is included in Smith and Jones (2024).
-
3. If neither the West Fork Silvies River nor the East Fork Silvies River was flowing into Malheur Lake in the image (for example, July 2022; fig. 2A), select “No” from the dropdown menu in cell D1 on the “Malheur Lake” tab and skip the following Silvies River streamflow section.
-
4. If one of the rivers was flowing into Malheur Lake in the image, select “No” from the dropdown menu in cell D1 on the “Malheur Lake” tab and skip the following Silvies River streamflow section.
-
5. If both the West Fork Silvies and the East Fork Silvies Rivers are flowing into Malheur Lake (for example, July 2023; fig. 2B), select “Yes” from the dropdown menu in cell D1 on the “Malheur Lake” tab and continue to the section “Silvies River Streamflow.”
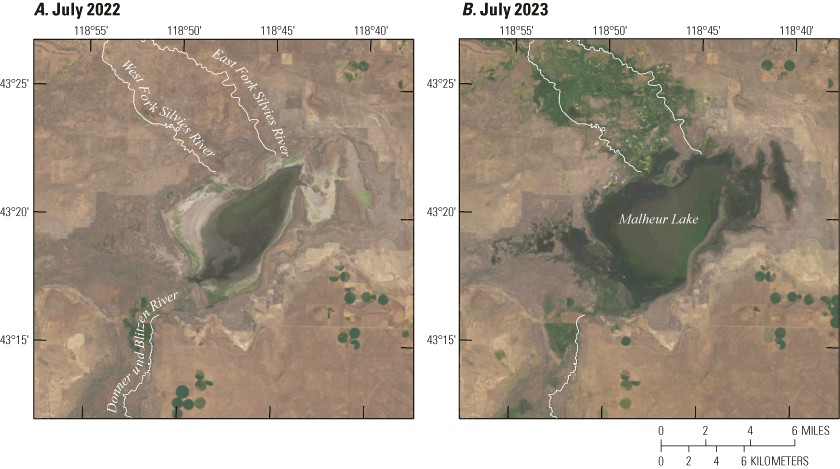
Malheur Lake, southeastern Oregon, in (A) July 2022 and (B) July 2023. Images were downloaded from LandsatLook (https://landsatlook.usgs.gov/). Flow lines added to the images show where the rivers would connect to Malheur Lake.
Silvies River Streamflow
Along the Silvies River, the closest active gage (in 2024) to Malheur Lake is north of Burns, Oregon (fig. 1). This gage was previously operated by the USGS and is now operated by the Oregon Water Resources Department (OWRD). Streamflow in the West Fork Silvies and East Fork Silvies Rivers was monitored from 1972 through 1977 (U.S. Geological Survey, 2024). Smith and Wood (2023) collected discrete streamflow measurements from the West Fork Silvies River in 2019 and 2020. All publicly available data were assessed to determine the best correlation between the OWRD Silvies River gage near Burns and the streamflow that reaches Malheur Lake through the West Fork Silvies River and East Fork Silvies River.
Because the OWRD Silvies River gage is upstream from the West Fork Silvies and East Fork Silvies River gages, the data are serially correlated. Comparisons showed that the timing of streamflow pulses measured at the OWRD Silvies River gage and at the West Fork Silvies River gage changed from year to year. Table 2 shows the number of days between peak flows measured at the OWRD Silvies River gage and the West Fork Silvies River gage, and this is visually shown for 1972 in figure 3A.
Table 2.
Dates of annual peak streamflows measured at two gaging locations along the Silvies River, southeastern Oregon.[OWRD, Oregon Water Resources Department]
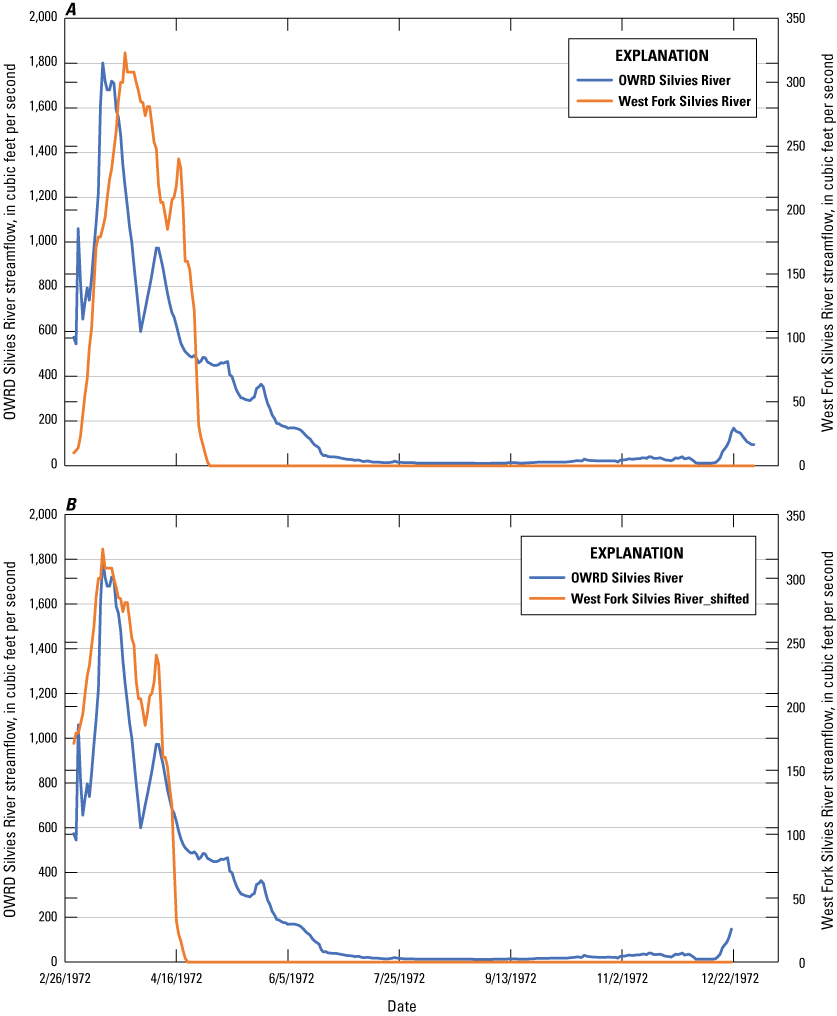
Streamflow measured at the Oregon Water Resources Department (OWRD) gage on the Silvies River near Burns, Oregon, and at a location downstream along the West Fork Silvies River, Oregon, February–December 1972. (A) Shows the measured data, whereas (B) shows how the West Fork Silvies River data could be shifted to account for travel time from upstream to downstream. Dates shown in month/day/year.
Other years of data (1973 and 1977) showed that negligible flows reached the West Fork Silvies River gage because of the low flows measured at the OWRD Silvies River near Burns gage. In 1973, streamflow reached more than 500 ft3/s at the OWRD Silvies River gage, but streamflow less than 2 ft3/s was measured at the West Fork Silvies River gage. In 1977, flows reached 115 ft3/s at the OWRD Silvies River near Burns gage, but no flow was measured at the West Fork Silvies River gage. Based on these comparisons, West Fork Silvies River streamflow was assumed to be zero when flows at OWRD Silvies River near Burns are 100 ft3/s or less.
To determine the serial correlation and the lag time between gages, West Fork Silvies River data were shifted back by the difference in days measured that year (table 2; fig. 3B). A linear correlation was developed between the OWRD Silvies River gage data (values greater than 100 ft3/s) and the shifted West Fork Silvies River gage data for years shown in table 2 (coefficient of determination [R2] =0.5587; mean absolute error [MAE]=42.33; fig. 4). The intercept (−12.86) forces the linear correlation to intersect the x-axis at 100 because 100 ft3/s streamflow at the upstream site resulted in zero streamflow at the downstream site.
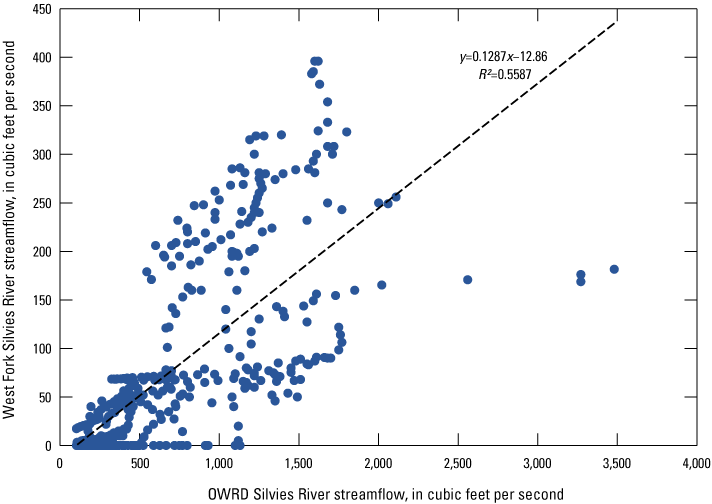
Scatterplot showing the linear correlation between Oregon Water Resources Department (OWRD) Silvies River streamflow and shifted West Fork Silvies River streamflow, southeastern Oregon. R2, coefficient of determination.
In the 1970s, there were times when the East Fork Silvies River flowed but the West Fork Silvies River did not. Based on information from satellite imagery from recent years, this pattern is reversed, and the West Fork Silvies River had flows more frequently than the East Fork Silvies River (Smith and Wood, 2023). In other words, under current (2024) conditions, if there is zero flow in the West Fork Silvies River, there is zero flow in the East Fork Silvies River. West Fork Silvies River and East Fork Silvies River measurements from 1972, 1974, 1975, and 1976 were correlated (U.S. Geological Survey, 2024), but paired readings were removed if no flow was measured at the West Fork Silvies River gage (R2=0.8768; MAE=12.33; fig. 5). The correlation was forced through zero.
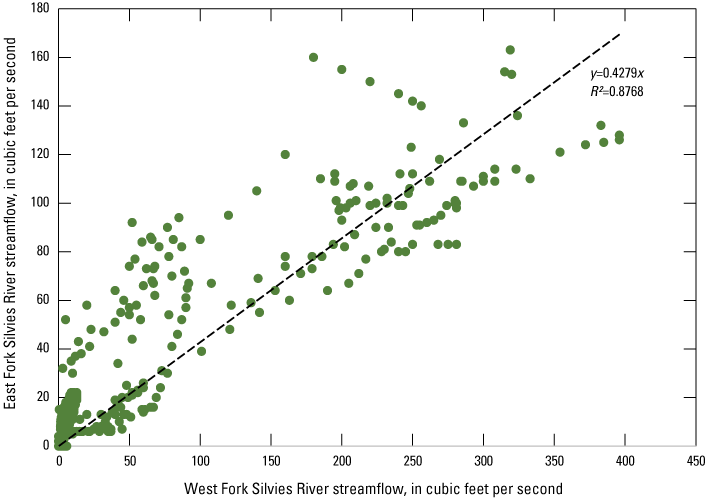
Scatterplot showing the linear correlation between West Fork Silvies River streamflow and East Fork Silvies River streamflow.
Integrating New Data
The following steps should only be followed if the West Fork Silvies and East Fork Silvies Rivers were connected to Malheur Lake, and therefore, cell D1 on the “Malheur Lake” tab has “Yes”:
-
1. Access the OWRD Silvies River streamflow data at this website: https://apps.wrd.state.or.us/apps/sw/hydro_near_real_time/display_hydro_graph.aspx?station_nbr=10393500.
-
2. Download the applicable date range from the OWRD website to account for the travel time between water measured at the Silvies River near Burns and water entering Malheur Lake (average of 14 days).
-
3. Add the starting date and ending date from table 3 for the month of interest. Select “Mean Daily Flow” as the dataset and “Microsoft Excel” as the download format.
Table 3.
Date range of data that should be downloaded from the Oregon Water Resources Department website for the Silvies River near Burns gage based on the month being assessed and accounting for travel time between the gage and Malheur Lake, southeastern Oregon.[OWRD, Oregon Water Resources Department]
-
4. Paste the mean daily flows as values in column F (starting with cell F1) on the “Malheur Lake” tab.
-
5. West Fork Silvies River mean daily flows will autopopulate in column H based on values in column F using the correlation described in fig. 4.
-
6. East Fork Silvies River mean daily flows will autopopulate in column J based on values in column H using the correlation described in fig. 5.
Donner und Blitzen River Water Quality
The quality of water entering Malheur Lake was assessed in 2019 and 2020 and documented in Smith and Wood (2023). One of the monitoring sites was along the Donner und Blitzen River downstream from Sodhouse Dam (at the FWS streamflow gage; fig. 1), which measured the water flowing into the lake from the refuge. Smith and Wood (2023) correlated streamflow in the Donner und Blitzen River at Sodhouse Dam to suspended sediment, total nitrogen, and total phosphorus concentrations (in milligrams per liter). These linear regressions (eqs. 2–4) are applied to the 15-minute Donner und Blitzen River at Sodhouse Dam streamflow data (in cubic meters per second) to compute monthly loads from the Donner und Blitzen River to Malheur Lake; monthly loads autopopulate in the “Monthly Summary” tab. Correlations were not used for the Silvies River.
wherey
is the suspended-sediment concentration in the Donner und Blitzen River at Sodhouse Dam, in milligrams per liter, and
x
is the streamflow of the Donner und Blitzen River at Sodhouse Dam, in cubic meters per second.
Output Methods
Surface water losses from the refuge occur through (1) open-water evaporation from lakes and ponds; (2) evapotranspiration (ET) in irrigated wet meadows, riparian areas, and wetlands; and (3) recharge through infiltration of surface water. In this tool, evaporation and ET are collectively referred to as ET, and recharge water is assumed to be incorporated in the groundwater system. This tool was not intended to create a closed water budget of the refuge or of the Donner und Blitzen River Valley. Estimated volumes of ET and recharge in this tool are used to show the general magnitude of losses during the irrigation months (April–July) from the various habitat types in the eastern section of the refuge. Two methods of determining monthly ET from the eastern section of the refuge were compared: estimated ET and calculated ET.
Estimated ET
The first method (referred to as “estimated ET”) of determining monthly ET used publicly available information (OpenET) and estimates of habitat areas in the Donner und Blitzen River Valley. OpenET data were pulled from three areas on the refuge (Malheur Lake, an irrigated meadow, and a pond; fig. 6; OpenET, 2023) for irrigation months from 2021 through 2024. Users can draw custom rectangles through the public interface, but rectangle areas are limited to 2,471 acres. Monthly OpenET values will vary based on the exact placement of the rectangle and size of the rectangle drawn on the landscape in the online user interface. The “Outputs” tab in the spreadsheet shows the data pulled from the default ensemble mean ET estimate in OpenET and used in this tool (OpenET, 2023). Monthly OpenET values (in inches) were rounded to the tenths, and the volume of water loss through ET from each habitat type was rounded to the nearest 1,000 cubic feet.
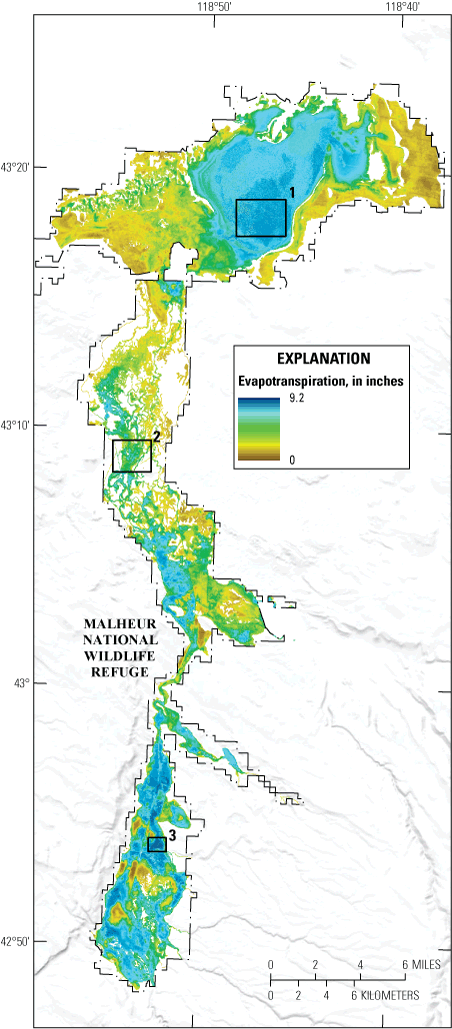
Evapotranspiration amounts across the eastern section of the Malheur National Wildlife Refuge, southeastern Oregon, in June 2021. Evapotranspiration amounts were generated using the ensemble mean from OpenET (2023), and the colors represent areas of low to high evapotranspiration amounts for that month. Black squares show the area in (1) Malheur Lake, (2) irrigated meadows, and (3) a pond that were selected as representative habitat types.
The average monthly ET over the 4 years of the study (for example, April 2021–24) was multiplied by the estimated area of habitat to calculate the ET loss from irrigated meadows and ponds. Although the acres of irrigated land can change from year to year, the approximate acres included in Mayer and others (2007; 29,500 acres irrigated meadow habitat and 6,500 acres of ponds) were used for this tool; these are estimated areas that could be higher than actual acreage. Because the area of Malheur Lake changes substantially across water years, estimates of ET from Malheur Lake were determined for each month of the analysis. Monthly Malheur Lake area was quantified using Dynamic Surface Water Extent (DSWE) rasters (Jones, 2019) and following steps in appendix 1. Lake area was then multiplied by the corresponding OpenET value to determine the volume (in cubic feet) of water loss through ET from Malheur Lake that month.
Calculated ET
With an account and a monthly fee, users can extract OpenET data from large areas that are not limited to the rectangle area restrictions of the public interface. This means that instead of using ET values from representative habitat types and multiplying by the approximate area of those habitat types, one shapefile can be used to calculate monthly ET from the eastern part of the refuge. To assess the accuracy of the estimated ET method used in the tool, an additional analysis was performed. Monthly OpenET data were calculated for the eastern part of the refuge using a shapefile with an area of 81,639 acres (referred to as “calculated ET”). The shapefile encompassed habitat areas on the refuge that are affected by water management, including wet meadows, dry meadows, emergent marsh, lake basin, palustrine open water, riparian shrub, and riverine areas.
Monthly ET calculated using the shapefile was compared to the monthly ET estimated from the representative habitat areas during the 16 months of analysis. Calculated ET is likely more accurate than the estimated ET approach because it fully encompasses areas on the refuge where water is managed; area included in the calculated ET shapefile is approximately 33 percent greater than the area used in the estimated ET method. Calculated ET volumes were greater than estimated ET volumes for each month of the comparison (average of 12 percent). Figure 7 shows the correlation between monthly ET volumes using the two methods.
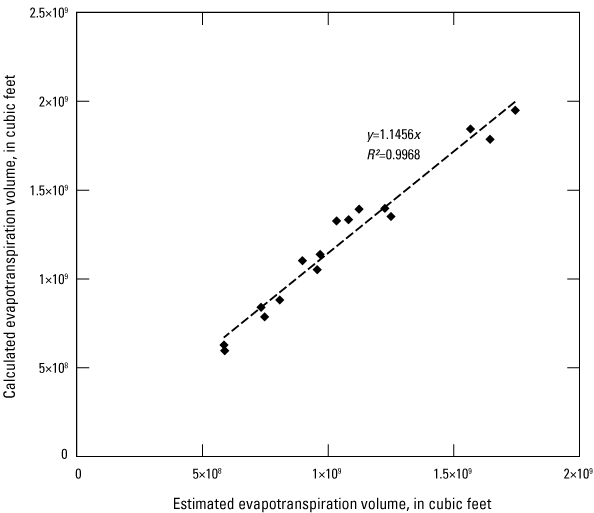
Scatterplot and linear trend line showing monthly evapotranspiration volumes for the eastern part of the Malheur National Wildlife Refuge, southeastern Oregon, using two methods.
This Water for Birds Tool was designed to be accessible to a wide range of stakeholders and managers, but managers and stakeholders are unlikely to have OpenET accounts with recurring fees. Therefore, the estimated ET method is used in this tool to allow users to add ET estimates for future years. Estimated ET values for 2021–24 on the “Outputs” tab were multiplied by 1.1456 (fig. 7) to approximate calculated ET volumes, and those values are locked to ensure data are not accidentally deleted. ET losses will populate in the “Monthly Summary” tab once the month (cell B1) and year (cell C1) are selected from the drop-down lists.
Recharge
In surface-water irrigated systems, ET can be used to estimate the volume of water applied to fields and the volume that recharges to groundwater through infiltration (Garcia and others, 2022a). The volume of applied water is estimated by doubling ET. Then, approximately 17 percent of applied water is recharged to groundwater. Recharge from Malheur Lake to groundwater is likely negligible (Hubbard, 1975; Garcia and others, 2022a). In this tool, the combined monthly ET volume from irrigated meadows and ponds was used to estimate recharge. This recharge volume applies to the eastern section of the refuge and autopopulates in the “Monthly Summary” tab.
DSWE Methods
Dynamic Surface Water Extent (DSWE) is an operationally generated, openly available data product indicating land surface inundation based on analysis of Landsat satellite data. DSWE data are available for any location in the United States starting in 1984 (Earth Resources Observation and Science Center, 2022). With DSWE, satellite imagery pixels are classified as (1) open water—high confidence (approximately 90 percent of the 30 meters [m]×30 m pixel is water), (2) open water—moderate confidence (approximately 90 percent of the 30 m×30 m pixel is water with high turbidity or bright soil substrates), (3) partial water—conservative (50–90 percent of the pixel is water, and the remainder is mud, soil, or vegetation), (4) partial water—aggressive (as little as 10 percent of the pixel is water with remaining area vegetation, soil, or mud), and (5) non-water. For this tool, individual DSWE dates of observation for each irrigation month (April–July) during 2021–24 were processed to generate proportions of open water and partial water for the Malheur National Wildlife Refuge extent (app. 1). Proportions represent the number of times each pixel was labeled as an inundated class divided by the number of times the pixel was observed, expressed as a percent (John Jones, USGS, written commun., July 2024). These monthly DSWE proportion layers (rasters) have been archived in Smith and Jones (2024; Malheur_proportions_month_2021_2024_Apr_July).
DSWE proportion layers provided and used in this analysis include the number of observations, the open surface water proportions, the partial surface water proportions, and the total surface water proportions (the open and partial surface water classes combined). The “number of observations” raster indicates how many satellite images were collected over each pixel that month. Over the Malheur National Wildlife Refuge, more observations were collected over the western section near Harney Lake than the eastern section of the refuge. The areas of partial surface water and of open surface water within the Malheur National Wildlife Refuge were determined for each irrigation month during 2021–24. The total surface water area (partial and open) was determined for Malheur Lake each irrigation month during 2021–24.
Results from these analyses are included in the “DSWE” tab of the spreadsheet; these results can be recreated by following the steps in appendix 1. Nothing on the “DSWE” tab can be manipulated, and the area of habitat types (open water, partial water, and Malheur Lake) autopopulate on the “Monthly Summary” tab based on the month (cell B1) and year (cell C1) selected from the drop-down lists at the top left of the summary.
Stage/Volume/Area Methods
A stage/volume/area table for Malheur Lake and the associated digital elevation model (DEM; collected when lake levels were low; Freed and others, 2021) were used to quantify the area of various water depths in Malheur Lake each month. Birds of different guilds require certain water depths to rest and forage (Schaffer-Smith and others, 2018): shorebird habitat is less than 0.1 m (Safran and others, 1997), wading bird habitat is less than 0.15 m, dabbling duck habitat is 0.05–0.25 m, and diving waterbird habitat is greater than 0.25 m (Taft and others, 2002). These depths were rounded to the nearest 0.1 m for this assessment.
The number of cells at each lake stage was determined using the DEM, and values are included in the “StageVolArea” tab of the spreadsheet. The number of cells was multiplied by the area of each cell (100 square meters) to calculate the area of Malheur Lake at each lake stage for a given depth range. Once the month and year (B1 and C1) on the “Monthly Summary” tab are selected, the area of Malheur Lake (cell B33 on the “Monthly Summary” tab) updates. The closest lake stage for that lake area is automatically calculated using the stage/volume/area table, and the “Monthly Summary” tab updates the areas in Malheur Lake for the four bird guilds based on their water depth requirements.
Uncertainty
An uncertainty analysis was not performed for this tool, but users are reminded that uncertainty is introduced through multiple sources. For example, Donner und Blitzen River streamflow measurements are estimated to be plus or minus (±) 8 percent (refer to Smith and Wood [2023] for an in-depth explanation). Linear interpolations of streamflow between discrete measurements can introduce an estimated error of ±16 percent (Smith and Wood, 2023). The stage/volume/area table has error associated with the vertical and horizontal resolutions of the DEM, and calculating Malheur Lake area from satellite imagery has an estimated uncertainty of ±10 percent (Smith and Wood, 2023). Coefficients of determination (R2) values for correlations indicate variability in the data, and Garcia and others (2022a) assessed uncertainty related to the tributary (Mud Creek, Bridge Creek, and McCoy Creek) streamflow modeled from the gage at the Donner und Blitzen River near Frenchglen. Additionally, the amount of water diverted from the Donner und Blitzen River is not systematically monitored on the refuge. Through the propagation of error, uncertainty in this tool may exceed ±25 percent.
Results
Of the four irrigation months, June often had the highest partial water habitat acreage on the refuge (table 4), although the actual amounts could vary substantially from year to year. Partial water habitat acreage in June 2022 was about one-half the acreage in June 2024 (fig. 8); the partially inundated Harney Lake area added a substantial amount of habitat in 2024.
Table 4.
Acres of habitat within the Malheur National Wildlife Refuge, southeastern Oregon.[Open-water and partial-water habitat for the Malheur National Wildlife Refuge; total wetted area and bird guild habitat for Malheur Lake only.]
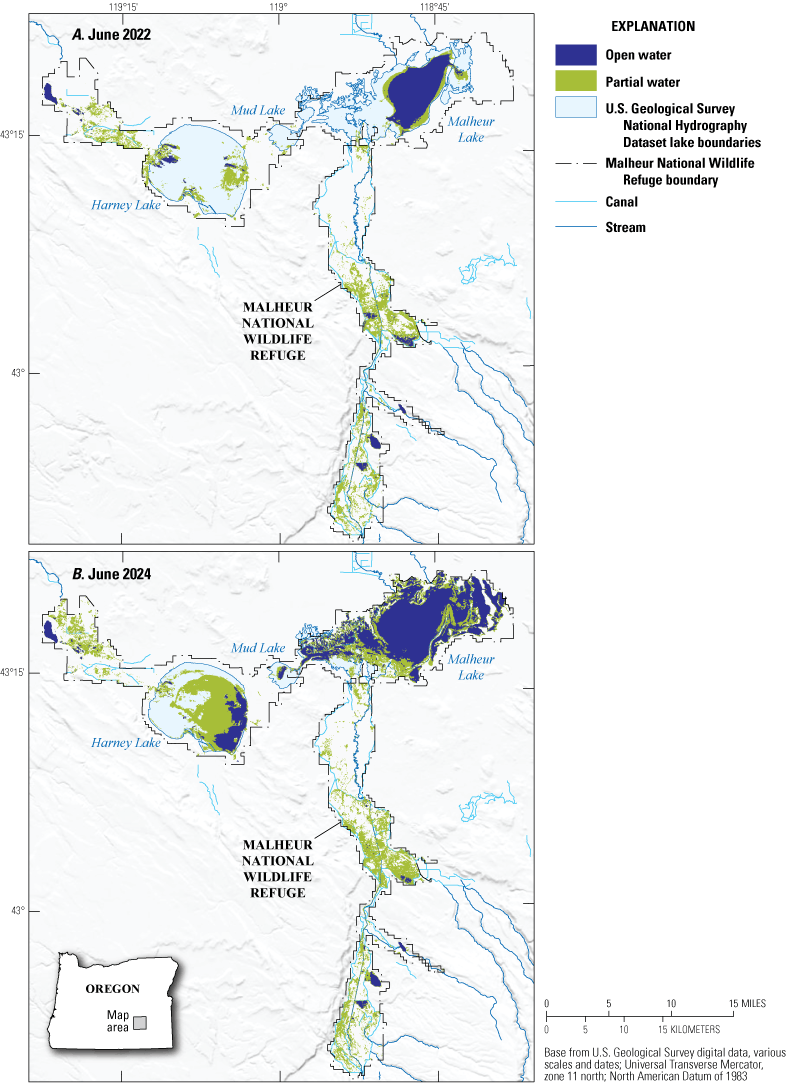
Open-water areas and partial water areas within the Malheur National Wildlife Refuge, southeastern Oregon, in (A) June 2022 and (B) June 2024.
Based on satellite imagery (included in Smith and Jones, 2024), the West Fork Silvies and East Fork Silvies Rivers were disconnected from Malheur Lake during all irrigation months in 2021 and 2022. Malheur Lake area decreased April through July in 2021 and 2022 (table 4). The Silvies River was connected to Malheur Lake and had measurable flow from May to July in 2023 and from May to June in 2024. Together, the West Fork Silvies and East Fork Silvies Rivers supplied a mean of 18 percent of the surface water inflows to Malheur Lake in the months they were connected; the rest of the surface-water inflow was supplied by the Donner und Blitzen River. The Silvies River inflow contributions varied from a low of less than 1 percent in July 2023 to 47 percent in May 2023.
The relation between Malheur Lake wetted area and bird habitat differs by bird guild. For the years in this analysis, Malheur Lake area and shorebird, wading bird, and dabbling duck habitat were best correlated with third-order polynomial trend lines (figs. 9A–9C). Malheur Lake area and diving waterbird habitat was best described with a linear relation (fig. 9D).
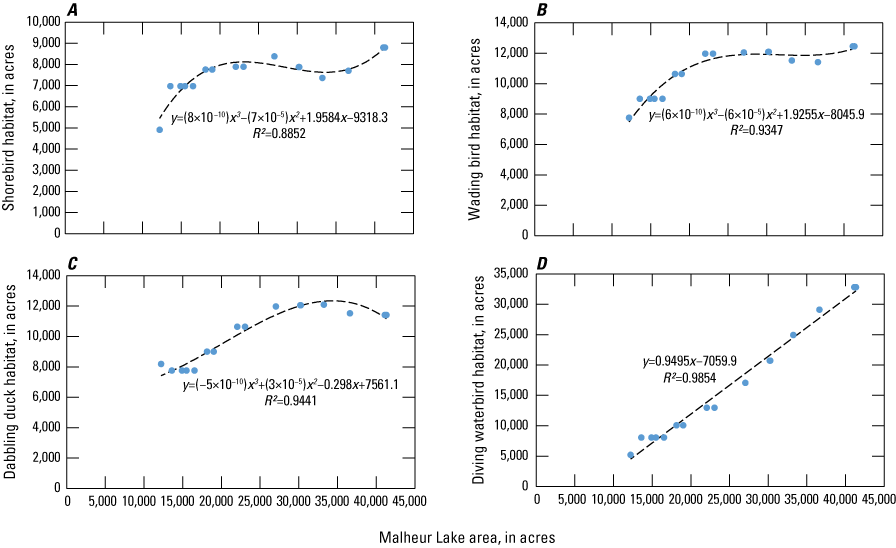
Scatterplots showing the correlations between Malheur Lake area and (A) shorebird habitat, (B) wading bird habitat, (C) dabbling duck habitat, and (D) diving waterbird habitat, southeastern Oregon.
In May 2022, about 11 percent of the surface water flowing into the Donner und Blitzen River Valley flowed out to Malheur Lake. Another 11 percent of Donner und Blitzen River Valley inflows were measured in diversion canals. The remaining 78 percent of inflows (the residual) were not measured through diversions or entering Malheur Lake (fig. 10A). In May 2024, 45 percent of inflows went into Malheur Lake, and 14 percent of inflows were not measured that month (fig. 10B).
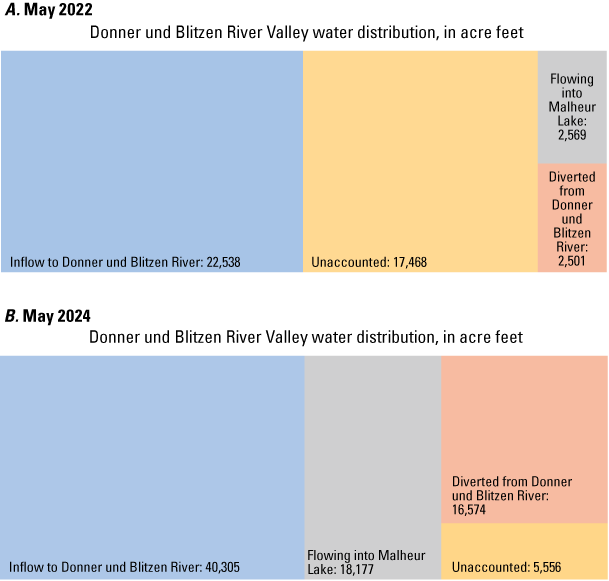
Summary of the inflows to the Donner und Blitzen River Valley and outflows from the river in (A) May 2022 and (B) May 2024 on the Malheur National Wildlife Refuge, southeastern Oregon. Inflows (left half of the box) are a summation of the main-stem Donner und Blitzen River streamflow measured near Frenchglen and tributary streamflows. Outflows (right half of the box) are the water volumes flowing into Malheur Lake or diverted from the Donner und Blitzen River. Flows into Malheur Lake were measured at Sodhouse Dam, and volumes diverted from the Donner und Blitzen River were measured in canals or along the main stem of the river. Outflows should equal inflows, so the residual is unaccounted outflows.
Discussion
The Malheur National Wildlife Refuge Water for Birds Tool integrates the best available information but could be improved in the future with updated measurements, models, and data availability. Creating a dynamic tool to proactively manage water and habitat for a current or upcoming year is not feasible until diversion measurements become more consistent and are available in near-real time. Some applicable models (such as carp populations in Malheur Lake; Pearson and others, 2019) could not be incorporated in the Water for Birds Tool because the format was not compatible. Updated information can be incorporated in the Water for Birds spreadsheet tool, and real-time data could likely be incorporated if a future iteration of the tool is web based.
The Malheur National Wildlife Refuge’s series of diversion canals, ponds, and wet meadows are complex. Some of the tributaries to the Donner und Blitzen River are diverted before they reach the main stem, which complicates the accounting of water inputs and diversions in the system. In general, the amount of water diverted from the Donner und Blitzen River is estimated, but continuous gaging at the seven major points of diversion would greatly increase the understanding of how much water is needed to inundate wet meadows on the refuge. Some river water returns to the Donner und Blitzen River from the wet meadows, but this has not been quantified to date.
The effects of irrigation practices on water quality in the Donner und Blitzen River are currently unknown. Water-quality models could be developed for locations along the Donner und Blitzen River upstream from Sodhouse Dam to determine where sediment is entering the system and if various management activities are affecting nutrient concentrations in the river. Sediment and nutrient concentrations modeled in this study represent the quality of water entering Malheur Lake, and these modeled concentrations could help resource managers make informed decisions about upstream irrigation practices.
Additional gage and inflow measurements would refine the tool. The Donner und Blitzen River gage near Frenchglen, Oregon, is one of the only active gages in the basin, and most of the water flowing into the refuge is modeled from streamflow measured at that long-term site. Gages along the West Fork Silvies River and Kiger Creek would provide valuable information. Kiger Creek likely provides a substantial amount of water to the refuge based on its large watershed (Garcia and others, 2022a), but Kiger Creek is not currently gaged. Furthermore, the correlation between the West Fork Silvies River and the OWRD gage near Burns is based on data that were collected in the 1970s. Current satellite imagery indicates that the hydrology in this area has likely changed since the 1970s, and updated continuous streamflow measurements would improve overall hydrologic understanding.
The snow water equivalent measured on April 1 at the snow-telemetered Fish Creek site on Steens Mountain shows that 2021–24 were substantially different water years (Natural Resource Conservation Service, 2024). Compared to the 30-year median snow water equivalent on April 1 (27.2 inches [in]), analysis years were moderate (2021, 29.4 in), dry (2022, 18.4 in), and wet (2023, 33 in; 2024, 44 in) in regard to precipitation. The snowpack on Steens Mountain affects the amount of water available for irrigation and habitat on the refuge. Refuge management also affects the amount and types of habitats. Partial water acreage (throughout the full extent of the Malheur National Wildlife Refuge) during irrigation months in the dry year of 2022 was similar to partial water acreage in 2021, which was a moderate precipitation year (Natural Resource Conservation Service, 2024); less water was available to distribute in 2022, but a similar amount of land was irrigated. In dry years when the amount of water available is limited, there may be a tradeoff for water resource managers to make between irrigated wet meadows and waterbird habitat in Malheur Lake.
Relations between Malheur Lake wetted area and acres of habitat for bird guilds reveal potential lake sizes with optimal bird habitat, especially in dry years when water is limited. Malheur Lake areas from about 25,000 to 30,000 acres in size maximize habitat for shorebirds, wading birds, and dabbling ducks. Increasing lake area results in more acres of diving waterbird habitat, but lake areas greater than 30,000 acres can reduce available habitat for the other bird guilds. Future studies could assess the effect of habitat availability on bird abundance and diversity. For example, studies could assess whether shorebird abundance is positively correlated to habitat acreage in Malheur Lake. An updated DEM for Malheur Lake that is more precise than 0.1 m would better inform bird guild habitat assessments.
The Donner und Blitzen River supplied 100 percent of the water flowing into Malheur Lake during irrigation months in 2021 and 2022, 71 percent in 2023, and 89 percent in 2024. These percentages emphasize the importance of Donner und Blitzen River inflows to Malheur Lake for bird habitat. In 2024, FWS measured streamflow at five locations along the main stem of the river, and this approach provided a more thorough accounting of the volume of water diverted for irrigation compared to years like 2021 and 2022 when streamflow was only measured at a few of the major diversions.
In the spreadsheet-based tool, outputs from the Donner und Blitzen River Valley through evapotranspiration and recharge may have been overestimated. Evapotranspiration rates estimated by OpenET are the total consumptive use of water from all sources, which may include sources other than Donner und Blitzen River flood-irrigation water, such as antecedent soil moisture and precipitation. Water diverted from the river in April may be lost through evapotranspiration in July, and ET analyses show that irrigated fields continue to evapotranspire through September and October. Therefore, a comparison of the water volume diverted in a month to the ET volume that month has limitations. Because recharge is calculated as a percentage of ET, the recharge volume could also be affected by other sources of water.
The Malheur National Wildlife Refuge Water for Birds Tool is the first assessment to link water quantity to bird habitat availability on a monthly scale. This type of tool is useful for informing management decisions because it is user-friendly, accessible, and able to be updated by resource managers. The spreadsheet-based format displays the equations used to calculate results, emphasizing transparency and reproducibility. This tool can guide future studies in the basin to ensure they increase our understanding of water use and habitat availability.
Conclusions
Water availability and water management affect the types and quantity of bird habitat throughout the Malheur National Wildlife Refuge during irrigation months. Streamflow diverted from the Donner und Blitzen River can create wet meadow habitat and ponds, whereas water that flows into Malheur Lake can create open water, marsh, and shoreline habitats. During the 2021–24 irrigation seasons, open water habitat within the refuge boundaries ranged from 10,601 acres in July 2022 to 54,056 acres in May 2024. Within Malheur Lake, habitat area was more variable for diving waterbirds (5,216 to 32,820 acres) than other bird guilds like shorebirds (4,909 to 8,797 acres). In this assessment, available bird habitat was determined by water depth, but other habitat quality factors, such as food resource availability, may also determine suitability. Water management decisions may result in tradeoffs in habitat abundance for different bird guilds. In dry water years with low snowpack and streamflow, resource managers could optimize the amount of habitat for specific bird guilds using the Water for Birds Tool developed in this study. Additional streamflow data from the basin should improve water budgets and allow resource managers to make informed decisions on a monthly timescale.
References Cited
Benjamin, J.R., Dunham, J.B., and Penn, C.A., 2023, Simulated growth potential of redband trout in the Donner und Blitzen River Basin, southeastern Oregon, using a bioenergetics model: U.S. Geological Survey data release, accessed January 2025, at https://doi.org/10.5066/P9MAXBZN.
Cornely, J.E., 1982, Waterfowl production at Malheur National Wildlife Refuge, 1942–1980: U.S. Fish and Wildlife Publications 38, p. 559–571, accessed August 2024, at https://digitalcommons.unl.edu/usfwspubs/38.
Earth Resources Observation and Science Center, 2022, USGS EROS archive—Landsat collection 2 level-3 dynamic surface water extent (DSWE) science product: U.S. Geological Survey web page, accessed September 2024, at https://www.usgs.gov/centers/eros/science/usgs-eros-archive-landsat-collection-2-level-3-dynamic-surface-water-extent.
Freed, T.Z., Smith, C.D., and Craver, D., 2021, Stage-volume-area table for Malheur Lake, Oregon, 2021: U.S. Geological Survey data release, accessed August 2024, at https://doi.org/10.5066/P96VJVRQ.
Garcia, C.A., Corson-Dosch, N.T., Beamer, J.P., Gingerich, S.B., Grondin, G.H., Overstreet, B.T., Haynes, J.V., and Hoskinson, M.D., 2022a, Hydrologic budget of the Harney Basin groundwater system, southeastern Oregon: U.S. Geological Survey Scientific Investigations Report 2021–5128, 144 p. [Also available at https://doi.org/10.3133/sir20215128.]
Garcia, C.A., Haynes, J.V., Overstreet, B.T., and Corson-Dosch, N.T., 2022b, Supplemental data—Hydrologic budget of the Harney Basin Groundwater System, Southeastern Oregon, 1982–2016: U.S. Geological Survey data release, accessed January 2025, at https://doi.org/10.5066/P9QABFML.
Gingerich, S.B., Johnson, H.M., Boschmann, D.E., Grondin, G.H., and Garcia, C.A., 2022, Groundwater resources of the Harney Basin, southeastern Oregon: U.S. Geological Survey Scientific Investigations Report 2021–5103, 118 p., https://doi.org/10.3133/sir20215103.
Hubbard, L.L., 1975, Hydrology of Malheur Lake, Harney County, southeastern Oregon: U.S. Geological Survey Water-Resources Investigations Report 75–21, 40 p. [Also available at https://doi.org/10.3133/wri7521.]
Jones, J.W., 2019, Improved automated detection of subpixel-scale inundation—Revised Dynamic Surface Water Extent (DSWE) partial surface water tests: Remote Sensing, v. 11, no. 4, art. 374, 26 p. [Also available at https://doi.org/10.3390/rs11040374.]
Laramie, M.B., Dunham, J.B., Mejia, F.H., Heaston, E.D., and Bisson, P.A., 2023, Fishes of Harney Basin revisited—An assessment of the distribution of native and nonnative fishes over a half century: Northwestern Naturalist v. 104, no. 2, p. 83–98. [Also available at https://doi.org/10.1898/NWN22-05.]
Mayer, T., Roy, R., Hallock, T., and Janssen, K., 2007, Hydrology and water quality at Malheur National Wildlife Refuge: U.S. Fish and Wildlife Service, Agency report, Portland, Oregon, 131 p. [Also available at https://ecos.fws.gov/ServCat/DownloadFile/5535?Reference=5826.]
Natural Resource Conservation Service, 2024, Air and water database report generator: U.S. Department of Agriculture website, accessed September 2024, at https://wcc.sc.egov.usda.gov/reportGenerator/.
OpenET, 2023, OpenET explore data: OpenET website, accessed August 2023, at https://openetdata.org/.
Pearson, J., Dunham, J., Bellmore, J.R., and Lyons, D., 2019, Modeling control of common carp (Cyprinus carpio) in a shallow lake–wetland system: Wetlands Ecology and Management, v. 27, nos. 5–6, p. 663–682. [Also available at https://doi.org/10.1007/s11273-019-09685-0.].
Safran, R.J., Isola, C.R., Colwell, M.A., and Williams, O.E., 1997, Benthic invertebrates at foraging locations of nine waterbird species in managed wetlands of the northern San Joaquin Valley, California: Wetlands, v. 17, p. 407–415, accessed January 2025, at https://doi.org/10.1007/BF03161430.
Schaffer-Smith, D., Swenson, J.J., Reiter, M.E., and Isola, J.E., 2018, Quantifying shorebird habitat in managed wetlands by modeling shallow water depth dynamics: Ecological Applications, v. 28, p. 1534–1545. [Also available at https://doi:10.1002/eap.1732.]
Simeone, C.E., Torgersen, C.E., Dunham, J.B., Overstreet, B.T., Diabat, M., Miwa, C., and Haggerty, P., 2024, Airborne thermal infrared and high-resolution true-color imagery and longitudinal profiles of stream temperatures, Upper Donner und Blitzen River Basin, Oregon, August 2020: U.S. Geological Survey data release. [Also available at https://doi.org/10.5066/P9FXCJ9B.]
Smith, C.D., and Jones, J.W., 2024, Water for Birds—A spreadsheet-based tool for the Malheur National Wildlife Refuge for irrigation months in 2021–2024: U.S. Geological Survey data release, https://doi.org/10.5066/P1AJAYVS.
Smith, C.D., and Wood, T.M., 2023, Implications of water, sediment, and nutrient budgets for the restoration of a shallow, turbid lake in semiarid southeastern Oregon: U.S. Geological Survey Scientific Investigations Report 2023–5098, 31 p. [Also available at https://doi.org/10.3133/sir20235098.]
Taft, O.W., Colwell, M.A., Isola, C.R., and Safran, R.J., 2002, Waterbird responses to experimental drawdown—Implications for the multispecies management of wetland mosaics:Journal of Applied Ecology, v. 39, p. 987–1001. [Also available at https://doi.org/10.1046/j.1365-2664.2002.00763.x.]
Thorson, J.M., Heck, M.P., Hockman-Wert, D.P., and Dunham, J.B., 2022, Stream temperature in the Donner und Blitzen basin, southeastern Oregon, 2018-2021: U.S. Geological Survey data release, accessed January 2025, at https://doi.org/10.5066/P99OA4KU.
U.S. Fish and Wildlife Service, 2013, Chapter 1—Introduction and background, in Malheur National Wildlife Refuge comprehensive conservation plan: U.S. Fish and Wildlife Service, prepared by Malheur National Wildlife Refuge, Portland, Oreg., 40 p., accessed September 2024, at https://malheurfriends.org/about-malheur/refuge-comprehensive-conservation-plan.
U.S. Fish and Wildlife Service, 2024a, River discharge dataset for Blitzen River below Sodhouse Dam at Malheur National Wildlife Refuge: U.S. Fish and Wildlife Service tabular dataset, U.S. Fish and Wildlife Service website, accessed September 2024, at https://ecos.fws.gov/ServCat/Reference/Profile/142076.
U.S. Fish and Wildlife Service, 2024b, River discharge dataset for selected locations on diversions from the Blitzen River at Malheur National Wildlife Refuge: U.S. Fish and Wildlife Service Tabular Dataset, accessed September 2024, at https://ecos.fws.gov/ServCat/Reference/Profile/170108.
U.S. Geological Survey, 2023, National Hydrography Dataset Plus Version 2, accessed October 2023, at https://www.usgs.gov/national-hydrography/access-national-hydrography-products.
U.S. Geological Survey, 2024, National Water Information System—Web interface: U.S. Geological Survey web page, accessed September 2024, at https://waterdata.usgs.gov/nwis.
Wood, T.M., and Smith, C.D., 2022, Light attenuation and erosion characteristics of fine sediments in a highly turbid, shallow, Great Basin Lake—Malheur Lake, Oregon 2017–18: U.S. Geological Survey Scientific Investigations Report 2022–5056, 51 p. [Also available at https://doi.org/10.3133/sir20225056.]
Appendix 1. Calculating Wetted Area
Determine How Many Satellite Images Were Used for the Month
The “number of observations” raster includes background zeros around the area of interest (AOI); these zeros affect the statistics, including the mean and standard deviation. To remove zeros from the raster statistics, navigate to the raster in the “Catalog” pane. Right-click and select “Calculate Statistics.” In the “Geoprocessing” box that opens, change the “Ignore Values” box by adding a 0. Then select “Run.” In the “Contents” pane, right-click the raster and open “Properties.” Select “Source” and then the drop-down arrow next to “Statistics.” These are the updated statistics regarding the number of observations for the month.
Count the Number of Pixels for Each Category
Three categories of DSWE data were assessed: (1) the area of open water was quantified for the entire refuge AOI, (2) the area of partial water was quantified for the entire refuge AOI, and (3) the total wetted area (open and partial pixels) was quantified for the Malheur Lake area. The data contained in a DSWE proportion raster is a proportion (0–100) of the number of satellite images that showed open water for a given pixel over the time interval. For example, in May 2023, a minimum of 1 and maximum of 6 satellite images were available. As long as one satellite image showed open water in the month, the pixel (and area) was considered open water in this tool. The same rule applied for partial water pixels and total water pixels (open and partial surface water pixels combined) assessed monthly.
Monthly Analyses for Refuge AOI (April–July 2021–24)
To calculate the area of open water and partial water throughout the Malheur National Wildlife Refuge for a month:
-
1. Highlight and select the “Open-water” raster in the “Contents” pane. Then, open the “Symbology” pane by clicking the “Symbology” tab at the bottom right. Change “Primary” symbology to “Classify.” Ensure the “Method” is set to “Natural Breaks (Jenks),” and change “Classes” to “2.” Click in the “Upper value” cell that has the lower number and change it to “5.” Click once in the cell below so Arc updates the fields. The “Method” automatically changes to “Manual Interval.” This will create two groups of open water.
-
2. Reclassify the “Open-water” raster with updated symbology by using the “Reclassify Tool.” Click once on “Reclassify” in ArcToolbox. Drag the open_sw_proportion.tif in as the “Input” raster. Change the “Output” raster name to end with “Month_Year_open.” Select “Run.”
-
3. Scroll to the top of the “Contents” pane and find the new reclass file. Open the attribute table. Record the count for “category 1” (0.001–5) and “category 2” (5.001–100). The pixel count was multiplied by the area of the pixel (900 square meters) to calculate the area of open water for that month.
-
4. Repeat steps 1–3 for the “partial water” raster.
Monthly Analyses for Malheur Lake AOI (April–July 2021–24)
To calculate the total area of water (open and partial) for Malheur Lake for a month:
-
1. Follow steps 1 and 2 in the “Monthly Analyses for Refuge AOI (April–July 2021–24)” section to change the symbology and reclassify the “total_sw_proportion.tif” for the month of interest.
-
2. Clip the reclassified raster to an AOI encompassing Malheur Lake; the “Study Area” shapefile is archived in Smith and Jones (2024) for this step. In ArcToolbox, navigate to the “Clip Raster” tool. Use the new reclassified raster as the “Input Raster.” Use the “Study Area” shapefile as the output extent. Check the box “Use Input Features for Clipping Geometry,” then select “Run.”
-
3. Scroll to the top of the “Contents” pane and find the newly clipped reclass file. Open the attribute table and record the count for “category 2” (5.001–100). The pixel count was multiplied by the area of the pixel (900 square meters) to calculate the total area of water (open and partial) for Malheur Lake that month.
Datums
Vertical coordinate information is referenced to the North American Vertical Datum of 1988 (NAVD 88).
Supplemental Information
Concentrations of chemical constituents in water are in milligrams per liter (mg/L).
A water year is the 12-month period from October 1 through September 30 of the following year and is designated by the calendar year in which it ends.
For more information about this publication, contact
Director, U.S. Geological Survey Oregon Water Science Center
601 SW Second Avenue, Suite 1950
Portland, Oregon 97204
For additional information, visit https://www.usgs.gov/centers/oregon-water-science-center
Publishing support provided by the Tacoma Publishing Service Center
Disclaimers
Any use of trade, firm, or product names is for descriptive purposes only and does not imply endorsement by the U.S. Government.
Although this information product, for the most part, is in the public domain, it also may contain copyrighted materials as noted in the text. Permission to reproduce copyrighted items must be secured from the copyright owner.
Suggested Citation
Smith, C.D., 2025, Managing water for birds—A tool for the Malheur National Wildlife Refuge, southeastern Oregon: U.S. Geological Survey Scientific Investigations Report 2025–5024, 21 p., https://doi.org/10.3133/sir20255024. [Supersedes preprint https://doi.org/10.32942/X2N03N.]
ISSN: 2328-0328 (online)
Study Area
| Publication type | Report |
|---|---|
| Publication Subtype | USGS Numbered Series |
| Title | Managing water for birds—A tool for the Malheur National Wildlife Refuge, southeastern Oregon |
| Series title | Scientific Investigations Report |
| Series number | 2025-5024 |
| DOI | 10.3133/sir20255024 |
| Publication Date | May 16, 2025 |
| Year Published | 2025 |
| Language | English |
| Publisher | U.S. Geological Survey |
| Publisher location | Reston, VA |
| Contributing office(s) | Oregon Water Science Center |
| Description | Report: vii, 21 p.; Data Release |
| Country | United States |
| State | Oregon |
| Other Geospatial | Malheur National Wildlife Refuge |
| Online Only (Y/N) | Y |