

Time of Travel of Releases From Lake Wallenpaupack to the U.S. Geological Survey’s Streamgage Monitoring Location on the Delaware River at Montague, New Jersey
Links
- Document: Report (13.5 MB pdf) , HTML , XML
- NGMDB Index Page: National Geologic Map Database Index Page (html)
- Download citation as: RIS | Dublin Core
Acknowledgments
The authors wish to express their gratitude to Brookfield Renewable U.S. for providing water level elevation data of the releases from Lake Wallenpaupack, scheduled every five years for maintenance, that facilitated this study. The authors would also like to extend their appreciation to the field crews from the Pennsylvania, New York, and New Jersey Water Science Centers for their diligent maintenance of the real-time streamgages that supplied crucial data for this study.
Abstract
In 2016, the U.S. Geological Survey (USGS) carried out a hydraulic study within the upper Delaware River Basin for the purpose of determining the time of travel for water releases from the Brookfield Renewable U.S. hydroelectric plant at Lake Wallenpaupack, Pennsylvania, to reach the USGS streamgage located on the Delaware River at Montague, New Jersey (site number 01438500). From September 19 to October 14, 2016, Brookfield Renewable initiated repeated releases of approximately 650 cubic feet per second (ft3/s) and 1,440 ft3/s. Hydraulic signals from the releases were tracked at nine key locations between Lake Wallenpaupack and the USGS streamgage at Montague, New Jersey (01438500). Gage height data were recorded at streamgages at major confluences of the Lackawaxen and Delaware Rivers, Mongaup and Delaware Rivers, and the Neversink and Delaware Rivers. The time of travel to the USGS streamgage at Montague, New Jersey, was determined to be 1,185 minutes during the approximately 650 ft3/s releases and 960 minutes during the approximately 1,440 ft3/s releases. Elevated streamflow between Lake Wallenpaupack and the Montague streamgage from runoff events prior to the dam releases was found to decrease calculated time of travel identified during the study. The results from this study can be used as a guide to estimate time of travel while considering the water level of downstream streamflow, the volume of water being released, and other outside influences, such as precipitation and snowmelt.
Introduction
The Delaware River Basin (fig. 1), which flows from New York, through Pennsylvania, New Jersey, and Delaware, comprises 13,579 square miles and provides water for over 14.2 million people (Delaware River Basin Commission, 2023). The 330-mile-long Delaware River originates in Hancock, New York (N.Y.; fig. 1), where the East and West Branch Delaware Rivers combine (Delaware River Basin Commission, 2023). The mouth is in the Delaware Bay, between Cape May, New Jersey (N.J.), and Lewes, Delaware (Del.), where it empties into the Atlantic Ocean (fig. 1). The river is comprised of freshwater from its headwaters in New York to Trenton, N.J., where it becomes tidally influenced south through the Delaware Bay (Delaware River Basin Commission, 2023). Waters between Trenton, N.J., and Philadelphia, Pennsylvania (Pa.), are mostly fresh, transitioning to brackish at Wilmington, Del., and saltwater in Delaware Bay (Delaware River Basin Commission, 2023). Each day, about 6.4 billion gallons of water are withdrawn for water use, with the top uses being thermoelectric and hydroelectric power generation, public water supply, and industry (Delaware River Basin Commission, 2023). About 850 million of those gallons are for consumptive use, meaning the water is withdrawn and not returned (Delaware River Basin Commission, 2023). Most of the consumptive use is withdrawn to supply New York City and northern New Jersey (Delaware River Basin Commission, 2023).
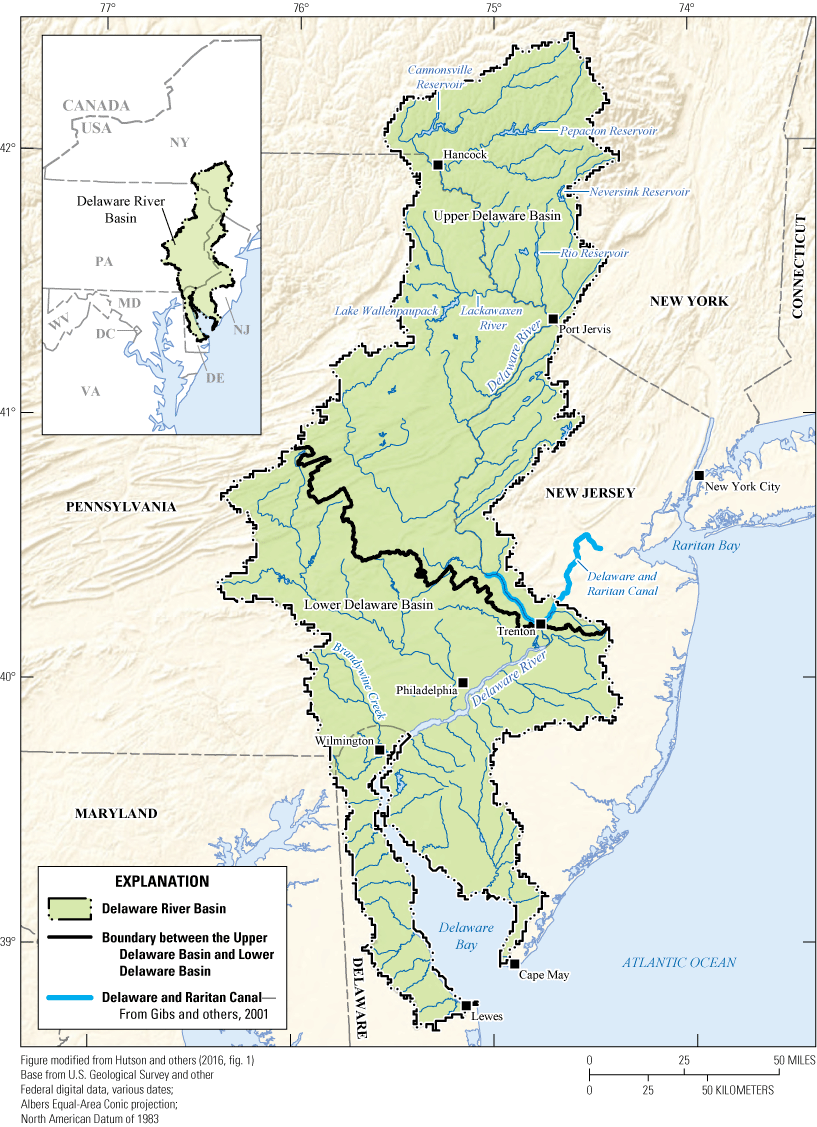
Map of the Delaware River Basin (Hutson and others, 2016).
In 1931, a decree was established over concerns to meet demand for populations downstream of New York State while allowing 440 million gallons per day (Mgal/d) to be drawn to supply New York City (New Jersey v. New York, 283 U. S. 337 [1931], Holmes and Supreme Court, 1930). The U.S. Supreme Court decreed, in the case New Jersey v. New York, 283 U.S. 336 (1931), Holmes and Supreme Court, 1930, that a minimum passing flow of 1,535 cubic feet per second (ft3/s) at the Delaware River in Port Jervis, N.Y., and 3,400 ft3/s at the Delaware River in Trenton, N.J. be maintained. Two reservoirs were initially built by New York City to accommodate their water needs, both completed and operational in 1955. The Neversink Reservoir, located on the Neversink River, and the Pepacton Reservoir, located on the East Branch of the Delaware River, are tributaries that feed into the Delaware River (fig. 1; U.S. Geological Survey, undated a).
The decree was amended in 1954 (New Jersey v. New York, 347 U.S. 995 [1954], U.S. Supreme Court, 1954) to accommodate the demand for water in New York City. The diversion limit was increased to 800 Mgal/d after a third reservoir was finished being constructed (347 U. S. 997 [1954], U.S. Supreme Court, 1954). This third reservoir, the Cannonsville Reservoir on the West Branch of the Delaware River, was completed in 1967 (U.S. Geological Survey, undated a). In addition, the 1954 amendment to the decree (347 U. S. 997-998 [1954], U.S. Supreme Court, 1954) ensured a minimum passing flow of 1,750 ft3/s during non-drought conditions to supply downstream populations, monitored at the U.S. Geological Survey (USGS) Delaware River at Montague, N. J. (USGS site 01438500) streamgage, hereafter referred to as Delaware River at Montague. Another change to the decree (347 U. S. 1002 [1954], U.S. Supreme Court, 1954) included an allowance of 100 Mgal/d diversion through the Delaware and Raritan Canal (fig. 1) for central and northeast New Jersey water supplies (U.S. Geological Survey, undated a).
The 1931 decree and 1954 amended decree led to the establishment of the Office of the Delaware River Master (ODRM), charged with directing releases from the New York City reservoirs to maintain minimum passing flow. The critical role of the ODRM is to quantify the amount of flow daily with the influences of precipitation, baseflow, and powerplant production but without releases from New York City reservoirs. If the forecasted passing flow at Delaware River at Montague is projected to be below 1,750 ft3/s, the River Master will design and direct releases from the Neversink, Pepacton, and Cannonsville Reservoirs, all located in New York State and drawn upon for New York City water supply (U.S. Geological Survey, undated b).
The ODRM annual report from 1955 describes “a preliminary study of gaging station recorder traces” that established average travel times for releases from the Rio, Wallenpaupack, Neversink, and Pepacton Reservoirs to reach the Delaware River at Montague (Paulsen, 1956, p. 10). The recorder traces were in conjunction with directed releases from the reservoirs. A second, “more detailed study,” was also described in Paulsen’s report, though more details of the studies are not defined (1956). Time of travel from Lake Wallenpaupack releases to Delaware River at Montague was found to be the same for both studies, 16 hours or 960 minutes (Paulsen, 1956, p. 10–11.) The ODRM currently uses these results to estimate travel times for Lake Wallenpaupack releases.
The goal of this study was to (1) confirm or improve the time of travel estimate from the 1955 study, (2) better understand the time and attenuation of releases from Lake Wallenpaupack to Delaware River at Montague, and (3) ascertain any factors that may influence time of travel. These data will be useful to the ODRM so they can more accurately predict flow at Delaware River at Montague and perhaps decrease releases at New York City reservoirs when predicted flow limits allow. Brookfield Renewable U.S., hereafter referred to as Brookfield Renewable, owns Lake Wallenpaupack, a 5,700-acre lake with a hydroelectric generation facility (Lake Wallenpaupack Watershed Management District, 2025). Water released from the Lake Wallenpaupack hydroelectric dam flows into Wallenpaupack Creek, which drains into the Lackawaxen River and then the Delaware River (fig. 1). From September 19 to October 14, 2016, Brookfield Renewable altered their release patterns from Lake Wallenpaupack for regularly scheduled inspections and maintenance that occurs every five years (Tri-County Independent, 2021). The pattern of releases created a distinct signal that could be tracked down the Lackawaxen River to the confluence with the Delaware River, then further to the Delaware River at Montague streamgage. From September 19 to October 2, there were 13 releases of approximately 650 ft3/s for the duration of 16–20 hours, with an average break of 6.7 hours in between releases. From October 5 to 14, there were 9 releases of approximately 1,440 ft3/s lasting 15.5–18 hours, with an average break of 7 hours between releases.
Purpose and Scope
The purpose of this report is to provide data about how quickly releases from Lake Wallenpaupack travel along the Lackawaxen River and to the Delaware River at Montague (01438500) streamgage. This study examined how the timing and attenuation of releases from the hydroelectric plant on Lake Wallenpaupack would affect flows by analyzing the time of travel for scheduled releases to reach the Delaware River at Montague streamgage. This information about scheduled releases could allow the ODRM to schedule releases with increased accuracy, thus allowing the New York City reservoirs at Neversink, Pepacton, and Cannonsville to release less water while still maintaining the decreed minimum passing flow.
Study Area
The area of this study is focused on the tripoint of New York, New Jersey, and Pennsylvania. Brookfield Renewable hydroelectric facility is located on Lake Wallenpaupack, Pennsylvania, which drains into the Lackawaxen River. Furnished record provided by Brookfield Renewable is labeled as site 01432045 (fig. 2). Two streamgages, sites 01432110 and 01432119, used for this study are located downstream of the Brookfield Renewable hydroelectric facility along the Lackawaxen River, which drains into the Delaware River (fig. 2). Two streamgages are located on the Mongaup River, downstream of Rio Reservoir in New York (sites 01433455 and 01433510). One streamgage is located below the Neversink River confluence with the Delaware River, downstream of the Neversink Reservoir in New York (site 01438180; fig. 2). Five additional streamgages used in the study are located on the Delaware River (sites 01432120, 01432160, 0143351103, 01434000, and 01438500; fig. 2). The farthest site downstream from Lake Wallenpaupack is Delaware River at Montague, N.J. (site 01438500; fig. 2).
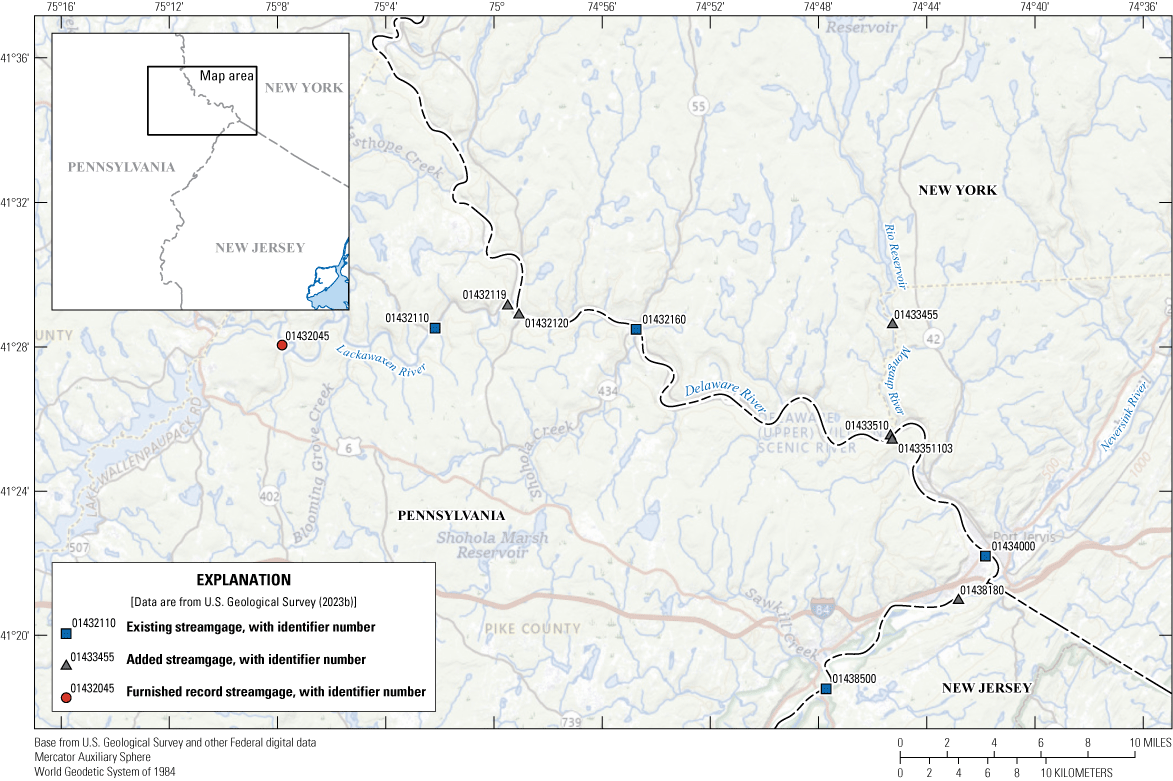
Map showing existing, added, and furnished record streamgages in the study area.
Methods and Approach
To track the releases from Lake Wallenpaupack, streamgages were utilized at key locations upstream and downstream of major confluences to separate reservoir release signals from the influence of other reservoirs and rivers. The Rio Reservoir drains into the Mongaup River, which enters the Delaware River downstream of the Lackawaxen River and Delaware River confluence. The Neversink Reservoir drains into the Neversink River, which enters the Delaware River downstream of the Mongaup River and Delaware River confluence. Both inflows are upstream of the Delaware River at Montague streamgage. Releases from the Rio and Neversink Reservoirs could increase flow and potentially impede signals from the Lake Wallenpaupack releases, depending on their magnitude. Additionally, river flow from the Delaware River upstream of the Lackawaxen River confluence, the Mongaup River below the Rio Reservoir, and the Neversink River below the Neversink Reservoir must be compared. Elevated flows due to precipitation events could influence the reservoir release signals downstream at Delaware River at Montague. To satisfy this, key sites were selected and additional streamgages were installed along the Delaware River, below the Rio Reservoir, and below the Neversink Reservoir. Refer to “Data Collection” for more details about site selection locations.
Data Collection
Data for this study came from the following three sources: (1) existing real-time streamgages (U.S. Geological Survey, 2023b), (2) added streamgages to augment the existing real-time streamgage network (U.S. Geological Survey, 2023b), and (3) furnished records for site 01432045 provided by Brookfield Renewable (Katie Lester, written commun., 2016). Data from all streamgages and the furnished record are publicly available online in the National Water Information System Database (U.S. Geological Survey, 2023b, also available at https://doi.org/10.5066/F7P55KJN). Streamgages are located along the Lackawaxen River downstream of Brookfield Renewable, Mongaup River downstream of Rio Reservoir, and Delaware River (fig. 2).
USGS Real-Time Streamgages
Data from the USGS real-time streamgages were collected, analyzed, and approved by their respective USGS water science centers prior to use in this study. Gage height (the height of the water surface referenced to the streamgage datum elevation) and streamflow (the volume of water moving downstream per unit of time) records were used in this study from the streamgages listed in table 1.
Table 1.
U.S. Geological Survey real-time streamgages, added streamgages, drainage areas, and respective U.S. Geological Survey water science centers responsible for them, as of January 2025.[Real-time streamgage data are from U.S. Geological Survey (2023b). Added streamgage data are from U.S. Geological Survey (2023a). USGS, U.S. Geological Survey; mi2, square miles]
Gage height is recorded at these sites using one of the following two methods: (1) a stilling well with an encoder or (2) a vented non-submersible pressure transducer. The stilling well has a small inlet that connects to the channel flow so that the water elevation of the channel matches the water elevation in the well. Inside the well, there is a float and shaft encoder. The float is attached to the bottom of a steel measuring tape that wraps around the rotational encoder. The encoder interprets gage height by measuring incremental changes in the position of the float wheel or shaft as it rotates with changing water heights. The water level is verified inside the well using an electric tape gage, which is another steel measuring tape with a weight at the bottom that is lowered to the water surface to obtain a reading. The water level is also verified outside of the well by either reading a fixed staff gage, which is a vertical graduated ruler in the river, or by measuring above or below a reference point in the channel at a known surveyed elevation using a steel measuring tape or engineer’s ruler. The Delaware River at Montague (01438500) and Delaware River at Port Jervis (01434000) streamgages use the stilling well and encoder method to determine gage height.
The Lackawaxen River at Rowland (01432110) and Delaware River at Barryville (01432160) streamgages use a pressure transducer to measure gage height. The pressure transducer calculates the water level by determining the pressure exerted on the water in the gage pool on the orifice mounted in the stream channel and converting it to a depth or head. The gage height reading computed by the pressure transducer is also independently verified using a staff gage and reference point readings located in the channel to confirm the readings are accurate. Refer to “Stage Measurement at Gaging Stations” for more details on these methods (Sauer and Turnipseed, 2010, p. 6–21).
Gage height data were collected at 15-minute intervals from September 19 to October 14, 2016, coinciding with Brookfield Renewable's scheduled releases of approximately 650 ft3/s from September 19 to October 2, followed by approximately 1,440 ft3/s from October 5 to October 14.
USGS Added Streamgages
To track the signal of the releases more accurately, the existing real-time streamgages were supplemented with newly installed streamgages deployed at key locations (table 1). From September 19 to October 14, 2016, gage height data were recorded at 5-minute intervals during Brookfield Renewable's repeated releases. These streamgages consist of surveyed reference points and unvented pressure transducers installed in the river. Unvented pressure transducers measure total pressure, being the pressure of water above the transducer and the atmospheric pressure. Centrally located barometric pressure transducers supplemented the unvented transducers and were used to correct for the influence of atmospheric pressure and define water pressure exclusively. Water pressure was converted to feet of water above sensor using the standard density for freshwater, 62.428 pounds per cubic foot (U.S. Geological Survey, 2018).
Water temperature data were collected at each streamgage as supplementary data. Though water temperature can be used to compute water density, the standard density of freshwater was used instead since there were no independent temperature checks during field visits to verify data accuracy. Changes in water temperature can also be associated with water releases upstream, which is why these supplemental data were collected. The water temperature method of pinpointing the timing of water release signals was not used; refer to the “Water Temperature Analysis” section of this study for further details.
Global Navigation Satellite System (GNSS) rapid static surveys were conducted on the reference point at each site to establish datum above North American Vertical Datum of 1988 (NAVD88). The rapid static surveys (single-base Online Position Users Service-Rapid Static [OPUS-RS] surveys) were of level III quality with an occupation of at least 15 minutes on each reference point, per the standards listed in the “Methods of Practice and Guidelines for Using Survey-Grade Global Navigation Satellite Systems (GNSS) to Establish Vertical Datum in the U.S. Geological Survey” (Rydlund and Densmore, 2012, p. 44).
Differential leveling surveys were conducted at each streamgage, which were then tied into NAVD88, to provide an established datum for each site. Differential leveling surveys involve using an electronic digital level that reads a bar code on a leveling rod. The rod is placed on points of known elevations and then on points of unknown elevations so that their elevation can be calculated. The known elevation points were found using the GNSS rapid static surveys, and then unknown reference points at each streamgage were found using differential leveling surveys. A more in-depth explanation of differential leveling surveys can be found in “Levels at Gaging Stations” (Kenney, 2010). The elevations found in the surveys were used to establish gage height for use in this study, which was then compared between the different streamgage locations to calculate the time of travel. Published gage height data are related to localized, arbitrary site datums for ease of reference point checks during field visits.
Sensor calibration was checked by comparing reference readings to recorded values during the deployment and recovery inspections. Any observed difference in the recorded values greater than 0.01 feet resulted in a correction being applied to those recorded values, following USGS standard procedures in “Stage Measurement at Gaging Stations” (Sauer and Turnipseed, 2010, p. 4).
The Lackawaxen River at Mouth at Lackawaxen, Pa. (01432119) streamgage, located upstream of the Lackawaxen River and Delaware River confluence, and Delaware River below Lackawaxen, Pa. (01432120) streamgage, located downstream of the confluence, were installed to separate the signal from the releases from the influence of the Delaware River above the Lackawaxen River (fig. 3).
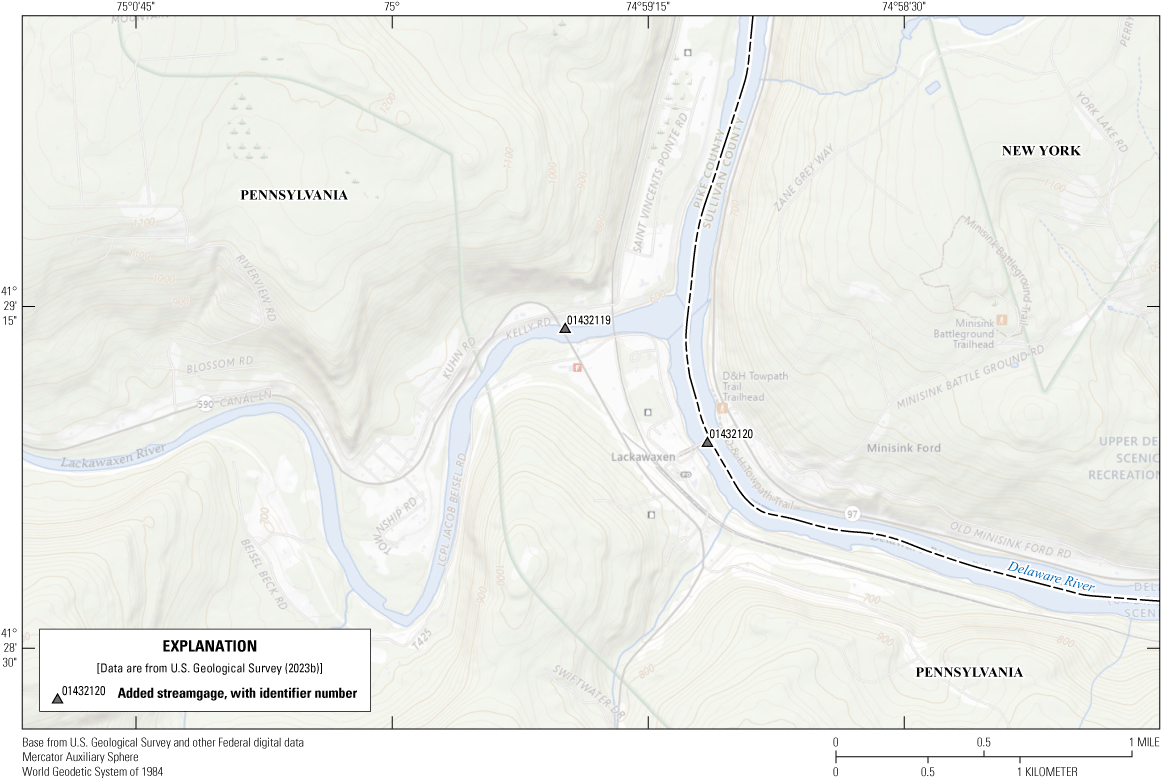
Map of the confluence of the Lackawaxen and Delaware Rivers.
The streamgages Mongaup River at Rio Reservoir at Rio, N.Y. (01433455), Mongaup River at Mongaup, N.Y. (01433510), both located upstream of the Mongaup River and Delaware River confluence, and Delaware River below Mouth of Mongaup River, N.Y. (0143351103), shown in figure 4, were installed to separate the signal from the releases from the influence of additional releases from Rio Reservoir.
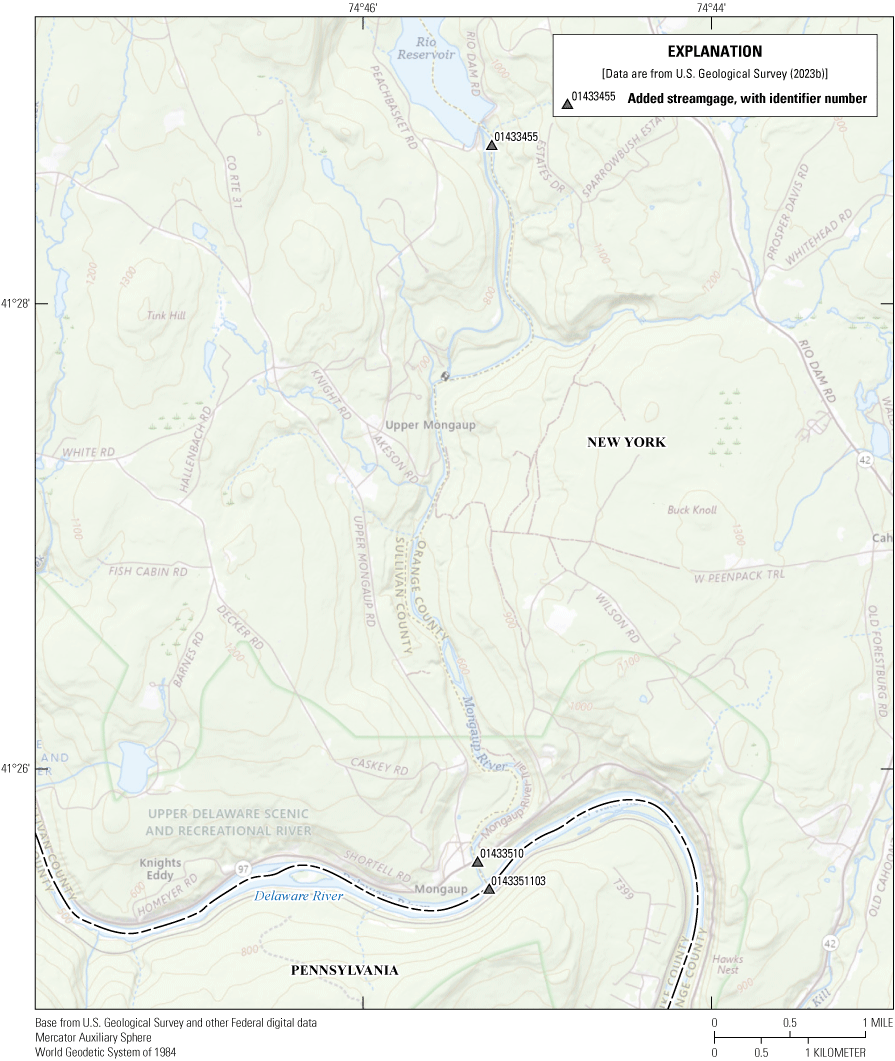
Map of the confluence of the Mongaup and Delaware Rivers.
Lastly, the Delaware River at Hunt’s Landing near Matamoras, Pa. (01438180) streamgage, located downstream of the Neversink River and Delaware River confluence, was installed to separate signal from the releases from the influence of the Neversink River, which enters the Delaware River below the Port Jervis, N.Y., real-time streamgage (01434000; fig. 5).
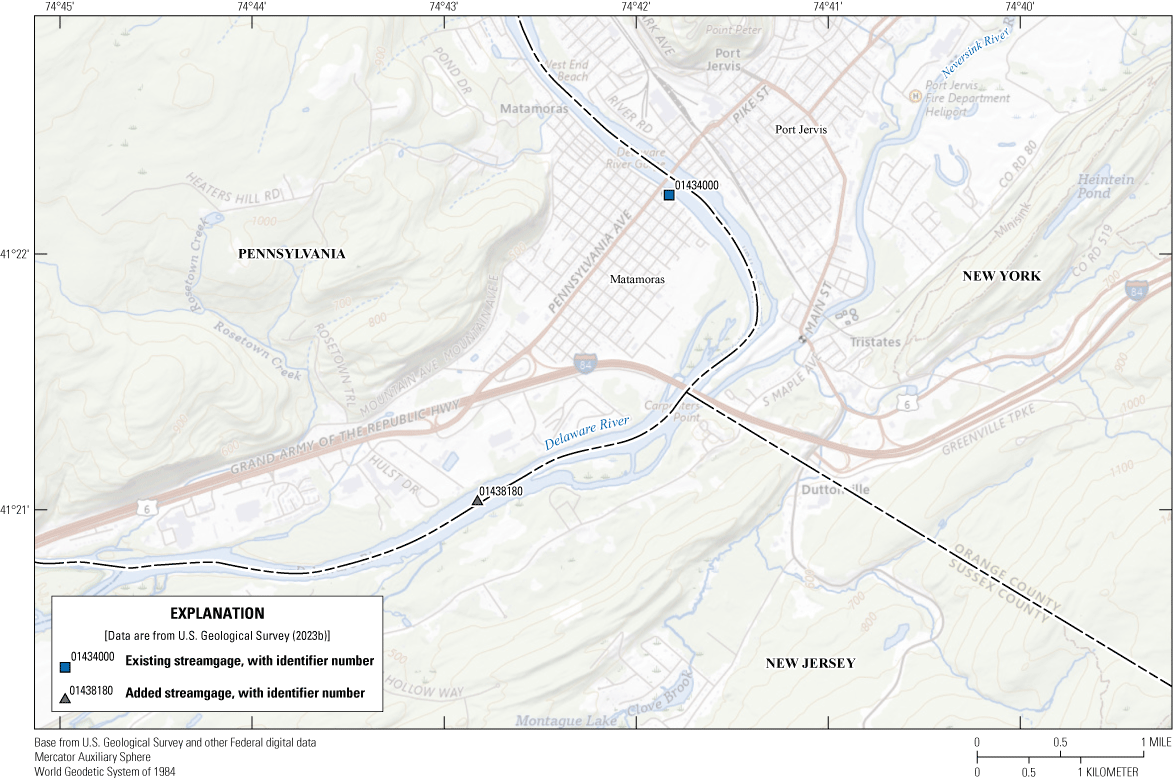
Map of the confluence of the Neversink and Delaware Rivers.
Furnished Record
Gage height and discharge records were provided by Brookfield Renewable and entered as site 01432045 Lake Wallenpaupack Diversion at Power Plant at Kimble, Pa. (U.S. Geological Survey, 2023b). The records provided data from September 14 through October 21, 2016, at 15-minute timestep intervals. Their methodology for collection and computation was not evaluated for this study, but the data provided compares favorably with the data from Lackawaxen River at Rowland, Pa. (01432110), located downstream of the diversion. The discharge data provided does not include flow from the Lackawaxen River. Hydrographs for both streamgages were plotted together to examine if they had the same patterns and increased or decreased at similar magnitudes in gage height. All release patterns from the Lake Wallenpaupack Diversion at Power Plant at Kimble, Pa., streamgage were seen at the Lackawaxen River at Rowland, Pa., streamgage, thus confirming the accuracy of data from Brookfield Renewable (fig. 6).
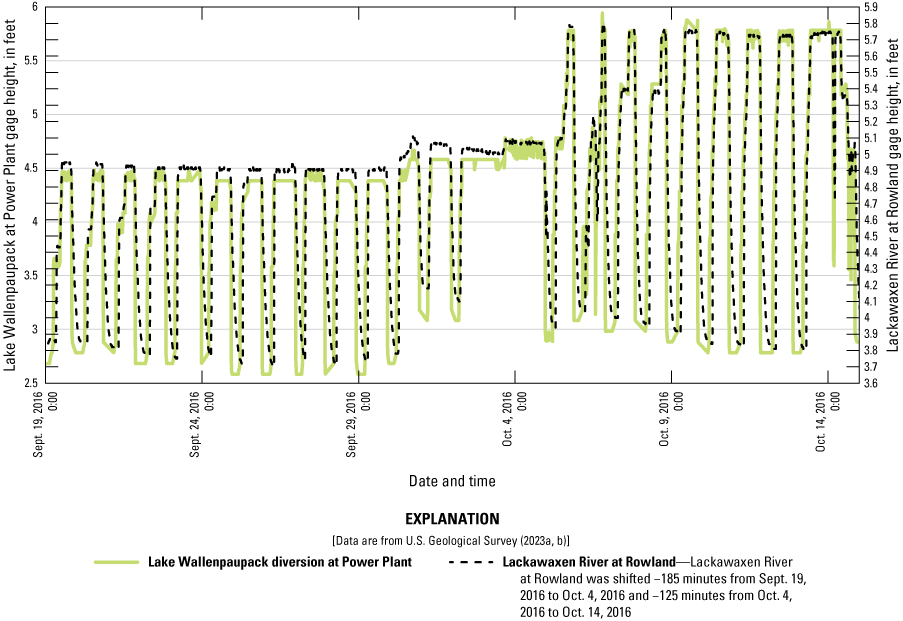
Chart showing the reservoir release data from Lake Wallenpaupack Diversion at Power Plant at Kimble, Pennsylvania (01432045) and Lackawaxen River at Rowland, Pennsylvania (01432110). Dates shown as month/day/year. Sample time shown in military time (24-hour clock).
Interpretation and Methodology
Several methods of time of travel analysis and computation were investigated as part of this study. These included defining time of travel by leading edge analyses, peak analyses, and graphical analyses that involved comparison of hydrographs throughout the study area. In addition, use of water temperature as a surrogate for determining time of travel was also investigated. Refer to the sections on “Water Temperature Analysis,” “Time of Travel Analysis,” and “Leading Edge Analysis” for discussions on the background behind these methods, issues encountered, and, ultimately, whether they were successful at defining time of travel between releases at Lake Wallenpaupack and the streamgage at Montague, N.J.
Water Temperature Analysis
At the beginning of the study, it was surmised that water temperature might be useful for tracking the signal of the releases. Water temperature differences were quickly determined to not be meaningful in this study. While releases do have a clear effect on water temperature, natural daily fluctuations in water temperature are of a larger scale than the temperature changes caused by the release. When comparing water temperature to gage height at Lackawaxen at Mouth at Lackawaxen, Pa. (01432119), the spike in water temperature occurs at the beginning of the release, occasionally preceding any rise in gage height and has no consistently definable relationship to the main flow going down the channel.
Time of Travel Analysis
To define how long it takes for releases from Lake Wallenpaupack to reach Delaware River at Montague, it was first necessary to investigate methods to define the travel time for releases from Lake Wallenpaupack to reach Delaware River at Montague. The following methods were considered: “Leading Edge Analysis,” “Peak Analysis,” and “Graphical Analysis.”
Leading Edge Analysis
One method to determine time of travel is with leading edge analysis, defining the amount of time between the beginning of a release and the first observable rise in gage height at the site of interest (Jobson, 1996). Leading edge analysis is commonly used in studies looking for the arrival time of a pollutant or spill to reach downstream sites of interest (Jobson, 1996). Attempting to calculate time of travel in this manner was complicated by the nature of the releases themselves. Releases from Lake Wallenpaupack come in stages, presumably as multiple turbines are turned on in sequence. The stages of release are not consistent, as the partial releases last 2 to 6 hours. This complicates matters further since the magnitude of the release affects the speed at which it travels down the channel. This method did not create a stable relationship between individual releases. Refer to figure 7 for a visual of the initial release timing and the gage height affect downstream at Delaware River at Montague.
While the leading edge may be visible in figure 7B, the analysis is complicated by the fact that the observed rise in gage height does not solely reflect the timing of the release; the existing flow conditions in the Lackawaxen and Delaware Rivers and the varying magnitudes of the releases also influenced the analysis. As a result, the relationship between individual releases and their corresponding gage height responses becomes unstable and difficult to interpret. The variability in existing river flow conditions and release magnitudes means that the leading edge alone may not consistently represent the true travel time for the reservoir release to reach the downstream location. The flow variability and channel dynamic exist for all conditions, but analyzing the entire shape offers an advantage and helps fit the timing better than just the leading edge.
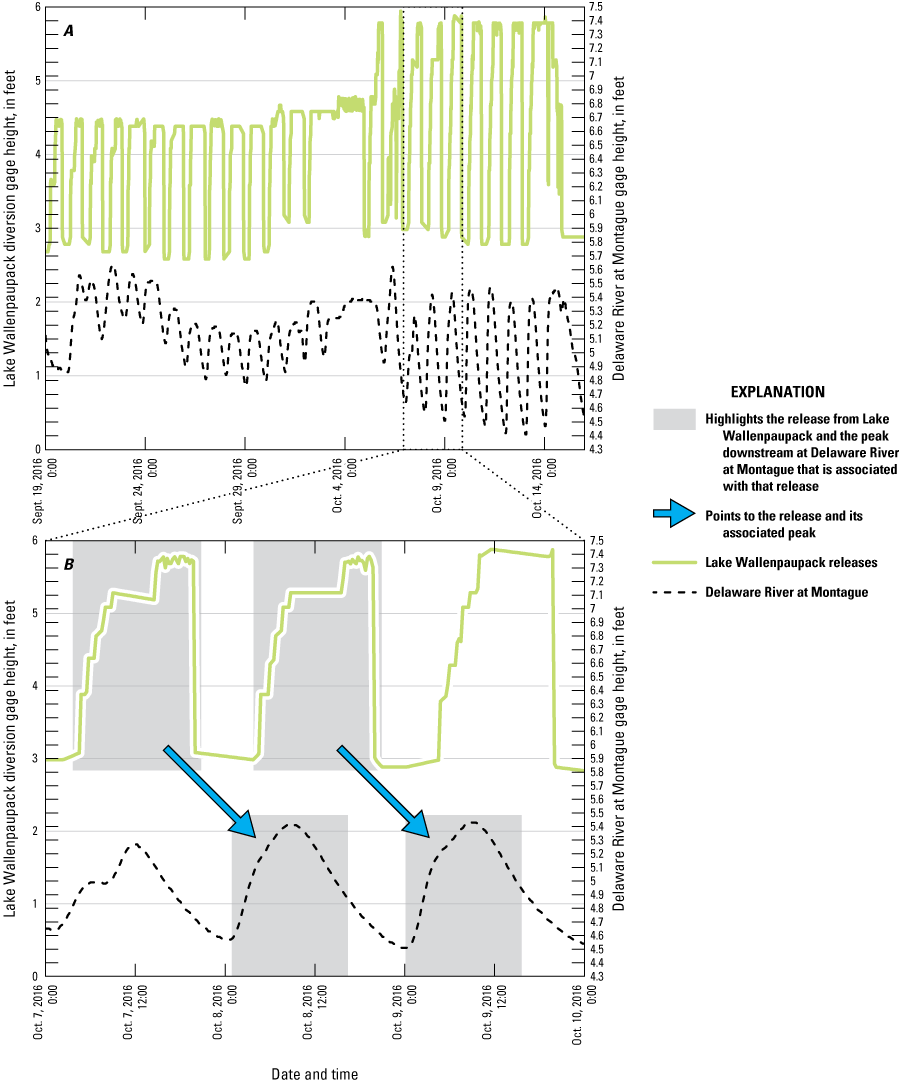
Charts showing the reservoir release and gage height data for Lake Wallenpaupack Diversion at Power Plant at Kimble, Pennsylvania (01432045) and Delaware River at Montague, New Jersey (01438500) from September 19 to October 14, 2016. A, whole time series during the release periods. B, two releases and their associated peaks as seen downstream at Delaware River at Montague. Dates shown as month/day/year. Sample time shown in military time (24-hour clock).
Peak Analysis
Peak analysis is the process of identifying the maximum gage height, or peak, for a given release period at Lake Wallenpaupack and points downstream. This point is then used as a reference for calculating the travel time of the released volume. The immediate complication with trying to line up peak flows is the nature of the releases. These releases are in stages, as previously described, and are relatively consistent during each stage. The highest point, or peak, is included in a period of relative streamflow, making it difficult to identify the peak from minor variability, incidental to noise, in the recorded data (fig. 7). Using the median point of the highest level of release was also considered, but this was complicated again by the inconsistency in the time in which the multiple turbines were cycled.
Another factor that affected clearly identifying the peaks at Montague was rain. Any precipitation that occurred during the study period clearly skewed the shape and the timing of the peak at Montague. While it was simple to differentiate the releases from precipitation runoff in the data, it was not possible to determine when a peak would have occurred without the contributions of runoff.
Graphical Analysis
Graphical analysis is the process of overlaying graphs of the collected data and visually determining at what time-shifted increment they best correspond. The one drawback with this method is its entirely subjective approach that is not conducive to mathematical or statistical evaluation. Although less easily described by statistics, the graphical analysis produced more reliable results because patterns that might require complex pattern fitting algorithms were apparent visually. The core question of the study regarding the length of time it takes a scheduled release to reach the Delaware at Montague gage was best answered by the visual pattern-fitting approach of graphical analysis.
The Lake Wallenpaupack releases and the associated peaks seen downstream at Delaware River at Montague are highlighted in Figure 7B. For each streamgage, starting at the Lake Wallenpaupack Diversion and moving in downstream order, a gage height hydrograph for the downstream streamgage was created and time-shifted backwards until the hydrograph overlaid upon the upstream streamgage hydrograph with reasonable fit. The next streamgage downstream was then time-shifted until it overlapped the already time-shifted upstream streamgage. Once hydrographs were overlapped, they were compared to the Lake Wallenpaupack Diversion data to check for any anomalies and avoid any cumulative timing errors from this process. Doing this iteratively helped sort the real signal of the release from other influences, and it also helped to keep track of the signal degradation as the sharp rises and drops from the releases diminished as they traveled downstream.
Two related conditions were noted during this process. Generally, releases traveled faster when the Delaware River level was elevated, and larger releases traveled faster regardless of the Delaware River level. This was likely caused by an increase in the ratio of channel area to wetted perimeter, causing less total resistance, which allowed the water to travel faster in the river system (Chow, 1959, p. 23, 99–100). Because of this, releases were divided into 2 separate categories: releases of approximately 650 ft3/s, 13 of which occurred from September 19 to October 1, 2016, and releases of approximately 1,440 ft3/s, 9 of which occurred from October 5 to October 14, 2016. These periods were analyzed separately using graphical analysis to define two distinct conditions.
Results
Comparison streamgages were selected upstream and downstream of major inflows to the study area. The major confluences are displayed using the graphical analysis method in figures 8–12. Periods shown in the figures are shortened for greater clarity in viewing the peaks during each flow rate.
First is the upstream-most confluence, the Lackawaxen and Delaware Rivers. During the approximately 650 ft3/s releases, the Lackawaxen River at Mouth at Lackawaxen, Pa., streamgage (01432119) needed a time-shift of −280 minutes to line up with releases from Lake Wallenpaupack. An additional 15-minute time-shift was needed to account for travel down to the confluence with the Delaware River at the Delaware River Below Lackawaxen, Pa., streamgage (01432120), as shown in figure 8A. During the approximately 1,440 ft3/s releases, Lackawaxen at Mouth only needed a time-shift of −180 minutes, but the confluence with the Delaware River needed an additional 20 minutes (fig. 8B).
The initial approximately 650 ft3/s release had a greater delay when compared with the approximately 1,440 ft3/s release. The starting gage height at the Delaware River streamgage was lower for the approximately 650 ft3/s release, but there was virtually no delay between streamgages at the start of the larger release.
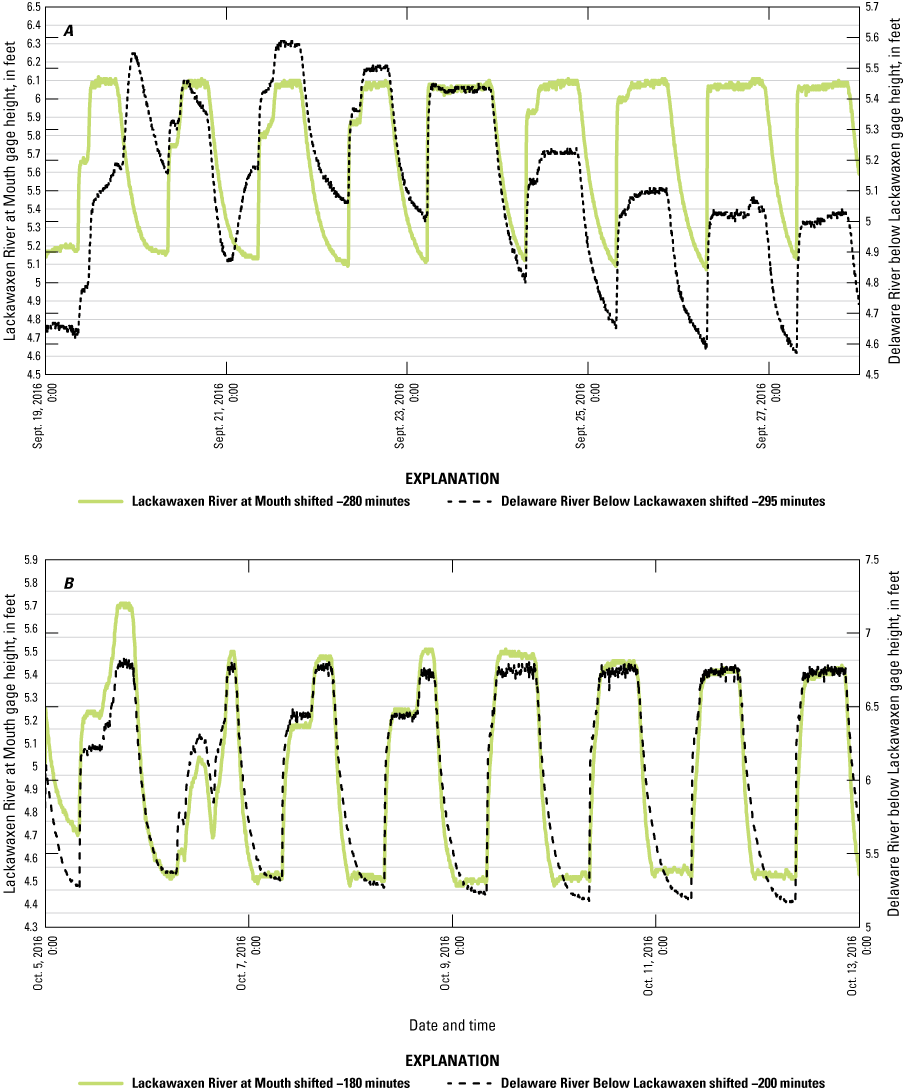
Charts showing time-shifted gage height data from the Lackawaxen and Delaware Rivers, streamgages Lackawaxen River at Mouth at Lackawaxen, Pennsylvania (01432119), and Delaware River Below Lackawaxen, Pennsylvania (01432120). A, period of approximately 650 cubic feet per second (ft3/s) releases. B, period of approximately 1,440 ft3/s releases. Dates shown as month/day/year. Sample time shown in military time (24-hour clock).
Next, the study compared the hydrographs of the Mongaup River below the Rio Reservoir and Delaware River below Mongaup to visually separate the signal from the September 19 to October 14, 2016, Lake Wallenpaupack releases from the influence of additional releases on September 30 and October 10, 2016, from Rio Reservoir (fig. 9). While the releases could be seen in the data collected at the Delaware River below Mouth of Mongaup River, N.Y., streamgage (fig. 9), the effects were minimal. The hydrograph for the Mongaup River at Mongaup, N.Y. (01433510) streamgage was omitted for redundancy and to minimize potential confusion since it had about the same hydrograph shape as the Mongaup River below the Rio Reservoir (01433455) streamgage. The hydrograph for the Mongaup River below the Rio Reservoir streamgage was time-shifted forward to line up with the release seen on the hydrograph for the Delaware River below Mongaup, which was time-shifted backwards for graphical analysis processing.
During the approximately 650 ft3/s releases, the hydrograph of the Delaware River Below Mouth of Mongaup River (0143351103) streamgage needed a time-shift of −740 minutes to line up with releases from Lake Wallenpaupack (fig. 9A). A relatively small rise in the hydrograph can be seen as a result of the Rio Reservoir release on September 30, 2016 (fig. 9). During the approximately 1,440 ft3/s releases, water traveled three hours faster downstream at Delaware River Below Mouth of Mongaup River (0143351103) than during the approximately 650 ft3/s releases, resulting in a time-shift of −560 minutes (fig. 9B). Though there was another release from Rio Reservoir on October 10, 2016, there is no clearly visible rise in the hydrograph pattern downstream at the Delaware River confluence. Thus, the Lake Wallenpaupack releases were easily apparent when lining up hydrographs for graphical analysis (fig. 10).
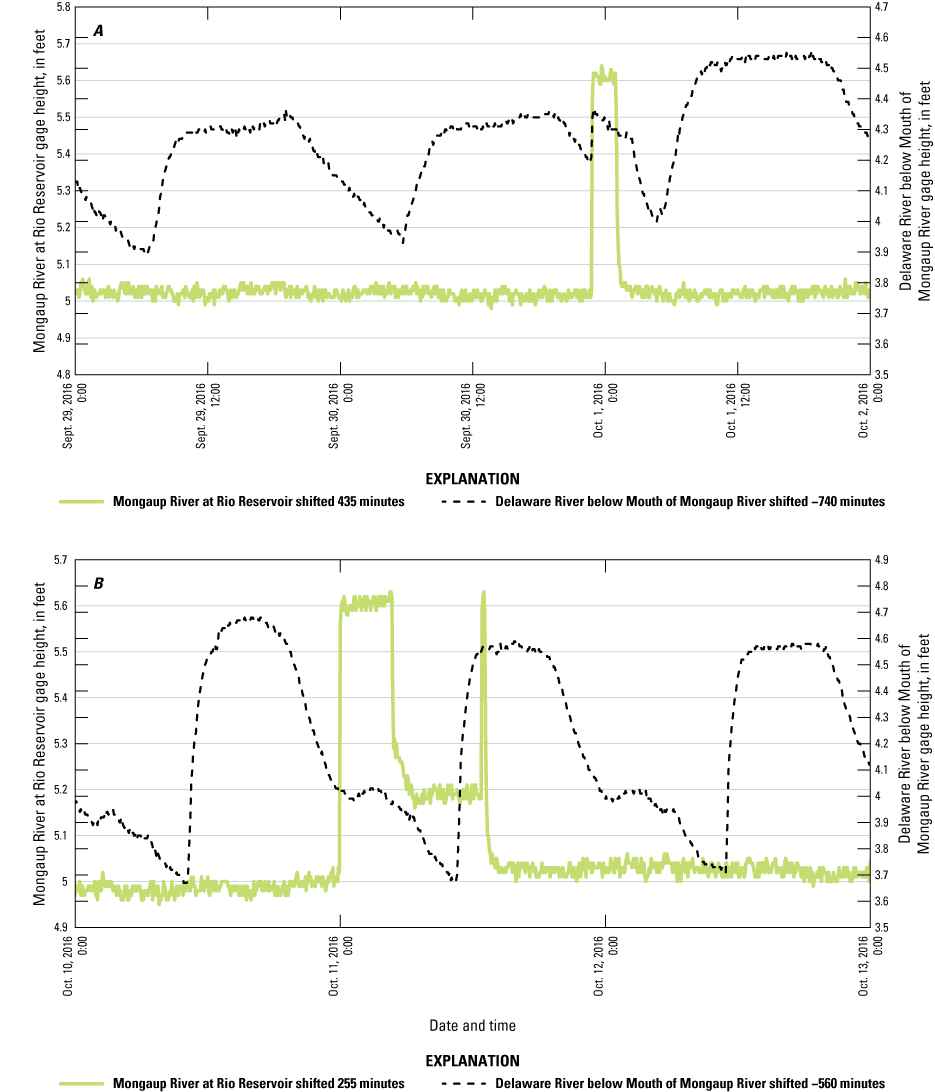
Charts showing time-shifted gage height data from the Mongaup and Delaware Rivers, streamgages Mongaup River below Rio Reservoir, New York (01433455), and Delaware River Below Mouth of Mongaup River, New York (0143351103). A, period of approximately 650 cubic feet per second (ft3/s) releases. B, period of approximately 1,440 ft3/s releases. Dates shown as month/day/year. Sample time shown in military time (24-hour clock).
The hydrograph of Delaware River below mouth of Mongaup River, N.Y. (0143351103) streamgage was compared with the hydrograph of the upstream streamgage Delaware River at Barryville, N.Y. (01432160) to show the time of travel and attenuation of peaks from the Delaware River and Mongaup River confluence (fig. 10). At the Delaware River at Barryville streamgage, a −420-minute time-shift was needed to line up its hydrograph with the approximately 650 ft3/s Lake Wallenpaupack releases, and the Delaware River below Mongaup hydrograph needed an additional 320 minutes (fig. 10A) During the approximately 1,440 ft3/s Lake Wallenpaupack releases, water arrived 125 minutes faster to the Barryville streamgage than during the approximately 650 ft3/s releases and 180 minutes faster to the Delaware River below Mongaup streamgage than during the approximately 650 ft3/s releases (fig. 10B). The hydrographs for each streamgage are nearly identical during both the lower and higher volume releases, further highlighting that the Mongaup streamflow has a lesser influence on timing and attenuation of the Delaware River flow at this gage height.
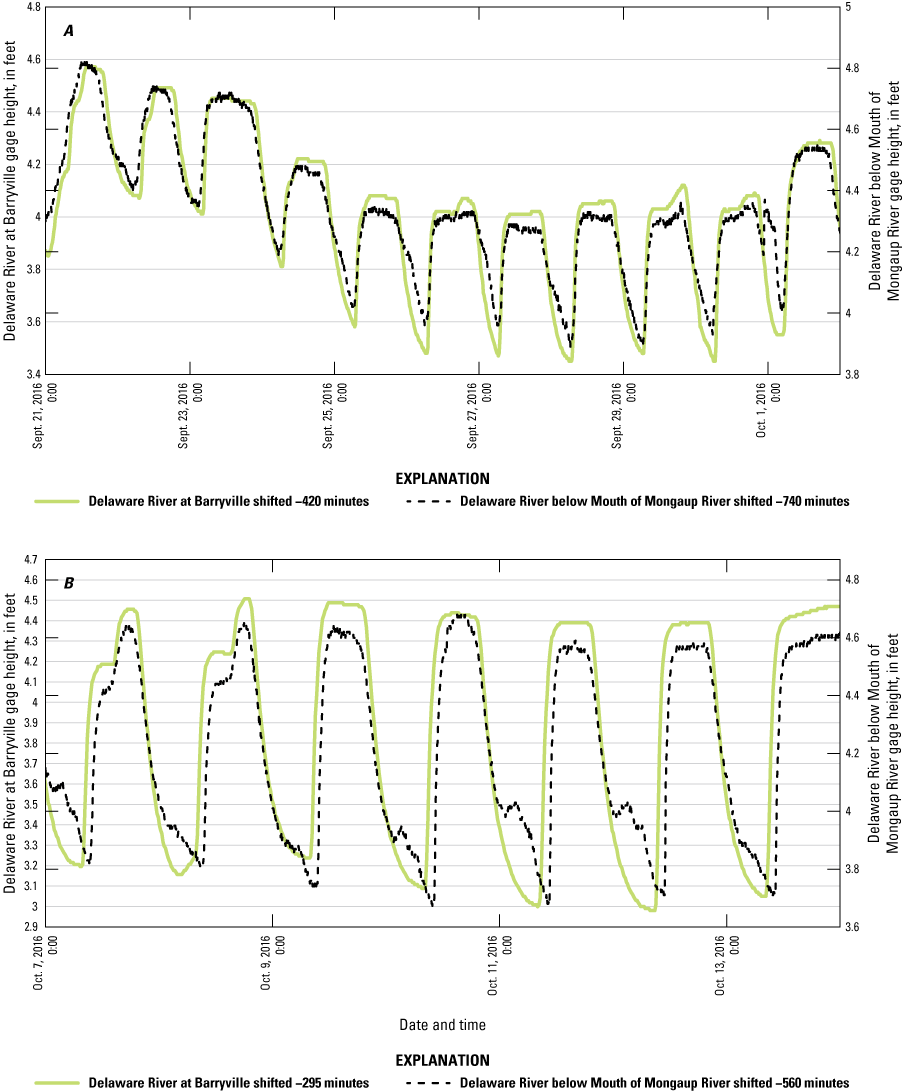
Charts showing time-shifted gage height data from Delaware River at Barryville, New York (01432160), and Delaware River Below Mouth of Mongaup River, New York (0143351103). A, period of approximately 650 cubic feet per second (ft3/s) releases. B, period of approximately 1,440 ft3/s releases. Dates shown as month/day/year. Sample time shown in military time (24-hour clock).
The hydrographs of the Delaware River streamgages (01434000; 01438180) above and below the Neversink River inflow are shown in figure 11. Gage heights below approximately 4.15 feet at the Delaware River at Hunt’s Landing streamgage (01438180) are missing due to the sensor being out of water. During the period of approximately 650 ft3/s releases, the Delaware River at Port Jervis, N.Y., streamgage (01434000) hydrograph needed a −915-minute time-shift to line up with the Lake Wallenpaupack releases, and an additional 55 minutes were needed for water to travel down to the Delaware River at Hunt’s Landing near Matamoras, Pa., streamgage (01438180; fig. 11A). During the period of approximately 1,440 ft3/s releases, water flow was substantially quicker than during the period of approximately 650 ft3/s at both streamgages, being 205 minutes faster at the Port Jervis streamgage and 200 minutes faster at the Hunt’s Landing streamgage (fig. 11B). As in figure 10, the hydrographs in figure 11 are almost identical, making the hydraulic signals from the Lake Wallenpaupack releases easily identifiable from the Neversink River inflow.
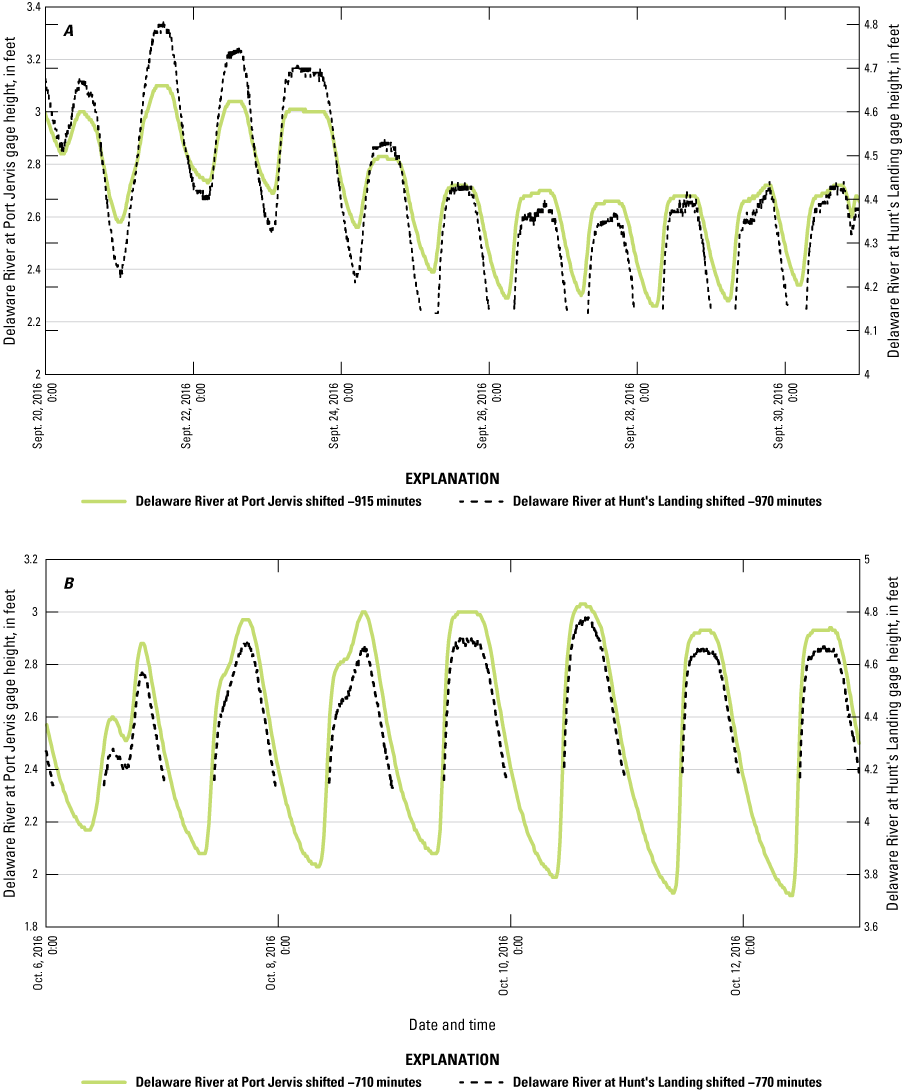
Charts showing time-shifted gage height data from above and below the Neversink River, streamgages Delaware River at Port Jervis, New York (1434000), and Delaware River at Hunt's Landing near Matamoras, Pennsylvania (1438180). A, period of approximately 650 cubic feet per second (ft3/s) releases. B, period of approximately 1,440 ft3/s releases. Dates shown as month/day/year. Sample time shown in military time (24-hour clock).
The final comparison from the Lake Wallenpaupack releases to Delaware River at Montague are shown in figure 12. During the period of approximately 650 ft3/s releases, the hydrograph of the Delaware River at Montague streamgage needed a time shift of −1,185 minutes (fig. 12A) During the period of approximately 1,440 ft3/s releases, water traveled downstream 225 minutes faster than during the period of 650 ft3/s releases (fig. 12B).
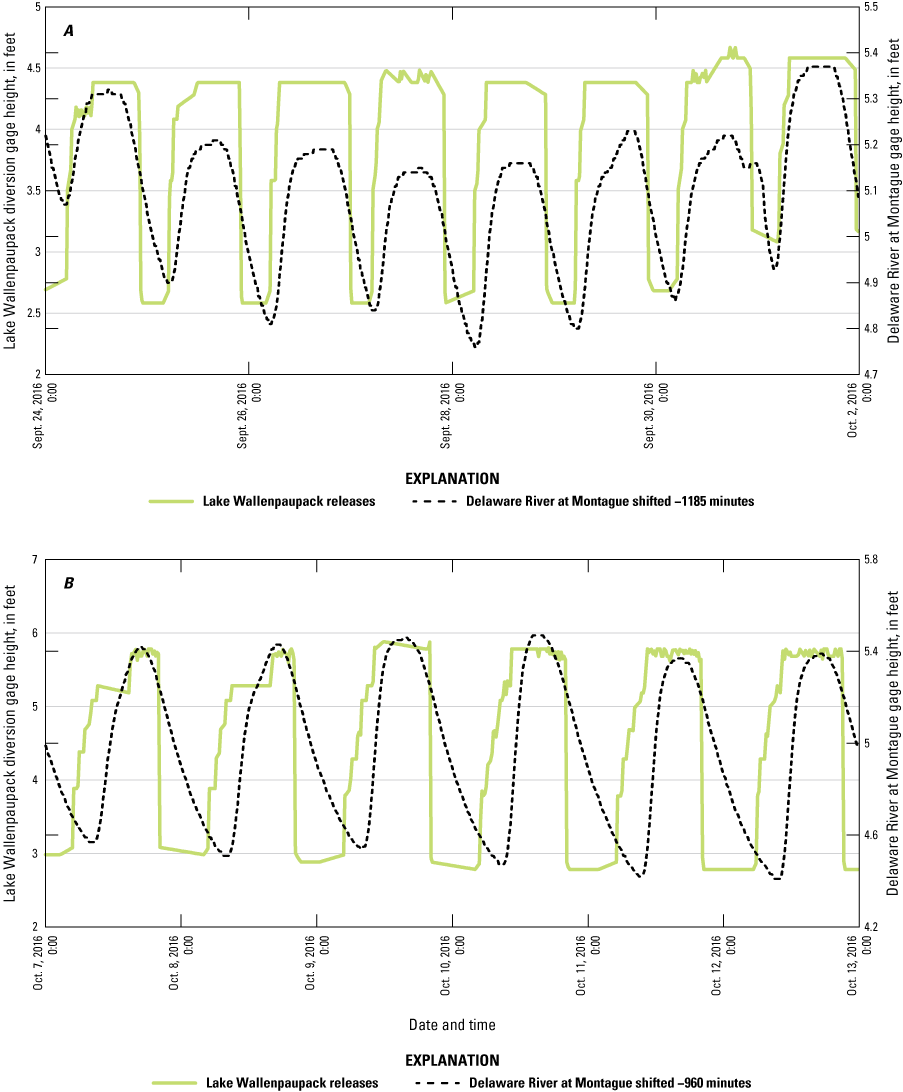
Charts showing time-shifted gage height data from Lake Wallenpaupack, Pennsylvania (01432045) and Delaware River at Montague, New Jersey (01438500). A, period of approximately 650 cubic feet per second (ft3/s) releases. B, period of approximately 1,440 ft3/s releases. Dates shown as month/day/year. Sample time shown in military time (24-hour clock).
The hydrograph in figure 12 compares the Lake Wallenpaupack releases to the Delaware at Montague streamgage, using the graphical analysis method. In the period of approximately 650 ft3/s releases, there is a variation in timing for gage height to rise at the Montague streamgage (fig. 12A). As in figure 8, when gage height is lower downstream, it takes longer for water to travel downstream. Similarly, the larger releases are also consistent. As previously mentioned, two conditions were established. If downstream streamgage water levels are elevated prior to releases, the water will travel faster downstream than under normal water levels, likely due to an increase in area-to-wetted perimeter ratio reducing resistance. Secondly, larger releases were consistent in speed and traveled faster than smaller releases regardless of downstream gage height. When a greater mass of water is being released, it has greater kinetic energy to move downstream. As a result, the mass of water flowing is less influenced by the resistance of a lower area to wetted perimeter ratio (Chow, 1959, p. 49).
Travel times were computed using the graphical analysis method, as explained previously. Starting at the upstream-most streamgage, downstream streamgages were time-shifted to overlay on upstream hydrographs where the timing of peaks generated from reservoir releases lined up most reasonably. All hydrographs were compared back to the upstream-most streamgage, the Lake Wallenpaupack Diversion, to check for accuracy of timing. Both analyses, comparing downstream streamgages to each other as well as comparing to the Lake Wallenpaupack diversion releases, yielded the same time of travel result. Results are listed as approximate time of travel since it was previously explained to be a subjective approach with no quantifiable error. Time-shifted values listed in the graphs were negative, since they were time-shifted backwards to compare to the Lake Wallenpaupack releases. In tables 2–3, time of travel is listed in positive values since it is the time that the releases took to reach the downstream streamgages. The results for the approximately 650 ft3/s releases are in table 2, and the results for the approximately 1,440 ft3/s releases are in table 3.
Table 2.
Travel times for discharge release of approximately 650 cubic feet per second from Lake Wallenpaupack, Pennsylvania, downstream to the Delaware River at Montague, New Jersey streamgage.[PA, Pennsylvania; NY, New York; NJ, New Jersey]
Table 3.
Travel times for discharge release of approximately 1,440 cubic feet per second from Lake Wallenpaupack, Pennsylvania, downstream to the Delaware River at Montague, New Jersey streamgage.[PA, Pennsylvania; NY, New York; NJ, New Jersey]
Summary
The Delaware River Basin provides water for millions of people in the states of New York, Pennsylvania, New Jersey, and Delaware. The Office of the Delaware River Master manages flow in the basin, ensuring a minimum passing flow of 1,750 cubic feet per second (ft3/s) at the Delaware River at Montague streamgage (U.S. Geological Survey [USGS] site 01438500), per the decree established between New York and New Jersey in 1954 (New Jersey v. New York, 347 U.S. 995 [1954], U.S. Supreme Court, 1954). The River Master directs releases from the Neversink, Pepacton, and Cannonsville Reservoirs in New York if the minimum flow is not met from the existing Delaware River flow. Flows from Lake Wallenpaupack in Pennsylvania and the Rio Reservoir in New York are also essential for determining the minimum passing flow. Preliminary studies in 1955 estimated the time of travel from Lake Wallenpaupack to the Delaware River at Montague streamgage to be 960 minutes (Paulsen, 1956, p. 10–11), but a more thorough and updated investigation of time of travel was needed. The intent of this study was to confirm and improve the understanding of timing and attenuation of releases from Lake Wallenpaupack to the Delaware River at Montague streamgage. This information can support the Delaware River Master in better predicting flow at Delaware River at Montague and thus further inform the need for reservoir releases.
The focus area of this study is in the upper Delaware River Basin where rivers in New York and Pennsylvania drain into the Delaware River in northwestern New Jersey. Brookfield Renewable U.S., owner of Lake Wallenpaupack, a 5,700-acre lake with a hydroelectric generation facility (Lake Wallenpaupack Watershed Management District, 2025), scheduled 13 releases of approximately 650 ft3/s from September 19 to October 2, 2016, and 9 releases of approximately 1,440 ft3/s from October 5 to October 14, 2023, from Lake Wallenpaupack, Pennsylvania (Pa.) for regularly scheduled inspections and maintenance that occurs every five years, creating distinct hydraulic signals that facilitated this study. Gage height data from four USGS real-time streamgages and six added USGS streamgages were utilized for data collection, located along major confluences on the Lackawaxen River, Pa., Mongaup River, New York (N.Y.), below the Neversink River, N.Y., and along the Delaware River in N.Y. and New Jersey (N.J.), with the southernmost streamgage being the Delaware River at Montague, N.J. Streamgages are located above and below the major confluences so that influence from the other rivers could be examined in conjunction with the timing and attenuation of the Lake Wallenpaupack Releases.
This study used the graphical analysis method for the final time of travel values reported. This involves overlaying hydrographs and visually determining the time shift needed for the graphs to best correlate. Though this method is subjective and does not require mathematical or statistical analysis, the timing of when the full volume of the release reached streamgages downstream was apparent visually in hydrographs.
Our analyses indicate that reservoir releases from Lake Wallenpaupack of approximately 650 ft3/s take about 1,185 minutes to travel to Delaware River at Montague, and releases of approximately 1,440 ft3/s take about 960 minutes. These results can be used as upper and lower bounds when providing guidance for releases in-between these values. In general, smaller releases take longer to travel and larger releases take shorter time to travel downstream to Delaware River at Montague. Factors that can increase travel time for smaller releases that must be considered include whether the gage height is low or high at Montague at the time of release. A lower gage height downstream can add to travel time, whereas an elevated gage height downstream can decrease travel time. The travel time is decreased due to an increased area-to-wetted perimeter ratio. As gage height rises within banks, area increases substantially, while the wetted perimeter only increases marginally. Similarly, the larger the mass of water flowing, the more energy it possesses to move downstream, and thus, it is less influenced by the same channel resistance.
Other factors that should be considered are the influences of precipitation in conjunction with releases, as well as discharge flowing from the Mongaup and Neversink Rivers into the Delaware River. Though these rivers showed negligible changes during this study, there could be situations of higher flow from these inflows due to rainfall or releases from the Rio Reservoir that feeds into the Mongaup River and the Neversink Reservoir that feeds into the Neversink River. Higher flows from the Mongaup and Neversink Rivers would lesson travel time from Lake Wallenpaupack releases.
Results from this study confirm that the previous estimated time of travel of 960 minutes, or 16 hours, found in the 1955 study, is accurate for releases of approximately 1,440 ft3/s; however, smaller releases of approximately 650 ft3/s take longer—approximately 1,185 minutes or 19.75 hours. This study can provide the Office of the Delaware River Master with an enhanced ability to manage minimum passing flow at Delaware River at Montague by being able to better predict flows from scheduled releases.
References Cited
Delaware River Basin Commission, [2023], Basin information: Delaware River Basin Commission, accessed February 27, 2023, at https://nj.gov/drbc/basin/.
Gibs, J., Gray, B., Rice, D.E., Tessler, S., and Barringer, T.H., 2001, Water quality of the Delaware and Raritan Canal, New Jersey, 1998-99: U.S. Geological Survey Water-Resources Investigations Report 2001-4072, accessed January 31, 2025, at https://doi.org/10.3133/wri014072.
Holmes, O.W., and Supreme Court of the United States, 1930, U.S. Reports—New Jersey v. New York, 283 U.S. 336 (1931): Library of Congress, accessed February 27, 2023, at https://www.loc.gov/item/usrep283336/.
Hutson, S.S., Linsey, K.S., Ludlow, R.A., Reyes, B., and Shourds, J.L., 2016, Estimated use of water in the Delaware River Basin in Delaware, New Jersey, New York, and Pennsylvania, 2010: U.S. Geological Survey Scientific Investigations Report 2015–5142, 76 p., accessed February 5, 2025, at https://doi.org/10.3133/sir20155142.
Jobson, H.E., 1996, Prediction of traveltime and longitudinal dispersion in rivers and streams: U.S. Geological Survey Water-Resources Investigations Report 96–4013, 69 p., accessed November 27, 2023, at https://doi.org/10.3133/wri964013.
Kenney, T.A., 2010, Levels at gaging stations: U.S. Geological Survey Techniques and Methods, book 3, chap. 19, 60 p., accessed November 27, 2023, at https://doi.org/10.3133/tm3A19.
Lake Wallenpaupack Watershed Management District, 2025, About Lake Wallenpaupack, accessed January 24, 2025, at https://wallenpaupackwatershed.org/about/lake-wallenpaupack/.
Paulsen, C.G., 1956, Report of the River Master of the Delaware River for the period December 1, 1954 to November 30, 1955. U.S. Geological Survey, 47 p., accessed November 27, 2023, at https://webapps.usgs.gov/odrm/documents/reports/RM1955.pdf.
Rydlund, P.H., Jr., and Densmore, B.K., 2012, Methods of practice and guidelines for using survey-grade global navigation satellite systems (GNSS) to establish vertical datum in the United States Geological Survey: U.S. Geological Survey Techniques and Methods, book 11, chap. D1, 102 p. with appendixes, accessed November 27, 2023 at https://pubs.usgs.gov/tm/11d1/.
Sauer, V.B., and Turnipseed, D.P., 2010, Stage measurements at gaging stations: U.S. Geological Survey Techniques and Methods book 3, chap. A7, 45 p., accessed November 27, 2023, at https://doi.org/10.3133/tm3A7.
Tri-County Independent, 2021, Lake Wallenpaupack drawdown to begin just after Labor Day: Tri-County Independent website, accessed January 23, 2025, at https://www.tricountyindependent.com/story/news/2021/08/24/brookfield-renewable-has-announced-lake-wallenpaupack-drawn-down-beginning-just-after-labor -day-dam/8240411002/.
U.S. Geological Survey, 2018, Water Density: U.S. Geological Survey web page, accessed February 27, 2023, at https://www.usgs.gov/special-topics/water-science-school/science/water-density#:~:text=A%20common%20unit%20of%20measurement%20for%20water%27s%20densit y,at%200.9998395%20g%2Fml%20at%204.0%C2%B0%20Celsius%20%2839.2%C2%B0%20Fahrenheit%29.
U.S. Geological Survey, 2023a, StreamStats: U.S. Geological Survey database, accessed September 18, 2023, at https://streamstats.usgs.gov/ss/.
U.S. Geological Survey, 2023b, USGS water data for the nation: U.S. Geological Survey National Water Information System database, accessed September 18, 2023, at https://doi.org/10.5066/F7P55KJN.
U.S. Geological Survey, [undated]a, About ODRM: U.S. Geological Survey, Office of the Delaware River Master web page, accessed February 27, 2023, at https://webapps.usgs.gov/ODRM/about/about-odrm.
U.S. Geological Survey, [undated]b, History of the Reservoir Releases Program in the upper Delaware River Basin: U.S. Geological Survey, Office of the Delaware River Master web page, accessed February 27, 2023, at https://webapps.usgs.gov/odrm/about/history.
U.S. Supreme Court, 1954, New Jersey v. New York, 347 U.S. 995: Justia, p. 347, accessed February 27, 2023, at https://supreme.justia.com/cases/federal/us/347/995/.
Conversion Factors
U.S. customary units to International System of Units
Datums
Vertical coordinate information is referenced to the North American Vertical Datum of 1988 (NAVD 88).
Horizontal coordinate information is referenced to the North American Datum of 1983 (NAD 83).
For more information about this report, contact:
Director, New Jersey Water Science Center
U.S. Geological Survey
3450 Princeton Pike, Suite 110
Lawrenceville, NJ 08648
or visit our website at
https://www.usgs.gov/centers/new-jersey-water-science-center
Publishing support provided by the Baltimore Publishing Service Center.
Disclaimers
Any use of trade, firm, or product names is for descriptive purposes only and does not imply endorsement by the U.S. Government.
Although this information product, for the most part, is in the public domain, it also may contain copyrighted materials as noted in the text. Permission to reproduce copyrighted items must be secured from the copyright owner.
Suggested Citation
Polcino, J., Trainor, J.J., and Collenburg, J.V., 2025, Time of travel of releases from Lake Wallenpaupack to the U.S. Geological Survey’s streamgage monitoring location on the Delaware River at Montague, New Jersey: U.S. Geological Survey Scientific Investigations Report 2025–5026, 20 p., https://doi.org/10.3133/sir20255026.
ISSN: 2328-0328 (online)
Study Area
| Publication type | Report |
|---|---|
| Publication Subtype | USGS Numbered Series |
| Title | Time of travel of releases from Lake Wallenpaupack to the U.S. Geological Survey’s streamgage monitoring location on the Delaware River at Montague, New Jersey |
| Series title | Scientific Investigations Report |
| Series number | 2025-5026 |
| DOI | 10.3133/sir20255026 |
| Publication Date | April 09, 2025 |
| Year Published | 2025 |
| Publisher | U.S. Geological Survey |
| Publisher location | Reston, VA |
| Contributing office(s) | New Jersey Water Science Center |
| Description | vii, 20 p. |
| Country | United States |
| State | New Jersey, New York, Pennsylvania |
| Other Geospatial | Delaware River, Lake Wallenpaupack |
| Online Only (Y/N) | Y |
| Additional Online Files (Y/N) | N |