

Status of Water-Level Altitudes and Long-Term and Short-Term Water-Level Changes in the Chicot and Evangeline (Undifferentiated) and Jasper Aquifers, Greater Houston Area, Texas, 2024
Links
- Document: Report (10.7 MB pdf) , HTML , XML
- Data Releases:
- USGS Data Release - Adams, A.C., and Ramage, J.K., 2024, Depth to groundwater measured from wells in the greater Houston area, Texas, 2024: U.S. Geological Survey data release
- USGS Data Release - Adams, A.C., and Ramage, J.K., 2024, Groundwater-level altitudes and long-term groundwater-level changes in the Chicot and Evangeline (undifferentiated) and Jasper aquifers, greater Houston area, Texas, 2024: U.S. Geological Survey data release
- Database: USGS Database U.S. Geological Survey, 2024, USGS water data for the Nation: U.S. Geological Survey National Water Information System database
- NGMDB Index Page: National Geologic Map Database Index Page (html)
- Download citation as: RIS | Dublin Core
Abstract
Since the early 1900s, groundwater withdrawn from the primary aquifers that compose the Gulf Coast aquifer system—the Chicot, Evangeline, and Jasper aquifers—has been an important source of water in the greater Houston area, Texas. This report, prepared by the U.S. Geological Survey in cooperation with the Harris-Galveston Subsidence District, City of Houston, Fort Bend Subsidence District, Lone Star Groundwater Conservation District, and Brazoria County Groundwater Conservation District, is one in an annual series of reports depicting the status of water-level altitudes and water-level changes in these aquifers in the greater Houston area.
In this report, the Chicot and Evangeline aquifers are treated as a single aquifer for the purposes of providing annual assessments of regional-scale water-level altitudes and water-level changes over time. In 2024, shaded depictions of estimated water-level altitudes for the Chicot and Evangeline aquifers (undifferentiated) ranged from about 301 feet (ft) below the North American Vertical Datum of 1988 (NAVD 88) to about 184 ft above NAVD 88. The largest decline in water-level altitudes depicted by the 1977–2024 long-term water-level-change map was in south-central Montgomery County. In comparison, the 1990–2024 long-term water-level-change map depicts the largest declines in water-level altitudes in an area northwest of The Woodlands and in an area of northern Waller County. The largest rise in water-level altitudes for 1977–2024 is depicted in an area of east-central Harris County, whereas the largest rise in water-level altitudes for 1990–2024 is depicted in an area of central Harris County. The 5-year short-term water-level-change map depicts the largest declines in several parts of the study area, but these declines are concentrated primarily in northern Fort Bend County, southwestern Harris County, and south-central Montgomery County. The largest rise for 2019–24 is depicted at a well in northern Fort Bend County. The 1-year short-term water-level-change map depicts the largest declines at a well in northern Fort Bend County and a well in west-central Harris County. The largest rise for 2023–24 is depicted at a well in east-central Fort Bend County.
In 2024, shaded depictions of estimated water-level altitudes for the Jasper aquifer ranged from about 255 ft below NAVD 88 to about 321 ft above NAVD 88. The 2000–24 long-term water-level-change map depicts the largest water-level decline in an area of central San Jacinto County; the largest rise is depicted in an area of central Grimes County. The 5-year short-term water-level-change map depicts the largest declines across parts of central and southern Montgomery County and at one well in north-central Harris County. The largest rise for 2019–24 is depicted at a well centered on the Montgomery-Grimes County line. The 1-year short-term water-level-change map depicts the largest declines at two wells in south-central Montgomery County and one well in northwestern Montgomery County on the west side of Lake Conroe. The largest rises during 2023–24 are depicted at one well in northwestern Montgomery County and one well in south-central Montgomery County.
Introduction
Since the early 1900s, groundwater withdrawn from the primary aquifers that compose the Gulf Coast aquifer system—the Chicot, Evangeline, and Jasper aquifers—has been an important source of water in the greater Houston area, Texas (fig. 1) (Kasmarek and Robinson, 2004; Ellis and others, 2023). The groundwater withdrawals are used for municipal supply, commercial and industrial use, and irrigation purposes in the greater Houston area (Kasmarek and Robinson, 2004), which as defined in this report includes approximately 11,000 square miles and encompasses all or part of 11 counties (Harris, Galveston, Fort Bend, Montgomery, Brazoria, Chambers, Grimes, Liberty, San Jacinto, Walker, and Waller). Early development of the Gulf Coast aquifer system, which began before 1900 in the greater Houston area, resulted in rapid declines in groundwater-level altitudes (hereinafter referred to as “water-level altitudes”) in some areas.
Ellis and others (2023) describe in detail the rapid development of groundwater resources in the greater Houston area during three discrete time intervals (1897–1945, 1946–1974, and 1975–2018) in the section “Groundwater-Level Measurements” and explain, “Although the historical groundwater-level minimums for many wells in the Houston-Galveston region (fig. 18B) generally occurred in the mid- to late-1970s, prior groundwater-level declines were so extensive that by 1946 groundwater levels in some wells in the Houston and Pasadena areas had nearly reached 50 percent of their historical minimums based on a predevelopment groundwater level estimated at land surface” (p. 39). The rapid development of groundwater resources in the greater Houston area led to water-level altitudes declining to more than 300 feet (ft) below the North American Vertical Datum of 1988 (NAVD 88) in the Chicot and Evangeline aquifers in southeastern Harris County by 1977 (Gabrysch, 1979).
These large water-level-altitude declines also led to as much as 10 ft of land-surface subsidence in some parts of the greater Houston area—historically in parts of central and southeastern Harris County and in Galveston County. With policies for reducing groundwater withdrawals in place since the 1970s, ongoing subsidence rates in these areas, first recognized by the releveling of benchmark lines beginning in the early 1900s and carried out through the 1950s, were for the most part mitigated; however, more recently there have been increased rates of subsidence due to increased groundwater withdrawals in the northern and western parts of the greater Houston area, which have led to depressurization and compaction of clay and silt layers interbedded in the aquifer sediments (Winslow and Doyel, 1954; Winslow and Wood, 1959; Gabrysch and Bonnet, 1975; Gabrysch, 1984; Holzer and Bluntzer, 1984; Coplin and Galloway, 1999; Kasmarek, Gabrysch, and Johnson, 2009; Ellis and others, 2023).
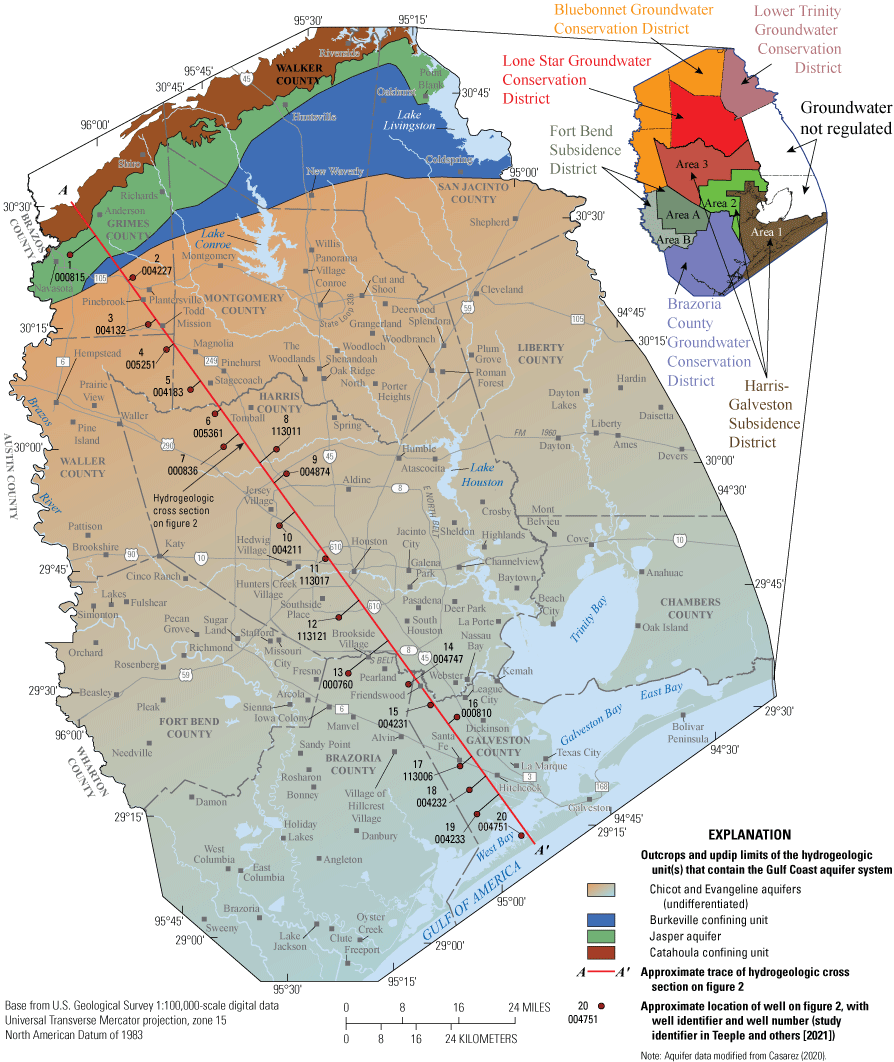
Locations of groundwater regulatory districts; approximate trace of hydrogeologic cross section A–A´; and outcrops and updip limits of the hydrogeologic units that contain the Gulf Coast aquifer system in the greater Houston study area, Texas.
To regulate and reduce groundwater withdrawals and to mitigate the effects of subsidence in Harris and Galveston Counties, the 64th Texas State Legislature authorized the establishment of the Harris-Galveston Subsidence District (HGSD) in 1975 (HGSD, 2024). After establishing the HGSD, the Texas State Legislature established an additional subsidence district (Fort Bend Subsidence District [FBSD]) and four groundwater conservation districts (Lone Star Groundwater Conservation District [LSGCD], Bluebonnet Groundwater Conservation District [BGCD], Brazoria County Groundwater Conservation District [BCGCD], and Lower Trinity Groundwater Conservation District [LTGCD]) in the greater Houston area (fig. 1) to enable the regulation of groundwater withdrawals within their respective jurisdictions. The FBSD was established by the 71st Texas State Legislature in 1989 (FBSD, 2024), the BGCD and LSGCD were established by the 77th Texas State Legislature in 2001 (BGCD, 2024; LSGCD, 2024), the BCGCD was established by the 78th Texas State Legislature in 2003 (BCGCD, 2024), and the LTGCD was established by the 79th Texas State Legislature in 2005 (LTGCD, 2024). Regulatory plans to gradually decrease groundwater withdrawals (in conjunction with increased use of alternative surface-water supplies) are currently (2025) being phased in throughout most of the study area (fig. 1). The current groundwater management plans of each district are available on their respective websites (FBSD, 2013; HGSD, 2013; LTGCD, 2019; BGCD, 2021; BCGCD, 2022; LSGCD, 2023). Groundwater withdrawals are currently (2025) not regulated by a groundwater conservation district in two counties in the greater Houston area: Liberty and Chambers Counties (fig. 1).
The U.S. Geological Survey (USGS), in cooperation with the HGSD, has monitored the status of water-level altitudes and long-term water-level changes in the greater Houston area since 1977, and the first water-level-altitude maps for the Chicot and Evangeline aquifers in the greater Houston area were published in 1979 (Gabrysch, 1979). Following their establishment by the Texas State Legislature in 1989, the FBSD also became a cooperative participant in the study, and in 1991 the first comprehensive report for the Chicot and Evangeline aquifers depicting water-level altitudes in 1990 for each aquifer was published by the USGS (Barbie and others, 1991). The USGS also published a map of Jasper aquifer water-level altitudes in the greater Houston area (Coplin, 2001) for the first time after the establishment of the LSGCD by using water-level data collected in 2000. Additional participants who later joined the ongoing study are the City of Houston and the BCGCD. More information on the history of water-level-altitude monitoring and on USGS reports published to document water-level altitudes and water-level changes in the greater Houston area is provided in Ellis and others (2023).
The decision to treat the Chicot and Evangeline aquifers as a single hydrogeologic unit in the greater Houston area when providing water-level altitudes and water-level changes was made starting with the 2021 annual report (Braun and Ramage, 2022) and continues in this report. The reasoning behind and nature of the decision are described in detail in the section “Treatment of the Chicot and Evangeline Aquifers as a Single Hydrogeologic Unit” in Ramage and others (2022). In brief, the rationale for not differentiating the Chicot aquifer from the Evangeline aquifer includes the absence of a confining unit between the two aquifers. Previous investigators have noted that the absence of a confining unit between the Chicot and Evangeline aquifers implies that the two aquifers are hydraulically connected, allowing groundwater to flow between them (Liu and others, 2019). Because of this hydraulic connection, water-level changes that occur in one aquifer can affect groundwater levels in the adjoining aquifer (Kasmarek and others, 2010). Additionally, previous investigators have noted similarity in geochemical signatures between the Chicot and Evangeline aquifers (Borrok and Broussard, 2016), as well as in hydraulic properties (Meyer and Carr, 1979; Carr and others, 1985). The decision was also made in response to the findings from Young and others (2017) and Young and Draper (2020), which led to the reclassification of the associated hydrogeologic units for a large proportion of the wells in the groundwater-monitoring network used to collect long-term groundwater levels for the annual series of reports. When considered together, the various lines of evidence that suggest a hydraulic connection between the Chicot and Evangeline aquifers provide sufficient justification for treating the Chicot and Evangeline aquifers as a single hydrogeologic unit for the purposes of providing annual assessments of regional-scale water-level altitudes and water-level changes over time.
This report, prepared by the USGS in cooperation with the HGSD, City of Houston, FBSD, LSGCD, and BCGCD, is one in an annual series of reports depicting the status of water-level altitudes and water-level changes in the Chicot and Evangeline (undifferentiated) and Jasper aquifers in the greater Houston area. Except where noted, the text and figures in this report were modified from the most recent edition in this annual series of reports (Ramage, 2024).
Purpose and Scope
The purpose of this report, prepared by the USGS in cooperation with the HGSD, City of Houston, FBSD, LSGCD, and BCGCD, is to depict water-level altitudes and long-term and recent short-term (1- and 5-year) water-level changes in the Chicot and Evangeline (undifferentiated) and Jasper aquifers in the greater Houston area, Texas. An overview of the hydrogeology of the study area is provided, and regional-scale maps depicting approximate water-level altitudes for 2024 (represented by measurements made during December 2023 through March 2024) (Adams and Ramage, 2024a, b), long-term water-level changes in the Chicot and Evangeline aquifers (undifferentiated) (1977–2024 and 1990–2024) and the Jasper aquifer (2000–24) (Adams and Ramage, 2024a, b), and recent short-term water-level changes for the Chicot and Evangeline (undifferentiated) and Jasper aquifers (2019–24 and 2023–24) (Adams and Ramage, 2024a, b) are featured. Except where noted, the text and figures in this report were modified from the most recent edition in this annual series of reports (Ramage, 2024).
Hydrogeology of the Study Area
The following overview of the hydrogeology of the study area is summarized from Kasmarek and Ramage (2017). From land surface down, the hydrogeologic units in the study area include the Chicot and Evangeline aquifers (undifferentiated), Burkeville confining unit, Jasper aquifer, and Catahoula confining unit (figs. 2 and 3). The geologic units containing the three primary aquifers in the Gulf Coast aquifer system in the study area (the Chicot, Evangeline, and Jasper aquifers) are composed of laterally discontinuous deposits of gravel, sand, silt, and clay (Baker, 1979). The geologic units that contain the Chicot, Evangeline, and Jasper aquifers and Burkeville and Catahoula confining units are shown in figure 3. The percentage of clay and other fine-grained, clastic material generally increases downdip (Baker, 1979). The Chicot part of the Chicot and Evangeline aquifers (undifferentiated) is contained in Holocene- and Pleistocene-age (Quaternary-age) sediments, and the Evangeline part of the Chicot and Evangeline aquifers (undifferentiated) is contained in Pliocene- and Miocene-age (Tertiary-age) sediments (Baker, 1979, 1986; Young and others, 2012, 2014; Casarez, 2020; Young and Draper, 2020; Teeple and others, 2021) (figs. 2 and 3). The more deeply buried Jasper aquifer is contained in Miocene-age sediments (Baker, 1979, 1986; Young and others, 2012, 2014; Casarez, 2020; Young and Draper, 2020; Teeple and others, 2021) (figs. 2 and 3). The stratigraphic relations between these hydrogeologic units are shown on hydrogeologic cross section A–A´ (figs. 1 and 2) of the Gulf Coast aquifer system, which extends through the greater Houston area from western Grimes County southeastward through Waller, Montgomery, Harris, and Brazoria Counties before terminating at the Gulf of America coast in Galveston County.
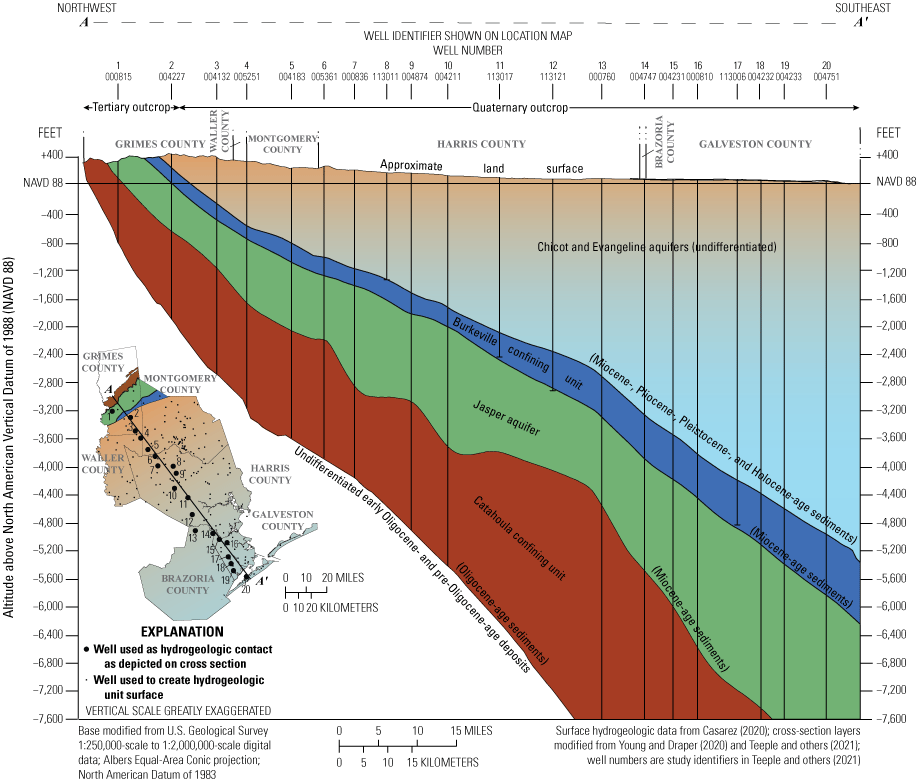
Hydrogeologic cross section A–A´ of the Gulf Coast aquifer system in Grimes, Waller, Montgomery, Harris, Brazoria, and Galveston Counties, Texas.
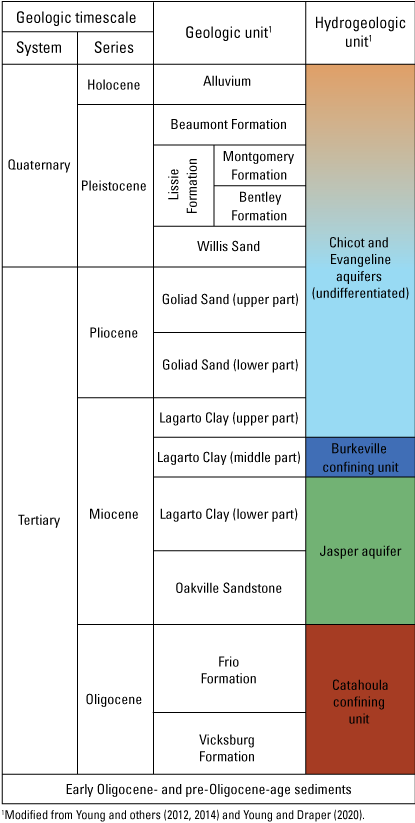
Depiction of the geologic and hydrogeologic units of the Gulf Coast aquifer system in the greater Houston study area, Texas.
Through time, geologic and hydrologic processes resulted in the accumulation of sediment wedges (stacked sequences of sediments) more than 7,600 ft thick at the coast (fig. 2) (Chowdhury and Turco, 2006). These sediments are the inland part of a “vast wedge of terrigenous sediments which composes the northern continental margin” of the Gulf of America (Garrison and Martin, 1973, p. 1). Within the stacked sequences of sediments in the greater Houston area are the interbedded layers of sediments that compose the geologic units that contain the Gulf Coast aquifer system. These layers of sediments were deposited by fluvial-deltaic processes and subsequently eroded and redeposited by worldwide episodic changes in sea level that occurred as a result of oscillations between glacial and interglacial climate conditions (Lambeck and others, 2002). During these climatic oscillations, clay and silt layers accumulated in interbedded layers with coarser grained sediments as part of the complex depositional history of the Gulf Coast aquifer system (Chowdhury and Turco, 2006). The Gulf Coast aquifer system is contained in geologic units that dip and thicken from northwest to southeast; the hydrogeologic units representing the aquifers and confining units thus crop out in bands inland from, and approximately parallel to, the coast and become progressively more deeply buried and confined toward the coast (figs. 1 and 2) (Kasmarek, 2012). The aquifers receive recharge where the geologic units containing the aquifers crop out (Kasmarek and Robinson, 2004) (figs. 1 and 2). The Burkeville confining unit is stratigraphically positioned between the Chicot and Evangeline aquifers (undifferentiated) and the Jasper aquifer (fig. 2), thereby restricting groundwater flow between the Chicot and Evangeline aquifers (undifferentiated) and the Jasper aquifer. Supporting evidence of the interaction of groundwater flow between the Chicot and Evangeline aquifers includes the absence of a confining unit and similarities between long-term water-level-change maps for each aquifer (for example, figs. 5 and 7 in Braun and others [2019] and figs. 5 and 7 in Braun and Ramage [2020]), which indicate that the areas where groundwater levels have risen or declined are approximately spatially coincident. Additional evidence of the hydraulic connection between the Chicot and Evangeline aquifers was provided by Borrok and Broussard (2016, p. 330); their geochemical evaluation of the Chicot aquifer system from 1993 to 2015 in Louisiana indicated that in some years (1998, 2008, and 2011) certain wells screened in the Chicot aquifer “appeared to be tapping water with a geochemistry (temperature, salinity, alkalinity, [and so forth]) matching the underlying Evangeline aquifer.”
Hydraulic properties of the Chicot aquifer do not differ appreciably from those of the hydrogeologically similar Evangeline aquifer (Carr and others, 1985, p. 10). From aquifer-test data, Meyer and Carr (1979) estimated that the transmissivity of the Chicot aquifer ranges from 3,000 to 25,000 square feet per day (ft2/d) and that the transmissivity of the Evangeline aquifer ranges from 3,000 to 15,000 ft2/d.
Proceeding updip and inland from the Quaternary- and Tertiary-age sediments containing the Chicot and Evangeline aquifers (undifferentiated) in the southeastern part of the study area, the older geologic units (containing the Burkeville confining unit, the Jasper aquifer, and the Catahoula confining unit) sequentially crop out (figs. 1 and 2). Additionally, in the downdip parts of the aquifer system, the Jasper aquifer can be differentiated from the overlying Chicot and Evangeline aquifers (undifferentiated) on the basis of hydrostratigraphic position relative to the altitude of the Burkeville confining unit (figs. 2 and 3).
Precipitation falling on the land surface overlying these aquifers returns to the atmosphere as evapotranspiration, becomes surface runoff until it reaches streams, or infiltrates as groundwater recharge to the unconfined sediments containing the aquifers (Williamson and others, 1990; Healy, 2010). The infiltrating water moves downgradient toward the coast, reaching the intermediate and deep zones of the aquifers southeastward of the outcrop areas, where it can be withdrawn and discharged by wells or is naturally discharged by diffuse upward leakage in topographically low areas near the coast (Kasmarek and Robinson, 2004). Water in the coastal, deep zones of the aquifers is denser, and this higher density water causes the fresher, lower density water that has not been captured and withdrawn by wells to be redirected as diffuse upward leakage to shallow zones from the confined downdip areas of the aquifer system (Kasmarek and Robinson, 2004).
Recent updates to the hydrogeologic framework are detailed in Ramage and others (2022), which summarized the work of Young and others (2012, 2014) and Young and Draper (2020). Young and Draper (2020) updated the Gulf Coast aquifer system stratigraphy and hydrogeologic unit thicknesses for the study area (figs. 2 and 3) by using a coupled chronostratigraphic and lithostratigraphic approach. The coupled chronostratigraphic and lithostratigraphic approach used by Young and Draper (2020) was applied to a prior representation of the hydrogeologic framework proposed by Young and others (2014), which in turn was based on earlier work by Young and others (2012). Young and Draper (2020) subdivided the Lagarto Clay (Miocene) into upper, middle, and lower parts; in their revised hydrogeologic framework, the upper part of the Lagarto Clay was included in the sediments that contain the Evangeline aquifer, which is undifferentiated from the Chicot aquifer for the purposes of this report (fig. 3). The lower part of the Lagarto Clay was included in the revised definition of the sediments that contain the Jasper aquifer (fig. 3), similar to Turcan and others (1966). Additionally, the Goliad Sand (Pliocene) was subdivided into upper and lower parts following Young and others (2012).
Previous Studies
From the early 1900s until about 1930, periodic measurements of groundwater levels were documented in the greater Houston area. Groundwater-level data became more widely available beginning in December 1930 when systematic USGS groundwater measurement surveys began in cooperation with the Texas State Board of Water Engineers (predecessor to the Texas Water Commission) and the City of Houston (White and others, 1939, 1944). From these data, the first water-level-altitude maps of the Chicot and Evangeline aquifers for 1928 and 1931 in the Houston area were published (figs. 1 and 2 in White and others [1939]). USGS groundwater measurements have continued since 1930 in a groundwater-level monitoring network of wells in the Houston area. Gabrysch (1967, 1972, 1980) produced water-level-altitude maps of the Chicot and Evangeline aquifers for 1957, 1966, 1970, and 1975. As described in the “Introduction” section of this report, the USGS established an extensive network of wells in 1977, and groundwater-level data collected during the spring seasons of 1977 and 1978 were used to construct water-level-altitude maps of the Chicot and Evangeline aquifers in the greater Houston area, the first to be published in an annual series (Gabrysch, 1979). In cooperation with the FBSD, which was established in 1989 and adopted its groundwater management plan in 1990 (FBSD, 2013), an increased number of wells were inventoried by the USGS in Fort Bend, Harris, Brazoria, and Waller Counties in 1989 and 1990. A more comprehensive water-level-altitude report for the Chicot and Evangeline aquifers depicting water-level altitudes for 1990 was published by the USGS in 1991 (Barbie and others, 1991) and was revised in 1997 when updated well data became available (Kasmarek, 1997). Similarly, after the establishment of the LSGCD in 2001, the USGS began publishing water-level-altitude maps for the Jasper aquifer in the greater Houston area (primarily Montgomery County) (Coplin, 2001). In 2004, 2006, and 2007, as additional wells with reliable water-level data were inventoried, updated water-level-altitude maps for the Jasper aquifer were published (Kasmarek and Lanning-Rush, 2004; Kasmarek and others, 2006; Kasmarek and Houston, 2007). Since 2007, comprehensive maps for the Jasper aquifer have been included in the annual series of reports that depict water-level altitudes and water-level changes in the greater Houston area (Kasmarek and Houston, 2007, 2008; Kasmarek, Houston, and Ramage, 2009; Kasmarek and others, 2010, 2012, 2013, 2014, 2015, 2016; Johnson and others, 2011; Kasmarek and Ramage, 2017; Shah and others, 2018; Braun and others, 2019; Braun and Ramage, 2020, 2022; Ramage and Braun, 2023; Ramage, 2024).
Methods
This section describes the methods used to (1) collect and process water-level data used in this report; (2) apply kriging processes used to depict water-level altitudes and water-level changes, which are described briefly herein and in detail in Ramage and others (2022); (3) determine water-level altitudes; (4) depict long-term water-level changes in the study area; and (5) depict short-term water-level changes in the study area. The data collection methods are similar to those described in previous reports by Gabrysch (1979), Kasmarek and Houston (2007), and Kasmarek and Ramage (2017).
Water-Level Measurements
Water-level measurements were made at 573 wells in the study area by USGS personnel during December 2023 through March 2024 (Adams and Ramage, 2024a). At each well, a measuring point was established (if one had not been previously established) to determine the depth to water. The height above or below land surface of the measuring point at each well was measured with an engineering ruler. The depth to water in each well was then measured by using a calibrated steel tape, airline, or electric groundwater-level tape in accordance with methods described in Cunningham and Schalk (2011). Each well was measured during the December 2023 through March 2024 time period to provide a “snapshot” of water-level altitudes in the aquifers associated with individual wells.
In 2024, a total of 11 additional water-level measurements (representing about 2 percent of the overall total number of water-level measurements) were provided by municipal utility districts, industrial entities, and powerplants. Municipal utility districts supply water to some of the businesses and residents of the greater Houston area (Municipal District Services, 2023). Water is used by oil and gas industrial entities during hydrocarbon processing (Allison and Mandler, 2018) and by powerplants to generate electrical power (Torcellini and others, 2003). The provided water levels were typically measured by using air pressure to determine the saturated thickness above the pump intake, and multiple pressure measurements were usually made as a quality-control measure. Air pressure measurements tend to provide less precision than do measurements made with either a calibrated steel tape or an electric tape; therefore, all provided measurements were rounded to the nearest foot. Water levels that were provided by municipal utility districts, industrial entities, or powerplants are identified as such in the “source” field in Adams and Ramage (2024a); additional information about these wells can be obtained from the USGS National Water Information System (NWIS) (USGS, 2024b); however, the provided water-level data were not entered into NWIS.
Median water-level values, based on measurements made during the previous 10 years where at least six water levels were available, were computed for three wells that could not be measured in 2024. This step was undertaken to maintain the spatial resolution of the dataset relative to previous iterations of the dataset associated with prior years in the annual series of USGS reports. The decision to include median water levels for these three wells to generate the maps included in this report was deemed appropriate because the three wells were considered to have low variability (standard deviations of less than [<] 2 ft) in the previous 10 years of measured values. Median water levels are identified in the “remarks” field in Adams and Ramage (2024a).
Many of the measured wells were being pumped at least once daily (and some more frequently) during the study period. Therefore, well pumps were turned off for at least 1 hour when possible before the water-level measurements were made in order to obtain a water-level measurement that approximated the static conditions within the aquifer. Antecedent withdrawal rates and pumping status of nearby wells were not always known and, in such instances, could have affected the representativeness of the water-level data that were collected. To ensure that the recorded water-level measurement was accurate, at least two water-level measurements were made at each well while the well was not being pumped. After the water-level-measurement data were collected, they were thoroughly evaluated, reviewed, and entered into NWIS (USGS, 2024b), and these data were then incorporated into a geographic information system as point-data layers and subsequently used for the construction of water-level-altitude and water-level-change maps. The water-level measurements made, provided, or computed for this study were carefully reviewed by USGS personnel and were compiled in a companion data release (Adams and Ramage, 2024a).
Kriging
This section is modified from the “Use of Universal Kriging Geostatistical Interpolation Methods To Depict Water-Level Altitudes” section of Ramage and others (2022). Kriging was used to create a grid of estimated water-level-altitude and water-level-change values for the Chicot and Evangeline (undifferentiated) and Jasper aquifers both at measured well locations and between measured well locations using water-level-measurement data from 2024 (Adams and Ramage, 2024a, b). Kriging has long been recognized as an effective method for interpolating hydrologic data, particularly water-level data, as an alternative to contouring methods (Varouchakis and others, 2012) and is a well-established geostatistical method (Matheron, 1963; Paramasivam and Venkatramanan, 2019) that provides an optimized unbiased linear prediction with a minimum mean estimation error. Kriging, like other interpolation methods, uses a weighted average of all measured values to predict values at unmeasured locations. The weights assigned to measured values when predicting values at unmeasured locations are spatially dependent. The spatial dependency is quantified by the spatial correlation of the measured locations and is assumed to be more similar with spatial proximity and to diverge as spatial distance increases. Correlation between measured locations and their spatial distance relative to one another is defined by the experimental semivariogram and the best-fit model that attempts to minimize the estimation error (Olea, 1975, 2009). Kriging methods for depicting water-level altitudes and water-level changes provide several advantages compared to manual contouring methods, such as those described in Kasmarek and Ramage (2017). One of the advantages of kriging over traditional, manual contouring methods is that kriging provides estimated values of the variable of interest at unmeasured locations. Kriging also provides a means of quantifying the estimation uncertainty (by standard deviation, the square root of the computed variance), thereby allowing for evaluation of the estimation reliability (Todini, 2001). This estimation uncertainty can be useful for understanding and quantifying the spatial variability of the data and allowing for possible optimization of the network of wells. Additional details related to the kriging processes used to depict shaded, gridded representations of water-level altitudes and water-level changes in the Chicot and Evangeline (undifferentiated) and Jasper aquifers are described in Ramage and others (2022).
Determination of Water-Level Altitudes
The 2024 regional-scale depictions of water-level altitudes presented in this report were derived from water-level measurements made throughout the 11-county study area from December 2023 through March 2024 (water levels usually are higher because groundwater use is at its lowest during these months compared to the rest of the year). Water-level altitudes were calculated by subtracting the water-level measurement, in feet below land surface, made at each well from the land-surface elevation at that well referenced to NAVD 88 (National Ocean Service, 2021). Prior to 2016, water-level altitudes published in this annual series of USGS reports were referenced to either the National Geodetic Vertical Datum of 1929 or NAVD 88, whereas all water-level altitudes published in 2016 and after are referenced to NAVD 88.
The accuracy of land-surface-elevation data at wells used in the annual series of reports has gradually improved over time as digital elevation models (DEMs) progressively replaced traditional methods of determining land-surface elevations from topographic maps. The most accurate land-surface-elevation data available were used by the USGS for each historical annual depiction of water-level altitudes in the study area. To determine land-surface elevations in 2024, a corresponding land-surface datum was obtained for each well (if one had not already been established) by using a USGS National Geospatial Program 1-meter DEM that provides three-dimensional elevation values referenced to NAVD 88 (Arundel and others, 2015; USGS, 2024a). In 1977, land-surface-elevation data were extracted from USGS 1:24,000-scale, 7.5-minute topographic quadrangle maps for the Gulf of America coastal area, which have a 5-ft contour as described in Gabrysch (1979) and thereby provide an accuracy of approximately 2.5 ft. The DEM used to determine land-surface elevations in 2024 provides an accuracy of 0.5 ft.
Color-shaded representations of the 2024 water-level-altitude grids of the Chicot and Evangeline (undifferentiated) and Jasper aquifers produced by the kriging process were constructed such that each color shade represents increments or “bins” of water-level altitudes (50-ft range, except at the extreme ranges where estimates are less than the 50-ft range). To depict the upper and lower bounds of the data on each map, the water-level-altitude increment for the first bin and for the last bin for a given map extends to the lowest and highest estimated water-level-altitude value, respectively. The gridded water-level altitudes are published in a companion data release (Adams and Ramage, 2024b). The kriging-derived water-level-altitude grids are approximate, regional-scale depictions of the water-level altitudes in the Chicot and Evangeline (undifferentiated) and Jasper aquifers.
Depicting Long-Term Water-Level Changes
Maps depicting long-term water-level changes in the Chicot and Evangeline (undifferentiated) and Jasper aquifers were constructed for the period of record available for each of the aquifers; data are from 1977 to 2024 for the Chicot and Evangeline aquifers (undifferentiated) and from 2000 to 2024 for the Jasper aquifer. With the establishment of the FBSD in 1989 and the subsequent increase in the number of wells that were inventoried by the USGS in Fort Bend, Harris, Brazoria, and Waller Counties in 1989 and 1990, a long-term water-level-change map for the period from 1990 to 2024 for the Chicot and Evangeline aquifers (undifferentiated) was also constructed to highlight changes in water levels since their establishment in 1989. Long-term water-level-change maps were constructed from kriging-derived grids of estimated water-level data from the current year (2024) and from each respective benchmark year for the period of record (1977 and 1990 for the Chicot and Evangeline aquifers [undifferentiated] and 2000 for the Jasper aquifer). Each color shade on the maps represents increments or “bins” of water-level changes of either 20 or 40 ft. As with the water-level-altitude maps, to depict the upper and lower bounds of the data on each map, the water-level-altitude increment for the first bin and for the last bin for a given map extends to the lowest and highest estimated water-level-change value, respectively.
In previous iterations of this report (Braun and Ramage, 2022; Ramage and Braun, 2023; Ramage, 2024), long-term water-level-change maps starting in 1977 and 1990 for the Chicot and Evangeline aquifers (undifferentiated) and starting in 2000 for the Jasper aquifer were produced by subtracting the current year water-level-altitude surface from the benchmark year water-level-altitude surface as described in Ramage and others (2022). In this report, long-term water-level- change surfaces were produced by using the same kriging methods (Ramage and others, 2022) that were used to produce the current year (2024) gridded surfaces of estimated water-level altitudes across the study area for the Chicot and Evangeline (undifferentiated) and Jasper aquifers. To produce the long-term water-level-change maps, the kriging process uses the calculated difference in water-level altitude between the benchmark year (1977, 1990, or 2000) and the current year (2024) at all wells where measurements were collected in both the benchmark year and the current year. At wells where a water-level measurement was collected in 2024 but not in the benchmark year, the well point was intersected with the kriged surface for the benchmark year, and the change was calculated as the difference between the water-level-altitude value at that well from the intersected point on the kriged surface for the benchmark year and the water-level altitude from 2024.
A mask was applied to each kriging-derived gridded surface (water-level altitudes and long-term water-level changes) as a method for either removing potential outlier data or masking (not showing) grid cells where there was insufficient data density. The threshold for the applied mask was chosen to retain (show) only those data for which the variance value of each grid cell was less than or equal to the overall mean variance of the entire gridded surface of each respective gridded surface. Water-level-measurement data from wells measured in a given historical year (1977, 1990, or 2000) were gridded using the same methods that were used to generate the 2024 water-level-altitude grids, and a mask was applied to the gridded historical altitudes to retain only those grid cells with variance values less than or equal to the mean variance of the historical grid (as a whole) (Ramage and Adams, 2023). The area of water-level change shown on the maps is based primarily on the availability of water-level data in both 2024 and the historical year. Long-term water-level-change shaded grids are available in Adams and Ramage (2024b); the grids and their associated variance distribution maps that were produced from the water-level data collected from the network of wells (along with a description of the processes by which these datasets were produced) are included in Adams and Ramage (2024a, b).
Depicting Short-Term Water-Level Changes
Maps depicting short-term water-level changes in the Chicot and Evangeline (undifferentiated) and Jasper aquifers were constructed to represent changes during the past 5 years (2019–24) and during the past year (2023–24). Because these change maps represent a much shorter time period than do the long-term change maps, changes in excess of 30 ft at the local scale (individual wells or small groups of proximal wells) tend to stand out because the majority of wells in the mapped area exhibit <20 ft of rise or decline over the shorter time periods; these local-scale changes tend to reflect short-term variations in demand, pumping status, or precipitation patterns. Because the estimates provided by the kriging process are weighted using data from other wells, these short-term variations tend to be smoothed out of long-term change maps, which are more representative of regional-scale variations in water levels. In order to preserve the representation of these short-term variations in demand, pumping status, or precipitation patterns, kriging and a shaded grid were not used to depict the short-term changes, which are instead depicted by shading a triangle symbol at each of the wells measured during both years representing the water-level change for the short-term interval in question, where the orientation of the triangle symbol represents water-level rises (pointing upward) or declines (pointing downward) and the shading represents water-level rises or declines at 10-ft intervals. Water-level change was determined by direct subtraction of water levels at each well measured at both the beginning and ending of the periods of interest (2019 and 2024 for the 5-year maps; 2023 and 2024 for the 1-year maps).
Water-Level Altitudes and Long-Term and Short-Term Water-Level Changes
Maps of water-level altitudes and long-term and short-term water-level changes were constructed for the Chicot and Evangeline (undifferentiated) and Jasper aquifers in the study area (figs. 4–12). This report depicts kriging-derived water-level altitudes for the Chicot and Evangeline aquifers (undifferentiated) in 2024 by using shaded grids where each shade represents a 50-ft interval (fig. 4) and approximate long-term (1977–2024 and 1990–2024) water-level changes in the Chicot and Evangeline aquifers (undifferentiated) by using shaded grids where each shade represents a 40-ft interval (figs. 5 and 6). Approximate short-term (2019–24 and 2023–24) water-level changes in the Chicot and Evangeline aquifers (undifferentiated) are represented by shaded triangle symbols for each well where a water-level measurement was made both in 2024 and in either 2019 or 2023 (figs. 7 and 8). For approximate water-level altitudes for the Jasper aquifer in 2024, shaded grids representing 50-ft intervals were used (fig. 9), and for approximate long-term (2000–24) water-level changes in the Jasper aquifer, shaded grids representing 20-ft intervals were used (fig. 10). Approximate short-term (2019–24 and 2023–24) water-level changes in the Jasper aquifer are represented by shaded triangle symbols for each well where a water-level measurement was made both in 2024 and in either 2019 or 2023 (figs. 11 and 12). Because the precision of the individual water-level-altitude values varied from the nearest hundredth of a foot to the nearest foot, the value obtained by subtracting the current year (2024) water-level-altitude surface from the benchmark year water-level-altitude surface was rounded to the nearest foot in the maps of water-level changes shown in figures 7, 8, 11, and 12.
Locations of wells used to construct the 2024 water-level-altitude maps for the Chicot and Evangeline (undifferentiated) and Jasper aquifers are presented in Adams and Ramage (2024a, b). Certain water-level measurements made during December 2023 through March 2024 were not used to construct the water-level-altitude maps presented in this report. Many of the wells that were excluded when constructing the water-level-altitude maps were colocated wells in nests. It is not possible to establish a variance-distance relation between observations made at the same location (variability of observations over zero distance) during the kriging process; therefore, prior to the kriging process, colocated wells must be “declustered.” When two or more wells were colocated, data from the well where the water level was deepest were retained because that well was expected to have a water level that was most analogous to nearby production wells, which tend to be deeper and have deeper water levels than domestic wells or piezometers. Production wells account for most of the groundwater-monitoring network, particularly in Harris County, where most of the colocated wells are located. A much smaller number of the wells were excluded when constructing the water-level-altitude maps because they were not consistent with water-level altitudes obtained from nearby wells screened in the same aquifer for one of the following reasons: (1) the water level measured in the well in question differed appreciably from the water levels measured in wells in the surrounding area and was deemed to be erroneous, or (2) water had been withdrawn recently from the well in question, temporarily lowering its static water-level altitude. A companion data release by Adams and Ramage (2024b) identifies the water-level measurements that were used to construct the maps of water-level altitudes and water-level changes for each aquifer. Of the 587 wells in the study area where water-level measurements were collected or 10-year median values were computed, 565 are screened in the Chicot, Chicot and Evangeline, Evangeline, or Jasper aquifers; of these 565 wells, the well depths were 250 ft or less in 38 wells (34 in the Chicot and Evangeline aquifers [undifferentiated] and 4 in the Jasper aquifer). Wells with depths of 250 ft or less are not used in the construction of the water-level-altitude maps (Ramage and others, 2022; Adams and Ramage, 2024a). Therefore, water-level measurements from 527 of the 565 available wells were used in the construction of the water-level-altitude maps for the Chicot and Evangeline (undifferentiated) and Jasper aquifers. Individual water-level altitudes measured at each well for the Chicot and Evangeline (undifferentiated) and Jasper aquifers and associated metadata are provided in the companion data releases (Adams and Ramage, 2024a, b).
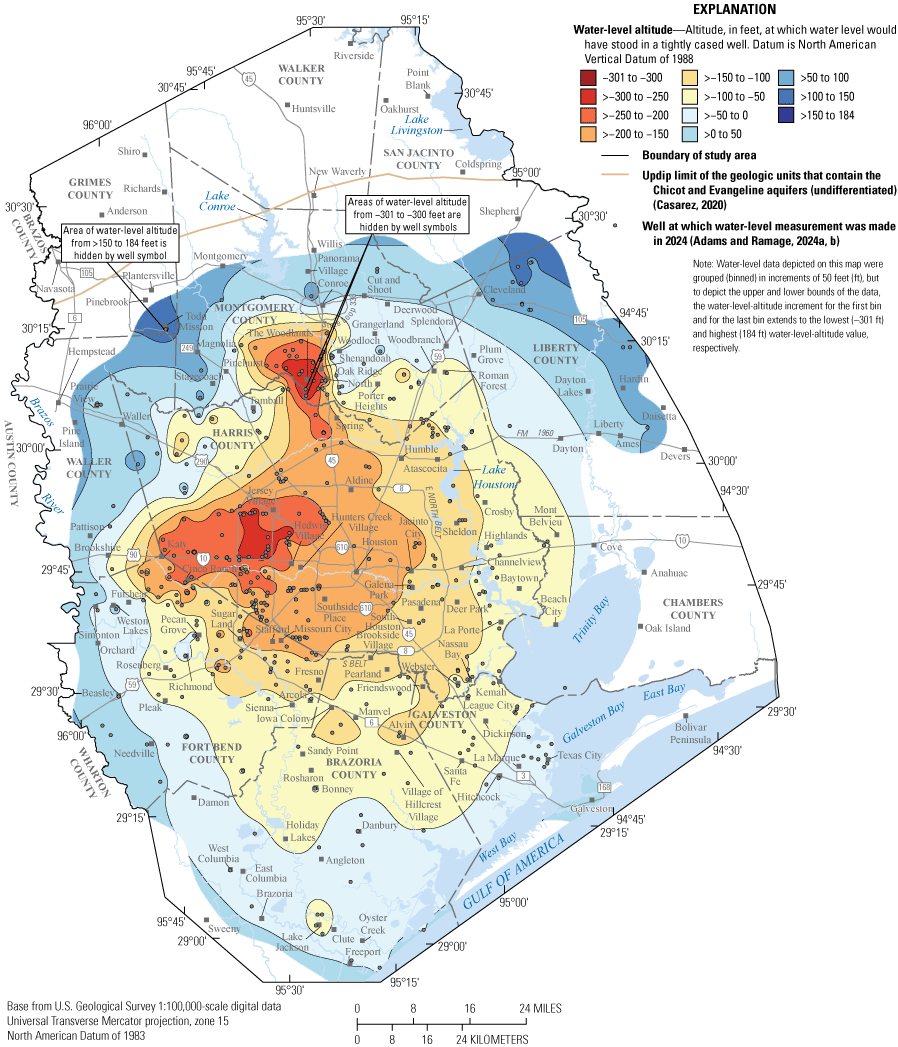
Approximate 2024 water-level altitudes in the Chicot and Evangeline aquifers (undifferentiated), greater Houston study area, Texas (water-level-measurement data collected during December 2023 through March 2024).
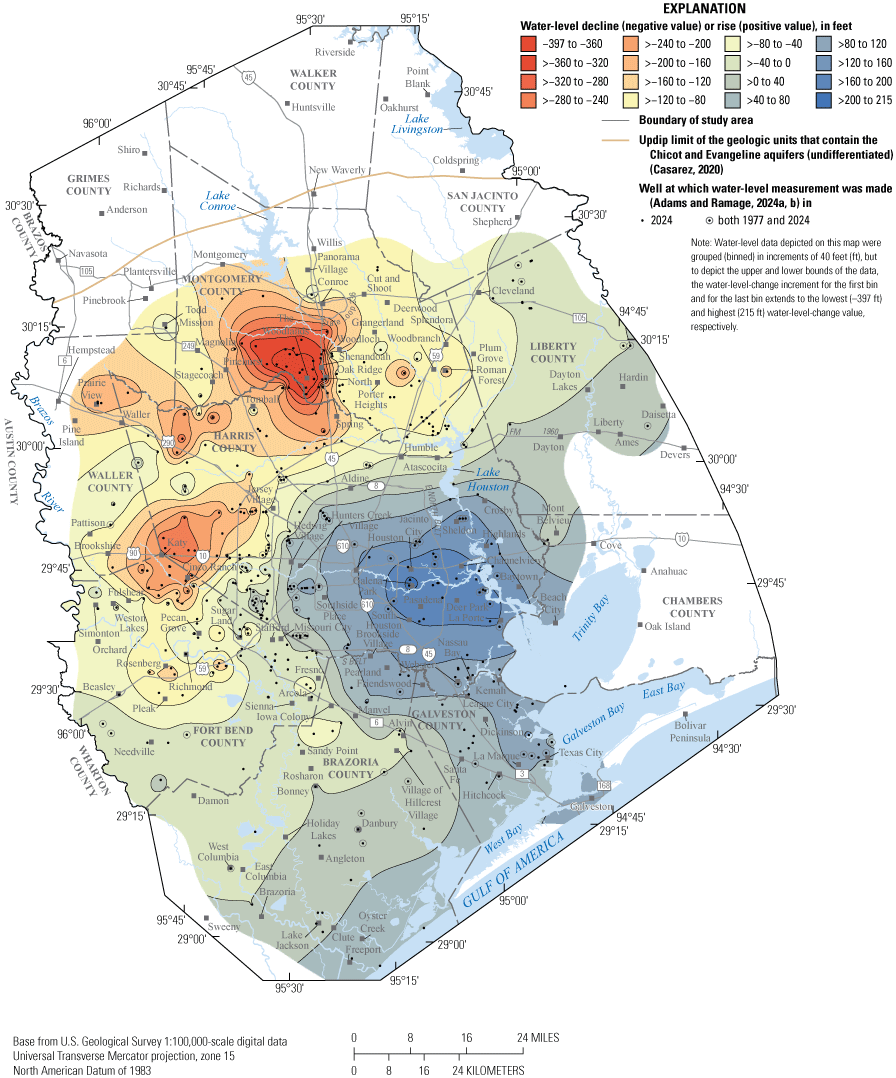
Approximate 1977–2024 water-level changes in the Chicot and Evangeline aquifers (undifferentiated), greater Houston study area, Texas.
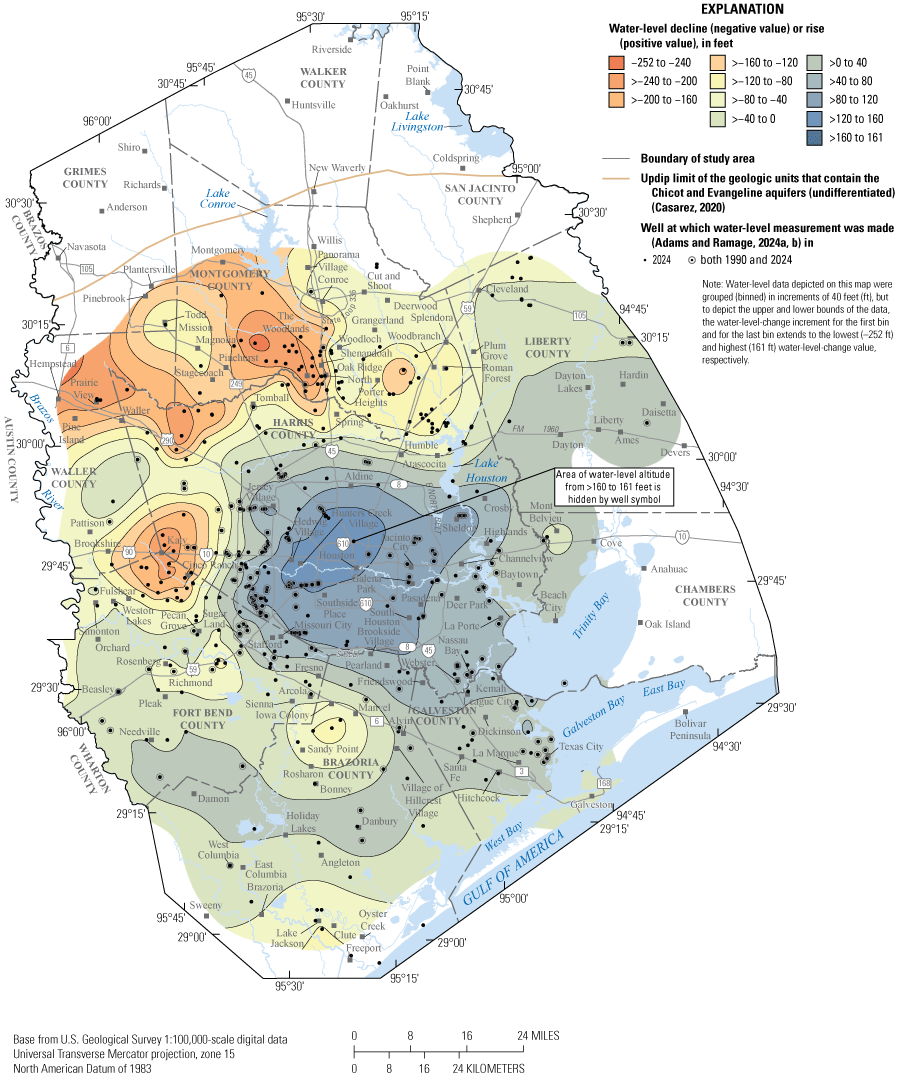
Approximate 1990–2024 water-level changes in the Chicot and Evangeline aquifers (undifferentiated), greater Houston study area, Texas.
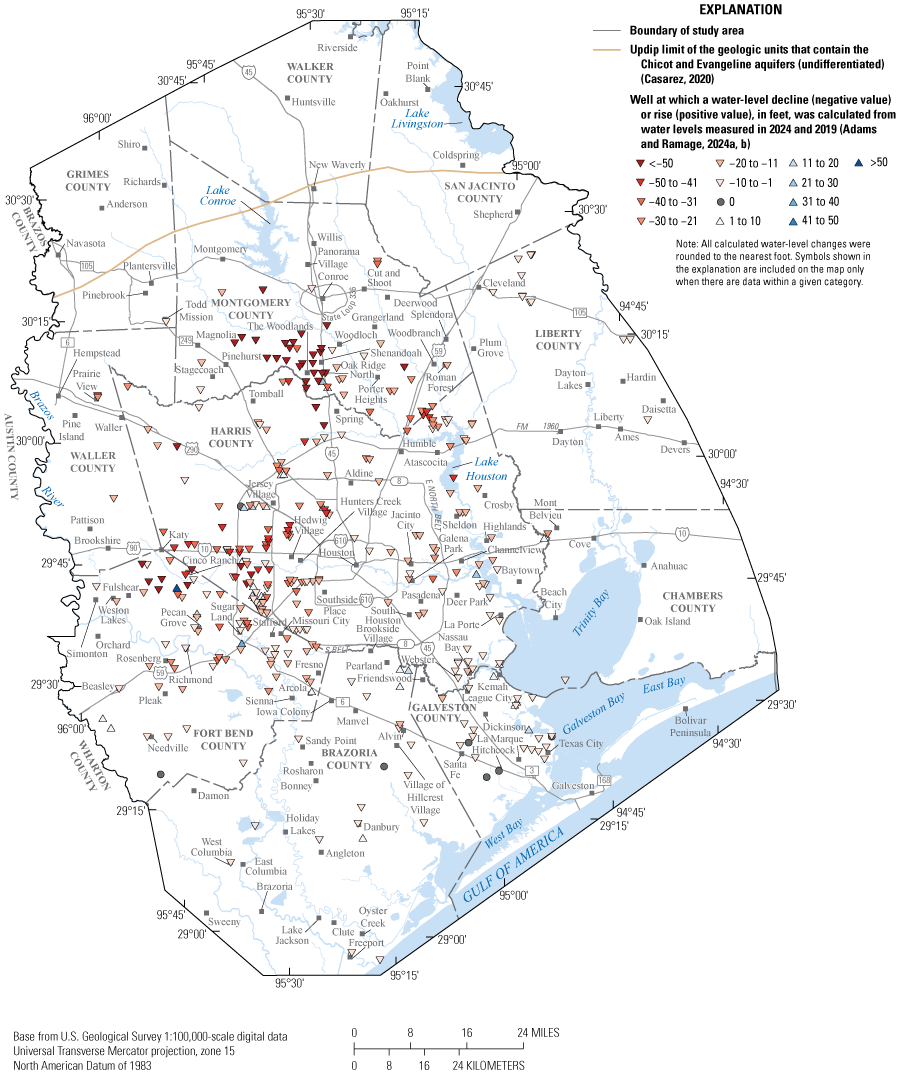
Approximate 2019–24 water-level changes at wells screened in the Chicot and Evangeline aquifers (undifferentiated), greater Houston study area, Texas.
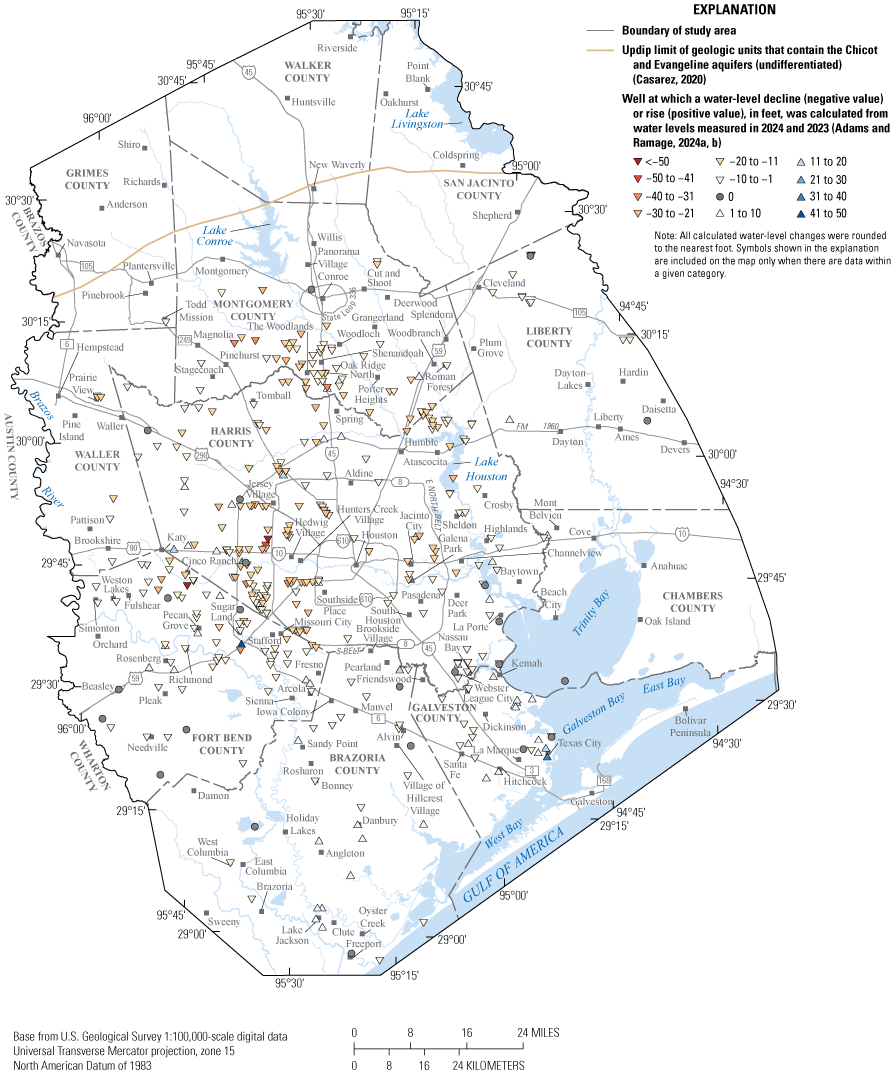
Approximate 2023–24 water-level changes at wells screened in the Chicot and Evangeline aquifers (undifferentiated), greater Houston study area, Texas.
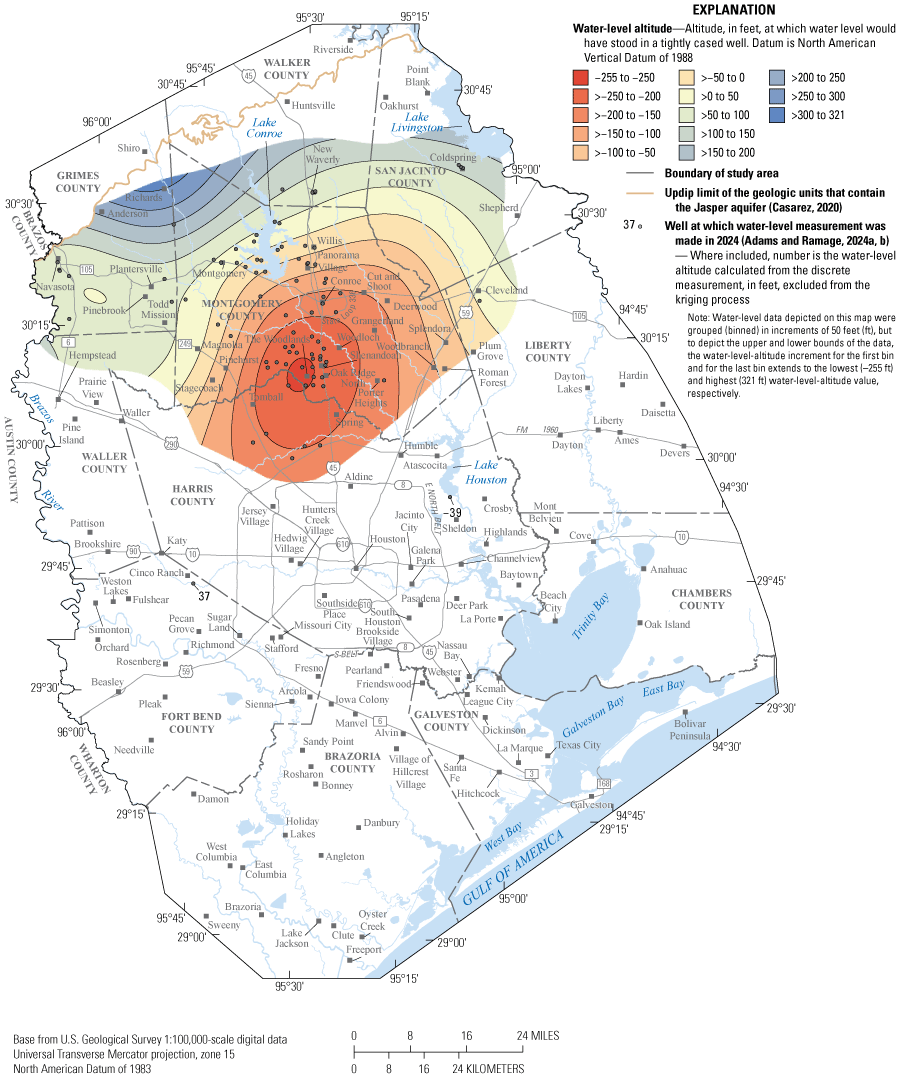
Approximate 2024 water-level altitudes in the Jasper aquifer, greater Houston study area, Texas (water-level-measurement data collected during December 2023 through March 2024).
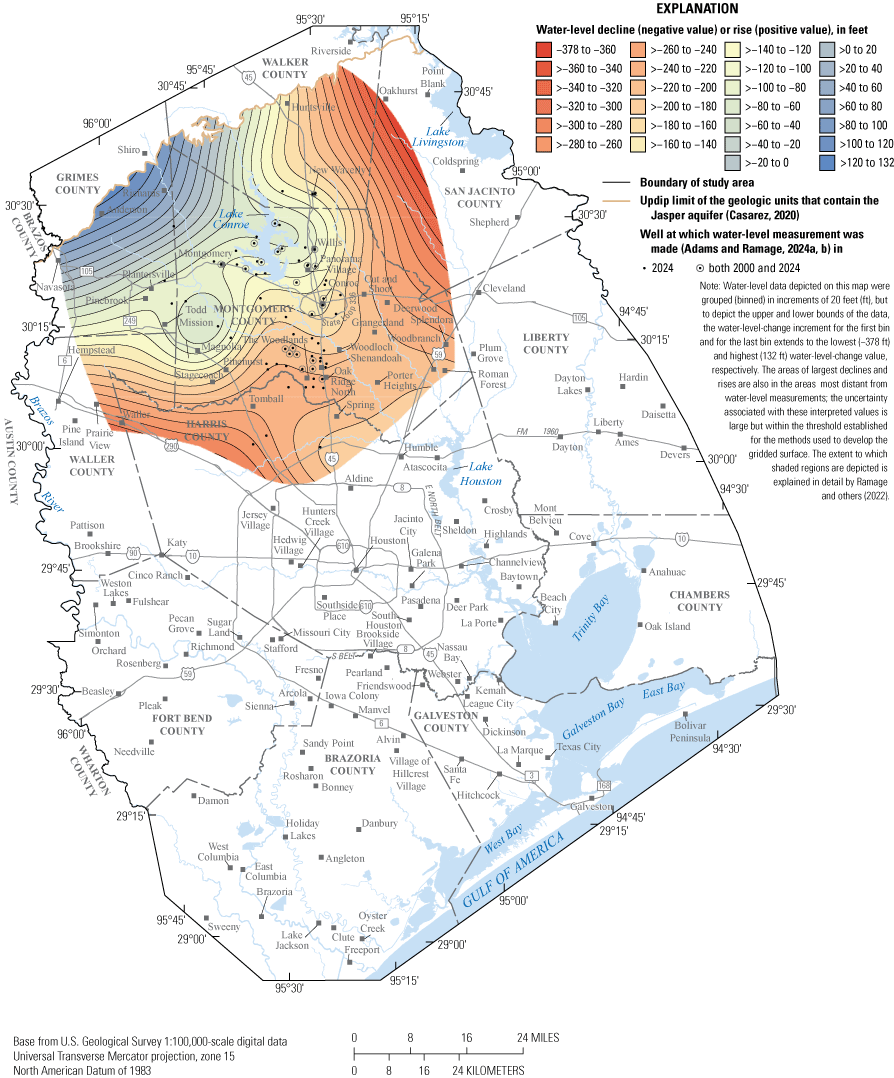
Approximate 2000–24 water-level changes in the Jasper aquifer, greater Houston study area, Texas.
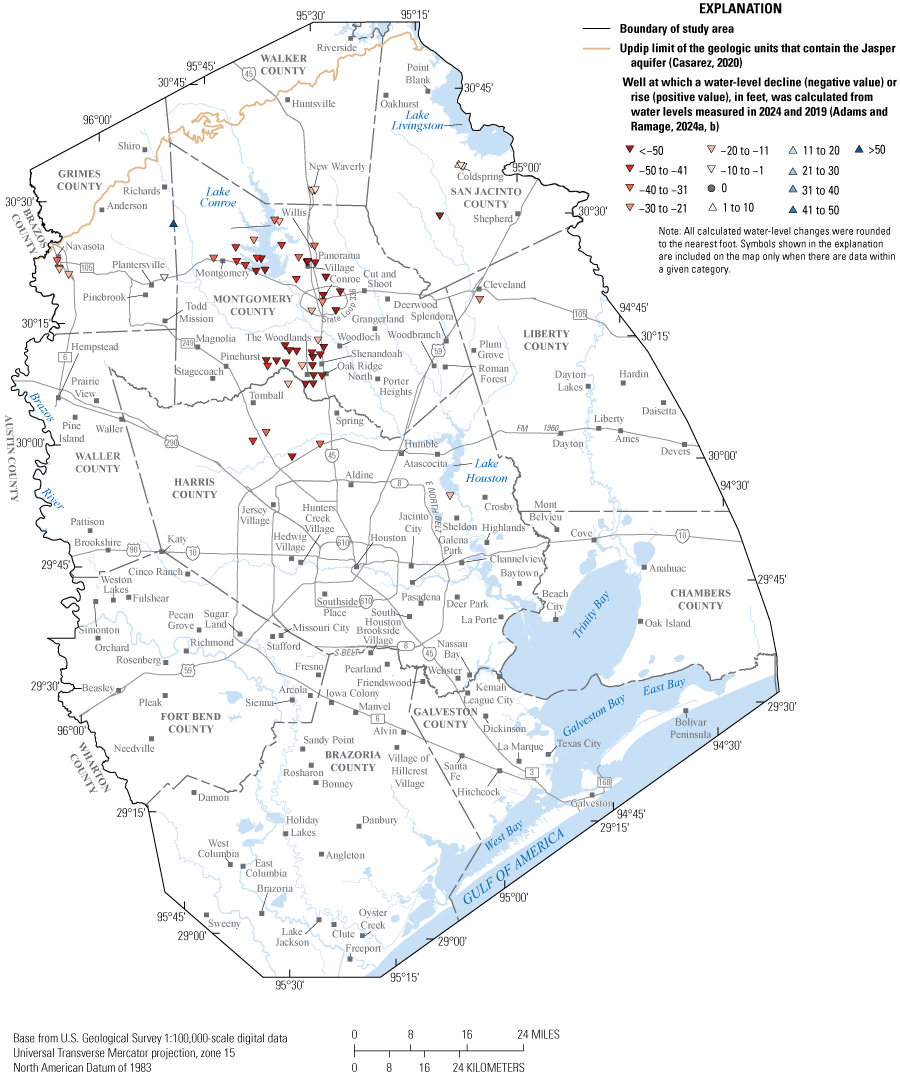
Approximate 2019–24 water-level changes at wells screened in the Jasper aquifer, greater Houston study area, Texas.
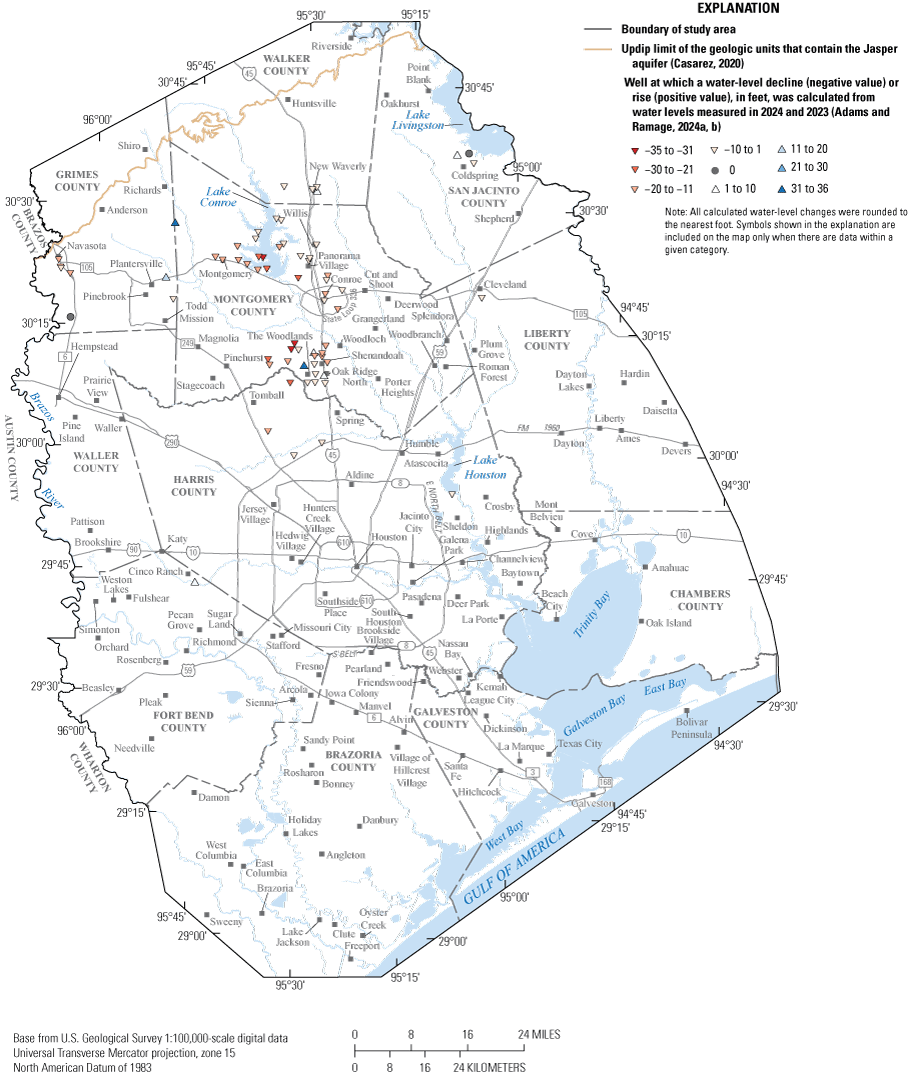
Approximate 2023–24 water-level changes at wells screened in the Jasper aquifer, greater Houston study area, Texas.
Chicot and Evangeline Aquifers (Undifferentiated)
Water-level-measurement data from 443 wells (Adams and Ramage, 2024b) were used to depict the 2024 water-level altitudes for the Chicot and Evangeline aquifers (undifferentiated) (fig. 4). In 2024, depicted water-level altitudes for the Chicot and Evangeline aquifers (undifferentiated) were lowest (300–301 ft below NAVD 88, which corresponds to the interval from −301 to −300 ft in fig. 4) in two small areas (so small that they are obscured by well symbols) in and near The Woodlands in Montgomery County. The highest depicted water-level altitudes (>150–184 ft above NAVD 88, which corresponds to the interval from greater than [>] 150 to 184 ft in fig. 4) for the Chicot and Evangeline aquifers (undifferentiated) in 2024 were in a small area (so small that it is obscured by the well symbol on the map) at and near a well south of Todd Mission, near the southeastern border of Grimes County.
The largest decline in water-level altitudes (360–397 ft, which corresponds to the interval from −397 to −360 ft in fig. 5) depicted by the 1977–2024 long-term water-level-change map for the Chicot and Evangeline aquifers (undifferentiated) was in south-central Montgomery County (fig. 5), whereas the 1990–2024 long-term water-level-change map for the Chicot and Evangeline aquifers (undifferentiated) depicts the largest declines in water-level altitudes (240–252 ft, which corresponds to the interval from −252 to −240 ft in fig. 6) in an area northwest of The Woodlands and in an area of northern Waller County (fig. 6). The largest rise in water-level altitudes in the Chicot and Evangeline aquifers (undifferentiated) (>200–215 ft, which corresponds to the interval from >200 to 215 ft in fig. 5) is depicted in an area of east-central Harris County for 1977–2024, whereas the largest rise in water-level altitudes for 1990–2024 (>160–161 ft, which corresponds to the interval from >160 to 161 ft in fig. 6) is depicted in an area of central Harris County.
The 5-year (2019–24) short-term water-level-change map for the Chicot and Evangeline aquifers (undifferentiated) depicts the largest declines (>50 ft, which corresponds to the interval <−50 ft in fig. 7) in several parts of the study area, primarily concentrated in northern Fort Bend County, southwestern Harris County, and south-central Montgomery County. The largest rise for 2019–24 (>50 ft) is depicted at a well in northern Fort Bend County (fig. 7). The 1-year (2023–24) short-term water-level-change map for the Chicot and Evangeline aquifers (undifferentiated) depicts the largest declines (>50 ft, which corresponds to the interval <−50 ft in fig. 8) at a well in northern Fort Bend County and a well in west-central Harris County. The largest rise (about 50 ft, which corresponds to the interval from 41 to 50 ft in fig. 8) is depicted at a well in east-central Fort Bend County.
Jasper Aquifer
Water-level-measurement data from 84 wells (Adams and Ramage, 2024b) were used to depict the approximate 2024 water-level altitudes for the Jasper aquifer (fig. 9). In 2024, water-level altitudes for the Jasper aquifer were lowest (250–255 ft below NAVD 88, which corresponds to the interval from −255 to −250 ft in fig. 9) in an area of south-central Montgomery County and north-central Harris County in and near The Woodlands, whereas water-level altitudes for the Jasper aquifer were highest (>300–321 ft above NAVD 88, which corresponds to the interval from >300 to 321 ft in fig. 9) in an area in eastern Grimes and northwestern Montgomery Counties (fig. 9).
Whereas annual water-level-measurement data have been collected from wells completed in the Chicot and Evangeline aquifers since 1977, annual water-level-measurement data have been collected from wells completed in the Jasper aquifer since only 2000. The 2000–24 long-term water-level-change map for the Jasper aquifer (fig. 10) depicts the largest water-level decline (360–378 ft, which corresponds to the interval from –378 to –360 ft in fig. 10) in an area of central San Jacinto County (fig. 10). The largest rise in water-level change (>120–132 ft, which corresponds to the interval from >120 to 132 ft in fig. 10) is depicted in an area of central Grimes County for 2000–24 (fig. 10). Note, however, that these areas of largest declines and rises are also in areas that are distant from water-level measurements; because they are interpreted values, the uncertainty associated with these values is considered large but within the threshold established for the methods used to develop the gridded surface. The extent to which shaded regions are depicted in figure 10 is explained in detail in Ramage and others (2022). Users should be aware of the uncertainty in the estimates of water-level change where the changes are depicted beyond where there were measured data for both 2000 and 2024.
The 5-year (2019–24) short-term water-level-change map for the Jasper aquifer depicts declines throughout most of the study area, with the largest declines (>50 ft, which corresponds to the interval <−50 ft in fig. 11) across parts of central and southern Montgomery County and at one well in north-central Harris County. The largest rise (>50 ft) for 2019–24 is depicted at a well centered on the Montgomery-Grimes County line (fig. 11). The 1-year (2023–24) short-term water-level-change map for the Jasper aquifer depicts the largest declines (31 to 35 ft, which corresponds to the interval from −35 to −31 ft in fig. 12) at two wells in south-central Montgomery County and at one well in northwestern Montgomery County on the west side of Lake Conroe. The largest rises (31 to 36 ft) during 2023–24 are depicted at one well in northwestern Montgomery County and one well in south-central Montgomery County (fig. 12).
Data Limitations
As described in the “Determination of Water-Level Altitudes” section, the accuracy of the land-surface-elevation data has gradually improved over time. Any changes in land-surface elevations at individual wells, such as inaccuracies associated with the DEM source data, could affect the accuracy of the long-term water-level-change maps that depict the differences between the current year (2024) and the historical year (1977, 1990, or 2000) altitudes.
Shaded representations of water-level altitudes and water-level changes should be viewed in a regional context because water-level altitudes in the Chicot and Evangeline aquifers (undifferentiated) and in the Jasper aquifer are dynamic and can change rapidly in individual wells and spatially over larger areas encompassing many wells in response to changes in local and regional groundwater withdrawals and different antecedent conditions when water-level measurements were made. Although the shaded, gridded surfaces provide more information than did the previously used contours and are based on geostatistical interpolation, the resulting data depicted in areas located between and distant to wells at which water-level measurements were made are estimated data. Users should be aware that water-level changes may have occurred since the water-level altitudes were determined for this report. Inherent uncertainties exist in these data such as antecedent withdrawal rates and the pumping status of nearby wells. When evaluating the gridded depictions of water-level altitudes and water-level changes (figs. 4–6, 9, and 10), users should exercise discretion and know the limitations of these data when drawing conclusions or making policy decisions. These data should not be used for engineering applications.
Summary
Since the early 1900s, groundwater withdrawn from the primary aquifers that compose the Gulf Coast aquifer system—the Chicot, Evangeline, and Jasper aquifers—has been an important source of water in the greater Houston area, Texas. This report, prepared by the U.S. Geological Survey in cooperation with the Harris-Galveston Subsidence District, City of Houston, Fort Bend Subsidence District, Lone Star Groundwater Conservation District, and Brazoria County Groundwater Conservation District, is one in an annual series of reports depicting the status of water-level altitudes and water-level changes in these aquifers in the greater Houston area. For this report, water levels in 573 wells were measured by U.S. Geological Survey personnel during December 2023 through March 2024 (water-level altitudes usually are higher during these months compared to the rest of the year).
In this report, the Chicot and Evangeline aquifers are treated as a single aquifer for the purposes of providing annual assessments of regional-scale water-level altitudes and water-level changes over time. This report features regional-scale maps depicting approximate 2024 water-level altitudes and both long-term (1977–2024, 1990–2024, and 2000–24) and recent short-term (1-year [2023–24] and 5-year [2019–24]) water-level changes in the Chicot and Evangeline (undifferentiated) and Jasper aquifers. After thorough review and evaluation of the collected data, water-level measurements from 443 and 84 wells were used to depict the approximate 2024 water-level altitudes for the Chicot and Evangeline aquifers (undifferentiated) and for the Jasper aquifer, respectively.
In 2024, estimated water-level altitudes for the Chicot and Evangeline aquifers (undifferentiated) ranged from about 301 feet (ft) below the North American Vertical Datum of 1988 (NAVD 88) to about 184 ft above NAVD 88. The largest decline in water-level altitudes (about 397 ft) depicted by the 1977–2024 long-term water-level-change map for the Chicot and Evangeline aquifers (undifferentiated) was in south-central Montgomery County, whereas the 1990–2024 long-term water-level-change map for the Chicot and Evangeline aquifers (undifferentiated) depicts the largest declines in water-level altitudes (about 252 ft) in an area northwest of The Woodlands and in an area of northern Waller County. The largest rise in water-level altitudes in the Chicot and Evangeline aquifers (undifferentiated) (about 215 ft) is depicted in an area of east-central Harris County for 1977–2024, whereas the largest rise in water-level altitudes for 1990–2024 (about 161 ft) is depicted in an area of central Harris County. The 5-year (2019–24) short-term water-level-change map for the Chicot and Evangeline aquifers (undifferentiated) depicts the largest declines (greater than [>] 50 ft) in several parts of the study area, with the greatest concentrations primarily in northern Fort Bend County, southwestern Harris County, and south-central Montgomery County; the largest rise (>50 ft) is depicted at a well in northern Fort Bend County. The 1-year (2023–24) short-term water-level-change map for the Chicot and Evangeline aquifers (undifferentiated) depicts the largest declines (>50 ft) at a well in northern Fort Bend County and a well in west-central Harris County; the largest rise (about 50 ft) is depicted at a well in east-central Fort Bend County.
In 2024, estimated water-level altitudes for the Jasper aquifer ranged from about 255 ft below NAVD 88 to about 321 ft above NAVD 88. The 2000–24 long-term water-level-change map for the Jasper aquifer depicts the largest water-level decline (about 378 ft) in an area of central San Jacinto County; the largest rise (132 ft) is depicted in an area of central Grimes County. The 5-year (2019–24) short-term water-level-change map for the Jasper aquifer depicts the largest declines (>50 ft) across parts of central and southern Montgomery County and at one well in north-central Harris County; the largest rise (>50 ft) is depicted at a well centered on the Montgomery-Grimes County line. The 1-year (2023–24) short-term water-level-change map for the Jasper aquifer depicts the largest declines (about 35 ft) at two wells in south-central Montgomery County and at one well in northwestern Montgomery County on the west side of Lake Conroe; the largest rises (about 36 ft) are depicted at one well in northwestern Montgomery County and one well in south-central Montgomery County.
Any changes in land-surface elevations at individual wells could affect the accuracy of the long-term water-level-change maps depicting the differences between the current year (2024) and the historical year (1977, 1990, or 2000) altitudes. Water-level changes may have occurred since the water-level altitudes were determined for this report. Inherent uncertainties exist in these data such as antecedent withdrawal rates and the pumping status of nearby wells. When evaluating the gridded depictions of water-level altitudes and water-level changes, users should exercise discretion and know the limitations of these data when drawing conclusions or making policy decisions. These data should not be used for engineering applications.
References Cited
Adams, A.C., and Ramage, J.K., 2024a, Depth to groundwater measured from wells in the greater Houston area, Texas, 2024: U.S. Geological Survey data release, https://doi.org/10.5066/P13XXB5O.
Adams, A.C., and Ramage, J.K., 2024b, Groundwater-level altitudes and long-term groundwater-level changes in the Chicot and Evangeline (undifferentiated) and Jasper aquifers, greater Houston area, Texas, 2024: U.S. Geological Survey data release, https://doi.org/10.5066/P13NLJ7T.
Allison, E., and Mandler, B., 2018, Water in the oil and gas industry—An overview of the many roles of water in oil and gas operations, pt. 2 of Petroleum and the environment: American Geosciences Institute, 2 p., accessed April 3, 2024, at https://www.americangeosciences.org/geoscience-currents/water-oil-and-gas-industry.
Arundel, S.T., Archuleta, C.M., Phillips, L.A., Roche, B.L., and Constance, E.W., 2015, 1-meter digital elevation model specification: U.S. Geological Survey Techniques and Methods, book 11, chap. B7, 25 p. with appendixes, accessed April 3, 2024, at https://doi.org/10.3133/tm11B7.
Baker, E.T., Jr., 1979, Stratigraphic and hydrogeologic framework of part of the Coastal Plain of Texas: Texas Department of Water Resources Report 236, 43 p., accessed April 3, 2024, at https://www.twdb.texas.gov/publications/reports/numbered_reports/doc/R236/R236.pdf.
Baker, E.T., Jr., 1986, Hydrology of the Jasper aquifer in the southeast Texas Coastal Plain: Texas Water Development Board Report 295, 64 p., accessed April 3, 2024, at https://www.twdb.texas.gov/publications/reports/numbered_reports/doc/R295/R295.pdf.
Barbie, D.L., Coplin, L.S., and Locke, G.L., 1991, Approximate altitude of water levels in wells in the Chicot and Evangeline aquifers in the Houston area, Texas, January–February 1990: U.S. Geological Survey Open-File Report 91–240, 2 sheets, accessed April 3, 2024, at https://doi.org/10.3133/ofr91240.
Bluebonnet Groundwater Conservation District [BGCD], 2021, Bluebonnet Groundwater Conservation District groundwater management plan: Bluebonnet Groundwater Conservation District, 212 p., accessed April 3, 2024, at https://www.bluebonnetgroundwater.org/wp-content/uploads/2023/08/Management-Plan-Adopted-01-27-2022.pdf.
Bluebonnet Groundwater Conservation District [BGCD], 2024, District history: Bluebonnet Groundwater Conservation District web page, accessed April 3, 2024, at https://www.bluebonnetgroundwater.org/district/.
Borrok, D.M., and Broussard, W.P., III, 2016, Long-term geochemical evaluation of the coastal Chicot aquifer system, Louisiana, USA: Journal of Hydrology, v. 533, p. 320–331, accessed April 3, 2024, at https://doi.org/10.1016/j.jhydrol.2015.12.022.
Braun, C.L., and Ramage, J.K., 2020, Status of groundwater-level altitudes and long-term groundwater-level changes in the Chicot, Evangeline, and Jasper aquifers, Houston-Galveston region, Texas, 2020: U.S. Geological Survey Scientific Investigations Report 2020–5089, 18 p., accessed April 3, 2024, at https://doi.org/10.3133/sir20205089.
Braun, C.L., and Ramage, J.K., 2022, Status of water-level altitudes and long-term water-level changes in the Chicot and Evangeline (undifferentiated) and Jasper aquifers, greater Houston area, Texas, 2021 (ver. 1.1, August 19, 2022): U.S. Geological Survey Scientific Investigations Report 2022–5065, 25 p., accessed April 3, 2024, at https://doi.org/10.3133/sir20225065.
Braun, C.L., Ramage, J.K., and Shah, S.D., 2019, Status of groundwater-level altitudes and long-term groundwater-level changes in the Chicot, Evangeline, and Jasper aquifers, Houston-Galveston region, Texas, 2019: U.S. Geological Survey Scientific Investigations Report 2019–5089, 18 p., accessed April 3, 2024, at https://doi.org/10.3133/sir20195089.
Brazoria County Groundwater Conservation District [BCGCD], 2022, Brazoria County Groundwater Conservation District management plan: Brazoria County Groundwater Conservation District, 122 p., accessed April 3, 2024, at https://www.bcgroundwater.org/images/bcg/documents/2022/Groundwater-Management-Plan-2022.pdf.
Brazoria County Groundwater Conservation District [BCGCD], 2024, About the district: Brazoria County Groundwater Conservation District web page, accessed April 3, 2024, at https://www.bcgroundwater.org/bcg/About_the_District.asp.
Carr, J.E., Meyer, W.R., Sandeen, W.M., and McLane, I.R., 1985, Digital models for simulation of ground-water hydrology of the Chicot and Evangeline aquifers along the Gulf Coast of Texas: Texas Department of Water Resources Report 289, 101 p., accessed April 3, 2024, at https://www.twdb.texas.gov/publications/reports/numbered_reports/doc/R289/Report289.pdf.
Casarez, I.R., 2020, Aquifer extents in the coastal lowlands aquifer system regional groundwater availability study area in Texas, Louisiana, Mississippi, Alabama, and Florida: U.S. Geological Survey data release, accessed April 3, 2024, at https://doi.org/10.5066/P9BH2KG2.
Chowdhury, A.H., and Turco, M.J., 2006, Geology of the Gulf Coast aquifer, Texas, chap. 2 of Mace, R.E., Davidson, S.C., Angle, E.S., and Mullican, W.F., eds., Aquifers of the Gulf Coast of Texas: Texas Water Development Board Report 365, p. 23–50, accessed April 3, 2024, at https://www.twdb.texas.gov/publications/reports/numbered_reports/doc/R365/ch02-Geology.pdf.
Coplin, L.S., 2001, Water-level altitudes in wells completed in the Jasper aquifer, greater Houston area, Texas, spring 2000: U.S. Geological Survey Open-File Report 01–147, 2 p., accessed April 3, 2024, at https://doi.org/10.3133/ofr01147.
Coplin, L.S., and Galloway, D., 1999, Houston-Galveston, Texas—Managing coastal subsidence, in Galloway, D., Jones, D.R., and Ingebritsen, S.E., eds., Land subsidence in the United States: U.S. Geological Survey Circular 1182, p. 35–48, accessed April 3, 2024, at https://doi.org/10.3133/cir1182.
Cunningham, W.L., and Schalk, C.W., comps., 2011, Groundwater technical procedures of the U.S. Geological Survey: U.S. Geological Survey Techniques and Methods, book 1, chap. A1, 151 p., accessed April 3, 2024, at https://doi.org/10.3133/tm1A1.
Ellis, J.H., Knight, J.E., White, J.T., Sneed, M., Hughes, J.D., Ramage, J.K., Braun, C.L., Teeple, A., Foster, L., Rendon, S.H., and Brandt, J., 2023, Hydrogeology, land-surface subsidence, and documentation of the GULF model, southeast Texas, 1897–2018: U.S. Geological Survey Professional Paper 1877, 407 p., accessed April 3, 2024, at https://doi.org/10.3133/pp1877.
Fort Bend Subsidence District [FBSD], 2013, Fort Bend Subsidence District 2013 district plan (amended 2022): Fort Bend Subsidence District, 13 p., accessed April 3, 2024, at https://fbsubsidence.org/wp-content/uploads/2022/07/FBSD-District-Plan-2.pdf.
Fort Bend Subsidence District [FBSD], 2024, Mission: Fort Bend Subsidence District web page, accessed April 3, 2024, at https://fbsubsidence.org/mission/.
Gabrysch, R.K., 1967, Development of ground water in the Houston district, Texas, 1961–65: Texas Water Development Board Report 63, 35 p., accessed April 3, 2024, at https://www.twdb.texas.gov/publications/reports/numbered_reports/doc/R63/Report63.asp.
Gabrysch, R.K., 1972, Development of ground water in the Houston district, Texas, 1966–69: Texas Water Development Board Report 152, 24 p., accessed April 3, 2024, at https://www.twdb.texas.gov/publications/reports/numbered_reports/doc/R152/R%20152.pdf.
Gabrysch, R.K., 1979, Approximate altitude of water levels in wells in the Chicot and Evangeline aquifers in the Houston area, Texas, spring 1977 and spring 1978: U.S. Geological Survey Open-File Report 79–334, 4 sheets, accessed April 3, 2024, at https://doi.org/10.3133/ofr79334.
Gabrysch, R.K., 1980, Development of ground water in the Houston district, Texas, 1970–74: Texas Water Development Board Report 241, 49 p., accessed April 3, 2024, at https://www.twdb.texas.gov/publications/reports/numbered_reports/doc/R241/report241.asp.
Gabrysch, R.K., 1984, Ground-water withdrawals and land surface subsidence in the Houston-Galveston region, Texas, 1906–80: Texas Department of Water Resources Report 287, 64 p., accessed April 3, 2024, at https://www.twdb.texas.gov/publications/reports/numbered_reports/doc/R287/R287.pdf.
Gabrysch, R.K., and Bonnet, C.W., 1975, Land-surface subsidence in the Houston-Galveston region, Texas: Texas Water Development Board Report 188, 19 p., accessed April 3, 2024, at https://www.twdb.texas.gov/publications/reports/numbered_reports/doc/R188.pdf.
Garrison, L.E., and Martin, R.G., 1973, Geologic structures in the Gulf of Mexico basin: U.S. Geological Survey Professional Paper 773, 85 p., 1 pl., accessed September 18, 2024, at https://doi.org/10.3133/pp773.
Harris-Galveston Subsidence District [HGSD], 2013, Regulatory plan 2013 (amended 2013 and 2021): Harris-Galveston Subsidence District, 14 p., accessed April 3, 2024, at https://hgsubsidence.org/wp-content/uploads/2021/05/2013-Regulatory-Plan-Amended-April-14-2021-FINAL-with-Bookmarks.pdf.
Harris-Galveston Subsidence District [HGSD], 2024, Legislative authority: Harris-Galveston Subsidence District web page, accessed April 3, 2024, at https://hgsubsidence.org/about/legislative-authority/.
Healy, R.W., 2010, Estimating groundwater recharge, with contributions by B.R. Scanlon: Cambridge, U.K., Cambridge University Press, 245 p., accessed April 3, 2024, at https://doi.org/10.1017/CBO9780511780745.
Holzer, T.L., and Bluntzer, R.L., 1984, Land subsidence near oil and gas fields, Houston, Texas: Ground Water, v. 22, no. 4, p. 450–459, accessed April 3, 2024, at https://doi.org/10.1111/j.1745-6584.1984.tb01416.x.
Johnson, M.R., Ramage, J.K., and Kasmarek, M.C., 2011, Water-level altitudes 2011 and water-level changes in the Chicot, Evangeline, and Jasper aquifers and compaction 1973–2010 in the Chicot and Evangeline aquifers, Houston–Galveston region, Texas: U.S. Geological Survey Scientific Investigations Map 3174, 16 sheets, scale 1:100,000, 17-p. pamphlet, 1 app., accessed April 3, 2024, at https://doi.org/10.3133/sim3174.
Kasmarek, M.C., 1997, Water-level altitudes in wells completed in the Chicot and Evangeline aquifers, Fort Bend County and adjacent areas, Texas, January–February 1990: U.S. Geological Survey Open-File Report 97–784, 2 sheets, scale 1:100,000, accessed April 3, 2024, at https://doi.org/10.3133/ofr97784.
Kasmarek, M.C., 2012, Hydrogeology and simulation of groundwater flow and land-surface subsidence in the northern part of the Gulf Coast aquifer system, Texas, 1891–2009 (ver. 1.1, December 2013): U.S. Geological Survey Scientific Investigations Report 2012–5154, 55 p., accessed April 3, 2024, at https://doi.org/10.3133/sir20125154.
Kasmarek, M.C., Gabrysch, R.K., and Johnson, M.R., 2009, Estimated land-surface subsidence in Harris County, Texas, 1915–17 to 2001 (ver. 1.1., February 8, 2010): U.S. Geological Survey Scientific Investigations Map 3097, 2 sheets, accessed April 3, 2024, at https://doi.org/10.3133/sim3097.
Kasmarek, M.C., and Houston, N.A., 2007, Water-level altitudes 2007 and water-level changes in the Chicot, Evangeline, and Jasper aquifers and compaction 1973–2006 in the Chicot and Evangeline aquifers, Houston-Galveston region, Texas: U.S. Geological Survey Scientific Investigations Map 2968, 159 p., 18 sheets, accessed May 11, 2023, at https://doi.org/10.3133/sim2968.
Kasmarek, M.C., and Houston, N.A., 2008, Water-level altitudes 2008 and water-level changes in the Chicot, Evangeline, and Jasper aquifers and compaction 1973–2007 in the Chicot and Evangeline aquifers, Houston-Galveston region, Texas: U.S. Geological Survey Scientific Investigations Map 3031, 4 p., 17 sheets, accessed April 3, 2024, at https://pubs.usgs.gov/sim/3031.
Kasmarek, M.C., Houston, N.A., and Brown, D.W., 2006, Water-level altitudes 2006 and water-level changes in the Chicot, Evangeline, and Jasper aquifers and compaction 1973–2005 in the Chicot and Evangeline aquifers, Houston-Galveston region, Texas: U.S. Geological Survey Open-File Report 2006–1079, 15 sheets, accessed April 3, 2024, at https://doi.org/10.3133/ofr20061079.
Kasmarek, M.C., Houston, N.A., and Ramage, J.K., 2009, Water-level altitudes 2009 and water-level changes in the Chicot, Evangeline, and Jasper aquifers and compaction 1973–2008 in the Chicot and Evangeline aquifers, Houston-Galveston region, Texas (ver. 1.3, March 15, 2011): U.S. Geological Survey Scientific Investigations Map 3081, 3 p., 16 sheets, 2 app., accessed April 3, 2024, at https://doi.org/10.3133/sim3081.
Kasmarek, M.C., Johnson, M.R., and Ramage, J.K., 2010, Water-level altitudes 2010 and water-level changes in the Chicot, Evangeline, and Jasper aquifers and compaction 1973–2009 in the Chicot and Evangeline aquifers, Houston-Galveston region, Texas: U.S. Geological Survey Scientific Investigations Map 3138, 17 p., 16 sheets, 1 app., accessed April 3, 2024, at https://doi.org/10.3133/sim3138.
Kasmarek, M.C., Johnson, M.R., and Ramage, J.K., 2012, Water-level altitudes 2012 and water-level changes in the Chicot, Evangeline, and Jasper aquifers and compaction 1973–2011 in the Chicot and Evangeline aquifers, Houston-Galveston region, Texas: U.S. Geological Survey Scientific Investigations Map 3230, 18 p., 16 sheets, accessed April 3, 2024, at https://doi.org/10.3133/sim3230.
Kasmarek, M.C., Johnson, M.R., and Ramage, J.K., 2013, Water-level altitudes 2013 and water-level changes in the Chicot, Evangeline, and Jasper aquifers and compaction 1973–2012 in the Chicot and Evangeline aquifers, Houston-Galveston region, Texas: U.S. Geological Survey Scientific Investigations Map 3263, 19 p., 16 sheets, accessed April 3, 2024, at https://doi.org/10.3133/sim3263.
Kasmarek, M.C., Johnson, M.R., and Ramage, J.K., 2014, Water-level altitudes 2014 and water-level changes in the Chicot, Evangeline, and Jasper aquifers and compaction 1973–2013 in the Chicot and Evangeline aquifers, Houston-Galveston region, Texas: U.S. Geological Survey Scientific Investigations Map 3308, 16 sheets, 31-p. pamphlet, accessed April 3, 2024, at https://doi.org/10.3133/sim3308.
Kasmarek, M.C., and Lanning-Rush, J., 2004, Water-level altitudes 2004 and water-level changes in the Chicot, Evangeline, and Jasper aquifers and compaction 1973–2003 in the Chicot and Evangeline aquifers, Houston-Galveston region, Texas: U.S. Geological Survey Open-File Report 2004–1084, 13 sheets, accessed April 3, 2024, at https://doi.org/10.3133/ofr20041084.
Kasmarek, M.C., and Ramage, J.K., 2017, Water-level altitudes 2017 and water-level changes in the Chicot, Evangeline, and Jasper aquifers and compaction 1973–2016 in the Chicot and Evangeline aquifers, Houston-Galveston region, Texas: U.S. Geological Survey Scientific Investigations Report 2017–5080, 32 p., accessed April 3, 2024, at https://doi.org/10.3133/sir20175080.
Kasmarek, M.C., Ramage, J.K., Houston, N.A., Johnson, M.R., and Schmidt, T.S., 2015, Water-level altitudes 2015 and water-level changes in the Chicot, Evangeline, and Jasper aquifers and compaction 1973–2014 in the Chicot and Evangeline aquifers, Houston-Galveston region, Texas: U.S. Geological Survey Scientific Investigations Map 3337, 16 sheets, scale 1:100,000, 35-p. pamphlet, accessed April 3, 2024, at https://doi.org/10.3133/sim3337.
Kasmarek, M.C., Ramage, J.K., and Johnson, M.R., 2016, Water-level altitudes 2016 and water-level changes in the Chicot, Evangeline, and Jasper aquifers and compaction 1973–2015 in the Chicot and Evangeline aquifers, Houston-Galveston region, Texas: U.S. Geological Survey Scientific Investigations Map 3365, 16 sheets, scale 1:100,000, 53-p. pamphlet, accessed April 3, 2024, at https://doi.org/10.3133/sim3365.
Kasmarek, M.C., and Robinson, J.L., 2004, Hydrogeology and simulation of ground-water flow and land-surface subsidence in the northern part of the Gulf Coast aquifer system, Texas: U.S. Geological Survey Scientific Investigations Report 2004–5102, 111 p., accessed April 3, 2024, at https://doi.org/10.3133/sir20045102.
Lambeck, K., Esat, T.M., and Potter, E.-K., 2002, Links between climate and sea levels for the past three million years: Nature, v. 419, no. 6903, p. 199–206, accessed April 3, 2024, at https://doi.org/10.1038/nature01089.
Liu, Y., Li, J., and Fang, Z.N., 2019, Groundwater level change management on control of land subsidence supported by borehole extensometer compaction measurements in the Houston-Galveston region, Texas: Geosciences, v. 9, no. 5, 19 p., accessed April 3, 2024, at https://doi.org/10.3390/geosciences9050223.
Lone Star Groundwater Conservation District [LSGCD], 2023, Groundwater management plan—Adopted May 9, 2023: Lone Star Groundwater Conservation District, 94 p., accessed April 3, 2024, at https://static1.squarespace.com/static/58347802cd0f6854e2f90e45/t/645d1d45378c8c3c692654bd/1683823944620/LSGCD+MP_Clean_Approved_05.09.23_Final_Compre ssed.pdf.
Lone Star Groundwater Conservation District [LSGCD], 2024, Our history: Lone Star Groundwater Conservation District web page, accessed April 3, 2024, at https://www.lonestargcd.org/history.
Lower Trinity Groundwater Conservation District [LTGCD], 2019, Groundwater management plan: Lower Trinity Groundwater Conservation District, 106 p., accessed April 3, 2024, at https://4596a5d4-d630-4058-8899-b9dd610c192c.filesusr.com/ugd/125bf6_b1700eade64040d7a3791979b153f1d3.pdf.
Lower Trinity Groundwater Conservation District [LTGCD], 2024, What is the Lower Trinity Groundwater Conservation District?: Lower Trinity Groundwater Conservation District web page, accessed April 3, 2024, at https://www.waterwells.info/.
Matheron, G., 1963, Principles of geostatistics: Economic Geology and the Bulletin of the Society of Economic Geologists, v. 58, no. 8, p. 1246–1266, accessed April 3, 2024, at https://pubs.geoscienceworld.org/segweb/economicgeology/article/58/8/1246/17275/Principles-of-geostatistics.
Meyer, W.R., and Carr, J.E., 1979, A digital model for simulation of ground-water hydrology in the Houston area, Texas: Texas Department of Water Resources LP–103, 27 p., accessed April 3, 2024, at http://www.twdb.texas.gov/publications/reports/limited_printing/doc/LP-103/LP-103%20a.pdf.
Municipal District Services, 2023, About Municipal District Services: Municipal District Services web page, accessed April 3, 2024, at https://www.mdswater.com/.
National Ocean Service, 2021, What is geodesy?—Global positioning tutorial: National Oceanic and Atmospheric Administration, National Ocean Service web page, accessed April 3, 2024, at https://oceanservice.noaa.gov/education/tutorial_geodesy/geo01_intro.html.
Olea, R.A., 1975, Optimum mapping techniques using regionalized variable theory: Lawrence, Kansas, Kansas Geological Survey, Number 2 Series on Spatial Analysis, 137 p., accessed April 3, 2024, at https://www.kgs.ku.edu/Publications/Bulletins/SpA2/SpatialAnalysis2.pdf.
Olea, R.A., 2009, A practical primer on geostatistics (ver. 1.4, December 2018): U.S. Geological Survey Open-File Report 2009–1103, 346 p., accessed April 3, 2024, at https://doi.org/10.3133/ofr20091103.
Paramasivam, C.R., and Venkatramanan, S., 2019, An introduction to various spatial analysis techniques: GIS and Geostatistical Techniques for Groundwater Science, p. 23–30, accessed April 3, 2024, at https://doi.org/10.1016/B978-0-12-815413-7.00003-1.
Ramage, J.K., 2024, Status of water-level altitudes and long-term and short-term water-level changes in the Chicot and Evangeline (undifferentiated) and Jasper aquifers, greater Houston area, Texas, 2023: U.S. Geological Survey Scientific Investigations Report 2024–5003, 26 p., accessed April 3, 2024, at https://doi.org/10.3133/sir20245003.
Ramage, J.K., and Adams, A.C., 2023, Groundwater-level altitudes and long-term groundwater-level changes in the Chicot and Evangeline (undifferentiated) and Jasper aquifers, greater Houston area, Texas, 2022: U.S. Geological Survey data release, accessed April 3, 2024, at https://doi.org/10.5066/P9F32XDT.
Ramage, J.K., and Braun, C.L., 2023, Status of water-level altitudes and long-term and short-term water-level changes in the Chicot and Evangeline (undifferentiated) and Jasper aquifers, greater Houston area, Texas, 2022: U.S. Geological Survey Scientific Investigations Report 2023–5007, 26 p., accessed April 3, 2024, at https://doi.org/10.3133/sir20235007.
Ramage, J.K., Braun, C.L., and Ellis, J.H., 2022, Treatment of the Chicot and Evangeline aquifers as a single hydrogeologic unit and use of geostatistical interpolation methods to develop gridded surfaces of water-level altitudes and water-level changes in the Chicot and Evangeline aquifers (undifferentiated) and Jasper aquifer, greater Houston area, Texas, 2021: U.S. Geological Survey Scientific Investigations Report 2022–5064, 51 p., accessed April 3, 2024, at https://doi.org/10.3133/sir20225064.
Shah, S.D., Ramage, J.K., and Braun, C.L., 2018, Status of groundwater-level altitudes and long-term groundwater-level changes in the Chicot, Evangeline, and Jasper aquifers, Houston-Galveston region, Texas, 2018: U.S. Geological Survey Scientific Investigations Report 2018–5101, 18 p., accessed April 3, 2024, at https://doi.org/10.3133/sir20185101.
Teeple, A.P., Foster, L.K., Lindaman, M.A., Duncan, L.L., and Casarez, I., 2021, Hydrogeologic data for the development of the hydrogeologic framework of the coastal lowlands aquifer system regional groundwater availability study area in Texas, Louisiana, Mississippi, Alabama, and Florida: U.S. Geological Survey data release, accessed April 3, 2024, at https://doi.org/10.5066/P9PEFY11.
Todini, E., 2001, Influence of parameter estimation uncertainty in kriging—Part 1 - Theoretical development: Hydrology and Earth System Sciences, v. 5, no. 2, p. 215–223, accessed April 3, 2024, at https://doi.org/10.5194/hess-5-215-2001.
Torcellini, P.N., Long, N., and Judkoff, R., 2003, Consumptive water use for U.S. power production: National Renewable Energy Laboratory report no. NREL/TP–550–33905, 18 p., accessed April 3, 2024, at https://www.nrel.gov/docs/fy04osti/33905.pdf.
Turcan, A.N., Jr., Wesselman, J.B., and Kilburn, C., 1966, Interstate correlation of aquifers, southwestern Louisiana and southeastern Texas, in Geological Survey Research 1966: U.S. Geological Survey Professional Paper 550–D, p. D231–D236, accessed April 3, 2024, at https://doi.org/10.3133/pp550D.
U.S. Geological Survey [USGS], 2024a, About 3DEP products & services: U.S. Geological Survey 3D Elevation Program web page, accessed April 3, 2024, at https://www.usgs.gov/3d-elevation-program/about-3dep-products-services.
U.S. Geological Survey [USGS], 2024b, USGS water data for the Nation: U.S. Geological Survey National Water Information System database, accessed April 3, 2024, at https://doi.org/10.5066/F7P55KJN.
Varouchakis, E.A., Hristopulos, D.T., and Karatzas, G.P., 2012, Improving kriging of groundwater level data using nonlinear normalizing transformations—A field application: Hydrological Sciences Journal, v. 57, no. 7, p. 1404–1419, accessed April 3, 2024, at https://doi.org/10.1080/02626667.2012.717174.
White, W.N., Livingston, P.P., and Turner, S.F., 1939, Ground-water resources of the Houston-Galveston area, Texas: Texas Board of Water Engineers Report 130, 16 p., accessed April 3, 2024, at https://www.twdb.texas.gov/publications/reports/historic_groundwater_reports/doc/M130.pdf.
White, W.N., Rose, N.A., and Guyton, W.F., 1944, Ground-water resources of the Houston district, Texas: U.S. Geological Survey Water-Supply Paper 889–C, 154 p., accessed April 3, 2024, at https://doi.org/10.3133/wsp889C.
Williamson, A.K., Grubb, H.F., and Weiss, J.S., 1990, Groundwater flow in the Gulf Coast aquifer systems, south central United States—A preliminary analysis: U.S. Geological Survey Water-Resources Investigations Report 89–4071, 124 p., accessed April 3, 2024, at https://doi.org/10.3133/wri894071.
Young, S.C., and Draper, C., 2020, The delineation of the Burkeville confining unit and the base of the Chicot aquifer to support the development of the GULF 2023 groundwater model: Harris-Galveston Subsidence District and Fort Bend Subsidence District report, prepared by INTERA, Inc., 75 p., accessed April 3, 2024, at https://hgsubsidence.org/wp-content/uploads/2021/06/Final_HGSD_FBSD_Burkeville_Report_final.pdf.
Young, S.C., Ewing, T., Hamlin, S., Baker, E., and Lupton, D., 2012, Final report—Updating the hydrogeologic framework for the northern portion of the Gulf Coast aquifer system: Texas Water Development Board report, prepared by INTERA, Inc., and Frontera Exploration Consultants, 285 p., accessed April 3, 2024, at https://www.twdb.texas.gov/publications/reports/contracted_reports/doc/1004831113_GulfCoast.pdf.
Young, S.C., Kelley, V.A., Deeds, N., Hudson, C., Piemonti, D., Ewing, T.E., Banerji, D., Seifert, J., and Lyman, P., 2017, Report on the delineation of fresh, brackish and saline groundwater resources based on interpretation of geophysical logs: Harris-Galveston Subsidence District Scientific Research Report 2018–001, prepared by INTERA, Inc., LBG-Guyton Associates, and the University of Texas Bureau of Economic Geology, 216 p., accessed April 3, 2024, at https://hgsubsidence.org/wp-content/uploads/2021/11/HGSD-Scientific-Report-2018-001_Report-on-the-Delineation-of-Fresh-Brackish-and-Saline-Groundwater -Resources-Based-on-Interpretation-of-Geophysical-Logs.pdf.
Young, S.C., Pinkard, J., Basset, R.L., and Chowdhury, A.H., 2014, Final report—Hydrogeochemical evaluation of the Texas Gulf Coast aquifer system and implications for developing groundwater availability models: Texas Water Development Board report no. 1148301233, prepared by INTERA, Inc., and Tetra Tech, 375 p., accessed April 3, 2024, at https://www.twdb.texas.gov/publications/reports/contracted_reports/doc/1148301233.pdf.
Datum
Vertical coordinate information is referenced to the North American Vertical Datum of 1988 (NAVD 88).
Horizontal coordinate information is referenced to the North American Datum of 1983 (NAD 83).
Abbreviations
>
greater than
<
less than
BCGCD
Brazoria County Groundwater Conservation District
BGCD
Bluebonnet Groundwater Conservation District
DEM
digital elevation model
FBSD
Fort Bend Subsidence District
HGSD
Harris-Galveston Subsidence District
LSGCD
Lone Star Groundwater Conservation District
LTGCD
Lower Trinity Groundwater Conservation District
NAVD 88
North American Vertical Datum of 1988
NWIS
National Water Information System
USGS
U.S. Geological Survey
For more information about this publication, contact
Director, Oklahoma-Texas Water Science Center
U.S. Geological Survey
1505 Ferguson Lane
Austin, TX 78754–4501
For additional information, visit
https://www.usgs.gov/centers/ot-water
Publishing support provided by
Lafayette Publishing Service Center
Disclaimers
Any use of trade, firm, or product names is for descriptive purposes only and does not imply endorsement by the U.S. Government.
Although this information product, for the most part, is in the public domain, it also may contain copyrighted materials as noted in the text. Permission to reproduce copyrighted items must be secured from the copyright owner.
Suggested Citation
Ramage, J.K., and Adams, A.C., 2025, Status of water-level altitudes and long-term and short-term water-level changes in the Chicot and Evangeline (undifferentiated) and Jasper aquifers, greater Houston area, Texas, 2024: U.S. Geological Survey Scientific Investigations Report 2025–5028, 27 p., https://doi.org/10.3133/sir20255028.
ISSN: 2328-0328 (online)
Study Area
| Publication type | Report |
|---|---|
| Publication Subtype | USGS Numbered Series |
| Title | Status of water-level altitudes and long-term and short-term water-level changes in the Chicot and Evangeline (undifferentiated) and Jasper aquifers, greater Houston area, Texas, 2024 |
| Series title | Scientific Investigations Report |
| Series number | 2025-5028 |
| DOI | 10.3133/sir20255028 |
| Publication Date | May 09, 2025 |
| Year Published | 2025 |
| Language | English |
| Publisher | U.S. Geological Survey |
| Publisher location | Reston, VA |
| Contributing office(s) | Oklahoma-Texas Water Science Center |
| Description | Report: v; 27 p.; 2 Data Releases; Database |
| Country | United States |
| State | Texas |
| City | Houston |
| Other Geospatial | Chicot, Evangeline, and Jasper aquifers |
| Online Only (Y/N) | Y |
| Additional Online Files (Y/N) | N |