

Spatial Stream Network Modeling of Water Temperature within the White River Basin, Mount Rainier National Park, Washington
Links
- Document: Report (4.7 MB pdf) , HTML , XML
- Data Release: USGS data release - Stream Temperature Models of White River Watershed, Mount Rainier National Park, Washington
- Version History: Version History (1 KB txt)
- NGMDB Index Page: National Geologic Map Database Index Page (html)
- Superseded Publications:
- Download citation as: RIS | Dublin Core
Acknowledgments
This study was funded by Mount Rainier National Park and the National Park Service in coordination with the U.S. Geological Survey.
Abstract
Water temperature is a primary control on the occurrence and distribution of fish and other ectothermic aquatic species. In the Pacific Northwest, cold-water species such as Pacific salmon (Oncorhynchus spp.) and bull trout (Salvelinus confluentus) have specific temperature requirements during different life stages that must be met to ensure the viability of their populations. Rivers draining Mount Rainier in western Washington, including the White River along its northern flank, support a number of cold-water fish populations, but the spatial distribution of water temperatures, particularly during late-summer baseflow during August and September, and the climatic, hydrologic, and physical processes regulating it are not well constrained. Spatial stream network (SSN) models, which are generalized linear models that incorporate streamwise spatial autocovariance structures, were fit to mean and 7-day average daily maximum water temperature for August and September for the White River Basin. The SSN models were calibrated using water temperature measurements collected in 2010 through 2020. The extent of the models included the White River and its tributaries upstream from its confluence with Silver Creek in Mount Rainier National Park, Washington. SSN models incorporated covariates hypothesized to represent the climatic, hydrologic, and physical processes that influence water temperature. SSN models were fit to the measured data and compared to generalized linear models that lacked spatial autocovariance structures. Statistically significant covariates within the best-fit models included the proportion of ice cover and forest cover within the basin, mean August air temperature, the proportion of consolidated geologic units, and snow-water equivalent. Statistical models that included spatial autocovariance structures had better predictive performance than those that did not. Additionally, models of mean August and September water temperature had better predictive performance than those of 7-day average daily maximum temperature in August and September. Predictions of the spatial distribution of water temperature were similar between August and September with a general warming in the downstream part of the mainstem White River compared to cooler water temperatures in the high-elevation headwater streams. The proportion of ice cover emerged as an inversely related significant covariate to both mean August and September water temperature because streams that receive glacial meltwater are colder than non-glaciated streams. Water temperatures of the upper White River increased downstream and are attributed to warming of water temperature from accumulated solar radiation and inflow of non-glaciated tributaries. Estimated water temperatures for the upper White River model are 3–4 degrees Celsius (°C) warmer for tributaries, but 1–2 °C cooler for the mainstem compared to the regional-scale model. Differences between the upper White River SSN model and the regional-scale NorWeST model are attributed to the fact that the upper White River SSN included water temperature observations specific to the upper White River, whereas water temperature observations from lower elevation streams and downstream from the Mount Rainer National Park boundary were used in the regional scale model.
Introduction
Changes in the water-temperature and discharge regimes of rivers throughout the western United States have contributed to shifts in the ranges of aquatic species that they support (Isaak and others, 2010; Eby and others, 2014). Increasing air temperatures, decreasing winter snowpack and glacial extent, and disturbances from flooding, debris flows, and wildfires have contributed to past and projected changes in the water-temperature regime of rivers. Ectothermic species such as fish are sensitive to changes in water temperature, which regulates their physiological functions and behavior. Optimal temperatures for some fish such as bull trout (Salvelinus confluentus) are substantially lower than other salmonids (Selong and others, 2001), with peak growth at rates at average temperatures of 13.2 degrees Celsius (°C) and declines in feeding at 16 °C, resulting in greater reductions in range than less thermally sensitive salmonids such as rainbow trout (Oncorhynchus mykiss; Isaak and others, 2020), which have peak growth rates at temperature ranges that include 17.8 and 24.6 °C (Verhille and others, 2016). As a result, bull trout are particularly sensitive to changes in water temperature, especially at the margins of their range where their habitat is easily fragmented by thermal barriers and thermally suitable habitat becomes disconnected. Additionally, non-native fish such as introduced brook trout (Salvelinus fontinalis) may displace bull trout from warmer temperature water due to increased growth rates relative to bull trout (McMahon and others, 2007). As a result, bull trout may become restricted to headwater streams where cold-water temperatures exist.
The native range of bull trout extends throughout western North America (Haas and McPhail, 2001), including western Washington rivers that drain to the Puget Sound. The White River flows from its headwaters on the northeastern flank of Mount Rainier, a glaciated stratovolcano, to its confluence with the Puyallup River before flowing into Puget Sound (fig. 1). Upstream from the confluence with Silver Creek, the upper White River Basin drains a 159 square kilometer area, and is largely within the Mount Rainier National Park boundary or otherwise part of a national forest. In addition to Endangered Species Act (ESA)-listed bull trout, the upper White River and its tributaries provide spawning, rearing, and migration habitat for non-native, introduced species including brook trout.
The upper White River and tributaries including Fryingpan Creek drain several glaciers (fig. 2), which provide an important component of summer baseflow to the White River when direct runoff from precipitation is minimal. Discharge from glacial meltwater buffers downstream water temperature during the summer when water temperatures are near their annual maximum. Further, streamflow inputs from groundwater discharge, outflow from cirque lakes, and the melt of seasonal snowpack contribute to baseflow and influence the thermal regime of the White River and its tributaries. Limited development has occurred within the upper White River Basin; landcover at lower elevations is predominately old-growth evergreen forest and at higher elevations is predominantly bare rock and glacial ice. The maritime climate of the study area is characterized by cool, wet winters when most of the annual precipitation falls as snow and warm, dry summers. A strong precipitation gradient occurs from the highest elevations of the study area on the flanks of Mount Rainier to its lowest elevation point at the confluence of the White River and Silver Creek.
Large, infrequent pulses of coarse-grained sediment from the proglacial headwaters of the White River and its glaciated tributaries are deposited onto the valley floor of White River (Anderson and Jaeger, 2020). The supply of these coarse-grained sediments exceeds the capacity of the White River to transport these sediments, resulting in a braided morphology of the White River. Migration and avulsions of channels along the White River occur during floods, which typically occur during late fall and early winter. As a result, flow in the White River during baseflow conditions is distributed across multiple channels that shift location at yearly timescales. The active channel morphology along the upper White River also limits encroachment of riparian vegetation resulting in a wide active channel migration zone that, in places, exceeds 150 meters (m) in width and is several times the wetted channel width of the White River during summer baseflow conditions. Further, well-sorted, coarse-grained sediment deposited within the White River valley serves as an alluvial aquifer that overlies volcanic bedrock. Smaller tributaries with lower elevation, non-glaciated headwaters, including Shaw, Klickitat, Deadwood, Crystal, and Sunrise Creeks are typically single-threaded I channels with narrow valley widths, low rates of channel migration and dense riparian vegetation cover. These smaller tributaries contribute additional discharge to summer baseflow that originates from groundwater discharge, snowmelt, and, in some tributaries, outflow from alpine lakes that occupy former glacier cirques.
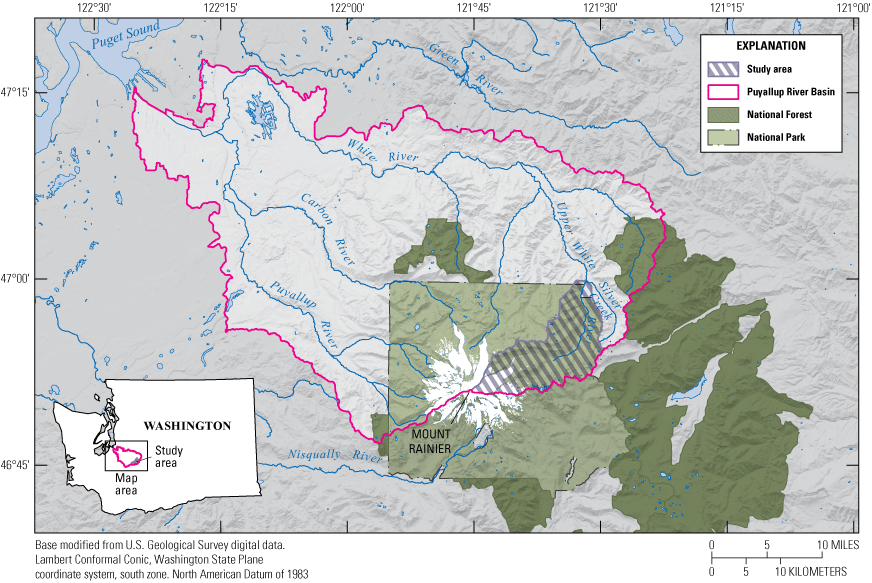
Location of the upper White River Basin (study area) within the Puyallup River Basin and Mount Rainier National Park, Washington.
Spatial variability of water temperature within a river network, termed “thermalscape,” is important for natural resource managers to assess the distribution and continuity of habitat for thermally sensitive aquatic species and development of conservation strategies. Statistical models that account for the spatial configuration of the stream network and which provide spatially continuous estimates of water temperature along a river can be used to characterize the spatial variability of stream water temperature. These spatial stream network (SSN) models incorporate covariates related to hydrological, meteorological, and other physical processes that influence water temperature and have been developed at regional scales, such as the NorWeST model that extends across the western United States (for example, NorWeST; Isaak and others, 2017) to individual watersheds (103-scale square kilometers) such as the Snoqualmie River Basin in western Washington State (Steel and others, 2016) and the Willow-Whitehorse and Willow-Rock-Frazer Basins in southeastern Oregon and northern Nevada (Gendaszek and others, 2020). Individual watershed models are able to include more local-scale factors that influence water temperature that are not possible to include in larger regional-scale models such as the NorWeST model. Mountainous headwater streams with glaciated watersheds such as the upper White River have unique factors contributing to water-temperature regimes compared to their lowland counterparts including glacial meltwater, snowmelt, outflow from alpine lakes, and geologic processes and deposits such as glacial sediment, landslides, and debris flows that contribute to unique groundwater and surface flow conditions within these streams. Therefore, an individual watershed scale modeling approach, which incorporates local covariates and observations specific to the study area, is a promising approach to accurately estimate water temperature in the upper White River Basin.
Purpose and Scope
In order to develop a spatially continuous representation of thermal conditions within the upper White River upstream from its confluence with Silver Creek, an SSN model was developed using hydrography of the White River Basin stream network, measured water temperature, and covariates derived from physical, hydrologic, and climatological processes hypothesized to influence water temperature. The objective of this model was to improve upon regional SSN models (for example, NorWeST; Isaak and others, 2017) by including spatially intensive water-temperature data collected by the National Park Service and additional covariates specific to the processes influencing water temperature within glaciated headwater streams. The resulting thermalscape can help natural resource managers to determine the extent and connectivity of thermally suitable habitat for bull trout and other cold-water species within the White River Basin and incorporate information about thermally suitable habitat within habitat conservation plans.
Methods
Water Temperature Data
To support habitat conservation planning for aquatic species within the White River, including bull trout, the National Park Service has maintained a water-temperature monitoring network within the headwaters of the White River Basin since 2010. The network collects data at 1-hour intervals at 25 sites. Water quality monitoring follows protocols detailed in Rawhouser and others (2012) and data are stored in the publicly accessible National Park Service IRMA database (National Park Service, 2024). Data measured from 2010 through 2020 were downloaded and summarized based on the site and year that data were collected and are hereafter referred to as “site-years.” Summary statistics of water temperature relevant to bull trout were calculated that included mean August (AugTw), mean September (SepTw), and 7-day average daily maximum (7-DADmax) for August (7-DADmaxAug) and September (7-DADmaxSep) for each year of the record in order to capture the time of year of maximum water temperatures for this region. Statistics were calculated for 79 site-years that included water-temperature data for at least 90 percent of data within the months of August and September (fig. 2; table 1). For August and September, 73 site-years met these criteria; for September only, 6 site-years met these criteria.
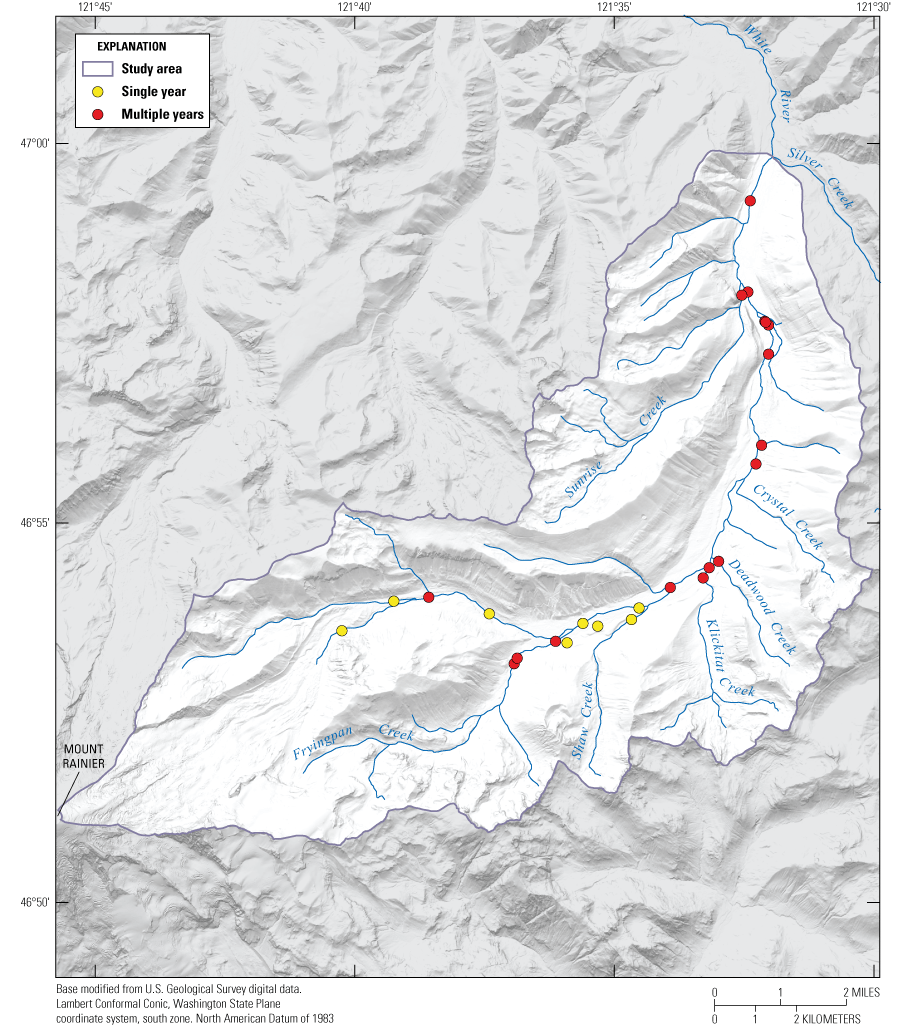
Locations of water-temperature measurement locations along National Stream Intranet (NSI) flowlines included with spatial stream network (SSN) model of water temperature within the upper White River Basin, Mount Rainier National Park, Washington.
Table 1.
Summary of water-temperature data for streams within the upper White River Basin, Mount Rainier National Park, Washington.[Abbreviations: --, no data given; Aug/Sep, August/September]
Statistical Models of Stream Temperature
SSN models that use a Gaussian distribution have been applied to provide continuous, spatially distributed predictions throughout a stream network including the distribution of species, water-chemistry data, and water temperature. Many SSN modeling efforts have focused on predicting the spatial distribution of water temperature because of water temperature’s fundamental role in determining the occurrence, distribution, and abundance of ectothermic species. SSN models have been developed at broad geographical extents that include the western United States and which include future conditions under projected climate scenarios (NorWeST; Isaak and others, 2017). SSN models have also been developed for individual watersheds in the Pacific Northwest and Great Basin of the United States, to inform the availability and connectivity of habitat for cold-water Pacific salmonids including Chinook salmon (Oncorhynchus tshawytscha) and Lahontan cutthroat trout (Oncorhynchus clarki henshawi; Steel and others, 2016; Gendaszek and others, 2020). The value of individual watershed scale models is that they generally include new calibration data not included in the larger regional model and also can make use of covariates specific to the individual watershed that may be effective predictors of water temperature that capture local processes but are not available for use at larger geographic extents and therefore not able to be used in the regional model.
Spatial Stream Network Model Development
SSN models of the upper White River Basin were developed from National Stream Intranet (NSI) hydrography processed from the medium-resolution National Hydrologic Dataset version 2 (NHDPlus v2; U.S. Environmental Protection Agency and U.S. Geological Survey, 2012) for topological consistency. Hydrographic features including braided channels, complex confluences with more than two tributaries, and divergent channels were removed within the NSI hydrography. The locations of water-temperature measurement sites were moved to coincide with the NSI hydrography and water-temperature prediction sites were created every 100 m along the NSI hydrography. Spatial and topological attributes were assigned to temperature measurement and prediction sites based on their topological relation to each other using Spatial Tools for the Analysis of River Systems (STARS; Peterson and Ver Hoef, 2014).
Forty covariates representing physiographic conditions and climatic characteristics developed by Jaeger and others (2023a) to model streamflow permanence within Mount Rainier National Park, including the headwaters of the White River Basin study area, were considered for inclusion within the SSN models of water temperature within the headwaters of the White River Basin. Physiographic characteristics described geology, terrain, soils, and landcover of Mount Rainier National Park; climatic characteristics described precipitation, air temperature, evapotranspiration, and snowpack of Mount Rainier National Park. Jaeger and others (2023a) presented these covariates within flow-conditioned parameter grids (FCPGs; Jaeger and others, 2023b) that allowed continuous representation of covariates across the Mount Rainier National Park study area by providing basin average values that incrementally change as drainage area accumulates in the downstream direction. Parameter grids are 30-m resolution and correspond to the NHDPlus v2 hydrography.
Although water temperature and streamflow permanence are distinct properties of a hydrographic network, the hydrological and climatological processes that influence these properties are often inter-related. In alpine headwater streams, for example, the presence and extent of a seasonal snowpack or glacial ice not only contributes to snowmelt and glacial meltwater runoff that supports streamflow but also cools water temperature. Groundwater discharge supports streamflow and imparts a distinct temperature signal on surface water identified as cooling surface water during the summer and warming it during the winter. Of the 40 covariates incorporated within the streamflow permanence model (Jaeger and others, 2023a), the 5 most important covariates in predicting streamflow permanence (upstream drainage area, total curvature, proportion of consolidated geologic material, topographic-wetness index, and proportion forested land cover) were incorporated into the water-temperature SSN model (table 1; fig. 3). In addition to these five most important covariates for the streamflow permanence model, three additional covariates were incorporated into the water-temperature SSN model to account for the influences of air temperature, glacial ice melt, and seasonal snowmelt on water temperature: cumulative proportion ice cover, March to September snow water equivalent (SWE), and mean daily maximum air temperature (March to September; Leach and others, 2024). Cumulative proportion ice cover is included in Jaeger and others (2023a). March to September SWE for years 2010 through 2020 are not included in Jaeger and others (2023a) and were not processed as FCPGs. Instead, SWE values from the unprocessed grids were used. Covariate dataset sources are provided in table 2.
Table 2.
Descriptions of covariates included in spatial stream network models of August and September mean water temperature (AugTw, SepTw, respectively).[Parenthetical signs within cells describing hypothesized influences indicate positive or negative relationships with water temperature or flow presence. Details on sources are provided in the text. Abbreviations: m, meters; +, positive; −, negative]
| Class | Covariate | Abbreviation | Resolution (m) | Scale | Hypothesis | Source |
|---|---|---|---|---|---|---|
| Terrain | Upstream drainage area | Upstream_DA | 30 | Area weighted | (+) Larger upstream drainage area corresponds to (1) wider streams which are proportionally less shaded and (2) lower elevation which have warmer air temperatures. | (U.S. Environmental Protection Agency and U.S. Geological Survey, 2012) |
| Terrain | Total curvature | Curve | 30 | Area weighted | (−) Higher curvature may correspond to increased convergence of streamflow and input of groundwater. | (U.S. Environmental Protection Agency and U.S. Geological Survey, 2012) |
| Terrain | Topographic-wetness index | TWI | 30 | Area weighted | (−) The TWI integrates input of water from upslope to drainage of water downslope. A higher TWI corresponds to increased likelihood of water presence and thus cooler temperatures. | (U.S. Environmental Protection Agency and U.S. Geological Survey, 2012) |
| Geology | Proportion of basin consolidated geologic material | Geo_Consolidated | 12 | Area weighted | (−) Higher proportion of consolidated surficial geology may correspond to closer proximity to groundwater and thus cooler temperatures. | (Washington Division of Geology and Earth Resources, 2016; Washington Geological Survey. 2019) |
| Landcover | Proportion of basin forested land cover | LC_Forest | 30 | Area weighted | (−) A higher proportion of forested land cover corresponds to increased riparian shading of stream resulting in cooler water temperatures. | (Homer and others, 2015) |
| Landcover | Proportion of basin ice landcover | LC_Ice | 30 | Area weighted | (−) A higher proportion of ice landcover corresponds to increased glacial ice runoff resulting in cooler stream temperatures. | (Homer and others, 2015) |
| Climate | Snow water equivalent (March–September) | SWE | 1,000 | Local | (−) A higher proportion SWE corresponds to increased potential for snowmelt runoff resulting in cooler stream temperatures. | Snow data assimilation system (SNODAS) version 1; Barrett (2003) |
| Climate | Average daily maximum temperature (August and September) | Aug_Ta, Sep_Ta | 4,000 | Area weighted | (−/+) Higher air temperatures may warm stream through conduction associated solar radiative inputs during clear days with higher insolation but also contribute higher rates of runoff from basins with glacial ice melt and snow melt that contribute to cooler stream temperatures. | (PRISM Climate Group, 2014) |
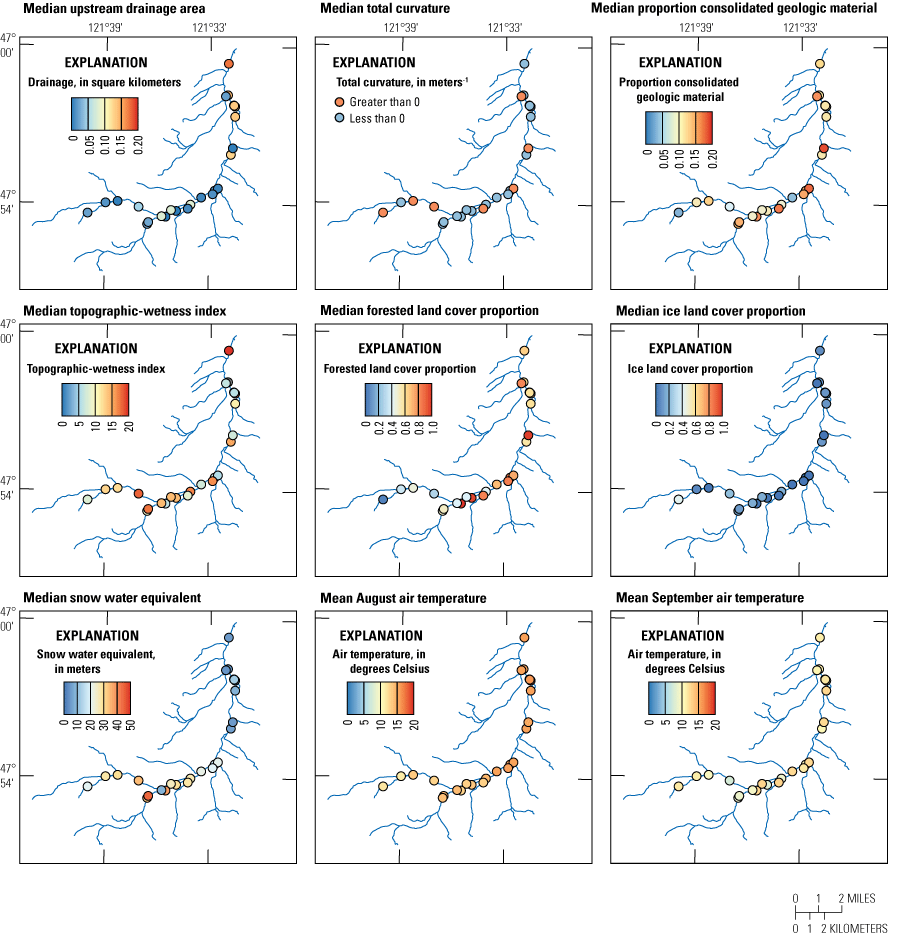
Spatial distribution of covariates included within the spatial stream network model of the upper White River Basin: median upstream drainage area, median total curvature, median proportion consolidated geologic material, median topographic-wetness index, median forested land cover proportion, median snow/ice landcover proportion, median snow water equivalent, mean August air temperature, and mean September air temperature. Air temperature covariates are presented as averages of years of water-temperature measurements for each location.
Four sets of models were developed to predict response variables of two metrics of water-temperature magnitude, mean monthly temperature and maximum monthly 7-DADmax, for both the months of August and September, for a total of four response variables. The 7-DADmax is a standard water quality metric that is typically used to describe relatively short-term conditions compared to monthly averages at a timescale that is relevant to aquatic organisms and is a standard metric in Washington State water quality criteria. Each set of models included (1) a spatial model with autocorrelation structures that included a mixture of exponential tail-up, exponential tail-down, and Euclidean structures and (2) a non-spatial model that excluded these spatial autocorrelation functions (Ver Hoef and Peterson, 2010). The non-spatial model is included here for comparison against the spatial model in order to evaluate if adding the spatial component to the model improves model fits and results in more accurate estimates of water temperature. The models were fit to the four response variables, AugTw, SepTw, 7-DADmaxAug, and 7-DADmaxSep. Random effects for year were included within each of the spatial and non-spatial models for the four response variables to account for variability across multiple years. Model performance was assessed by calculating mean absolute prediction error (MAPE) between observed temperatures and leave-one-out cross-validation (LOOCV) predictions, root mean square prediction error (RMSPE) from LOOCV prediction, and predictive r2 calculated as the square of the correlation coefficient between observed temperatures and LOOCV predictions. For each of the four models, non-significant covariates were sequentially removed by applying the equivalent of a backward stepwise regression (Detenbeck and others, 2016). Details of the SSN model including covariate values and modeling steps are presented in Leach and others (2024). Results of the final model were compared to modeled water temperature values from NorWeST.
Results
Spatial stream network models that included spatial autocorrelation structures predicted all four modeled response variables, AugTw, SepTw, 7-DADmaxAug, and 7-DADmaxSep, better than non-spatial models that excluded spatial autocorrelation structures (table 3). The highest performing model, the spatial model of AugTw, for example had a predictive r2 of 0.76 whereas its non-spatial counterpart had a predictive r2 of 0.23; correspondingly, MAPE and RMPSE increased from the spatial to the non-spatial models indicating decreased model performance. Both spatial and non-spatial model performance metrics were higher for models of mean monthly water temperature compared to monthly 7-DADmax and were higher for models of metrics of August water temperature compared to metrics of September water temperature.
Table 3.
Model fit of spatial stream network models of water temperature within the headwaters of the White River Basin, Mount Rainier National Park, Washington.[Abbreviations: AugTw, mean August water temperature; 7-DADmaxAug, seven day average daily maximum temperature for August; SepTW, mean September water temperature; 7-DADmaxSep, seven day average daily maximum temperature for September; RMSPE, root means square prediction error; MAPE, mean absolute prediction error; r2, square of the correlation coefficient]
Covariates that were statistically significant varied among the four individual response variable models for both the spatial and non-spatial models. Within the spatial models, the proportion of basin ice landcover (LC_Ice) was highly significant for the mean August temperature model (AugTw, significance at 0.001) whereas proportion of basin forested land cover was significant (significance at 0.05) for the mean September temperature model (SepTw) in addition to LC_Ice (significance at 0.1). Mean August air temperature (Aug_Ta), proportion of basin consolidated geologic material (Geo_Consolidated), and snow water equivalent (SWE) were significant covariates for the 7DADmaxAug model; no significant covariates were identified in the 7-DADmaxSep model. Topographic variables of upstream drainage area (Upstream_DA), total curvature (Curve) and topographic-wetness index (TWI) were not significant variables in any of the spatial models. For the non-spatial models, Upstream_DA and the proportion of basin consolidated geologic material (Geo_Consolidated) were consistent significant covariates in three out of four and all four response variable models, respectively (table 3).
The spatial distribution of predicted AugTw, SepTw, 7-DADmaxAug, and 7-DADmaxSep for the final model varied within the upper White River Basin primarily with respect to longitudinal position within the drainage network and connection to or disconnection from glacial meltwater, as represented by proportion of basin ice landcover (figs. 3, 4, and 5). In general, water temperatures as characterized by all four response variables increased downstream from high-elevation headwater streams to the downstream extent of the model domain at the confluence of White River and Silver Creek (figs. 4 and 5). The coolest tributaries to the mainstem White River received direct contributions of glacial meltwater whereas tributary streams that did not receive glacial meltwater were warmest as measured by each of the four response variables.
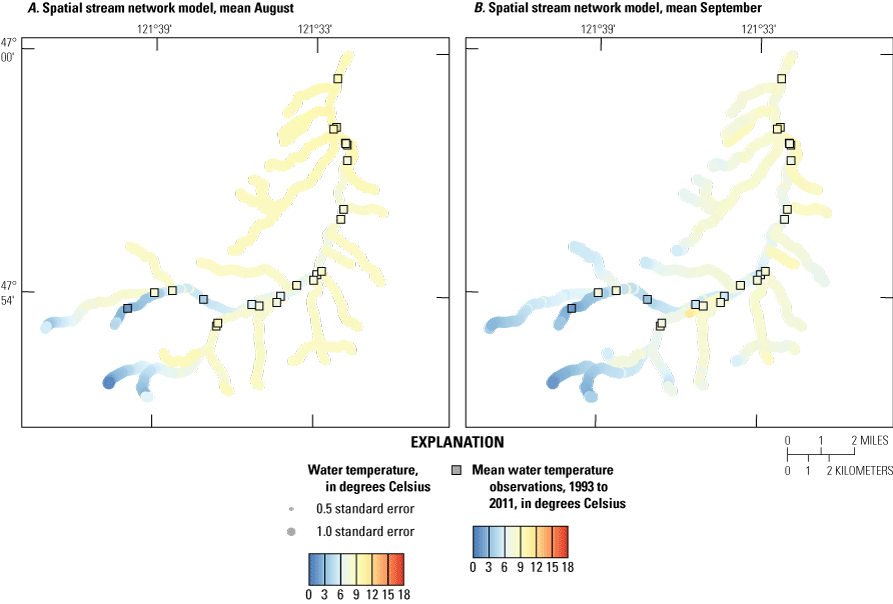
Predicted values of mean August water temperature (AugTw) and September water temperature (SepTw) by spatial stream network models that included the spatial autocovariance structure.
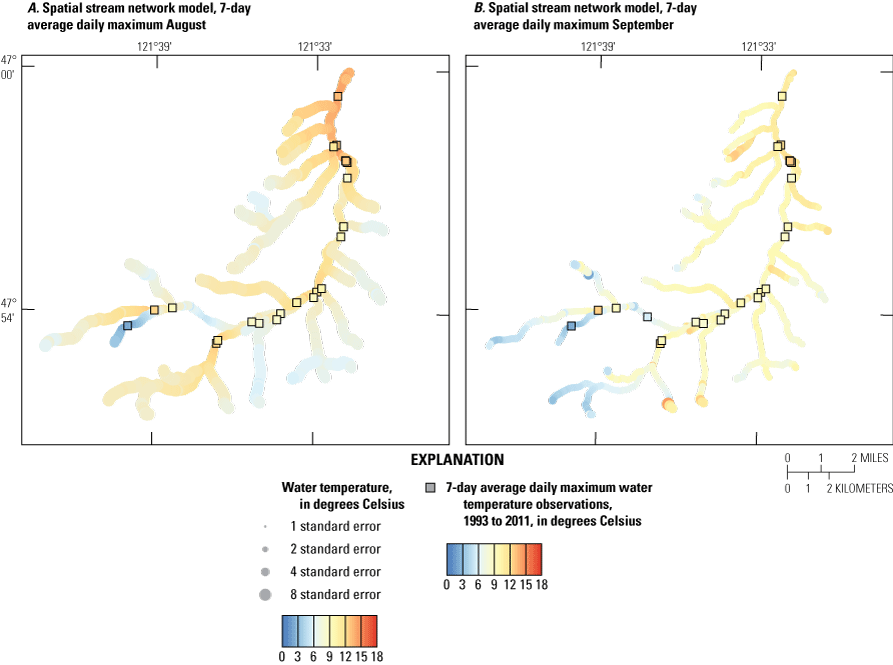
Predicted values of August and September 7-day average daily maximum (7-DADmax) water temperature by spatial stream network models including the spatial autocovariance structure.
On average, mean average August temperature is approximately 1 °C warmer in the upper White River SSN model compared to the modeled temperature from the NorWeST model (table 4). Warmer overall temperature for the study area is attributed to warmer temperatures by 3–4 °C in tributaries draining to the mainstem in the upper White River SSN model compared to the NorWeST model (fig. 6). However, the upper White River SSN model has cooler temperatures by approximately 3 °C in reaches immediately draining glaciers and cooler temperatures in the mainstem by approximately 1–2 °C (fig. 6). Water temperature observations used to calibrate the NorWeST model were located in lower elevation river reaches farther from the glaciated regions of Mount Rainier whereas the upper White River SSN model was calibrated using observations from the upper White River mainstem including reaches in close proximity to the glaciers and in non-glaciated tributaries (fig. 2; table 1).
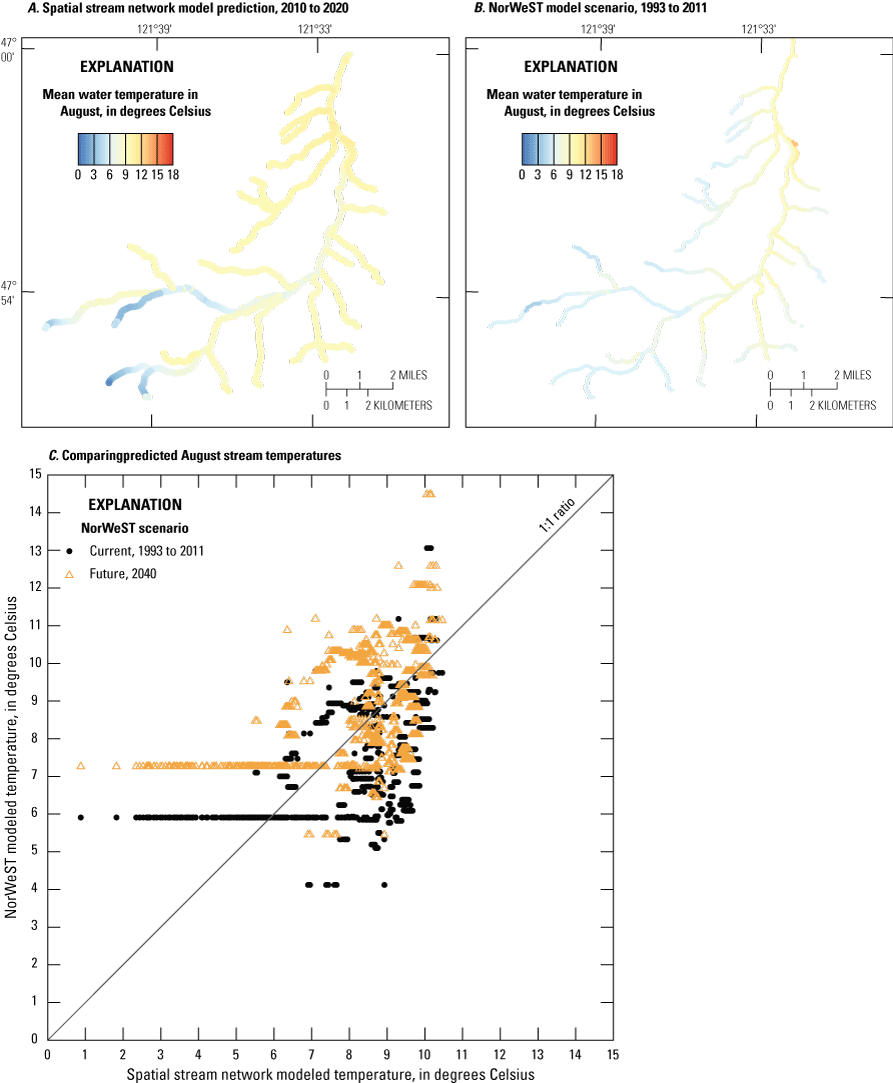
Predicted values of mean August water temperature by spatial stream network (SSN) models including the spatial autocovariance structure for 2010–20 (A) as well as by the NorWeST model scenarios (Isaak and others, 2017) for 1993–2011 (B). The SSN spatial model values are compared to the NorWeST model scenarios for “current” conditions (1993–2011) and a future scenario based on global climate model ensemble averages for 2040 (C).
Table 4.
Summary of upper White River spatial stream network model and the NorWeST water temperature model in degrees Celsius.[Abbreviations: SSN, spatial stream network; Min, minimum; Max, maximum]
Discussion
Spatial variability of late-summer water temperature within the White River Basin of Mount Rainier National Park was estimated by fitting SSN models that incorporated covariates representing hydrologic, climatic, and physical processes hypothesized to drive the water temperature of the White River and its tributaries. The temperature metrics, AugTw, SepTw, 7-DADmaxAug, and 7-DADmaxSep, represented the magnitude of water temperature during late-summer baseflow when water temperature was near its annual maximum and discharge was near its annual minimum were correlated. However, different covariates representing various drivers of the White River Basin’s thermal regime were statistically significant and the performance of models fit to each response variable varied such that models of AugTw and SepTw had better predictive performance than models of 7-DADmaxAug and 7-DADmaxSep, which we attribute to the relatively coarse resolution of the predictor variables to the response variables resulting in better predictions of average conditions over longer time periods (for example, monthly versus 7 days). Specifically, the monthly models had lower RMSPE and MAPE despite slightly lower predicted r2 in the SepTw relative to 7-DADmaxAug (table 3). The inclusion of spatial structures, similar to other statistical models of water temperature within a stream network (for example, Isaak and others, 2017), substantially improved predictive performance and therefore the spatial models are the final selected model to estimate water temperature compared to the non-spatial model. The relative importance of the hydrologic, climatic, and physical processes hypothesized to drive the White River’s thermal regime was evaluated based on covariate significance within best-fit stream temperature models.
During August, when precipitation was at its annual minimum and air temperature was near its annual maximum, surface-water runoff from rainfall and snowmelt was minimal within the White River Basin and streamflow was largely maintained by glacial meltwater within streams draining glaciated headwaters. Streamflow within streams draining non-glaciated headwaters of the White River Basin, which were generally at lower elevations, is likely largely sustained during August by either groundwater discharge or surface-water outflow from lakes occupying headwater cirques formed by former glaciers that melted during the Holocene. Consequently, August water temperatures within the White River Basin differed between those parts of the stream network with glaciated (for example, covered by glaciers) and non-glaciated headwaters with the colder water temperatures associated with streams immediately draining glaciers (figs. 4A and 5B). The best-fit SSN model of AugTw predicted the coldest water temperatures within streams draining the glaciated parts of the upper White River Basin with increases in water temperature in the downstream direction attributed to both cumulative radiative inputs from insolation and the input of non-glaciated tributaries downstream. Although the mainstem White River retained cold water temperatures downstream, water temperature predicted by the best-fit SSN model of AugTw gradually increased downstream reflecting both warming due to effect of radiative inputs. Of the covariates considered for inclusion within the AugTw model, the proportion of basin ice landcover (LC_Ice) was the only significant covariate within the best-fit SSN model that included spatial autocovariance structures. This suggested that hydrological processes connected to the extent of glacial ice were the dominant drivers of stream temperature within the White River Basin and best explained the variability of AugTw at measured sites.
Although the only statistically significant covariate within the best-fit SSN model of AugTw was the proportion of basin ice landcover, other processes likely contributed to the temperature regime of non-glaciated watersheds. However, the limited number of observations within non-glaciated parts of the stream network likely reduced their influence within the best-fit model of AugTw. Consequently, relatively high AugTw within the non-glaciated parts of the White River Basin was simply reflected in the model as an absence of glacial ice. Nevertheless, other factors, such as the quantity of groundwater discharge as related to subsurface geology and riparian shading as reflected through forest cover likely contributed to the temperature regime of non-glaciated basins despite their overall influence within the White River being much less than the extent of glacial ice cover. Although performance metrics were slightly lower compared to the 2 monthly models, SWE was identified as a significant predictor for the 7-DADmaxAug model (table 3). Years of larger snowpack have correlated to cooler water temperatures in other regional mountain rivers (Jaeger and others, 2017). The presence of SWE as a significant predictor in the 7-DADmaxAug suggests that larger snowpack years may result in reducing maximum temperatures at least in August, but did not significantly influence average monthly temperatures, at least with this dataset, indicating that the magnitude of snowpack years for this dataset was not sufficient to result in a statistically significant effect on temperature when averaged over a longer time step of 1 month compared to 7 days.
Mean water temperatures in September (SepTw) within the White River Basin were lower than mean water temperatures within August (AugTw), but their spatial distributions throughout the White River and its tributaries within each month were similar. The lowest water temperatures, both observed and modeled, were present within those parts of the drainage network receiving glacial meltwater runoff whereas those parts that did not receive glacial meltwater were warmer (figs. 4 and 5). The proportion of basin ice landcover was also a statistically significant covariate within the model of SepTw, but its significance was less relative to the model of AugTw. Diminished significance may be because August temperatures are generally higher than September temperatures and therefore any influence on temperature may be lower for months in which seasonal cooling processes such as seasonal changes in air temperature, may be more influential. An additional covariate, proportion of basin forested landcover, emerged as a statistically significant covariate within the SepTw model, but its positive relation to SepTw was opposite the hypothesized negative relation, which was based on the assumption that increased forest cover corresponded to increased riparian shading. Although riparian shading was likely higher within parts of the drainage network with a greater proportion of forested landcover, this relation was confounded by the increase in the proportion of forested landcover with decreasing altitude, as a proxy for increased distance from glaciated water sources and potentially more opportunity in wider, braided channels downstream to have warming influences of solar radiation.
The combined result of the upper White River Basin SSN model predicting warmer water temperatures for the tributaries draining into the mainstem and cooler water temperature for the upper White River mainstem compared to the NorWeST model is attributed to the upper White River Basin SSN model being calibrated with temperature data specific to the river. The NorWeST SSN model had observations from lower elevation river reaches downstream and outside of the modeled domain. This finding of different modeling results indicates the utility of local-scale models calibrated using local field observations from both glaciated and non-glaciated basins if the scope of interest is similarly local.
Conclusions
Spatial stream network models predicted the spatial distribution of late-summer water temperature characterized by mean August and mean September water temperatures and the 7-day average daily maximum of water temperature within the upper White River Basin upstream from the White River’s confluence with Silver Creek. Although each of these temperature metrics was correlated, the predictive performance of the AugTw and SepTw models was greatest, which was further improved by the inclusion of spatial autocovariance structures. The distribution of runoff from glacial meltwater throughout the White River Basin is likely a primary control on water temperature in both August and September as the proportion of basin ice landcover emerged as a statistically significant covariate in the AugTw and SepTw models. The inclusion of this covariate in the models suggests that variability in water temperature can be explained by whether the drainage network includes or excludes runoff from glacial meltwater. Modeled water temperatures were approximately 2 degrees Celsius cooler than what was estimated for NorWeST. Differences in model estimates are attributed to the use of water temperature observations specifically from the upper White River study area, which were not included in the NorWeST model.
Data Availability
All model results and modeling code used in this study are available in the U.S. Geological Survey data release (Leach and others, 2024).
References Cited
Barrett, A.P., 2003, National operational hydrologic remote sensing center snow data assimilation system (SNODAS) products at National Snow and ice data center (NSIDC): Cooperative Institute for Research in Environmental Sciences, accessed July 10, 2024, https://nsidc.org/data/g02158/versions/1.
Detenbeck, N.E., Morrison, A.C., Abele, R.W., and Kopp, D.A., 2016, Spatial statistical network models for stream and river temperature in New England, USA: Water Resources Research, v. 52, no. 8, p. 6018–6040, accessed July 10, 2024, at https://doi.org/10.1002/2015WR018349.
Eby, L.A., Helmy, O., Holsinger, L.M., and Young, M.K., 2014, Evidence of climate-induced range contractions in bull trout Salvelinus confluentus in a Rocky Mountain watershed, U.S.A: PLoS One, v. 9, no. 6, p. e98812, accessed July 10, 2024, at https://doi.org/10.1371/journal.pone.0098812.
Gendaszek, A.S., Dunham, J.B., Torgersen, C.E., Hockman-Wert, D.P., Heck, M.P., Thorson, J., Mintz, J., and Allai, T., 2020, Land-cover and climatic controls on water temperature, flow permanence, and fragmentation of Great Basin stream networks: Water, v. 12, no. 7, 29 p., accessed July 10, 2024, at https://www.mdpi.com/2073-4441/12/7/1962.
Homer, C., Dewitz, J., Yang, L., Jin, S., Danielson, P., Xian, G., Coulston, J., Herold, N., Wickham, J., and Megown, K., 2015, Completion of the 2011 National land cover database for the conterminous United States—Representing a decade of land cover change information: Photogrammetric Engineering and Remote Sensing, v. 81, no. 5, p. 345–354.
Isaak, D.J., Wenger, S.J., Peterson, E.E., Ver Hoef, J.M., Nagel, D.E., Luce, C.H., Hostetler, S.W., Dunham, J.B., Roper, B.B., Wollrab, S.P., Chandler, G.L., Horan, D.L., and Parkes-Payne, S., 2017, The NorWeST summer stream temperature model and scenarios for the western US—A crowd-sourced database and new geospatial tools foster a user community and predict broad climate warming of rivers and streams: Water Resources Research, v. 53, no. 11, p. 9181–9205.
Isaak, D.J., Luce, C.H., Horan, D.L., Chandler, G.L., Wollrab, S.P., Dubois, W.B., and Nagel, D.E., 2020, Thermal regimes of perennial rivers and streams in the western United States: Journal of the American Water Resources Association, v. 56, no. 5, p. 842–867, accessed July 10, 2024, at https://doi.org/10.1111/1752-1688.12864.
Jaeger, K.L., Curran, C.A., Anderson, S.W., Morris, S.T., Moran, P.W., and Reams, K.A., 2017, Suspended sediment, turbidity, and stream water temperature in the Sauk River Basin, Washington, water years 2012–16: U.S. Geological Survey Scientific Investigations Report 2017–5113, 47 p., https://doi.org/10.3133/sir20175113.
Jaeger, K.L., Dunn, S.B., and Wilkerson, O.A., 2023b, Supporting data for and predictions from streamflow permanence modeling in Mount Rainier National Park and surrounding area, Washington, 2018–2020: U.S. Geological Survey data release, https://doi.org/10.5066/P942QL23.
Leach, A.C., Gendaszek, A.S., and Jaeger, K.L., 2024, Stream temperature models of White River watershed, Mount Rainier National Park, Washington: U.S. Geological Survey data release, https://doi.org/10.5066/P9ZKB3EZ.
National Park Service, 2024, Integrated Resource Management Applications (IRMA): National Park Service website, accessed on July 10, 2024, at https://irma.nps.gov/aqwebportal/.
PRISM Climate Group, 2014, PRISM Climate Group: Oregon State University website, data created February 4, 2014, accessed on July 10, 2024, at https://prism.oregonstate.edu.
Rawhouser, A.K., Grace, L.P., Lofgren, R.A., Glesne, R.S., Boetsch, J.R., Welch, C.A., Samora, B.A., Crain, P., and Holmes, R.E., 2012, North Coast and Cascades Network water quality monitoring protocol: Fort Collins, Colorado, National Park Service, Natural Resource Report NPS/NCCN/NRR—2012/571, 440 p., accessed on July 16, 2024, at https://irma.nps.gov/DataStore/DownloadFile/454917.
Steel, E.A., Sowder, C., and Peterson, E.E., 2016, Spatial and temporal variation of water temperature regimes on the Snoqualmie River network: Journal of the American Water Resources Association, v. 52, no. 3, p. 769–787, accessed July 10, 2024, at https://doi.org/10.1111/1752-1688.12423.
U.S. Environmental Protection Agency and U.S. Geological Survey, 2012, National Hydrography Dataset Plus NHDPlus (ver. 2.10): U.S. Environmental Protection Agency, accessed June 27, 2016, at https://www.epa.gov/waterdata/nhdplus-national-hydrography-dataset-plus.
Washington Division of Geology and Earth Resources, 2016, Surface geology, 1:100,000--GIS data, November 2016: Washington Division of Geology and Earth Resources Digital Data Series DS-18, version 3.1, previously released June 2010, https://www.dnr.wa.gov/programs-and-services/geology/publications-and-data/gis-data-and-databases.
Washington Geological Survey, 2019, Surface geology, 1:24,000--GIS data, November 2019: Washington Geological Survey Digital Data Series DS-10, version 3.1, previously released September 2017, accessed September 15, 2021, at https://fortress.wa.gov/dnr/geologydata/publications/data_download/ger_portal_surface_geol ogy_24k.zip.
Conversion Factors
Datum
Vertical coordinate information is referenced to the North American Vertical Datum of 1988 (NAVD 88).
For information about the research in this report, contact the
Director, Washington Water Science Center
U.S. Geological Survey
934 Broadway, Suite 300
Tacoma, Washington 98402
https://www.usgs.gov/centers/washington-water-science-center
Manuscript approved on March 25, 2025
Publishing support provided by the U.S. Geological Survey
Science Publishing Network, Tacoma Publishing Service Center
Edited by Vanessa Ball and Jeff Suwak
Design and layout by Teresa A. Lewis and Yanis X. Castillo
Disclaimers
Any use of trade, firm, or product names is for descriptive purposes only and does not imply endorsement by the U.S. Government.
Although this information product, for the most part, is in the public domain, it also may contain copyrighted materials as noted in the text. Permission to reproduce copyrighted items must be secured from the copyright owner.
Suggested Citation
Gendaszek, A.S., Leach, A.C., and Jaeger, K.L., 2025, Spatial stream network modeling of water temperature within the White River Basin, Mount Rainier National Park, Washington (ver. 1.1, May 2025): U.S. Geological Survey Scientific Investigations Report 2025–5029, 17 p., https://doi.org/10.3133/sir20255029. [Supersedes preprint https://doi.org/10.31223/X5712P.]
ISSN: 2328-0328 (online)
Study Area
| Publication type | Report |
|---|---|
| Publication Subtype | USGS Numbered Series |
| Title | Spatial stream network modeling of water temperature within the White River Basin, Mount Rainier National Park, Washington |
| Series title | Scientific Investigations Report |
| Series number | 2025-5029 |
| DOI | 10.3133/sir20255029 |
| Edition | Version 1.0: April 23.2025; Version 1.1: May 20, 2025 |
| Publication Date | April 23, 2025 |
| Year Published | 2025 |
| Language | English |
| Publisher | U.S. Geological Survey |
| Publisher location | Reston, VA |
| Contributing office(s) | Washington Water Science Center |
| Description | Report: vi, 17 p.; Data Release |
| Country | United States |
| State | Washington |
| Other Geospatial | Mount Rainier National Park, upper White River Basin |
| Online Only (Y/N) | Y |