

Flood-Inundation Maps for 14.8 Miles of Little and Big Papillion Creeks in Omaha, Nebraska, 2023
Links
- Document: Report (2.7 MB pdf) , HTML , XML
- Dataset: USGS National Water Information System database - USGS water data for the Nation
- Data Release: USGS data release - Flood-inundation geospatial datasets for 14.8 miles of the Little and Big Papillion Creeks in Omaha, Nebraska, 2023
- NGMDB Index Page: National Geologic Map Database Index Page (html)
- Download citation as: RIS | Dublin Core
Acknowledgments
The authors wish to thank the Papio-Missouri River Natural Resource District for funding the operation and maintenance of the streamgages used for this study.
Abstract
Digital flood-inundation map libraries for two reaches that constitute 14.8 miles of Little and Big Papillion Creeks in Omaha, Nebraska, were created by the U.S. Geological Survey (USGS) in cooperation with the Papio-Missouri River Natural Resource District. The flood-inundation maps, which can be accessed through the USGS Flood Inundation Mapping Program website at https://www.usgs.gov/mission-areas/water-resources/science/flood-inundation-mapping-fim-program, depict estimates of the areal extent and depth of flooding corresponding to selected water levels (stages) at the Little Papillion Creek at Irvington, Nebr. (USGS station 06610750), Little Papillion Creek at Ak-Sar-Ben at Omaha, Nebr. (USGS station 06610765), and Big Papillion Creek at Q Street at Omaha, Nebr. (USGS station 06610770) streamgages. Near-real-time stages at these streamgages may be obtained from the USGS National Water Information System database at https://doi.org/10.5066/F7P55KJN or from the National Weather Service Advanced Hydrologic Prediction Service at https://water.weather.gov/ahps/.
Flood profiles were computed for two different reaches that constitute 14.8 miles of stream length in the study area by using hydraulic models. The models were calibrated by adjusting roughness coefficients to best represent the current (2022) stage-streamflow relation at the streamgages within the study reach.
The hydraulic models were then used to compute water-surface profiles at 1-foot stage intervals for selected stage ranges to represent various flooding scenarios at the streamgages in each reach. The simulated water-surface profiles then were combined with a digital elevation model using a geographic information system, which had a 10-foot grid spacing to delineate the flooding extents and water depths for each stage. The availability of these flood-inundation maps, along with information regarding current stage from the USGS streamgages, can provide emergency management personnel and residents with information that is critical for flood response activities and post flood recovery efforts.
Introduction
The Papillion Creek drainage basin is one of the most flood-prone and heavily populated areas in the State of Nebraska (Papio-Missouri River Natural Resources District, 2023). One of the most devastating floods happened June 16–17, 1964, following a storm that produced 8 inches of rain in 3 hours. The flood waters destroyed 95 trailer homes and other personal property and resulted in the loss of seven lives. Since 1964, additional development and urbanization of the western part of the Papillion Creek drainage basin may cause a substantial increase in the amount of stormwater runoff in the event of a storm of similar or greater magnitude. This development and urbanization could increase the severity and occurrence of flooding (Papio-Missouri River Natural Resources District, 2023).
Emergency managers in Omaha, Nebraska, have relied on several sources to make decisions on how to best alert the public and mitigate flood damages. One source is the current flood insurance study (FIS) for Douglas County (not shown on any maps; Federal Emergency Management Agency, 2014). A second source is the U.S. Geological Survey (USGS) streamgages on Little Papillion Creek at Irvington, Nebr. (USGS station 06610750; table 1), Little Papillion Creek at Ak-Sar-Ben at Omaha, Nebr. (USGS station 06610765; table 1), and Big Papillion Creek at Q Street at Omaha, Nebr. (USGS station 06610770; table 1), which provide current (2023) and historical water levels and streamflows, including annual peak flows, via the USGS National Water Information System database (table 1; U.S. Geological Survey, 2023b). A third source of flood-related information is the National Weather Service (NWS) Advanced Hydrologic Prediction Service, which also provides the USGS stage data for the three streamgages (NWS identifier: IRVN1, OMLN1, RABN1; National Weather Service, 2023a, b, c)
Table 1.
U.S. Geological Survey streamgage information for Little and Big Papillion Creeks at Omaha, Nebraska (U.S. Geological Survey, 2023b).[USGS, U.S. Geological Survey; mi2, square mile; ft, foot; NAVD 88, North American Vertical Datum of 1988; °, degree; ʹ, minute; ʺ, second]
As reported by the National Weather Service (2023a, b, c, d).
Although the current stage at a USGS streamgage is particularly useful for residents near a streamgage, the stage is of limited use to residents farther upstream or downstream because the water-surface elevation is not constant along the stream reach. Additionally, knowledge of a water level at a streamgage is difficult to translate into depth and areal extent of flooding at points distant from the streamgage. One way to address these informational gaps is to produce flood-inundation maps (FIMs) that are referenced to the stages recorded at a USGS streamgage. By referring to the appropriate map, emergency responders can discern the severity of flooding (depth of water and areal extent), identify roads that are or will soon be flooded, and make plans to notify or evacuate residents for some distance upstream and downstream from the streamgage. In addition, the capability to visualize the potential extent of flooding may motivate residents to take precautions and heed warnings that they previously might have disregarded.
In 2023, the USGS, in cooperation with Papio-Missouri River Natural Resource District, led a study to produce two libraries of FIMs for 14.8 miles (mi) of Little and Big Papillion Creeks in Omaha, Nebr. Hydraulic model development was completed by the U.S. Army Corps of Engineers (USACE) as part of the Silver Jackets Interagency Flood Risk Management Team under the authority of the Floodplain Management Services Program. These maps, in conjunction with the real-time stage data from the USGS streamgages, can help to guide users in taking individual safety precautions and can provide emergency management personnel with a tool to efficiently manage emergency flood operations and post flood recovery efforts.
Purpose and Scope
This report describes the development of two estimated FIM libraries for 14.8 mi of Little and Big Papillion Creeks in Omaha, Nebr., and identifies where the maps can be viewed on the internet and where ancillary data (geographic information system flood polygons and depth grids) can be downloaded. The FIMs cover 14.8 mi of Little and Big Papillion Creeks with the upstream limit at the Little Papillion Creek at Irvington, Nebr. (USGS station 06610750; fig. 1) streamgage to 3.8 mi downstream from the confluence with Big Papillion Creek and includes a 2.8-mi reach of the Big Papillion Creek above the confluence. The FIMs were produced for water levels referenced to the stage recorded at three streamgages on Little and Big Papillion Creeks: Little Papillion Creek at Irvington, Nebr. (USGS station 06610750; table 1), Little Papillion Creek at Ak-Sar-Ben at Omaha, Nebr. (USGS station 06610765; table 1), and Big Papillion Creek at Q Street at Omaha, Nebr. (USGS station 06610770; table 1). The 4-mi section of Little Papillion Creek downstream from the streamgage Little Papillion Creek at Irvington, Nebr. (USGS station 06610750) will be herein referred to as the “Irvington reach” (fig. 1). The 8-mi section that encompasses Little and Big Papillion Creeks extends from 1.75 mi upstream of the Little Papillion Creek at Ak-Sar-Ben at Omaha, Nebr. (USGS station 06610765) streamgage to 3.8 mi downstream from the Big Papillion Creek at Q Street at Omaha, Nebr. (USGS station 06610770) streamgage and will be herein referred to as the “Ak-Sar-Ben reach” (fig. 1). In addition to the 8-mi section, the Ak-Sar-Ben reach also includes a 2.8-mi section of the Big Papillion Creek upstream from the confluence of Little and Big Papillion Creeks.
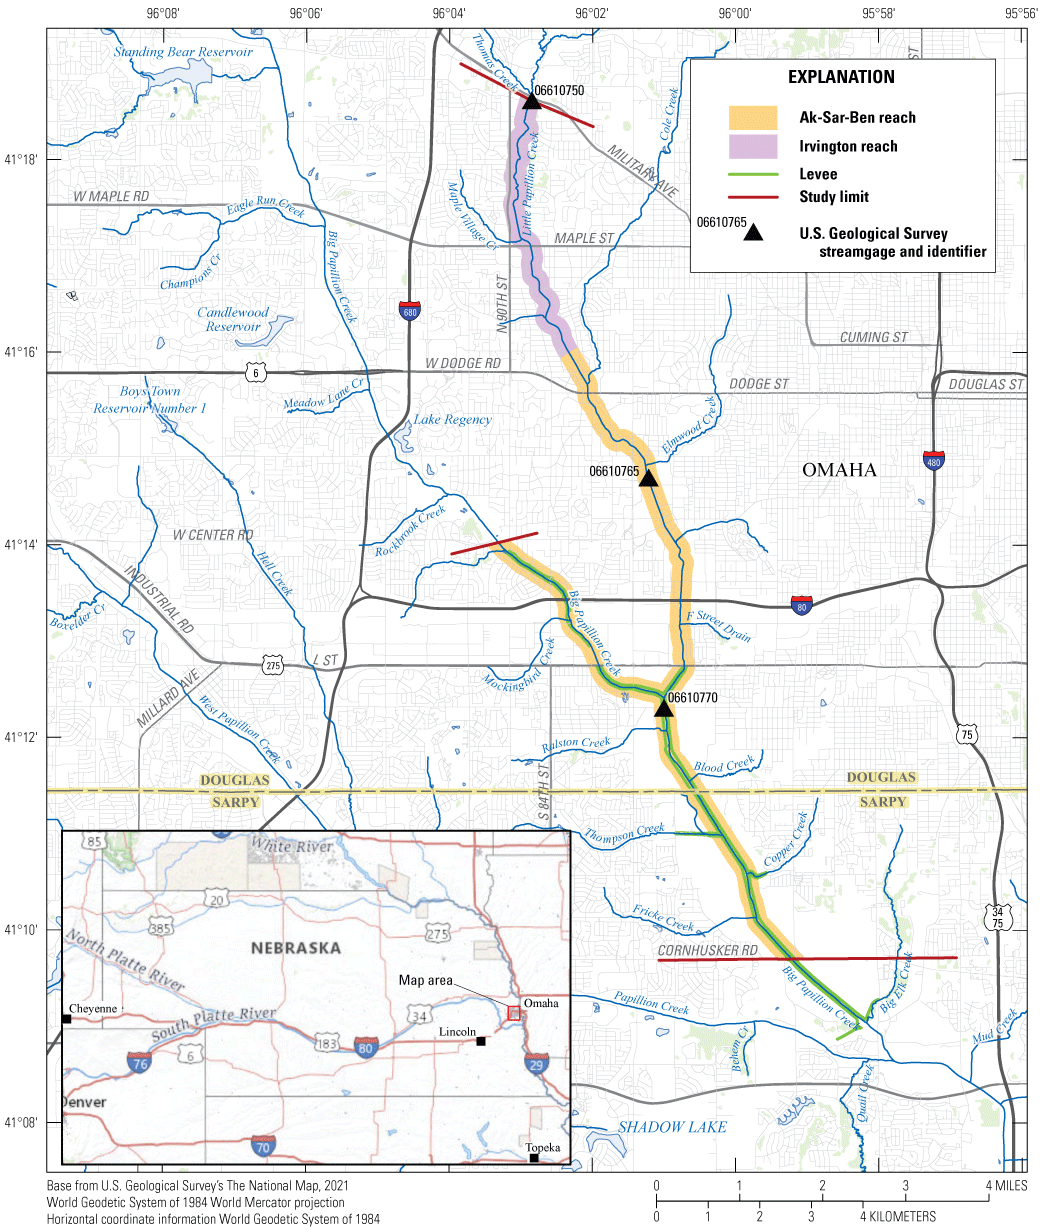
Locations of entire 14.8-mile study reach, flood-inundation map library reaches, and U.S. Geological Survey streamgages for Little and Big Papillion Creeks, in Omaha, Nebraska (U.S. Geological Survey, 2023b).
The map libraries were developed for stage ranges corresponding to the action and major flood stages at each streamgage as defined by the NWS (National Weather Service, 2023d; table 1). The map library for the Irvington reach consists of water surface profiles at 1-foot (ft) intervals for a range of stages from 15 to 26 ft referenced to the streamgage datum at the Little Papillion Creek at Irvington, Nebr. (USGS station 06610750) and resulted in 11 maps. The Ak-Sar-Ben reach map library consists of water surface profiles for combinations of 1-ft stage intervals at the Little Papillion Creek at Ak-Sar-Ben at Omaha, Nebr. (USGS station 06610765) and the Big Papillion Creek at Q Street at Omaha, Nebr. (USGS station 06610770) streamgages and resulted in 63 total maps. The stages for the Little Papillion Creek at Ak-Sar-Ben at Omaha, Nebr. (USGS station 06610765) ranged from 16.5 to 28.5 ft referenced to the streamgage datum. The stages for the Big Papillion Creek at Q Street at Omaha, Nebr. (USGS station 06610770) streamgage ranged from 33 to 39 ft referenced to the streamgage datum. The geospatial datasets used in this study are available as a USGS data release (Strauch, 2025).
Study Area Description
The study area is located in the Dissected Till Plains section of the Central Lowland physiographic province (not shown on any maps; Fenneman, 1938). The drainage areas of streamgages within the study reach range from about 32 square miles (mi2) at the Little Papillion Creek at Irvington, Nebr. (USGS station 06610750) streamgage to about 218 mi2 at the Big Papillion Creek at Q Street at Omaha, Nebr. (USGS station 06610770) streamgage, near the downstream study limit (table 1; U.S. Geological Survey, 2023b). In general, much of the downstream end of the basin is urbanized, and much of the upstream part of the basin is used for agricultural purposes (Center for Advanced Land Management Information Technologies, 2007). The Omaha metropolitan area has experienced a 16-percent population growth from 2010 to 2020 (U.S. Census Bureau, 2023). As a result, some areas within the basin once dominated by agricultural land use have been developed into urban and suburban land uses (Papio-Missouri River Natural Resources District, 2017). The climate is continental and temperate with large seasonal variations in temperature and precipitation. The average annual precipitation in Omaha is 31.86 inches per year (1991–2020), of which 74 percent falls during April–September (National Centers for Environmental Information, 2023).
The total study length is about 14.8 mi long, with an upstream limit at the Little Papillion Creek at Irvington, Nebr. (USGS station 06610750) streamgage and downstream limit at Cornhusker Road, about 3.8 mi downstream from the Big Papillion Creek at Q Street at Omaha, Nebr. (USGS station 06610770) streamgage. The study also includes a 2.8-mi reach of Big Papillion Creek above the confluence of Little Papillion Creek (fig. 1). Most of the land contiguous to the study reach is urban or developed. There is one major tributary and several other minor tributaries that join Little Papillion Creek in the study reach. Cole Creek is the major tributary and has a drainage area of about 6.8 mi2 (U.S. Geological Survey, 2023b). The main channels within the study reach have a total of 34 crossings (railroad, roadway, and pedestrian bridges) as of April 2023. In response to devastating floods in 1959, 1964, and 1965, structural flood control measures such as levee construction and channel straightening were completed to increase the conveyance capacity of Papillion Creek and its major tributaries (Papio-Missouri River Natural Resources District, 2023). These levee-protected areas are located along the banks of Little Papillion Creek for about 0.5 mi upstream from the confluence of Little and Big Papillion Creeks, and along most of the banks of Big Papillion Creek (fig. 1). The levee-protected areas are included in the U.S. Army Corps of Engineers National Levee Database (U.S. Army Corps of Engineers, 2023).
Previous Studies
The current FIS for Douglas County, Nebr. (not shown on any maps) was completed by a study contractor for the Federal Emergency Management Agency (Federal Emergency Management Agency, 2014). The FIS for Douglas County, Nebr., presents estimates of the peak streamflows with 10-, 2-, 1-, and 0.2-percent annual exceedance probabilities and their associated water-surface elevations for Little and Big Papillion Creeks in Omaha, Nebr.
The USACE and Papio-Missouri River Natural Resources District also completed the Papillion Creek and Tributaries Lakes General Reevaluation Study (U.S. Army Corps of Engineers, Omaha District, Northwestern Division, 2021). The purpose of the study was to reevaluate flood risk over a wide range of updated annual exceedance probability events on the following tributaries: Papillion Creek, Big Papillion Creek, West Papillion Creek, Little Papillion Creek, South Papillion Creek (not shown), Thomas Creek, Cole Creek, and Saddle Creek. The study produced an existing conditions model as well as models for various possible future changes to the drainage basin. The existing conditions hydraulic model that was developed as part of the USACE 2014 study was used for the development of the water-surface profiles (and resulting FIM libraries) in this study.
Creation of Flood-Inundation Map Library
The USGS has standardized the procedures for creating FIMs for flood-prone communities (U.S. Geological Survey, 2023a). Tasks specific to development of the flood maps for Papillion Creek included the (1) acquisition of the existing conditions hydraulic model from the Papillion Creek and Tributaries Lakes General Reevaluation Study (U.S. Army Corps of Engineers, Omaha District, Northwestern Division, 2021); (2) verification and calibration of energy-loss factors (roughness coefficients) in the stream channel and floodplain and determination of steady-flow data; (3) production of estimated FIMs at various stream stages using the USACE Hydrologic Engineering Center-River Analysis System (HEC–RAS) Mapper program (U.S. Army Corps of Engineers, Hydrologic Engineering Center, 2019); and (4) preparation of the maps, as shapefile polygons that depict the areal extent of flood inundation and as depth grids that provide the depth of floodwaters for specified streamgage stages, for viewing on a USGS flood-inundation mapping application. The study methods and objectives were originally presented in previously published reports (Bales and others, 2007; Strauch and Hobza, 2023) and are summarized herein.
Computation of Water-Surface Profiles
The water-surface profiles used to produce the FIMs in this study were computed using HEC–RAS, version 5.0.7 (Brunner, 2016). HEC–RAS is a one-dimensional and/or two-dimensional hydraulic model used for simulation of water-surface profiles with steady-state (gradually varied) or unsteady-state flow computation options. The Irvington reach was modeled using the one-dimensional steady-state flow computation option. The Ak-Sar-Ben reach was modeled using a one-dimensional/two-dimensional unsteady-state flow computation option because of the flow dynamics at the confluence and the levee storage area system.
Hydrologic Data
The study area includes three streamgages (fig. 1; table 1). Stage is measured every 15 minutes, transmitted hourly by a satellite radio, and made available through the USGS National Water Information System database (U.S. Geological Survey, 2023b). Stage data from these streamgages are referenced to a local datum but can be converted to water-surface elevations referenced to the North American Vertical Datum of 1988 (NAVD 88) by adding the NAVD 88 streamgage datum value in table 1.
The peak flows used in the model simulations for the Irvington reach were taken from the current stage-streamflow relation (rating number 4, effective February 28, 2021) and corresponded to the target stages at the Little Papillion Creek at Irvington, Nebr. (USGS station 06610750) streamgage (table 2). For peak flows that were greater than the current stage-streamflow rating (greater than 6,720 cubic feet per second [ft3/s]), the HEC–RAS model calibrated for the current study was used to extend the rating. Flows ranging from 4,300 to 17,800 ft3/s were used as input into the hydraulic model to produce water-surface profiles. No major tributaries join Little Papillion Creek within the Irvington reach; therefore, the gage-derived streamflows were not adjusted for tributary inflows but were held constant throughout the study reach for a given profile.
Table 2.
Streamflows corresponding to selected stages and water-surface elevations at Little Papillion Creek at Irvington, Nebraska (U.S. Geological Survey station 06610750) streamgage used in the hydraulic model for the Irvington reach (U.S. Geological Survey, 2023b).[NAVD 88, North American Vertical Datum of 1988]
The Ak-Sar-Ben reach peak flow data were obtained from a combination of the Little Papillion Creek at Ak-Sar-Ben at Omaha, Nebr. (USGS station 06610765; rating number 7, effective May 21, 2020) and the Big Papillion Creek at Q Street at Omaha, Nebr. (USGS station 06610770; rating number 9, effective November 27, 2022) to create peak flow scenarios that could occur in the reach (table 3). Peak flows input into the model on the Big Papillion Creek above the confluence were calculated by subtracting the target flow at the Little Papillion Creek at Ak-Sar-Ben at Omaha, Nebr. (USGS station 06610765) from the flow at Big Papillion Creek at Q Street at Omaha, Nebr. (USGS station 06610770). If this calculation resulted in a negative or unrealistically low streamflow value, that scenario was not used to create a water surface profile or inundation map. For peak flows that were greater than the current stage-streamflow rating (greater than 7,800 [USGS station 06610765] and 13,100 [USGS station 06610770] ft3/s), the calibrated HEC–RAS model developed for the current study was used to extend the rating. Flows ranging from 6,600 to 34,900 ft3/s were used as input into the hydraulic model to produce water-surface profiles. Cole Creek joins the Little Papillion Creek above the Little Papillion Creek at Ak-Sar-Ben at Omaha, Nebr. (USGS station 06610765) streamgage. However, the upstream limit of the Ak-Sar-Ben reach model was positioned so that the Cole Creek inflow would be included in the streamflow accounted for at the Little Papillion Creek at Ak-Sar-Ben at Omaha, Nebr. (USGS station 06610765) streamgage; therefore, the gage-derived streamflow was not adjusted for tributary inflows but were held constant throughout the study reach for a given profile.
Table 3.
Estimated streamflows for corresponding stages and water-surface elevations at Little Papillion Creek at Ak-Sar-Ben at Omaha, Nebraska (U.S. Geological Survey station 06610765) and at Big Papillion Creek at Q Street at Omaha, Nebraska (U.S. Geological Survey station 06610770) streamgages (U.S. Geological Survey, 2023b) used in the hydraulic model for the Ak-Sar-Ben reach (8-mile section that encompasses Little and Big Papillion Creeks).[USGS, U.S. Geological Survey; NAVD 88, North American Vertical Datum of 1988; --, no value]
Topographic Data
All topographic data used in this study are referenced vertically to NAVD 88 and horizontally to the North American Datum of 1983 (NAD 83). The digital elevation model (DEM) that was used in the study was derived from light detection and ranging (lidar) data, which were collected during December 2016 by Woolpert, Inc., of Dayton, Ohio (U.S. Geological Survey, 2020). The original lidar data vertical accuracy was 0.50 ft at a 95-percent confidence level based on a root mean square error (RMSE) of 0.26 ft for the “open terrain” land-cover category. By these criteria, the lidar data supported production of 2-ft contours (Dewberry, 2012). The final DEM had a 10-ft grid-cell size and a vertical accuracy of plus or minus 1 ft (U.S. Geological Survey, 2020).
Hydraulic Structures
A total of 34 crossings (railroad, roadway, and pedestrian bridges) have the potential to affect water-surface elevations during floods along the stream reaches. Levees line portions of the banks of the Ak-Sar-Ben reach, as described in the “Study Area Description” section (fig. 1) and were represented as lateral structures in the hydraulic model. In some cases, lateral structures on the Ak-Sar-Ben reach needed to be realigned to the high ground to provide a more realistic result and to minimize issues with stability. In addition, some portions of the levee tiebacks (originally modeled as break lines) were modeled as weirs. These changes allow the model to accurately represent the best alignment and surveyed elevation, instead of relying solely on the DEM representation of these structures. Survey data available on the National Levee Database indicated georeferenced elevation points and were used to represent tie backs (U.S. Army Corps of Engineers, 2023). This choice was made at the Thompson Creek and Copper Creek tributaries. For inundation mapping purposes, the landward side of the levee is shown as an “area of uncertainty” because there is uncertainty as to how this area would be inundated in the event of the levee overtopping or failing.
Energy-Loss Factors
Hydraulic analyses require the estimation of energy losses that result from frictional resistance exerted by a channel on streamflow. These energy losses are quantified by the Manning’s roughness coefficient (n value; Barnes, 1967). As part of the calibration process, the initial n values were adjusted until the differences between simulated and observed water-surface elevations at the streamgage within the study reach were minimized.
The initial (precalibration) n values for the Irvington reach were selected based on field observations and high-resolution aerial photographs. The final n values were 0.033 for the main channel and ranged from 0.05 to 0.06 for the overbank areas simulated in this analysis.
Initial n values for the Ak-Sar-Ben overbank flow areas were assigned based on the 2016 National Land Cover Dataset (Dewitz, 2019). For the main channel areas, n values were selected based on field observations and high-resolution aerial photographs. The final n values were 0.02–0.03 for the main channel and ranged from 0.04 to 0.08 for the overbank areas.
Hydraulic Model
HEC–RAS was used for the analysis of both study reaches. The Irvington reach was modeled using the one-dimensional steady-state flow computation option. The Ak-Sar-Ben reach was modeled using a one-dimensional/two-dimensional unsteady-state flow computation option because of the flow dynamics at the confluence and the levee storage area system. For both modeled reaches, flow data consisted of the flow regime, boundary conditions, and flows that produced water-surface elevations at the streamgage that matched target water-surface elevations for the streamgages in the reach. The models assumed a subcritical (tranquil) flow regime. The downstream boundary condition was defined as normal depth (depth of flow in a channel when the slope of the water surface and channel bottom is the same and the water depth remains constant), and these values were set to a water slope of 0.001 ft of vertical change for every foot of horizontal distance for the Irvington reach and 0.00134 ft for the Ak-Sar-Ben reach. The calculation of normal depth was estimated from the slope of the channel bottom of the four farthest downstream cross sections in the model. The HEC–RAS model for the Irvington reach was calibrated to the current (2022; rating number 4) stage-streamflow relation at the Little Papillion Creek at Irvington, Nebr. (USGS station 06610750) by the method described in the “Energy-Loss Factors” section. Differences between observed and simulated water-surface elevations for the four simulated calibration flows at Little Papillion Creek at Irvington, Nebr. (USGS station 06610750) streamgage were less than or equal to 0.21 ft (table 4), with an RMSE of 0.20 ft.
Table 4.
Calibration of model to target water-surface elevations for the Irvington reach at Little Papillion Creek at Irvington, Nebraska (U.S. Geological Survey station 06610750) streamgage (U.S. Geological Survey, 2023b).[ft, foot; NAVD 88, North American Vertical Datum of 1988]
The Ak-Sar-Ben reach HEC–RAS model was calibrated to the current (2022) stage-streamflow relation at the Little Papillion Creek at Ak-Sar-Ben at Omaha, Nebr. (USGS station 06610765) and Big Papillion Creek at Q Street at Omaha, Nebr. (USGS station 06610770) streamgages. Because the rating for the Little Papillion Creek at Ak-Sar-Ben at Omaha, Nebr. (USGS station 06610765) streamgage had a maximum stage of 17.5 ft, the calibration included two additional runs at 1-ft intervals below the range of stages used to create the inundation maps for the reach to include a few more data targets for calibration. Differences between observed and simulated water-surface elevations for the four simulated calibration flows at the Little Papillion Creek at Ak-Sar-Ben at Omaha, Nebr. (USGS station 06610765) streamgage were less than or equal to 0.11 ft (table 5) and had an RMSE of 0.04 ft. Similarly, all the target stages used to create the inundation maps for the Big Papillion Creek at Q Street at Omaha, Nebr. (USGS station 06610770) streamgage were larger than the maximum stage of the rating curve. Therefore, the highest four stages of the rating curve were used for calibration. The modeled differences at the Big Papillion Creek at Q Street at Omaha, Nebr. (USGS station 06610770) streamgage were less than or equal to 0.30 ft (table 5) and had an RMSE of 0.18 ft for the four simulated calibration flows.
Table 5.
Calibration of model to target water-surface elevations at Little Papillion Creek at Ak-Sar-Ben at Omaha, Nebraska (U.S. Geological Survey station 06610765) and at Big Papillion Creek at Q Street at Omaha, Nebraska (U.S. Geological Survey station 06610770) streamgages (U.S. Geological Survey, 2023b).[ft, foot; NAVD 88, North American Vertical Datum of 1988]
Development of Water-Surface Profiles
For the Irvington reach, the calibrated hydraulic model was used to generate water-surface profiles for a total of 11 flood stages at 1-ft intervals between 15 and 26 ft (excluding the 24-ft stage) as referenced to the local streamgage datum of the Little Papillion Creek at Irvington, Nebr. (USGS station 06610750). The 24-ft stage could not be modeled because the simulated streamflow at that stage was in a transition zone between over-bridge weir flow and pressure-flow state, which caused the elevation of the stage at this point to rise above the 24-ft stage. Streamflows corresponding to the various stages were obtained from the current (2022) stage-streamflow relation for the streamgage Little Papillion Creek at Irvington, Nebr. (USGS station 06610750; table 2).
The Ak-Sar-Ben reach hydraulic model was used to generate water-surface profiles for a total of 63 flood stage scenarios. The flood stage scenarios corresponded to combinations of stage data from the Little Papillion Creek at Ak-Sar-Ben at Omaha, Nebr. (USGS station 06610765) and Big Papillion Creek at Q Street at Omaha, Nebr. (USGS station 06610770) streamgages to represent the possible flood and backwater conditions from the confluence of Little and Big Papillion Creeks. Little Papillion Creek was represented by stage values in 1-ft stage intervals that ranged from 16.5 to 28.5 ft, as referenced to the local datum of Little Papillion Creek at Ak-Sar-Ben at Omaha, Nebr. (USGS station 06610765) streamgage. Big Papillion Creek below the confluence was represented by stage values in 1-ft stage intervals that ranged from 33 to 39 ft, as referenced to the local datum of the Big Papillion Creek at Q Street at Omaha, Nebr. (USGS station 06610770) streamgage. Streamflows corresponding to the various stages were obtained from the current (2022) stage-streamflow relation for the streamgages (table 3). For Big Papillion Creek above the confluence, flows were calculated by subtracting the flow at the Little Papillion Creek at Ak-Sar-Ben at Omaha, Nebr. (USGS station 06610765) streamgage from the flow at Big Papillion Creek at Q Street at Omaha, Nebr. (USGS station 06610770) streamgage. If the calculation of the flow for Big Papillion Creek above the confluence resulted in a negative or unrealistic flow, a water-surface profile was not created for that scenario. The flood stage scenario combinations used to create water surface profiles and 63 inundation maps for the Ak-Sar-Ben reach are shown in figure 2.
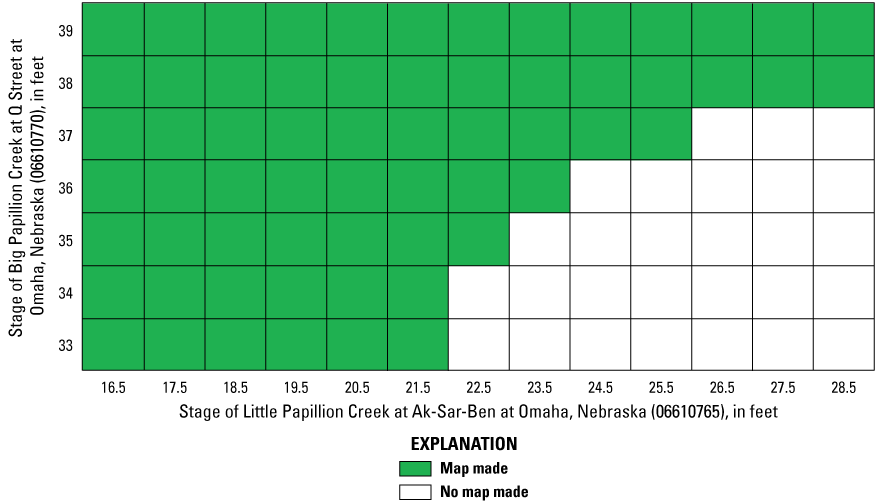
Flood-stage scenarios at Little Papillion Creek at Ak-Sar-Ben at Omaha, Nebraska (U.S. Geological Survey station 06610765) and at Big Papillion Creek at Q Street at Omaha, Nebraska (U.S. Geological Survey station 06610770) streamgages for which inundation maps were created (U.S. Geological Survey, 2023b).
Development of Flood-Inundation Maps
Flood-inundation maps for 14.8 mi of Little and Big Papillion Creeks in Omaha were created in a geographic information system by combining the water-surface profiles and DEM data. The DEM data were derived from the same lidar data described previously in the “Topographic Data” section and, therefore, have an estimated vertical accuracy of 2 ft (that is, plus or minus 1 ft). Estimated flood-inundation boundaries for each simulated water-surface profile were developed with HEC–RAS Mapper software (Brunner, 2016; U.S. Army Corps of Engineers, Hydrologic Engineering Center, 2019). Shapefile polygons and depth grids of the inundated areas for each profile were modified as needed in the ArcMap application of ArcGIS (Esri, 2023) to ensure a hydraulically reasonable transition of the flood boundaries between modeled cross sections.
Inundated areas that were detached from the main channel were examined to identify subsurface connections with the main stream, such as culverts. Where such connections existed, the mapped inundated areas were retained in their respective flood maps; otherwise, the erroneously delineated parts of the flood extent were deleted. The flood-inundation areas were overlaid on high-resolution, georeferenced, aerial photographs of the study area. Bridge surfaces are shown as noninundated up to the lowest flood stage that intersects the lowest structural chord of the bridge. In these latter circumstances, the bridge surface is depicted as being inundated. Estimates of water depth can be obtained from the depth-grid data that are included with the presentation of the flood maps on an interactive USGS mapping application described in the following section, “Flood-Inundation-Map Delivery.” The datasets (depth grids and shapefiles) used in this study are available as a USGS data release (Strauch, 2025).
Flood-Inundation-Map Delivery
A FIM Program website (U.S. Geological Survey, 2023a) has been established at https://www.usgs.gov/mission-areas/water-resources/science/flood-inundation-mapping-fim-program to make USGS flood-inundation study information available to the public. The website links to a mapping application called the “USGS FIM mapper” that provides map libraries and detailed information on flood extents and depths for modeled sites. The mapping application enables the production of customized FIMs from the map library for the Irvington and Ak-Sar-Ben reaches. A link on this website connects to the USGS National Water Information System database (U.S. Geological Survey, 2023b), which provides the current stage and streamflow at the Little Papillion Creek at Irvington, Nebr. (USGS station 06610750), Little Papillion Creek at Ak-Sar-Ben at Omaha, Nebr. (USGS station 06610765), and Big Papillion Creek at Q Street at Omaha, Nebr. (USGS station 06610770) streamgages to which the inundation maps are referenced. The estimated FIMs are shown in sufficient detail so that preparations for flooding and decisions for emergency response can be completed efficiently. Depending on the flood magnitude, roadways are shown as shaded (inundated and likely impassable) or not shaded (dry and passable) to facilitate emergency planning and use. Bridge surfaces are shown as noninundated up to the lowest flood stage that intersects the lowest structural chord of the bridge. A shaded building should not be interpreted to mean that the structure is completely submerged; rather, bare earth surfaces near the building are inundated. In these instances, the water depth (as indicated in the mapping application by holding the cursor over an inundated area) near the building would be an estimate of the water level inside the structure, unless flood-proofing measures had been implemented.
Disclaimer for Flood-Inundation Maps
The FIMs should not be used for navigation, regulatory, permitting, or other legal purposes. The USGS provides these maps “as is” for a quick reference emergency planning tool but assumes no legal liability or responsibility resulting from the use of this information.
Uncertainties and Limitations Regarding Use of Flood-Inundation Maps
Although the FIMs represent the boundaries of inundated areas with a distinct line, some uncertainty is associated with these maps. The flood boundaries shown were estimated based on water stages and streamflows at selected USGS streamgages. Water-surface elevations along the stream reaches were estimated by hydraulic modeling, assuming unobstructed flow, and using streamflows and hydrologic conditions anticipated at the USGS streamgage(s). The hydraulic model reflects the land-cover characteristics and any bridge, dam, levee, or other hydraulic structures existing as of April 2023. Unique meteorological factors (timing and distribution of precipitation) may cause actual streamflows along the model reach to vary from those assumed during a flood, which may lead to deviations in the water-surface elevations and inundation boundaries shown. Additional areas may be flooded because of unanticipated conditions such as changes in the streambed elevation or roughness, backwater into major tributaries along a main-stem river, or backwater from localized debris or ice jams. The accuracy of the floodwater extent portrayed on these maps will vary with the accuracy of the DEM used to simulate the land surface.
If this series of FIMs will be used in conjunction with NWS river forecasts, the user should be aware of additional uncertainties that may be inherent or factored into NWS forecast procedures. The NWS uses forecast models to estimate the quantity and timing of water flowing through selected stream reaches in the United States. These forecast models (1) estimate the amount of runoff generated by precipitation and snowmelt, (2) simulate the movement of floodwater as it proceeds downstream, and (3) predict the flow and stage (and water-surface elevation) for the stream at a given location (Advanced Hydrologic Prediction Service forecast point) throughout the forecast period (every 6 hours and 3–5 days out in many locations). For more information on Advanced Hydrologic Prediction Service forecasts, please refer to https://water.weather.gov/ahps/pcpn_and_river_forecasting.pdf.
A couple other sources of uncertainty relevant to the study reach are the levee system and the extension of ratings by the model. Breached levees can produce variable flood extents and water depths on the landward side of the levee. These areas of uncertainty are shown as a shaded green color on the flood-inundation mapping web application and depict what the flooding extents would be if there was no levee at all. No levee breach analysis was done as part of the study; levees were assumed to perform until overtopped. Another source is the extension of streamflow ratings beyond the observed and measured streamflows that are available. Although the guidelines and methods were followed for proper model extension, data to validate/verify/calibrate the model at these high flows are unavailable; therefore, the resulting maps at the uncalibrated flows have more uncertainty. Additional uncertainties and limitations pertinent to this study may be described elsewhere in this report.
Summary
Digital flood-inundation maps were developed for 14.8 miles (mi) of Little and Big Papillion Creeks in Omaha, Nebraska, by the U.S. Geological Survey (USGS) in cooperation with the Papio-Missouri River Natural Resource District. The flood-inundation maps, which can be accessed through the USGS Flood-Inundation Mapping Program website at https://www.usgs.gov/mission-areas/water-resources/science/flood-inundation-mapping-fim-program, depict estimates of the areal extent and depth of flooding corresponding to selected water levels (stages) at the Little Papillion Creek at Irvington, Nebr. (USGS station 06610750), Little Papillion Creek at Ak-Sar-Ben at Omaha, Nebr. (USGS station 06610765), and Big Papillion Creek at Q Street at Omaha, Nebr. (USGS station 06610770) streamgages. Near-real-time stages at these streamgages may be obtained from the USGS National Water Information System database at https://doi.org/10.5066/F7P55KJN or from the National Weather Service Advanced Hydrologic Prediction Service at https://water.weather.gov/ahps/.
The maps cover a total length of 14.8 mi starting from the Little Papillion Creek at Irvington, Nebr. (USGS station 06610750) streamgage and flowing about 3.8 mi downstream from the Big Papillion Creek at Q Street at Omaha, Nebr. (USGS station 06610770) streamgage and includes a 2.8-mi reach of Big Papillion Creek above the confluence of Big Papillion Creek with Little Papillion Creek. The 4-mi section of Little Papillion Creek, extending from the streamgage Little Papillion Creek at Irvington, Nebraska (USGS station 06610750) to 4 mi downstream, is referenced to that streamgage and is hereinafter referred to as the “Irvington reach.” The 8-mi section that encompasses Little and Big Papillion Creeks and their confluence and the 2.8-mi section that encompasses Big Papillion Creek above its confluence is herein referred to as the “Ak-Sar-Ben reach.” The Ak-Sar-Ben reach extends from 1.75 mi upstream from the Little Papillion Creek at Ak-Sar-Ben at Omaha, Nebr. (USGS station 06610765) streamgage to 3.8 mi downstream from the Big Papillion Creek at Q Street at Omaha, Nebr. (USGS station 06610770) and references both the streamgages.
The maps were developed using the U.S. Army Corps of Engineers Hydrologic Engineering Centers River Analysis System program to compute water-surface profiles and to delineate estimated flood-inundation areas and depths of flooding for selected stream stages. The Hydrologic Engineering Centers River Analysis System hydraulic models were calibrated by adjusting roughness coefficients to best represent the current (2022) stage-streamflow relation at the Little Papillion Creek at Irvington, Nebr. (USGS station 06610750), Little Papillion Creek at Ak-Sar-Ben at Omaha, Nebr. (USGS station 06610765), and Big Papillion Creek at Q Street at Omaha, Nebr. (USGS station 06610770) streamgages. The calibrated hydraulic model for the Irvington reach was used to generate water-surface profiles for a total of 11 flood stages at 1-foot (ft) intervals between 15 and 26 ft. The Ak-Sar-Ben reach hydraulic model was used to generate water-surface profiles for a total of 63 flood stage scenarios. The flood stage scenarios corresponded to a combination of stage data from the Little Papillion Creek at Ak-Sar-Ben at Omaha, Nebr. (USGS station 06610765) and Big Papillion Creek at Q Street at Omaha, Nebr. (USGS station 06610770) streamgages to represent the possible flood and backwater conditions from the confluence of Little and Big Papillion Creeks. Little Papillion Creek was represented by stage values in 1-ft stage intervals that ranged from 16.5 to 28.5 ft, as referenced to the local datum of the Little Papillion Creek at Ak-Sar-Ben at Omaha, Nebr. (USGS station 06610765) streamgage. Big Papillion Creek below the confluence was represented by stage values in 1-ft stage intervals that ranged from 33 to 39 ft, as referenced to the local datum of the Big Papillion Creek at Q Street at Omaha, Nebr. (USGS station 06610770) streamgage. For Big Papillion Creek above the confluence, flows were calculated by subtracting the flow at the Little Papillion Creek at Ak-Sar-Ben at Omaha, Nebr. (USGS station 06610765) streamgage from the flow at the Big Papillion Creek at Q Street at Omaha, Nebr. (USGS station 06610770) streamgage. If the calculation of the flow for the Big Papillion Creek above the confluence resulted in a negative or unrealistic flow, a water surface profile was not created for that scenario. The simulated water-surface profiles then were combined with a digital elevation model derived from light detection and ranging data using a geographic information system to delineate flood-inundation areas as shapefile polygons and depth grids for each profile. These flood-inundation polygons were overlaid on high-resolution, georeferenced aerial photographs of the study area.
Interactive use of the maps on the USGS Flood-Inundation Mapping application can give users a general indication of depth of water at any point by using the mouse cursor to click within the shaded areas. These maps, in conjunction with the real-time stage data from the USGS streamgages, can help to guide users in taking individual safety precautions and can provide emergency management personnel with a tool to manage emergency flood operations and post flood recovery efforts efficiently.
References Cited
Bales, J.D., Wagner, C.R., Tighe, K.C., and Terziotti, S., 2007, LiDAR-derived flood-inundation maps for real-time flood-mapping applications, Tar River basin, North Carolina: U.S. Geological Survey Scientific Investigations Report 2007–5032, 42 p., accessed April 9, 2024, at https://doi.org/10.3133/sir20075032.
Barnes, H.H., Jr., 1967, Roughness characteristics of natural channels: U.S. Geological Survey Water-Supply Paper 1849, 219 p. [Also available at https://doi.org/10.3133/wsp1849.]
Brunner, G.W., 2016, HEC–RAS river analysis system—Hydraulic reference manual (ver. 5.0, February 2016): Davis, Calif., U.S. Army Corps of Engineers, 538 p., accessed August 2023 at https://www.hec.usace.army.mil/software/hec-ras/documentation/HEC-RAS%205.0%20Reference%20Manual.pdf.
Center for Advanced Land Management Information Technologies, 2007, 2005 Nebraska land use patterns: University of Nebraska–Lincoln Institute of Agriculture and Natural Resources geospatial data, accessed April 18, 2023, at https://calmit.unl.edu/2005-nebraska-statewide.
Dewberry, 2012, National enhanced elevation assessment final report: Fairfax, Va., Dewberry, 84 p., accessed May 9, 2023, at https://www.dewberry.com/services/geospatial-mapping-and-survey/national-enhanced-elevation-assessment-final-report.
Dewitz, J., 2019, National Land Cover Database (NLCD) 2016 Products (ver. 3.0, November 2023): U.S. Geological Survey data release, accessed April 18, 2023, at https://doi.org/10.5066/P96HHBIE.
Esri, 2023, About ArcGIS (version 10.8): Esri web page, accessed April 18, 2023, at https://www.esri.com/en-us/arcgis/about-arcgis/overview.
National Centers for Environmental Information, 2023, U.S. climate normals: National Centers for Environmental Information National Oceanic and Atmospheric Administration, Data tools—1991–2020, accessed April 18, 2023, at https://www.ncdc.noaa.gov/cdo-web/datatools/normals.
National Weather Service, 2023a, Advanced Hydrologic Prediction Service—Little Papillion Creek near Irvington: National Oceanic and Atmospheric Administration digital data, accessed April 18, 2023, at https://water.weather.gov/ahps2/hydrograph.php?wfo=oax&gage=irvn1&prob_type=stage.
National Weather Service, 2023b, Advanced Hydrologic Prediction Service—Little Papillion Creek at Ak-Sar-Ben at Omaha: National Oceanic and Atmospheric Administration digital data, accessed April 18, 2023, at https://water.weather.gov/ahps2/hydrograph.php?wfo=oax&gage=omln1&prob_type=stage.
National Weather Service, 2023c, Advanced Hydrologic Prediction Service—Big Papillion Creek at Q Street at Omaha: National Oceanic and Atmospheric Administration digital data, accessed April 18, 2023, at https://water.weather.gov/ahps2/hydrograph.php?wfo=oax&gage=rabn1&prob_type=stage.
National Weather Service, 2023d, NWS high water level terminology: National Oceanic and Atmospheric Administration web page, accessed April 20, 2023, at https://www.weather.gov/aprfc/terminology.
Papio-Missouri River Natural Resources District, 2017, Papio-Missouri River Natural Resources District groundwater management plan (v. 1): Lincoln, Nebr., Olsson Associates, [variously paged], accessed April 18, 2023, at https://www.papionrd.org/wp-content/uploads/2018/03/180209-P-MRNRD-170724-Final_GMP_Vol-I-adopted_180208.pdf.
Papio-Missouri River Natural Resources District, 2023, It happened here before: Papio-Missouri River Natural Resources District, accessed April 18, 2023, at https://www.papionrd.org/flood-control/it-happened-here-before/.
Strauch, K.R., 2025, Flood inundation geospatial datasets for 14.8 miles of the Little and Big Papillion Creeks in Omaha, Nebraska, 2023: U.S. Geological Survey data release, https://doi.org/10.5066/P9OU7E42.
Strauch, K.R., and Hobza, C.M., 2023, Flood-inundation maps for an 8-mile reach of Papillion Creek near Offutt Air Force Base, Nebraska, 2022: U.S. Geological Survey Scientific Investigations Report 2023–5054, 12 p., accessed April 18, 2023, at https://doi.org/10.3133/sir20235054.
U.S. Army Corps of Engineers, 2023, National Levee Database: U.S. Army Corps of Engineers digital data, accessed April 19, 2023, at https://levees.sec.usace.army.mil/#/public-dashboard.
U.S. Army Corps of Engineers, Omaha District, Northwestern Division, 2021, Papillion Creek general reevaluation report: U.S. Army Corps of Engineers, accessed April 19, 2023, at https://www.nwo.usace.army.mil/Missions/Civil-Works/Planning/Planning-Projects/Papillion-GRR/.
U.S. Census Bureau, 2023, Quick facts—Washington, Sarpy, Saunders, Douglas, and Cass Counties: U.S. Census Bureau digital data, accessed April 18, 2023, at https://www.census.gov/quickfacts/fact/table/washingtoncountynebraska,sarpycountynebraska,saunderscountynebraska,douglascountynebraska,casscountynebra ska/PST045219.
U.S. Geological Survey, 2020, USGS one meter NE Eastern UA 2016: U.S. Geological Survey digital data, accessed April 19, 2023, at https://apps.nationalmap.gov/downloader/#/.
U.S. Geological Survey, 2023a, USGS Flood Inundation Mapping (FIM) Program: U.S. Geological Survey web page, accessed April 19, 2023, at https://www.usgs.gov/mission-areas/water-resources/science/flood-inundation-mapping-fim-program?qt-science_center_objects=0#qt-science_center_objects.
U.S. Geological Survey, 2023b, USGS water data for the Nation: U.S. Geological Survey National Water Information System database, accessed April 18, 2023, at https://doi.org/10.5066/F7P55KJN.
Conversion Factors
U.S. customary units to International System of Units
Temperature in degrees Fahrenheit (°F) may be converted to degrees Celsius (°C) as follows:
°C = (°F – 32) / 1.8.
Datums
Vertical coordinate information is referenced to (1) stage, the height above an arbitrary datum established at a streamgage, and (2) elevation, the height above the North American Vertical Datum of 1988 (NAVD 88).
Horizontal coordinate information is referenced to the North American Datum of 1983 (NAD 83).
Abbreviations
DEM
digital elevation model
FIM
flood-inundation map
FIS
Flood Insurance Study
HEC–RAS
Hydrologic Engineering Center–River Analysis System
lidar
light detection and ranging
n value
Manning’s roughness coefficient
NWS
National Weather Service
RMSE
root mean square error
USACE
U.S. Army Corps of Engineers
USGS
U.S. Geological Survey
For more information about this publication, contact:
Director, USGS Nebraska Water Science Center
5231 South 19th Street
Lincoln, NE 68512
402–328–4100
For additional information, visit: https://www.usgs.gov/centers/ne-water
Publishing support provided by the
Rolla and Lafayette Publishing Service Centers
Disclaimers
Any use of trade, firm, or product names is for descriptive purposes only and does not imply endorsement by the U.S. Government.
Although this information product, for the most part, is in the public domain, it also may contain copyrighted materials as noted in the text. Permission to reproduce copyrighted items must be secured from the copyright owner.
Suggested Citation
Strauch, K.R., and Hoefer, B.R., 2025, Flood-inundation maps for 14.8 miles of Little and Big Papillion Creeks in Omaha, Nebraska, 2023: U.S. Geological Survey Scientific Investigations Report 2025–5032, 14 p., https://doi.org/10.3133/sir20255032.
ISSN: 2328-0328 (online)
Study Area
| Publication type | Report |
|---|---|
| Publication Subtype | USGS Numbered Series |
| Title | Flood-inundation maps for 14.8 miles of Little and Big Papillion Creeks in Omaha, Nebraska, 2023 |
| Series title | Scientific Investigations Report |
| Series number | 2025-5032 |
| DOI | 10.3133/sir20255032 |
| Publication Date | May 21, 2025 |
| Year Published | 2025 |
| Language | English |
| Publisher | U.S. Geological Survey |
| Publisher location | Reston, VA |
| Contributing office(s) | Nebraska Water Science Center |
| Description | Report: vi, 14 p.; Data Release; Dataset |
| Country | United States |
| State | Nebraska |
| City | Omaha |
| Other Geospatial | Little and Big Papillion Creeks |
| Online Only (Y/N) | Y |
| Additional Online Files (Y/N) | N |