

Spatial Patterns and Temporal Trends in Water Quality in Idaho’s Lower Boise River and its Tributaries, 1994–2023
Links
- Document: Report (7 MB pdf) , HTML , XML
- Data Release: USGS data release - Water quality concentrations and discharge in the lower Boise River and select tributaries, southwestern Idaho, 1994–2023
- NGMDB Index Page: National Geologic Map Database Index Page (html)
- Download citation as: RIS | Dublin Core
Acknowledgments
This work was conducted with financial support from the City of Boise, the Idaho Department of Environmental Quality, and the Lower Boise Watershed Council. We thank the many people who have contributed to this study since 1994, including Alexandra Etheridge, Rhonda Fosness, Mark Hardy, Dorene MacCoy, Daniel Murray, Alvin Saablan, Molly Wood, Alysa Yoder, and Lauren Zinsser. We also thank Natalie Day and Bob Hirsch for consultation on analytical methods, and Alexandra Etheridge and Steve Kalkhoff for peer review.
Abstract
The lower Boise River in southwestern Idaho is a vital cultural, economic, and ecological resource, but some of its beneficial uses are impaired by excess algae, sediment, nutrients, and bacteria. In response, a variety of water quality improvement projects and regulations have been implemented in recent decades. A recent study showed that, from water years 2003 to 2021, concentrations of total phosphorus at the mouth of the Boise River near Parma decreased by 60 percent, indicating the success of the improvement projects and progress towards reaching the regulatory target. However, although the progress of the system as a whole towards reaching the total phosphorus target is well documented, quantifying contributions and trends in total phosphorus loading from individual tributaries and upstream mainstem locations is needed. Similarly, tributary contributions and trends of other constituents of concern are unknown or have not been evaluated in a decade. To evaluate the success of past water-quality improvement efforts and help prioritize future investments, this study characterized spatial and seasonal patterns in concentrations and loads of suspended sediment, total phosphorus, orthophosphate, total nitrogen, nitrate plus nitrite, Escherichia coli bacteria, and periphyton chlorophyll a (chl-a) at three mainstem and seven tributary sites of the lower Boise River during water years 2019–2023. For sites and constituents with adequate data, temporal trends over a 15-year and 30-year period were also evaluated.
Recent (in other words, water years 2019–2023) concentrations and loads of suspended sediment and total phosphorus were typically greatest during the irrigation season and often exceeded total maximum daily load targets. However, concentrations and loads of suspended sediment, total phosphorus, and orthophosphate have decreased over the past 15 to 30 years at many sites. In contrast, concentrations of total nitrogen and nitrate plus nitrite showed increasing trends at the Boise River near Parma, likely reflecting the effects of regional changes in agricultural practices in recent decades. Periphyton chl-a concentrations during October–November were highly likely increasing over the 30-year period at Boise River at Eckert, but were uncertain at Middleton and Parma. At Boise River at Middleton, periphyton chl-a concentrations exceeded the total maximum daily load target of 150 milligrams per square meter in 75 percent of samples during water years 2019–2023. Results therefore demonstrate that past watershed improvement efforts have been largely effective at reducing concentrations and loads of suspended sediment, total phosphorus, and orthophosphate in the lower Boise River watershed, but different strategies may be needed to reduce concentrations and loads of total nitrogen, nitrate plus nitrite, Escherichia coli, and periphyton chl-a.
Introduction
The lower Boise River is a cultural, economic, and ecologically vital resource in southwestern Idaho. The river provides fish and wildlife habitat and is used for boating, fishing, swimming, and, along its banks, hiking and cycling. Through a complex network of diversions and canals, the river also provides irrigation water for agriculture that is an important contributor to the local economy. However, from Middleton to the confluence with the Snake River, some of the beneficial uses of the lower Boise River are impaired by excess nutrients, suspended sediment, and fecal-associated bacteria (Idaho Department of Environmental Quality, 2015a, 2015b). High nutrient concentrations contribute to nuisance algae growth, impairing habitat for cold-water aquatic life and salmonid spawning, reducing diversity of macroinvertebrate community composition, and negatively impacting dissolved oxygen concentrations and pH (Idaho Department of Environmental Quality, 2015b). Excess algae also harm aesthetics and reduce recreational activities such as swimming, fishing, and boating. High concentrations of suspended sediment (SSC) degrade fish spawning habitat and can cause fish feeding and gill problems, reduced growth rates, and population decline (Idaho Department of Environmental Quality, 2015a). Suspended sediment also transports other contaminants, including nutrients, metals, pesticides, and bacteria (Mahler and others, 2000; Etheridge and others, 2014; Didoné and others, 2021; Baldwin and others, 2024). Bacteria and viruses associated with human or animal waste, such as the bacterium Escherichia coli (E. coli), can cause illness in recreational users. Sources of nutrients, SSC, and bacteria to the lower Boise River include tributaries, stormwater, agriculture, wastewater treatment discharges, industrial point source discharges, groundwater, and background contributions from upstream from Lucky Peak Reservoir (Etheridge, 2013; Etheridge and others, 2014; Idaho Department of Environmental Quality, 2015a, 2015b).
For decades, regulatory efforts have sought to restore the beneficial uses of the lower Boise River, as well as the Snake River downstream (Idaho Department of Environmental Quality, 1999; Idaho Department of Environmental Quality and Oregon Department of Environmental Quality, 2004). Most recently, in 2015, total maximum daily loads (TMDLs) of total phosphorus (TP), periphyton chlorophyll a (chl-a), SSC, and E. coli were established or revised from previous TMDLs (Idaho Department of Environmental Quality, 2015a, 2015b). The TMDL target for TP was set at less than or equal to (≤) 0.07 milligrams per liter (mg/L) at the Boise River near Parma and its tributaries during the May 1–September 30 irrigation season (Idaho Department of Environmental Quality, 2015b). The TMDL target for mean monthly periphyton chl-a was set at ≤150 milligrams per square meter (mg/m2) in the Boise River from Middleton to the mouth (Idaho Department of Environmental Quality, 2015b). Sediment TMDL targets in the main stem of the lower Boise River were established at 50 mg/L SSC for ≤60 days, or 80 mg/L SSC for ≤14 days (Idaho Department of Environmental Quality, 1999). Sediment TMDLs were also established for select tributaries, including Fifteenmile Creek (mean of 23 mg/L SSC for greater than or equal to [≥] 84 days) and Sand Hollow, Mason, and Indian Creeks (mean of 20 mg/L SSC for ≥4 months; Idaho Department of Environmental Quality, 2015a). The TMDL criterion for E. coli was based on a geometric mean of 126 E. coli organisms per 100 milliliters (mL), calculated from a minimum of 5 samples taken every 3–7 days over a 30-day period (Idaho Department of Environmental Quality, 2015a). The requirement to calculate the geometric mean is triggered by a single sample concentration exceeding 406 E. coli organisms per 100 mL in waters designated as primary contact recreation (including Dixie Slough and the lower Boise River), or 576 E. coli organisms per 100 mL in waters designated as secondary contact recreation (including Indian Creek, Mason Creek, Fifteenmile Creek, and Sand Hollow Creek; Idaho Department of Environmental Quality, 2014, 2015a).
To reach the target concentrations identified in these TMDLs, a variety of improvement projects have been implemented in the basin over the past 15 years, including the creation of the Dixie Drain Phosphorus Removal Facility on Dixie Slough, the diversion of Indian Creek to the Riverside Canal during the irrigation season, upgrades to wastewater treatment plants, and increasing adoption of agricultural best-management practices including conversions from flood irrigation to sprinklers and the use of no-till drills in planting. The efficacy of these improvement efforts was recently highlighted by King and Yoder (2025), who used long-term, high-frequency monitoring at the Boise River near Parma (USGS site 13213000; U.S. Geological Survey, 2024)—near the confluence with the Snake River—to document a 60-percent decrease in TP concentrations and loads from water years 2003–2021. However, recent contributions and long-term trends in total phosphorus from upstream mainstem locations and individual tributaries are not well understood. Similarly, tributary contributions and trends of other constituents of concern are unknown or have not been evaluated since 2011–13 (Etheridge, 2013; Etheridge and others, 2014), prior to the implementation of the 2015 TMDLs and several major improvement projects. An updated understanding of recent patterns in tributary concentrations and loads can help gauge the effectiveness of the TMDLs and past improvement projects and help prioritize future improvement efforts.
In this report, we examine the spatial and temporal patterns in water quality for seven tributaries and three mainstem locations in the lower Boise watershed (fig. 1; table 1). Constituents evaluated include SSC, TP, OP (orthophosphate [as phosphorus]), total nitrogen (TN), nitrate plus nitrite (as nitrogen), E. coli bacteria, and periphyton chl-a (table 2). We describe the spatial and seasonal patterns in concentrations and loads of these constituents in recent years (water years 2019–2023) to understand the relative importance of different tributaries during the irrigation (May 1 through September 30) and non-irrigation (October 1 through April 30) seasons. The percentages of TP as OP, and TN as nitrate plus nitrite, are presented to help understand the importance of different sources in different seasons. For sites and constituents with sufficient data, we also present trends in constituent concentrations over the past 15 and 30 years (water years 2008–2023 and 1994–2023) to help evaluate the effectiveness of past watershed improvement projects.
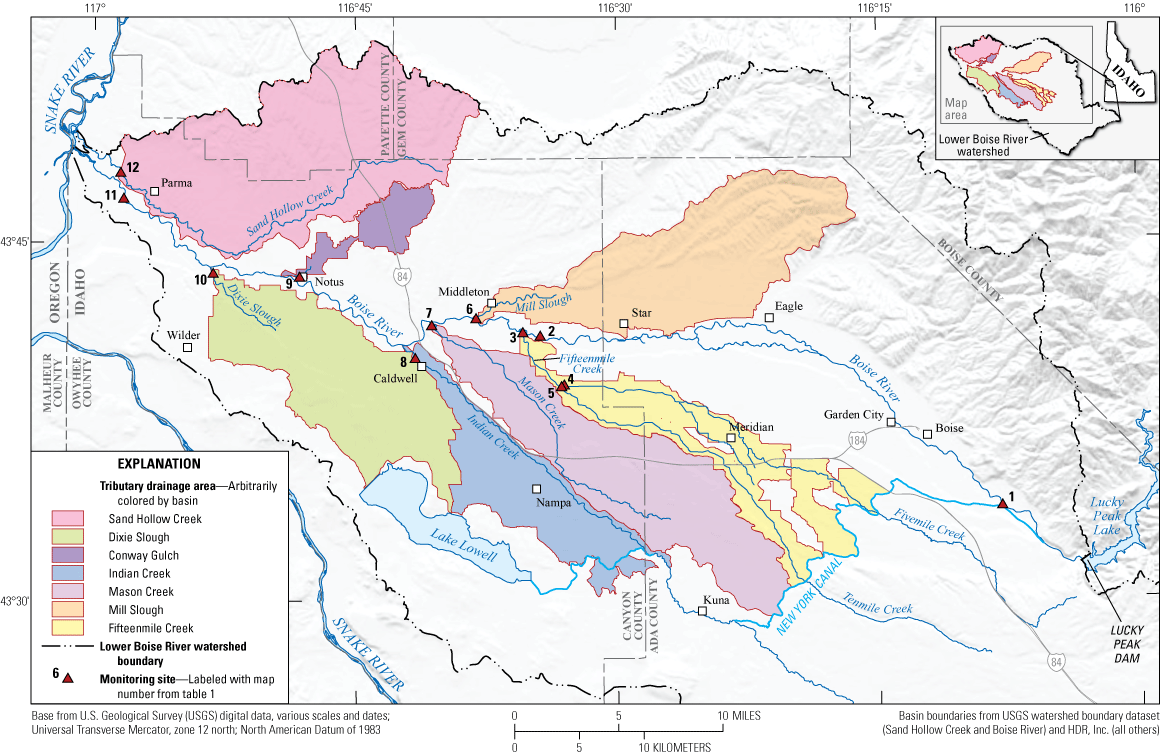
Monitoring locations in the lower Boise River watershed, Idaho.
Table 1.
Monitoring locations and constituents examined for recent spatial and seasonal patterns and long-term trends in the lower Boise River watershed, Idaho (U.S. Geological Survey, 2024).[Abbreviations: USGS, U.S. Geological Survey; SSC, suspended-sediment concentration; TP, total phosphorus; OP, orthophosphate as phosphorus; TN, total nitrogen; NO3+NO2, nitrate plus nitrite as nitrogen; E. coli, Escherichia coli bacteria; chl-a, chlorophyll a; X, evaluated; --, no data given]
| USGS site number | Map number (fig. 1) | Site name | Constituent | ||||||
|---|---|---|---|---|---|---|---|---|---|
| SSC | TP | OP | TN | NO3+NO2 | E. coli | Periphyton chl-a | |||
| 13203760 | 1 | Boise River at Eckert | X | X | X | X | X | X | X |
| 13210050 | 2 | Boise River at Middleton | X | X | X | X | X | X | X |
| 13210815 | 3 | Fifteenmile Creek | X | X | X | -- | -- | -- | -- |
| 13210795 | 4 | Fivemile Creek | X* | X* | X* | -- | -- | -- | -- |
| 13210660 | 5 | Tenmile Creek | X* | X* | X* | -- | -- | -- | -- |
| 132108247 | 6 | Mill Slough | X | X | X | -- | -- | -- | -- |
| 13210980 | 7 | Mason Creek | X | X | X | -- | -- | -- | -- |
| 13211441 | 8 | Indian Creek | X | X | X | -- | -- | -- | -- |
| 13212550 | 9 | Conway Gulch | X | X | X | -- | -- | -- | -- |
| 13212890 | 10 | Dixie Slough | X | X | X | -- | -- | -- | -- |
| 13213000 | 11 | Boise River near Parma | X | X | X | X | X | X | X |
| 13213072 | 12 | Sand Hollow Creek | X* | X* | X* | -- | -- | -- | -- |
Table 2.
Constituents sampled in the lower Boise River, Idaho, and their laboratory reporting limits, 1994–2023.[Abbreviation: mg/L, milligrams per liter; MPN/100 mL; mg/m2; <, less than]
Purpose and Scope
This report provides a status update on water quality in the lower Boise River watershed in southwest Idaho. Numerous water quality improvement projects and TMDLs have been implemented since the previous watershed assessment in 2009–2012 by Etheridge and others (2014). This update is needed to provide information for the evaluation of the effectiveness of these improvement projects and help watershed managers prioritize sites and constituents to maximize returns on future water-quality improvement efforts. We present constituent concentrations and loads from 29 synoptic sampling events of select tributaries and the mainstem Boise River during the irrigation and non-irrigation seasons in water years 2019–2023. For constituents and sites with adequate data, we also assess trends in concentrations and loads over a 15–30-year period. The sampled tributaries were Fifteenmile Creek, Mill Slough, Mason Creek, Indian Creek, Dixie Slough, Conway Gulch, and Sand Hollow Creek (a tributary to the Snake River). Mainstem Boise River sites were located at Eckert Road (upstream from Boise), near Middleton, and near Parma. Fivemile Creek and Tenmile Creek, the two main tributaries to Fifteenmile Creek, were also sampled. All sites were sampled for SSC, TP, and OP, and Boise River sites were also sampled for TN, nitrate plus nitrite, E. coli, and periphyton chl-a (table 1). All years are water years (October 1—September 30) unless specified otherwise.
Description of Study Area
The lower Boise River watershed and the monitoring locations in the current study were described in detail by Etheridge (2013) and Etheridge and others (2014) and are briefly described here. The lower Boise River extends 103 kilometers (km) from the outflow of Lucky Peak Dam to the confluence with the Snake River. Along this reach, the river flows through the cities of Boise, Garden City, Eagle, Star, Middleton, Caldwell, Notus, and Parma, Idaho. We collected samples at three mainstem locations spanning most of the length of the lower Boise River. From upstream to downstream, these were the Boise River at Eckert Road (U.S. Geological Survey [USGS] site 13203760), the Boise River at Middleton (USGS site 13210050), and the Boise River near Parma (USGS site 13213000; fig. 1; table 1; U.S. Geological Survey, 2024). The Boise River at Eckert is located upstream from most urban and agricultural influences and is considered relatively pristine (Etheridge and others, 2014). Between Eckert and Middleton, urbanization increases and the Boise River receives effluent from the City of Boise’s Lander and West Boise wastewater treatment plants. No major tributaries enter the Boise River between Eckert and Middleton, but water is withdrawn via several large diversions, reducing the streamflow in this reach during the summer irrigation season. Downstream from Middleton, several major tributaries enter the Boise River, including, from upstream to downstream, Fifteenmile Creek, Mill Slough, Mason Creek, Indian Creek, Conway Gulch, and Dixie Slough (fig. 1; table 1). These tributaries drain large areas of agricultural land and, in some cases, receive municipal wastewater effluent (for example, Indian Creek, Mill Slough, Conway Gulch, and Fifteenmile Creek via its tributary Fivemile Creek), and have previously been identified as important sources of sediment and nutrients to the lower Boise River (Etheridge, 2013; Etheridge and others, 2014). The Boise River near Parma, near the confluence with the Snake River, is located downstream from these major tributaries and therefore represents the mix of agricultural and urban influences in the watershed. Samples were also collected at Sand Hollow Creek, which receives wastewater from the City of Parma. Although Sand Hollow Creek discharges to the Snake River, it is generally considered to be part of the lower Boise River system and is included in the lower Boise River TMDL (Idaho Department of Environmental Quality, 2015a).
Datasets
Sample Collection and Analysis
Sites were sampled six times per year from 2018 to 2023 (five in 2022), targeting a range of hydrologic and management conditions including high and low flows during the irrigation and non-irrigation seasons, and the spring “freshet,” or first flush. In 1994–2017, samples were collected on less regular frequencies which varied over time and by site and constituent. At Boise River near Parma, TP samples were collected at high frequency (as often as every 2 days) starting in 2004 and continuing through 2023 as part of a related study in partnership with the City of Boise (King and Yoder, 2025).
All samples were collected and processed following the U.S. Geological Survey (USGS) National Field Manual (U.S. Geological Survey, variously dated) and previous lower Boise studies (Etheridge, 2013; Etheridge and others, 2014). Water samples were collected using the equal-width increment method where possible, and multiple vertical samples or grab samples were collected in cases where wading was not possible or where velocities were too slow. Water samples were collected using a 1-liter high-density polyethylene bottle with a depth-integrating sediment and water-quality sampler (model DH-81, DH-95, or D-95, depending on conditions) and homogenized in a plastic churn. Water samples from Dixie Slough were collected by the City of Boise using similar methods. Most of the high-frequency TP samples at the Boise River near Parma were collected using an automated refrigerated sampler (Teledyne ISCO, Lincoln, Nebraska) from the riverbank. Samples from the automated sampler were compared against 25 concurrent samples collected using the equal-width increment method during varying hydrologic conditions. The median relative percent difference between TP concentrations collected using the two different methods was 1.7 percent, confirming that samples collected using the autosampler were representative of the whole-channel conditions (King and Yoder, 2025). Periphyton chl-a samples were collected three times per year (October, February, and August) at the three mainstem Boise River sites following methods described by Moulton and others (2002). Scrapings from 11 submerged rocks were composited, then a subsample of known volume was filtered through a 0.7-micrometer (µm; nominal) glass fiber filter. Filters were wrapped in aluminum foil and frozen. Field replicates and blanks of each constituent were collected throughout the study to ensure data quality. Results are summarized in appendix table 1.1 and appendix figure 1.1.
Water samples were analyzed for SSC, TP, and OP, and samples from the mainstem Boise River sites were also analyzed for TN, nitrate plus nitrite, and E. coli. For SSC, unfiltered water was shipped to the USGS Cascade Volcano Observatory (Vancouver, Washington) and analyzed using methods described in Guy (1969). For TP and TN, unfiltered water was preserved with sulfuric acid, chilled at 4 degrees Celsius (°C), shipped to the USGS National Water Quality Monitoring Laboratory (NWQL; Denver, Colorado), and analyzed using methods described in Fishman (1993) and Patton and Kryskalla (2003). For E. coli, unfiltered water was chilled at 4 °C and analyzed within 24 hours at the Idaho Department of Health and Welfare Laboratory (Boise, Idaho) using standard method number 9223B (Eaton and others, 1999). Water samples for dissolved nutrients (OP and nitrate plus nitrite) were filtered through a 0.45-µm capsule filter, chilled at 4 °C, and analyzed at NWQL using methods described in Fishman (1993) and Patton and Kryskalla (2011). Periphyton chl-a samples were analyzed within 1 week of collection by the Bureau of Reclamation Pacific Northwest Regional Laboratory (Boise, Idaho) using standard spectrophotometric method number 10200H (Eaton and others, 1999). All sample results are published in Baldwin and King (2025).
Discharge
Mean daily discharge records and their sources are provided in Baldwin and King (2025). Briefly, discharge records were from USGS stream gages (table 1; U.S. Geological Survey, 2024) except at the following sites. Mill Slough discharge was calculated as the sum of discharges from the North and South Middleton Drains (USGS stream gages 13210842 and 13210831, respectively; U.S. Geological Survey, 2024). Boise River at Middleton discharge was provided by the Bureau of Reclamation (Bureau of Reclamation, 2024). Discharge for Boise River at Eckert was calculated from water rights accounting records provided by the Idaho Department of Water Resources by subtracting the discharges in the New York Canal, Penitentiary Canal, and Ridenbaugh Canal from the discharge from Lucky Peak Dam (Bureau of Reclamation, 2024; Idaho Department of Water Resources, 2024).
Discharge at Fivemile and Tenmile Creeks—tributaries to Fifteenmile Creek—were measured following USGS standard methods (Turnipseed and Sauer, 2010). For dates when discharge measurements were not collected at these sites, flow was approximated with linear regressions between discharge at these sites and discharge at the Fifteenmile Creek streamgage. There were 23 and 24 discrete discharge observations at Fivemile and Tenmile Creeks, respectively, and both regressions had adjusted R-squared values of 0.7 or higher. Diversions and return flows between these sites and the streamgage at Fifteenmile Creek are thought to be the primary sources of variability in these relations.
Indian Creek discharge records varied by season. During winter months (mid-October–mid-April), Indian Creek briefly flows through a section of the Riverside Canal, which is otherwise dry during winter, before flowing into the Boise River near Caldwell. During this period, the Indian Creek discharge to the Boise River was provided by an Idaho Power Company streamgage in Caldwell, upstream from the Indian Creek–Riverside Canal confluence (Idaho Power Company, 2022). During summer months (mid-April–mid-October), Riverside Canal is flowing and therefore mixes with Indian Creek at their confluence. To reduce nutrient loads to the Boise River during the irrigation season, most of Riverside Canal downstream from the Indian Creek confluence is conveyed to irrigated lands west and south of Caldwell, rather than discharging directly into the Boise River. Some of this water does eventually discharge to the Boise River, but further downstream, through Dixie Slough (Etheridge and others, 2014) and through shallow groundwater return flows in the winter (Etheridge, 2013). There were some cases in the mid-April–mid-October period when flow in Riverside Canal downstream from the Indian Creek confluence was spilled to the Boise River via Indian Creek. The proportion of spill from Riverside Canal to the Boise River in the summer that came from Indian Creek was assumed to be proportional to the contribution of Indian Creek to Riverside Canal downstream from their confluence. For example, if 20 percent of the discharge in Riverside Canal came from Indian Creek, then 20 percent of the spill from Riverside Canal to the Boise River was assumed to come from Indian Creek (Idaho Power, written commun., 2023).
Data Analysis
This report focuses on two primary analyses: recent spatial and seasonal patterns in constituent concentrations and loads, and trends over the longer term. All analyses were done using R software (R Core Team, 2024). In all analyses, the irrigation season is defined as May 1 through September 30, and the non-irrigation season is October 1 through April 30.
Recent Spatial and Seasonal Patterns
Recent spatial and seasonal patterns in constituent concentrations and loads were evaluated using data from 29 synoptic sampling events during the 5-year period from water year 2019–2023. Measured concentrations and daily discharge data were used to estimate concentrations and loads for each day of the 5-year period using the composite method in the R package loadflex (Appling and others, 2015). The composite method uses measured values when available, and estimates values for days between measured values using a combination of regression and interpolation (Aulenbach and Hooper, 2006). The regression models used in the composite method were based on LOADEST model number 7, which includes predictor variables for streamflow and season (Runkel and others, 2004; Lorenz and others, 2015). Loads are reported as mass per day (SSC, TP, OP, TN, nitrate plus nitrite) or most probable number per day (E. coli). Loads were not calculated for periphyton chl-a, as it is generally not a constituent that is transported in streamflow. To help highlight the importance of individual sites relative to others, loads are also presented as percentages of the total inflow load, where the total inflow load is the sum of loads from all monitored sites upstream from the Boise River near Parma (in other words, the Boise River at Middleton, Fifteenmile Creek, Mill Slough, Mason Creek, Indian Creek, Conway Gulch, and Dixie Slough). Comparing this total inflow load to the load at Boise River near Parma (the outflow) provided insights into the presence of unmeasured sources (tributaries, drains, groundwater seeps) or sinks (deposition/storage, biological uptake, loss to groundwater) between Middleton and Parma.
The percentages of TP as OP, and TN as nitrate plus nitrite, were calculated from measured values to help understand the importance of different sources in different seasons. Orthophosphate and nitrate are naturally occurring but environmental concentrations increase with the use of agricultural chemical fertilizers, manure, and composted organic materials, as well as from leaking septic systems and inadequately-treated wastewater (U.S. Geological Survey, 1999; Wakida and Lerner, 2005; Kim and others, 2015; Kent and others, 2020). Orthophosphate and nitrate readily leach into and are transported by shallow groundwater, creating an important source pathway to surface waters (U.S. Geological Survey, 1999; Domagalski and Johnson, 2012). In contrast, particulate phosphorus and nitrogen are typically mobilized by erosion and transported in surface waters. The percentages of TP as OP, and TN as nitrate plus nitrite, can therefore indicate the relative contributions from groundwater versus surface water.
For sites and constituents with concentrations below the reporting limit (left-censored concentrations; table 3), mean concentrations were estimated using regression on order statistics using the ros function in the NADA package in R (Lee, 2020). At the Boise River at Eckert, where some concentrations were left-censored (table 3), loads were estimated by substituting left-censored concentrations with the reporting-limit concentration. These estimates therefore represent the maximum possible loads coming into the lower Boise River and provide a baseline for comparison to sites downstream. Because some concentrations at Eckert were slightly lower than the reporting limit, the actual loads were likely slightly lower than our load estimates, and therefore load increases from Eckert to Middleton are likely slightly greater than the estimates presented here.
Table 3.
Percentages of samples with concentrations below their laboratory reporting limits.[Abbreviations: SSC, suspended-sediment concentration; TP, total phosphorus; OP, orthophosphate as phosphorus; TN, total nitrogen; NO3+NO2, nitrate plus nitrite as nitrogen; E. coli, Escherichia coli bacteria; chl-a, chlorophyll a; --, not evaluated]
Temporal Trends
Temporal trends in measured concentrations were evaluated for the 30-year period from 1994–2023 for SSC, TP, OP, TN, nitrate plus nitrite, and periphyton chl-a; and from 1999 to 2023 for E. coli. The starting years were selected based on the beginning of regular monitoring across all sites, with at least one sample collected in each season (irrigation and non-irrigation seasons). Trends in periphyton chl-a concentrations were limited to samples collected in October–November because 64 percent of all samples were collected during those 2 months, and data in other months were lacking, especially in the early part of the record. At mainstem Boise River sites, trends were also evaluated for measured concentrations during the 15-year period from 2009 to 2023. Many watershed improvements occurred during this more recent period, and the resulting water-quality trends were not always well-represented by a monotonic trend analysis over 30 years. Trends were not evaluated for 2009–2023 at tributary sites because of inadequate data during the first half of that period.
Temporal trends in concentrations were evaluated using a Mann-Kendall Theil-Sen approach following Helsel and others (2020). This approach accommodated several constraints of our data, including (1) left-censored concentrations for some sites and constituents, especially at the Boise River at Eckert (table 3); (2) irregular sampling frequencies, with some sites and constituents having periods of frequent sampling (in other words, multiple samples per season) intermixed with gaps of multiple years; (3) correlations between discharge and the concentrations of some constituents; and (4) discharge data limited to discrete measurements on sampling dates for some sites during some periods. The potential effect of discharge on concentrations was removed (Helsel and others, 2020) by fitting a shrinkage cubic regression spline to the relation between the natural log (ln) of discharges and the natural log of measured concentrations to get the ln(concentration) residuals using the centrend function in the NADA2 package (Julian and Helsel, 2021). To minimize the potential weighting of the higher-frequency sampling periods, we then simplified the dataset to the annual medians of the ln(concentration) residuals (Helsel and others, 2020). Years with no samples were left as gaps. To evaluate trends specifically within the irrigation and non-irrigation seasons, we also created datasets of the median ln(concentration) residuals for each season of each water year. Trends over time in the annual median ln(concentration) residuals were then evaluated using the non-parametric Mann-Kendall trend test and Theil-Sen slope estimator (Theil, 1950; Sen, 1968). The Mann-Kendall and Theil-Sen tests were done using the rkt function in the rkt package in R (Marchetto, 2024), which allows for gaps in time-series data. For a subset of sites and constituents, linear (untransformed) concentrations were used instead of ln(concentrations) for better model fit; these were TP at Fifteenmile Creek and Boise River near Parma, OP at Fifteenmile Creek, and TN at Boise River at Eckert. For trends in periphyton chl-a concentrations, a modified approach was used because periphyton chl-a was sampled from rock surfaces, and concentrations were assumed to be independent of discharge (although changes in water depth or velocity could affect periphyton growth by altering light penetration). The potential effect of discharge on concentrations was therefore not removed, and instead trends in periphyton chl-a concentrations were evaluated on the measured concentrations themselves. Trends were not evaluated for several constituents at Boise River at Eckert (TP, OP, nitrate plus nitrite, E. coli) because high rates of left-censored data at that site (greater than [>] 20 percent; table 3) yielded unreliable trend results.
Temporal trends in measured loads were evaluated using a similar approach, with some modifications. Because loads are determined by discharge, the potential effect of discharge on loads was not removed. Instead, trends were evaluated on the annual or seasonal medians of the natural logs of instantaneous loads using the Mann-Kendall and Akritas-Theil-Sen tests using the ATS function in the NADA2 package in R (Julian and Helsel, 2021). In cases where the annual median load was calculated using a left-censored concentration value, the load was considered to be left-censored and was input as such in the trend test. Trends in loads may be driven by changes in either concentration or discharge, or both. To help differentiate these drivers, we also evaluated temporal trends in discharge values on days when samples were collected. Trends in discharge were evaluated using the same approach as trends in loads. Results of this analysis are meant to help understand trends in loads, but because discharge data were limited to sampling dates, the reported trends in discharge may not represent actual changes in discharge over time.
The uncertainty of trend results is presented along a spectrum of likelihood rather than a single binary threshold (Hirsch and others, 2015; Wasserstein and others, 2019; Day, 2021). Trend results with p-values less than (<) 0.05 were considered “highly likely”; p-values 0.05 to <0.10 were considered “likely”; and p-values ≥0.10 were considered “uncertain.” For models using ln(concentration) and ln(load), the percent change in concentrations or loads per year was calculated using equation 1, and the percent change over the entire trend analysis period was calculated using equation 2:
whereslope
is the Thiel-Sen slope in natural log units, and
n years
is the number of years in the analysis period (Helsel and others, 2020).
Slopes were converted to linear units (for example, milligrams per liter per year) using equation 3 (Helsel and others, 2020):
wheremedian concentration or load is in linear units
and
for left-censored datasets
estimated using the ros function in the NADA package in R (Lee, 2020).
For models using untransformed concentrations, the percent change in concentration per year was estimated using equation 4:
wherestartmean and endmean are the means of the annual median concentrations during the first 5 water years of the analysis period (startmean)
and
the last 5 water years of the analysis period (endmean).
Five-year means were used to reduce the potential effect of an unusually high or low year on the percent change calculation.
Results and Discussion
All measured constituent concentrations and discharge values from this study are available online (Baldwin and King, 2025). The following sections present recent spatial and seasonal patterns in sample results from 2019 to 2023, and long-term trends in sample results from 1994 to 2023.
Recent Spatial and Seasonal Patterns
Measured concentrations and corresponding discharges used in the evaluation of recent (2019–2023) spatial and seasonal patterns are plotted in figures 2 and 3, and shown relative to TMDL thresholds in figure 4. Concentration summaries in the following section are based on these measured values. Daily concentrations during the 2019–2023 period, estimated using the composite model, are shown relative to measured concentrations in figure 5. Daily estimated loads relative to measured loads are shown in figure 6.
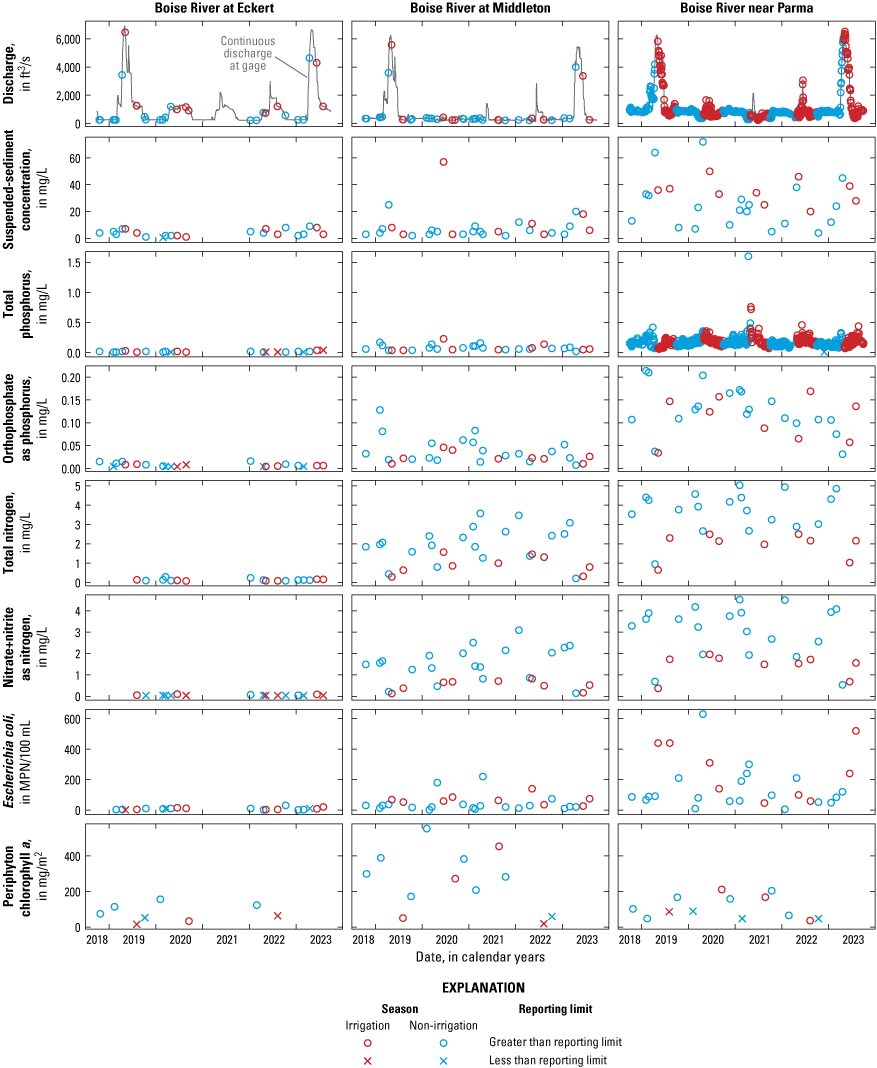
Measured constituent concentrations and corresponding discharges used in the analysis of recent spatial and seasonal patterns at mainstem Boise River sites, Idaho, water years 2019–2023. [ft3/s, cubic feet per second; mg/L, milligrams per liter; MPN/100 mL, most probable number per 100 milliliters; mg/m2, milligrams per meter squared]
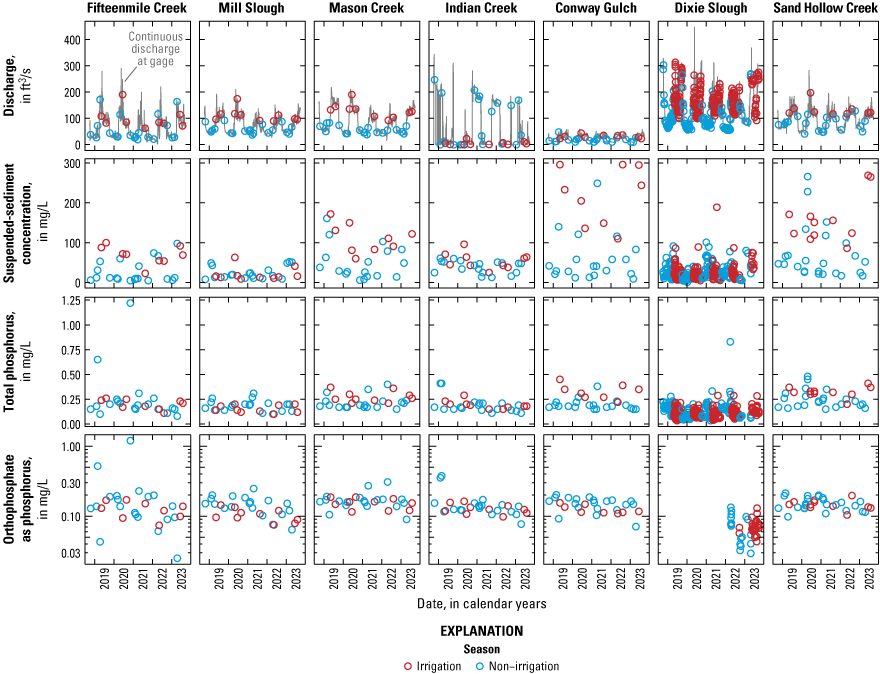
Measured constituent concentrations and corresponding discharges used in the analysis of recent spatial and seasonal patterns at Boise River tributaries and Sand Hollow Creek, Idaho water years 2019–23. Note the y-axes for orthophosphate are log10-transformed. [ft3/s, cubic feet per second; mg/L, milligrams per liter]
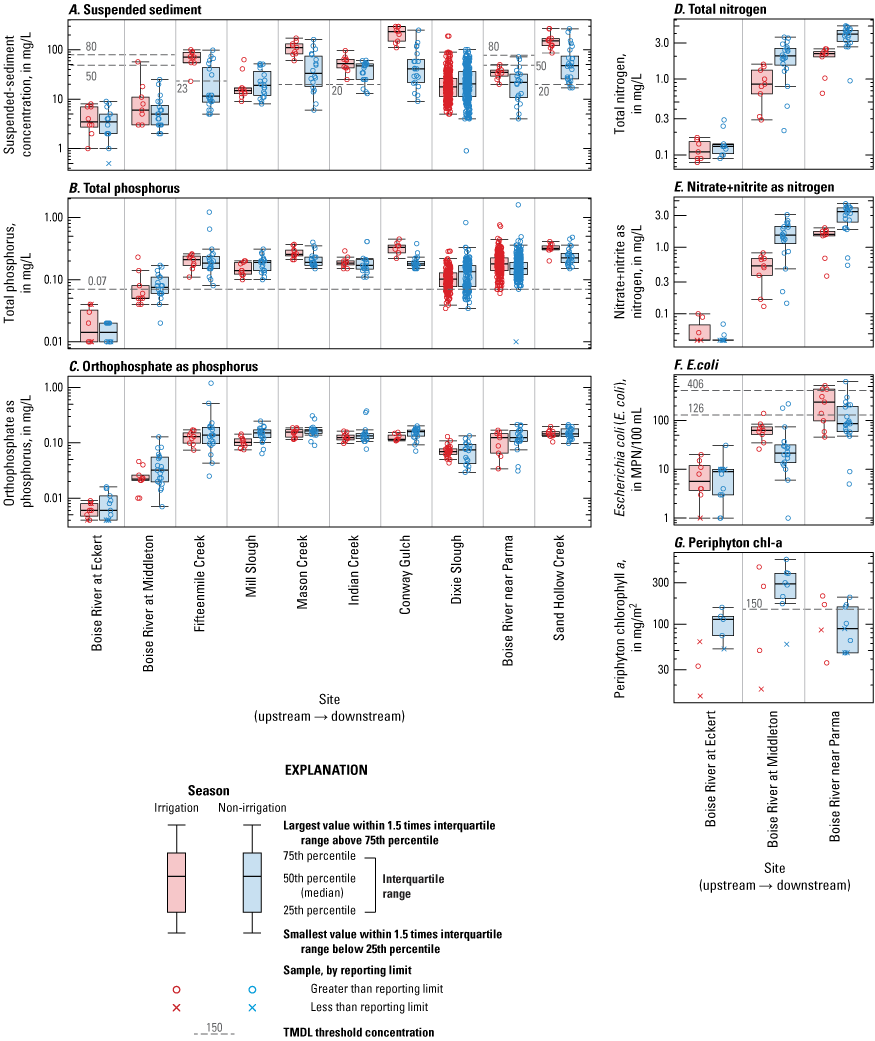
Measured constituent concentrations relative to total maximum daily load (TMDL) threshold concentrations, water years 2019–23. TMDL thresholds are shown for reference only; instantaneous values above thresholds do not necessarily represent a TMDL exceedance. TMDL thresholds in graphs A and G are site-specific; the threshold in G only applies at Middleton and Parma. [mg/L, milligrams per liter; MPN/100 mL, most probable number per 100 milliliters; mg/m2, milligrams per meter squared; E. coli, Escherichia coli; chl-a, chlorophyll a]

Seasonal patterns in discharge and constituent concentrations at mainstem lower Boise River, Idaho, sites, water years 2019–23. An outlier total phosphorus concentration of 1.60 mg/L at Boise River near Parma (April 14, 2021) is omitted for plotting purposes. [ft3/s, cubic feet per second; mg/L, milligrams per liter; MPN/100 mL, most probable number per 100 milliliters]
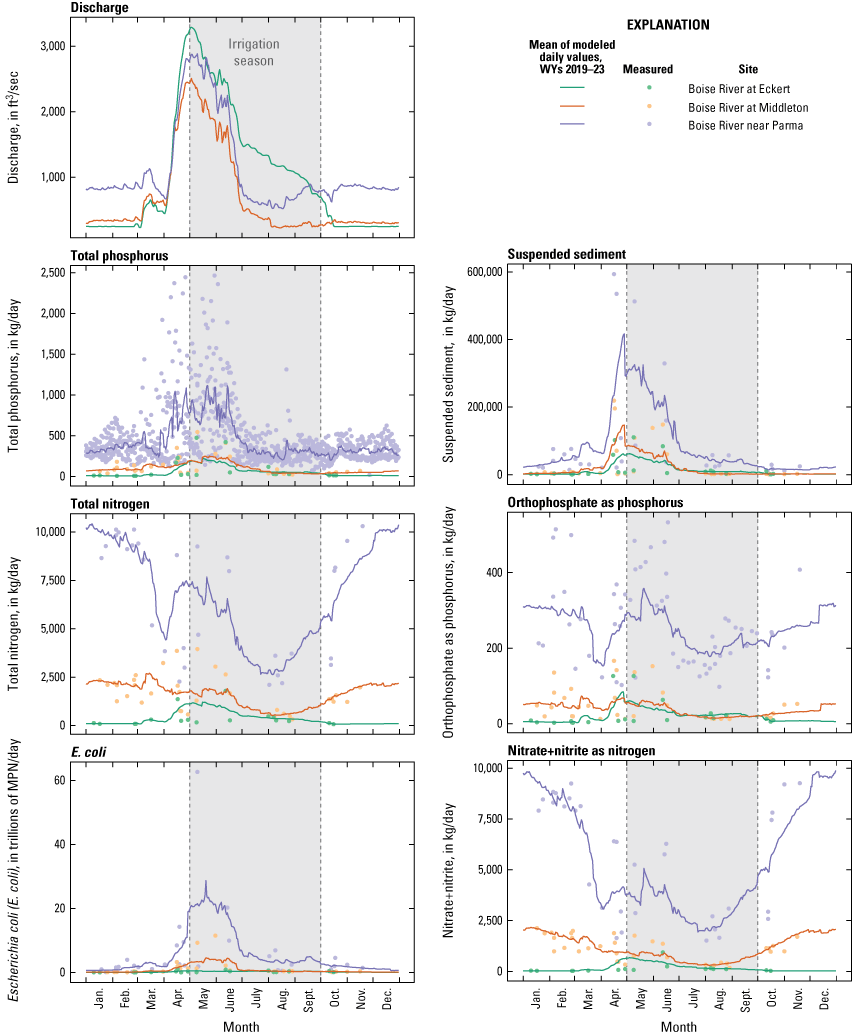
Seasonal patterns in discharge and loads at mainstem lower Boise River sites, Idaho, water years (WYs) 2019–2023. [ft3, cubic feet; kg/day, kilograms per day; MPN/day, most probable number per day]
Lower Boise River
The 2019–23 period was characterized by a range of flow conditions in the lower Boise River, including two high-flow years (2019 and 2023) and three low-flow years (2020–22; figs. 2, 5). Discharge was generally greatest in late spring–early summer, driven by snowmelt but moderated by upstream reservoirs. Mean discharges during the non-irrigation season were similar from Eckert to Middleton but increased 1.8-fold from Middleton to Parma with inputs from tributaries (table 4). In contrast, during the irrigation season, mean discharge was reduced by nearly one-half (0.52-fold) between Eckert and Middleton because of diversions, then increased 1.4-fold from Middleton to Parma with irrigation returns and tributary inputs (table 4). Overall, mean discharge decreased 25 percent (0.75-fold) from Eckert to Parma during the irrigation season.
Table 4.
Mean estimated discharge and constituent loads in Boise River tributaries and Sand Hollow Creek, Idaho during the irrigation and non-irrigation seasons, water years 2019–23.[Discharges are based on daily values. Loads are based on daily estimates for the entire period using the composite method. The percentage of total load (percent of total) is based on the sum of the means from the monitored Boise River tributaries and the Boise River at Middleton. Abbreviations: Cr, Creek; ft3/s, cubic feet per second; I, irrigation; NI, non-irrigation; %, percent; kg, kilograms; MPN, most probable number; x, not included in percent of total calculation; --, not evaluated]
Concentrations of most of the monitored constituents increased considerably along the mainstem Boise River from Eckert to Middleton to Parma during the irrigation and non-irrigation seasons in 2019–2023. The measured concentrations of TP, OP, TN, nitrate plus nitrite, and E. coli all increased at least tenfold from Eckert to Parma (fig. 4; tables 5, 6). The only constituent that did not follow this spatial trend was periphyton chl-a, which occurred in the greatest concentrations at Middleton based on the limited data available (fig. 4). At Parma, the highest measured concentrations of SSC, E. coli, and to a lesser extent, TP, occurred in late spring–early summer, following the seasonal pattern of discharge (fig. 5). This pattern was less apparent at Eckert and Middleton. The mean proportion of TP as OP was the same during the irrigation and non-irrigation seasons at Eckert, but it was lower during the irrigation season at Middleton and Parma (fig. 5; tables 5, 6), likely associated with higher flows diluting OP contributions from groundwater, wastewater treatment plants, and other sources. Concentrations of OP, TN, and nitrate plus nitrite followed a seasonal pattern opposite that of SSC, E. coli, and TP, with lower concentrations during late spring to mid-summer (fig. 5). The percentage of TN in the form nitrate plus nitrite decreased during the irrigation season at Middleton and Parma (fig. 5; tables 5, 6), consistent with the understanding that nitrate plus nitrite is groundwater sourced and is diluted by higher flows.
Table 5.
Mean measured and composite model-estimated constituent concentrations in the Boise River and Sand Hollow Creek, Idaho, water years 2019–23.[Abbreviations: NA, unable to estimate because of low detection frequency; --, not evaluated; SSC, suspended-sediment concentration; TP, total phosphorus; OP, orthophosphate as phosphorus; TN, total nitrogen; NO3+NO2, nitrate plus nitrite as nitrogen; E. coli, Escherichia coli bacteria; chl-a, chlorophyll a; mg/L, milligrams per liter; MPN, most probable number per 100 milliliters; mg/m2, milligrams per square meter; %, percent; I, irrigation; NI, non-irrigation]
Table 6.
Mean measured and composite model-estimated constituent concentrations in select tributaries to the Boise River, Idaho, water years 2019–23.[Abbreviations: SSC, suspended-sediment concentration; TP, total phosphorus; OP, orthophosphate as phosphorus; mg/L, milligrams per liter; %, percent; I, irrigation; NI, non-irrigation]
Measured concentrations above TMDL targets were frequent for some constituents at lower Boise River sites during 2019–2023 (fig. 4). Concentrations of TP were greater than the TMDL target of 0.07 mg/L in 33 percent of samples from Boise River at Middleton and 99 percent of samples at Boise River near Parma during the irrigation (and TMDL) season. Periphyton chl-a concentrations were greater than the mean monthly TMDL target of 150 mg/m2 in 75 percent of year-round samples from Boise River at Middleton and in 38 percent of samples from Boise River near Parma. Among the months represented by recent samples at Boise River at Middleton, some of the highest concentrations occurred during February (fig. 7). E. coli concentrations were greater than the TMDL target of 406 MPN/100 mL in 14 percent of samples at Boise River near Parma; and were greater than the TMDL target of 126 MPN/100 mL in 41 percent of samples at Boise River near Parma and in 14 percent of samples at Boise River at Middleton. Concentrations of SSC above the TMDL targets were infrequent, with 3.4 percent of samples from Middleton and 6.6 percent of samples from Parma greater than the 50 mg/L threshold, and no samples greater than the 80 mg/L threshold. Notably, many of these TMDL targets (for example, periphyton chl-a; the E. coli threshold of 126 MPN/100 mL; and SSC) are intended to be evaluated using means of multiple samples over a given time period. Therefore, a single sample above a target concentration does not necessarily indicate a TMDL exceedance.
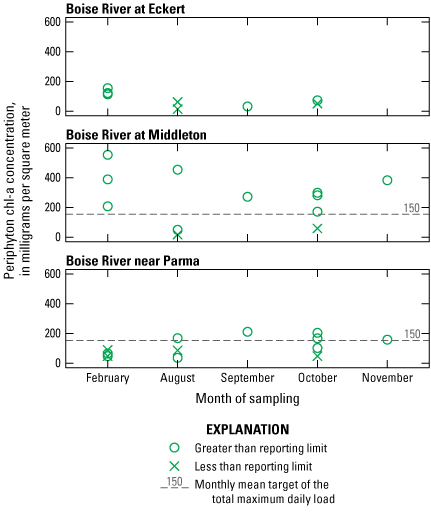
Periphyton chlorophyll a (chl-a) concentrations during different months at mainstem lower Boise River, Idaho, sites, water years 2019–23.
Despite a mean loss of discharge along the Boise River from Eckert to Parma during the irrigation seasons, and only a minor increase during the non-irrigation seasons, mean loads of SSC, TP, OP, TN, nitrate plus nitrite, and E. coli all increased considerably (5.0-fold to 91-fold; table 4; fig. 6). For all these constituents, most of the load increases occurred between Middleton and Parma. The seasonal patterns of loads generally reflected those of concentrations, with the highest loads of SSC, TP, and E. coli occurring during late spring–early summer, and the highest loads of TN and nitrate plus nitrite occurring during autumn and winter (fig. 6). The seasonal pattern of OP loads was less clear, with high values in both winter and early summer, but consistently low values in late summer–early autumn, potentially related to increased uptake of OP by algae during the growing season (Hoelscher and Myers, 2003; Wood and Etheridge, 2011).
Fifteenmile Creek
Measured concentrations of SSC, TP, and OP in Fifteenmile Creek were generally greater than those in the Boise River at Middleton but similar to those in most other tributaries (tables 5, 6; fig. 4). Suspended-sediment concentrations followed a seasonal pattern and were greatest during the irrigation season (mean 2.57-fold greater than in the non-irrigation season), during which time 89 percent of samples were greater than the site-specific TMDL threshold of 23 mg/L (figs. 4 and 8; Idaho Department of Environmental Quality, 2015a). Total phosphorus concentrations consistently exceeded the TMDL threshold of 0.07 mg/L and, apart from two samples with high concentrations during the non-irrigation season, did not show a clear seasonal pattern (fig. 8). Orthophosphate concentrations and the percentage of TP as OP were lowest during late spring–early summer (fig. 8) as high flows diluted OP from sources such as groundwater and wastewater treatment plants.
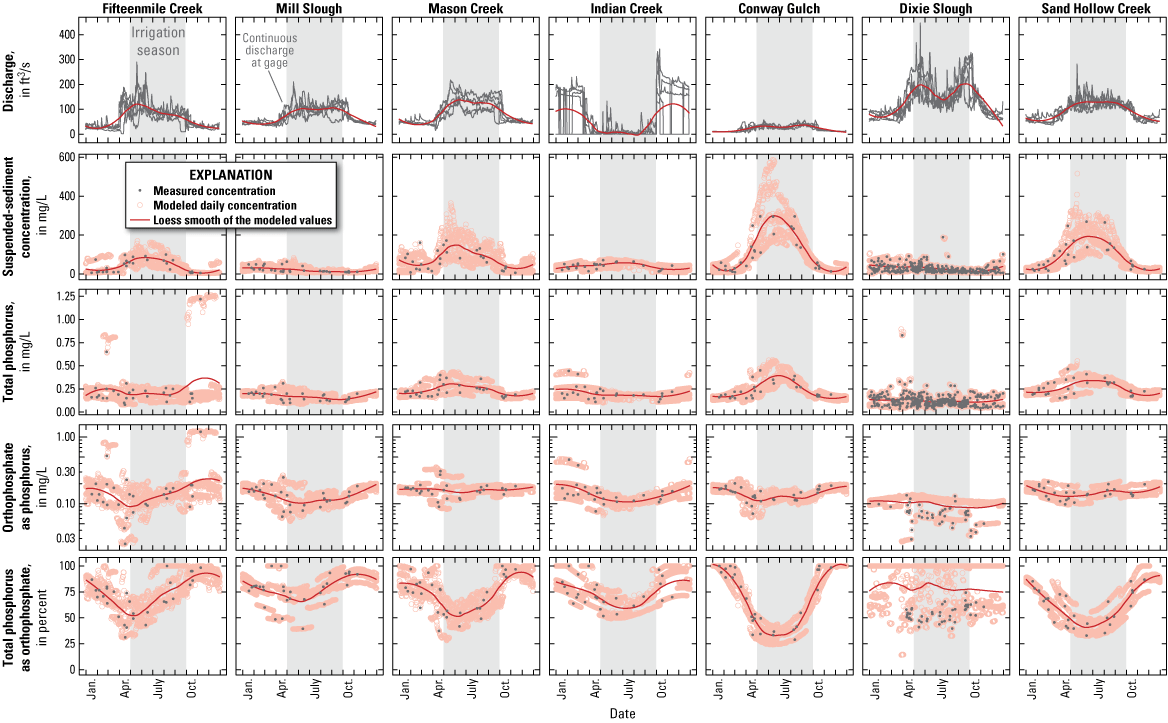
Seasonal patterns in discharge and measured and modeled constituent concentrations at lower Boise River tributaries and Sand Hollow Creek, Idaho, water years 2019–23. [ft3/s, cubic feet per second; mg/L, milligrams per liter]
Discharges from Fifteenmile Creek averaged 6.50 and 4.50 percent of the total measured inflow to the Boise River during the irrigation and non-irrigation seasons, respectively (table 4). However, the relative contributions of loads of TP and OP from Fifteenmile Creek to the Boise River were disproportionately greater. Of the total measured loads, Fifteenmile Creek accounted for 12.4 percent of the TP and 15.0 percent of the OP in the irrigation season, and 10.5 percent of the TP and 11.8 percent of the OP in the non-irrigation season (table 4; fig. 9). For SSC, Fifteenmile Creek contributed 6.45 percent of the total measured inflow load during non-irrigation season, comparable to its discharge contribution, but 14.7 percent of the total inflow SSC during irrigation season (fig. 9).
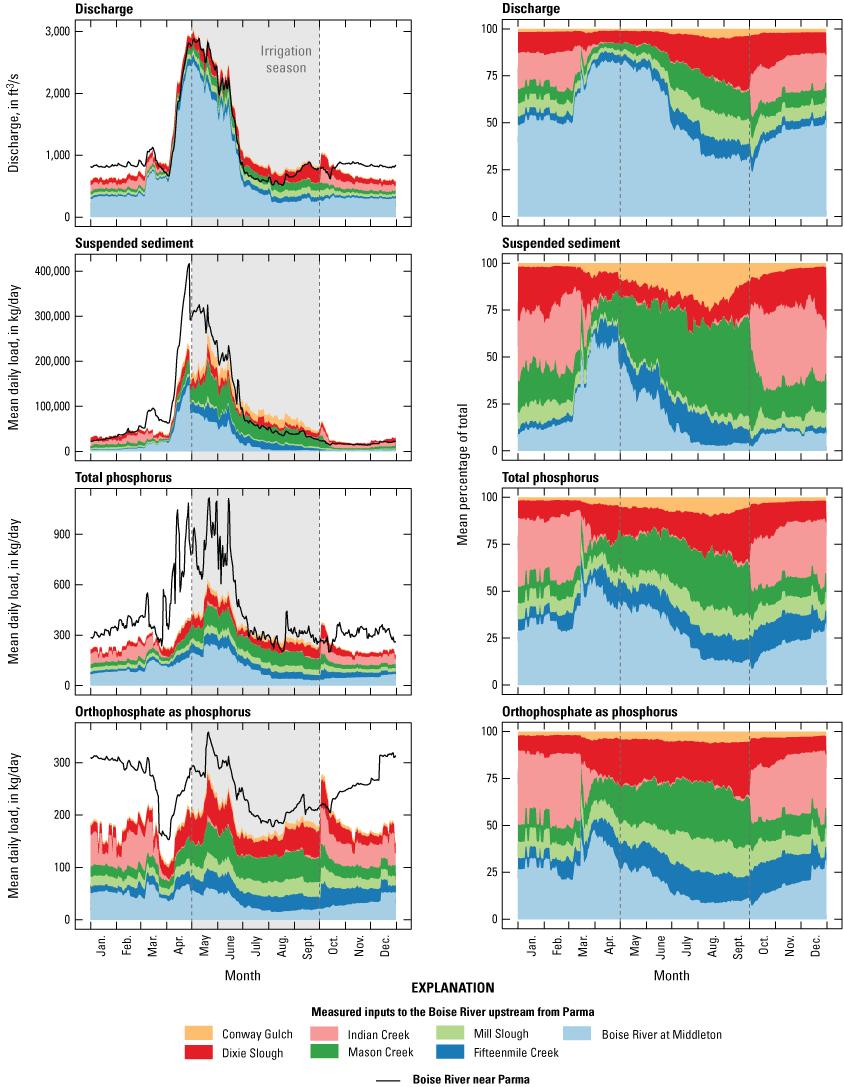
Discharge and constituent load contributions to the lower Boise River, Idaho, water years 2019–23. Values in the left column are means of daily discharges and modeled daily loads over the 5-year period. Inputs are shown stacked for comparison to the Boise River near Parma. Values in the right column are percentages of the total inputs in the left column. [ft3/s, cubic feet per second; kg/day, kilograms per day]
Fivemile Creek and Tenmile Creek are the two primary tributaries to Fifteenmile Creek. During the non-irrigation season, Fivemile Creek contributed slightly more discharge than Tenmile Creek (55 percent versus 45 percent of the total, respectively) but considerably more SSC (76 percent), TP (74 percent), and OP (71 percent; fig. 10), potentially associated in part with the discharge of the City of Meridian’s wastewater effluent to Fivemile Creek. During the irrigation season, mean discharge increased 1.8-fold at both sites. At Fivemile Creek, loads of SSC, TP, and OP also increased during the irrigation season, but disproportionately less than the increase in discharge (1.03–1.5-fold increases over the non-irrigation season loads) indicating a dilution effect by higher flows in the irrigation season. The mean percentage of TP as OP was nearly unchanged (60 percent) in Fivemile Creek between the irrigation and non-irrigation seasons. In contrast, at Tenmile Creek, loads of SSC increased 4.0-fold, loads of TP increased 2.9-fold, and the percentage of TP as OP decreased to 53 percent during the irrigation season. These results suggest greater mobilization of particulates during the irrigation season in the Tenmile Creek watershed compared to Fivemile Creek.
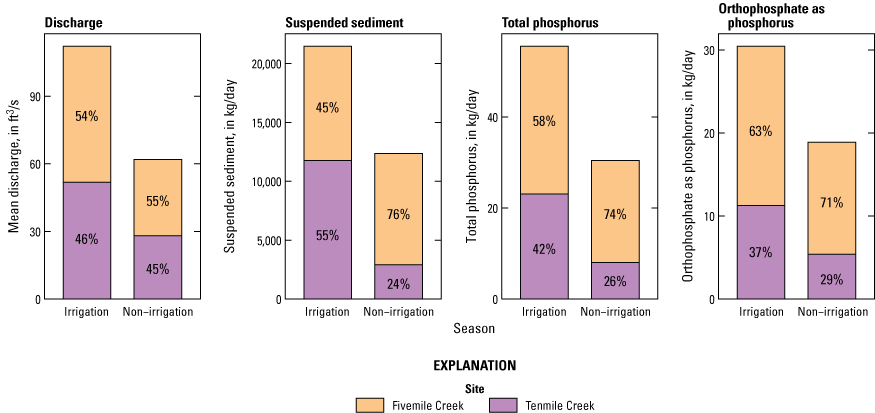
Mean discharge and constituent loads at Fivemile and Tenmile Creeks, Idaho, during the irrigation and non-irrigation seasons, water years 2019–23. Percentages are of the combined contributions from both sites. [%, percent; ft3/s, cubic feet per second; kg/day, kilograms per day]
Mill Slough
Among the lowest tributary concentrations of SSC, TP, and OP were measured at Mill Slough (fig. 4; tables 5, 6). However, concentrations reported here do not reflect contributions from the Middleton wastewater treatment plant, which discharges to Mill Slough downstream from the sampling location. SSC and TP concentrations were relatively stable year-round, whereas OP concentrations and the percentage of TP as OP decreased during the irrigation season, indicating dilution of a groundwater source of OP (fig. 8). During irrigation season, Mill Slough contributed an average of 6.98 percent of the total measured discharge to the Boise River, but only 3.60 percent of the total measured suspended-sediment load (table 4; fig. 9). The OP contribution from Mill Slough during the irrigation season was relatively greater at 14.2 percent of the total inflow load. During the non-irrigation season, Mill Slough contributed 5.89 percent of the total measured discharge to the Boise River, and 6.08–10.9 percent of the total SSC, TP, and OP loads.
Mason Creek
At Mason Creek, concentrations of SSC and, to lesser extent, TP, followed a seasonal pattern, increasing in the early irrigation season and decreasing through late summer and autumn (fig. 8). Measured concentrations of SSC were greater than the site-specific TMDL threshold of 20 mg/L (Idaho Department of Environmental Quality, 2015a) in 72 percent of samples during the non-irrigation season, and 100 percent of samples during the irrigation season (fig. 4). Measured concentrations of TP were greater than the TMDL threshold of 0.07 mg/L in all samples. Concentrations of OP at Mason Creek were higher than most other sites, and relatively stable year-round, but the percentage of TP as OP was notably lower during the irrigation season (tables 5, 6; fig. 8). The relative stability in OP concentrations, higher TP concentrations, and lower percentages of TP as OP during the irrigation season at Mason Creek suggest a source of increased particulate phosphorus during that period.
Mason Creek contributed an average of 6.01 percent of the total discharge to the study area during the non-irrigation season, compared to 15.0 percent of total load of SSC and 11.3 and 12.6 percent of the total loads of TP and OP, respectively. During the irrigation season, discharge increased 2.3-fold compared to the non-irrigation season, and loads of SSC, TP, and OP increased 5.4-fold, 3.1-fold, and 2.2-fold, respectively. The mean irrigation season load of OP at Mason Creek was the highest of the monitored tributaries, and even exceeded the Boise River at Middleton, where discharge was seven times greater (table 4; fig. 9). Mean irrigation season TP and suspended-sediment loads at Mason Creek also approached (TP) or exceeded (SSC) those of the Boise River at Middleton, and were greater than all other sites except Sand Hollow Creek and Boise River at Parma (table 4). The high loads at Mason Creek were a product of relatively high discharge and concentrations during the irrigation season (fig. 8).
Indian Creek
Measured concentrations of SSC, TP, and OP at Indian Creek were moderate compared to other tributaries (tables 5, 6). Suspended-sediment concentrations were slightly greater during the irrigation season (mean 1.39-fold greater than non-irrigation season), with all sample concentrations above the site-specific TMDL threshold of 20 mg/L (Idaho Department of Environmental Quality, 2015a; fig. 4). During the non-irrigation season, 84 percent of sample concentrations were greater than the SSC TMDL threshold. As with most of the monitored tributaries, all samples from Indian Creek exceeded the TP concentration threshold of 0.07 mg/L. Concentrations of OP and the percentage of TP as OP were both lower during the irrigation season (fig. 8; tables 5, 6), suggesting that the higher flows in the irrigation season dilute OP coming from groundwater or the upstream wastewater treatment plants at Kuna and Nampa.
Load contributions of suspended sediment, TP, and OP from Indian Creek were greater than those from any other tributary during the non-irrigation season, including Sand Hollow Creek (table 4; fig. 9). Indian Creek contributed 18.4 percent of the total measured suspended-sediment load to the Boise River during the non-irrigation season, and 19.5 percent and 22.5 percent of the total TP and OP loads, respectively. These high loads were largely the result of Indian Creek’s high discharge during the non-irrigation season (table 4).
Loading from Indian Creek to the Boise River was greatly reduced during the irrigation season by diverting about 95 percent of Indian Creek discharge to Riverside Canal (fig. 8). Upstream from Riverside Canal, constituent loads in Indian Creek during the irrigation season averaged 22,270 kilograms per day (kg/day; suspended sediment), 75.8 kg/day (TP), and 50.7 kg/day (OP). Downstream from Riverside Canal, at the mouth of Indian Creek, loads averaged 1,110 kg/day (suspended sediment), 3.60 kg/day (TP), and 2.11 kg/day (OP). The diversion of Indian Creek to Riverside Canal during irrigation season therefore resulted in surface-water load reductions of approximately 21,160 kg/day suspended sediment, 72.2 kg/day TP, and 48.6 kg/day OP to the Boise River. However, some fraction of the reduced OP load may eventually return to the Boise River via groundwater.
Conway Gulch
Conway Gulch had some of the highest concentrations of SSC and TP among the study sites. During the irrigation season, SSC showed a strong seasonal pattern, increasing 3.7-fold, on average, and exceeding concentrations at all other sites (tables 5, 6; fig. 8). Total phosphorus concentrations also increased during the irrigation season (1.7-fold) and were among the highest of the monitored sites. During the non-irrigation season, SSC remained relatively high (second only to Sand Hollow Creek), but TP and OP were moderate relative to other sites. The percentage of TP as OP was strongly seasonal at Conway Gulch, averaging 38 percent during the irrigation season and 78 percent during the non-irrigation season, a greater seasonal difference than at any other site (fig. 8; tables 5, 6). This seasonality seems to be driven by increased concentrations of particulate phosphorus and dilution of groundwater-sourced OP during the irrigation season. Our results do not capture the potential influence of wastewater discharged to Conway Gulch by the city of Notus because our sampling was upstream from that location.
Conway Gulch was the smallest of the monitored tributaries in terms of discharge, but its load of suspended sediment to the Boise River was disproportionately large because of its high SSC concentrations. During the non-irrigation season, Conway Gulch contributed an average of 1.74 percent of the total measured inflow discharge and 4.38 percent of the total inflow suspended-sediment load (table 4). Discharge doubled during the irrigation season, but the suspended-sediment load increased by 8.4-fold (fig. 9). In contrast, mean loads of OP increased only 1.7-fold from the non-irrigation to the irrigation season.
Dixie Slough
Dixie Slough had the lowest mean concentrations of TP and OP of the monitored tributaries in both the irrigation and non-irrigation seasons, and among the lowest mean concentrations of SSC (tables 5, 6; fig. 4). Unlike most sites, at Dixie Slough little or no seasonality was observed in SSC, TP, or OP concentrations, nor in the percentage of TP as OP (fig. 7), which may be attributed to the flocculation and settling facility that is operated in the irrigation season by the City of Boise. Dixie Slough was the largest of the monitored tributaries, contributing 11.4 percent of the total measured discharge to the Boise River during the non-irrigation season, and 12.4 percent during the irrigation season. Despite the high discharges, loads of SSC and TP from Dixie Slough were moderate compared to other sites (table 4; fig. 9).
Sand Hollow Creek
Measured concentrations of SSC, TP, and OP at Sand Hollow Creek were among the highest of the monitored sites (tables 5, 6; figs. 4, 8). During the non-irrigation season, mean SSC concentrations were higher than any other site and were greater than the site-specific TMDL threshold of 20 mg/L in 92 percent of samples. Suspended-sediment concentrations increased 2.2-fold during the irrigation season, on average, and were greater than the TMDL threshold in 100 percent of samples (fig. 4). Total phosphorus concentrations also increased in the irrigation season. Orthophosphate concentrations were similar in the irrigation and non-irrigation seasons (tables 5, 6; figs. 4, 8), suggesting that the seasonality in the percentage of TP as OP was likely driven by increases in particulate phosphorus during the irrigation season, rather than a dilution of groundwater OP.
Loads of SSC and TP at Sand Hollow Creek were greater than any of the lower Boise River tributaries during the irrigation season (table 4), a product of both high concentrations and high flows. Suspended sediment and TP loads remained high during the non-irrigation season, matched or exceeded only by Indian Creek. Orthophosphate loads at Sand Hollow Creek were also high relative to most of the lower Boise River tributaries during the irrigation season but were moderate during the non-irrigation season. Sand Hollow Creek receives wastewater from the Parma wastewater treatment plant.
Measured Inputs Relative to Boise River at Parma
During 2019–2023, we compared the measured inputs to the lower Boise River (in other words, the measured tributaries plus the Boise River at Middleton) to the loads at Parma (in other words, the outflow) for clues as to whether there were unmeasured sources to the main stem or unaccounted-for losses from or storage/transformation/uptake within the main stem. The summed discharge inputs averaged only 1.5 percent greater than the discharge at Parma, on average (fig. 9), demonstrating that, on an annual basis, all major sources of discharge were accounted for, and that any losses to diversions or groundwater were minor. Seasonally, however, differences were observed between the summed inputs and Parma. In the autumn through early spring, the combined discharge of the measured inputs could not fully account for the discharge at Parma (fig. 9), suggesting that contributions were from unaccounted-for small tributaries or groundwater to the main stem. This finding is substantiated by Etheridge (2013), who reported that groundwater contributed 9.9 and 21 percent of the total discharge at Parma during synoptic surveys in October 2012 and March 2013, respectively. During the late spring through summer, in contrast, the measured inputs exceeded the discharge at Parma, indicating losses to diversions.
The mean load of suspended sediment from the measured inputs over the 5-year period accounted for 89 percent of the load at Parma, on average, indicating that an important source of suspended sediment (about 11 percent of the total load at Parma) was not measured. Figure 9 shows that the unaccounted-for suspended-sediment loading at Parma occurred during mid-spring through early summer, concurrent with spring high flows. A portion of the unaccounted-for suspended-sediment load during this period was likely from resuspension of sediment deposited in the mainstem during the previous summer and autumn, as evidenced by input loads exceeding Parma loads during that period (fig. 9). The remainder of the unaccounted-for load of suspended sediment at Parma during the mid-spring through early summer likely came from unmeasured tributaries and drains.
The mean loads of TP and OP from the measured inputs accounted for 68 percent and 72 percent, respectfully, of the loads at Parma (fig. 9). Most of the unaccounted-for TP load at Parma occurred during the spring to mid-summer, similar to the pattern observed for SSC and likely associated with particulate phosphorus from unmeasured tributaries and drains, as well as resuspension of particles in the main stem by high spring flows. The unaccounted-for load of TP during the autumn through early spring was largely from OP, which could be associated with groundwater contributions to the mainstem that were not included in this work. This hypothesis is further supported by the coincident unaccounted-for gain in flow between Middleton and Parma during the autumn through early spring (fig. 9).
Temporal Trends
Trends in concentrations and loads were evaluated using samples collected over a 30-year period (1994–2023) and, at mainstem sites, a more recent 15-year period (2009–2023; figs. 11, 12). Trends in suspended-sediment concentrations were highly likely decreasing during the irrigation season at Mill Slough and Dixie Slough over the 30-year period, and at Boise River near Parma over the recent 15-year period (table 7; fig. 13). During the non-irrigation season, trends in SSC were uncertain except at Fifteenmile Creek, where they were highly likely decreasing over the 30-year period. Elsewhere, trends in SSC were uncertain. The greatest reduction in SSC was at Dixie Slough, where concentrations during the irrigation season decreased 73 percent over the 30-year period, or 1.0 mg/L/year, on average (table 7; fig. 13). Loads of suspended sediment showed decreasing trends at most sites, especially during the irrigation season (table 8). At sites where trends in suspended-sediment concentrations were uncertain (Boise River at Middleton, Mason Creek, Indian Creek, Conway Gulch), the decreasing trends in suspended-sediment loads were likely driven by decreasing trends in discharge at the time of sampling (table 9).
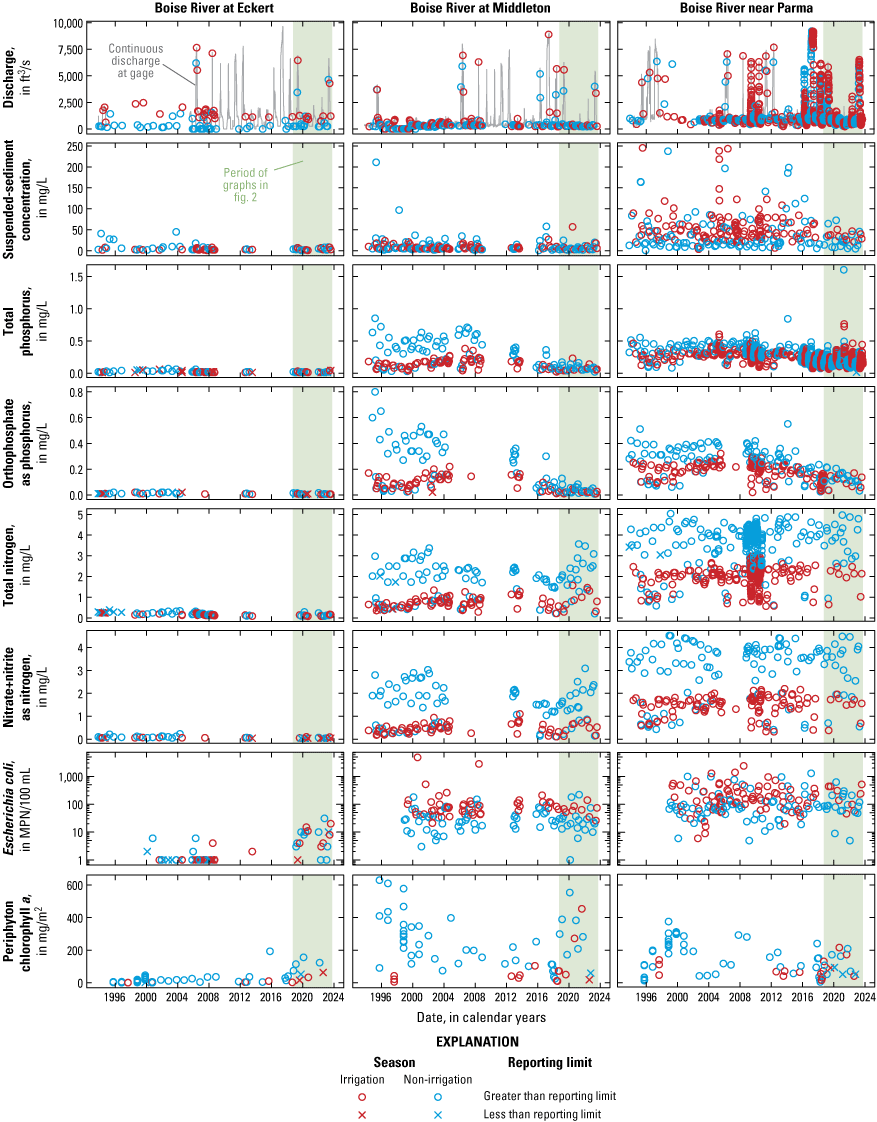
Measured constituent concentrations and corresponding discharges used in the trends analysis at mainstem Boise River sites, water years 1994–2023 (E. coli water years 1999–2023). Green bars highlight the water year 2019–23 period used to characterize spatial and seasonal patterns in recent years. Daily discharge values are shown as a gray line and were not available for the entire period; sampled discharge values are shown as circles. The y-axes for E. coli are log10-transformed. [E. coli, Escherichia coli bacteria; ft3/s, cubic feet per second; mg/L, milligrams per liter; MPN/100 mL, most probable number per 100 milliliters; mg/m2, milligrams per meter squared]
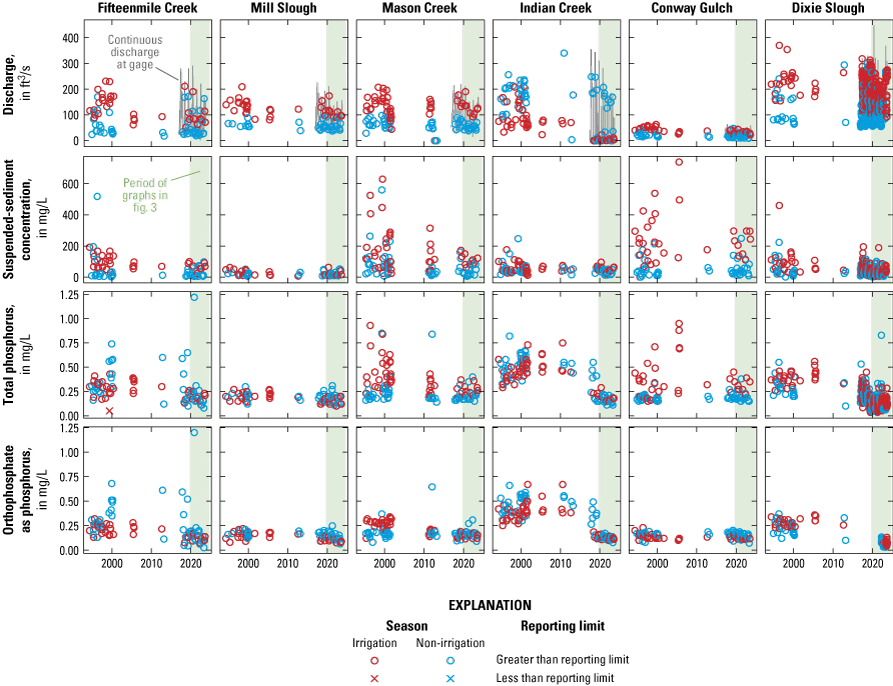
Measured constituent concentrations and corresponding discharges used in the trends analysis at Boise River tributaries, water years 1994–2023. Green bars highlight the water year 2019–23 period used to characterize spatial and seasonal patterns in recent years. Daily discharge values were not available for the entire period. [ft3/s, cubic feet per second; mg/L, milligrams per liter]
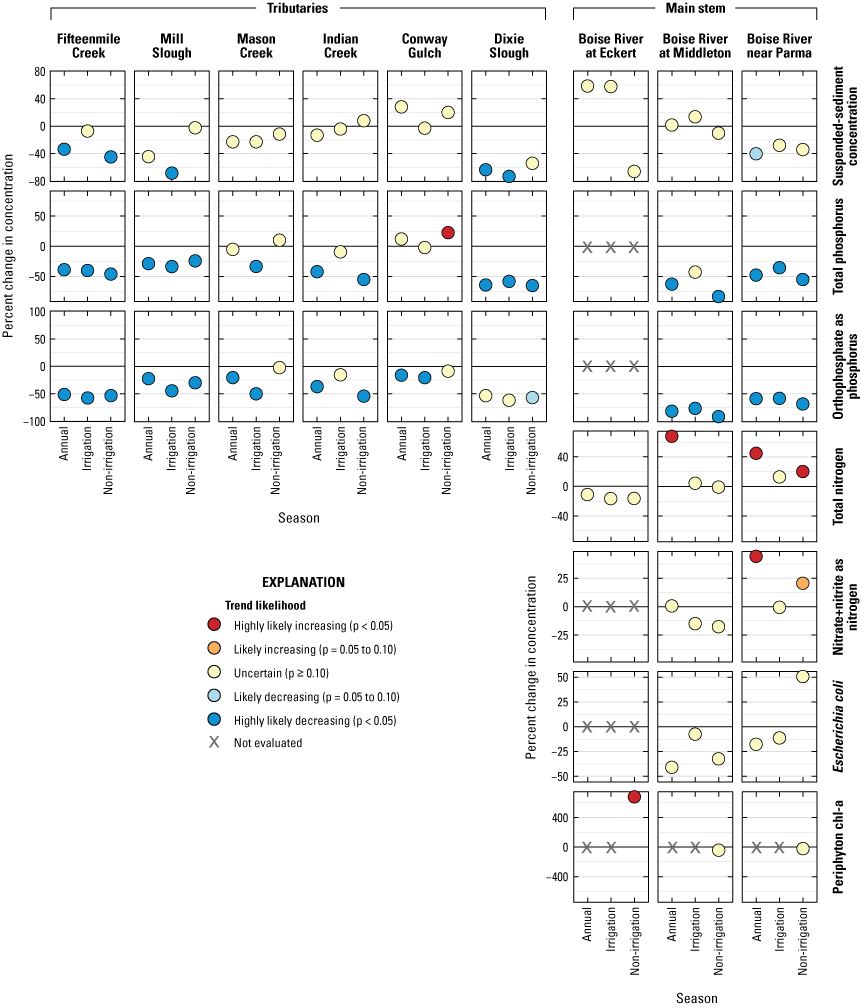
Trend direction, likelihood, and percent change in concentrations at lower Boise River tributary and mainstem sites, Idaho, water years 1994–2023 (E. coli, water years 1999–2023). Percent change values are for the entire study period. Trends were not evaluated (“X”) where less than 20 percent of results were left-censored or where data were inadequate. For periphyton chlorophyll a, non-irrigation trends are based on data from October to November only. [<, less than; =, equals; ≥, greater than or equal to; E. coli, Escherichia coli bacteria; chl-a, periphyton chlorophyll a]
Table 7.
Trends of concentrations of select constituents in mainstem lower Boise River and tributary sites, Idaho, water years 1994–2023 and 2009–2023.[Results are from the Mann-Kendall Theil-Sen test. Slope is the mean change in concentration per year, in original concentration units. Abbreviations: % Δ/yr., percent change in concentration per year; % Δ total, percent change in concentration over the given timespan; --, not analyzed because of data limitations; <, less than; Oct., October; Nov., November]
Table 8.
Trends of loads of select constituents in mainstem lower Boise River and tributary sites, Idaho, water years 1994–2023 and 2009–2023.[Results are from the Mann-Kendall Theil-Sen test; Slope is the mean change in load per year; slope units are most probable number per year, in billions, for Escherichia coli, and kilograms per year for all other constituents. Abbreviations: % Δ/yr., percent change in load per year; % Δ total, percent change in load over the given timespan; --, not analyzed because of data limitations; <, less than]
Table 9.
Trends of discharge values coinciding with discrete sampling events in mainstem lower Boise River and tributary sites, Idaho, water years 1994–2023 and 2009–2023.[Results are from the Mann-Kendall Theil-Sen test; Slope is the mean change in discharge per year, in cubic feet per second. Abbreviations: % Δ/yr., percent change in discharge per year; % Δ total, percent change in discharge over the given timespan; --, not analyzed because of data limitations; <, less than]
Total phosphorus concentrations during the non-irrigation season were highly likely decreasing at all sites except Mason Creek (fig. 13; table 7). During the irrigation season, TP concentrations were highly likely decreasing at all sites except Boise River at Middleton, Indian Creek, and Conway Gulch. Over the 30-year period, TP concentrations at each site decreased 23–83 percent in 1 or more seasons, suggesting that the TP TMDL and related point and nonpoint source reduction efforts over the study period have been effective. Loads of TP were also likely or highly likely decreasing at nearly all sites and seasons (table 8), reflecting both decreasing concentrations (table 7) and discharges at the time of sample collection (table 9). King and Yoder (2025) estimated 60 percent decreases in TP concentrations and loads at Boise River near Parma during 2003–2021. Our estimates, using different methods and time periods, generally support their findings, with TP concentrations decreasing 44–48 percent and loads decreasing 57–70 percent.
Like TP, concentrations of OP were likely or highly likely decreasing at all sites during one or more seasons (fig. 13; table 7). The largest decreases in OP concentrations were observed in the Boise River at Middleton (77–92 percent decreases, depending on season and evaluation period), Fifteenmile Creek (51–58 percent decreases), and Boise River near Parma (54–68 percent decreases). Similarly, loads of OP were likely or highly likely decreasing at all sites during one or more seasons (table 8).
Trends in TN, nitrate plus nitrite, E.coli, and periphyton chl-a were only evaluated at mainstem lower Boise River sites because tributary sites lacked adequate data for trend analysis. In contrast to TP and OP, concentrations of TN were highly likely increasing at Middleton (68 percent increase, or 1.68-fold) and at Parma (45 percent increase, or 1.45-fold) during 1994–2023 (fig. 13; table 7). Loads of TN at Middleton were also highly likely increasing during 1994–2023 (table 8). In contrast, loads of TN were highly likely decreasing at Eckert during 1994–2023, driven by decreasing discharges during sample collections (table 9).
Nitrate plus nitrite concentrations were uncertain at Middleton but likely increasing at Parma during the irrigation season (21 percent increase, or 1.21-fold) and highly likely increasing annually (44 percent increase, or 1.44-fold) during 1994–2023 (fig. 13; table 7). Increasing trends in nitrate plus nitrite concentrations have also been observed in surface water and groundwater elsewhere in the Snake River Basin (Frans and others, 2012; Lentz and others, 2018; Bjorneberg and others, 2020; Naymik and others, 2023) and have been attributed to shifts in agricultural practices including increases in dairy herds, animal feed crops, and use of chemical and manure fertilizer (Lentz and others, 2018). Trends in loads of nitrate plus nitrite were generally uncertain, but likely decreasing during the irrigation season at Parma during 2009–2023 (table 8).
Trends in E. coli concentrations were uncertain except during the 2009–2023 irrigation season at Eckert, where they were likely decreasing, and the 2009–2023 non-irrigation season at Parma, where they were highly likely increasing (fig. 13; table 7). Trends in loads of E. coli were uncertain.
Periphyton chl-a concentrations were highly likely increasing at Eckert during the October-November period (1994–2023; fig. 13; table 7). At Middleton and Parma, trends in periphyton chl-a concentrations were uncertain. Loads were not estimated for periphyton chl-a.
Summary and Conclusions
In recent decades, TMDLs and point- and nonpoint-source watershed improvement projects have sought to improve the water quality in the lower Boise River, Idaho, and its tributaries. To gauge the effectiveness of these efforts and help prioritize future resources, this study characterized recent spatial and seasonal patterns in constituent concentrations and loads, and evaluated trends over a 30-year period, at three mainstem and seven tributary sites. Concentrations and loads of suspended-sediment concentrations (SSC) were greatest during irrigation season and, at some sites, were frequently greater than site-specific total maximum daily load (TMDL) targets, especially at Fifteenmile, Mason, Indian, and Sand Hollow Creeks. Of these sites, only Fifteenmile Creek showed a likely or highly likely downward trend in SSC concentrations, although trends were not evaluated at Sand Hollow Creek because data were inadequate. Mill Slough, Dixie Slough, and the Boise River near Parma also had highly likely decreasing SSC concentrations, indicating that sprinkler conversions and (or) other erosion-focused watershed improvements have been effective. Like SSC, total phosphorus (TP) concentrations and loads were greatest during the irrigation season at most sites. TP concentrations exceeded the irrigation season TMDL target of 0.07 milligrams per liter in 33 percent of samples from the Boise River at Middleton, 99 percent of samples from the Boise River near Parma, and in all tributary samples except some of those from Dixie Slough. However, 30-year and 15-year trends show that TP and orthophosphate (as phosphorus; OP) concentrations and loads have decreased substantially at most sites, further demonstrating the apparent effectiveness of improvement projects that have been implemented over the study period.
Although concentrations and loads of SSC, TP, and OP have decreased at many locations, it is not necessarily clear which improvement projects have influenced these reductions. A better understanding of constituent reductions from different types of improvement projects (for example, conversions from flood irrigation to sprinklers, and upgrades to wastewater treatment plants and other point sources) would help managers prioritize future projects. Such an analysis may also consider other factors that could influence constituent trends, including changes to land use/cover (for example, urbanization, changes in types of crops and livestock) and types and quantities of fertilizers used.
In contrast to SSC, TP, and OP, watershed improvement projects do not appear to have reduced concentrations of total nitrate (TN) or nitrate plus nitrite, which showed increasing trends at the Boise River at Middleton (TN) and the Boise River near Parma (TN and nitrate plus nitrite). Over the 30-year study period, annual median concentrations of TN and nitrate plus nitrite increased 45 percent and 44 percent, respectively, at Boise River near Parma. These trends corroborate those of other recent studies elsewhere in the Middle Snake River Basin, and are thought to reflect changes in agricultural practices in recent decades (Frans and others, 2012; Lentz and others, 2018; Bjorneberg and others, 2020; Naymik and others, 2023). Total nitrate was primarily as nitrate plus nitrite, especially during the non-irrigation season, and was likely associated with groundwater, although the source is not clear without additional investigation. Concentrations of Escherichia coli (E. coli) were greatest during irrigation season and, at Boise River near Parma, were greater than the TMDL targets of 126 and 406 most probable number per 100 milliliters in 41 percent and 14 percent of samples, respectively (including irrigation and non-irrigation season samples). Trends of E. coli concentrations over the 30-year period were uncertain at Boise River at Middleton and Parma because of high variability, but over the more recent 15 years, E. coli concentrations were likely decreasing during the irrigation season at Middleton and highly likely increasing during the non-irrigation season at Parma. Periphyton chlorophyll a (chl-a) concentrations were greatest at Boise River at Middleton, where they exceeded the TMDL target in 75 percent of samples. Notably, periphyton chl-a was the only constituent for which concentrations were greater at Middleton than Parma. It is hypothesized that the increased suspended sediment at Parma (compared to Middleton) reduces light penetration and thereby periphyton growth. Periphyton chl-a trends were highly likely increasing over the 30-year period at Boise River at Eckert, but they were uncertain at Boise River at Middleton and Parma.
References Cited
Baldwin, A.K., and King, T.V., 2025. Water quality concentrations and discharge in the lower Boise River and select tributaries, southwestern Idaho, 1994–2023. U.S. Geological Survey data release, https://doi.org/10.5066/P13VWHMF.
Bureau of Reclamation, 2024, Hydromet real time data: Bureau of Reclamation database, accessed September 1, 2024, at https://www.usbr.gov/pn/hydromet/.
Didoné, E.J., Minella, J.P.G., Tiecher, T., Zanella, R., Prestes, O.D., and Evrard, O., 2021, Mobilization and transport of pesticides with runoff and suspended sediment during flooding events in an agricultural catchment of Southern Brazil: Environmental Science and Pollution Research International, v. 28, no. 29, p. 39370–39386.
Frans, L.M., Rupert, M.G., Hunt, C.D., Jr., and Skinner, K.D., 2012, Groundwater quality in the Columbia Plateau, Snake River Plain, and Oahu basaltic-rock and basin-fill aquifers in the northwestern United States and Hawaii, 1992–2010: U.S. Geological Survey Scientific Investigations Report 2012–5123, 98 p.
Idaho Department of Water Resources, 2024, Idaho Department of Water Resources diversion data: Idaho Department of Water Resources database, accessed March 15, 2024, at https://research.idwr.idaho.gov/apps/watermanagement/diversiondataapplication/Login.aspx.
Idaho Power Company, 2022, Idaho Power river flow and reservoir information: Idaho Power Company website, accessed March 15, 2024, at https://www.idahopower.com/community-recreation/recreation/water-information/stream-flow-data/.
Julian, P., and Helsel, D.R., 2021, NADA2—Data analysis for censored environmental data: R package version 1.0.2, accessed September 1, 2024, at https://github.com/SwampThingPaul/NADA2.
Lee, L., 2020, NADA—Nondetects and data analysis for environmental data, version 1.6-1.1: R Foundation for Statistical Computing software release, accessed September 1, 2024, at https://CRAN.R-project.org/package=NADA.
Marchetto, A., (2024). rkt—Mann-Kendall test—Seasonal and regional Kendall tests, version 1.7: R Foundation for Statistical Computing software release, accessed March 15, 2024, at https://CRAN.R-project.org/package=rkt.
Patton, C.J., and Kryskalla, J.R., 2003, Methods of analysis by the U.S. Geological Survey National Water Quality Laboratory—Evaluation of alkaline persulfate digestion as an alternative to Kjeldahl digestion for determination of total and dissolved nitrogen and phosphorus in water: U.S. Geological Survey Water-Resources Investigations Report 2003–4174, 33 p.
R Core Team, 2024, R—A language and environment for statistical computing, version 4.2.3: R Foundation for Statistical Computing software release, accessed July 20, 2024, at https://www.R-project.org/.
U.S. Geological Survey, 2024, USGS water data for the Nation: U.S. Geological Survey National Water Information System database, accessed November 19, 2024, at https://doi.org/10.5066/F7P55KJN.
U.S. Geological Survey, [variously dated], National field manual for the collection of water-quality data: U.S. Geological Survey Techniques of Water-Resources Investigations, book 9, accessed November 19, 2024, at http://water.usgs.gov/owq/FieldManual/.
Appendix 1. Summary of results from quality assurance/quality control samples
Table 1.1.
Summary of relative percent differences between replicate samples collected in the lower Boise River and select tributaries, Idaho in water years 1994–2023.[Abbreviations: n, number; E. coli, Escherichia coli]
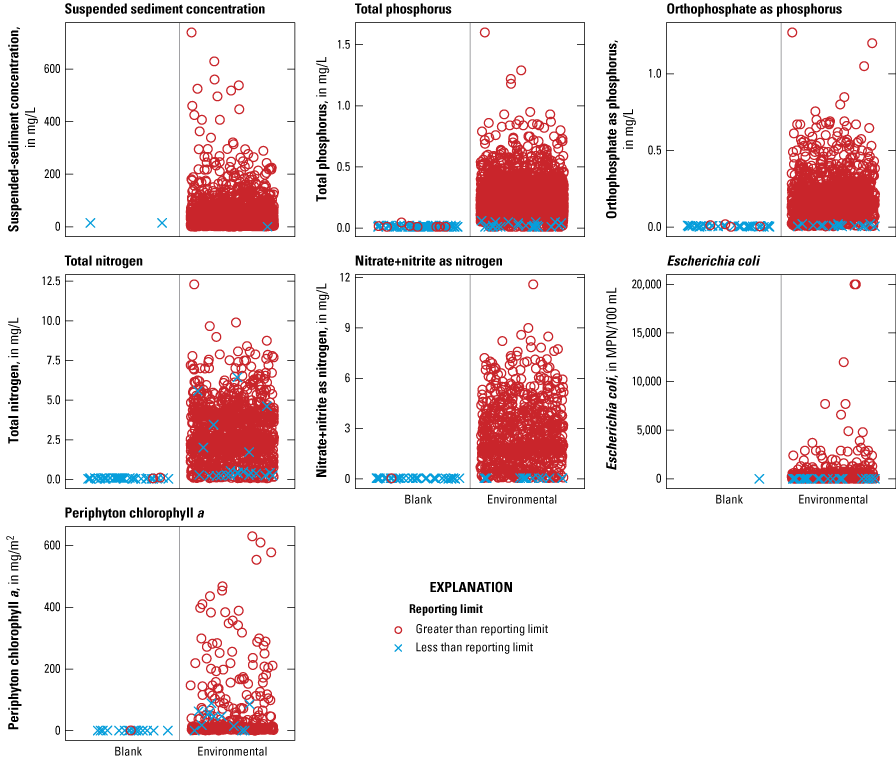
Constituent concentrations in blank samples compared to environmental samples in the lower Boise River and select tributaries, Idaho, water years 1994–2023. [mg/L, milligrams per liter; mg/m2, milligrams per square meter; MPN/100 mL, most probable number per 100 milliliters].
Conversion Factors
International System of Units to U.S. customary units
Temperature in degrees Celsius (°C) may be converted to degrees Fahrenheit (°F) as follows:
°F = (1.8 × °C) + 32.
Temperature in degrees Fahrenheit (°F) may be converted to degrees Celsius (°C) as follows:
°C = (°F – 32) / 1.8.
Supplemental Information
Concentrations of chemical constituents in water are given in milligrams per liter (mg/L). Concentrations of bacteria in water are given in most probable number per 100 milliliters (MPN/100 mL). Concentrations of periphyton chlorophyll a are given in milligrams per square meter (mg/m2).
For information about the research in this report, contact the
Director, Idaho Water Science Center
U.S. Geological Survey
230 Collins Rd
Boise, Idaho 83702-4520
https://www.usgs.gov/centers/id-water
Manuscript approved on April 11, 2025
Publishing support provided by the U.S. Geological Survey
Science Publishing Network, Tacoma Publishing Service Center
Edited by Vanessa Ball and John Osias
Illustration support by JoJo Mangano
Layout by Luis Menoyo
Cover design by Teresa A. Lewis
Disclaimers
Any use of trade, firm, or product names is for descriptive purposes only and does not imply endorsement by the U.S. Government.
Although this information product, for the most part, is in the public domain, it also may contain copyrighted materials as noted in the text. Permission to reproduce copyrighted items must be secured from the copyright owner.
Suggested Citation
Baldwin, A.K., and King, T.V., 2025, Spatial patterns and temporal trends in water quality in Idaho’s lower Boise River and its tributaries, 1994–2023: U.S. Geological Survey Scientific Investigations Report 2025–5033, 46 p., https://doi.org/10.3133/sir20255033.
ISSN: 2328-0328 (online)
Study Area
| Publication type | Report |
|---|---|
| Publication Subtype | USGS Numbered Series |
| Title | Spatial patterns and temporal trends in water quality in Idaho’s lower Boise River and its tributaries, 1994–2023 |
| Series title | Scientific Investigations Report |
| Series number | 2025-5033 |
| DOI | 10.3133/sir20255033 |
| Publication Date | May 30, 2025 |
| Year Published | 2025 |
| Language | English |
| Publisher | U.S. Geological Survey |
| Publisher location | Reston, VA |
| Contributing office(s) | Idaho Water Science Center |
| Description | Report viii, 45 p.; Data Release |
| Country | United States |
| State | Idaho |
| Other Geospatial | Lower Boise River watershed |
| Online Only (Y/N) | Y |