

Assessing Spatial Variability of Nutrients, Phytoplankton, and Related Water-Quality Constituents in the California Sacramento–San Joaquin Delta at the Landscape Scale: Comparison of Four (2018, 2020, 2021, 2022) Spring High-Resolution Mapping Surveys
Links
- Document: Report (41.2 MB pdf) , HTML , XML
- Data Releases:
- USGS data release - Assessing spatial variability of nutrients and related water quality constituents in the California Sacramento–San Joaquin Delta at the landscape scale—2018 High resolution mapping surveys (ver. 2.0, October 2023)
- USGS data release - Assessing spatial variability of nutrients, phytoplankton, and related water-quality constituents in the California Sacramento–San Joaquin Delta at the landscape scale—2020–2021 high-resolution mapping surveys
- USGS data release - Assessing spatial variability of nutrients, phytoplankton, and related water quality constituents in the California Sacramento–San Joaquin Delta at the landscape scale—2022 High resolution mapping surveys
- Download citation as: RIS | Dublin Core
Acknowledgments
This study was done in collaboration with the U.S. Geological Survey (USGS), Delta Regional Monitoring Program, Delta Science Program, and State Water Contractors, with additional funding provided from the USGS Cooperative Matching Funds Program. We thank our funding cooperators for making these mapping surveys possible.
This work relied on the dedication of the USGS California Water Science Center Biogeochemistry Team, including Bryan Downing, Kyle Nakatsuka, Angela Hansen, Ayelet Delascagigas, Keith Bouma-Gregson, Chuck Hansen, Dylan Burau, Alan Gelber, Jacob Brinkman, Nathan Jumps, Balthasar Von Hoyningen Huene, Maura Uebner, Diana Oros, Patrick Dellwo, and more.
Executive Summary
This report summarizes results from boat-based, high-resolution water-quality mapping surveys completed before, during, and after upgrades to the EchoWater Resource Recovery Facility (EchoWater Facility), the regional wastewater facility for the City of Sacramento and surrounding areas, near Elk Grove, California. Surveys were completed in the tidal aquatic environments of the Sacramento–San Joaquin Delta (Delta) in spring (May or June) 2018, 2020, 2021, and 2022. In each survey, a suite of in situ sensors were used to continuously (one measurement per second) measure water-quality conditions, nutrients, phytoplankton abundance, and species composition. In addition to in situ data collection, discrete water samples were collected about every 2 miles while underway for determination of phosphate, ammonium, and nitrate concentration. The boat stopped at about 30 locations to collect discrete samples for a suite of additional analytes, including phytoplankton enumeration. The four surveys represent snapshots in time across different phases of the EchoWater Facility Biological Nutrient Reduction (BNR) upgrade. The May 2018 survey represents conditions before the upgrade. The second survey (June 2020) represents conditions after implementation of the Nitrifying Sidestream Treatment. The third survey (May 2021) was completed immediately after the completion of the BNR upgrade and represents a transitional period, and the final survey (May 2022) represents post-upgrade conditions.
Relevant hydrologic and climatic context such as water-year type, X2 position (the distance from the Golden Gate Bridge to the point upstream where bottom salinity is 2 parts per thousand; Jassby and others, 1995), water export to import ratio, and management actions like the Delta Cross Channel gate operations are presented for each survey so they may be considered in comparisons among surveys. Differences in water-quality parameters, like turbidity, temperature, salinity, pH, and dissolved oxygen (DO) improve understanding of nutrient cycling and phytoplankton dynamics. Because the Delta is a complex system, we divided the study area into hydrologic zones to better examine general trends and obtain a broadscale view of differences among the 4 study years. Results are presented for each survey and parameter using box plots to compare the different hydrologic zones. We also present each parameter using contour maps by survey to display gradients across the system.
The most evident change to water quality in the Delta across surveys is related to the EchoWater Facility BNR upgrade, which included nitrification and denitrification processes. Through this upgrade, effluent ammonium (NH4+) concentrations were reduced by more than 95 percent (from about 2,000 micromolars [µM] to below the reporting limit of 35 µM), and nitrate (NO3−) concentrations increased from near zero to about 500 µM; therefore, the concentration of dissolved inorganic nitrogen (DIN; the sum of NH4+ and NO3−) in the effluent was reduced by about 75 percent between May 2018 and May 2022. The BNR upgrade resulted in a reduction in NH4+ concentrations in aquatic habitats immediately below the facility, designated as the “north Delta tidal transition zone” (Bergamaschi and others, 2024), from about 30 µM pre-upgrade to near zero during the 2022 spring survey, whereas effluent NO3− increased from median concentrations of about 7 µM to about 15 µM. Because of the reduced effluent nitrogen loads and variability in Sacramento River nitrogen loads from upstream sources, DIN concentrations in the north Delta tidal transition zone decreased from a median of 53.3 µM in 2018 to 35.3 µM in 2020, 20.7 µM in 2021, and 11.3 µM in 2022 during the spring surveys.
The changes in DIN concentration and form observed in the north Delta tidal transition zone after the EchoWater Facility upgrade extended downstream but were rapidly altered by hydrologic mixing, biogeochemical processes, and other nutrient source inputs. Most of the Delta indicated near-zero concentrations of NH4+ 1 year after the completion of the EchoWater Facility upgrades represented by the 2022 survey. Exceptions to this finding were observed in the San Joaquin River near Stockton and in Suisun Bay, indicating there are NH4+ inputs to these locations from other sources (for example, Stockton Regional Wastewater Control Facility and Central Contra Costs Sanitary District wastewater treatment plants or agricultural and urban runoff).
Although there was an increase in NO3− concentrations in the north Delta tidal transition zone after the upgrade, increases in NO3− in other zones were not apparent, presumably because nitrification of effluent derived ammonium was no longer a source of NO3−. Concentrations of DIN in many Delta zones were lower in 2022 compared to 2018 and 2020, with concentrations near or below what is considered potentially nitrogen limiting conditions for phytoplankton growth in the North Delta tidal transition zone and the Cache Slough complex channel system. Unrelated to the EchoWater Facility upgrade, NO3− and therefore DIN concentrations increased in the San Joaquin River near Stockton and in adjacent water bodies by survey date (likely associated with increasing drought conditions). The Mokelumne River had low DIN concentrations, except in 2018 when the Delta Cross Channel was open, which allowed nutrient-rich Sacramento River water to flow into this section of the river. Data from these surveys also support the hypothesis that nutrient drawdown during phytoplankton blooms may create localized nitrogen limiting conditions.
The BNR upgrade resulted in lower effluent phosphate (PO43−) concentrations, which lowered PO43− concentrations in some zones of the Delta during the four spring surveys; however, PO43− concentrations throughout the Delta remained above 0.3 µM, indicating that primary productivity was not limited by phosphorous availability. DIN and PO43− decreased after the upgrade in many areas of the Delta, and the DIN to dissolved inorganic phosphorus (DIN:DIP) ratio remained similar to pre-upgrade conditions and was often below the Redfield Ratio of 16, indicating nitrogen is more likely to limit phytoplankton growth than phosphorous. Inputs of dissolved organic carbon (DOC) from the EchoWater Facility are a minor source of this constituent to the Delta, so the upgrade had little to no effect on DOC concentrations across the Delta.
Because phytoplankton abundance and species composition in the Delta are shaped by multiple factors other than nutrients (for example, light availability, temperature, salinity, and predation), it is important to consider these factors (as well as long-term monitoring) in addition to the EchoWater Facility upgrade. Although phytoplankton populations were low across much of the Delta during the spring surveys, several localized phytoplankton blooms (defined here as greater than 15 micrograms per liter [µg/L] of chlorophyll) provide insight into conditions that may favor the growth of beneficial and harmful species.
Introduction
Nutrients play vital roles in estuaries because they regulate the growth of phytoplankton, vegetation, and microbes (Cloern and Dufford, 2005; Dahm and others, 2016; Kraus and others, 2017a). In the Sacramento–San Joaquin Delta (Delta), the landward extent of the San Francisco estuary, concentrations and forms of nutrients vary seasonally and spatially in response to several factors, including point-source and non-point-source loading, hydrologic mixing and transport time, and biogeochemical transformation (for example, nitrification, denitrification, mineralization, uptake, and burial). These factors are affected by environmental drivers, such as temperature, light, and precipitation; by landscape-scale drivers such as water depth, channel and wetland geomorphology, and habitat type; and by management actions such as reservoir releases, gate operations, barriers, and wastewater treatment plant operations (Foe and others, 2010; Parker and others, 2012a; Novick and others, 2015; Kraus and others, 2017a, b; Senn and others, 2020).
From 2019 to 2021, one of the largest point-source dischargers to the Delta, the EchoWater Resource Recovery Facility (EchoWater Facility, formerly known as Sacramento County Regional Wastewater Treatment Plant or Regional San; Jassby, 2008; Novick and others, 2015; Saleh and Domagalski, 2015) underwent major upgrades designed to meet its National Pollutant Discharge Elimination System (NPDES) wastewater discharge permit, which required a reduction of dissolved inorganic nitrogen (DIN) load (Senn and others, 2020; California Regional Water Quality Control Board, 2021). The objective of the upgrade was to shift the dominant form of nitrogen in the EchoWater Facility’s effluent from ammonium (NH4+) to nitrate (NO3−) and reduce total nitrogen loading to the Sacramento River (O’Donnell, 2014; Richey and others, 2018; Senn and others, 2020). To achieve this objective, the EchoWater Facility incorporated a Biological Nutrient Removal (BNR) system into their treatment stream, which included a nitrification step to convert NH4+ to NO3−, followed by a denitrification step that converts NO3− to nitrogen gas (N2).
Because phytoplankton productivity, community composition, and spatial distribution can be affected by nutrient forms and relative abundances (Dugdale and others, 2007; Glibert, 2010; Glibert and Burkholder, 2011; Parker and others, 2012a, b; Senn and Novick, 2014; Glibert and others, 2016; Wilkerson and Dugdale, 2016), the shift in nutrient forms and amounts may cause fundamental changes to the downstream ecosystem (Senn and others, 2020). Changes to phytoplankton productivity as a response to the EchoWater Facility upgrades are presently (2024) unknown, although research has begun in the area (Glibert and others, 2022). Historically, phytoplankton production in the Delta has been low relative to the available nutrients (Jassby and others, 2002; Jassby, 2008); therefore, understanding changes to the lower trophic food web due to changes in nutrient concentrations and forms is a highly anticipated area of study. When the EchoWater Facility Harvest Water Program (https://www.sacsewer.com/harvest-water) commences, there will be further reductions in nutrient loading. The Harvest Water Program will be one of California’s largest water recycling projects and has the potential to direct most of the EchoWater Facility’s treated effluent to farming and wildlife habitat lands rather than to the Sacramento River.
To document changes in nutrients and phytoplankton before, during, and after the EchoWater Facility upgrades, the U.S. Geological Survey (USGS) completed boat-based, high-resolution water-quality, nutrient, and phytoplankton data-collection surveys that covered a large part of the Delta (fig. 1). These surveys are referred to as “mapping surveys.”
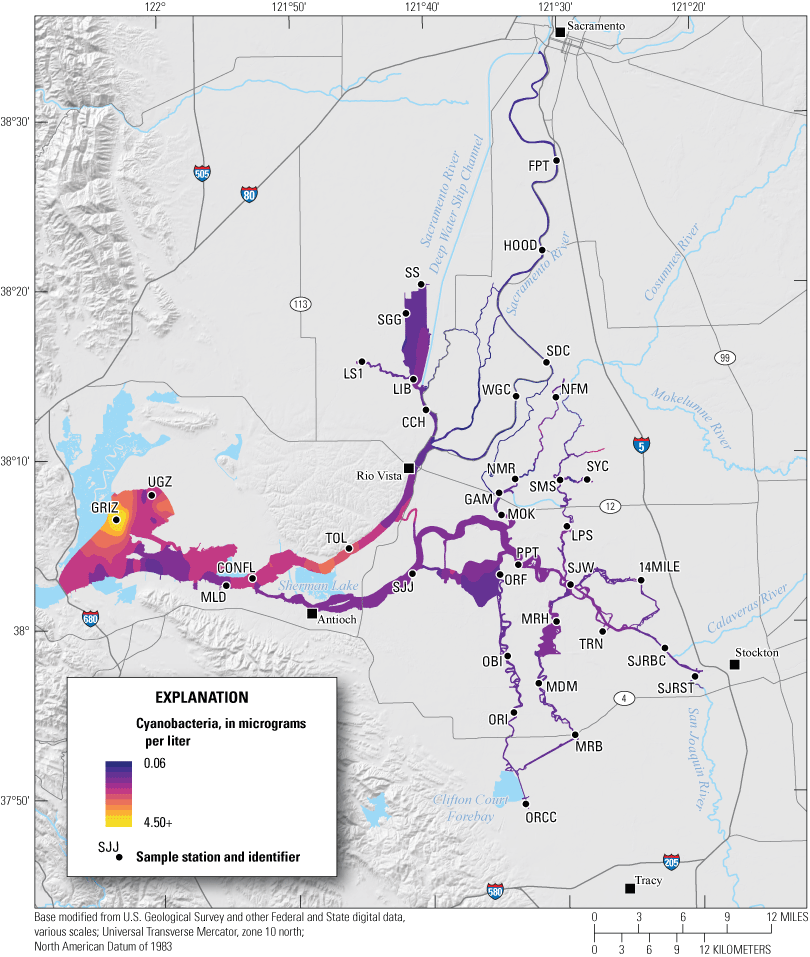
Sacramento–San Joaquin Delta with the spatial extent of the high-resolution boat-based mapping surveys (colored area) and circles indicating where the boat typically stopped to collect discrete samples. The contoured color shows an example of how a parameter can change throughout the system. For explicit boat survey tracks, see figures 3 and 4. Station identifiers (abbreviations) and names are shown in table 4. Abbreviation: +, plus.
The mapping survey technique, developed by the USGS California Water Science Center Biogeochemistry Group, can cover as much as 100 miles (mi) of waterway in a day, providing a measurement of Delta-wide conditions in a relatively short timeframe (3–4 days). The resulting data can be used to provide a snapshot in time (Bergamaschi and others, 2024). Additionally, these data can be used by modelers or others who consider specific conditions (for example, tidal phase, time of day, solar radiation, or wind) that existed during the exact times that data were collected. Data-dense snapshots can be assigned relevant spatial, hydrologic, and climatic contexts for further analysis and comparison across time (Downing and others, 2016; Gross and others, 2023; Brown and others, 2024).
In 2018, the USGS, in cooperation with the Delta Regional Monitoring Program (DRMP), completed three high-resolution water-quality mapping surveys to document the distribution of nutrient concentrations, phytoplankton abundance, and water-quality conditions. The DRMP funded an additional survey in spring 2020, and the USGS received funding from the Delta Science Program to complete two additional surveys in 2020 and three more in 2021. Subsequently, the USGS received funding from California State Water Contractors for three surveys in 2022. Each year, surveys were completed in spring, summer, and fall. This report includes the results and discussion of each of the four (2018, 2020, 2021, 2022) spring surveys to compare conditions before, during, and after the BNR upgrade.
The spring 2018 survey provides information about water-quality gradients before any phase of the EchoWater Facility upgrade and can be considered a control in relation to subsequent surveys. The spring 2020 survey provides information about water-quality gradients after the Nitrifying Sidestream Treatment project, which began in March 2019 and was completed on May 2, 2019. The BNR Phase 1 treatment was completed on September 15, 2020, and about 60 percent of effluent underwent nitrification and denitrification while construction continued. The BNR Phase 2 treatment was completed on April 19, 2021, and 100 percent of effluent underwent the nitrification and denitrification treatment. The spring 2021 survey was done from May 15 to 17 and provides information that immediately followed BNR Phase 2 of the EchoWater Facility upgrade. This period served as a transitional period because higher riverine effluent-derived nutrient concentrations had likely not yet flushed out of the system. The spring 2022 survey provides information collected about a year after the completion of the upgrade. The work funded under each agreement addressed management assessment questions from the Delta Regional Monitoring Program. These questions are identified in three topics: (1) status and trends; (2) sources, pathways, loadings, and processes; and (3) forecasting scenarios (table 1).
Table 1.
Study objectives and questions relevant to Delta Regional Monitoring Program management questions.Understanding the effects of the EchoWater Facility’s 2020–21 BNR upgrade will help inform future management of the Delta. Additional management actions have occurred subsequent to the surveys presented in this report, such as the City of Stockton Regional Wastewater Treatment Control Facility’s upgrade (https://www.stocktonca.gov/services/water,_sewer___stormwater/regional_wastewater_control_facility_modifications_project.php), and more wastewater treatment plant upgrades are planned (for example, Town of Discovery Bay; https://todb.ca.gov/denitrification-project). Furthermore, the EchoWater Facility is undertaking infrastructure plans to provide increased recycled water for farming irrigation as a replacement for pumped groundwater, which will likely reduce their effluent output to the Sacramento River. This effort is referred to as the “Harvest Water project” (https://www.sacsewer.com/harvest-water/). Future collection of similar broad-area, high-spatial-resolution datasets will help document and understand how different management actions (for example, water imports, water exports, gate operations, wetland restoration, and aquatic vegetation control) and changing hydroclimate conditions can affect water quality, nutrients, and phytoplankton in the Delta. Continuing to analyze these data using appropriate statistical methods will allow researchers to identify trends in and controls on these water-quality parameters.
Further analyses of these and other USGS high-resolution water-quality mapping datasets—including the summer and fall Delta-wide mapping surveys—are intended to identify changes more quantitatively in water quality and drivers of nutrient concentrations, forms, ratios, and phytoplankton abundance and species composition across the Delta. Data from these surveys also are being used by modelers to build, calibrate, validate linked hydrodynamic-biogeochemical models, and improve usage of remote sensing data (Fichot and others, 2016; Gross and others, 2019; Lee and others, 2021). Incorporating information from other long-term datasets like phytoplankton enumeration (for example, Richardson and others, 2023a; Perry and others, 2024), zooplankton abundance (for example, Barros, 2022), clam distribution (for example, Zierdt-Smith and others, 2021; Wells and Interagency Ecological Program, 2024), and fish monitoring (for example, Steinke and others, 2018; Mahardja and others, 2019) will further inform the role of management actions in the Delta.
Methods
This report provides a broad comparison of data collected during the 2018, 2020, 2021, and 2022 spring surveys and is being provided to the DRMP to meet USGS deliverables associated with agreement 20ZGJFA6035767. Data referenced in this report are publicly available as data releases from Bergamaschi and others (2020), O’Donnell and others (2023, 2024), and in the USGS National Water Information System (U.S. Geological Survey, 2023; https://waterdata.usgs.gov/usa/nwis).
Data Collection
Four high-resolution, boat-based mapping surveys were done across broad areas of the Delta (fig. 1) in spring 2018, 2020, 2021, and 2022. Each survey was completed over 3–4 consecutive days (table 2).
The methods for each boat-based, high-resolution mapping survey followed the approach described by Downing and others (2016), Fichot and others (2016), Kimmerer and others (2019), Bergamaschi and others (2020), Stumpner and others (2020), and Richardson and others (2023c). Detailed methods for each survey are provided with their associated data: Bergamaschi and others (2020) for 2018 surveys, O’Donnell and others (2023) for 2020 and 2021 surveys, and O’Donnell and others (2024) for 2022 surveys. Briefly, water was continuously pumped from about 1-meter (m) depth to a flow-through system comprised of in situ instruments (including those listed in table 3, among others) deployed on a 26-foot research vessel. The research vessel navigated throughout the Delta at speeds as much as 30 knots (15.4 meters per second), while instruments recorded data at a frequency of 1 unique measurement per second.
Table 3.
List of in situ parameters by instrument included in this report.[µg/L, micrograms per liter; µM, micromolar; °, degree]
During each survey, the research vessel stopped at about 30 fixed stations (fig. 1; table 4) to collect a suite of discrete samples analyzed for concentrations of NH4+, NO3−, nitrite (NO2−), phosphate (PO43−), dissolved organic carbon (DOC), and chlorophyll a captured on a 0.2-micrometer (µm) filter, as well as phytoplankton enumerated according to traditional methods as described by Bergamaschi and others (2020). Additionally, discrete samples were collected about every 2 mi while underway for additional nutrient analysis. In 2018, these additional samples were analyzed for PO43− only, whereas they were analyzed for PO43−, NH4+, NO3− + NO2−, and NO2− during the other 3 years. During some surveys, discrete samples collected at fixed stations also were analyzed for picophytoplankton, optical properties of dissolved organic matter, the fraction of larger celled chlorophyll a containing organisms captured on a 5-micrometer filter, cyanotoxins, suspended sediment concentration and composition, and other constituents; however, those data are not included in this report.
Table 4.
Discrete sampling locations regularly sampled during U.S. Geological Survey (USGS) high-resolution mapping surveys done in the Sacramento–San Joaquin Delta.[Station information is available at U.S. Geological Survey (2023). Sample stations and identifiers are shown on figure 1. Abbreviation: NAD 83, North American Datum of 1983]
Chlorophyll fluorescence (reported in micrograms per liter [µg/L] of chlorophyll) is an in situ measurement used as a proxy for chlorophyll concentration. Although several different chlorophyll fluorometers were deployed during the mapping surveys, we report chlorophyll data collected by the bbe Molaenke FluoroProbe (bbe Moldaenke, Germany), which provides a value for total chlorophyll fluorescence in units of µg/L and attributes that fluorescence to four groups of phytoplankton: (1) diatoms; (2) cryptophytes; (3) cyanobacteria; and (4) green algae (Beutler and others, 2002; Harrison and others, 2018; Delascagigas, 2021). In addition to the high-resolution chlorophyll data, discrete samples were collected at each fixed station (fig. 1; table 4) for phytoplankton enumeration by microscopy. Generally, phytoplankton groupings commonly enumerated in samples from the Delta can be matched to FluoroProbe channels based on primary pigmentation (table 5).
Data Processing
Data (Bergamaschi and others, 2020; O’Donnell and others, 2023, 2024) were median filtered with a 20-second moving window to remove outliers, except for the NH4+ data. Discrete NH4+ data were used to validate data from the continuous ammonium flow-through analyzer (Richardson and others, 2023c), discrete NO3− + NO2− data were used to calibrate data from the SUNA V2 NO3− sensor, and discrete DOC data were regressed against the in situ dissolved organic matter fluorescence (fDOM) data to model DOC concentrations (Bergamaschi and others, 2020; O’Donnell and others, 2023, 2024).
Although the exact temporal (date and time) and spatial (latitude and longitude) attributes of the high-resolution data generated during the surveys are relevant because they can be related to specific hydroclimate data (for example, point in the tide or time of day) and specific landscape-scale factors (for example, geomorphology or aquatic vegetation), these exact attributes make it difficult to compare data across surveys. Likewise, different routes were taken during each survey, and some locations were mapped twice in 1 day (for example, dead-end sloughs) or mapped on more than 1 day because of overlapping transects. Thus, to facilitate comparison among dates, data were geo-rectified in a method that minimized effects of disparate data density. Briefly, the GeoPandas software library (Jordahl and others, 2020) in Python was used to assign the median-filtered data attributes from Delta-wide polygon shapefiles that are spaced at about 150-m intervals, including a polygon identifier (ID; identifier unique to each 150-m length shapefile) and geospatial information, like the regions presented on figure 2 and finer resolution metadata, like slough, river reach, bay, and so on. Polygon identification numbers were used to aggregate data and obtain summary statistics. To make contour maps, raster images were created using these data with Environmental Systems Research Institute, Inc. (Esri) ArcGIS Pro version 2.2.1 Spline with Barriers tool (based on Terzopoulos and Witkin [1988]; Esri, Inc., Redlands, California). The Focal Statistics tool in ArcGIS Pro (Esri, Inc., Redlands, California) was then used to smooth the raster, and data were interpolated (where missing) with the ArcGIS Extract Multi Values to Points tool (Esri, Inc., Redlands, California). The Contour tool in ArcGIS Pro (Esri, Inc., Redlands, California) was used to convert the smoothed and interpolated rasters to vectors, and then the National Hydrography Dataset (U.S. Geological Survey, 2016) was used to clip the polygons into the final format included in this report.
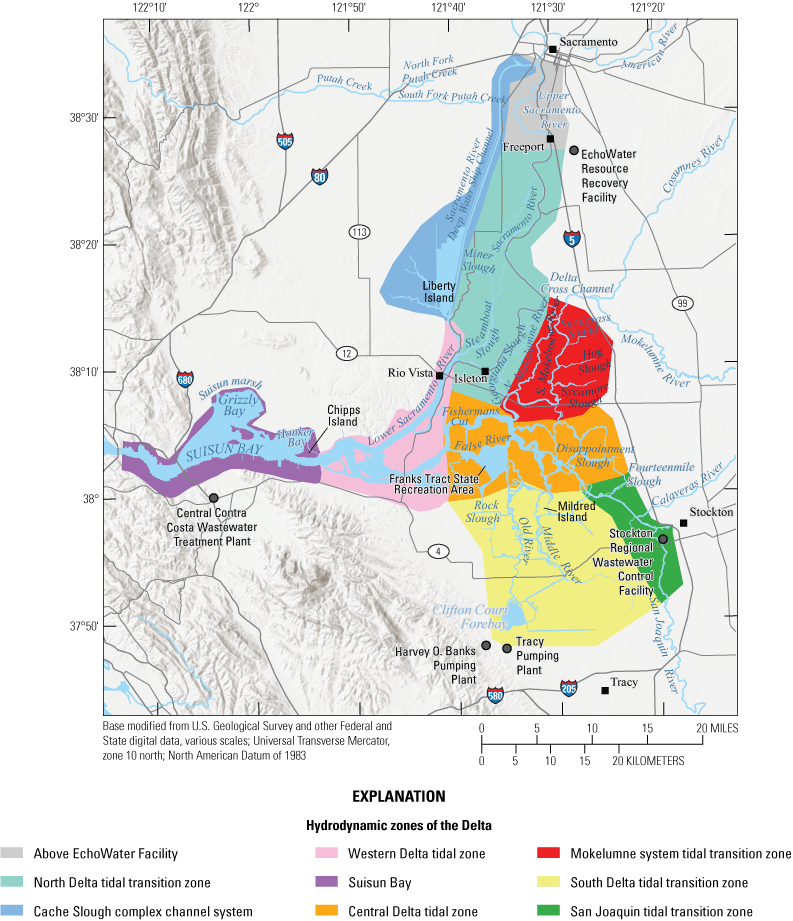
Study area of the Sacramento–San Joaquin Delta colored by zone.
The surveys were done across nine broadly defined hydrodynamic zones of the Delta (fig. 2; Jabusch and others, 2016; Bergamaschi and others, 2024; Brown and others, 2024). The three tidal transition zones represent locations where river flow transitions from flowing toward the sea (gravity-driven) to being mostly tidally driven. Tidal zones are locations where the major hydrologic effect is tidal forcing. The Suisun Bay zone encompasses the brackish zone, which connects the Delta to the San Francisco Bay.
Routes taken by the research vessel were similar, but not identical, across surveys (fig. 3; Bergamaschi and others, 2020; O’Donnell and others, 2023, 2024). Only data collected in the same location (for example, within 150 m of each other) of all four spring surveys (fig. 4) are presented in the box plots presented in this report). Data were separated by zones, defined on figure 2, and shown in box plots to use as companions to the provided Delta-wide contour maps. The contour maps are for exploring gradients across the Delta during the same general period (for example, spring) and for visual reference of differences across study periods.
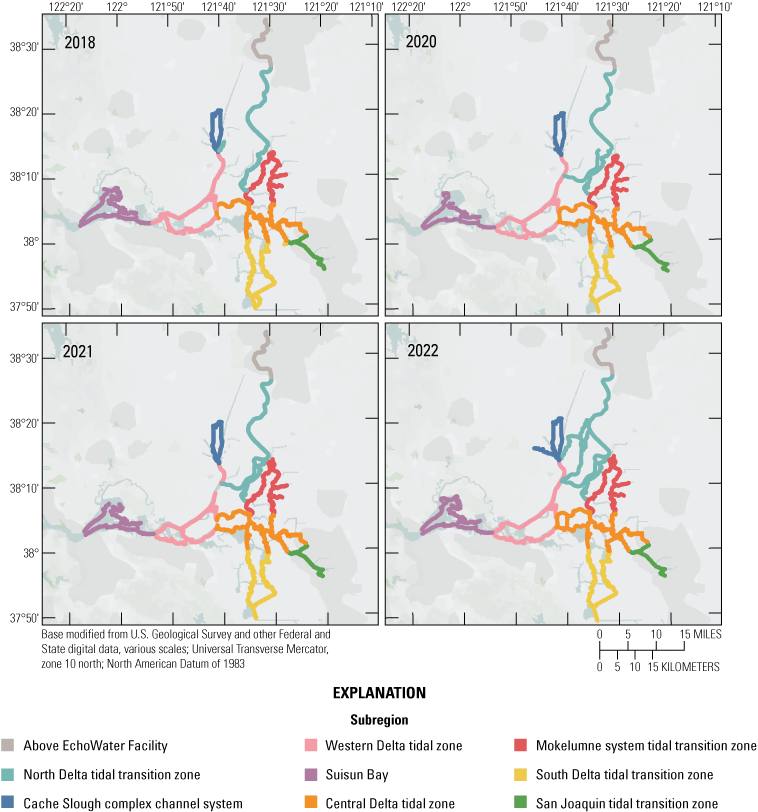
Boat tracks for each of the four spring mapping surveys. Tracks are colored by Sacramento–San Joaquin Delta zone (fig. 1).
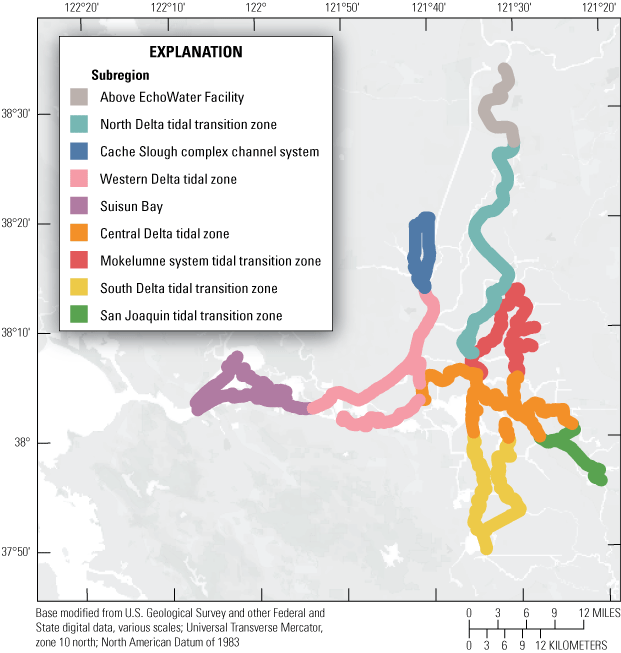
Boat tracks that overlapped in each survey after georectification. Only data collected in these locations on all four dates are presented in the box plots included in this report. All data collected (fig. 3) are represented in the contour plots.
Hydrologic, Climatic, and Management Operations Context
When comparing water-quality conditions in the Delta among different dates, it is imperative to consider hydrologic and climatic conditions and water-management operations (table 6). Although hydrodynamics are greatly affected by water-year type, particularly during winter storms, most of the year freshwater flows through the Delta and are determined by management actions, such as reservoir releases, water exports, gate operations, and the placement of barriers. These factors determine total Delta inflow, exports, and outflow to San Francisco Bay and affect water-quality gradients across the system. Specifically, these hydrologic and climatic metrics affect water residence time and mixing (especially of saline and freshwater), dilution of point and non-point inputs, biogeochemical transformation of constituents, and phytoplankton abundance and community composition.
Table 6.
Hydrologic and climatic conditions and management operations for each spring mapping survey.[See text for details and references. Abbreviations: BNR, biological nutrient reduction; ft3/s, cubic foot per second; km, kilometer; X2, distance from Golden Gate Bridge where bottom salinity is 2 parts per thousand]
Water-Year Type
The Sacramento and San Joaquin Valley Water Year Hydrologic Classification Index—commonly referred to as “water-year type”—is calculated by the California Department of Water Resources (CDWR) for the Sacramento and San Joaquin River Basins based on modeled, unimpaired water runoff (California Department of Water Resources, 2024a). Unimpaired water runoff is defined as the natural water production of a river basin unaltered by upstream diversions, storage, and export of water to or import of water from other basins. The index categorizes each water year (October 1 to September 30) as one of the following: wet, above normal, below normal, dry, or critical.
For the Sacramento River Basin, water year 2018 is defined as “below normal,” 2020 is defined as “dry,” and water years 2021 and 2022 are defined as “critical” (fig. 5).
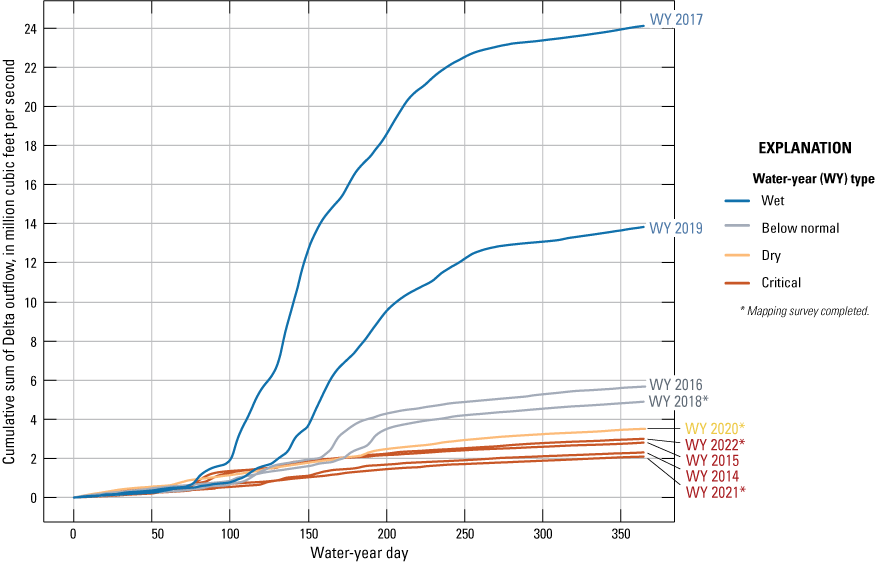
Cumulative sum of Sacramento–San Joaquin Delta outflow at Chipps Island (not shown) colored by water-year type for water years 2014–22. Data are from California Department of Water Resources (2024b).
To demonstrate how the outflow can differ by water year, the cumulative sum of Delta outflow at Chipps Island (fig. 2) in million cubic feet per second (Mft3/s) by water year is shown on figure 5 for water years 2014–22. A stark difference in cumulative outflow is evident by water-year type. Water years with higher cumulative outflow are associated with lower water residence time, lower salinity in the estuary, and higher dilution of some nutrient inputs, like wastewater treatment plant effluent, but can also increase upstream nutrient loading in the Sacramento River due to increased runoff. Previous water-year types may affect subsequent water years, particularly during the spring surveys; the 2018 and 2020 surveys were preceded by wet water years.
Delta Outflow
Delta outflow is a measure of the net amount of freshwater that passes through the Delta into San Francisco Bay and is determined by a water balance (combination of inflows and exports; California Department of Water Resources, 2024b). The average daily measurement is an estimate of net outflow at Chipps Island, a location at the confluence of all major tributaries to the estuary (fig. 2). The data shown on figure 6 are the daily average Delta outflow and are used to determine the cumulative sums shown on figure 5. The vertical lines on figure 6 indicate when the four spring surveys were completed. The May 2018 survey took place after major flows and captured the highest flows of the four surveys. In context, however, the Delta outflow was still relatively low during the May 2018 survey compared to much of the following year (water year 2019).
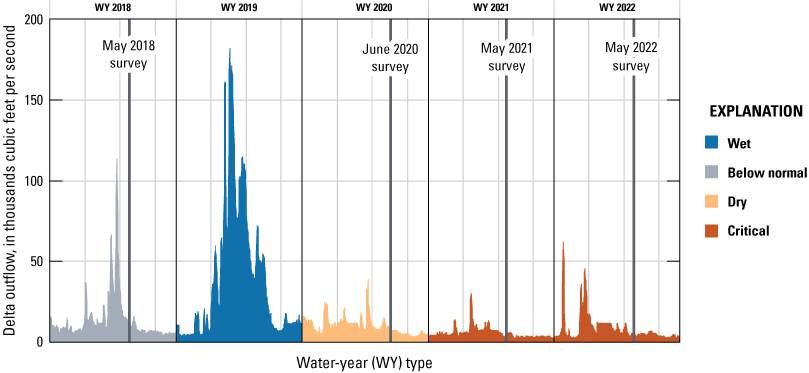
Daily Delta outflow by water year, colored by water-year type. Vertical lines represent survey dates. Data are from California Department of Water Resources (2024b).
The mean Delta outflow ranged from 4,955 to 9,738 cubic feet per second (ft3/s) during the four spring surveys, decreasing each survey (fig. 6; table 6). The lower flows in the later surveys are associated with higher water residence time and less constituent dilution, especially compared to the initial 2018 survey. Longer water residence time allows more time for biogeochemical transformations, more time for phytoplankton growth, and allows slower growing phytoplankton species to compete with faster growing species (Smith and others, 2014).
Export:Outflow Ratio
Relating Delta exports to Delta outflow can give insight into Delta hydrodynamic conditions. Delta exports are the sum of water diverted from the Central Valley Project pumping at Tracy Pumping Plant, the Contra Costa Water District diversions at Middle River, Rock Slough and Old River, the North Bay aqueduct and State Water Project exports, including the Harvey O. Banks Pumping Plant or Clifton Court Forebay intake (fig. 2; California Department of Water Resources, 2021). The ratio of water diverted from the system to that flowing into the San Francisco Bay, referred to as the “export:outflow ratio,” approaches zero when water exports are small relative to water outflow to the ocean (California Department of Water Resources, 2021). A higher export-to-outflow ratio reflects that a higher proportion of freshwater inflows to the Delta are diverted for use within the Delta or elsewhere, rather than flowing out to the bay. Across an annual timescale, the ratio typically is lowest in late spring when winter runoff and reservoir outflow are greatest and during storms, which are more typical in the late fall and winter. There is a steady increase in the ratio in June relative to May across most years and is consistent with pumping requirements for agriculture. The average daily export:outflow ratio for each spring survey was 0.16, 0.23, 0.11, and 0.16, respectively (table 6). The 2020 survey, which was done in June rather than May (delayed due to the coronavirus disease 2019 [COVID-19] pandemic), reported a higher average export:outflow ratio compared to the other three surveys.
Because the average Delta outflow measurement in 2022 was about 50 percent of what it was in 2018, yet average export:outflow ratios for the 2 years were equal, this means Delta exports also decreased by about 50 percent in 2022 compared to 2018. This result can be attributed to the ongoing drought. The average export:outflow ratio was lowest during the 2021 survey, although Delta outflow was second lowest amongst the surveys at 5,308 ft3/s (table 6). The pumping was likely lowest during the 2021 survey because of the lack of rain that water year and subsequent limits on exports (figs. 5–6).
X2 Position
Another metric that provides information about water-quality conditions in the Delta is the position of X2, which is defined as the distance from the Golden Gate Bridge to the point upstream where bottom salinity is 2 parts per thousand (Jassby and others, 1995). For example, target X2 positions in October after an above-normal water year are less than or equal to 74 kilometers (km; Crader and others, 2010). The Bureau of Reclamation and CDWR are tasked with managing X2 based on Action 4 of the U.S. Fish and Wildlife Service Reasonable and Prudent Alternative regulations designed to protect aquatic life in the Delta (National Research Council, 2010). This task is achieved by managing both reservoir releases to the Delta and exports out of the Delta. X2 positions farther upstream reflect lower freshwater flows from the Delta, allowing saline water from the San Francisco Bay to move farther upstream and can indicate that encroaching brackish water is reducing the area of freshwater habitats where productivity by phytoplankton is typically higher.
The average X2 position during the period of mapping in May 2020, 2021, and 2022 was farther upstream (78, 84, and 83 km, respectively) relative to May 2018 (70 km) and was consistent, given that 2018 was a wetter year based on the water year index. The X2 position was farther upstream in the later years compared to the spring 2018 survey, which indicates the species composition between the X2 positions may differ because the area of freshwater phytoplankton habitat may have been reduced with each survey and likewise the habitat for euryhaline phytoplankton may broaden. Because the increase in X2 through surveys is directly related to worsening drought conditions, we will primarily focus on the effects of droughts in this report instead of framing by effects of X2.
Delta Cross Channel Status
Water resource management affects water flow and mixing in the Delta. For example, when open, the Delta Cross Channel (DCC) allows Sacramento River water to flow to the Mokelumne River and into the San Joaquin River via Snodgrass Slough (fig. 2). Because EchoWater Facility effluent enters the Sacramento River upstream from the DCC when the gates are open, higher nutrient-containing water is diverted into the northern end of the Mokelumne system tidal transition zone (fig. 2). As such, DCC operations must be considered in our comparison among survey dates. Each of the four spring mapping surveys described in this report were done when the DCC was closed (Bureau of Reclamation, 2022); however, before the spring 2020 survey (June 8–11), the DCC had been opened from May 22 to 26, May 30 to June 1, and June 6 to 8. In 2021, a series of DCC gate operation tests were done 6 days before the spring survey (May 11–14), which consisted of three brief openings (each about 30 minutes) pulsing Sacramento River water into Snodgrass Slough (Bureau of Reclamation, 2022).
Drought Barrier Status
One distinct difference during the spring 2022 survey was the presence of the emergency drought salinity barrier near the mouth of the west False River (fig. 2). This barrier is only put in place during extreme drought conditions. The purpose of this barrier is to limit salinity intrusion into the central Delta to protect the quality of water exported from the Delta for drinking water and irrigation (Kimmerer and others, 2019). The placement of the barrier alters flow by decreasing tidal dispersion into the Franks Tract State Recreation Area (fig. 2).
EchoWater Facility Status
Effluent inflow to the Sacramento River from the EchoWater Facility is identified as one of the main drivers of nutrient concentrations in the Delta, particularly during low flow periods when upstream nutrient concentrations are low and effluent inputs are less diluted (Senn and others, 2020). Although the total amount (loading) of nutrients entering the Delta from the EchoWater Facility is a function of effluent nutrient concentrations and effluent flow (concentration and volume), the resulting riverine concentration is affected by the ratio of effluent flow to river flow (dilution). Typical EchoWater Facility effluent volumes comprise about 1–3 percent of the total Sacramento River flow during spring conditions; however, during low flow periods when river reversals occur in this part of the river, effluent contributions can increase to 6 percent for brief periods (typically less than 1 hour), resulting in parcels of water with higher concentrations of effluent-derived nutrients in the river (O’Donnell, 2014; Kraus and others, 2017a). Thus, lower Sacramento River flows associated with drought periods (for example, 2020 and onward within this report) had higher percentages of EchoWater Facility effluent in the Sacramento River, as well as longer water residence times.
Because there were key changes to EchoWater Facility effluent nutrient concentrations and forms between the spring surveys, the percentage of effluent in relation to flow conditions is not the only key factor to consider regarding EchoWater Facility operations. Between the spring 2018 and 2020 surveys, EchoWater Facility effluent had a notable increase in NO3− concentration after the implementation of the Nitrifying Sidestream Treatment project (fig. 7). BNR Phase 1 began in fall 2020, and Phase 2 was implemented just before the spring 2021 survey. The final spring 2022 survey was completed just over 1 year after the BNR Phase 2 upgrade implementation. Effluent nitrogen concentration data (fig. 7) indicated that EchoWater Facility upgrades effectively reduced NH4+ effluent concentrations from about 1,500–2,500 micromolars (µM; about 20–35 milligrams per liter [mg/L] of nitrogen) to near zero (the reporting limit for effluent NH4+ concentration is 35.7 µM, equivalent to 0.5 mg/L of nitrogen) and increased NO3− concentrations from near zero (the reporting limit for effluent NO3− concentration is 7.1 µM, equivalent to 0.1 mg/L of nitrogen) to about 500 µM (about 7 mg/L of nitrogen); as a result, effluent DIN (NH4++NO3−+NO2−) was reduced by more than 80 percent. In addition to decreases in effluent inorganic nitrogen inputs, the upgrade also resulted in lower phosphorus (P) concentrations, both for PO43− and total P (fig. 8).
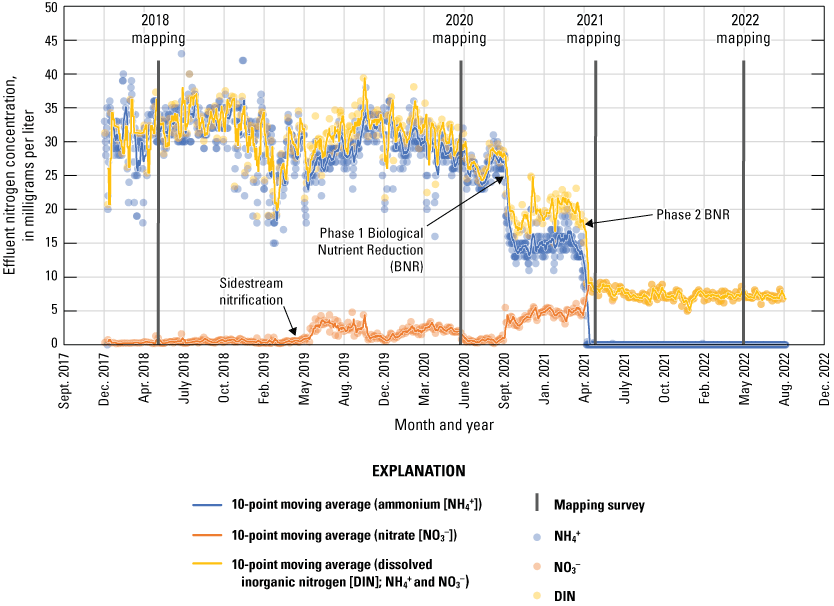
Concentrations of nitrogen in the form of ammonium (NH4+), nitrate (NO3−), and their sum (dissolved inorganic nitrogen [DIN]) in EchoWater Facility’s treated effluent discharged into the Sacramento River from October 2018 to September 2022. Data from the EchoWater Facility. Circles represent raw data; lines represent 10-point moving average.
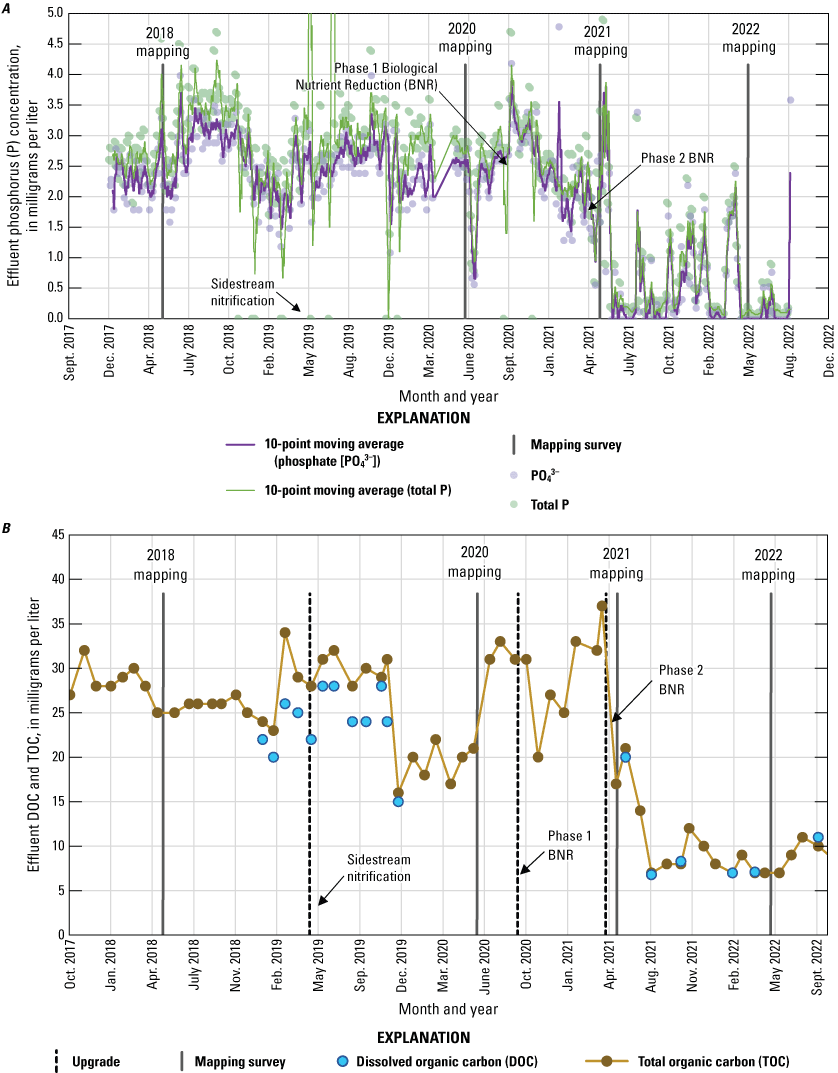
Concentrations of A, total phosphorus (P) and orthophosphate (PO43-) in milligrams per liter; and B, total organic carbon (TOC) and dissolved organic carbon (DOC) in milligrams per liter in EchoWater Facility treated effluent discharged into the Sacramento River from October 2018 to September 2022. Data from EchoWater Facility. Circles represent raw data.
Nutrient Distribution
The nutrient concentrations measured during the four spring surveys included those known to be directly targeted by the EchoWater Facility BNR process—NH4+ and NO3− and therefore, DIN—as well as PO43− and DOC. The greatest change to nutrient concentrations in the Delta across the four spring surveys was expected to occur in the reaches immediately downstream from Freeport, where EchoWater Facility effluent enters the Sacramento River (fig. 2). These reaches include the main stem of the Sacramento River down to Isleton, Georgiana Slough, Steamboat Slough, and Miner Slough, which are all considered part of the north Delta tidal transition zone (fig. 2). Because the EchoWater Facility upgrade lowered effluent concentrations of NH4+ and increased concentrations of NO3−, it was expected that those changes would be mirrored in the downstream reaches of this zone—particularly because water travel times through these reaches typically range from 1 to 4 days, providing only limited time for biogeochemical transformation of effluent-derived nitrogen (Kraus and others, 2017a, b; Fackrell and others, 2022). However, due to variable mixing, water residence time, biogeochemical transformations, and other point and non-point sources of nutrients, effects on locations farther downstream in the Delta were uncertain (Senn and others, 2020).
Each nutrient measured during these mapping surveys displayed unique patterns in concentration within the Delta during a given survey and across the survey dates within the same zone. Here, we discuss patterns in individual constituents by survey date and Delta zone, using boxplots (fig. 9) and visual inspection of Delta-wide contour maps (fig. 10) to provide insights into the state of the Delta across the four spring surveys (2018, 2020, 2021, and 2022).
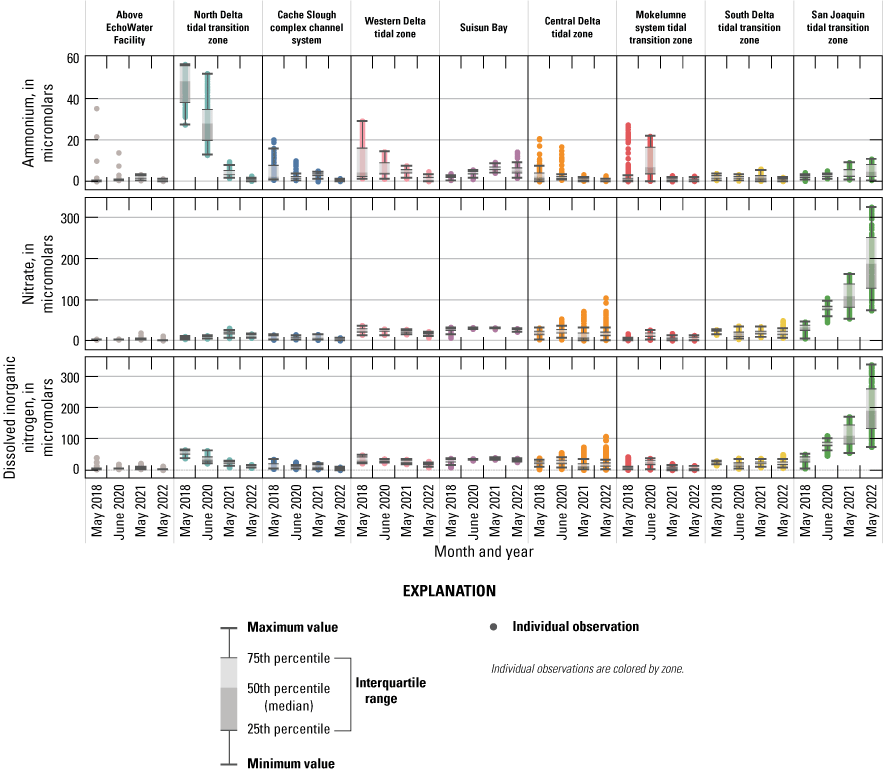
Median, interquartile range, and distribution of ammonium, nitrate, and dissolved inorganic nitrogen concentrations within each zone of the Sacramento–San Joaquin Delta, California. Units are in micromolar.
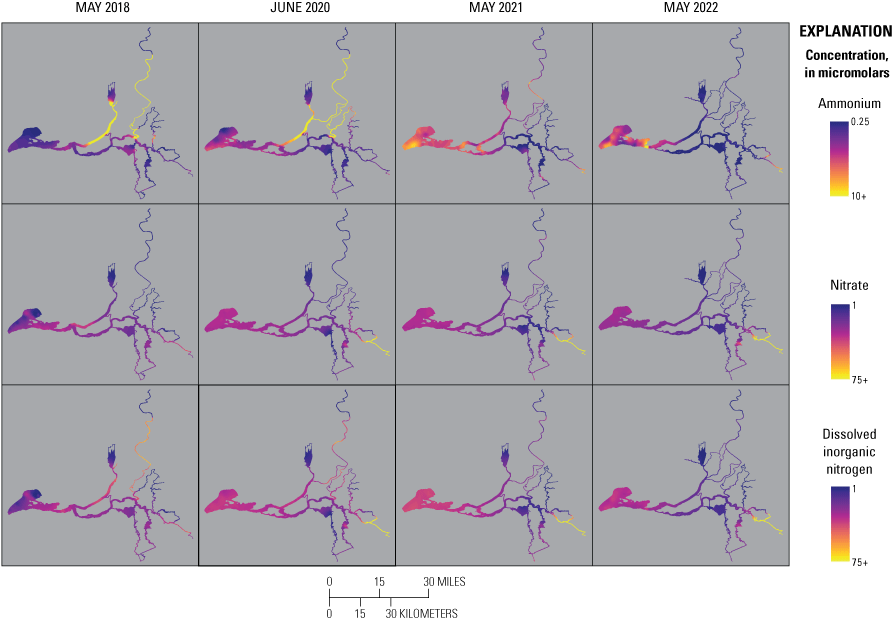
Concentration of ammonium (NH4+, top), nitrate (NO3−, middle), and dissolved inorganic nitrogen (DIN=NO3− + NH4+; bottom) measured during the spring 2018, 2020, 2021, and 2022 surveys. Color bars do not necessarily correspond to the full range of values measured. Note the difference in the NH4+ color bar range compared to NO3− and DIN. Abbreviations: =, equals; +, plus.
Ammonium
Main findings are listed here:
-
• In the north Delta tidal transition zone, the zone just below the EchoWater Facility, median NH4+ concentrations were an order of magnitude lower in the 2021 and 2022 spring surveys (3.3 and 0.3 μM, respectively) after the EchoWater Facility upgrade compared to pre-upgrade concentrations measured in the 2018 and 2020 spring surveys (47.9 and 27.8 μM, respectively).
-
• In the Mokelumne system tidal transition zone during the spring 2020 survey, there was a large increase in median NH4+ concentration resulting from the opening of the Delta Cross Channel. This increase primarily affected NH4+ concentrations in the North Fork of the Mokelumne River.
-
• Maximum NH4+ concentrations decreased in each Delta zone by the survey date, with a few notable exceptions:
-
• During the spring 2022 survey, well after the BNR upgrade, most zones contained low concentrations of NH4+, commonly near the level of detection. Notable exceptions, where high concentrations of NH4+ were measured, occurred in the San Joaquin tidal transition zone, Suisun Bay, and the lower Sacramento River section of the western Delta tidal zone, reflecting point source NH4+ inputs other than the EchoWater Facility, including the Stockton Regional Wastewater Control Facility and Central Contra Costa Wastewater Treatment Plant (fig. 2).
Concentrations of NH4+ across the study area ranged from a high near 57 μM in the north Delta tidal transition zone during the 2018 survey to negligible (near zero) concentrations in all zones during the May 2022 survey (figs. 9–10; tables 1.1–1.9). In the segment of the Sacramento River, above the EchoWater Facility, which serves as a control zone where nutrients and water quality are unaffected by EchoWater Facility effluent discharge, median NH4+ concentrations were 0.3, 0.8 1.9, and 0.4 μM during the 2018, 2020, 2021, and 2022 spring surveys, respectively (fig. 9; table 1.1). These concentrations indicated no decrease through time that might confound the effects of the upgrade. It is worth noting that during the 2018, 2021, and 2022 surveys, flows were reversing at Freeport, requiring the EchoWater Facility to halt effluent flows during peak flood tide periods to meet its permit requirements. Nevertheless, when river flows reverse, effluent-containing river water can be transported upstream into this zone, which explains the high outlier NH4+ concentrations observed in the Sacramento River above the EchoWater Facility in 2018 and 2020 (fig. 9).
In the main stem of the Sacramento River, NH4+ concentrations immediately below the EchoWater Facility remained elevated during the 2021 spring survey, even though it was completed several days after the BNR Phase 2 upgrade was fully implemented (fig. 7). This lag may represent a reservoir of effluent-derived NH4+ that was retained in this river reach (for example, due to incomplete flushing or sediment storage) and was released over time after the upgrade (Senn and others, 2020). It seems this reservoir was depleted by the spring 2022 survey.
The highest NH4+ concentrations (greater than 50 μM) were measured in the north Delta tidal transition zone, in the Sacramento River reaches, just downstream from the EchoWater Facility’s effluent inflow location in 2018 and 2020, before the wastewater treatment plant upgrade (fig. 10; table 1.1). The high variability in NH4+ concentrations in this zone in 2018 and 2020 primarily is a result of hourly changes in the ratio of effluent flow to river flow, which determines effluent dilution (O’Donnell, 2014; Kraus and others, 2017b). As expected, NH4+ concentrations were much lower in the north Delta tidal transition zone in 2021 and 2022 after the BNR upgrade, at 3.3 and 0.3 μM median concentrations, respectively (figs. 9–10; table 1.2).
Farther downstream from the EchoWater Facility, in the Cache Slough complex channel system and western Delta tidal zone, similar patterns in NH4+ concentration were observed; the maximum values decreased after the upgrade (figs. 9–10; tables 1.3–1.4). Suisun Bay had lower NH4+ concentrations in the 2 years prior to the upgrade compared to the 2 years after (figs. 9–10; table 1.5, discussed below). In the central Delta tidal zone and Mokelumne system tidal transition zone, maximum NH4+ concentrations during the first two surveys (pre-BNR upgrade) were greater than 15 μM, whereas the highest measured concentrations were near 3 μM during the latter two surveys (fig. 9; tables 1.6–1.7). One key difference in NH4+ concentration trends between the two zones, however, can be seen in the Mokelumne system tidal transition zone in spring 2020, where the median NH4+ concentration of 7.2 μM was the highest out of the four surveys (fig. 9; table 1.7). This difference is because the DCC was open just before the 2020 spring survey, allowing Sacramento River water that contained effluent-derived NH4+ to flow into this zone, whereas the zone was isolated from these inputs by DCC gate closures in other years (fig. 10; table 6). In spring 2020, elevated NH4+ concentrations that extended into the Mokelumne River indicate that even short periods of opening the DCC gates can alter water quality in the Mokelumne River tidal transition zone.
Concentrations of NH4+ in Suisun Bay, the south Delta tidal transition zone, and the San Joaquin tidal transition zone were less variable through time than the other zones, with no clear trends associated with the EchoWater Facility upgrade (figs. 9–10). Concentrations of NH4+ in these areas are less affected by inputs from the Sacramento River and more affected by local point and non-point sources, including other riverine or wetland inputs, other wastewater treatment plants, or internal biogeochemical cycling. Notably, trends of increasing maximum NH4+ concentrations through time were measured in Suisun Bay and the San Joaquin tidal transition zone (figs. 9–10). In spring 2022, well after the upgrade, median NH4+ concentrations in the San Joaquin tidal transition zone and Suisun Bay (each ~5 μM) were higher than the north Delta tidal transition zone (0.3 µM, fig. 9; tables 1.2, 1.5, 1.9), indicating that there are other sources of NH4+ to the Delta that need to be considered other than the EchoWater Facility, including the Stockton Regional Wastewater Control Facility and Central Contra Costa Wastewater Treatment Plant (fig. 2). In spring 2021 and 2022, in Suisun Bay, NH4+ concentrations were higher than concentrations measured in the upstream western Delta tidal zone in some areas, indicating local inputs of NH4+ to Suisun Bay (figs. 9–10).
The increase in NH4+ concentrations in 2021, in Suisun Bay, was most notable in deep waters (fig. 10). Suisun Bay receives nutrient inputs locally from the Central Contra Costa Sanitary District Wastewater Treatment Plant and Suisun marsh, which likely contributed to higher NH4+ concentrations (fig. 2). However, the increased position of X2 (table 6) at the time of the 2021 spring survey may have also played a role; higher salinity indicates less dilution of freshwater inputs, and higher salinity may have affected phytoplankton community dynamics in a way that resulted in lower NH4+ uptake by phytoplankton. The patches of Suisun Bay that indicate depleted NH4+ concentrations are spatially associated with higher chlorophyll concentrations (see the “Phytoplankton Abundance and Species Composition” section).
In addition to examining where we observed higher NH4+ concentrations, it is relevant where we observed very low values of NH4+, particularly before the upgrade, because it indicates locations where NH4+ sinks (for example, nitrification or uptake by phytoplankton, plants, and bacteria) are greater than NH4+ sources (for example, inputs, remineralization, and benthic release). These locations appear to include the northern part of the Cache Slough complex channel system and areas off the Mokelumne River, including Hog, Sycamore, and Fourteenmile Sloughs (figs. 2, 10).
Nitrate
Main findings are listed here:
-
• In the north Delta tidal transition zone, the zone just below the EchoWater Facility, median NO3− concentrations were higher in spring 2021 (17 μM) and 2022 (10 μM) after the EchoWater Facility upgrade compared to pre-upgrade concentrations measured in spring 2018 and 2020 (7 and 8 μM, respectively).
-
• The highest NO3− concentrations (mean, median, maximum, and minimum) were measured in the San Joaquin tidal transition zone, and NO3− concentrations increased by the survey date in this zone, likely associated with increasing drought conditions.
-
• In the central Delta tidal zone, whereas maximum NO3− concentrations increased by the survey date, median values were lower in 2021 and 2022 (post-upgrade) relative to 2018 and 2020 (pre-upgrade).
-
• In the western Delta tidal zone, maximum NO3− concentrations decreased by survey, and the lowest median concentrations were measured in 2022 (16 versus about 21–24 μM during the first three spring surveys).
-
• In Suisun Bay, there was a NO3− drawdown during the May 2018 survey that is linked to a diatom bloom.
-
• In the Mokelumne system tidal transition zone, the highest mean, median, maximum, and minimum NO3− concentrations during the June 2020 survey can be attributed to the opening of the DCC.
Nitrate concentrations across the Delta revealed a larger range than NH4+; NO3− concentrations were greater than 300 µM in the San Joaquin tidal transition zone during the spring 2022 survey but were below the detection limit (less than 1 μM) in locations above the EchoWater Facility, in the northern part of the Cache Slough complex, and parts of the Mokelumne River and central Delta tidal transition zone (figs. 9–10; tables 1.1, 1.3, 1.6–1.7, 1.9). Because NO3− concentrations in the San Joaquin tidal transition zone during the spring 2022 survey were about 3 times higher than the highest value in any other survey, these data were replotted without the San Joaquin tidal transition zone to better view trends within other zones (fig. 11).
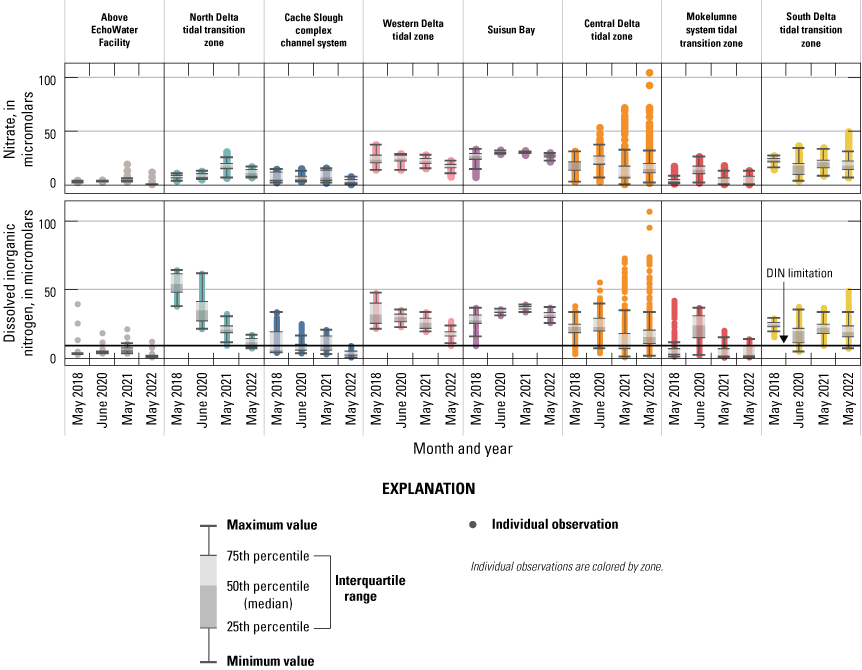
Median, interquartile range, and distribution of nitrate (NO3−; top) and dissolved inorganic nitrogen (DIN=NO3−+ ammonium [NH4+], bottom) concentrations within each zone, excluding the San Joaquin tidal transition zone (fig. 9). Units are in micromolar (µM). The reference line on the bottom plot indicates the conservative level of 9.3 µM DIN, which may limit phytoplankton growth (Reynolds, 1999; Chorus and Spijkerman, 2021). Abbreviations: =, equals; +, plus.
As expected, NO3− concentrations increased in the north Delta tidal transition zone after the EchoWater Facility upgrade because of the implementation of the BNR process, which converts effluent NH4+ to NO3− via nitrification but does not have complete conversion of NO3− to N2 gas via denitrification. Just below the EchoWater Facility, median NO3− concentrations in the Sacramento River were higher in spring 2021 (17.1 μM) and 2022 (10.4 μM) after the BNR upgrades compared to pre-upgrade concentrations measured in spring 2018 and 2020 (7.1 and 7.6 μM, respectively; fig. 11; table 1.2). Conversely, the highest mean, median, and maximum NO3− concentrations within the north Delta tidal transition zone were measured in 2021, immediately after the EchoWater Facility upgrade (figs. 9–11; table 1.2); this reflects differences not only in effluent nutrient concentration but also effluent dilution, which is a function of effluent discharge volume and river flow.
Unlike NH4+, where the highest concentrations were measured in the Sacramento River just below Freeport due to pre-upgrade effluent inputs from the EchoWater Facility, the highest concentrations of NO3− were measured on the San Joaquin River. The high concentrations of NO3− in the San Joaquin River are presumably due to inputs from the Stockton wastewater treatment plant and agricultural return waters (figs. 2, 9–10; Novick and others, 2015; Dahm and others, 2016; Saleh and Domagalski, 2021). The increase in NO3− concentrations through time in the San Joaquin tidal transition zone seems to be confined to the San Joaquin River south of Fourteenmile Slough (figs. 2, 10), indicating that the San Joaquin River imports water that has higher NO3− concentration to the Delta. Furthermore, there was a substantial increase of NO3− concentrations in the San Joaquin tidal transition zone through time. These increases may be due to drought conditions and lower river flows that became more severe in 2021 and 2022.
Higher NO3− concentrations also appear in the maximum values measured in the central Delta tidal transition zone during the later surveys. However, median NO3− concentration values in this zone were higher in the first two surveys than the latter two (20.1 and 20.3 µM in 2018 and 2020, respectively, versus 8.0 and 14.7 µM in 2021 and 2022, respectively; table 1.6). Although most of the central Delta tidal transition zone may be decreasing in NO3− concentration, localized increases over time appear in some areas due to increases in San Joaquin River inputs.
Decreasing maximum NO3− concentrations occurred through time in the western Delta tidal zone, and 2022 had the lowest median (about 16 versus about 21–24 µM) and minimum (about 7.5 versus about 14–15 µM) values of all four surveys (figs. 10–11; tables 1.4–1.5). In Suisun Bay, NO3− concentrations included much lower values in 2018, with a range of 7.2–33.1 µM compared to the next three surveys, which had fewer variable concentrations, with ranges of about 22 to 32 µM (figs. 10–11; table 1.5). Similar to NH4+, these lower Susin Bay NO3− concentrations measured during the spring of 2018 seem to be in the shoals and are associated with a concomitant localized diatom bloom (see the “Phytoplankton Abundance and Species Composition” section). However, median nitrate values in Suisun Bay were similar in 2018, 2020, 2021, and 2022 (26.0, 30.2, 30.2, and 26.4 µM, respectively).
In the Mokelumne system tidal transition zone, the highest median NO3− value was observed during the spring 2020 survey (13.6 µM; figs. 10–11; table 1.7), attributed to the opening of the DCC gates immediately before the 2020 survey, which allowed effluent containing Sacramento River water to enter this zone (table 6). Median NO3− concentrations in the Mokelumne system tidal transition zone were similarly low during the 2018 (2.5 µM), 2021 (0.5 µM), and 2022 (1.6 µM) spring surveys, reflecting low NO3− contributions from the Mokelumne River.
There is no evident trend in NO3− concentration in the south Delta tidal transition zone through time; however, like in the San Joaquin tidal transition zone, median and maximum NO3− concentrations peaked in the spring 2022 survey (figs. 10–11). These higher concentrations are thus attributable to higher concentrations entering this zone from the San Joaquin River (figs. 2, 10).
Overall, changes in NO3− concentrations, both temporally and spatially, were more complicated than that of NH4+. Because the EchoWater Facility treatment plant upgrade BNR process converts NH4+ to NO3−, effluent NO3− concentrations increased from close to zero to about 8 mg/L of nitrogen (fig. 7) after the upgrade, and thus, NO3− concentrations in the north Delta transition zone increased in direct response during the spring months. Effects on NO3− concentration farther downstream are complicated by biogeochemical nutrient transformations and additional inputs (for example, Central San and Stockton wastewater treatment plant inputs and agricultural drainage waters). This information is described in detail in Senn and others (2020), where the downstream effects of the BNR upgrade were broken down into hydrodynamically determined zones of influence (fig. 12). Briefly, before the upgrade, spring NO3− concentrations largely came from nitrification of effluent-derived NH4+ in much of the Delta. Although NO3− concentrations in the effluent may have increased with downstream movement from the EchoWater Facility, NO3− concentrations are expected to decrease because there is less NH4+ to be nitrified.
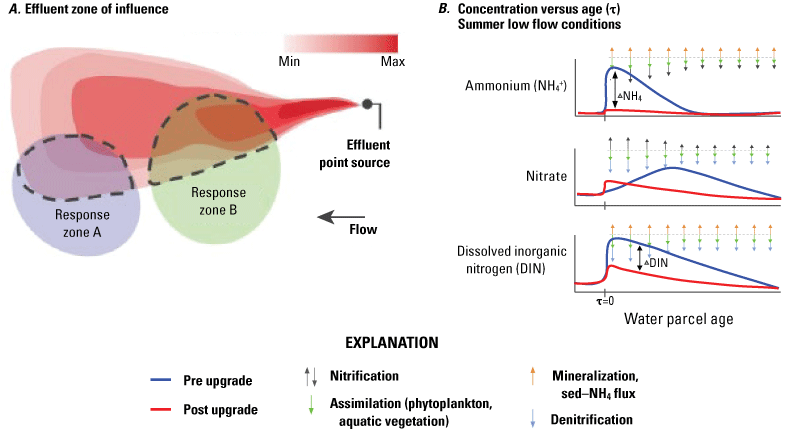
Conceptual figures from Senn and others (2020) that depict how changes in ammonium (NH4+), nitrate (NO3−), and dissolved inorganic nitrogen (DIN) are likely to change in the Sacramento–San Joaquin Delta after the EchoWater Facility upgrade: A, shows how the effluent zone of influence (ZOI) attenuates with distance from nutrient point source inputs due to biogeochemical transformation and hydrodynamic mixing; and B, shows relative changes in concentrations of NH4+, NO3−, and DIN before and after the EchoWater Facility upgrade as water travels downstream from the point where EchoWater Facility’s effluent enters the Sacramento River (τ=0) and biogeochemical transformation of effluent derived nutrients alters nitrogen concentration.
Dissolved Inorganic Nitrogen
Main findings are listed here:
-
• Trends in DIN were largely similar to NO3− concentration because across most of the Delta, NO3− is the primary contributor (greater than 60 percent) to DIN. Exceptions include areas where NH4+ concentrations were elevated, such as the north Delta tidal transition zone.
-
• In the zone immediately below the EchoWater Facility (north Delta tidal transition zone), DIN concentrations decreased substantially over time reflecting the implementation of the BNR treatment, which reduced effluent DIN inputs by more than 60 percent, despite the increase in NO3− inputs.
-
• Maximum DIN concentrations decreased in the Cache Slough complex channel system and western Delta tidal zone by survey date.
-
• Like trends observed with NO3− concentration, DIN concentration increased in the San Joaquin tidal transition zone and the central Delta tidal zone by the survey date, likely associated with increasing drought conditions.
-
• In Suisun Bay, DIN concentrations appeared relatively stable over time, except in May 2018 when nutrient drawdown occurred (see the “Phytoplankton Abundance and Species Composition” section).
-
• For the four spring surveys, DIN generally was above levels thought to be limiting to phytoplankton growth (greater than 7.1–9.3 µM; Reynolds, 1999; Chorus and Spijkerman, 2021), except in the zone above the EchoWater Facility, northern reaches of the Cache Slough complex, and Mokelumne system tidal transition zone in all but the 2020 survey.
-
• Mean DIN concentrations in the central Delta tidal zone were lower in 2021 and 2022 after the upgrade compared to pre-upgrade conditions in 2018 and 2020, with values nearing concentrations that have the potential to limit phytoplankton growth rates (less than 7.1–9.3 µM; Reynolds, 1999; Chorus and Spijkerman, 2021).
-
• The increase in DIN concentration in the Mokelumne River tidal transition zone in June 2020 (before the EchoWater Facility upgrade) coincides with the opening of the DCC and a cyanobacteria bloom (see the “Phytoplankton Abundance and Species Composition” section).
Although individual examination of NH4+ and NO3− is important because of their distinct putative environmental effects, DIN (the sum of NH4+ and NO3−) comprises the pool of nitrogen readily available to support primary production. Higher DIN concentrations could yield more phytoplankton biomass. A ratio of 1 µM DIN to 1 µg/L chlorophyll a is commonly used to estimate the potential phytoplankton biomass that can accrue from the available DIN pool (Gowen and others, 1992; Tett and others, 2003; Edwards and others, 2005). Alternatively, at low DIN concentrations (less than 7.1–9.3 µM), phytoplankton growth may become nitrogen limited (Reynolds, 1999; Chorus and Spijkerman, 2021; Cloern, 2021). In addition to absolute concentrations, the percentage of contributions of NH4+ and NO3− to the total DIN pool (fig. 13) provide information about which form of nitrogen is the predominant contributor. Some studies indicate that nitrogen form may be an indicator of the potential food quality of phytoplankton grown in the Delta, including the growth of harmful algae (Glibert and others, 2016), whereas other studies indicate that nitrogen form is unlikely to be a key driver of phytoplankton community assemblage in the Delta (Ward and Paerl, 2017; Senn and others, 2020; Cloern, 2021).
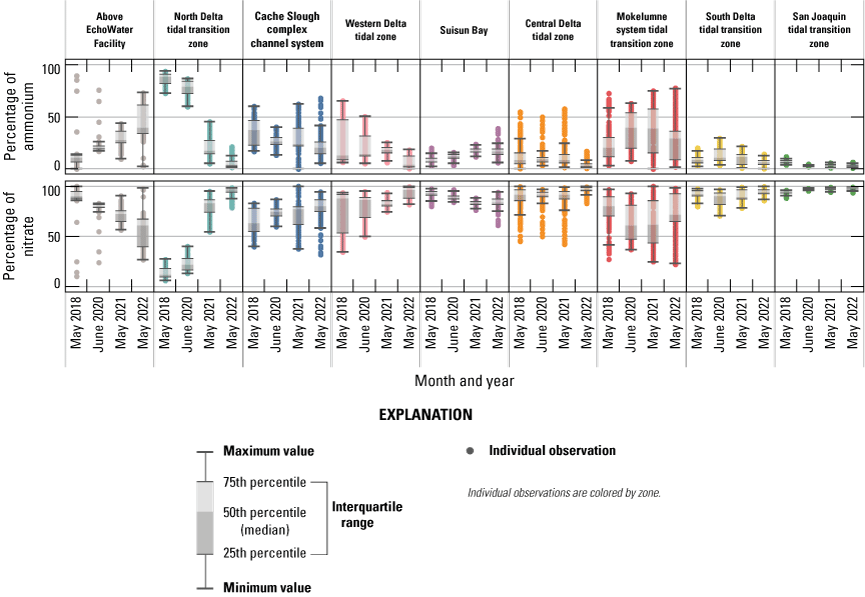
Median, interquartile range, and distribution of ammonium and nitrate relative contribution to the total dissolved inorganic nitrogen (DIN) pool (in percentage) measured for spring 2018, 2020, 2021, and 2022 determined in each zone of the Sacramento–San Joaquin Delta, California.
Temporal and spatial trends in DIN were largely similar to NO3− concentration (figs. 9–11) because NO3− is the primary contributor (greater than 60 percent) to DIN across most of the Delta (fig. 13). Exceptions to these trends include areas where NH4+ concentrations were elevated, such as the north Delta tidal transition zone. In this zone, immediately below the EchoWater Facility, DIN concentrations decreased substantially over time, reflecting the implementation of the EchoWater Facility’s BNR upgrade, which reduced effluent DIN inputs by more than 60 percent (fig. 7). Thus, as NH4+ concentrations decreased and NO3− increased in the north Delta tidal transition zone after the BNR upgrade (in concentration and percentage of contribution to DIN), the median DIN concentrations in this zone decreased through time from 53 µM in 2018 to 35 µM in 2020, 21 µM in 2021, and 11 µM in 2022. Although median DIN concentrations in the zone did not fall below the potential DIN growth limitation threshold value of 9.3 µM (Reynolds, 1999; Chorus and Spijkerman, 2021), concentrations approached the threshold (fig. 11; table 1.2). These data indicate that nitrogen limitation may occur in this zone at times due to variability in the multiple factors that drive these concentrations. In contrast, DIN concentrations in the Sacramento River “control” zone upstream from the EchoWater Facility were potentially limiting to phytoplankton growth during all four spring surveys (median DIN concentrations were 3, 4, 7, and 1 µM in 2018, 2020, 2021 and 2022, respectively; fig. 11; table 1.1). Assessment of whether or not there have been changes in DIN concentrations and forms in this part of the Sacramento River above the EchoWater Facility over time is beyond the scope of this report.
In the Cache Slough complex channel system and western Delta tidal zone, which are zones that predominantly receive flow from the north Delta tidal transition zone and thus are likely to be affected by the EchoWater Facility upgrade, maximum DIN concentrations decreased through time and DIN was lowest during the spring 2022 survey (figs. 10–11; tables 1.3–1.4), with concentrations in the Cache Slough complex channel system falling well below potentially limiting concentrations (9.3 µM). Because these two zones, especially the Cache Slough complex channel system, encompass areas that experience highly variable water residence times (Downing and others, 2016; Gross and others, 2019), changes in median DIN concentrations over time indicate more complicated temporal and spatial trends than the north Delta tidal transition zone, which was more clearly affected by the change in the EchoWater Facility’s effluent.
Similar to NO3−, maximum DIN concentrations in the south Delta tidal transition zone were higher during the spring 2022 survey (49.5 µM) compared to the spring 2018 survey (29.2 µM), with maximum DIN during the 2020 and 2021 surveys similar and near 35 µM (figs. 10–11; table 1.8). This increase from 2018 to 2022 can be attributed to increasing NO3− concentrations in the San Joaquin tidal transition zone (figs. 9–10). One noticeable spatial pattern within this zone is that Old River generally had lower DIN concentrations than Middle River across each survey, supporting models that indicate Middle River is more hydrologically connected to the San Joaquin River than Old River (figs. 2, 10).
Maximum DIN concentrations increased through time in the central Delta tidal zone, from about 38 µM to about 107 µM, due to higher concentrations entering this zone from the San Joaquin River (figs. 9–11; table 1.6). Median DIN concentrations in the two spring surveys completed after the upgrade in this zone were much lower (about 9 µM in 2021 and about 15 µM in 2022) than the two done before the upgrade (23 µM in 2018 and 2020; table 1.6).
Conversely, maximum DIN concentrations decreased through time in the Mokelumne system tidal transition zone from about 42 to 14 µM (table 1.7), whereas medians remained low (ranging from 1 to 3 µM; table 1.7), except in the spring 2020 survey, where median DIN concentration was noticeably elevated at 24 µM due to opening of the DCC. When viewing the contour map (fig. 10), the 2020 DIN increase in the Mokelumne system tidal transition zone appears restricted to predominantly the North Fork of the Mokelumne River, with the two surveyed dead-end sloughs (Hog and Sycamore Sloughs; fig. 2) displaying a nutrient drawdown that fueled a cyanobacteria bloom (see the “Phytoplankton Abundance and Species Composition” section).
Like observed in NH4+ and NO3− concentrations, DIN measurements in Suisun Bay exhibited a unique pattern of drawdown on the shoals, with 2018 values having a far wider range and a lower median compared to the more consistent measurements in the later three surveys (fig. 10). These lower Suisun Bay DIN concentrations in 2018 likely are attributed to uptake by a diatom bloom (see the “Phytoplankton Abundance and Species Composition” section; figs. 10–11). However, it can be noted that in addition to DIN uptake by phytoplankton, aquatic vegetation and bacterial communities living in the water column and the benthos may be substantial sinks for DIN, in the form of NH4+ and NO3− (Senn and others, 2020). These results highlight that uptake of DIN by phytoplankton blooms can draw nutrient concentrations to potentially growth-limiting conditions.
It is evident by the difference in NH4+, NO3−, and DIN concentrations above and below the EchoWater Facility’s effluent discharge location that in spring, when upstream nutrient concentrations are low, the amount and forms of DIN in the Sacramento River are predominantly a function of nitrogen inputs from wastewater treatment facilities and dilution determined by the river discharge (fig. 10). Additional effects on the distribution of DIN forms and concentrations in the Delta include other inputs, hydrologic conditions, biogeochemical processes, and water-management activities (for example, DCC operation, water exports, and barriers). The effects of opening the DCC just before the spring 2020 survey were discussed earlier and are described in the discussion about the coinciding cyanobacteria bloom in the “Phytoplankton Abundance and Species Composition” section.
Another example of the importance of hydrology is evident in three longer water residence time areas surveyed: (1) Cache Slough complex, (2) Hog Slough, and (3) Sycamore Slough (fig. 2). Each of these locations contained low DIN concentrations in the landward, higher water residence time areas, even though tidal action supplies these systems with DIN via advective and dispersive mixing. Low DIN concentrations measured at the landward reaches of these three areas were observed during all four spring surveys regardless of source water DIN concentrations. Because water residence time is higher in these dead-end areas, there is a greater chance for increased phytoplankton growth, which is frequently associated with nutrient drawdown due to DIN uptake by aquatic vegetation and bacteria and denitrification in anoxic sediments (Senn and others, 2020; Stumpner and others, 2020; Bergamaschi and others, 2024). Potential sources of DIN in these areas, including agricultural return waters, benthic fluxes, and mineralization of detrital material, appear to be minimal or offset by sinks.
Phosphate
Main findings are listed here:
-
• The wastewater treatment plant upgrade reduced effluent PO43− concentrations in 2021 and 2022; however, a decrease in PO43− concentrations immediately downstream from the EchoWater Facility was only observed during the spring 2022 survey.
-
• The effects of the upgrade on PO43− across the Delta are complicated by the recycling of this nutrient and inputs from the San Joaquin River and Cache Slough complex.
-
• During all four spring surveys, measured PO43− concentrations were typically well above concentrations considered to limit phytoplankton growth (less than 0.3 µM; Reynolds, 1999; Chorus and Spijkerman, 2021).
Like nitrogen, phosphorus is a required element for all biota. Specifically, PO43− is used in processes like the formation of DNA and cell membranes and the production of cellular energy. Dissolved PO43− in aquatic ecosystems is readily available for uptake by aquatic vegetation, bacteria, and phytoplankton. When PO43− concentrations are above about 0.1–0.3 µM, it can be assumed that phosphorus is readily available and not limiting to phytoplankton growth (Reynolds, 1999; Chorus and Spijkerman, 2021). Below these concentrations there is potential for PO43− availability to limit growth; however, dissolved organic phosphorus and particulate phosphorus can also serve as important pools of phosphorus.
Like nitrogen, wastewater treatment plants are primary sources of PO43− in many urbanized aquatic ecosystems (Ward and Paerl, 2017). Agricultural and urban drainage waters are other key sources because PO43− is commonly used in fertilizers. Although a change in PO43− loading was not an objective of the EchoWater Facility’s upgrade (Senn and others, 2020), the implementation of the BNR treatment altered effluent PO43− and total phosphorus concentrations (fig. 8). In water year 2018, before phase 1 of the BNR upgrade, PO43− concentrations in effluent were about 65–100 µM (2–3 mg/L of P). In water year 2022, after the upgrade, PO43− concentrations in effluent were usually below 30 µM (about 1 mg-P/L). It is not clear if these lower PO43− concentrations will be maintained in the future because they are not part of the EchoWater Facility’s National Pollutant Discharge Elimination System permit requirements.
Although the implementation of the BNR upgrade led to a decrease in effluent PO43− concentrations during most of 2021 and 2022, according to EchoWater Facility’s effluent data, this decrease did not happen until June 2021 (fig. 8). This decrease is reflected in the PO43− concentrations observed in the north Delta tidal transition zones during the spring surveys; median PO43− concentrations in this zone immediately below the treatment facility were around 3, 2, and 2 µM in 2018, 2020, and 2021, respectively, but concentrations dropped to 0.6 µM in May 2022 (fig. 14; table 1.2). Lower median (and minimum) PO43− concentrations in spring 2022 compared to the other 3 years of study were also observed in the western Delta tidal transition zone and Suisun Bay. Because these zones are predominantly made up of Sacramento River water in spring, these lower concentrations are likely a direct result of lower PO43− inputs from the EchoWater Facility.
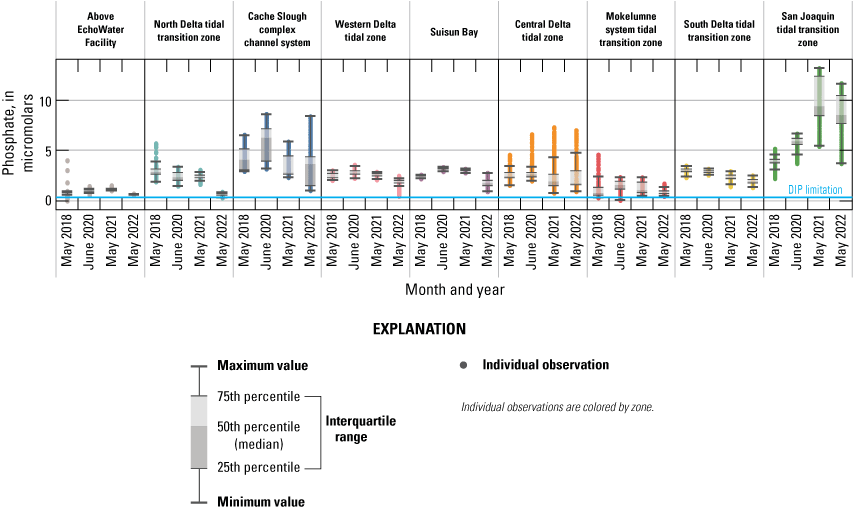
Median, interquartile range, and distribution of phosphate for spring 2018, 2020, 2021, and 2022 in each zone of the Sacramento–San Joaquin Delta, California. The reference line indicates the conservative dissolved inorganic phosphorus (DIP) limitation level of 0.32 micromolar.
Although water in the Cache Slough complex channel system also is predominantly composed of Sacramento River source water, PO43− concentrations in this zone were much more variable because PO43− is released from the benthos over time, resulting in higher PO43− concentrations in the northern reaches of the Cache Slough complex channel system where water residence times are long and there are extensive shallow water habitats (Bergamaschi and others, 2024). Although the minimum PO43− concentration in the Cache Slough complex, associated with the southernmost part of the zone that receives inflowing Sacramento River water, had a lower PO43− concentration in spring 2022 compared to the previous studies, the median and maximum values overlapped with the other years (figs. 14–15). These observations reflect the complex biogeochemical transformations that depend on many factors, like water residence time, temperature, water depth, and biota (Xu and others, 2021).
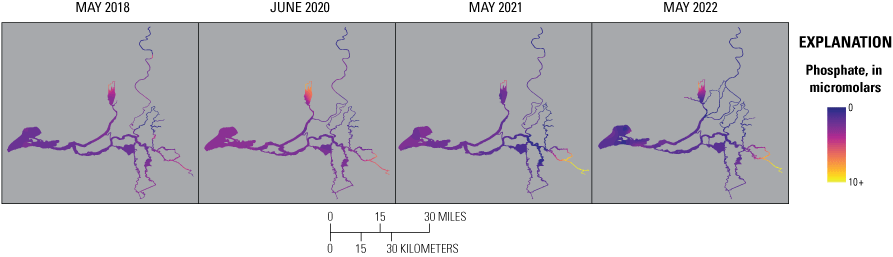
Phosphate concentrations determined during high-resolution mapping surveys of the Sacramento–San Joaquin Delta, California, in spring 2018, 2020, 2021, and 2022. Abbreviation: +, plus.
Although there were differences among each mapping event, there were no notable or consistent patterns in PO43− concentration in the central Delta tidal zone, the Mokelumne system tidal transition zone, or the south Delta tidal transition zone over time that indicate these areas were affected by the EchoWater Facility upgrade. These zones include complex habitats that can consume and release PO43−, have longer water residence times than channeled river habitats, and receive inputs from the San Joaquin River.
In the San Joaquin tidal transition zone, PO43− concentrations were much higher in 2021 and 2022 compared to 2018 and 2020 (figs. 14–15). Like nitrogen, this increase is presumably associated with the drought conditions and lower dilution of PO43− inputs from urban and agricultural sources.
Like the part of the Sacramento River above the EchoWater Facility included in this study, the Mokelumne system tidal transition zone had some of the lowest median PO43− concentrations measured across the Delta during the four surveys, ranging from 0.7 to 1.6 µM (figs. 14–15; table 1.7). The highest median value of 1.6 µM in 2020 can be attributed to the opening of the DCC, which routed more nutrient-rich Sacramento River water into this zone. Although low, these concentrations are still well above PO43− concentrations of 0.1–0.3 µM considered to be potentially limiting to phytoplankton growth (Chorus and Spijkerman, 2021).
Ratio of Dissolved Inorganic Nitrogen to Dissolved Inorganic Phosphorus
Main findings are listed here:
-
• Ratios of dissolved inorganic nitrogen concentration to dissolved inorganic phosphorus concentration (DIN:DIP) were below the Redfield ratio value of 16:1 in much of the Delta, indicating greater potential for DIN limitation than DIP limitation.
-
• Lower DIN:DIP in the Cache Slough complex, Mokelumne system tidal transition zone, above the EchoWater Facility, and in the central Delta coincide with potentially limiting concentrations of DIN (less than 9 µM), indicating the potential for DIN limitation after the upgrade.
Optimum DIN and DIP (PO43−) concentrations and stoichiometry for maximum phytoplankton growth are debated topics among phytoplankton researchers. Whereas a standard optimum DIN:DIP of 16:1, called the Redfield ratio (Redfield, 1934), has been a longtime standard, the reality is that optimum nutrient compositions vary between species and are affected by environmental conditions (Flynn and others, 2010; Hillebrand and others, 2013; Chorus and Spijkerman, 2021). A general pattern confirmed by a meta-analysis by Hillebrand and others (2013) is that diatoms are associated with a lower DIN:DIP ratio than other species, with chlorophytes having higher DIN:DIP and dinoflagellates in between (Ho and others, 2003; Quigg and others, 2003). Cyanobacteria also are associated with higher DIN:DIP compared to the Redfield ratio (Quigg and others, 2011). Although the Redfield ratio of 16:1 is not universally applicable to each phytoplankton taxa, it is a rough mean of global phytoplankton species composition and cellular stoichiometry correlated with high phytoplankton growth rate when nutrients are not in excess (Klausmeier and others, 2004; Hillebrand and others, 2013); thus, we reference DIN:DIP calculated within each Delta zone concerning this longtime standard (fig. 16). Furthermore, DIN:DIP ratios can provide insight into if DIN or DIP is more likely to limit phytoplankton growth and which species of phytoplankton may have a competitive advantage. For example, DIN:DIP values below 16 indicate potential nitrogen limitation whereas higher values indicate potential phosphorus limitation (Chorus and Spijkerman, 2021). However, if both DIN and DIP concentrations are replete, it is unlikely that nutrient limitation is occurring even if the DIN:DIP ratio is not close to 16.
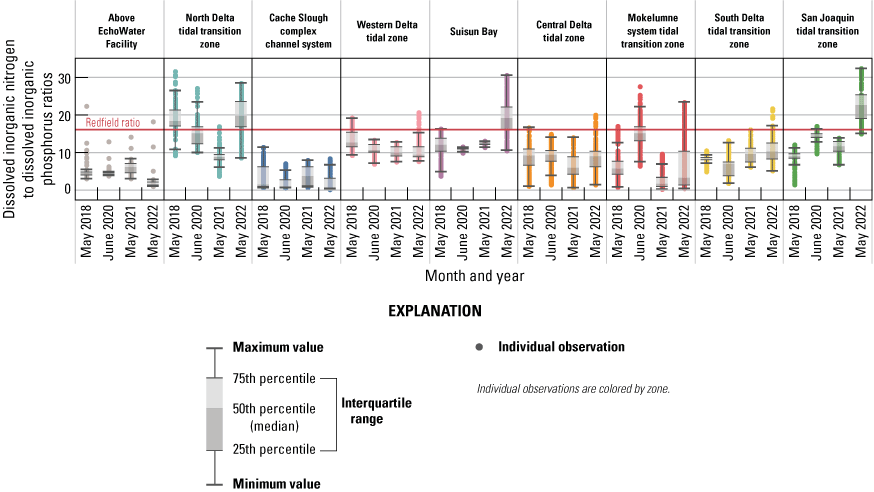
Median, interquartile range, and distribution of the ratio of dissolved inorganic nitrogen to dissolved inorganic phosphorus (for spring 2018, 2020, 2021, and 2022 in each zone of the Sacramento–San Joaquin Delta, California. A reference line plots the Redfield ratio of 16:1 (Redfield, 1934).
There were only a few instances when the interquartile ranges of DIN:DIP within a specific zone were above the Redfield ratio (and thus more likely to be phosphorus limited than nitrogen limited), and these conditions occurred in zones with high DIN and DIP concentrations that were not likely to be limiting—the north Delta tidal transition zone in 2018 and 2022, Suisun Bay in 2022, and the San Joaquin tidal transition zone in 2022 (figs. 16–17). Interquartile ranges of DIN:DIP within each zone did not intersect the Redfield ratio, except in the north Delta tidal transition zone during the 2020 survey, Suisun Bay during the 2022 survey, and Mokelumne system tidal transition zone during the 2020 survey. All other interquartile ranges fell below the Redfield ratio (fig. 16). These data indicate that during spring in the Delta, phytoplankton blooms are more likely to be nitrogen limited than phosphorus limited. However, as discussed earlier, neither DIN nor DIP concentrations were low enough in much of the Delta during the four spring surveys to be considered potentially limiting to phytoplankton growth (Chorus and Spijkerman, 2021). Exceptions to this conclusion include the Cache Slough complex where DIN concentrations were well below 9 µM, especially in the northern parts (especially in 2022; fig. 10). Potentially limiting DIN concentrations were also observed in the Mokelumne system tidal transition zone, the zone above the EchoWater Facility, and potentially in the central Delta tidal zone after the BNR upgrade.
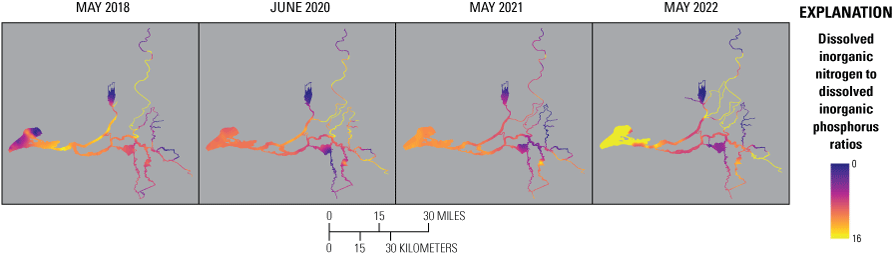
Dissolved inorganic nitrogen to dissolved inorganic phosphorus ratios determined during high-resolution mapping surveys of the Sacramento–San Joaquin Delta, California, in spring 2018, 2020, 2021, and 2022.
Observing which zones and during which surveys were either above or below the Redfield ratio in conjunction with the many factors influencing phytoplankton growth (for example, nutrient concentrations, light availability, temperature, salinity, and water residence time) may shed light to which major phytoplankton groups had the highest growth potential and thus competitive advantage concerning nutrients. Because diatoms are associated with lower DIN:DIP (15:1; Hillebrand and others, 2013), it seems as though most of the Delta may comprise nutrient stoichiometry that is favorable to diatoms’ cellular nutrient stoichiometry (figs. 16–17). As mentioned in previous sections, and detailed more thoroughly later in the text, the drawdown associated with lower DIN:DIP in Suisun Bay during the spring 2018 survey coincides with a large diatom bloom (fig. 17; see the “Phytoplankton Abundance and Species Composition” section).
Harmful algal bloom events, including those producing microcystins, are commonly associated with high DIP concentrations (Beaver and others, 2018); however, high DIN:DIP ratios also have been associated with the production of microcystins, which are rich in nitrogen (Quigg and others, 2011). We did observe a large cyanobacteria bloom in the Mokelumne system tidal transition zone during the spring 2020 survey (see the “Phytoplankton Abundance and Species Composition” section) associated with the opening of the DCC, which resulted in higher DIN and DIP concentrations (figs. 14–15) and higher DIN:DIP (figs. 16–17). The diversion of Sacramento River water into the Mokelumne system tidal transition zone may have provided increased nutrients that supported the growth of cyanobacteria.
In the San Joaquin tidal transition zone, DIN:DIP values were generally below 16 during the first three surveys (median ratios of around 9, 14, and 12 in 2018, 2020, and 2021, respectively), but in 2022, the median was highest at 22.5 (table 1.9). DIN and DIP concentrations were higher in 2022 compared to prior surveys (figs. 9–10, 14–15; table 1.9), thus the increase in the DIN:DIP ratio reflects a greater increase in DIN than DIP (fig. 16). Whereas high DIN:DIP indicates nutrient conditions are particularly favorable to harmful algal blooms; DIN and DIP concentrations in the San Joaquin River were well above nutrient-limiting concentrations.
Dissolved Organic Carbon
Main findings are listed here:
-
• Effluent inputs from Regional San are a minor source of DOC to the Delta.
-
• DOC concentrations measured in effluent and from the four spring mapping surveys indicated that DOC inputs from the EchoWater Facility decreased after the upgrade, but the decrease was minor.
-
• Across the Delta there were no clear trends in DOC associated with the EchoWater Facility upgrade.
Along with particulate organic carbon, the DOC pool serves as an energy source fueling the bacterial food web (Jassby and Cloern, 2000; Stepanauskas and others, 2005). Although DOC can be beneficial from an aquatic habitat standpoint, it is a drinking-water constituent of concern because a fraction of the DOC pool reacts to form disinfection byproducts during treatment (Kraus and others, 2008). Although treated effluent contains DOC, the treatment process is designed to remove most of the biodegradable organic material before release. This process is done by removing solids and by encouraging as much biodegradation and loss (as CO2) of DOC during treatment. The EchoWater Facility’s current NPDES permit (California Regional Water Quality Control Board, 2021) requires that the biological oxygen demand (BOD) of its treated effluent must be monitored at a daily frequency and maintained below a weekly average of 15 milligrams per liter (mg/L) and a monthly average of 10 mg/L. This permit also requires the facility to report total organic carbon (TOC) concentrations quarterly and DOC concentrations monthly. Although DOC concentrations entering the Delta from the Sacramento River and other riverine inflows affect downstream conditions, higher within Delta contributions of DOC from biota, decomposition of detrital material, agricultural drains, and the benthos also contribute to DOC. Additionally, biogeochemical processing during transport alters DOC concentration and composition (Kraus and others, 2008; Eckard and others, 2020; Richardson and others, 2020).
As described in the “Methods” section, DOC concentrations were modeled at high spatial resolution using a linear empirical relation between in situ fDOM and laboratory-determined concentrations of DOC on discrete samples for each survey. Based on those data, across all four spring surveys, DOC concentrations in the Sacramento River upstream from the EchoWater Facility ranged between 1.2 and 1.6 mg/L of carbon (fig. 18; table 1.1). In the north Delta tidal transition zone immediately downstream from the facility, median DOC concentrations were slightly higher, ranging from 1.4 to 1.9 mg/L of carbon, which is an increase of 0.5, 0.3. 0.1 and 0.0 mg /L of carbon in 2018, 2020, 2021, and 2022, respectively, compared to the zone upstream from the facility (tables 1.1–1.2). This trend over time indicates that after the upgrade, DOC concentrations in treated effluent have, if anything, decreased. This hypothesis is supported by data provided by the EchoWater Facility that indicates TOC and DOC concentrations in their treated effluent were lower after the upgrade (fig. 8).
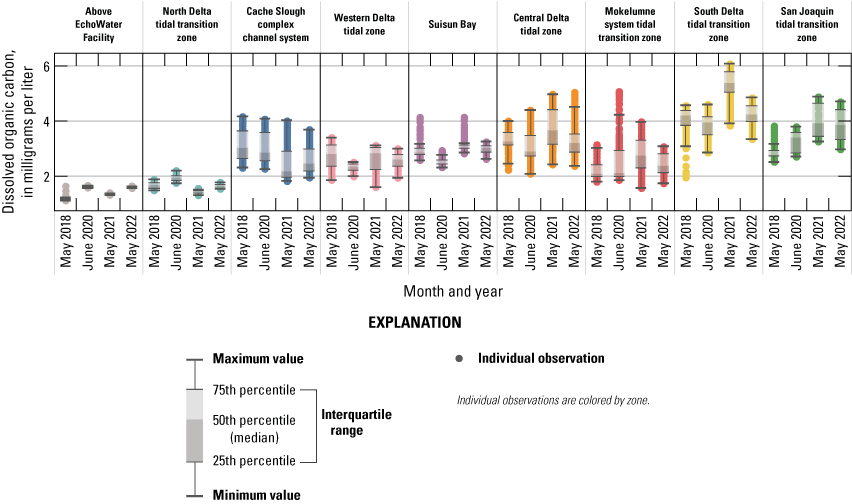
Median, interquartile range, and distribution of dissolved organic carbon for spring 2018, 2020, 2021, and 2022 in each zone of the Sacramento–San Joaquin Delta, California.
As Sacramento River water mixed into downstream tidal transition zones, DOC concentrations increased, with many zones doubling in concentration (fig. 18). This increase is in line with several prior studies and models that documented within-Delta contributions of DOC can be substantial (Kraus and others, 2008; Eckard and others, 2020; Richardson and others, 2020). Visual examination of the contour plots provides further insight into which areas of the Delta contribute DOC and why (fig. 19). For example, the northern part of the Cache Slough complex, characterized by longer water residence time, shallow wetlands, organic sediments, and aquatic vegetation, contains higher DOC concentrations than the southern part.
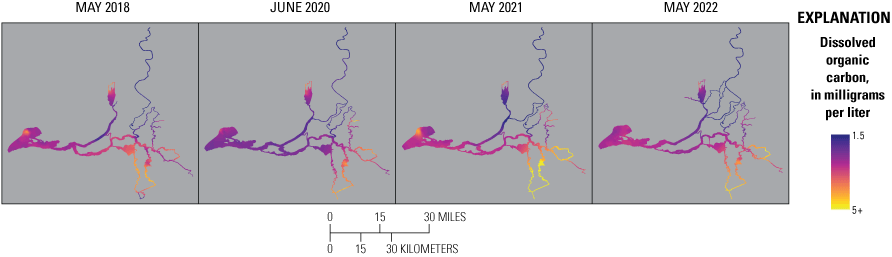
Dissolved organic carbon concentrations determined during high-resolution mapping surveys of the Sacramento–San Joaquin Delta, California, in spring 2018, 2020, 2021, and 2022. Abbreviation: +, plus.
The Mokelumne system tidal transition zone also indicated a large range in DOC concentrations (fig. 18). In the northern reaches, representing water entering the Delta from the Mokelumne River, DOC concentrations were less than 2.0 milligrams of carbon per liter (mg-C/L). Farther downstream within this zone, higher concentrations were observed in Hog and Sycamore Sloughs. Similar to the northern reaches of the Cache Slough complex channel system, the increase in DOC in the dead-end sloughs likely is associated with longer water residence times, which allow for greater inputs from phytoplankton, aquatic vegetation, and soils. These results indicate that ongoing wetland restoration efforts throughout the Delta, which increase water residence time and support primarily production, increase DOC concentrations across the zone.
Moving seaward, the western Delta tidal zone and Suisun Bay displayed smaller ranges in DOC concentration during each survey than the Cache Slough complex channel system, although median values are comparable (figs. 18–19). Within Suisun Bay, notably higher DOC concentrations in the northwest zone in May 2018 and 2021 likely reflects inputs from Suisun marsh to the north.
The highest DOC concentrations typically were observed in the central and southern Delta (at or above 5 mg-C/L; figs. 18–19), presumably reflecting inputs from subsided island agricultural drainage waters that are rich in DOC and mixing with San Joaquin River water that had higher DOC concentration, especially during the 2021 and 2022 drought years. These zones of the Delta also comprise remnant wetlands and have longer water residence times, fostering DOC production by phytoplankton and aquatic vegetation and release from the benthos due to decomposition of detrital material.
DOC concentrations in the San Joaquin tidal transition zone were higher in 2021 and 2022 (median values of 3.9 mg-C/L) compared to 2018 and 2020 (2.8 and 3.4 mg-C/L, respectively). This change likely is a result of drought conditions.
Additional Water-Quality Parameters
A suite of water-quality parameters (turbidity, water temperature, salinity, pH, and dissolved oxygen) was collected in tandem with the nutrient data (table 3). Like with nutrients, these parameters can be affected by changes in climate, flow, wetland restoration, infrastructure projects, and other factors that are not related to the EchoWater Facility upgrade. However, some of these parameters can affect and be affected by nutrient concentrations and phytoplankton growth. For example, phytoplankton and other organisms can contribute to turbidity and, conversely, turbidity (organic and mineralic) can affect light availability, and thus primary production. Photosynthesis by phytoplankton and aquatic vegetation can alter pH and dissolved oxygen, and these factors can in turn affect phytoplankton growth and productivity. Temperature and salinity partially control the species composition of the phytoplankton community because each phytoplankton species grows within specific temperature and salinity ranges. We present and review these water-quality data to put the four spring surveys in broader context of conditions across the Delta.
Turbidity
Main findings are listed here:
-
• The largest ranges of turbidity were in Suisun Bay and the western Delta tidal zone.
-
• There was a spike in maximum turbidity in the Mokelumne system tidal transition zone during the June 2020 survey.
-
• In other areas of the Delta, turbidities measured during the spring surveys were primarily below 15 formazin nephelometric units (FNU).
Turbidity is a measurement of the cloudiness of water and is related to light scattering by particles in the water column. Higher turbidity measurements mean more light is scattered, which shortens the depth to which light useful for photosynthesis can penetrate the water column (the photic zone). Because turbidity directly affects light availability, it is considered one of the main controls on primary production by phytoplankton in the Delta (Cloern, 1987; Stumpner and others, 2020; Richardson and others, 2023b). Turbidity also is a habitat quality characteristic important to zooplankton and fish, including endangered species like the delta smelt, because it affects visibility and thus predator-prey relationships (Cloern, 1999; Vogel and Beauchamp, 1999; Browman and others, 2000; Gallegos, 2001; Kirk, 2010; Rathjen and others, 2012). In addition to providing information about the light field, turbidity is used as a proxy for suspended sediment concentration, which is of interest in the context of contaminant transport, wetland restoration, and mitigation of sea level rise (Kirwan and Megonigal, 2013; Achete and others, 2017).
Environmental factors that may increase turbidity include suspended particulates entering the water in runoff after rain events, erosion due to storm events or construction projects, high flows resulting in bottom shear stress and turbulent conditions, algal blooms, and wind events in shallow water habitats. Suspended particles contributing to turbidity in water bodies can be comprised of matter like algae, bacteria, organic detritus, and mineralic sediment. Because nutrient inputs from wastewater treatment plants are not considered primary drivers of turbidity, there is no expectation that turbidity values would change as a result of the EchoWater Facility BNR upgrade, except perhaps through changes in phytoplankton abundance.
Based on prior studies, we expect higher turbidity in Suisun Bay due to the hydrodynamic trapping and oscillations of suspended particles, followed by the upstream western Delta tidal zone (Schoellhamer, 2011). Across the four surveys, the highest median turbidity values were observed in Suisun Bay (figs. 20–22). The highest median turbidity measurements in Suisun Bay were during the spring 2018 mapping survey (61.3 FNU; fig. 20; table 1.5). This result may reflect the presence of algal particles associated with elevated chlorophyll, coinciding with a diatom bloom (see the “Phytoplankton Abundance and Species Composition” section). The highest maximum turbidity measurements, however, were during the spring 2022 survey, at 197 FNU, which did not coincide with elevated phytoplankton and thus was associated with particle inputs from channels draining Suisun marsh to the north or wind that stirred up bottom sediments. Aside from the high overall turbidity in spring 2018 and high localized turbidity in spring 2022, turbidity values in Suisun Bay remained relatively consistent, with median values in spring 2020–22 near 40 FNU (figs. 20, 22; table 1.5). To better analyze data in zones with lower turbidity values, we replotted the turbidity data shown on figure 20 such that the y-axis is a maximum of 20 FNU (fig. 21).
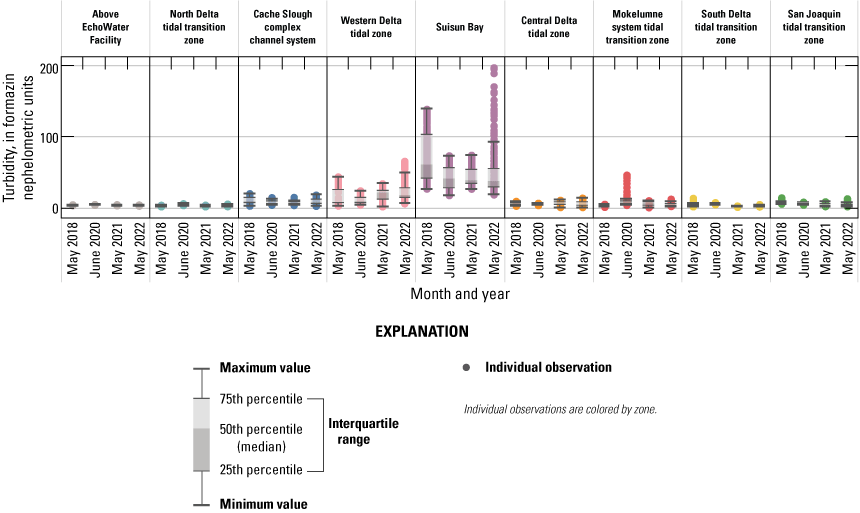
Median, interquartile range, and distribution of turbidity measured during surveys done in spring 2018, 2020, 2021, and 2022 in each zone of the Sacramento–San Joaquin Delta, California. To better distinguish lower values, see figure 21.
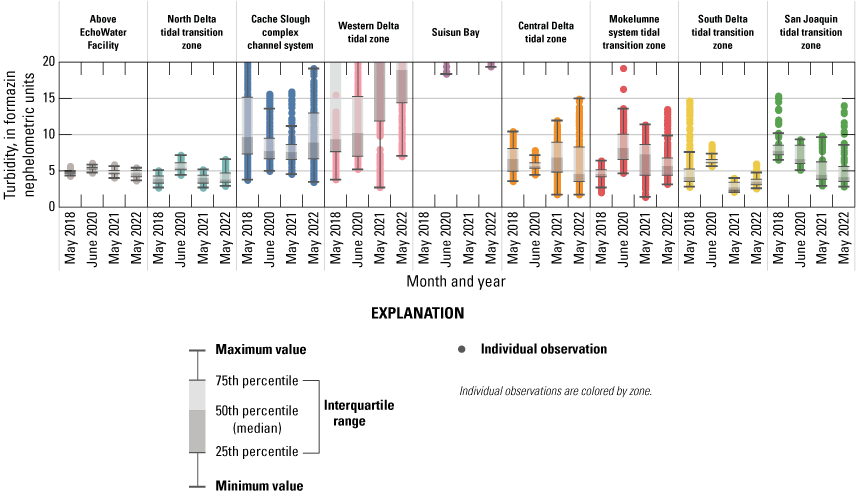
Median, interquartile range, and distribution of turbidity measured during surveys done in spring 2018, 2020, 2021, and 2022 in each zone of the Sacramento–San Joaquin Delta, California. The y-axis is set to a maximum of 20 formazin nephelometric units. See figure 20 for full data range.
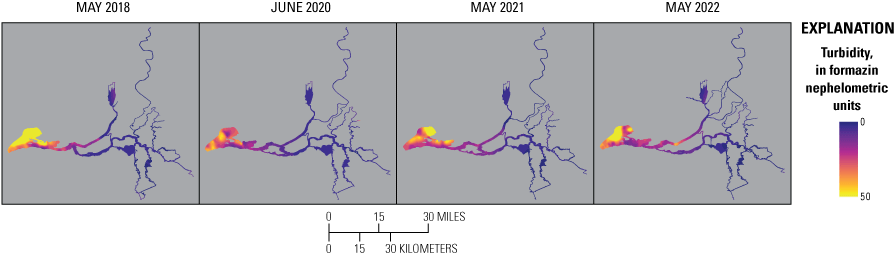
Turbidity in formazin nephelometric units measured during surveys of the Sacramento–San Joaquin Delta, California, in spring 2018, 2020, 2021, and 2022.
Trends in turbidity over time are not readily apparent by visual inspection of the data plotted on figures 20–21; however, a few points can be gleaned by examining the same data plotted in the contour maps (fig. 22). The western Delta tidal zone, particularly in the lower Sacramento River in 2020 and 2021, had higher turbidities than other zones of the Delta besides Suisun Bay (figs. 21–22; table 1.4). Higher turbidity observed in the Mokelumne system tidal transition zone during the spring 2020 survey (figs. 21–22; table 1.7) is concomitant with an algal bloom occurring at that time in Hog Slough (see the “Phytoplankton Abundance and Species Composition” section).
Aside from these higher turbidities observed in Suisun Bay, the western Delta tidal zone, and the Mokelumne system tidal transition zone, turbidities measured across other zones of the Delta during the spring surveys were primarily below 15 FNU (figs. 21–22; tables 1.1–1.9). Because turbidity in the Delta is strongly controlled by source inputs, flow conditions, and wind events, further exploration of turbidity data and potential relation to the EchoWater Facility upgrade would be better informed by spring, summer, and fall surveys and long-term trends gleaned from continuous fixed station datasets (Bergamaschi and others, 2020; O’Donnell and others, 2023, 2024; U.S. Geological Survey, 2023).
Water Temperature
Main findings are listed here:
-
• By zone, there were similar water temperature trends through the four spring surveys, with the lowest temperatures observed during the 2018 survey, which had a higher flow.
-
• The highest recorded temperatures were in the 2020 survey because this survey was done in June rather than May. One exception to this finding was the zone above the EchoWater Facility, where temperatures increased by the survey date.
Water temperatures in the Delta are driven by climate, weather, and water management in complex ways that vary across space and time (Bashevkin and Mahardja, 2022). We expected the highest temperatures measured across the four spring surveys to occur during 2020 because although the other surveys were done in May, the 2020 survey was delayed until June due to the coronavirus disease 2019 restrictions (table 2). Although higher water temperatures in 2020 were observed in many zones of the Delta (figs. 23–24), it is not clear this was directly related to the specific timing of the surveys because water temperatures in the Sacramento River above the EchoWater Facility and in the north Delta tidal transition zone were not notably higher in 2020 compared to 2018, 2021 and 2022, and water temperatures above the EchoWater Facility increased by survey date. These data indicate that in spring, flow effects on water residence time and mixing of different water sources to and within the Delta play a large role in determining water temperatures across the system.
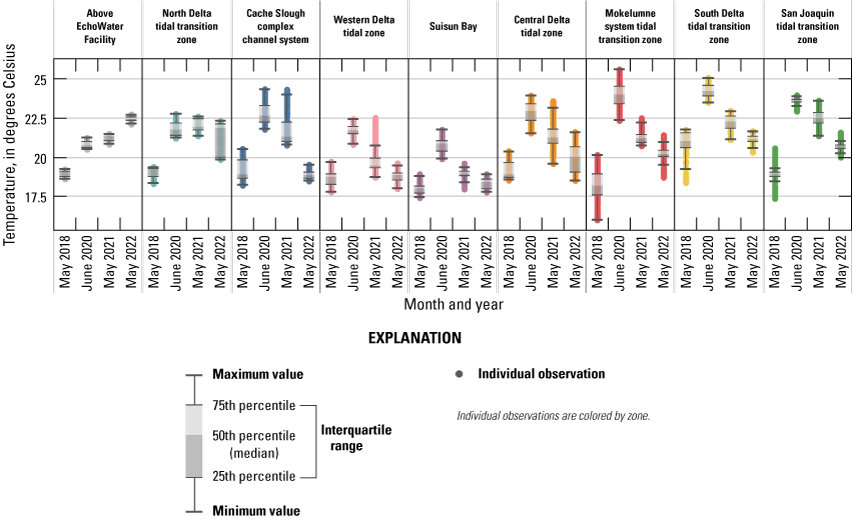
Median, interquartile range, and distribution of temperature measured during surveys done in spring 2018, 2020, 2021, and 2022 in each zone of the Sacramento–San Joaquin Delta, California.
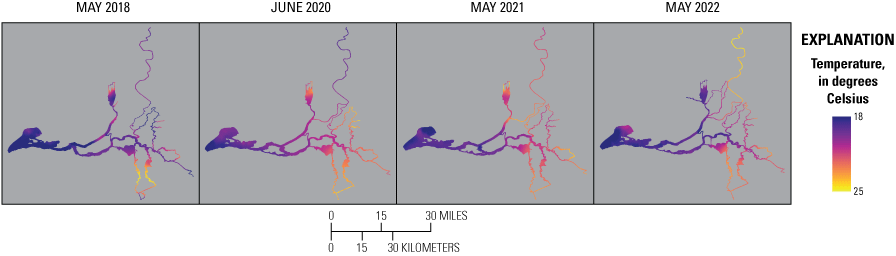
Temperature measured during surveys of the Sacramento, San Joaquin Delta, California, done in spring 2018, 2020, 2021, and 2022.
Temperatures measured across the Delta during the spring surveys ranged from a low of 16.0 degrees Celsius (˚C) in the Mokelumne system tidal transition zone in 2018 to a high of 25.6 ˚C in the same zone in 2020 (fig. 23; tables 1.1–1.9). Within all but three zones, median water temperature was lowest in 2018 (ranging from 18 to 21 ˚C across zones) and highest in 2020 (ranging from 21 to 24 ˚C across zones; figs. 23–24; tables 1.1–1.9). The exceptions to this trend include the zone above the EchoWater Facility, the north Delta tidal transition zone, and the Cache Slough complex channel system (fig. 23; tables 1.1–1.9). Median temperatures in most zones were lower in 2022 than in 2021, which was driven by differences in climatic and hydrodynamic factors. Temperatures were lower in Suisun Bay and the western Delta tidal zone due to mixing with colder saline water originating from the ocean and because of shorter water residence times compared to other Delta zones.
Salinity
Main findings are listed here:
-
• In both zones where we expect brackish salinity measurements (Suisun Bay and western Delta tidal zone), salinity increased during the first three surveys, corresponding with the increase in X2 position, but decreased slightly in the May 2022 survey.
Because most of the Delta consists of freshwater habitats, this section focuses on salinity measured in Suisun Bay and the western Delta tidal zone (figs. 25–26). Salinity gradients in the Delta are predominantly determined by the mixing of saline water originating from the ocean, with freshwater originating from upstream river flows. During spring, freshwater flows in these two zones largely are determined by water-year type, reservoir releases, exports, and the operation of flow structures like salinity gates and the DCC (table 6).
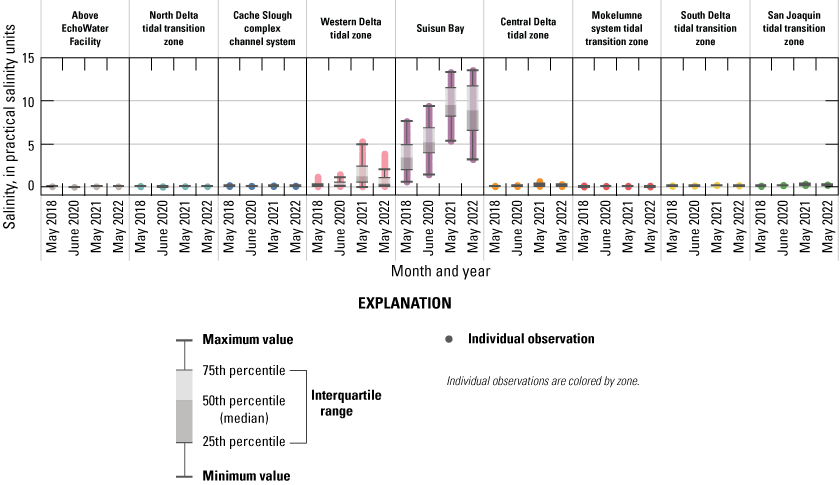
Median, interquartile range, and distribution of salinity measured during surveys done in spring 2018, 2020, 2021, and 2022 in each zone of the Sacramento–San Joaquin Delta, California.
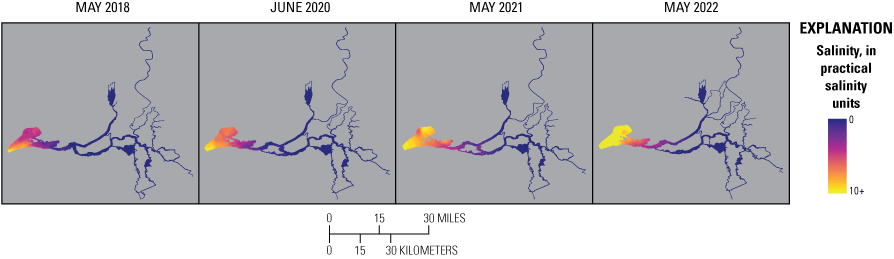
Salinity measured during surveys of the Sacramento–San Joaquin Delta, California, done in spring 2018, 2020, 2021, and 2022. Abbreviation: +, plus.
Because of the drought conditions observed during the surveys, one might expect salinity to increase with each consecutive year because of lower freshwater flows, particularly as the mean Delta outflow during each survey decreased, respectively (table 6). However, median salinity measurements were highest during the 2021 survey (1 practical salinity unit [PSU] in the western Delta tidal zone and about 10 PSU in Suisun Bay) when Delta outflow was 5,308 ft3/s, corresponding to the highest mean X2 position (84 km) and the lowest mean export:ouflow ratio value (0.11; table 6). These results are an example of how management actions (for example, water diversions) affect water quality. If export:outflow ratio had been maintained at a higher rate more similar to the other surveys, salinity in the western Delta would have been even higher during the 2021 survey.
In 2022, although mean Delta outflow was even lower than in 2021, at 4,955 ft3/s, the position of X2 was maintained at a similar position (83 km) even given a higher export:outflow ratio (0.16; fig. 6; table 6). This result may be explained by the placement of the west False River Emergency Drought Barrier and several rain events that occurred before the spring 2022 survey. As a result, median salinities in the western Delta tidal zone and Suisun Bay during the spring 2022 surveys were 0.4 and 9.0 PSU, respectively, compared to 1.1 and 9.5 PSU in 2021.
pH and Dissolved Oxygen
Main findings are listed here:
-
• There are large ranges in pH and dissolved oxygen (DO) values in many zones of the Delta, with higher values often associated with actively growing algal blooms.
-
• Aquatic vegetation may increase pH and DO values in the Cache Slough complex channel system and Fourteenmile Slough.
Among the water-quality parameters measured during the four surveys, those most directly reflective of photosynthetic productivity are pH and DO. During photosynthesis, DO is produced and carbon dioxide is removed, elevating pH. The reverse occurs during respiration and decomposition, where DO and pH decrease. Increases in DO and pH are often key indicators of an active phytoplankton bloom (for example, rates of photosynthesis exceed respiration), although high rates of photosynthesis by submerged or floating aquatic vegetation can also cause these patterns. Nitrification (the conversion of NH4+ to NO2− and NO3−) also consumes oxygen and decreases pH.
There was a decrease in pH immediately below the EchoWater Facility discharge point on the Sacramento River, particularly in the 2018, 2020, and 2021 spring surveys (figs. 27–28) compared to the river reach immediately upstream. This decrease likely is a result of the rapid nitrification of effluent-derived NH4+. This step change seems to become less pronounced over time because the EchoWater Facility upgrades changed the effluent nutrient makeup and lower upstream pH (figs. 7–8, 27–28). Although these pH changes are measurable, the magnitude of change is relatively small (less than 0.5 pH units), and we are not aware of any evidence that these changes affected biological activity in the Sacramento River. Interestingly, maximum pH values in the north Delta tidal transition zone increased with each survey, indicating a reduction in NH4+ inputs from the EchoWater Facility over time may be decreasing oxygen demand from nitrification. However, there was no clear trend in DO percentage of saturation across the four surveys in these northern Delta zones.
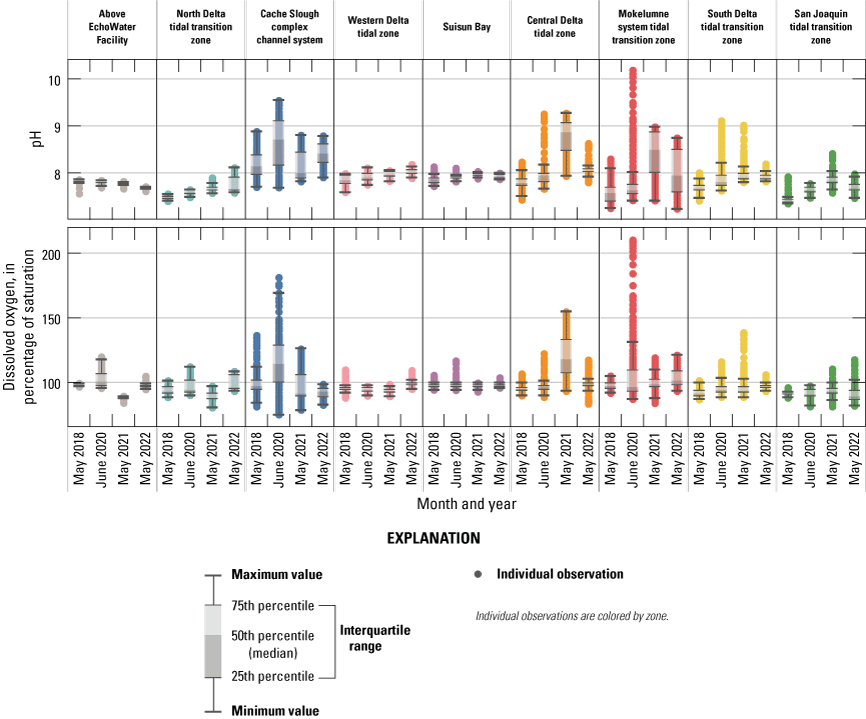
Median, interquartile range, and distribution of dissolved oxygen percentage of saturation measured during surveys done in spring 2018, 2020, 2021, and 2022 in each zone of the Sacramento–San Joaquin Delta, California.
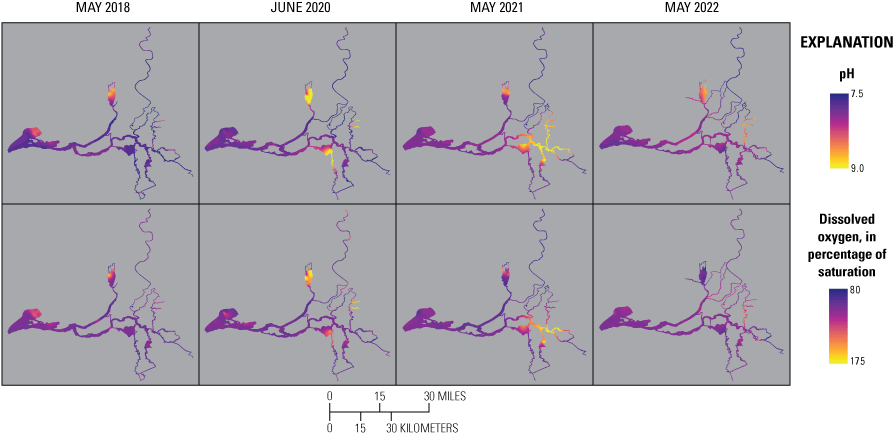
pH and dissolved oxygen percentage of saturation determined during high-resolution mapping surveys of the Sacramento–San Joaquin Delta, California, in spring 2018, 2020, 2021, and 2022.
Trends in pH and DO across the rest of the Delta during the four spring surveys were more variable. Elevated pH and DO were regularly coincident and thus reflective of high primary productivity. For example, in the Mokelumne system tidal transition zone, pH and DO were regularly elevated in Hog and Sycamore Sloughs compared to the main stem of the South Mokelumne River (figs. 2, 28). The highest measurement of pH (more than 10) also was related to the highest increase in maximum DO (more than 200-percent saturation), which occurred in the Mokelumne system tidal transition zone in 2020 (figs. 27–28). Interestingly, high maximum pH and DO values neither corresponded to the highest median pH nor DO in the same zone during the same surveys, highlighting how patchy changes in water-quality parameters can be (figs. 27–28).
In contrast to the association between elevated pH and DO and phytoplankton blooms observed in the Mokelumne system tidal transition zone, the high pH and DO values observed in the Cache Slough complex channel system during the spring 2020 survey were not associated with a phytoplankton bloom (figs. 27–29). This observation indicates that photosynthesis by aquatic vegetation may increase pH and DO values in this wetland dominated zone.
Within the San Joaquin tidal transition zone, Fourteenmile Slough (fig. 2) generally had higher pH and DO percentage of saturation measurements than the San Joaquin River (figs. 2, 28). This result indicates that higher rates of photosynthesis occur in Fourteenmile Slough (fig. 2), although nutrient concentrations were higher in the San Joaquin River (figs. 2, 10, 15, 28). Like observed in the Cache Slough complex, because there is no evidence that Fourteenmile Slough had higher chlorophyll concentrations, productivity in this zone also may be attributable to aquatic vegetation.
Phytoplankton Abundance and Species Composition
Chlorophyll concentration is used as a proxy for phytoplankton biomass, which often is used as an indicator of food availability to the lower food web as well as the presence of harmful algal blooms. Harmful algal blooms can lead to low dissolved oxygen and the production of cyanotoxins and taste and odor compounds (Lee and others, 2017; Chorus and Welker, 2021). Because some phytoplankton are considered beneficial and others can be harmful, the species composition of the phytoplankton community also matters. It is widely assumed that zooplankton and other phytoplankton consumers prefer more nutritious species like diatoms and cryptophytes instead of cyanobacteria and green algae (Ahlgren and others, 1992; Taipale and others, 2013, 2016; Jónasdóttir, 2019). Because of this preference, managers in the Delta strive to provide conditions that support the growth of beneficial phytoplankton species while minimizing the growth of harmful species, particularly cyanobacteria that produce cyanotoxins (Kudela and others, 2023; Larsen and others, 2023).
Although nutrient availability and water-quality parameters presented in this report can affect phytoplankton abundance and species composition, numerous other factors affect phytoplankton, such as light availability, turbulence, seed source, and predation (Ward and Paerl, 2017). Phytoplankton blooms in the Delta are commonly short lived, and thus the four spring snapshots captured in the four surveys are not representative of long-term trends related to the EchoWater Facility upgrade. Here, we briefly discuss spatial trends in total chlorophyll data across the Delta and the relative contributions of the four different phytoplankton groups for the four spring surveys, highlighting major trends and noteworthy events. In particular, we highlight instances where chlorophyll concentrations were greater than 15 µg/L, which we refer to as a “bloom event,” and use the discrete phytoplankton enumeration data to identify which phytoplankton species were dominant and discuss factors that may have contributed to their growth.
Main findings are listed here:
-
• During the four spring surveys, chlorophyll concentrations across the study domain were predominantly below 15 µg/L.
-
• Chlorophyll concentrations exceeding 15 µg/L were evident in the following zones and periods:
-
o Cache Slough complex channel system during the May 2021 survey; attributed to a mix of green algae and cryptophytes.
-
o Suisun Bay during the May 2018 survey; attributed to diatoms.
-
o Central Delta tidal zone during the May 2021 survey; attributed to diatoms.
-
o Mokelumne system tidal transition zone in all but the May 2018 survey, with a major bloom event (as much as about 400 µg/L) occurring in Hog Slough during the June 2020 survey; attributed to cyanobacteria.
-
The range of total chlorophyll concentrations measured for each zone and survey date is shown in the box plots on figure 29 and contour maps on figure 30 (high outlier data in Hog Slough are presented on fig. 31). These data are more specifically attributed to the FluoroProbe’s four phytoplankton groups on figures 32–33, with the percentage contribution of phytoplankton groups to total chlorophyll shown on figures 34–35. Discrete samples for phytoplankton enumeration were collected at approximately 30 discrete stations during each survey, and the total cell biovolume and cell densities were determined from those data and species-specific biovolume and density (figs. 1, 2.1–2.2; Richardson and others, 2023a).
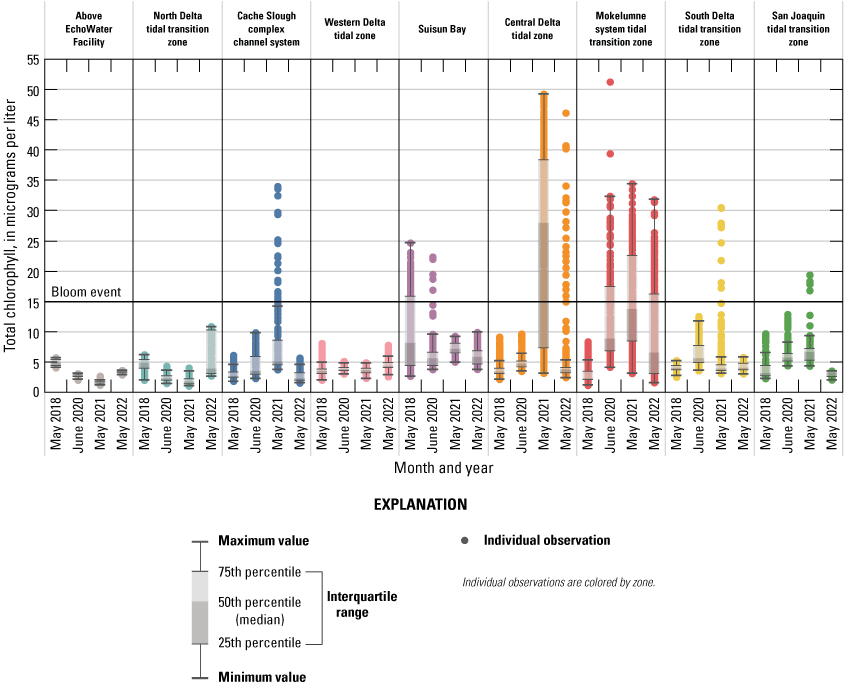
Median, interquartile range, and distribution of total chlorophyll concentration for spring 2018, 2020, 2021, and 2022 in each zone of the Sacramento–San Joaquin Delta. The reference line at 15 micrograms per liter (µg/L) indicates the threshold we consider conditions to indicate a bloom event. The y-axis maximum is set to 55 µg/L; thus, high values from the 2020 spring survey in Hog Slough (Mokelumne system tidal transition zone) are off the scale. Hog Slough data is plotted separately in figure 31.
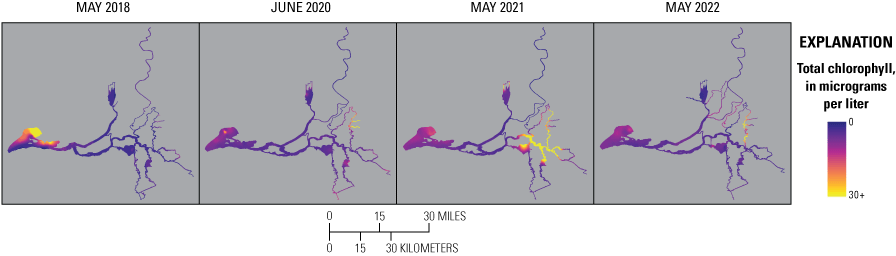
Total chlorophyll concentrations measured during high-resolution mapping surveys of the Sacramento–San Joaquin Delta, California, in spring 2018, 2020, and 2021. Abbreviation: +, plus.
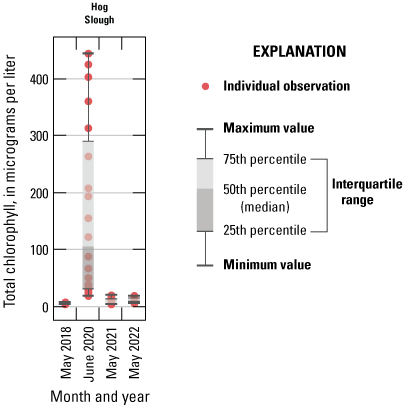
Median, interquartile range, and distribution of total chlorophyll concentration for spring 2018, 2020, 2021, and 2022 in Hog Slough (Mokelumne system tidal transition zone; refer to fig. 2 for slough location).
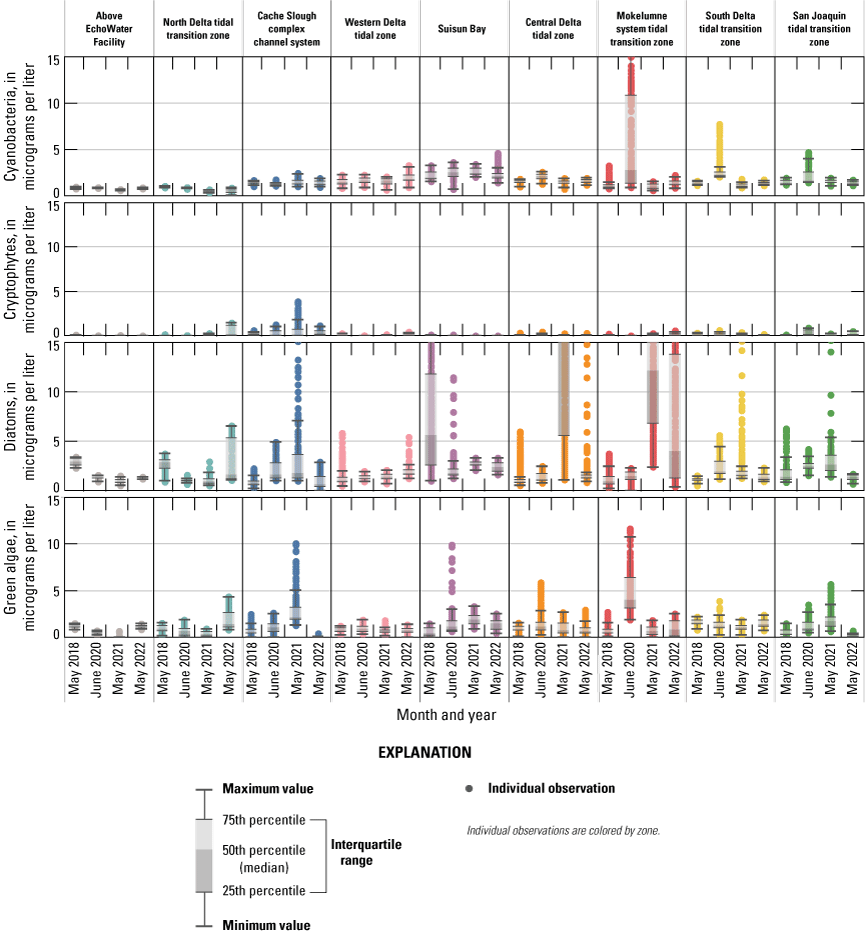
Median, interquartile range, and distribution of chlorophyll fluorescence produced by four phytoplankton groups. The y-axis maximum for cyanobacteria is set to 15 micrograms per liter (µg/L); thus, high values from the 2020 spring survey in Hog Slough (Mokelumne system tidal transition zone) are off the scale.
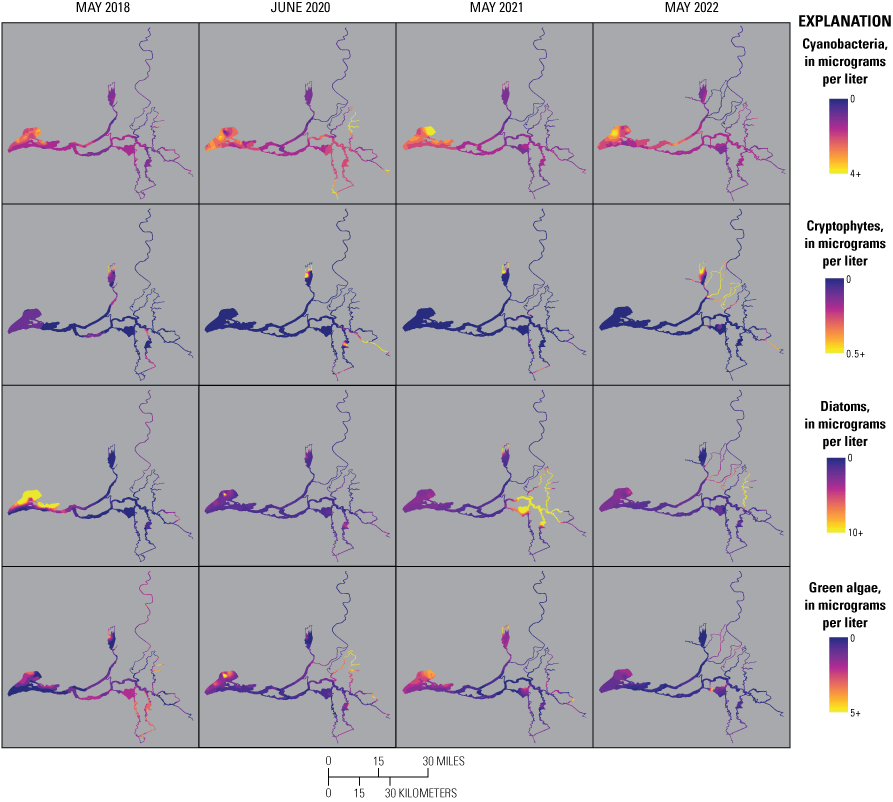
Cyanobacteria, cryptophytes, diatoms, and green algae fluorescence measured during high-resolution mapping surveys of the Sacramento–San Joaquin Delta, California, in spring 2018, 2020, 2021, and 2022. Note that scale maximums are different for each phytoplankton group, such that any values at or above the maximum plot are in yellow. Abbreviation: +, plus.
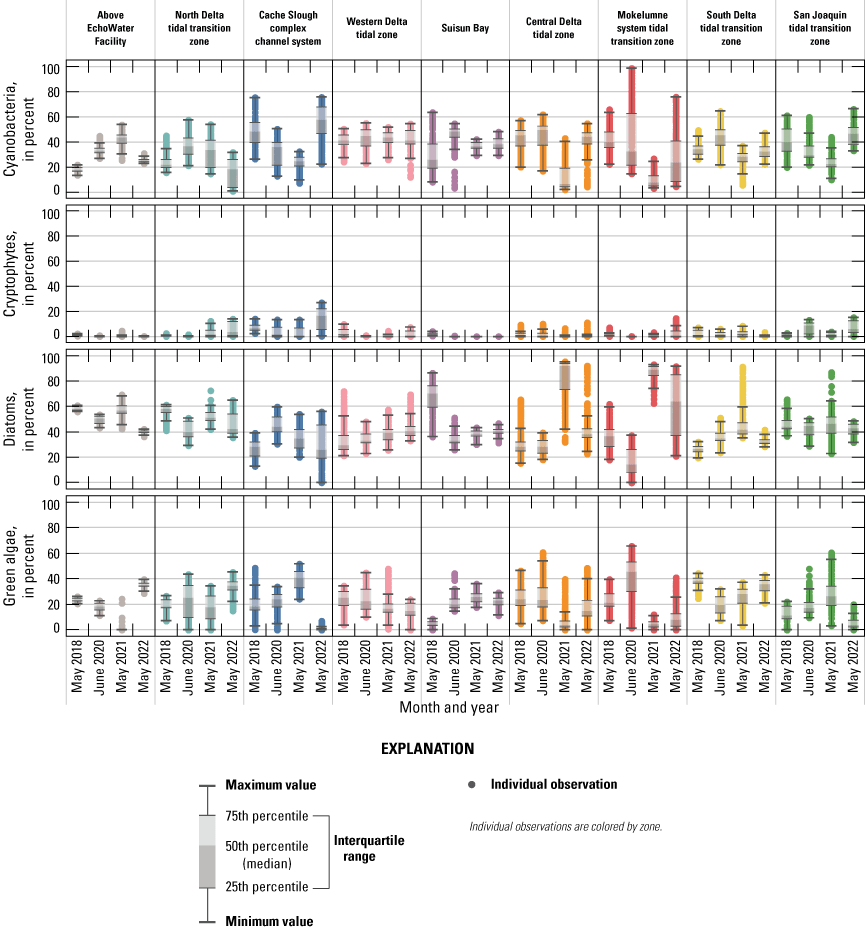
Median, interquartile range, and distribution of cyanobacteria, cryptophytes, diatoms, and green algae relative percentage of contribution during high-resolution mapping surveys of each zone of the Sacramento–San Joaquin Delta, California, for spring 2018, 2020, 2021, and 2022.
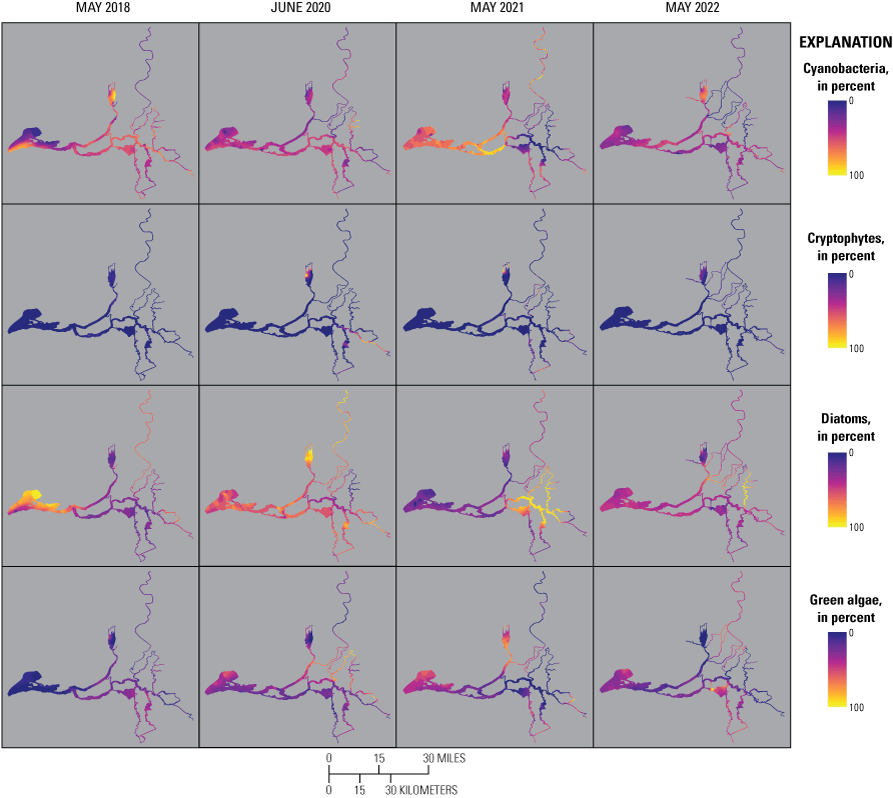
Cyanobacteria, cryptophytes, diatoms, and green algae relative percentage of contribution measured during high-resolution mapping surveys of the Sacramento–San Joaquin Delta, California, in spring 2018, 2020, 2021, and 2022.
Chlorophyll concentrations measured during these spring surveys ranged from close to zero to more than 400 µg/L (figs. 29–31), with most of the data (92 percent) below 15 µg/L and more than half (65 percent) below 5 µg/L. Median chlorophyll concentrations for each zone and date most frequently varied between 3 and 5 µg/L (fig. 29; tables 1.1–1.9).
The cyanobacteria fluorescence data indicated cyanobacteria were present at low levels (less than 5 µg/L; figs. 32–33) throughout most of the Delta during the four spring surveys, except for a localized bloom event in Hog and Sycamore Sloughs during the 2020 survey, discussed further later in the text.
Cryptophyta presence in the Delta during the spring surveys seems to be the lowest out of the four phytoplankton groups; values measured were below 1.5 µg/L, except in the northern Cache Slough complex channel system in 2021 when they reached about 4 µg/L (figs. 32–33). During the spring 2022 survey, Miner and Steamboat Sloughs were added to the survey area, and these channelized distributaries fed by Sacramento River water apparently also support low but measurable populations of cryptophytes (greater than 0.5 µg/L; figs. 2, 33). Because these areas were not surveyed in any other mapping event, it is unclear if this is a common occurrence, particularly because these populations were not measured in adjacent waterways.
Although low in concentration, cryptophytes can contribute as much as 27 percent of the total chlorophyll (fig. 34; table 1.3). The highest percentage of contribution of cryptophytes were in the Cache Slough complex, the San Joaquin tidal transition zone, and the north Delta tidal transition zone during the two surveys that occurred after the BNR upgrade (figs. 34–35). Cryptophytes were consistently low (near zero) in Suisun Bay and in the zone above the EchoWater Facility.
The diatom group was the largest contributor to total chlorophyll (figs. 32–33). The spring 2018 survey documented a diatom bloom (nearly 20 µg/L and 70-percent contribution to total chlorophyll) in Suisun Bay (figs. 32–33; table 1.5). During the spring 2020 survey, diatom concentrations were less than10 µg/L across the Delta, with only a small area of elevated chlorophyll in Suisun Bay (greater than 10 µg/L). During the spring 2021 survey, an extensive diatom bloom (as much as about 46 µg/L and 95-percent contribution to total chlorophyll) was observed, extending from the Mokelumne River into Little Franks Tract and down into the northern part of Middle River and the central San Joaquin River (figs. 2, 33; table 1.6). Another diatom bloom (as much as 29 µg/L and 91-percent contribution to total chlorophyll) was observed during the spring 2022 survey. The 2022 bloom was mostly limited to the Mokelumne River, and the spatial extent was much smaller than the spring 2021 bloom (fig. 33; table 1.7). Note that the diatom blooms in the Mokelumne system tidal transition zone in 2021 and 2022 were not concentrated in Hog and Sycamore Sloughs like the cyanobacteria bloom in spring 2020.
Concentrations of chlorophyll attributed to green algae typically were less than 5 µg/L (fig. 32). During the spring 2020 survey, green algae were detected in a small patch in the northern shoal of Suisun Bay, through the North and South Mokelumne Rivers, and into Hog and Sycamore Sloughs. In these locations, green algae concentrations remained near or below 10 µg/L (figs. 2, 32–33). A localized patch of elevated green algae was near the base of Fishermans Cut near the False River Emergency Drought Barrier in the central Delta tidal zone in spring 2022 (figs. 2, 35). No other algal group occurred at high concentrations at the False River barrier except for green algae, and the 2022 survey was the first survey of this study done after the barrier was installed.
In the following paragraphs, we discuss trends in phytoplankton species abundance and composition by Delta zone, focusing primarily on areas with elevated concentrations (greater than 15 µg/L).
Above the Echowater Facility, North Delta Tidal Transition Zone, and Western Delta Tidal Zone
Water in the main stem of the Sacramento River flows first through the channelized zone above the EchoWater Facility, through the channelized north Delta tidal zone, and then into the more hydrodynamically complex western Delta tidal zone (fig. 2). Bloom events were not recorded during any of the mapping surveys in these three zones, and chlorophyll concentrations in these zones were consistently well below 15 µg/L (fig. 29).
Cache Slough Complex Channel System
Chlorophyll concentrations throughout the Cache Slough complex channel system were similar and low (less than 15 µg/L) during the 2018, 2020, and 2022 surveys, whereas the 2021 survey captured a phytoplankton bloom (as much as 34 µg/L) in the northern part of the Cache Slough complex channel system (figs. 29–30; table 1.3). The highest maximum concentration for each of the four phytoplankton groups were detected in the Cache Slough complex channel system during that bloom (fig. 32; table 1.3). Green algae contributed to total chlorophyll at a higher percentage than any of the three other groups (median of about 39 percent; fig. 32; table 1.3). The phytoplankton enumeration results for the three sites sampled in this zone correspondingly indicated a chlorophyte of the genus Spirogyra, a large filamentous periphyton species, contained the highest biovolume of any species enumerated (greater than 1.8 million cubic micrometers per milliliter [µm3/mL]; fig. 36). Despite the abundance of green algae by cell biovolume, the highest maximum chlorophyll concentration (about 18 µg/L) was on the diatom channel (Bacillariophyta, most commonly; fig. 32; table 1.3). Phytoplankton enumeration results indicate potential diatom genera (and one ochrophyte) that would likely be picked up on the diatom channel, including Melosira, Cocconeis, and Thalassiosira, among others, with no single genus dominating the density or biovolume data (fig. 36).
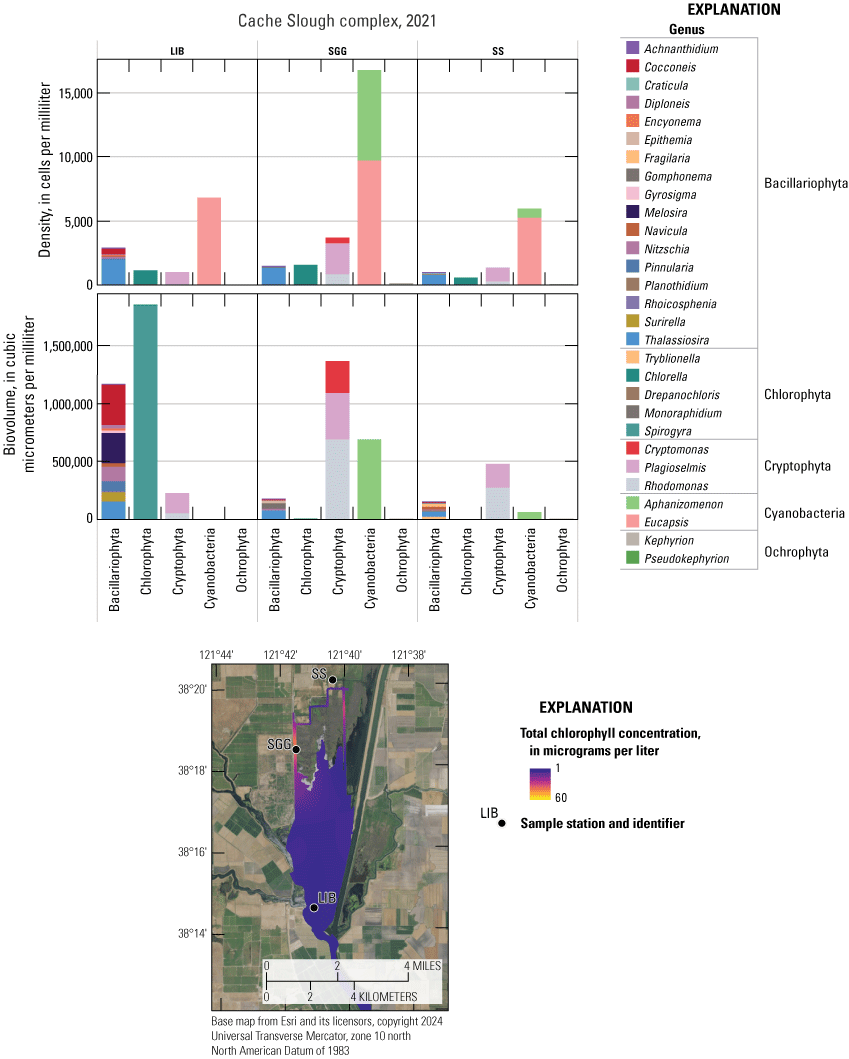
Phytoplankton enumeration cell biovolume and density results collected at three discrete sampling stations (LIB, SGG, and SS) in May 2021 and grouped by division. Map inset shows station locations (fig. 1; table 4) and total chlorophyll concentration during the spring 2021 survey (fig. 30). See table 5 for nomenclature comparisons between FluoroProbe channels and phytoplankton enumeration taxonomic groups.
Each of the three stations in the Cache Slough complex channel system displays unique patterns in phytoplankton species contribution, indicating that the phytoplankton community in this zone is highly variable. Elevated phytoplankton concentrations have been previously reported for areas in the Cache Slough complex channel system that have longer water residence time and shallow water (Stumpner and others, 2020; Brown and others, 2024). It is noteworthy that the Cache Slough complex channel system contained the highest relative abundances of cryptophytes across surveys, though concentrations were below 5 µg/L, with a maximum percentage contribution of 27 percent to overall fluorescence in 2022 (figs. 34–35; table 1.3).
Suisun Bay
Although median chlorophyll concentrations were similar (around 6–10 µg/L, table 1.5) across all four spring surveys in Suisun Bay, there were localized areas that supported higher chlorophyll concentrations around 10–25 µg/L during the 2018 and 2020 surveys (figs. 29–30; table 1.5). The spring 2018 Suisun Bay bloom was more extensive than the spring 2020 bloom but localized to the eastern shoal of Suisun Bay. The 2018 bloom was dominated by diatoms, with diatoms contributing about 70 percent of the total chlorophyll concentration (fig. 34; tables 1.1, 1.5). The 2018 diatom bloom in this part of Suisun Bay also was associated with a drawdown in NO3− and DIN and higher pH and DO percentage of saturation (figs. 10, 28). The GRIZ station was the nearest location to the spring 2018 Suisun Bay bloom, where discrete samples were collected for phytoplankton enumeration (fig. 1; table 4). In the spring 2018 sample, the dominant species attributing to both biovolume and cell density was the diatom Aulacoseira granulata (fig. 37; Bergamaschi and others, 2020).
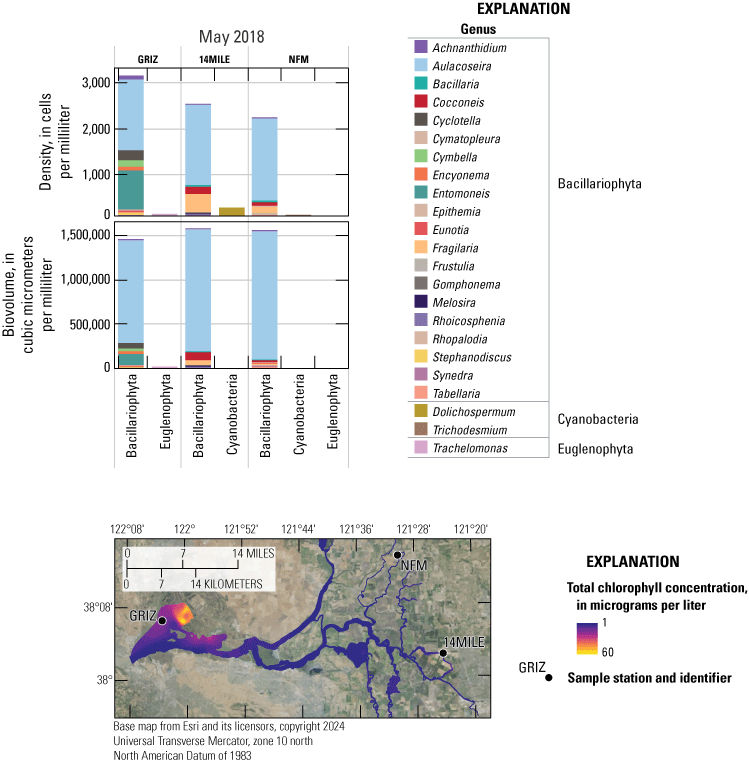
Phytoplankton enumeration cell biovolume and density results from discrete samples collected at three stations (GRIZ, 14MILE, and NFM) in May 2018 and grouped by division. Map inset shows station locations (fig. 1; table 4) and total chlorophyll concentration during the spring 2018 survey (fig. 30). See table 5 for nomenclature comparisons between FluoroProbe channels and phytoplankton enumeration taxonomic groups.
During the May 2018 survey, several stations outside of Suisun Bay were dominated by diatom (Bacillariophyta) biovolume and cell density, and particularly by Aulacoseira, yet they did not display similar bloom conditions where chlorophyll was less than 15 µg/L (figs. 2.1–2.2). Comparing phytoplankton enumeration data at station GRIZ with two sites that have similar high density and relative abundance of diatoms (stations 14MILE and NFM, fig. 1; table 4), a noticeable difference is the presence of the diatoms Achnanthidium, Entomoneis, Cyclotella, Cymbella, and Encyonema at GRIZ (fig. 37; Bergamaschi and others, 2020; Richardson and others, 2023a).
In 2020, a less spatially extensive bloom was localized to the central area of Suisun Bay. This bloom was associated with an increase in diatoms and green algae (figs. 34–35, 2.1–2.2). Like the 2018 Suisun Bay bloom, pH and DO percentage of saturation were elevated at the same location as the bloom (figs. 28, 30). However, instead of an overall DIN drawdown, the 2020 Suisun Bay bloom was associated primarily with a drawdown of NH4+ (fig. 10). This drawdown is because the 2018 bloom was larger, and we surmise the phytoplankton took up all the NH4+ pool and then accessed the NO3− pool (figs. 32–35). During the spring 2020 survey, discrete samples enumerated for phytoplankton at station GRIZ (fig. 1; table 4) were highest in diatom biovolume, attributed to species of the genera Cyclotella and Gyrosigma. However, in terms of cell density, cyanobacteria of the genus Eucapsis were highest (figs. 32–35, 38). Several kinds of green algae were enumerated in the sample collected at station GRIZ in 2020, including Chlorophyta dominated by Chlorella and Euglenophyta, which were not present during the 2018 bloom; however, they do not appear to make up a large part of the biovolume or density in the 2020 sample (fig. 38).
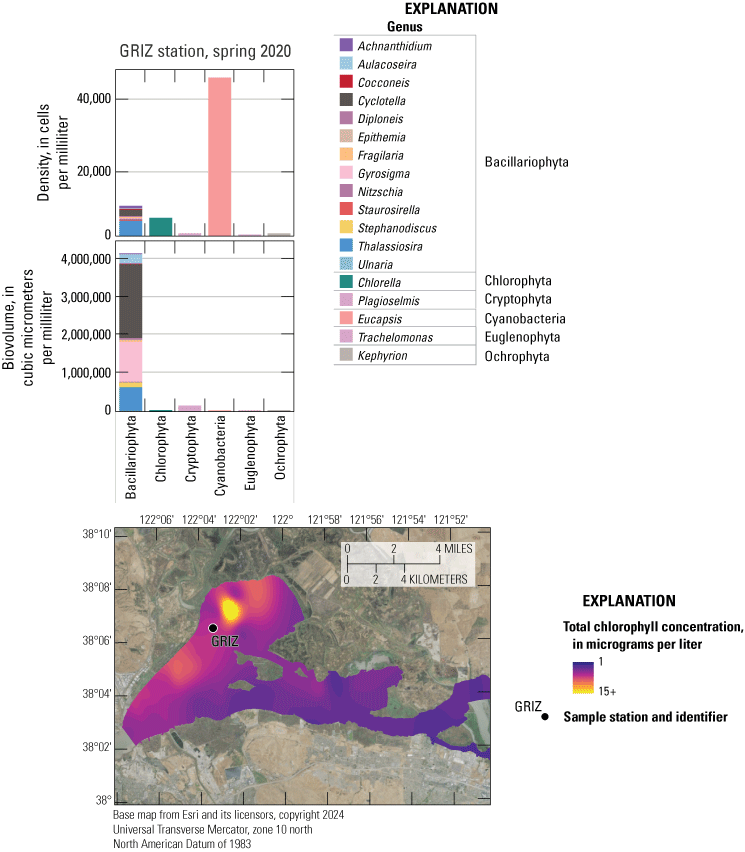
Phytoplankton enumeration cell biovolume and density results collected at the GRIZ discrete sample station in June 2020 and grouped by division. Map inset shows station locations (fig. 1; table 4) and total chlorophyll concentration during the spring 2020 survey (fig. 30). See table 5 for nomenclature comparisons between FluoroProbe channels and phytoplankton enumeration taxonomic groups. Abbreviation: +, plus.
Central Delta Tidal Zone
During the 2018 and 2020 surveys, total chlorophyll concentrations were below 15 µg/L throughout the central Delta tidal zone with median values of 3.4 and 4.7 µg/L, respectively (figs. 29–30). Among the four phytoplankton groups measured, on average, about 28 percent of the total chlorophyll was attributed to diatoms, 45 percent to cyanobacteria, 23 percent to green algae, and less than 1 percent to cryptophytes (figs. 34–35).
There was a large phytoplankton bloom in the central Delta tidal zone during the May 2021 survey, with chlorophyll concentrations of 20–50 µg/L in much of the zone (figs. 32–33). According to the chlorophyll data, diatoms contributed 75–95 percent of these elevated chlorophyll values (median percent contribution of 91 percent; figs. 34–35). Among phytoplankton enumeration data collected from six stations in the central Delta tidal zone during the 2021 spring survey, Aulacoseira was the dominant diatom by biovolume (fig. 39). It also is worth noting that during this period, the cyanobacteria Eucapsis microscopica was similar or higher in density than Aulacoseira, although this species only contributed a small amount to total biovolume. The May 2021 bloom also was associated with elevated DO and pH (figs. 27–28).
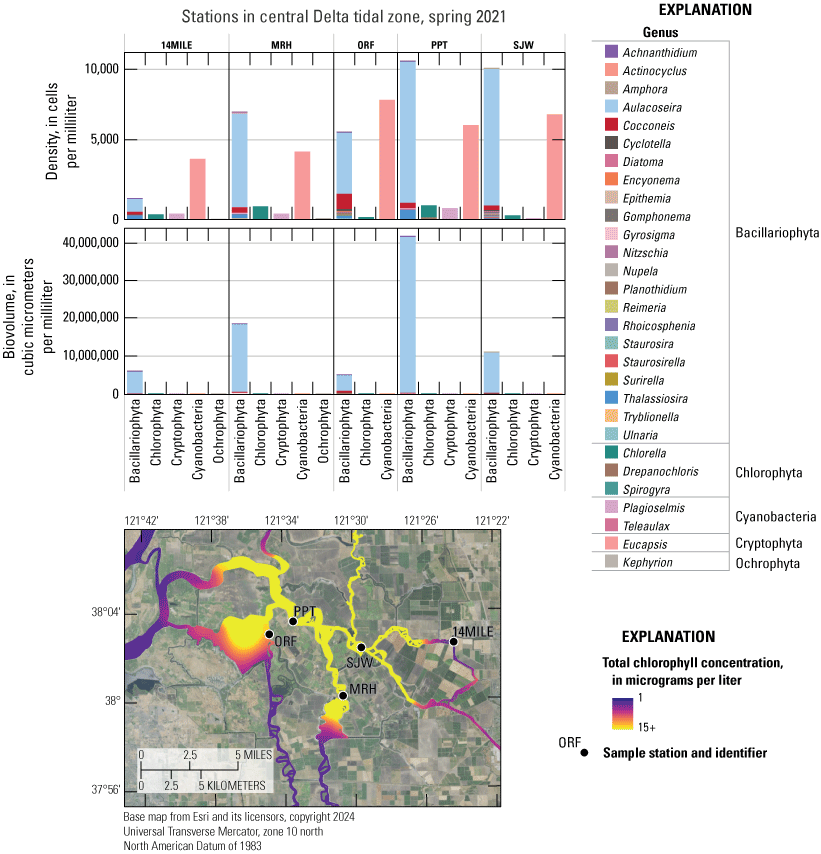
Phytoplankton enumeration cell biovolume and density results collected in the central Delta tidal zone in 2021 and grouped by division. Map inset shows station locations (fig. 1; table 4) and total chlorophyll concentration during the spring 2021 survey (fig. 30). See table 5 for nomenclature comparisons between FluoroProbe channels and phytoplankton enumeration taxonomic groups. Abbreviation: +, plus.
Based on high maximum chlorophyll concentration measurements (46 µg/L), another phytoplankton bloom was evident in the central Delta tidal zone during the spring 2022 survey. However, the median chlorophyll measurement during this survey (4 µg/L) was similar to the first two surveys, indicating that the bloom was spatially confined near the west False River Emergency Drought Barrier (figs. 2, 29). Assessing the chlorophyll concentration data separated by algal groupings (figs. 33, 35), indicated patterns were dissimilar from the 2021 diatom bloom because an increase in percentage of green algae is observed with a decrease in percent diatoms (figs. 33, 35). The concentration of green algae was highest directly at the barrier and into Fishermans Cut (figs. 33, 35). It can be noted that the DCC was closed before and during the spring 2022 mapping survey (table 6), and therefore, nutrient inputs from the Sacramento River did not contribute to this event (low DIN within the effluent by 2022 likely did not spur this bloom; fig. 7).
Mokelumne System Tidal Transition Zone
Total chlorophyll concentration in Hog Slough of the Mokelumne system tidal transition zone during the spring 2020 survey was so high (50–450 µg/L) that those data were replotted separately on figure 40. Visual inspection of the chlorophyll contour maps (fig. 30) indicated Sycamore Slough also had elevated chlorophyll during this survey, with values approaching 30 µg/L.
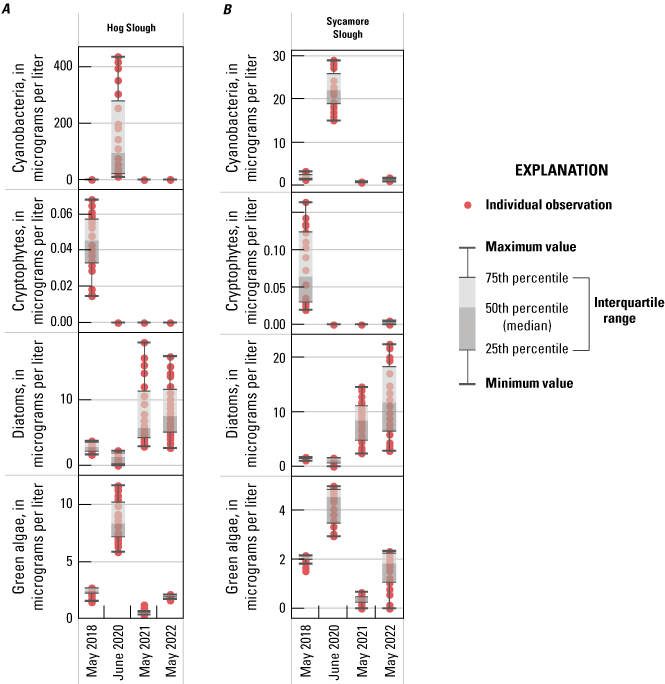
Median, interquartile range, and distribution of chlorophyll produced by four phytoplankton groups measured in A, Hog Slough; and B, Sycamore Slough in the Mokelumne system tidal transition zone. Note the difference in y-axis ranges.
Chlorophyll fluorescence data by phytoplankton group indicated that the elevated chlorophyll in Hog and Sycamore Sloughs during the 2020 survey was attributable mainly to cyanobacteria, with a smaller contribution from green algae (fig. 40). This bloom event coincided with an increase in DIN concentrations in the Mokelumne system tidal transition zone (figs. 10–11), which resulted from the DCC opening before the survey (table 6). The DIN concentration data reflect a drawdown of DIN in Hog and Sycamore Sloughs, which is likely due to DIN uptake associated with these localized blooms (figs. 10–11, 41).
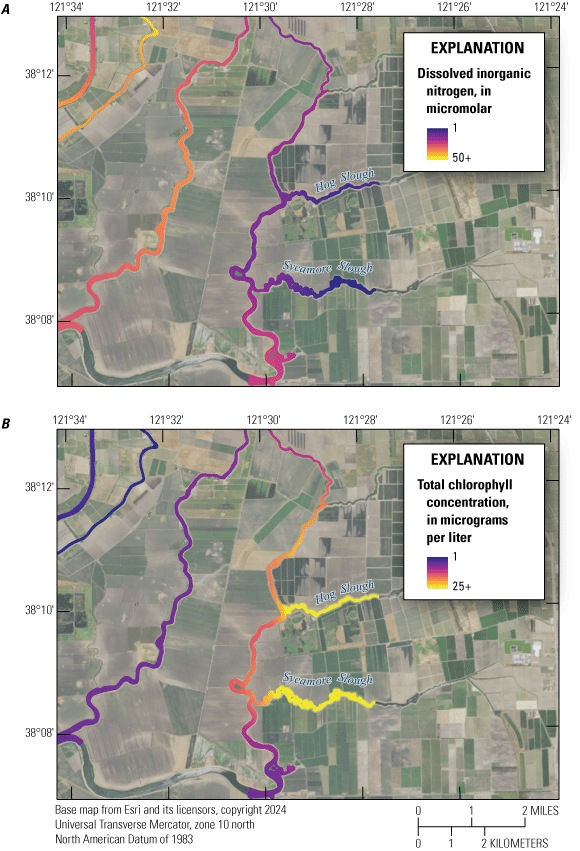
A, Dissolved inorganic nitrogen (in micromolar); and B, total chlorophyll concentration (in micrograms per liter) in Hog and Sycamore Sloughs and surrounding waterways during the spring 2020 mapping survey. Abbreviation: +, plus.
The high DO (as much as 211-percent saturation) and high pH (as much as 10.2) values measured in Hog Slough during the 2020 survey further support that this bloom was actively photosynthesizing (figs. 27–28; table 1.7). Whether or not the 2020 blooms in the Mokelumne system tidal transition zone were supported by the opening of the DCC and delivery of nutrients to this zone will require further investigation—especially because the concentration and form of DIN supplied to this zone via the Sacramento River have changed since the implementation of the BNR upgrade (fig. 7).
Comparing chlorophyll concentrations in the North and South Forks of the Mokelumne River indicated that the South Fork is a more hospitable environment for bloom formation (figs. 2, 42). There are a few hydrologic reasons for this result, including inputs from the higher residence time, dead-end sloughs in the south fork, a lower tidal flow, and shallower water depths (Thompson and others, 2023). Additionally, the South Fork of the Mokelumne River receives less Sacramento River water (for example, effluent flow) than the North Fork (Thompson and others, 2023).
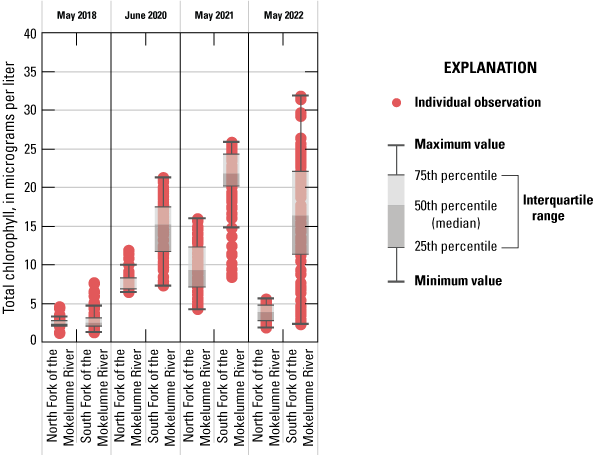
Median, interquartile range, and distribution of total chlorophyll concentration in the North and South Forks of the Mokelumne River (Mokelumne system tidal transition zone, see fig. 2 for location) in spring 2018, 2020, 2021, and 2022.
The phytoplankton enumeration data from stations sampled in the Mokelumne system tidal transition zone also indicated that blooms in Hog and Sycamore Sloughs were dominated by cyanobacteria (figs. 2, 43). Stations SYC and SMS (fig. 1; table 4) indicated high cyanobacteria density and biovolume, with the community composition dominated by Dolichospermum and populations of Aphanizomenon and Eucapsis. Phytoplankton enumeration of the sample collected just downstream at station LPS (fig. 1; table 4) indicated only the minor presence of Dolichospermum species (fig. 43). Phytoplankton enumeration of a sample collected at nearby stations NFM and NMR, which contain similar source water but are not hydrologically connected to Hog or Sycamore Sloughs, did not detect either Dolichospermum or Aphanizomenon genera (fig. 43).
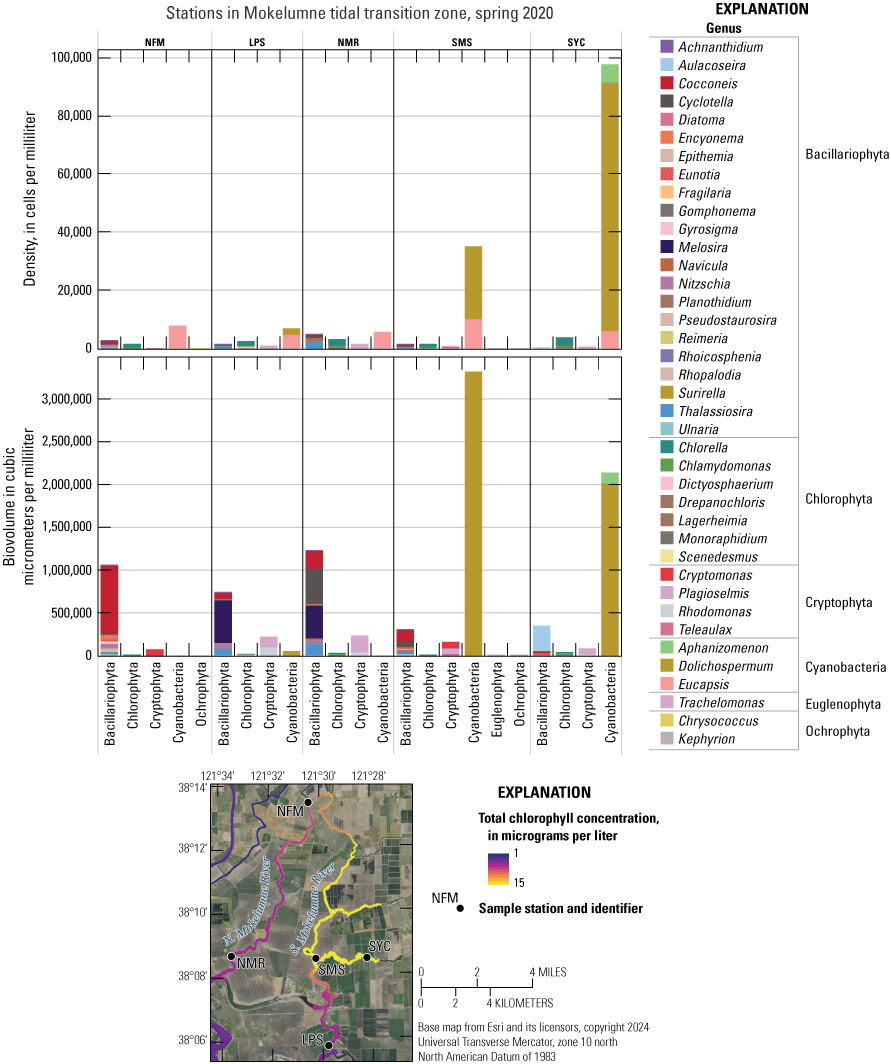
Phytoplankton enumeration cell biovolume and density results from discrete samples collected in the Mokelumne system tidal transition zone in 2020. Map inset shows station locations (fig. 1; table 4) and total chlorophyll concentration during the spring 2020 survey (fig. 30). See table 5 for nomenclature comparisons between FluoroProbe channels and phytoplankton enumeration taxonomic groups.
The Mokelumne system tidal transition zone also had elevated chlorophyll concentrations during the spring 2021 and 2022 surveys (as much as about 35 and 32 µg/L, respectively; figs. 29–30; table 1.7). However, those blooms were composed primarily of diatoms, with minimal contributions of cyanobacteria (figs. 32–33).
South Delta Tidal Transition Zone
Most of the south Delta tidal transition zone supported low (less than 5 µg/L) populations of phytoplankton; however, there were localized areas of higher values (figs. 29–30, 32–33). This zone is comprised of diverse hydrologic and biogeochemical habitats (for example, remnant wetlands and dead-end channels), thus, there may be areas where specific phytoplankton species grow better. For example, near Clifton Court Forebay, off Old River (fig. 2), a localized increase in cyanobacteria was evident during the 2020 survey (fig. 30). The sample enumerated for phytoplankton at the ORCC station nearest to Clifton Court Forebay (fig. 1; table 4) displays a diverse mixture of several genera of cyanobacteria, including Microcystis, Aphanizomenon, Eucapsis, Dolichospermum, Planktolyngbya, and Planktothrix (fig. 44). Additional stations in the south Delta tidal transition zone contained diverse phytoplankton species composition during the spring 2020 survey (fig. 44).
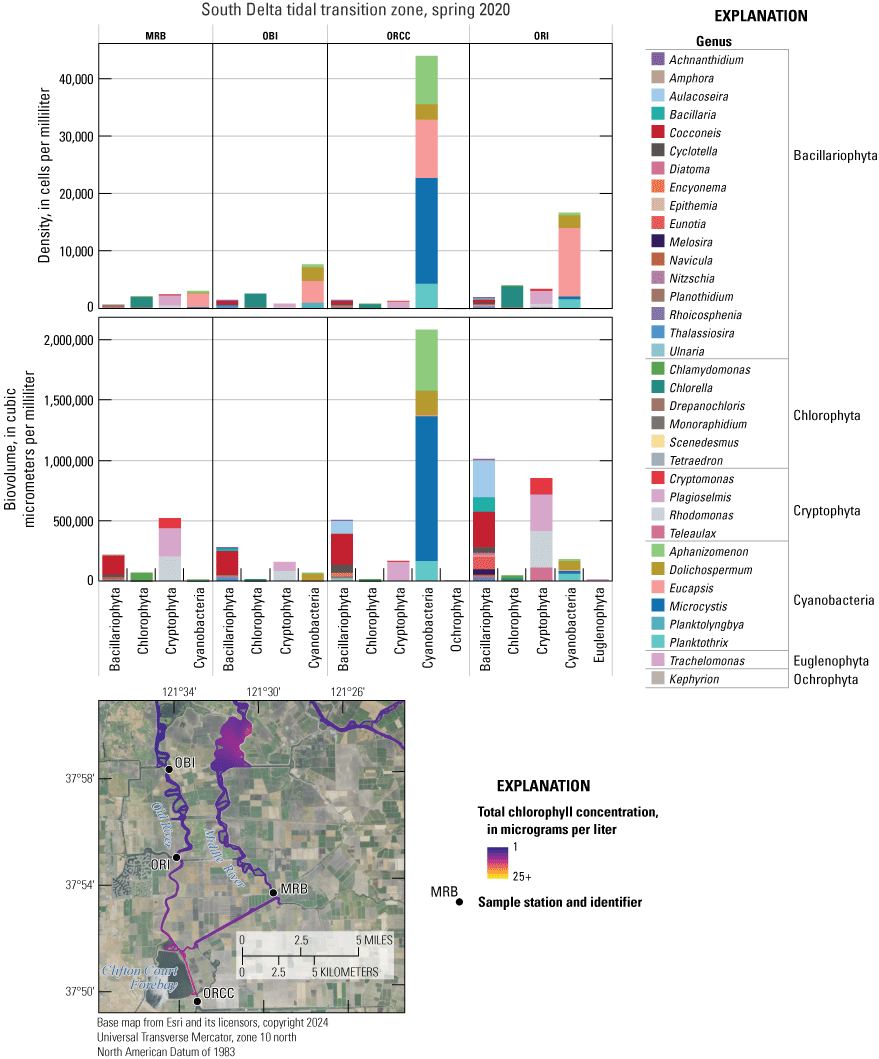
Phytoplankton enumeration cell biovolume and density results collected in the south Delta tidal transition zone in 2020. Map inset shows station locations (fig. 1; table 4) and total chlorophyll concentration during the spring 2020 survey (fig. 30). See table 5 for nomenclature comparisons between FluoroProbe channels and phytoplankton enumeration taxonomic groups. Abbreviation: +, plus.
San Joaquin Tidal Transition Zone
During the four spring surveys, median chlorophyll concentrations in the San Joaquin tidal transition zone ranged from 3.2 to 6.7 µg/L, with concentrations rarely exceeding 10 µg/L (figs. 29–30, 32–33; table 1.9). During the spring 2020 survey, cryptophytes and cyanobacteria were both slightly elevated compared to the other surveys (fig. 32). Density and biovolume measurements of these two groups display interesting results; at station SJRBC, in the San Joaquin tidal transition zone sampled for phytoplankton enumeration during each spring survey, cryptophytes dominate biovolume and cyanobacteria dominate cell density (figs. 1, 45; table 4). The cyanobacteria Eucapsis had the highest cell-density measurements during the 2020–22 spring surveys, according to the phytoplankton enumeration results (fig. 45). However, Eucapsis is a small species and only made up a small contribution to the total biovolume detected in the 2020–22 spring surveys at station SJRBC (fig. 45).
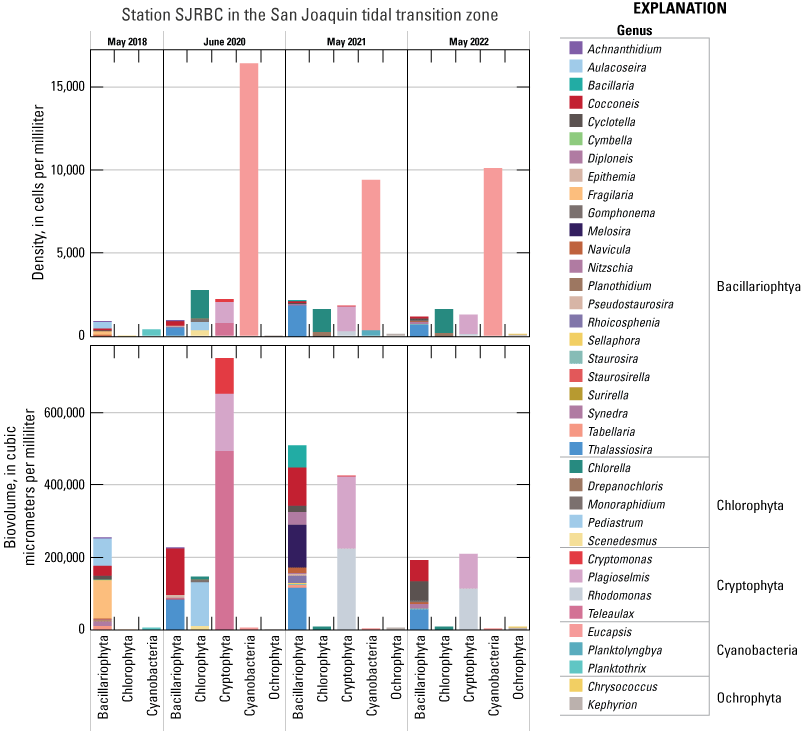
Phytoplankton enumeration cell biovolume and density results from the SJRBC discrete sample station in the San Joaquin tidal transition zone during each spring survey and grouped by division. For station locations, see figure 1 and table 4. See table 5 for nomenclature comparisons between FluoroProbe channels and phytoplankton enumeration taxonomic groups.
The one occasion when total chlorophyll was detected above 15 ug/L in the San Joaquin transition zone was during the spring 2021 survey. The elevated chlorophyll was attributed to diatoms (fig. 32). Enumeration results from the nearby SJRB station also indicated higher diatom (Bacillariophyta) biovolume during the spring 2021 survey (fig. 45). There was no clear dominant diatom species indicated, with a reported mixture of many species, including Thalassiosira, Cocconeis, and Melosira, among others (fig. 45).
Conclusions
This report discusses water quality, nutrient, and phytoplankton data collected during four high-resolution Sacramento–San Joaquin Delta-wide mapping surveys completed in spring (May/June) of 2018, 2020, 2021, and 2022. The studies focused on changes, over time, that can be attributed to the EchoWater Facility’s Biological Nutrient Reduction (BNR) upgrade that came fully online in May 2021. Future data interpretation would ideally include surveys completed in the summer (July) and fall (October) of these 4 years and Delta-wide surveys completed in subsequent years. In addition, data from these surveys can be related to continuous and discrete flow and water-quality data collected at many fixed stations by the U.S. Geological Survey and other entities.
In addition to discussing the broad distribution of four phytoplankton groups (cyanobacteria, cryptophytes, diatoms, and green algae) across the Delta, we highlight instances of algal blooms and describe the water quality and management operations coincident with each. Using microscopy data, we determine the phytoplankton species associated with each bloom. Our data-collection method, high-resolution mapping allows for the granular mapping of the extent of each bloom, which is not possible using traditional discrete sampling, which often are in locations where remote sensing may not be an option (smaller water bodies).
Finally, it can be concluded that the 4 water years during which these mapping surveys took place represent drought conditions. Doing surveys that encompass a wider range of hydrologic conditions would allow for a more holistic view of trends and drivers across the Delta, providing additional insight into future conditions.
References Cited
Achete, F., Wegen, M. van der, Roelvink, J.A., and Jaffe, B., 2017, How can climate change and engineered water conveyance affect sediment dynamics in the San Francisco Bay-Delta system?: Climatic Change, v. 142, p. 375–389, accessed January 16, 2024, at https://doi.org/10.1007/s10584-017-1954-8.
Ahlgren, G., Gustafsson, I.-B., and Boberg, M., 1992, Fatty acid content and chemical composition of freshwater microalgae: Journal of Phycology, v. 28, no. 1, p. 37–50, accessed January 16, 2024, at https://doi.org/10.1111/j.0022-3646.1992.00037.x.
Barros, A.E., 2022, Interagency ecological program zooplankton study (ver. 11): Environmental Data Initiative data package, accessed March 16, 2023, at https://doi.org/10.6073/pasta/51bfce9bc26011095d8b99b3a2aee1b8.
Bashevkin, S.M., and Mahardja, B., 2022, Seasonally variable relationships between surface water temperature and inflow in the upper San Francisco Estuary: Limnology and Oceanography, v. 67, no. 3, p. 684–702, accessed September 25, 2024, at https://doi.org/10.1002/lno.12027.
Beaver, J.R., Tausz, C.E., Scotese, K.C., Pollard, A.I., and Mitchell, R.M., 2018, Environmental factors influencing the quantitative distribution of microcystin and common potentially toxigenic cyanobacteria in U.S. lakes and reservoirs: Harmful Algae, v. 78, p. 118–128, accessed January 16, 2024, at https://doi.org/10.1016/j.hal.2018.08.004.
Bergamaschi, B.A., Kraus, T.E.C., Downing, B.D., Soto Perez, J., O’Donnell, K., Hansen, J.A., Hansen, A.M., Gelber, A.D., and Stumpner, E.B., 2020, Assessing spatial variability of nutrients and related water quality constituents in the California Sacramento–San Joaquin Delta at the landscape scale—2018 High resolution mapping surveys (ver. 2.0, October 2023): U.S. Geological Survey data release, accessed November 17, 2022, at https://doi.org/10.5066/P9FQEUAL.
Bergamaschi, B.A., Kraus, T.E.C., Downing, B.D., Stumpner, E.B., O’Donnell, K., Hansen, J.A., Soto Perez, J., Richardson, E.T., Hansen, A.M., and Gelber, A., 2024, Assessing spatial variability of nutrients, phytoplankton, and related water-quality constituents in the California Sacramento–San Joaquin Delta at the landscape scale—2018 High resolution mapping surveys: U.S. Geological Survey Scientific Investigations Report 2023–5060, 47 p., accessed September 25, 2024, at https://doi.org/10.3133/sir20235060.
Beutler, M., Wiltshire, K.H., Meyer, B., Moldaenke, C., Lüring, C., Meyerhöfer, M., Hansen, U.-P., and Dau, H., 2002, A fluorometric method for the differentiation of algal populations in vivo and in situ: Photosynthesis Research, v. 72, no. 1, p. 39–53, accessed January 16, 2024, at https://doi.org/10.1023/A:1016026607048.
Browman, H.I., Rodriguez, C.A., Beland, F., Cullen, J.J., Davis, R.F., Kouwenberg, J.H.M., Kuhn, P.S., McArthur, B., Runge, J.A., St-Pierre, J.F., and Vetter, R.D., 2000, Impact of ultraviolet radiation on marine crustacean zooplankton and ichthyoplankton—A synthesis of results from the estuary and Gulf of St. Lawrence, Canada: Marine Ecology Progress Series, v. 199, p. 293–311, accessed September 25, 2024, at https://doi.org/10.3354/meps199293.
Brown, L.R., Ayers, D.E., Bergamaschi, B.A., Burau, J.R., Dailey, E.T., Downing, B.D., Downing-Kunz, M., Feyrer, F.V., Huntsman, B.M., Kraus, T.E.C., Morgan, T., Lacy, J.R., Parchaso, F., Ruhl, C.A., Stumpner, E., Stumpner, P., Thompson, J., and Young, M.J., 2024, Physics to fish—Understanding the factors that create and sustain native fish habitat in the San Francisco estuary: U.S. Geological Survey Open-File Report 2023–1087, 150 p., accessed September 25, 2024, at https://doi.org/10.3133/ofr20231087.
Bureau of Reclamation, 2022, Delta cross channel operations: Bureau of Reclamation report, accessed December 13, 2022, at https://www.usbr.gov/mp/cvo/vungvari/Ccgates.pdf.
California Department of Water Resources, 2021, Dayflow: California Department of Water Resources web page, accessed March 16, 2023, at https://data.cnra.ca.gov/dataset/dayflow.
California Department of Water Resources, 2024a, Chronological reconstructed Sacramento and San Joaquin Valley water year hydrologic classification indices: California Department of Water Resources dataset, accessed January 26, 2024, at https://cdec.water.ca.gov/reportapp/javareports?name=wsihist.
California Department of Water Resources, 2024b, Delta outflow: California Department of Water Resources web page, accessed September 25, 2024, at https://cdec.water.ca.gov/dynamicapp/staMeta?station_id=dto.
California Regional Water Quality Control Board, 2021, Waste Discharge Requirements/NPDES [National Pollutant Discharge Elimination System] Permit CA0077682: California Regional Water Quality Control Board, Order R5-2021-0019, 264 p., accessed March 16, 2023, at https://www.waterboards.ca.gov/centralvalley/board_decisions/adopted_orders/sacramento/r5-2021-0019_npdes.pdf.
Chorus, I., and Spijkerman, E., 2021, What Colin Reynolds could tell us about nutrient limitation, N:P ratios and eutrophication control: Hydrobiologia, v. 848, no. 1, p. 95–111, accessed September 25, 2024, at https://doi.org/10.1007/s10750-020-04377-w.
Chorus, I., and Welker, M., 2021, Cyanobacterial toxins, chap. 2 of Chorus, I., and Welker, M., eds., Toxic cyanobacteria in water (2d ed.): London, CRC Press, p. 13–162, accessed January 16, 2024, at https://doi.org/10.1201/9781003081449-2.
Cloern, J.E., 1987, Turbidity as a control on phytoplankton biomass and productivity in estuaries: Continental Shelf Research, v. 7, nos. 11–12, p. 1367–1381, accessed January 16, 2024, at https://doi.org/10.1016/0278-4343(87)90042-2.
Cloern, J.E., 1999, The relative importance of light and nutrient limitation of phytoplankton growth—A simple index of coastal ecosystem sensitivity to nutrient enrichment: Aquatic Ecology, v. 33, no. 1, p. 3–15, accessed January 16, 2024, at https://doi.org/10.1023/A:1009952125558.
Cloern, J.E., 2021, Use care when interpreting correlations—The ammonium example in the San Francisco estuary: San Francisco Estuary and Watershed Science, v. 19, no. 4, 11 p., accessed January 16, 2024, at https://doi.org/10.15447/sfews.2021v19iss4art1.
Cloern, J.E., and Dufford, R., 2005, Phytoplankton community ecology—Principles applied in San Francisco Bay: Marine Ecology Progress Series, v. 285, p. 11–28, accessed January 16, 2024, at https://doi.org/10.3354/meps285011.
Crader, P., Grober, L., Ballard, A., Foe, C., Riddle, D., La Brie, D., Gowdy, M., and Mahaney, E., 2010, Development of flow criteria for the Sacramento–San Joaquin Delta ecosystem: California Environmental Protection Agency, State Water Resources Control Board Resolution report, 178 p., accessed January 16, 2024, at https://www.waterboards.ca.gov/waterrights/water_issues/programs/bay_delta/deltaflow/docs/final_rpt080310.pdf.
Dahm, C.N., Parker, A.E., Adelson, A.E., Christman, M.A., and Bergamaschi, B.A., 2016, Nutrient dynamics of the Delta—Effects on primary producers: San Francisco Estuary and Watershed Science, v. 14, no. 4, 35 p., accessed January 16, 2024, at https://doi.org/10.15447/sfews.2016v14iss4art4.
Delascagigas, A., 2021, Comparison of data generated by the in situ bbe fluoroprobe to traditional laboratory-based methods used to characterize phytoplankton abundance and community composition: Sacramento, Calif., California State University, Sacramento, M.S. thesis, 77 p., accessed January 16, 2024, at https://hdl.handle.net/20.500.12741/rep:2344.
Downing, B.D., Bergamaschi, B.A., Kendall, C., Kraus, T.E.C., Dennis, K.J., Carter, J.A., and von Dessonneck, T.S., 2016, Using continuous underway isotope measurements to map water residence time in hydrodynamically complex tidal environments: Environmental Science & Technology, v. 50, no. 24, p. 13387–13396, accessed November 17, 2022, at https://doi.org/10.1021/acs.est.6b05745.
Dugdale, R.C., Wilkerson, F.P., Hogue, V.E., and Marchi, A., 2007, The role of ammonium and nitrate in spring bloom development in San Francisco Bay: Estuarine, Coastal and Shelf Science, v. 73, nos. 1–2, p. 17–29, accessed November 17, 2022, at https://doi.org/10.1016/j.ecss.2006.12.008.
Eckard, R.S., Bergamaschi, B.A., Pellerin, B.A., Kraus, T., and Hernes, P.J., 2020, Trihalomethane precursors—Land use hot spots, persistence during transport, and management options: Science of the Total Environment, v. 742, 9 p., accessed January 16, 2024, at https://doi.org/10.1016/j.scitotenv.2020.140571.
Edwards, V., Icely, J., Newton, A., and Webster, R., 2005, The yield of chlorophyll from nitrogen—A comparison between the shallow Ria Formosa lagoon and the deep oceanic conditions at Sagres along the southern coast of Portugal: Estuarine, Coastal and Shelf Science, v. 62, no. 3, p. 391–403, accessed September 25, 2024, at https://doi.org/10.1016/j.ecss.2004.09.004.
Fackrell, J.K., Kraus, T.E.C., Young, M.B., Kendall, C., and Peek, S., 2022, Stable isotopes provide insight into sources and cycling of N compounds in the Sacramento–San Joaquin Delta, California, USA: Science of the Total Environment, v. 816, 13 p., accessed January 16, 2024, at https://doi.org/10.1016/j.scitotenv.2021.151592.
Fichot, C.G., Downing, B.D., Bergamaschi, B.A., Windham-Myers, L., Marvin-DiPasquale, M., Thompson, D.R., and Gierach, M.M., 2016, High-resolution remote sensing of water quality in the San Francisco Bay–Delta Estuary: Environmental Science & Technology, v. 50, no. 2, p. 573–583, accessed November 17, 2022, at https://doi.org/10.1021/acs.est.5b03518.
Flynn, K.J., Raven, J.A., Rees, T.A.V., Finkel, Z., Quigg, A., and Beardall, J., 2010, Is the growth rate hypothesis applicable to microalgae?: Journal of Phycology, v. 46, no. 1, p. 1–12, accessed January 16, 2024, at https://doi.org/10.1111/j.1529-8817.2009.00756.x.
Foe, C., Ballard, A., and Fong, S., 2010, Nutrient concentrations and biological effects in the Sacramento–San Joaquin Delta: California Environmental Protection Agency report, 90 p., accessed November 17, 2022, at https://www.waterboards.ca.gov/waterrights//water_issues/programs/bay_delta/docs/cmnt081712/sldmwa/foeetal2010nutrientconcandbioleffectsindelta.pdf.
Gallegos, C.L., 2001, Calculating optical water quality targets to restore and protect submersed aquatic vegetation—Overcoming problems in partitioning the diffuse attenuation coefficient for photosynthetically active radiation: Estuaries, v. 24, no. 3, p. 381–397, accessed January 16, 2024, at https://doi.org/10.2307/1353240.
Glibert, P.M., 2010, Long-term changes in nutrient loading and stoichiometry and their relationships with changes in the food web and dominant pelagic fish species in the San Francisco Estuary, California: Reviews in Fisheries Science, v. 18, no. 2, p. 211–232, accessed November 17, 2022, at https://doi.org/10.1080/10641262.2010.492059.
Glibert, P.M., and Burkholder, J.M., 2011, Harmful algal blooms and eutrophication—“Strategies” for nutrient uptake and growth outside the Redfield comfort zone: Chinese Journal of Oceanology and Limnology, v. 29, no. 4, p. 724–738, accessed November 17, 2022, at https://doi.org/10.1007/s00343-011-0502-z.
Glibert, P.M., Wilkerson, F.P., Dugdale, R.C., and Parker, A.E., 2022, Ecosystem recovery in progress? Initial nutrient and phytoplankton response to nitrogen reduction from sewage treatment upgrade in the San Francisco Bay delta: Nitrogen, v. 3, no. 4, p. 569–591, accessed September 25, 2024, at https://doi.org/10.3390/nitrogen3040037.
Glibert, P.M., Wilkerson, F.P., Dugdale, R.C., Raven, J.A., Dupont, C.L., Leavitt, P.R., Parker, A.E., Burkholder, J.M., and Kana, T.M., 2016, Pluses and minuses of ammonium and nitrate uptake and assimilation by phytoplankton and implications for productivity and community composition, with emphasis on nitrogen-enriched conditions: Limnology and Oceanography, v. 61, no. 1, p. 165–197, accessed November 17, 2022, at https://doi.org/10.1002/lno.10203.
Gowen, R.J., Tett, P., and Jones, K.J., 1992, Predicting marine eutrophication—The yield of chlorophyll from nitrogen in Scottish coastal waters: Marine Ecology Progress Series, v. 85, p. 153–161, accessed September 25, 2024, at https://doi.org/10.3354/meps085153.
Gross, E., Andrews, S., Bergamaschi, B., Downing, B., Holleman, R., Burdick, S., and Durand, J., 2019, The use of stable isotope-based water age to evaluate a hydrodynamic model: Water (Basel), v. 11, no. 11, 17 p., accessed January 16, 2024, at https://doi.org/10.3390/w11112207.
Gross, E., Holleman, R., Kimmerer, W., Munger, S., Burdick, S., and Durand, J., 2023, Using age tracers to estimate ecological rates in a phytoplankton model: Water (Basel), v. 15, no. 11, 26 p., accessed January 16, 2024, at https://doi.org/10.3390/w15112097.
Harrison, J.W., Beecraft, L., and Smith, R.E.H., 2018, Implications of irradiance exposure and non-photochemical quenching for multi-wavelength (bbe FluoroProbe) fluorometry: Journal of Photochemistry and Photobiology, B—Biology, v. 189, p. 36–48, accessed January 16, 2024, at https://doi.org/10.1016/j.jphotobiol.2018.09.013.
Hillebrand, H., Steinert, G., Boersma, M., Malzahn, A., Meunier, C.L., Plum, C., and Ptacnik, R., 2013, Goldman revisited—Faster-growing phytoplankton has lower N:P and lower stoichiometric flexibility: Limnology and Oceanography, v. 58, no. 6, p. 2076–2088, accessed January 16, 2024, at https://doi.org/10.4319/lo.2013.58.6.2076.
Ho, T.-Y., Quigg, A., Finkel, Z.V., Milligan, A.J., Wyman, K., Falkowski, P.G., and Morel, F.M.M., 2003, The elemental composition of some marine phytoplankton: Journal of Phycology, v. 39, no. 6, p. 1145–1159, accessed January 16, 2024, at https://doi.org/10.1111/j.0022-3646.2003.03-090.x.
Jabusch, T., Bresnahan, P., Trowbridge, P., Novick, E., Wong, A., Salomon, M., and Senn, D., 2016, Summary and evaluation of Delta subregions for nutrient monitoring and assessment: San Francisco Estuary Institute Contribution no. 789, 59 p., accessed November 17, 2022, at https://www.sfei.org/documents/delta-subregions.
Jassby, A.D., 2008, Phytoplankton in the upper San Francisco estuary—Recent biomass trends, their causes, and their trophic significance: San Francisco Estuary and Watershed Science, v. 6, no. 1, 24 p., accessed November 17, 2022, at https://doi.org/10.15447/sfews.2008v6iss1art2.
Jassby, A.D., and Cloern, J.E., 2000, Organic matter sources and rehabilitation of the Sacramento–San Joaquin Delta (California, USA): Aquatic Conservation, v. 10, no. 5, p. 323–352, accessed March 16, 2023, at https://doi.org/10.1002/1099-0755(200009/10)10:5<323::AID-AQC417>3.0.CO;2-J.
Jassby, A.D., Cloern, J.E., and Cole, B.E., 2002, Annual primary production—Patterns and mechanisms of change in a nutrient-rich tidal ecosystem: Limnology and Oceanography, v. 47, no. 3, p. 698–712, accessed November 17, 2022, at https://doi.org/10.4319/lo.2002.47.3.0698.
Jassby, A.D., Kimmerer, W.J., Monismith, S.G., Armor, C., Cloern, J.E., Powell, T.M., Schubel, J.R., and Vendlinski, T.J., 1995, Isohaline position as a habitat indicator for estuarine populations: Ecological Applications, v. 5, no. 1, p. 272–289, accessed November 17, 2022, at https://doi.org/10.2307/1942069.
Jónasdóttir, S.H., 2019, Fatty acid profiles and production in marine phytoplankton: Marine Drugs, v. 17, no. 3, 20 p., accessed January 16, 2024, at https://doi.org/10.3390/md17030151.
Jordahl, K., Bossche, J. van den, Fleischmann, M., Wasserman, J., McBride, J., Gerard, J., Tratner, J., Perry, M., Badaracco, A.G., Farmer, C., Hjelle, G.A., Snow, A.D., Cochran, M., Gillies, S., Culbertson, L., Bartos, M., Eubank, N., Albert, M., Bilogur, A., Rey, S., Ren, C., Arribas-Bel, D., Wasser, L., Wolf, L.J., Journois, M., Wilson, J., Greenhall, A., Holdgraf, C., and Leblanc, F.F., 2020, Geopandas/Geopandas—v0.8.1, Python tools for geographic data: Zenodo software release, accessed March 16, 2023, at https://doi.org/10.5281/zenodo.3946761.
Kimmerer, W., Wilkerson, F., Downing, B., Dugdale, R., Gross, E.S., Kayfetz, K., Khanna, S., Parker, A.E., and Thompson, J., 2019, Effects of drought and the emergency drought barrier on the ecosystem of the California delta: San Francisco Estuary and Watershed Science, v. 17, no. 3, 28 p., accessed November 17, 2022, at https://doi.org/10.15447/sfews.2019v17iss3art2.
Kirk, J.T.O., 2010, Light and photosynthesis in aquatic ecosystems (3d ed.): Cambridge, United Kingdom, Cambridge University Press, 649 p., accessed January 16, 2024, at https://doi.org/10.1017/CBO9781139168212.
Kirwan, M.L., and Megonigal, J.P., 2013, Tidal wetland stability in the face of human impacts and sea-level rise: Nature, v. 504, no. 7478, p. 53–60, accessed January 16, 2024, at https://doi.org/10.1038/nature12856.
Klausmeier, C.A., Litchman, E., Daufresne, T., and Levin, S.A., 2004, Optimal nitrogen-to-phosphorus stoichiometry of phytoplankton: Nature, v. 429, no. 6988, p. 171–174, accessed January 16, 2024, at https://doi.org/10.1038/nature02454.
Kraus, T.E.C., Bergamaschi, B.A., Hernes, P.J., Spencer, R.G.M., Stepanauskas, R., Kendall, C., Losee, R.F., and Fujii, R., 2008, Assessing the contribution of wetlands and subsided islands to dissolved organic matter and disinfection byproduct precursors in the Sacramento–San Joaquin River Delta—A geochemical approach: Organic Geochemistry, v. 39, no. 9, p. 1302–1318, accessed January 16, 2024, at https://doi.org/10.1016/j.orggeochem.2008.05.012.
Kraus, T.E.C., Carpenter, K.D., Bergamaschi, B.A., Parker, A.E., Stumpner, E.B., Downing, B.D., Travis, N.M., Wilkerson, F.P., Kendall, C., and Mussen, T.D., 2017a, A river‐scale Lagrangian experiment examining controls on phytoplankton dynamics in the presence and absence of treated wastewater effluent high in ammonium: Limnology and Oceanography, v. 62, no. 3, p. 1234–1253, accessed November 17, 2022, at https://doi.org/10.1002/lno.10497.
Kraus, T.E.C., O’Donnell, K., Downing, B.D., Burau, J.R., and Bergamaschi, B.A., 2017b, Using paired in situ high frequency nitrate measurements to better understand controls on nitrate concentrations and estimate nitrification rates in a wastewater‐impacted river: Water Resources Research, v. 53, no. 10, p. 8423–8442, accessed November 17, 2022, at https://doi.org/10.1002/2017WR020670.
Kudela, R.M., Howard, M.D.A., Monismith, S., and Paerl, H.W., 2023, Status, trends, and drivers of harmful algal blooms along the freshwater-to-marine gradient in the San Francisco Bay–Delta system: San Francisco Estuary and Watershed Science, v. 20, no. 4, 51 p., accessed September 25, 2024, at https://doi.org/10.15447/sfews.2023v20iss4art6.
Larsen, L.G., Bashevkin, S.M., Christman, M.A., Conrad, J.L., Dahm, C.N., and Thompson, J., 2023, Ecosystem services and disservices of Bay–Delta primary producers—How plants and algae affect ecosystems and respond to management of the Estuary and its watershed: San Francisco Estuary and Watershed Science, v. 20, no. 4, 22 p., accessed September 25, 2024, at https://doi.org/10.15447/sfews.2023v20iss4art1.
Lee, C.M., Hestir, E.L., Tufillaro, N., Palmieri, B., Acuña, S., Osti, A., Bergamaschi, B.A., and Sommer, T., 2021, Monitoring turbidity in San Francisco Estuary and Sacramento–San Joaquin Delta using satellite remote sensing: Journal of the American Water Resources Association, v. 57, no. 5, p. 737–751, accessed January 16, 2024, at https://doi.org/10.1111/1752-1688.12917.
Lee, J., Rai, P.K., Jeon, Y.J., Kim, K.-H., and Kwon, E.E., 2017, The role of algae and cyanobacteria in the production and release of odorants in water: Environmental Pollution, v. 227, p. 252–262, accessed January 16, 2024, at https://doi.org/10.1016/j.envpol.2017.04.058.
Mahardja, B., Speegle, J., Nanninga, A., and Barnard, D., 2019, Interagency ecological program—Over four decades of juvenile fish monitoring data from the San Francisco Estuary, collected by the Delta Juvenile Fish Monitoring Program, 1976–2018 (ver. 3): Environmental Data Initiative data package, accessed November 17, 2022, at https://doi.org/10.6073/pasta/87dda12bed2271ce3d91abdb7864c50c.
National Research Council, 2010, A scientific assessment of alternatives for reducing water management effects on threatened and endangered fishes in California’s bay delta: Washington, D.C., National Academies Press, 93 p., accessed January 16, 2024, at https://doi.org/10.17226/12881.
Novick, E., Holleman, R., Jabusch, T., Sun, J., Trowbridge, P., Senn, D., Guerin, M., Kendall, C., Young, M., and Peek, S., 2015, Characterizing and quantifying nutrient sources, sinks and transformations in the Delta—Synthesis, modeling, and recommendations for monitoring: San Francisco Estuary Institute Contribution no. 785, 28 p., accessed November 17, 2022, at https://www.sfei.org/documents/delta-nutrient-sources.
O’Donnell, K., 2014, Nitrogen sources and transformations along the Sacramento River—Linking wastewater effluent releases to downstream nitrate: Sacramento, Calif., California State University, Sacramento, M.S. thesis, 66 p., accessed November 17, 2022, at https://hdl.handle.net/10211.3/131710.
O’Donnell, K., Richardson, E.T., Soto Perez, J., Sturgeon, C.L., Delascagigas, A., Nakatsuka, K., Uebner, M.Q., Bergamaschi, T., Hansen, J.A., Bouma Gregson, K., Kraus, T.E.C., and Bergamaschi, B.A., 2024, Assessing spatial variability of nutrients, phytoplankton, and related water quality constituents in the California Sacramento–San Joaquin Delta at the landscape scale—2022 high resolution mapping surveys: U.S. Geological Survey data release, https://doi.org/10.5066/P9QULEAT.
O’Donnell, K., Stumpner, E., Richardson, E.T., Soto Perez, J., Sturgeon, C.L., Delascagigas, A., Nakatsuka, K., Uebner, M.Q., Bergamaschi, T., Hansen, J.A., Hansen, A.M., Downing, B.D., Kraus, T.E.C., and Bergamaschi, B.A., 2023, Assessing spatial variability of nutrients, phytoplankton and related water-quality constituents in the California Sacramento–San Joaquin Delta at the landscape scale—2020–2021 High-resolution mapping surveys: U.S. Geological Survey data release, https://doi.org/10.5066/P90VYUBX.
Parker, A.E., Dugdale, R.C., and Wilkerson, F.P., 2012a, Elevated ammonium concentrations from wastewater discharge depress primary productivity in the Sacramento River and the northern San Francisco Estuary: Marine Pollution Bulletin, v. 64, no. 3, p. 574–586, accessed March 16, 2023, at https://doi.org/10.1016/j.marpolbul.2011.12.016.
Parker, A.E., Hogue, V.E., Wilkerson, F.P., and Dugdale, R.C., 2012b, The effect of inorganic nitrogen speciation on primary production in the San Francisco Estuary: Estuarine, Coastal and Shelf Science, v. 104–105, p. 91–101, accessed November 17, 2022, at https://doi.org/10.1016/j.ecss.2012.04.001.
Perry, S.E., Brown, T., and Klotz, V., 2024, Interagency ecological program—Phytoplankton monitoring in the Sacramento–San Joaquin Bay-Delta, collected by the Environmental Monitoring Program, 2008–2023 (ver. 9): Environmental Data Initiative data package, accessed September 25, 2024, at https://doi.org/10.6073/pasta/3f08391bdf51583bd4282e697485201d.
Quigg, A., Finkel, Z.V., Irwin, A.J., Rosenthal, Y., Ho, T.-Y., Reinfelder, J.R., Schofield, O., Morel, F.M.M., and Falkowski, P.G., 2003, The evolutionary inheritance of elemental stoichiometry in marine phytoplankton: Nature, v. 425, no. 6955, p. 291–294, accessed January 16, 2024, at https://doi.org/10.1038/nature01953.
Quigg, A., Irwin, A.J., and Finkel, Z.V., 2011, Evolutionary inheritance of elemental stoichiometry in phytoplankton: Proceedings of the Royal Society B—Biological Sciences, v. 278, no. 1705, p. 526–534, accessed January 16, 2024, at https://doi.org/10.1098/rspb.2010.1356.
Rathjen, K.A., Breitburg, D.L., and Neale, P.J., 2012, Effects of ultraviolet radiation on the growth, reproduction and survival of the lobate ctenophore Mnemiopsis leidyi in Chesapeake Bay: Journal of Experimental Marine Biology and Ecology, v. 432–433, p. 121–130, accessed January 16, 2024, at https://doi.org/10.1016/j.jembe.2012.06.029.
Reynolds, C.S., 1999, Non-determinism to probability, or N:P in the community ecology of phytoplankton: Archiv für Hydrobiologie, v. 146, no. 1, p. 23–35, accessed January 16, 2024, at https://doi.org/10.1127/archiv-hydrobiol/146/1999/23.
Richardson, C.M., Fackrell, J.K., Kraus, T.E.C., Young, M.B., and Paytan, A., 2020, Lateral carbon exports from drained peatlands—An understudied carbon pathway in the Sacramento–San Joaquin Delta, California: Journal of Geophysical Research—Biogeosciences, v. 125, no. 12, 21 p., accessed January 16, 2024, at https://doi.org/10.1029/2020JG005883.
Richardson, E.T., Bouma-Gregson, K., Kraus, T.E.C., O’Donnell, K., Sturgeon, C.L., Soto Perez, J., Delascagigas, A., Nakatsuka, K.K., Burau, D.J., Gelber, A.D., Von Hoyningen Huene, B.L., Jumps, N.I., and Bergamaschi, B.A., 2023a, Phytoplankton species composition and abundance in the Sacramento–San Joaquin River Delta—Microscopic enumeration of USGS samples, beginning in 2016 (ver. 1.1, December 2023): U.S. Geological Survey data release, accessed September 25, 2024, at https://doi.org/10.5066/P97ZBPLH.
Richardson, E.T., Bouma-Gregson, K., O’Donnell, K., and Bergamaschi, B.A., 2023b, A simple approach to modeling light attenuation in the Sacramento–San Joaquin Delta using commonly available data: San Francisco Estuary and Watershed Science, v. 21, no. 4, 15 p., accessed September 25, 2024, at https://doi.org/10.15447/sfews.2023v21iss4art5.
Richardson, E.T., Hansen, A.M., Kraus, T.E.C., Downing, B.D., Forsberg, D., Stillian, J., O’Donnell, K., Sturgeon, C.L., and Bergamaschi, B.A., 2023c, A novel boat-based field application of a high-frequency conductometric ammonium analyzer to characterize spatial variation in aquatic ecosystems: Limnology and Oceanography—Methods, v. 21, no. 12, p. 761–774, accessed January 16, 2024, at https://doi.org/10.1002/lom3.10579.
Richey, A., Robinson, A., and Senn, D., 2018, Operation baseline science and monitoring needs—A memorandum summarizing the outcomes of a stakeholder workshop and surveys: Delta Science Program report, 45 p., accessed November 17, 2022, at https://sfbaynutrients.sfei.org/sites/default/files/final_regional_san_workshop_memo_10.03.2018.pdf.
Saleh, D., and Domagalski, J., 2015, SPARROW modeling of nitrogen sources and transport in rivers and streams of California and adjacent states, U.S: Journal of the American Water Resources Association, v. 51, no. 6, p. 1487–1507, accessed November 17, 2022, at https://doi.org/10.1111/1752-1688.12325.
Saleh, D., and Domagalski, J., 2021, Concentrations, loads, and associated trends of nutrients entering the Sacramento–San Joaquin Delta, California: San Francisco Estuary and Watershed Science, v. 19, no. 4, 25 p., accessed January 16, 2024, at https://doi.org/10.15447/sfews.2021v19iss4art6.
Schoellhamer, D.H., 2011, Sudden clearing of estuarine waters upon crossing the threshold from transport to supply regulation of sediment transport as an erodible sediment pool is depleted—San Francisco Bay, 1999: Estuaries and Coasts, v. 34, no. 5, p. 885–899, accessed January 16, 2024, at https://doi.org/10.1007/s12237-011-9382-x.
Senn, D.B., Kraus, T.E.C., Richey, A., Bergamaschi, B.A., Brown, L.R., Conrad, J.L., Francis, C.A., Kimmerer, W., Kudela, R.E., Otten, T.G., Parker, A.E., Robinson, A., Mueller-Solger, A., Stern, D., and Thompson, J.K., 2020, Changing nitrogen inputs to the northern San Francisco Estuary—Potential ecosystem responses and opportunities for investigation: San Francisco Estuary Institute Contribution no. 973, 52 p., accessed November 17, 2022, at https://bacwa.org/wp-content/uploads/2020/11/2020_Delta_Nutrient_Reduction_Responses.pdf.
Senn, D., and Novick, E., 2014, Suisun Bay ammonium synthesis report: San Francisco Estuary Institute Contribution no. 706, 189 p., accessed November 17, 2022, at https://sfbaynutrients.sfei.org/sites/default/files/SuisunSynthesisI_Final_March2014.pdf.
Smith, J.M., Chavez, F.P., and Francis, C.A., 2014, Ammonium uptake by phytoplankton regulates nitrification in the sunlit ocean: PLoS One, v. 9, no. 9, 9 p., accessed January 16, 2024, at https://doi.org/10.1371/journal.pone.0108173.
Steinke, D.A., Young, M.J., and Feyrer, F.V., 2018, Vertical distribution of longfin smelt in the San Francisco Estuary (ver. 3.0, February 2021): U.S. Geological Survey data release, accessed November 17, 2022, at https://doi.org/10.5066/F7SF2VF5.
Stepanauskas, R., Moran, M.A., Bergamaschi, B.A., and Hollibaugh, J.T., 2005, Sources, bioavailability, and photoreactivity of dissolved organic carbon in the Sacramento–San Joaquin River Delta: Biogeochemistry, v. 74, no. 2, p. 131–149, accessed January 16, 2024, at https://doi.org/10.1007/s10533-004-3361-2.
Stumpner, E.B., Bergamaschi, B.A., Kraus, T.E.C., Parker, A.E., Wilkerson, F.P., Downing, B.D., Dugdale, R.C., Murrell, M.C., Carpenter, K.D., Orlando, J.L., and Kendall, C., 2020, Spatial variability of phytoplankton in a shallow tidal freshwater system reveals complex controls on abundance and community structure: Science of the Total Environment, v. 700, 17 p., accessed November 17, 2022, at https://doi.org/10.1016/j.scitotenv.2019.134392.
Taipale, S., Strandberg, U., Peltomaa, E., Galloway, A.W.E., Ojala, A., and Brett, M.T., 2013, Fatty acid composition as biomarkers of freshwater microalgae—Analysis of 37 strains of microalgae in 22 genera and in seven classes: Aquatic Microbial Ecology, v. 71, no. 2, p. 165–178, accessed January 16, 2024, at https://doi.org/10.3354/ame01671.
Taipale, S.J., Vuorio, K., Strandberg, U., Kahilainen, K.K., Järvinen, M., Hiltunen, M., Peltomaa, E., and Kankaala, P., 2016, Lake eutrophication and brownification downgrade availability and transfer of essential fatty acids for human consumption: Environment International, v. 96, p. 156–166, accessed January 16, 2024, at https://doi.org/10.1016/j.envint.2016.08.018.
Terzopoulos, D., and Witkin, A., 1988, Physically based models with rigid and deformable components: IEEE Computer Graphics and Applications, v. 8, no. 6, p. 41–51, accessed November 17, 2022, at https://doi.org/10.1109/38.20317.
Tett, P., Gilpin, L., Svendsen, H., Erlandsson, C.P., Larsson, U., Kratzer, S., Fouilland, E., Janzen, C., Lee, J.-Y., Grenz, C., Newton, A., Ferreira, J.G., Fernandes, T., and Scory, S., 2003, Eutrophication and some European waters of restricted exchange: Continental Shelf Research, v. 23, nos. 17–19, p. 1635–1671, accessed September 25, 2024, at https://doi.org/10.1016/j.csr.2003.06.013.
Thompson, L.C., Mussen, T.D., Cook, M., Nordin, J., Noss, J., Bigler, U., Ramamoorthy, S., Berg, G.M., Driscoll, S., Herrmann, C., Kimmerer, W., Ignoffo, T., Kraus, T., Fackrell, J.K., Bergamaschi, B., Guerin, M., and Rachiele, R., 2023, Sacramento River nutrient change study—A report to the Delta Regional Monitoring Program, State water contractors, and Bureau of Reclamation: Delta Regional Monitoring Program report, 361 p., accessed January 16, 2024, at https://deltarmp.org/Documents/Sacramento_River_Nutrient_Change_Study.pdf.
U.S. Geological Survey, 2023, USGS water data for the Nation: U.S. Geological Survey National Water Information System database, accessed December 13, 2023, at https://doi.org/10.5066/F7P55KJN.
Vogel, J.L., and Beauchamp, D.A., 1999, Effects of light, prey size, and turbidity on reaction distances of lake trout (Salvelinus namaycush) to salmonid prey: Canadian Journal of Fisheries and Aquatic Sciences, v. 56, no. 7, p. 1293–1297, accessed January 16, 2024, at https://doi.org/10.1139/f99-071.
Ward, A.K., and Paerl, H.W., 2017, Delta nutrients forms and ratios public workshop—“Role of nutrients in shifts in phytoplankton abundance and species composition in the Sacramento–San Joaquin Delta”: San Francisco Estuary Institute report, 41 p., accessed January 16, 2024, at https://sfbaynutrients.sfei.org/sites/default/files/2017_wardpaerl_nutrientformsratiosworkshopreport.pdf.
Wells, E., and Interagency Ecological Program, 2024, Interagency Ecological Program—Benthic invertebrate monitoring in the Sacramento–San Joaquin Bay-Delta, collected by the Environmental Monitoring Program, 1975–2023 (ver. 4): Environmental Data Initiative data package, accessed November 17, 2022, at https://doi.org/10.6073/pasta/df4298038f7c9f694668549ec27c47cb.
Wilkerson, F., and Dugdale, R., 2016, The ammonium paradox of an urban high-nutrient low-growth estuary, in Glibert, P.M., and Kana, T.M., eds., Aquatic microbial ecology and biogeochemistry—A dual perspective: Switzerland, Springer, p. 117–126, accessed November 17, 2022, at https://link.springer.com/chapter/10.1007/978-3-319-30259-1_10.
Xu, H., McCarthy, M.J., Paerl, H.W., Brookes, J.D., Zhu, G., Hall, N.S., Qin, B., Zhang, Y., Zhu, M., Hampel, J.J., Newell, S.E., and Gardner, W.S., 2021, Contributions of external nutrient loading and internal cycling to cyanobacterial bloom dynamics in Lake Taihu, China—Implications for nutrient management: Limnology and Oceanography, v. 66, no. 4, p. 1492–1509, accessed January 16, 2024, at https://doi.org/10.1002/lno.11700.
Zierdt-Smith, E.L., Shrader, K.H., Parchaso, F., and Thompson, J.K., 2021, A spatially and temporally intensive sampling study of benthic community and bivalve metrics in the Sacramento–San Joaquin Delta (ver. 2.0, May 2021): U.S. Geological Survey data release, accessed November 17, 2022, at https://doi.org/10.5066/P93BAY64.
Appendix 1. Ranges, Medians, and Averages of Parameters by Zone
Table 1.1.
Ranges, medians, and averages of parameters within the zone above the EchoWater Facility. Cells are colored as a gradient from lowest to highest (lowest is white, highest is darkest) for each parameter.[Cells are colored as a gradient from lowest to highest (lowest is white, highest is darkest) for each parameter. See Bergamaschi and others (2020) for 2018 survey data, O’Donnell and others (2023) for 2020 and 2021 survey data, and O’Donnell and others (2024) for 2022 survey data. Abbreviations: DIN, dissolved inorganic nitrogen; DIP, dissolved inorganic phosphorus; DO, dissolved oxygen; fDOM, dissolved organic matter fluorescence; FNU, formazin nephelometric units; mg/L, milligram per liter; PSU, practical salinity units; °C, degree Celsius; µg/L, microgram per liter; µM, micromolar; %, percent]
Table 1.2.
Ranges, medians, and averages of parameters within the north Delta tidal transition zone included in the report.[Cells are colored as a gradient from lowest to highest (lowest is white, highest is darkest) for each parameter. See Bergamaschi and others (2020) for 2018 survey data, O’Donnell and others (2023) for 2020 and 2021 survey data, and O’Donnell and others (2024) for 2022 survey data. Abbreviations: DIN, dissolved inorganic nitrogen; DIP, dissolved inorganic phosphorus; DO, dissolved oxygen; fDOM, dissolved organic matter fluorescence; FNU, formazin nephelometric units; mg/L, milligram per liter; PSU, practical salinity units; °C, degree Celsius; µg/L, microgram per liter; µM, micromolar; %, percent]
Table 1.3.
Ranges, medians, and averages of parameters within the Cache Slough complex channel system included in the report.[Cells are colored as a gradient from lowest to highest (lowest is white, highest is darkest) for each parameter. See Bergamaschi and others (2020) for 2018 survey data, O’Donnell and others (2023) for 2020 and 2021 survey data, and O’Donnell and others (2024) for 2022 survey data. Abbreviations: DIN, dissolved inorganic nitrogen; DIP, dissolved inorganic phosphorus; DO, dissolved oxygen; fDOM, dissolved organic matter fluorescence; FNU, formazin nephelometric units; mg/L, milligram per liter; PSU, practical salinity units; °C, degree Celsius; µg/L, microgram per liter; µM, micromolar; %, percent]
Table 1.4.
Ranges, medians, and averages of parameters within the western Delta tidal zone included in the report.[Cells are colored as a gradient from lowest to highest (lowest is white, highest is darkest) for each parameter. See Bergamaschi and others (2020) for 2018 survey data, O’Donnell and others (2023) for 2020 and 2021 survey data, and O’Donnell and others (2024) for 2022 survey data. Abbreviations: DIN, dissolved inorganic nitrogen; DIP, dissolved inorganic phosphorus; DO, dissolved oxygen; fDOM, dissolved organic matter fluorescence; FNU, formazin nephelometric units; mg/L, milligram per liter; PSU, practical salinity units; °C, degree Celsius; µg/L, microgram per liter; µM, micromolar; %, percent]
Table 1.5.
Ranges, medians, and averages of parameters within Suisun Bay included in the report.[Cells are colored as a gradient from lowest to highest (lowest is white, highest is darkest) for each parameter. See Bergamaschi and others (2020) for 2018 survey data, O’Donnell and others (2023) for 2020 and 2021 survey data, and O’Donnell and others (2024) for 2022 survey data. Abbreviations: DIN, dissolved inorganic nitrogen; DIP, dissolved inorganic phosphorus; DO, dissolved oxygen; fDOM, dissolved organic matter fluorescence; FNU, formazin nephelometric units; mg/L, milligram per liter; PSU, practical salinity units; °C, degree Celsius; µg/L, microgram per liter; µM, micromolar; %, percent]
Table 1.6.
Ranges, medians, and averages of parameters within the central Delta tidal zone included in the report.[Cells are colored as a gradient from lowest to highest (lowest is white, highest is darkest) for each parameter. See Bergamaschi and others (2020) for 2018 survey data, O’Donnell and others (2023) for 2020 and 2021 survey data, and O’Donnell and others (2024) for 2022 survey data. Abbreviations: DIN, dissolved inorganic nitrogen; DIP, dissolved inorganic phosphorus; DO, dissolved oxygen; fDOM, dissolved organic matter fluorescence; FNU, formazin nephelometric units; mg/L, milligram per liter; PSU, practical salinity units; °C, degree Celsius; µg/L, microgram per liter; µM, micromolar; %, percent]
Table 1.7.
Ranges, medians, and averages of parameters within the Mokelumne system tidal transition zone included in the report.[Cells are colored as a gradient from lowest to highest (lowest is white, highest is darkest) for each parameter. See Bergamaschi and others (2020) for 2018 survey data, O’Donnell and others (2023) for 2020 and 2021 survey data, and O’Donnell and others (2024) for 2022 survey data. Abbreviations: DIN, dissolved inorganic nitrogen; DIP, dissolved inorganic phosphorus; DO, dissolved oxygen; fDOM, dissolved organic matter fluorescence; FNU, formazin nephelometric units; mg/L, milligram per liter; PSU, practical salinity units; °C, degree Celsius; µg/L, microgram per liter; µM, micromolar; %, percent]
Table 1.8.
Ranges, medians, and averages of parameters within the south Delta tidal transition zone included in the report.[Cells are colored as a gradient from lowest to highest (lowest is white, highest is darkest) for each parameter. See Bergamaschi and others (2020) for 2018 survey data, O’Donnell and others (2023) for 2020 and 2021 survey data, and O’Donnell and others (2024) for 2022 survey data. Abbreviations: DIN, dissolved inorganic nitrogen; DIP, dissolved inorganic phosphorus; DO, dissolved oxygen; fDOM, dissolved organic matter fluorescence; FNU, formazin nephelometric units; mg/L, milligram per liter; PSU, practical salinity units; °C, degree Celsius; µg/L, microgram per liter; µM, micromolar; %, percent]
Table 1.9.
Ranges, medians, and averages of parameters within the San Joaquin tidal transition zone included in the report.[Cells are colored as a gradient from lowest to highest (lowest is white, highest is darkest) for each parameter. See Bergamaschi and others (2020) for 2018 survey data, O’Donnell and others (2023) for 2020 and 2021 survey data, and O’Donnell and others (2024) for 2022 survey data. Abbreviations: DIN, dissolved inorganic nitrogen; DIP, dissolved inorganic phosphorus; DO, dissolved oxygen; fDOM, dissolved organic matter fluorescence; FNU, formazin nephelometric units; mg/L, milligram per liter; PSU, practical salinity units; °C, degree Celsius; µg/L, microgram per liter; µM, micromolar; %, percent]
Appendix 2. Phytoplankton Biovolume and Cell Density
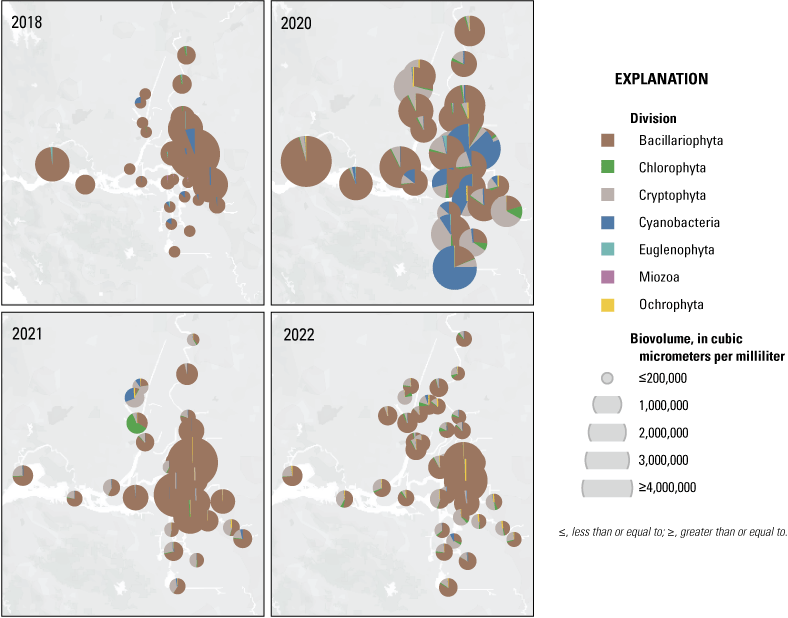
Phytoplankton biovolume (in cubic micrometers per milliliter [µm3/mL]) at discrete sampling stations (fig. 1 in the main text) collected during four high-resolution mapping surveys of the Sacramento–San Joaquin Delta, California, in 2018, 2020, 2021, and 2022. The center of each pie chart indicates where samples were collected; the size of the pie chart indicates the biovolume. Pie charts show relative percentage of contribution of each phytoplankton division to the sample total biovolume.
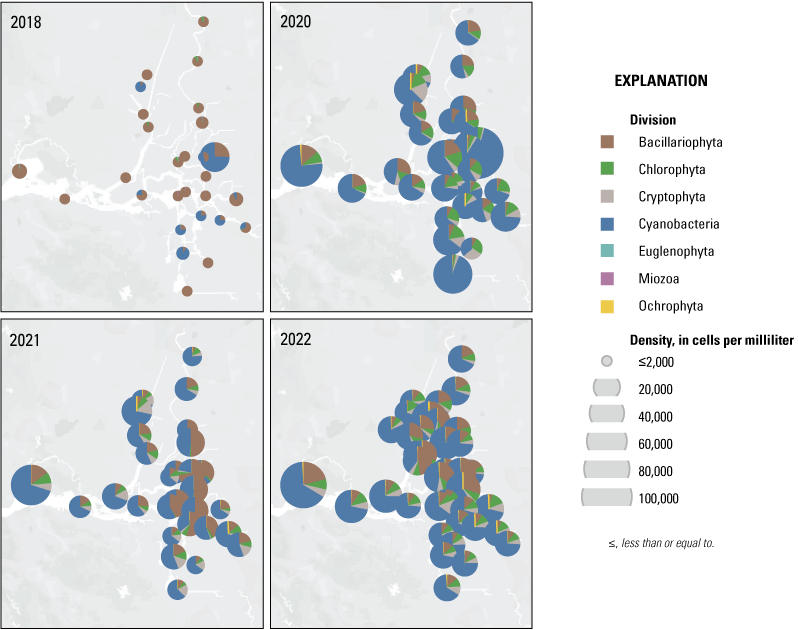
Phytoplankton cell density (in cells per milliliter [cells/mL]) at discrete sampling stations (fig. 1 in the main text) collected during four high-resolution mapping surveys of the Sacramento–San Joaquin Delta, California, in 2018, 2020, 2021, and 2022. The center of each pie chart indicates where the samples were collected; the size of the pie chart indicates the cell density. Pie charts show relative percentage of contribution of each phytoplankton division to the sample total cell density.
Conversion Factors
U.S. customary units to International System of Units
Temperature in degrees Celsius (°C) may be converted to degrees Fahrenheit (°F) as follows:
°F = (1.8 × °C) + 32.
Supplemental Information
A water year is the 12-month period from October 1 through September 30 of the following year and is designated by the calendar year in which it ends.
Concentrations of chemical constituents in water are given in either milligrams per liter (mg/L), micrograms per liter (µg/L), or micromolar (µM). Phytoplankton biovolume are given in cubic micrometers per milliliter (µm3/mL). Phytoplankton densities are given in cells per milliliter (cells/mL).
The distance from the Golden Gate Bridge to the point upstream where bottom salinity is 2 parts per thousand is expressed as “X2”.
Abbreviations
BNR
Biological Nutrient Reduction
CDWR
California Department of Water Resources
DCC
Delta Cross Channel
Delta
Sacramento–San Joaquin Delta
DIN
dissolved inorganic nitrogen
DIN:DIP
dissolved inorganic nitrogen to dissolved inorganic phosphorus
DIP
dissolved inorganic phosphorus
DO
dissolved oxygen
DOC
dissolved organic carbon
DRMP
Delta Regional Monitoring Program
fDOM
dissolved organic matter fluorescence
FNU
formazin nephelometric units
N2
nitrogen gas
NH4+
ammonium
NO2−
nitrite
NO3−
nitrate
NPDES
National Pollutant Discharge Elimination System
P
phosphorus
PO43−
phosphate
PSU
practical salinity units
TOC
total organic carbon
USGS
U.S. Geological Survey
For more information concerning the research in this report, contact the
Director, California Water Science Center
U.S. Geological Survey
6000 J Street, Placer Hall
Sacramento, California 95819
https://www.usgs.gov/centers/california-water-science-center
Publishing support provided by the Science Publishing Network,
Sacramento Publishing Service Center
Disclaimers
Any use of trade, firm, or product names is for descriptive purposes only and does not imply endorsement by the U.S. Government.
Although this information product, for the most part, is in the public domain, it also may contain copyrighted materials as noted in the text. Permission to reproduce copyrighted items must be secured from the copyright owner.
Suggested Citation
Richardson, E., Kraus, T., O’Donnell, K., Soto-Perez, J., Sturgeon, C., Stumpner, E., and Bergamaschi, B., 2025, Assessing spatial variability of nutrients, phytoplankton, and related water-quality constituents in the California Sacramento–San Joaquin Delta at the landscape scale—Comparison of four (2018, 2020, 2021, 2022) spring high-resolution mapping surveys: U.S. Geological Survey Scientific Investigations Report 2025–5035, 78 p., https://doi.org/10.3133/sir20255035.
ISSN: 2328-0328 (online)
Study Area
| Publication type | Report |
|---|---|
| Publication Subtype | USGS Numbered Series |
| Title | Assessing spatial variability of nutrients, phytoplankton, and related water-quality constituents in the California Sacramento–San Joaquin Delta at the landscape scale—Comparison of four (2018, 2020, 2021, 2022) spring high-resolution mapping surveys |
| Series title | Scientific Investigations Report |
| Series number | 2025-5035 |
| DOI | 10.3133/sir20255035 |
| Publication Date | July 02, 2025 |
| Year Published | 2025 |
| Language | English |
| Publisher | U.S. Geological Survey |
| Publisher location | Reston, VA |
| Contributing office(s) | California Water Science Center |
| Description | Report: x, 78 p.; 3 Data Releases |
| Country | United States |
| State | Callifornia |
| Other Geospatial | Sacramento–San Joaquin Delta |
| Online Only (Y/N) | Y |