

Using Public Participatory Geographic Information Systems (PPGIS) to Explore Uses and Values for Mojave Trails National Monument, California
Links
- Document: Report (5.09 MB pdf) , HTML , XML
- Data Release: USGS data release - Values Mapping for Planning in Regional Ecosystems: Mojave Trails National Monument, California, 2024
- Download citation as: RIS | Dublin Core
Acknowledgments
Special thanks to Dr. Rebecca Moore (Bureau of Land Management) for feedback on the values and definitions, and for naming the Values Mapping for Planning in Regional Ecosystems (VaMPIRE) application, and to Dr. Scott Beck (formerly U.S. Geological Survey) for work on prior iterations of VaMPIRE. We would also like to thank Tamara Faust, Mitchell Owens, and Regan Watt (Bureau of Land Management) for coordination of using the VaMPIRE tool in Mojave Trails National Monument, and thanks to Dr. Julie Minde (U.S. Department of Agriculture Forest Service) and Russell Slatton (Bureau of Land Management) for providing feedback on this report. Additionally, we appreciate all the Bureau of Land Management and Department of the Interior staff who provided input on the VaMPIRE application and survey.
Abstract
Many people ascribe a variety of values to public lands and waters, but some values are more difficult to assess and quantify than others. Public participatory geographic information systems (PPGIS) are tools that have been used to help quantify and map the public’s diverse values for a landscape. This work describes the first known Office of Management and Budget–approved use of PPGIS by a Department of the Interior bureau. The U.S. Geological Survey developed an internet-based application to aid in gathering PPGIS data, called Values Mapping for Planning in Regional Ecosystems (VaMPIRE). Further, this work describes the first pilot of the VaMPIRE application in coordination with the Bureau of Land Management to collect spatial data and other survey data regarding the public’s uses of and values for locations within Mojave Trails National Monument. We emailed the link to the VaMPIRE application to an interested party email list in 2024 with 207 valid emails and received 74 responses; we also received 47 responses from members of an off-roading social media group. Of the list of 16 value options, recreation was the most popular value for the monument, followed by wilderness and inspirational. Over 1,000 points were placed throughout the monument, indicating locations people use or value, with the locations spread throughout the entire monument. Additionally, most survey respondents stated their ability to receive benefits in locations they mapped would not change in response to a hypothetical scenario related to recreational facility development. This report describes exploratory results from the first use of the VaMPIRE tool in Mojave Trails National Monument and includes reflections on how the process went and considerations for future use of VaMPIRE.
Introduction
The Bureau of Land Management (BLM) is mandated by the Federal Land Policy and Management Act (FLPMA) of 1976 to manage public lands for multiple uses, including outdoor recreation and human occupancy and use (43 U.S.C. 1701). FLPMA not only requires BLM to manage for recreation, it also requires BLM to collect data for inventorying outdoor recreation and scenic values on a continuing basis and to keep that data “current so as to reflect changes in conditions and to identify new and emerging resource and other values” (U.S. Congress, 1976, 43 U.S.C. 1711). Further, the 2020 BLM Recreation Strategy explicitly identifies a focus area of maintaining an inventory of visitor data, with a particular need for geographic information system (GIS) data related to visitors (BLM, 2020). Visitor data include information regarding the various ways people interact with and value public lands. Identifying specific locations and the ways that people use and value them is vital for supporting land management decisions. However, inventorying values for public lands is a challenging task because it involves collecting and analyzing the values of public land users. It is especially difficult to collect GIS data to understand specific locations people use and value across large geographic scales, since traditional online tools for visitor surveys often do not have the option to add complex geospatial questions.
In 2016, the BLM and U.S. Department of Agriculture Forest Service partnered to collect spatial data on the public’s uses of and values for Browns Canyon National Monument (Bartlett and others, 2017). This effort was referred to as “human ecology mapping” and the purpose was to engage the public before developing a management plan for the monument. This human ecology mapping effort consisted of 6 in-person listening sessions and 1 online listening session, with a total of 178 people who participated (Bartlett and others, 2017). The listening sessions involved the use of public participatory geographic information systems (PPGIS), which is broadly defined as any process that involves geospatial mapping and public engagement (Brown, 2012; Brown and Fagerholm, 2015). In this case, participants notated paper maps to indicate places they visited, used, or interacted with in some way within Browns Canyon National Monument (Bartlett and others, 2017).
This 2016 effort proved to be useful in getting a better sense of features of the monument important to the public, activities the public participated in at the monument, and the specific locations associated with different uses. This information was referenced during the public land use planning process to develop a monument management plan. As a result, this effort fostered public-private participant trust, and therefore, similar PPGIS efforts may be useful in other locations as well to support decision making and updates to resource management plans (Bartlett and others, 2017). Because the data for the Browns Canyon PPGIS effort were collected at public meetings and therefore did not require Paperwork Reduction Act (PRA; Public Law 104–13; 109 Stat. 163) authorization, there were limits on the type of data that could be collected. Specifically, participants could not be asked precise questions, including demographic information, and therefore it is impossible to identify neglected perspectives. However, given the success and information gathered from this human ecology mapping effort, there has been an increased interest in creating an online tool that could collect this type of spatial data at other locations in the future.
In partnership with the BLM, the U.S. Geological Survey (USGS) developed an internet-based PPGIS values mapping application called the Values Mapping for Planning in Regional Ecosystems (VaMPIRE) for use by Federal land management agencies to collect data from members of the public regarding the ways they use and value public lands and waters. The difference between VaMPIRE and other approaches, such as the Browns Canyon effort, is that VaMPIRE is an online tool and also includes a survey that complies with the PRA and has Office of Management and Budget (OMB) approval (OMB Control Number 1028–0139). The VaMPIRE application is designed for both online and in-person survey approaches to maximize participation by anyone in the United States. It is designed to use PPGIS methods to inform public land inventories and support decision making during land-use planning and project review processes.
The overall goal of this research is to test the use of the VaMPIRE application and to better understand human-environment interactions occurring in the Mojave Trails National Monument. We have two specific research questions: (1) Which types of values are most prevalent in Mojave Trails National Monument? (2) What locations within Mojave Trails National Monument do people highly use and value? Additionally, because this is the first use of the VaMPIRE tool, we assess the process itself and opportunities for improvement in the future.
Public Participatory Geographic Information Systems (PPGIS) on U.S. Public Lands and Waters
Globally, the use of PPGIS has been widespread in research evaluating visitor activities and public perceptions of values associated with public lands and waters (Brown, Weber, and Bie, 2014; Brown and Fagerholm, 2015; Hansen and others, 2021; Olafsson and others, 2022). In addition to the use of PPGIS for Browns Canyon National Monument, PPGIS has also been used in multiple other U.S. public lands contexts, mostly in national forests. For example, one such study evaluated public values for six national forests in Colorado and Wyoming and found that biocentric values (for example, future, biodiversity, and aesthetic values) made up the majority of responses (Bagstad and others, 2017). This finding is a common result among many PPGIS surveys across the world (Brown and Raymond, 2007; Nielsen-Pincus, 2011; Brown and Weber, 2012). Another study used PPGIS in two national forests in Alaska to understand how the public’s values for wilderness areas differ from nonwilderness areas, finding that life-sustaining, intrinsic, and spiritual values were more common in wilderness areas than nonwilderness areas (Brown and Alessa, 2005). One of those PPGIS studies within Chugach National Forest in Alaska resulted in a forest plan that was consistent with public preferences and values, rather than the alternative plan that was based only on biophysical characteristics (Reed and Brown, 2003). Lastly, Brown and Reed (2012) used a PPGIS mapping tool to support a values-compatibility analysis to determine the compatibility of proposed off-highway-vehicle routes in the Mt. Hood National Forest in Oregon. When accounting for the landscape values of the public, land managers would be able to select the placement of the off-highway-vehicle routes optimally (Brown and Reed, 2012). The main implication from PPGIS studies on public lands is that land managers can incorporate public attitudes and preferences when making decisions for public resource management and development projects on public lands and waters.
Despite the demonstrated use and value PPGIS brings to planning and decision-making processes, it has not yet been widely used across Federal agencies or locations, partially due to constraints with the OMB approval process and the length of time required to comply with the PRA (Brown, 2012). The studies reviewed in the paragraph above all took place in national forests and collected data over a decade ago. This study represents the first known PPGIS application that has been approved by the OMB for use by a DOI bureau. Additionally, researchers that previously used PPGIS noted that it is particularly useful for multiple-use landscapes, like national forests and BLM lands, because management decisions could affect land use (Brown, Kelly, and Whitall, 2014).
Methods
The following section explains the study location of Mojave Trails National Monument, the development of the questions used in the survey instrument and the survey instrument itself, and how the data were collected and analyzed.
Study Site
Mojave Trails National Monument, located in southern California, was designated in 2016 and encompasses 1.6 million acres of Federal land managed by the BLM (BLM, undated; fig. 1). The national monument contains diverse landscape features, including sand dunes, lava flows, and mountain ranges (refer to recreation points of interest on fig. 1). The historic Route 66 (U.S. Highway 66) runs through the national monument, which is a highway that represents historic places and cultural resources from California to Lake Michigan (National Park Service, 2022). Along with recreational activities such as hiking, camping, and wildlife viewing, the Marble Mountains within Mojave Trails National Monument contain well-known sites for rockhounding and invertebrate fossil collecting (BLM, undated). The area is also known for the cultural and historic landmarks, such as the Mojave Indian Trails, which are historic Native American trading routes, and the Desert Training Center, which was a World War II training facility. There were an estimated 63,000 visits by recreators in 2022 (BLM, 2023).
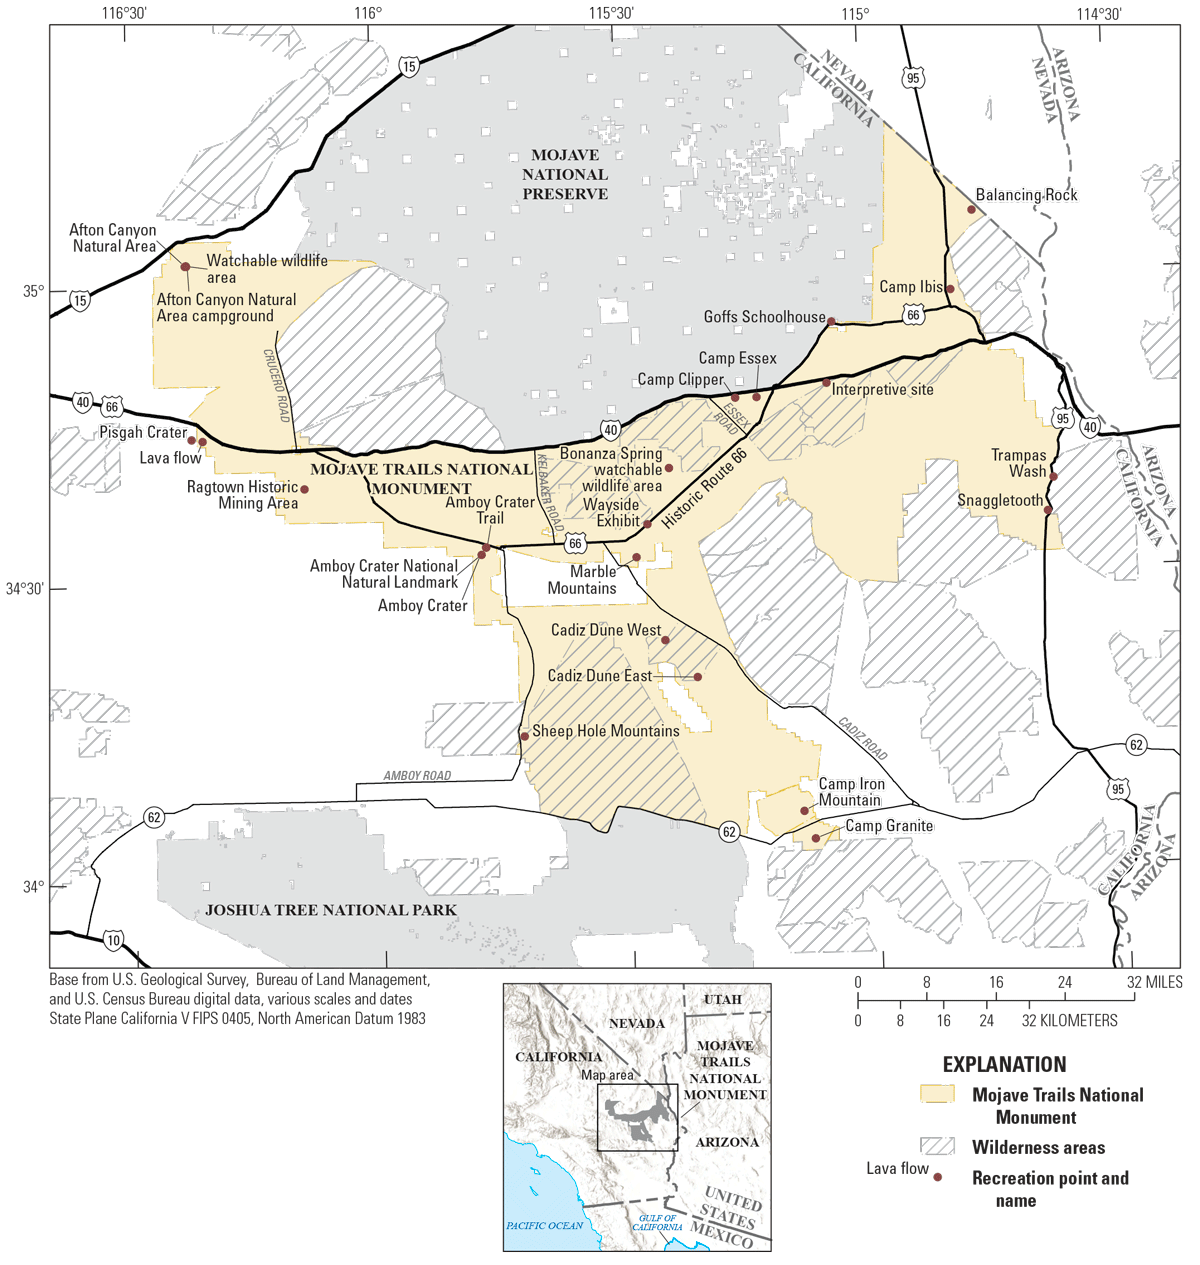
Location map of Mojave Trails National Monument, California. Public land boundary data from the U.S. Geological Survey Protected Areas Database of the United States (U.S. Geological Survey Gap Analysis Project, 2024); wilderness areas data from the Bureau of Land Management (BLM) National Wilderness Areas Polygons (BLM, 2024a); points of interest data from the BLM National Recreation Site Points (BLM, 2024b).
Questionnaire Development
The questionnaire was developed by reviewing prior PPGIS studies and the associated lists of values and definitions used in those studies (for example, Brown and Reed, 2000; Brown, 2004; Allen and others, 2009; Brown, 2012; Brown and Raymond, 2014; Brown and Fagerholm, 2015). We then consulted with BLM collaborators from the Socioeconomics team and the National Operations Center to add and refine questions and values to better fit a BLM context, given the multiple-use landscape. For example, although not common in the prior literature, we added the values “personal income opportunity” and “community economic opportunity” because BLM lands are used for multiple purposes and can offer income opportunities. We also sent the survey to the Interagency Visitor Use Management Council to solicit additional feedback on questions and phrasing. After refining the survey instrument with these groups, we were asked to further edit values and definitions by OMB staff.
There were four sections on the survey: (1) experience use history, (2) GIS application to map uses of and values for the landscape, (3) change in use of the landscape due to land use change or management changes, and (4) demographics. We asked three questions related to experience use history because a person’s past experience and familiarity with the landscape can influence how they use and value that landscape (Moore and Graefe, 1994; Halpenny, 2010). Similarly, demographic data are useful to better understand the characteristics of the sample, which may also affect uses of and values for a landscape.
Data were collected online, and the mapping application asked participants to place points on the map representing their uses of and values for different locations, with Mojave Trails National Monument outlined on the map (refer to fig. 2). We used points rather than polygons because prior research compared the two methods and found that points were more favorable due to greater validity and lower cognitive complexity for participants (Brown and Pullar, 2012). Participants could place up to 30 points on the map (due to the software and how the application was developed). They were asked to select uses and values from a list of 16 different options, all of which had an associated definition. The list of values and their respective definitions can be found in table 1.
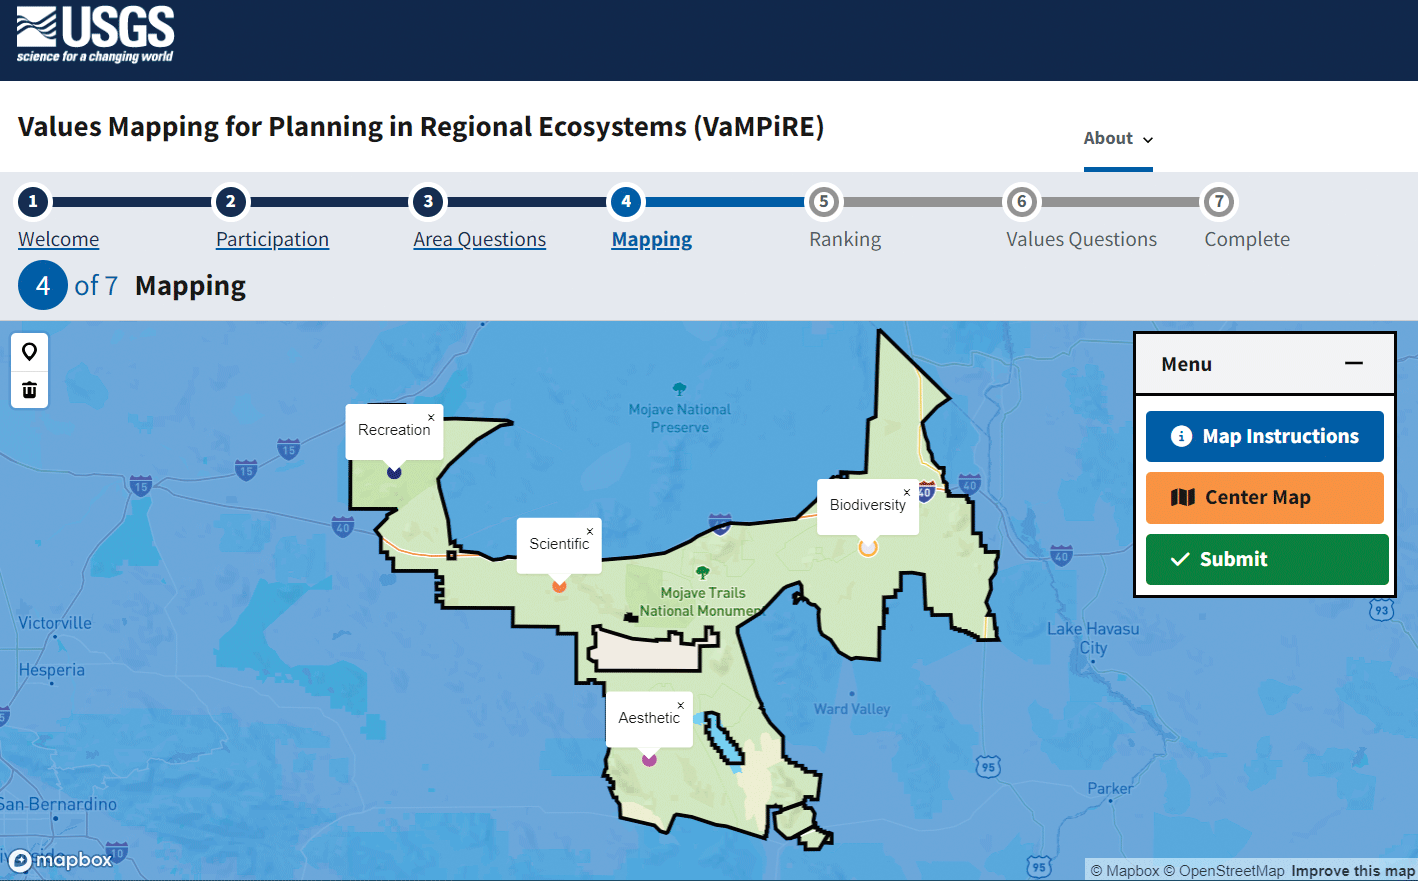
A screenshot of the Values Mapping for Planning in Regional Ecosystems (VaMPIRE) application on the page that includes the mapping component. Users could choose from a list of 16 values to place on the map by clicking on the balloon icon located in the top left.
Table 1.
The list of uses and value options, with their respective definitions, given to participants to add to a map of Mojave Trails National Monument.Following the mapping portion of the survey, participants were asked to rank their top 3 most important location-value pairs, and the following survey questions related only to these top 3 location-value pairs. This approach was used to understand more information about certain locations and values, but to only ask additional questions up to three times (rather than for every point they placed) to keep the survey response time and burden on participants lower. Participants were given a hypothetical scenario and asked how their use of the area would change if the scenario were to happen. For Mojave Trails National Monument, the scenario was recreational facility development and read: “In this hypothetical scenario, increased visitor use requires the development of new facilities to support camping, information dissemination, restrooms, and other needs. As a result, while you are benefiting from [insert value] you will occasionally see utilities, access roads and vehicles, and new development that are associated with this work.”
Based on this scenario, participants were asked if they would change the location they visit, the number of visits, the timing of visits, or the activities participated in, or if they would stop visiting altogether. Participants were then asked what factors would be important in deciding to substitute locations (for example, similar cost, similar travel time, similar use levels). Finally, we asked to what degree this scenario would affect the overall quality of their experience. These questions were each asked up to three times, once for each of their top three location-value pairs selected. These questions were used to better understand how uses of and values for the landscape would change under the recreational facility development hypothetic scenario. The full survey instrument can be found in appendix 1.
Application Development
All data were collected online through a website application developed by the USGS Fort Collins Science Center. The application was supported on all major browsers on computers, tablets, and mobile devices. The mapping interface uses Mapbox (Mapbox, 2024), and users were able to pan and zoom in on the map to locate specific features. Figure 2 shows a screenshot of one page of the application that has the mapping interface showing the map zoomed out on with points placed.
The development of VaMPIRE was a multiyear effort based on an original proof of concept that has been iteratively updated according to feedback from project partners. An open dialog between project scientists, BLM partners, and developers facilitated the creation of the first VaMPIRE prototype, which was gradually refined to accommodate the survey content for the pilot of Mojave Trails National Monument. The application code was written to remain flexible regarding survey location and survey question generation, such that it is possible to use VaMPIRE surveys for multiple locations simultaneously (for example, using different web addresses for each location). VaMPIRE is the culmination of interdisciplinary collaboration, incorporation of user feedback toward application improvement, and constraints to application content and appearance.
The VaMPIRE application has three main components: a front-end program to display the mapping interface and survey, a database server to store survey responses, and an application programming interface (API) program to facilitate communication between the front end and the database. Industry-standard technologies (for example, GraphQL and Docker) are used to securely and efficiently deliver a streamlined survey experience to users. The front end was designed for intuitive operation and extensively uses the U.S. Web Design System for the appearance of the application. The API and database support the display, filtering, and exportation of survey response data such that the data can be accessed via a graphical user interface, filtered using structured query language (SQL)-like commands, and exported in JavaScript Object Notation (JSON) format.
Data Collection
The sample of people contacted for survey participations resulted from an interested party list of Mojave Trails National Monument and included names and emails previously collected by the monument staff. The email list had 246 email addresses, of which 39 were returned as no longer valid. Therefore, the total potential sample size was 207. Surveys were conducted in January and February 2024. Emails were first sent out with an introduction, a description of the purpose of the survey, and a personalized link to the survey. The first reminder email was sent out a week after the initial email, and the last reminder email was sent out 3 weeks after the initial email (following guidance from Dillman and others, 2014). Each potential participant was sent a unique survey link so we could track if they completed the survey, forwarded the survey, or completed it multiple times. People only received the reminder emails if they had not completed the survey at the time the reminders were sent. The spreadsheet with names, email addresses, and unique links to participate in the survey was never connected to the database of survey responses, and all survey responses are anonymous.
Additionally, one participant who was emailed the survey posted the link to the survey in an off-roading-focused Facebook group, which garnered additional responses. Although soliciting responses through social media was not the original intent of this study, due to the large response from the group, we included these data and analyzed them separately from the email-list group when appropriate. The full dataset is available online (Lindley and Wilkins, 2025).
Data Analysis
All data were analyzed using R (version 4.3.1; R Core Team, 2022), and maps were created in R using the ggplot2 package (Kahle and Wickham, 2013). Given that this is the first pilot of the VaMPIRE tool and the research questions are more exploratory in nature, the results focus on presenting summary maps and descriptive statistics (for example, frequencies) for each survey question; we do not aim to provide formal statistical analyses or comparisons. We first used descriptive statistics to show demographics of respondents and their experience with Mojave Trails National Monument. To answer our first research question, we created a table with frequencies of each value that participants placed on the map. For our second research question, we plotted all locations placed within the boundaries of Mojave Trails National Monument to discern the most popular areas in the monument, regardless of associated value category. Locations were then separated by value category and represented in a map for each individual value category. These maps could aid in explaining how certain areas are valued, and the information could be later used in a compatibility analysis with specific management objectives to better understand the optimal location of certain projects, such as trails or restrooms.
Next, we depicted locations placed by respondents from the email-list group and those placed by respondents from the off-roading group. We mapped the locations separately for respondents from the email-list group and the off-roading group, then conducted a hotspot analysis to highlight the most used areas in Mojave Trails National Monument by each group. Hotspot analysis was conducted in R using sfhotspot (Ashby, 2023) using a cell size of 2,000 feet. We end by showing the frequencies of different responses regarding the hypothetical scenario and how it would affect use of the area and user experiences.
Results
The following sections describe the response rates and characteristics of the sample, the values for Mojave Trails National Monument, the spatial distribution of values throughout the monument, and the responses to the hypothetical scenario of recreational facility development. In many of the tables and figures below, we separate the results from participants from the interested parties email-list group and participants from the off-roading social media group.
Response Rates and Characteristics of the Sample
There were 74 total responses from the email-list group out of 207 deliverable email recipients, which is a response rate of 35.7 percent. We obtained an additional 47 responses from the survey being posted in an off-roading group on a social media outlet. Combined, this represents a total of 121 responses.
Table 2 shows characteristics of respondents divided into these two groups: respondents from the email-list group and respondents from the off-roading group. Based on the respondent’s year of birth, respondents were grouped in six age bands, as can be seen in table 2. A majority (64.7 percent) of respondents from the email-list group were 60 years or older, while 46.7 percent of respondents from the off-roading group were 60 years or older. Very few people under the age of 40 from either group participated in this survey. Additionally, the samples for both groups had more male participants, with the off-roading group being particularly skewed toward men. For both samples, most respondents have a bachelor’s degree or higher, are white/Caucasian and not of Hispanic, Latino, or Spanish origin, and lived in California at the time of the survey.
Table 2.
Demographic characteristics of survey respondents from the email-list group and off-roading group.[Sample sizes for each question are often less than the total sample size because respondents could choose to not answer any of the demographic questions. The “Number” columns indicate the number of respondents for each category and question. M.D., doctor of medicine; J.D., doctor of law; Ph.D., doctor of philosophy]
Table 3 consists of summary statistics of respondents’ experience use history of Mojave Trails National Monument separated by respondents from the email-list group and respondents from the off-roading group. The two most common responses for the number of years the respondent has been visiting Mojave Trails National Monument were 6–7 years and 20 or more years for both samples. The most common responses for the number of visits to the monument in an average year were 1–2 times and 3–4 times a year for both groups, with 62.2 percent of the email-list group visiting 1–4 times a year on average, and 59.6 percent of the off-roading group visiting 1–4 times a year. Respondents from both groups visit most often in the fall and spring and visit least often in the summer. Additionally, most respondents indicated they visited in more than one season.
Table 3.
Respondents’ experience use history with the Mojave Trails National Monument.[The “Number” columns indicate the number of respondents for each category and question.]
Values for Mojave Trails National Monument
Respondents placed a total of 1,069 values locations around the Mojave Trails National Monument area, 1,005 of which were specifically within the boundaries of Mojave Trails National Monument. The following results and figures use only those points placed within the monument boundaries. The number of points placed for each value category is shown in table 4. On average, respondents from the email-list group placed 8.77 points in the national monument per person, while respondents from the off-roading group placed 7.57 points in the national monument per person.
Table 4.
Respondents’ values placed within Mojave Trails National Monument.[n, number of respondents]
Across both groups, recreation accounted for over half of all points placed by respondents, with 52 percent of locations placed by the email-list group representing recreation, and 74 percent of locations placed by the off-roading group representing recreation (table 4). For the email-list group, all 16 of the value options were selected at least twice, while 2 value options were not selected by any participants in the off-roading group (biodiversity and life sustaining). Apart from recreation, the most common value choices from the email-list group were wilderness, inspirational (intellectual), education or learning, and biodiversity. For the off-roading group, aside from recreation, the most common values placed were therapeutic (mental health) and aesthetic.
Of the top three values ranked by each email-list respondent (185 total responses), 45.41 percent were recreation, 9.73 percent were inspirational (intellectual), and 8.11 percent were wilderness. As for the off-roading group, 107 total locations were placed in the top three values for each person. These responses were skewed more heavily toward recreation, with 78.50 percent recreation, 5.61 percent aesthetic, and 3.74 percent therapeutic (mental health). Of these points, the most common primary recreation activity for the off-roading group was off-roading (65.48 percent), whereas the most common primary activity for recreation for the email-list group was rockhounding (39.23 percent). The follow-up question asking about specific recreational activities was only asked for each individual’s top three locations.
Spatial Patterns of Values for Mojave Trails National Monument
Figure 3 depicts the specific locations respondents use or value (combining responses from both the email and off-roading groups). Areas with the highest concentration of points are in the northwest portion of the national monument, near the Afton Canyon Natural Area and the Pisgah Crater and lava flow area. While there is a higher concentration of locations in the northern area of the national monument, locations valued by respondents exist throughout the entire monument.
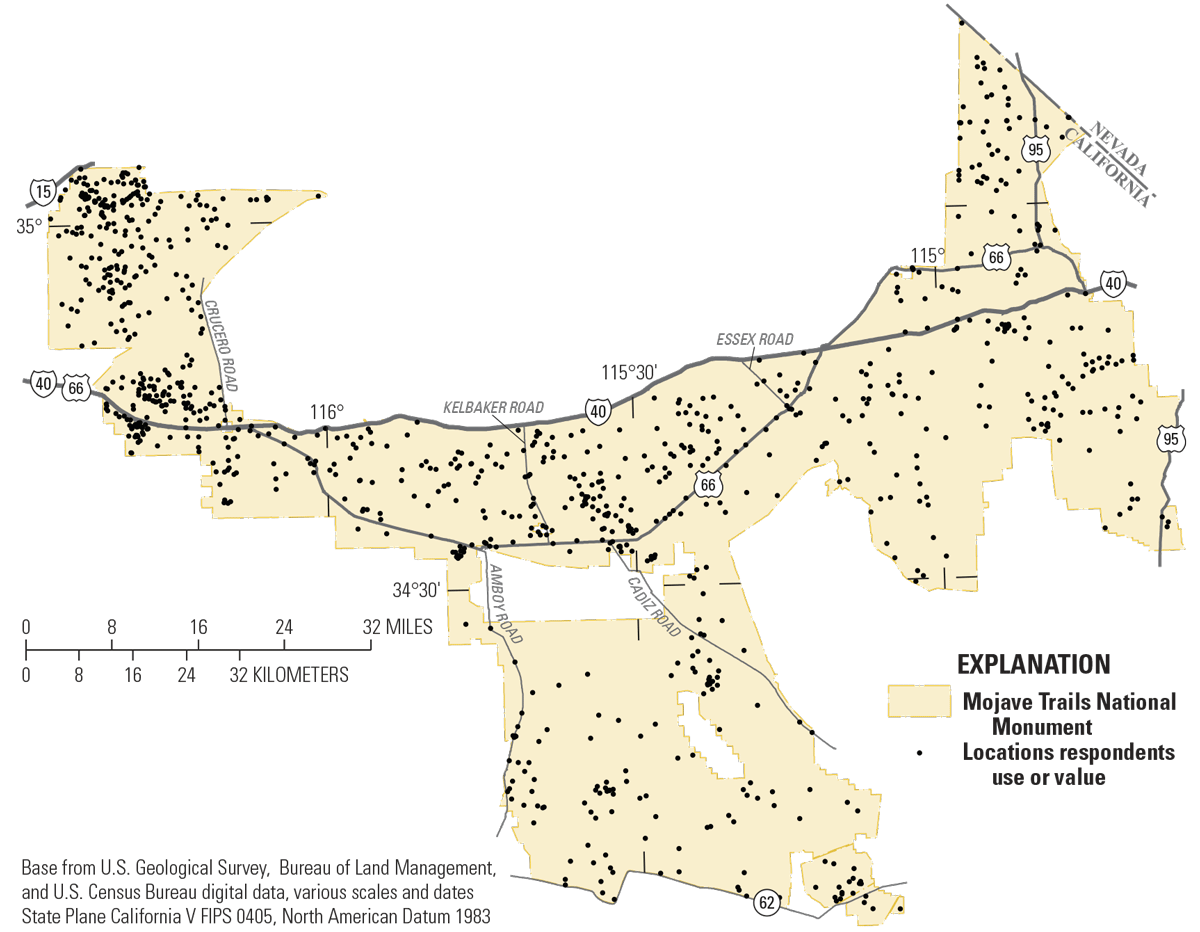
Locations respondents value within Mojave Trails National Monument (U.S. Geological Survey Gap Analysis Project, 2024). There are 1,005 total points.
Figure 4 shows the locations placed by respondents, separated by value type. While every value category was used, recreation was the most common value associated with a location, whereas life sustaining and personal-income opportunity were the least common. Overall, the locations for each value were placed throughout the national monument, and there are no clear visual differences in how the different values cluster on the landscape.
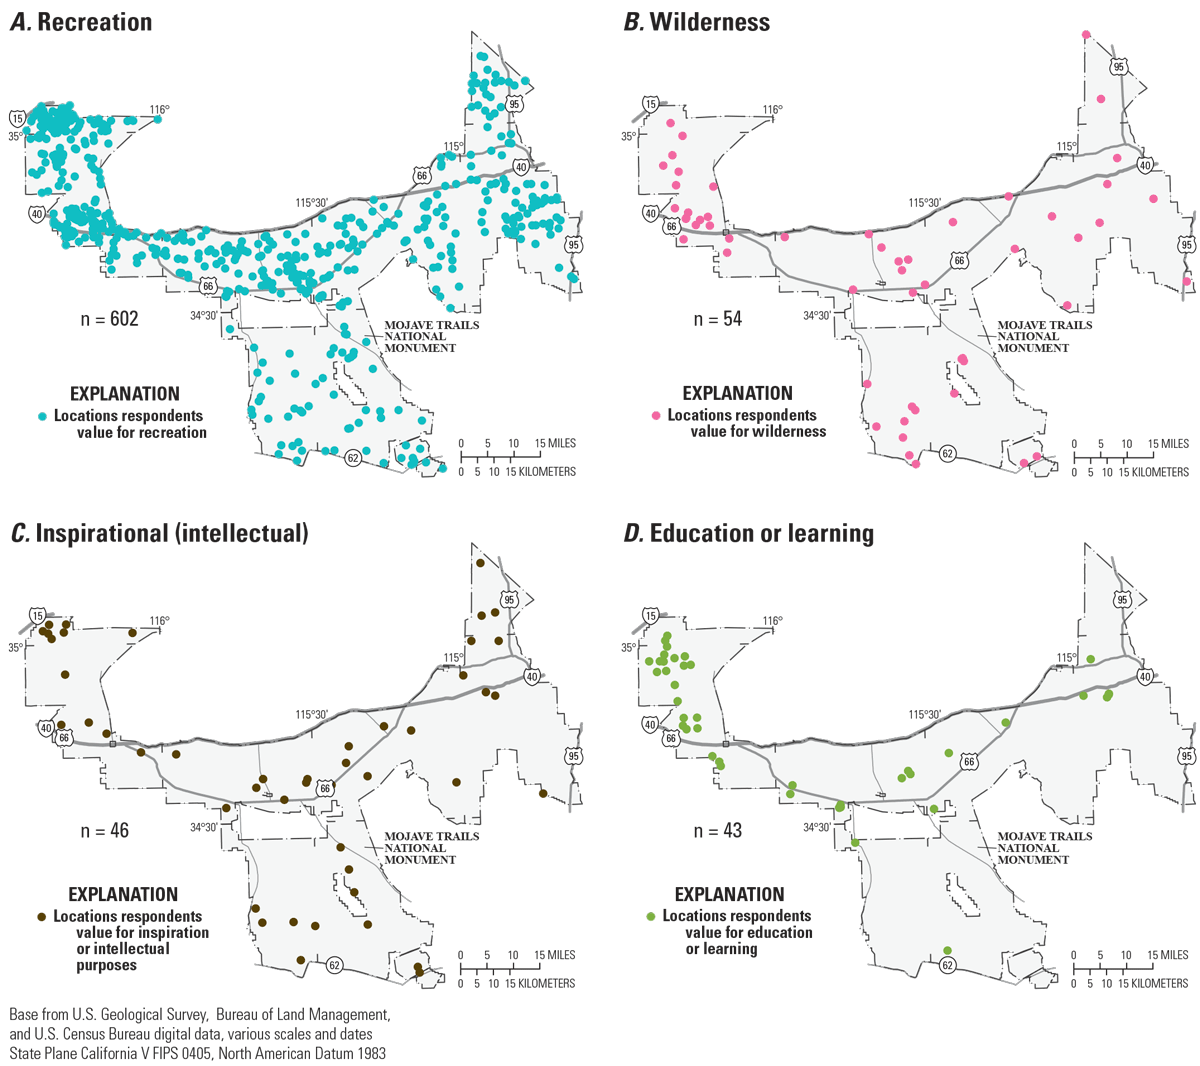
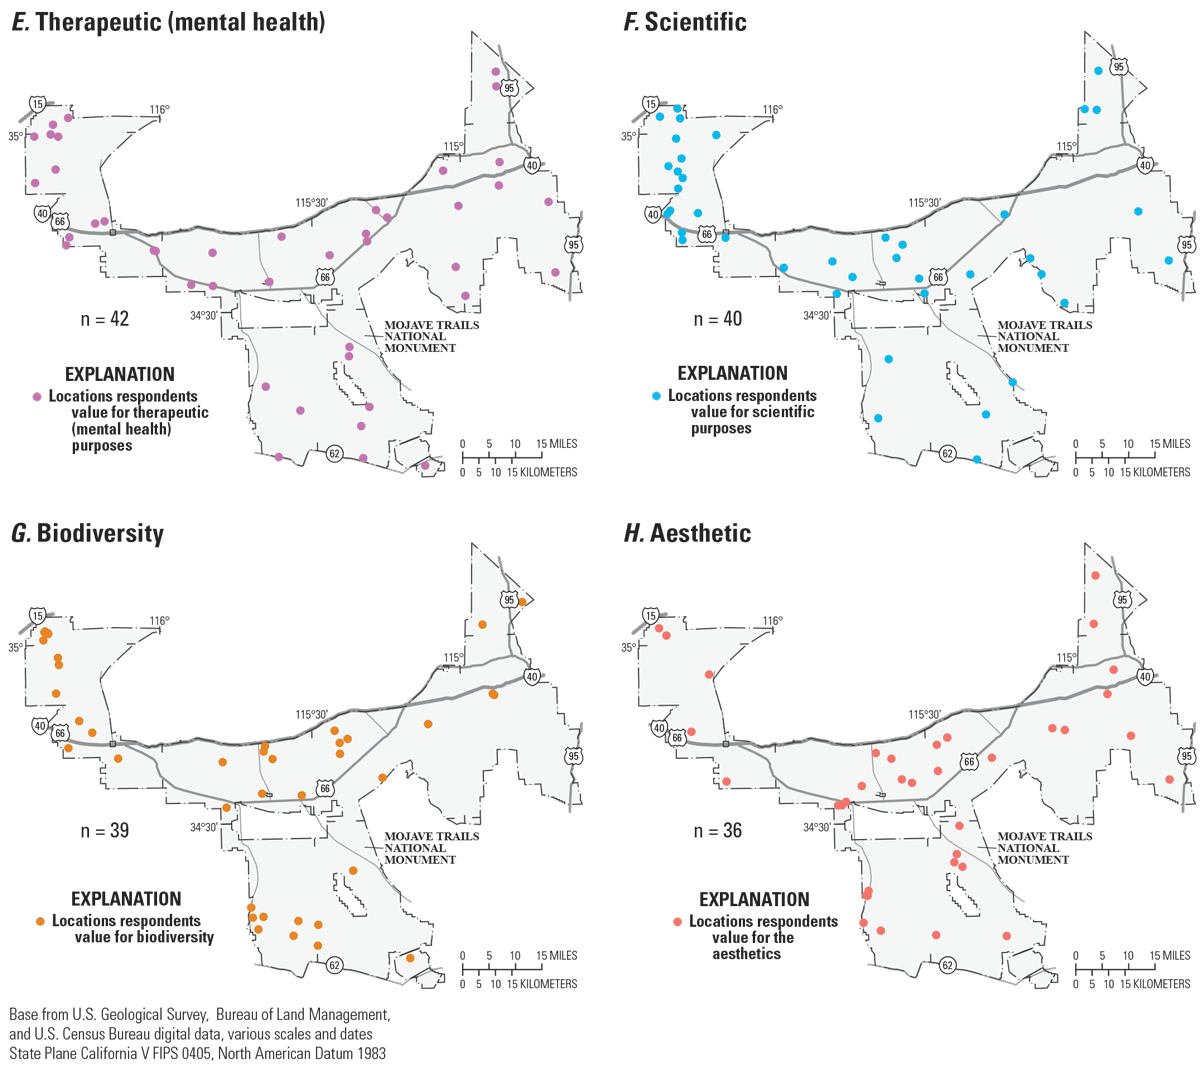
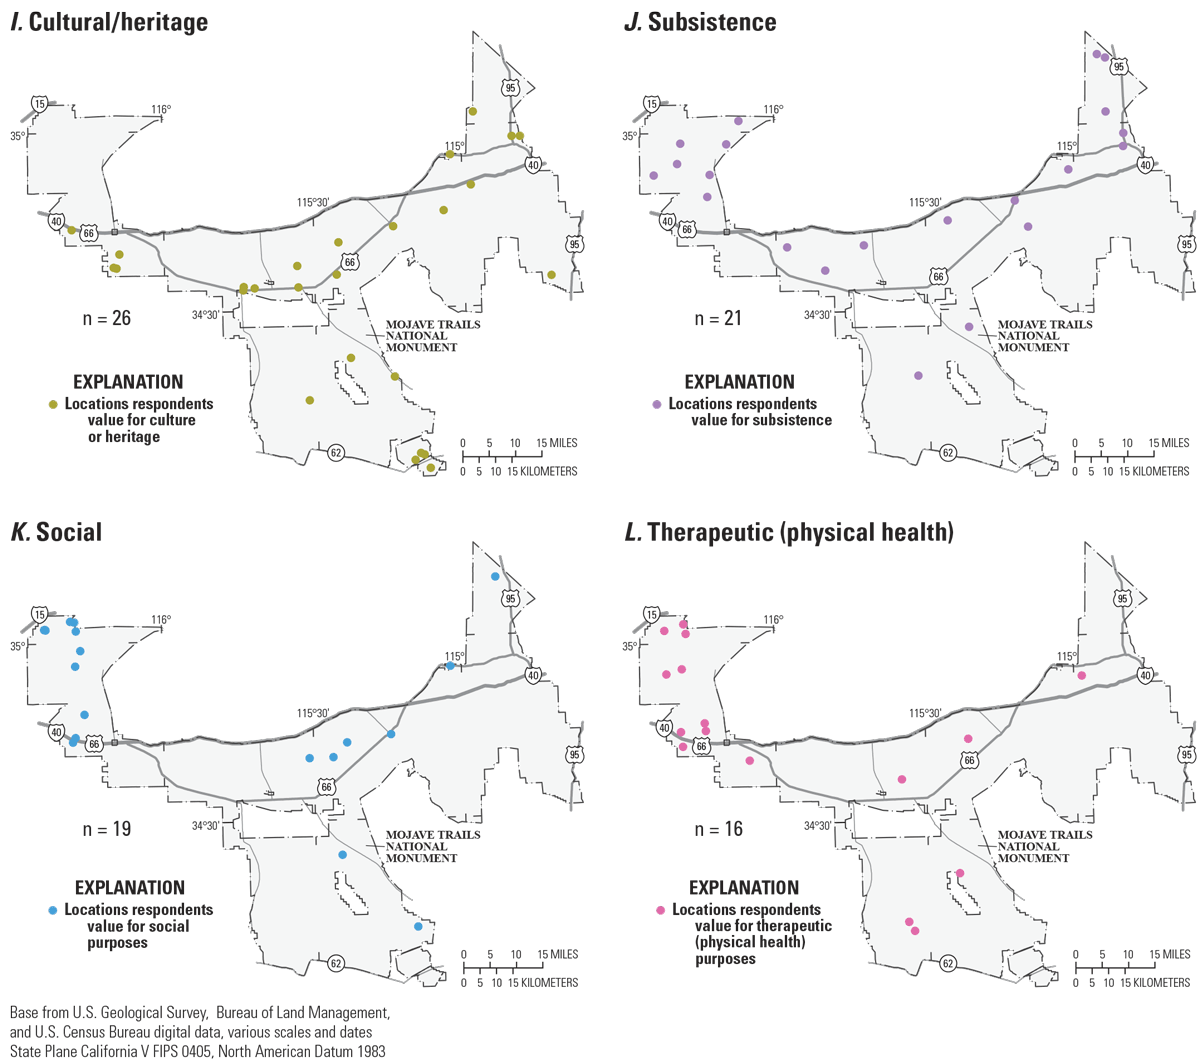
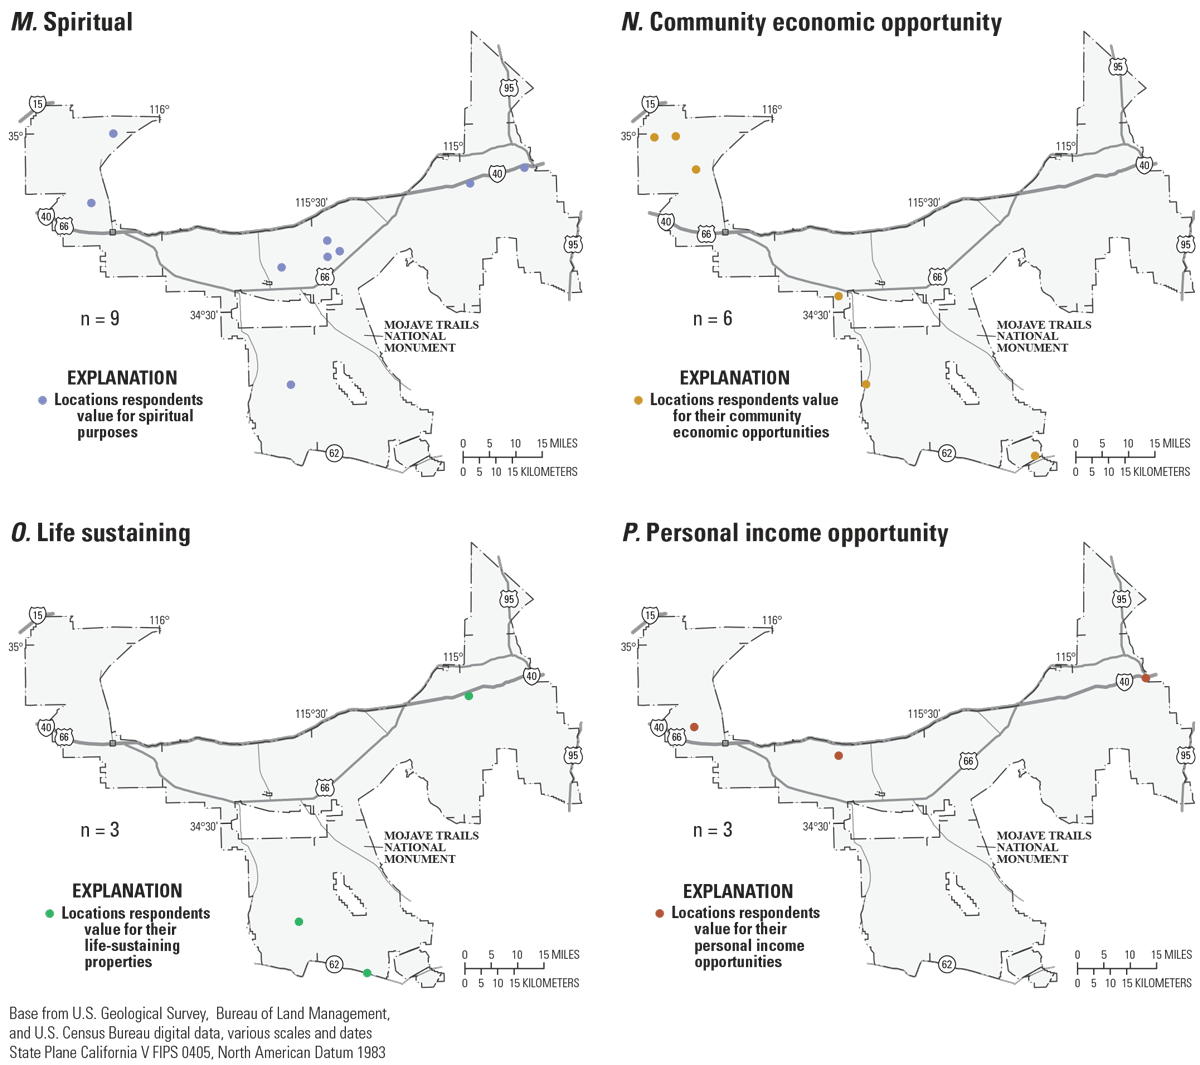
A–P, Locations that respondents value within Mojave Trails National Monument (U.S. Geological Survey Gap Analysis Project, 2024), by value. Sample sizes (n) represent the total number of points placed within the monument for each value category for both respondent groups. Figure panels are ordered from values with the most points to the least points.
Respondents from the email-list group placed a total of 649 locations, and respondents from the off-roading group placed a total of 356 locations (as described in table 4). The spatial distribution of locations respondents value comparing the email-list group to the off-roading group can be seen in figure 5. Respondents from the email-list group placed a higher proportion of locations in the northwest section of Mojave Trails National Monument, whereas the respondents from the off-roading group placed more locations in the northern and northeastern section of Mojave Trails National Monument more generally. This can further be seen in the hotspot analysis in figure 6. For both groups, a lower proportion of points were placed in the southern part of the national monument.
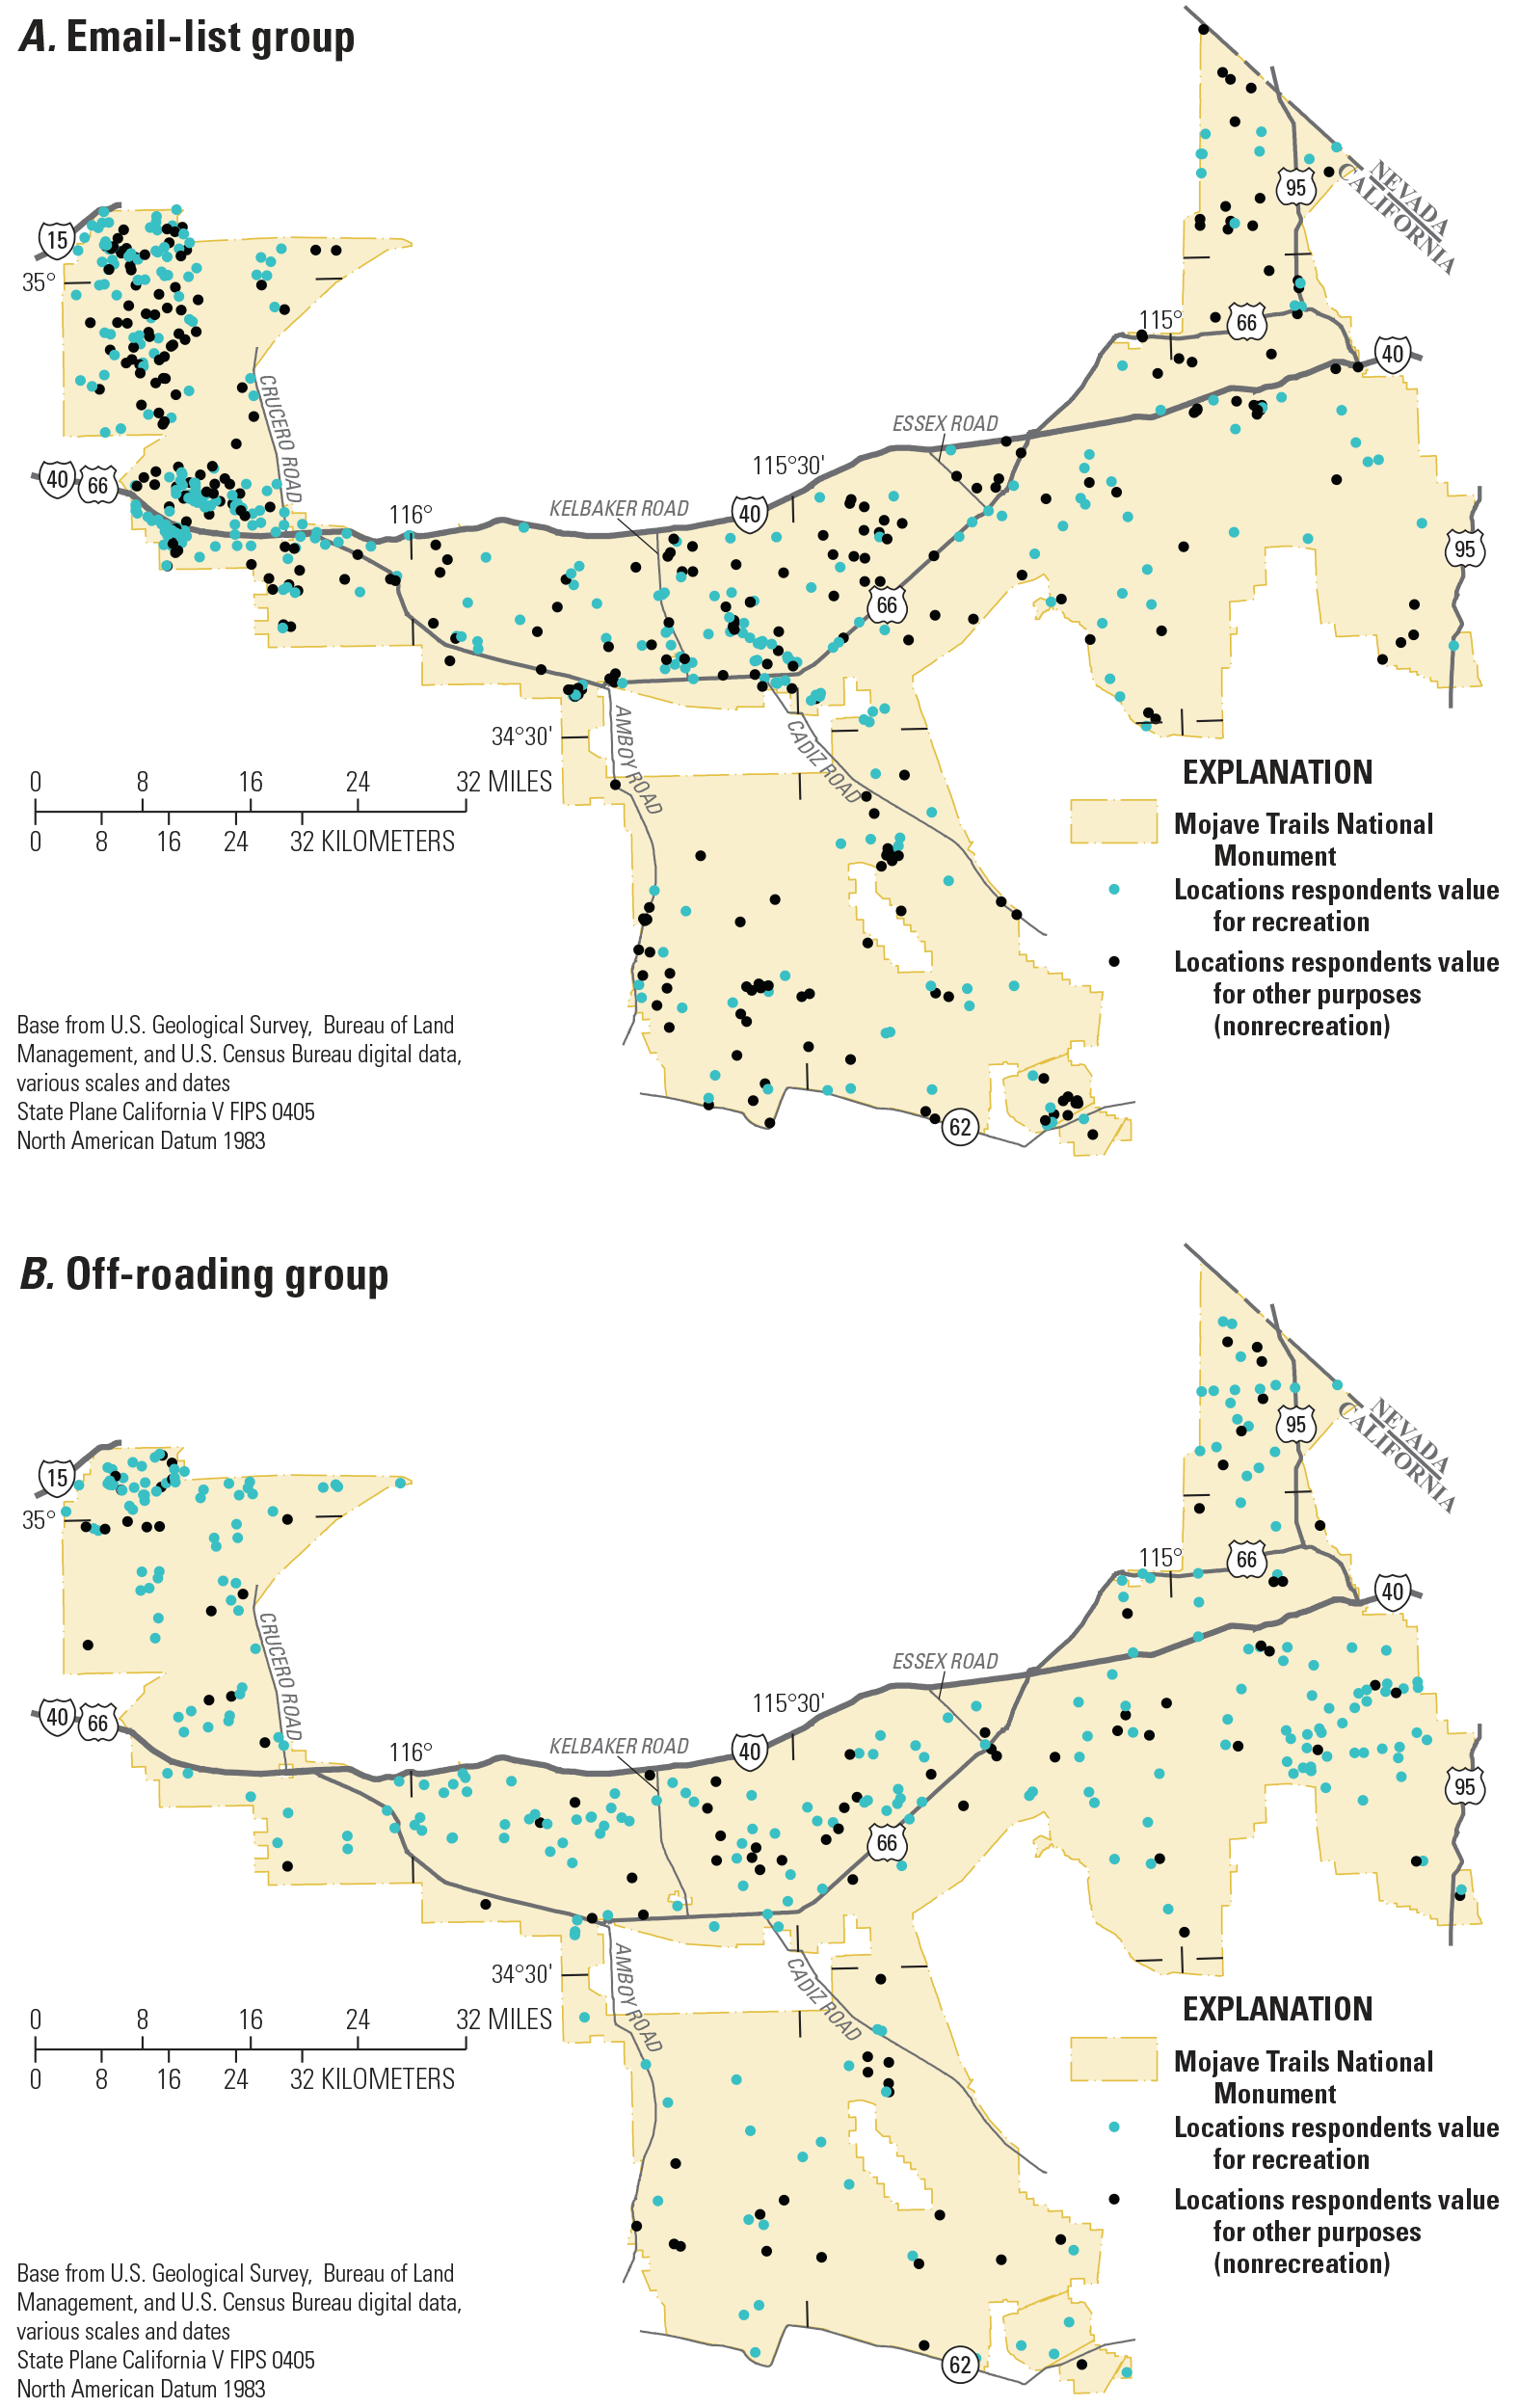
Locations that respondents value within Mojave Trails National Monument (U.S. Geological Survey Gap Analysis Project, 2024), separated into two groups: A, the email-list group (who placed 649 points) and B, the off-roading group (who placed 356 points). Due to the high prevalence of recreation points placed in both groups, points are separated to show only recreation and not recreation (all other values).
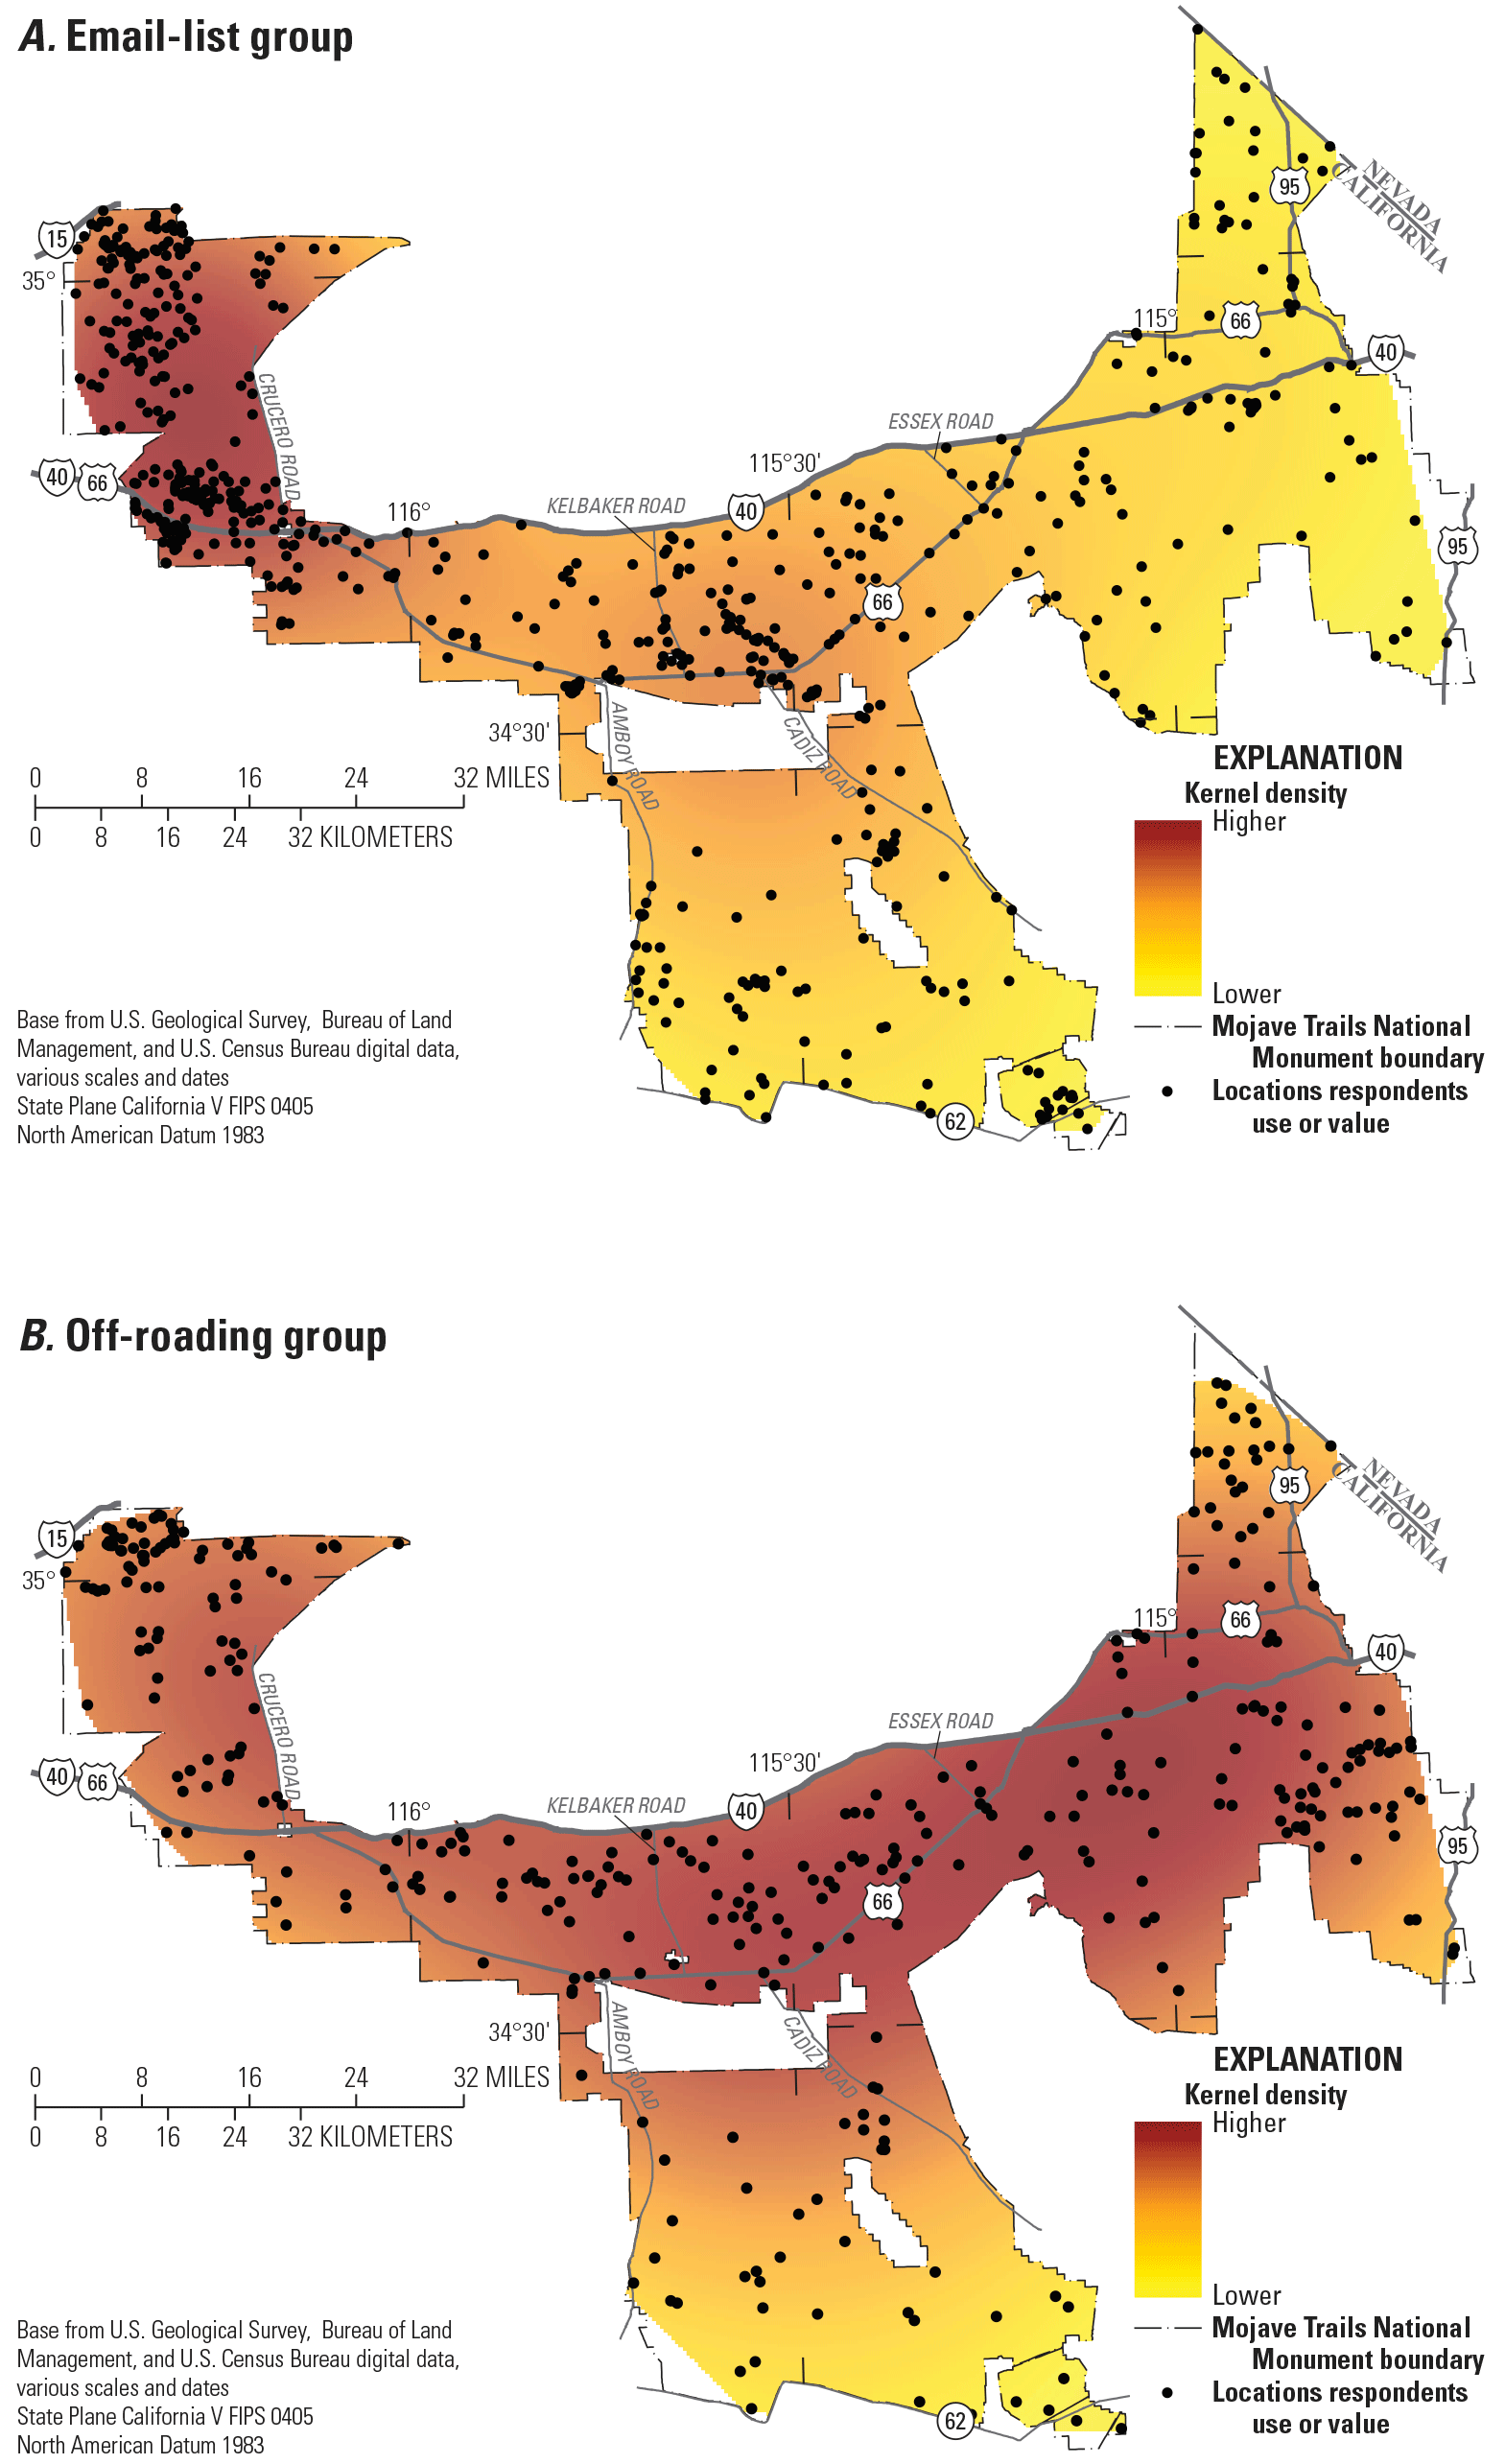
Hotspot analysis of all locations and values placed within Mojave Trails National Monument by respondents in A, the email-list group (who placed 649 points) and B, the off-roading group (who placed 356 points).
Perceptions of the Hypothetical Scenario
Lastly, participants were asked about how they would respond to the hypothetical recreational facility development scenario. Specifically, this question was asked up to three times per respondent for each of their top three location-value pairs (refer to table 5). A majority of respondents from both the email-list group and the off-roading group stated that their ability to receive the value they selected from that location would not change as a result of recreational facility development. Of all the substitution options, respondents from both groups were least likely to substitute a different value in the same location or a different location. Respondents were more likely to substitute the timing of their visits, how often they visit, or the location they visit to receive that benefit. However, 10.49 percent of respondents from the email-list group and 6.67 percent from the off-roading group stated they would stop receiving benefits from their selected value altogether due to recreational facility development.
Table 5.
Responses to questions related to the hypothetical scenario of recreational facility development.While 48.96 percent of respondents from the email-list group and 56.70 percent of respondents from the off-roading group stated they would not be willing to substitute locations, the most important attribute reported from both groups to consider when substituting locations was stated to be a location with a similar setting, whereas the least important for both groups was that the substitute location have similar costs. The actual text for this question depended on the answer to the previous question (refer to table 5). Respondents were fairly split on how large of an effect the hypothetical scenario would have on their experience.
Discussion
This pilot survey has shown that although Mojave Trails National Monument is highly valued for recreation purposes, respondents also value the monument for a variety of other reasons. Specifically, all 16 value definitions were used in the mapping application. Similar to the results in this work, the number of points placed for the recreation category in other studies is typically the highest, followed by categories such as wilderness and aesthetic (Beverly and others, 2008; Brown and Reed, 2009; Brown, Donovan, and others, 2014). Additionally, although there is a higher concentration of value locations in the northwest corner of Mojave Trails National Monument, the value locations are spread throughout the entire monument. Understanding specific locations people use and value across the monument can be useful for planning and decision making.
The response rate of 35.7 percent for this study is higher than expected given response rates for similar online PPGIS applications. For example, a prior study using PPGIS surveys for six national forests resulted in responses rates that varied from 6 to 21 percent by forest (Bagstad and others, 2017). However, it is likely that the response rate was higher than expected for this study given that we were emailing people on an “interested parties” email-list. The sections that follow discuss limitations associated with these results, as well as lessons learned and opportunities to improve the VaMPIRE application in the future.
Limitations
Important to note from these findings is the bias of our sample. Due to the sampling method (which involved using a list of interested parties to collect data), all respondents were highly interested in the Mojave Trails National Monument in some capacity, which likely influenced the results. Collecting data using an interested-party email list is a low-cost, time-saving method, but will likely provide a sample that is biased if the intent is to capture the general public’s values. However, there may be instances where public land and water managers are more interested in the uses and values of people who are particularly interested in the area, in which case an interested party email list would be appropriate and the target audience. The survey link was also shared with an off-roading group on social media, which biased the sample to have more representation from people who off-road and people who use the particular social media outlet. In any case, we advise land managers who use this tool in the future to think about whose opinions and input are of interest and who may be excluded. For example, if data are collected exclusively using an internet survey, people without reliable internet access may be unintentionally excluded.
The demographics of participants in this study also show that respondents were considerably different from the U.S. population in general, and likely different from typical visitors to the monument. For example, over 80 percent of respondents were 50 years old or older (with less than 10 percent of respondents younger than 40 years old), and about 65 percent were men. Although we do not have data on the demographic profile of all visitors to Mojave Trails National Monument, it is unlikely that this sample is representative of all visitors to the monument. Respondents from the off-roading group were even more highly biased in terms of demographics and their interests, given the off-roading group was centered on a specific recreational activity. All results should be interpreted keeping this bias in mind and recognizing that these findings are not representative of all Mojave Trails National Monument visitors. Prior studies in Canada, Australia, and on national forests in Arizona and Oregon have found that participants in PPGIS studies tend to be disproportionately male and highly educated, so this bias is not unique to this study (Beverly and others, 2008; Brown and Reed, 2009; Raymond and Brown, 2011; Brown and Fagerholm, 2015). Prior research has also found that the types of values mapped are influenced by participant demographics (including gender and level of formal education), indicating that having a representative sample is important (Brown and Reed, 2009). Additional research could help clarify why certain demographics may be more likely to respond to PPGIS surveys and how to mitigate these respondent biases.
Lessons Learned from the First Pilot and Future Considerations
Given that this was the first use of the VaMPIRE tool, we aimed to evaluate challenges, considerations, and possible areas for improvement for future use of the tool. Regarding technical use of the online application, we only received one email indicating confusion with how to use the online application, with the participant noting that they could not figure out how to zoom in on the map (and there was another respondent who put in the open-ended comment box that they also could not figure out how to zoom the map). At the time of this pilot, we did not have a plus or minus button on the application for zooming in or out on the map; participants had to zoom using the scroll wheel on a mouse (or fingers on a touch screen). After receiving this feedback, we added a plus and minus button to the online map to facilitate ease of zooming in and out for future applications. We also received feedback about technical difficulties with being allowed to place only 30 points, and not knowing when 30 points had been reached. This was a software limitation, and for future uses of VaMPIRE we hope to increase this point limit so these challenges are mitigated.
Additionally, a couple of respondents wrote in the open-ended comment box at the end that some places were hard to identify and that it would be useful to include more place names. Future iterations of VaMPIRE may benefit from including key locations within the area that are shown on the map even when it is completely zoomed out (showing the entire monument or area of interest). We also identified one area where the questions could be improved. When analyzing results, it became apparent that the question on how the quality of their experience would be affected by the hypothetical scenario could be perceived as either positive or negative, but we did not ask if the effect would be positive or negative. Future uses of VaMPIRE would benefit from adding a question asking participants if the scenario would have a positive, negative, or neutral effect on their uses and values for the landscape (or updating the response options to clarify).
The VaMPIRE tool was designed to be used in any BLM-managed public lands and resources. Therefore, this pilot survey was not tailored to the specific context of Mojave Trails National Monument, which had the potential to cause confusion. For example, someone choosing recreation as one of their top three values would then see a question about the types of recreation they engaged in at that location. However, the provided list of recreation activities contains 24 options that, although applicable at a national scale, may not be as applicable at the local scale and could be missing certain activities that are exceptionally popular at the survey location. In the case of Mojave Trails National Monument, we did not include rockhounding in the list despite it being very popular at this specific location. There was an “other” option for participants to write in activities, yet we did receive feedback (both through email and through the open-ended comment box) indicating that because rockhounding is such a prevalent activity, not having it appear in the list was a source of confusion or disappointment for some respondents. In the future, it may be useful to tailor activity lists to fit each individual location if possible.
This pilot also demonstrated how easy and likely it is that the survey link could be shared with others outside of the original intended sample. In some cases, this may be beneficial because it can expand the pool of participants to new groups, but in other cases it may not be warranted or may bias the sample. Specifically, it is undesirable for people to complete the survey if their data will not be used or would bias the sample (this would unnecessarily increase the burden on the public). For future iterations, it may be important to consider only allowing one submission per unique link to limit the survey distribution beyond the intended participants. Additionally, there are limits on the total number of participants allowed for these surveys based on the burden estimates submitted to the OMB for approval.
Lastly, both follow-up emails for those who had not yet responded to the survey increased response rates substantially, so it is important that future studies also use multiple email contacts to increase the response rate (as recommended by Dillman and others, 2014). This is one potential issue with allowing the link to be shared outside of the target sample—there is not a way to send follow-up reminders to potential participants (for example, people who may have been forwarded the link or contacted through social media).
Conclusions
This pilot was the first known Office of Management and Budget–approved use of public participatory geographic information systems (PPGIS) by a bureau of the Department of the Interior and shows great potential to increase the understanding of visitor values on public lands and waters. The U.S. Geological Survey Values Mapping for Planning in Regional Ecosystems (VaMPIRE) tool, codeveloped with the Bureau of Land Management, proved to be useful for collecting spatial visitor data with a user-friendly PPGIS interface. These spatial data collected through the VaMPIRE application can be used by public land and water managers for a variety of mission and operational work to support decision-making processes and to inventory the public’s uses and values for locations across a landscape. The results from Mojave Trails National Monument provided herein are exploratory and intended to depict what information this application can collect and provide. The tool is the first of its kind within the Department of the Interior to collect information from people about where they interact, the ways they interact, and the values associated with specific locations on public lands and waters. VaMPIRE also provides insight about tradeoffs, substitutions, and potential values lost from hypothetical management scenarios that can be beneficial to multiple-use land management agencies that are required to manage public areas for many interests, including recreation, energy development, grazing, and more.
As of 2024, there are two other approved pilot locations for public lands and waters in Moab, Utah, and San Luis Valley, Colorado. These locations will have different sampling methods, which will provide further information on ways to use the VaMPIRE tool to collect data. It is our hope that after these pilot tests, the VaMPIRE tool can be used more broadly in more locations across the United States.
References Cited
Allen, S.D., Wickwar, D.A., Clark, F.P., Dow, R.R., Potts, R., and Snyder, S.A., 2009, Values, beliefs, and attitudes technical guide for Forest Service land and resource management, planning, and decisionmaking—General Technical Report PNW-GTR-788: Portland, Oreg., U.S. Department of Agriculture, Forest Service, Pacific Northwest Research Station, 112 p., accessed November 12, 2024, at https://www.fs.usda.gov/pnw/pubs/pnw_gtr788.pdf.
Ashby, M., 2023, sfhotspot—Hot-Spot Analysis with Simple Features (R package version 0.8.0): The Comprehensive R Archive Network webpage, accessed November 12, 2024, at https://cran.r-project.org/package=sfhotspot.
Bagstad, K.J., Semmens, D.J., Ancona, Z.H., and Sherrouse, B.C., 2017, Evaluating alternative methods for biophysical and cultural ecosystem services hotspot mapping in natural resource planning: Landscape Ecology, v. 32, p. 77–97, accessed May 2, 2024, at https://doi.org/10.1007/s10980-016-0430-6.
Bartlett, G., Cerveny, L., Golomb, J., Harner, J., and Gronewald, R., 2017, Social landscape assessment of Browns Canyon National Monument: Bureau of Land Management, prepared by Consensus Building Institute, Inc., U.S. Department of Agriculture Forest Service, and University of Colorado, Colorado Springs, accessed November 12, 2024, at http://npshistory.com/publications/blm/browns-canyon/social-landscape-assessment.pdf.
Beverly, J.L., Uto, K., Wilkes, J., and Bothwell, P., 2008, Assessing spatial attributes of forest landscape values—An internet-based participatory mapping approach: Canadian Journal of Forest Research, v. 38, no. 2, p. 289–303, accessed May 2, 2024, at https://doi.org/10.1139/X07-149.
Brown, G., 2004, Mapping spatial attributes in survey research for natural resource management—Methods and applications: Society & Natural Resources, v. 18, no. 1, p. 17–39, accessed May 2, 2024, at https://doi.org/10.1080/08941920590881853.
Brown, G., 2012, Public participation GIS (PPGIS) for regional and environmental planning—Reflections on a decade of empirical research: Journal of the Urban and Regional Information Systems Association, v. 25, no. 2, p. 7–18, accessed November 12, 2024, at https://participatorymapping.org/wp-content/archive/publications/urisa_journal_2012.pdf.
Brown, G., and Alessa, L., 2005, A GIS-based inductive study of wilderness values: International Journal of Wilderness, v. 11, no. 1, p. 14–18, accessed November 12, 2024, at https://www.researchgate.net/profile/Lilian-Alessa/publication/238793538_A_GIS-based_Inductive_Study_of_Wilderness_Values/links/0c96052d60ec38c6be0000 00/A-GIS-based-Inductive-Study-of-Wilderness-Values.pdf.
Brown, G., Donovan, S., Pullar, D., Pocewicz, A., Toohey, R., and Ballesteros-Lopez, R., 2014, An empirical evaluation of workshop versus survey PPGIS methods: Applied Geography, v. 48, no. 1, p. 42–51, accessed May 2, 2024, at https://doi.org/10.1016/j.apgeog.2014.01.008.
Brown, G., and Fagerholm, N., 2015, Empirical PPGIS/PGIS mapping of ecosystem services—A review and evaluation: Ecosystem Services, v. 13, p. 119–133, accessed May 2, 2024, at https://doi.org/10.1016/j.ecoser.2014.10.007.
Brown, G., Kelly, M., and Whitall, D., 2014, Which ‘public’? Sampling effects in public participation GIS (PPGIS) and volunteered geographic information (VGI) systems for public lands management: Journal of Environmental Planning and Management, v. 57, no. 2, p. 190–214, accessed May 2, 2024, at https://doi.org/10.1080/09640568.2012.741045.
Brown, G., and Raymond. C., 2007, The relationship between place attachment and landscape values—Toward mapping place attachment: Applied Geography, v. 27, no. 2, p. 89–111, accessed May 2, 2024, at https://doi.org/10.1016/j.apgeog.2006.11.002.
Brown, G., and Raymond, C.M., 2014, Methods for identifying land use conflict potential using participatory mapping: Landscape and Urban Planning, v. 122, p. 196–208, accessed May 2, 2024, at https://doi.org/10.1016/j.landurbplan.2013.11.007.
Brown, G., and Reed, P., 2000, Validation of a forest values typology for use in national forest planning: Forest Science, v. 46, no. 2, p. 240–247, accessed May 2, 2024, at https://doi.org/10.1093/forestscience/46.2.240.
Brown, G., and Reed, P., 2012, Values compatibility analysis—Using public participation geographic information systems (PPGIS) for decision support in national forest management: Applied Spatial Analysis and Policy, v. 5, p. 317–332, accessed May 2, 2024, at https://doi.org/10.1007/s12061-011-9072-x.
Brown, G., and Weber, D., 2012, Measuring change in place values using public participation GIS (PPGIS): Applied Geography, v. 34, p. 316–324, accessed May 2, 2024, at https://doi.org/10.1016/j.apgeog.2011.12.007.
Brown, G., Weber, D., and de Bie, K., 2014, Assessing the value of public lands using public participation GIS (PPGIS) and social landscape metrics: Applied Geography, v. 53, p. 77–89, accessed May 2, 2024, at https://doi.org/10.1016/j.apgeog.2014.06.006.
Brown, G.G., and Pullar, D.V., 2012, An evaluation of the use of points versus polygons in public participation geographic information systems using quasi-experimental design and Monte Carlo simulation: International Journal of Geographical Information Science, v. 26, no. 2, p. 231–246, accessed May 2, 2024, at https://doi.org/10.1080/13658816.2011.585139.
Brown, G.G., and Reed, P., 2009, Public participation GIS—A new method for use in national forest planning: Forest Science, v. 55, no. 2, p. 166–182, accessed May 2, 2024, at https://doi.org/10.1093/forestscience/55.2.166.
Bureau of Land Management [BLM], 2020, Connecting with communities—BLM recreation strategy: Bureau of Land Management, accessed May 12, 2024, at https://www.blm.gov/sites/blm.gov/files/documents/files/2014ConnectingWithCommunities_summary.pdf.
Bureau of Land Management [BLM], 2023, Mojave Trails National Monument, 2022—Annual Manager’s Report: National Conservation Lands, 10 p., accessed March 12, 2024, at https://www.blm.gov/sites/default/files/docs/2023-08/2022_Mojave_Trails.pdf.
Bureau of Land Management [BLM], 2024a, BLM National NLCS Wilderness Areas Polygons: Bureau of Land Management Geospatial Business Platform, accessed March 12, 2024, at https://gbp-blm-egis.hub.arcgis.com/datasets/BLM-EGIS::blm-natl-nlcs-wilderness-areas-polygons/about.
Bureau of Land Management [BLM], 2024b, BLM National Recreation Site Points: Bureau of Land Management Geospatial Business Platform, accessed March 12, 2024, at https://gbp-blm-egis.hub.arcgis.com/datasets/7438e9e800914c94bad99f70a4f2092d_1/about.
Bureau of Land Management [BLM], [undated], Mojave Trails National Monument: Bureau of Land Management website, accessed February 27, 2025, at https://www.blm.gov/programs/national-conservation-lands/california/mojave-trails-national-monument.
Halpenny, E.A., 2010, Pro-environmental behaviours and park visitors—The effect of place attachment: Journal of Environmental Psychology, v. 30, no. 4, p. 409–421, accessed May 2, 2024, at https://doi.org/10.1016/j.jenvp.2010.04.006.
Hansen, A.S., Glette, V., and Arce, J.F., 2021, Mapping recreational activities in coastal and marine areas—PPGIS findings from western Sweden: Ocean & Coastal Management, v. 205, article 105567, accessed May 2, 2024, at https://doi.org/10.1016/j.ocecoaman.2021.105567.
Kahle, D., and Wickham, H., 2013, ggmap—Spatial visualization with ggplot2: The R Journal, v. 5, no. 1, p. 144–161, accessed May 2, 2024, at https://journal.r-project.org/archive/2013-1/kahle-wickham.pdf. [Also available at https://doi.org/10.32614/RJ-2013-014.]
Lindley, S.M., and Wilkins, E.J., 2025, Values mapping for planning in regional ecosystems—Mojave Trails National Monument, California, 2024: U.S. Geological Survey data release, https://doi.org/10.5066/P1423FLS.
Mapbox, 2024, Mapbox GL JS, version 0.54.0: Mapbox, accessed March 12, 2024, at https://www.mapbox.com/about/maps/.
Moore, R.L., and Graefe, A.R., 1994, Attachments to recreation settings—The case of rail-trail users: Leisure Sciences, v. 16, no. 1, p. 17–31, accessed May 2, 2024, at https://doi.org/10.1080/01490409409513214.
National Park Service, 2022, Route 66 overview: National Park Service, accessed May 5, 2024, at https://www.nps.gov/articles/route-66-overview.htm.
Nielsen-Pincus, M., 2011, Mapping a values typology in three counties of the interior Northwest, USA—Scale, geographic associations among values, and the use of intensity weights: Society & Natural Resources, v. 24, no. 6, p. 535–552, accessed May 2, 2024, at https://doi.org/10.1080/08941920903140972.
Olafsson, A.S., Purves, R.S., Wartmann, F.M., Garcia-Martin, M., Fagerholm, N., Torralba, M., Albert, C., Verbrugge, L.N.H., Heikinheimo, V., Plieninger, T., Bieling, C., Kaaronen, R., Hartmann, M., and Raymond, C.M., 2022, Comparing landscape value patterns between participatory mapping and geolocated social media content across Europe: Landscape and Urban Planning, v. 226, article 104511, accessed May 2, 2024, at https://doi.org/10.1016/j.landurbplan.2022.104511.
R Core Team, 2022, R—A language and environment for statistical computing, version 4.3.1: R Foundation for Statistical Computing software release, accessed May 2, 2024, at https://www.r-project.org/.
Raymond, C.M., and Brown, G., 2011, Assessing spatial associations between perceptions of landscape value and climate change risk for use in climate change planning: Climatic Change, v. 104, p. 653–678, accessed May 2, 2024, at https://doi.org/10.1007/s10584-010-9806-9.
Reed, P., and Brown, G., 2003, Values suitability analysis—A methodology for identifying and integrating public perceptions of ecosystem values in forest planning: Journal of Environmental Planning and Management, v. 46, no. 5, p. 643–658, accessed February 27, 2025, at https://doi.org/10.1080/0964056032000138418.
U.S. Congress, 1976, Federal Land Policy and Management Act of 1976—Public Law 94–579: U.S. Government Printing Office, 71 p., accessed February 26, 2025, at https://www.govinfo.gov/content/pkg/COMPS-1719/pdf/COMPS-1719.pdf.
U.S. Geological Survey Gap Analysis Project, 2024, Protected Areas Database of the United States (PAD-US) 4: U.S. Geological Survey data release, accessed May 12, 2024, at https://doi.org/10.5066/P96WBCHS.
Appendix 1. The Survey Instrument
Intro Text
The Bureau of Land Management manages public lands for multiple uses—including recreation, conservation, energy development, livestock grazing, and timber harvesting—to name a few. Land managers are often tasked with maximizing some combination of these uses without reducing the quality of visitors’ experiences. To accomplish this, managers must understand (1) what specific locations people are visiting, and (2) how visitors use and value these lands.
The following mapping application and survey is a pilot study intended to help land managers understand your uses of and values for public lands and waters near Mojave Trails National Monument. It should take around 15 minutes to complete and will work on most modern desktop, tablet, and mobile devices.
Should you choose to participate, you will:
-
1) Interact with a map to identify locations that you use and that are important to you in Mojave Trails National Monument
-
2) Rank your top three locations you have visited and their values based on their importance to you
-
3) Answer a few questions related to these top three locations/values
At no point during this survey will you be personally identified. Additionally, you are under no obligation to participate and may end this survey at any time. This application is designed by the U.S. Geological Survey and the Bureau of Land Management and has been approved by the Office of Management and Budget [Control Number 1028-0139]. Please contact [name] ([email address]) with any questions. Thank you in advance for your thoughtful responses!
PAPERWORK REDUCTION ACT STATEMENT
We are collecting this information subject to the Paperwork Reduction Act (44 U.S.C. 3501) to identify public uses for public lands and waters. Your response is voluntary. We may not conduct or sponsor, and you are not required to respond to a collection of information, unless it displays a currently valid OMB Control Number. OMB has reviewed and approved this survey and assigned OMB Control Number 1028-0139.
The public burden for the collection of information is estimated to be 15 minutes per response, including the time for reviewing instructions, gathering and maintaining data, and completing and reviewing the form. Direct comments regarding the burden estimate or any aspect of this collection of information may be sent to the Information Collection Clearance Officer, USGS, 12201 Sunrise Valley Dr., Mail Stop 242, Reston, VA 20192.
Q1. Are you 18 years or older and willing to participate in this survey?
[If “No”] The respondent is asked: “Would you be willing to answer a few questions as to why?” If they select “no,” the survey ends. If they select yes, they will go to the non-response survey.
[If “Yes”—continue below]
Part 1—Experience Use History Questions
Q1. Mojave Trails National Monument and the surrounding area are outlined on the following map. How many years have you been visiting this location?
Q2. In an average year, how frequently do you visit Mojave Trails National Monument?
Q3. In which season(s) do you most often visit Mojave Trails National Monument? (Check all that apply)
Part 2—Values Mapping/Geographic Information System (GIS)
Q1. Please use the following mapping interface to indicate the locations you use and value in Mojave Trails National Monument—indicated by the black outline. Instructions for using the mapping interface are listed on the next page. Although you can place markers anywhere, the focus of this study is on public lands and waters. You can place up to 30 points, and you can zoom in on the map to indicate specific locations.
Instructions
-
1. Use the mouse to drag and zoom the map to the location you would like to identify
-
2. Click the balloon icon in the top left corner of the map to select from a list of values
-
3. Select a value, then click the Select Location button at the bottom of the list
-
4. Click the map on the specific location in which you would like to place the value
-
5. Repeat this process as many times as you would like to place values on the map
-
6. To delete a misplaced value, click the value on the map and select the trash can icon on the top left portion of the map.
[The following values are presented as options to map. The definition for each appears if the user hovers their mouse over the value/term.]
-
• “Recreation”: I value these areas because I use them for recreational activities
-
• “Subsistence”: I value these areas because I use them to collect food and materials that help sustain my life
-
• “Social”: I value these areas because they provide me with opportunities for social interaction
-
• “Inspirational (Intellectual)”: I value these areas because they provide me with opportunities to think creatively and to be inspired by nature
-
• “Therapeutic (Physical Health Benefits)”: I value these areas because I can go there to feel better physically
-
• “Therapeutic (Mental Health Benefits)”: I value these areas because I can go there to feel better mentally
-
• “Spiritual”: I value these areas because they are sacred, religious, or spiritually special to me
-
• “Wilderness”: I value these areas because they offer me an undeveloped, natural area where I can go to experience a sense of solitude or engage in primitive recreation
-
• “Aesthetic”: I value these areas because I appreciate the beautiful scenery
-
• “Personal Income Opportunity”: I value these areas because they provide me with income opportunities that support my livelihood
-
• “Life Sustaining”: I value these areas because they are places that produce, preserve, clean, and renew air, soil and water
-
• “Education or Learning”: I value these areas because I use them to learn about the environment
-
• “Scientific”: I value these areas because I utilize them for scientific research
-
• “Biodiversity”: I value these areas because I can observe a variety of plants, animals, and insects
-
• “Community Economic Opportunity”: I value this place because it provides economic benefits that support my community and bolster the economy
-
• “Cultural / Heritage”: I value these areas because they represent natural and human history or because they allow my culture to continue and pass down the knowledge and traditions of my ancestors
Q2. On the next section we will ask you to select and rank your TOP 3 locations that you placed on the map.
Instructions
-
1. Click on the dot of your most important value/location. The dot will be highlighted (do not click on the label)
-
2. Click on the Add Selected button in the upper right corner of the map area. The value will appear on the ranking list above the map
-
3. Repeat this process for your second-most important value/location (if applicable), and third-most important value/location (if applicable)
-
4. Click SUBMIT at the bottom of the page once you have ranked your top 3 value/locations
[After the participant clicks “Submit”] In the next section you will respond to survey questions based upon your top selected value/locations: [lists top 3 selected values]
Part 3—Questions Based on the Top Three Value Selections
[All of these questions are only asked if the value listed is in the top 3 most important]
[If Recreation]:
Q1. You have selected this location as the {most, 2nd most, 3rd most} important and it is valuable to you for recreation. Please select ALL of the recreational activities in which you participate at this location from the list of activities.
-
• Backcountry Camping
-
• Developed Camping
-
• Biking (Mountain)
-
• Biking (Road)
-
• Hiking
-
• Trail Running
-
• Fishing
-
• Hunting
-
• Off Roading (e.g., ATV, OHV)
-
• Target Shooting
-
• Bird Watching
-
• Wildlife Viewing
-
• Horseback Riding
-
• Picnicking
-
• Scenic Driving
-
• Boating
-
• River Sports (e.g., Kayaking, Rafting)
-
• Rock Climbing or Bouldering
-
• Night Sky Viewing/Astronomy
-
• Viewing Historical or Cultural Sites
-
• Photography
-
• Geocaching
-
• Skiing or Snowboarding (Frontcountry)
-
• Skiing or Snowboarding (Backcountry)
-
• Other—write in
Q2. Please select your PRIMARY activity from the list of recreation activities in which you participate at this location.
[If Subsistence]:
Q1. You have selected this location as the {most, 2nd most, 3rd most} important and is valuable to you for subsistence. Please select ALL of the subsistence activities in which you participate at this location from the list of activities.
-
• Foraging (collecting plant-based foods like mushrooms, herbs, wild edible plants)
-
• Hunting for food
-
• Fishing for food
-
• Collecting wood for energy
-
• Collecting water for consumption
-
• Other—write in
Q2. Please select your PRIMARY activity from the list of subsistence activities in which you participate at this location.
[If Social]:
Q1. You have selected this location as the {most, 2nd most, 3rd most} important and it is valuable to you for social interaction. Please select ALL of the types of social interaction in which you participate at this location from the list of activities.
-
• Spend time with friends
-
• Spend time with family
-
• Meet new people
-
• Recreation competitions
-
• Other—write in
Q2. Please select your PRIMARY activity from the list of social activities in which you participate at this location.
[If Inspirational]:
Q1. You have selected this location as the {most, 2nd most, 3rd most} important and it is valuable to you for inspirational reasons. Please select ALL of the types of inspirational activities in which you participate at this location from the list of activities.
-
• Painting, drawing, etc.
-
• Photography
-
• Writing
-
• Reading
-
• Meditating
-
• Thinking
-
• Other—write in
Q2. Please select your PRIMARY activity from the list of Inspirational activities in which you participate at this location.
[If Personal Income Opportunity]:
Q1. You have selected this location as the {most, 2nd most, 3rd most} important and it is valuable to you for income opportunities. Please select your PRIMARY income activity in this area from the following list of common sources.
-
• Recreation Guiding / Outfitter
-
• Mining
-
• Energy Development
-
• Grazing
-
• Timber Harvesting
-
• Other—Write in
[If Education or Learning]
Q1. You have selected this location as the {most, 2nd most, 3rd most} important and it is valuable to you for education or learning. Please select why you value this location for education or learning (select all that apply).
-
• I have used this location to learn independently (i.e., not part of a school or program)
-
• I am/was an educator who has used this location to teach
-
• I am/was a student who has used this location to learn
-
• Other—write in
[If Scientific]
Q1. You have selected this location as the {most, 2nd most, 3rd most} important and it is valuable to you for scientific purposes. Please select why you value this location for scientific purposes.
-
• I have personally used this location for scientific research
-
• I value scientific research conducted in this location
-
• Other—write in
[If any of the following values, no Q1 or Q2 for this section: Therapeutic (Mental Health), Spiritual, Wildness, Aesthetic, Life Sustaining, Biodiversity, Community Economic Opportunity, Cultural/Heritage, Therapeutic (Physical Health)]
Scenario prompt
“Public lands are managed for multiple uses including recreation, grazing, timber harvesting, mineral extraction, or energy development. As a result, [insert value] activities may occur in the same place as some of these other activities. We would like to ask about how your use of this place may be affected if other uses were to occur here. A hypothetical scenario will be presented below. Please identify how you would respond.”
In this hypothetical scenario, increased visitor use requires the development of new facilities to support camping, information dissemination, restrooms, and other needs. As a result, while you are benefiting from [insert value activity] you will occasionally see utilities, access roads and vehicles, and new development that are associated with this work.
Questions based on scenarios – (Asked up to 3 times, once for each of the top 3 values selected)
[If Recreation, Subsistence, Social, or Inspirational]:
Q3. Considering this hypothetical scenario, which of the items listed below best reflects how your use of this area for [insert value] would change?
-
• Continue to do this activity, with no changes to how often or where I do it
-
• Substitute a different activity in the same location
-
• Continue to do this activity in this location, but change how often
-
• Continue to do this activity in this location, but change the timing (e.g., visiting in a different time of year or time of day)
-
• Do the same activity in a different location
-
• Do a different activity in a different location
-
• Stop doing this activity
Q3.a. [If options 1–4 selected]: Would you be willing to substitute locations under any of the following circumstances? (Select all that apply)
-
• Yes, if there was a similar travel time
-
• Yes, if there were similar costs
-
• Yes, if it was a similar setting
-
• Yes, if it had a similar recreational challenge
-
• Yes, if it had similar visitor use levels
-
• No, I would not be willing to substitute locations
-
• Other—Write in
Q3.b. [If options 5–6 selected]: What factors are important in deciding to substitute locations?
-
• Similar travel time
-
• Similar costs
-
• Similar setting
-
• Similar recreational challenge
-
• Similar visitor use levels
-
• Other—Write in
Q4. How would the overall quality of your experience be affected if [insert scenario name] happened in this location?
-
• There would be no effect on the overall quality of my [insert value] experience
-
• There would be a slight effect on the overall quality of my [insert value] experience
-
• There would be a moderate effect on the overall quality of my [insert value] experience
-
• There would be a substantial effect on the overall quality of my [insert value] experience but I would keep visiting this place
-
• There would be a substantial effect on the overall quality of my [insert value] experience and I would stop visiting this place
[If Therapeutic (Physical Health Benefits), Therapeutic (Mental Health Benefits), Aesthetic, Spiritual, Wildness, Education/Learning, Scientific, Life Sustaining, Biodiversity, Cultural/Heritage]:
Q3. Considering this hypothetical scenario, which of the items listed below best reflects how your ability to receive [insert value] benefits from this area would change?
-
• My ability to receive this benefit from this location will not change
-
• Substitute a different benefit in the same location
-
• Continue to receive this benefit in this location, but change how often
-
• Continue to receive this benefit in this location, but change the timing (e.g., visiting in a different time of year or time of day)
-
• Receive the same benefit in a different location
-
• Receive a different benefit in a different location
-
• Stop receiving this benefit
Q3.a. [If options 1–4 selected]: Would you be willing to substitute locations to receive this benefit under any of the following circumstances? (Select all that apply)
-
• Yes, if there was a similar travel time
-
• Yes, if there were similar costs
-
• Yes, if it was a similar setting
-
• Yes, if it had a similar recreational challenge
-
• Yes, if it had similar visitor use levels
-
• No, I would not be willing to substitute locations
-
• Other—Write in
Q3.b. [If options 5–6 selected]: What factors are important in deciding to substitute locations?
-
• Similar travel time
-
• Similar costs
-
• Similar setting
-
• Similar recreational challenge
-
• Similar visitor use levels
-
• Other—Write in
Q4. How would the overall quality of your experience be affected if [insert scenario name] happened in this location?
-
• There would be no effect on the overall quality of my [insert value] experience
-
• There would be a slight effect on the overall quality of my [insert value] experience
-
• There would be a moderate effect on the overall quality of my [insert value] experience
-
• There would be a substantial effect on the overall quality of my [insert value] experience but I would keep visiting this place
-
• There would be a substantial effect on the overall quality of my [insert value] experience and I would stop visiting this place
[If Personal Income Opportunity]:
Q3. Public lands are managed for multiple uses including recreation, grazing, timber harvesting, surface mining, or energy development. As a result, an individual’s income opportunities within a given location may be affected by these other land uses within the same area. If your Personal Income Opportunities were to become limited by shifts in landscape management priorities, please indicate how you might respond.
-
• I would be able to continue my income opportunity in a different location nearby
-
• I would be able to transition to a different income opportunity in the same area or nearby
-
• I would not be able to find another income opportunity but there are other financial situations that would allow me to stay in my community (e.g., spouse/partner has income, have savings, etc.)
-
• I would need to leave my community
Q3.a. [If options 1–4]: How would the overall quality of your life be affected if this were to happen?
-
• There would be no negative effect on my overall quality of life or livelihood
-
• There would be a slight negative effect on my overall quality of life or livelihood
-
• There would be a moderate negative effect on my overall quality of life or livelihood
-
• There would be a substantial negative effect on my overall quality of life or livelihood
[If they chose “Community Economic Opportunity,” no Q3 or Q4 in this section]
Part 4—Demographics
In this final section of the survey, we would like to ask you some questions about your personal background.
Q1. In what year were you born?
Q2. Gender: How do you identify?
Q3. Are you of Hispanic, Latino, or Spanish origin?
-
• Yes, I am of Hispanic, Latino, or Spanish origin
-
• No, I am not of Hispanic, Latino, or Spanish origin
Q4. How would you describe your racial origin(s)? (Please check all that apply)
-
• American Indian or Alaska Native
-
• Asian
-
• Black or African American
-
• Native Hawaiian or Other Pacific Islander
-
• White / Caucasian
-
• Other—write in
Q5. What is the highest degree or level of school you have completed? (if you’re currently a student, please indicate the highest degree you have received)
-
• Some High School or Less
-
• High School Degree or Equivalent (e.g. GED)
-
• Some College, No Degree
-
• Associates Degree
-
• Bachelor’s Degree
-
• Master’s Degree
-
• Professional Degree (e.g., MD, JD)
-
• Doctorate (e.g., PhD)
Q6. What is your current employment status?
-
• Employed Full Time (40 or more hours per week)
-
• Employed Part time (up to 39 hours per week)
-
• Unemployed and currently looking for work
-
• Unemployed and not currently looking for work
-
• Student
-
• Retired
-
• Homemaker
-
• Self-employed
-
• Unable to work
Q7. Which of the following broad categories best describes your total annual household income for the last calendar year?
-
• $25,000 or less
-
• $25,001–$50,000
-
• $50,001–$75,000
-
• $75,001–$100,000
-
• $100,001–$125,000
-
• $125,001–$150,000
-
• More than $150,000
Q8. Do you currently live in the U.S.?
Q8.a. [If Yes] Please enter the zip code for where you currently live
Q8.b. [If No] Please enter the country where you currently live
Q9. How did you hear about this survey?
-
• I met someone outdoors doing surveys
-
• I was emailed the link (with no personal contact)
-
• Family, friend, or colleague forwarded it
-
• Other—Write in
Q10. Do you have any other comments related to this survey? [Open ended]
Abbreviations
API
application programming interface
BLM
Bureau of Land Management
DOI
Department of the Interior
FLPMA
Federal Land Policy and Management Act
GIS
geographic information system
JSON
JavaScript Object Notation
OMB
Office of Management and Budget
PPGIS
public participatory geographic information systems
PRA
Paperwork Reduction Act
SQL
structured query language
USGS
U.S. Geological Survey
VaMPIRE
Values Mapping for Planning in Regional Ecosystems
ZIP
Zone Improvement Plan
For more information concerning the research in this report, contact the
Director, USGS Fort Collins Science Center
2150 Centre Ave., Bldg. C
Fort Collins, CO 80526-8118
(970) 226-9100
Or visit the Fort Collins Science Center website at:
https://www.usgs.gov/centers/fort-collins-science-center
Publishing support provided by the Science Publishing Network,
Denver Publishing Service Center
Disclaimers
Any use of trade, firm, or product names is for descriptive purposes only and does not imply endorsement by the U.S. Government.
Although this information product, for the most part, is in the public domain, it also may contain copyrighted materials as noted in the text. Permission to reproduce copyrighted items must be secured from the copyright owner.
Suggested Citation
Wilkins, E.J., Lindley, S.M., Rogers, K., Schuster, R., Hannon, M.T., Rowland, P.T., and Runnels, M.J., 2025, Using public participatory geographic information systems (PPGIS) to explore uses and values for Mojave Trails National Monument, California: U.S. Geological Survey Scientific Investigations Report 2025–5037, 27 p., https://doi.org/10.3133/sir20255037.
ISSN: 2328-0328 (online)
Study Area
| Publication type | Report |
|---|---|
| Publication Subtype | USGS Numbered Series |
| Title | Using public participatory geographic information systems (PPGIS) to explore uses and values for Mojave Trails National Monument, California |
| Series title | Scientific Investigations Report |
| Series number | 2025-5037 |
| DOI | 10.3133/sir20255037 |
| Publication Date | June 26, 2025 |
| Year Published | 2025 |
| Language | English |
| Publisher | U.S. Geological Survey |
| Publisher location | Reston VA |
| Contributing office(s) | Fort Collins Science Center |
| Description | Report: vi, 27 p.; Data Release |
| Country | United States |
| State | California |
| Other Geospatial | Mojave Trails National Monument |
| Online Only (Y/N) | Y |