

Assessment of Water Chemistry of the Coconino Aquifer in Northeastern Arizona
Links
- Document: Report (6.3 MB pdf) , HTML , XML
- Download citation as: RIS | Dublin Core
Acknowledgments
The author would like to acknowledge Celeste Journey, U.S. Geological Survey hydrologist Emeritus, for her statistical expertise. Jon Mason, U.S. Geological Survey hydrologist Emeritus, proposed the initial study. The author also would like to acknowledge the many women and men who have sampled and analyzed groundwater in the area since 1933.
Abstract
The Coconino aquifer was investigated as a potential groundwater resource for the Hopi Tribe and Navajo Nation in northeastern Arizona. Basic groundwater chemistry, including major ions, total dissolved solids, and selected trace metal concentrations, are presented and analyzed to characterize the Coconino aquifer. The geochemical compositions of groundwater are associated with changes in geology and groundwater movement and are compared to drinking-water standards to determine suitable areas for potential groundwater resource development. Dissolved-solids concentrations in much of the Coconino aquifer water were higher than the U.S. Environmental Protection Agency’s secondary drinking-water standard of 500 milligrams per liter (mg/L) due to a buried halite body in the southeastern part of the study area. However, trace metal concentrations were generally low. Groundwater may need to be treated for high dissolved-solids concentrations before it is suitable for use as a resource for the Hopi Tribe and Navajo Nation.
Introduction
The Coconino aquifer is a multiple-aquifer system that extends throughout northeastern Arizona, northwestern New Mexico, southwestern Colorado, and southeastern Utah (fig. 1). In northern Arizona, the Coconino aquifer underlies most of the Navajo Nation and the entirety of the Hopi Reservation. Despite its substantial area, wells drilled into the Coconino aquifer are most common in the southern and eastern extent of the aquifer. The Coconino aquifer is deeply buried elsewhere, likely buried to depths greater than 3,000 feet (ft) in some areas to the north. Total dissolved solids (TDS) concentrations are likely high in the Coconino aquifer water [greater than 2,000 milligrams per liter (mg/L)] in much of these areas (Bills and others, 2007). Shallower, more accessible aquifers overlie the Coconino aquifer in this region, including the Navajo aquifer, the primary water source for the Hopi Tribe and the southwestern Navajo Nation (Mason, 2021). Sustainable water resources for the Hopi Tribe and Navajo Nation are limited due to their location in an arid to semi-arid desert environment with minimal precipitation and groundwater recharge. However, as groundwater demand increases to keep up with population growth, the Coconino aquifer has the potential to serve as a source of water for a larger portion of the Hopi Tribe and Navajo Nation. Increased water production from the regional Coconino aquifer has the potential to provide greater water security to both Tribes.
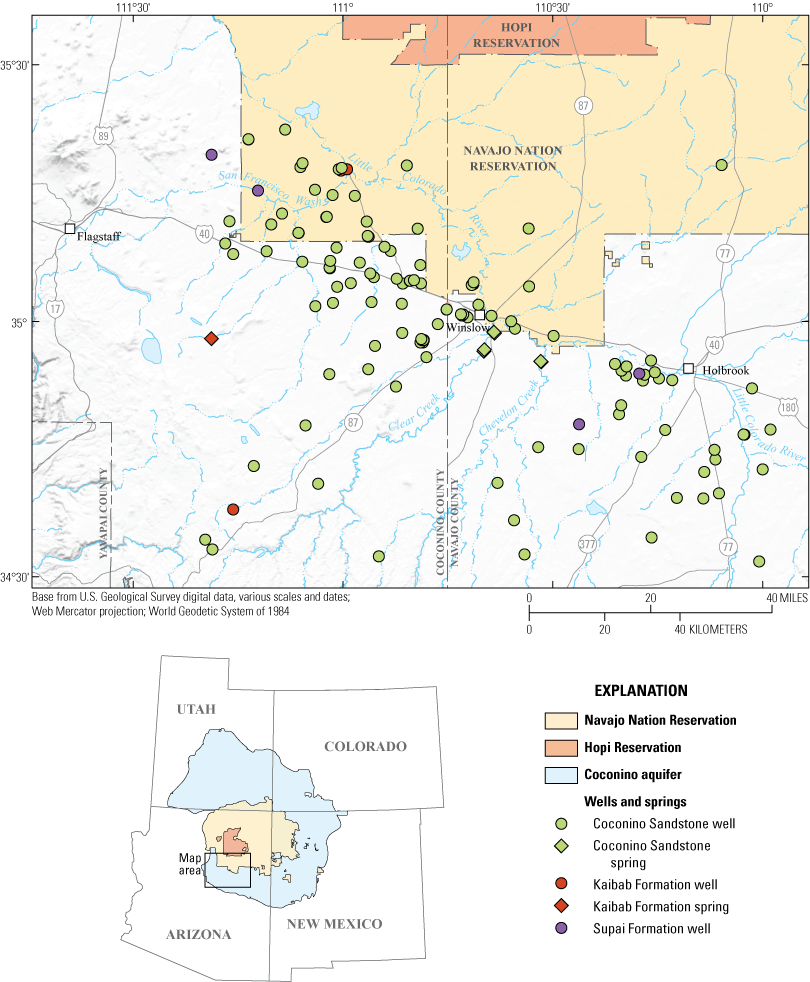
Approximate extent of the Coconino aquifer, boundaries of the Hopi Reservation and Navajo Nation, and the locations of the Coconino aquifer groundwater sites included in this study, northeastern Arizona. Figure is modified from Robson and Banta (1995).
This report focuses on groundwater chemistry of the Coconino aquifer between Flagstaff, Arizona, and the area just east of Holbrook, Arizona, and from south of the Little Colorado River to the southern end of the Hopi Reservation (fig. 1). Coconino aquifer water users in the study area include the southwestern part of the Navajo Nation and the cities of Flagstaff, Winslow, and Holbrook (including their surrounding communities; Hart and others, 2002). Although previous studies and production from existing wells have shown that the Coconino aquifer can produce large quantities of water (for example, Mann, 1976), less has been done to examine the suitability of the water quality for development throughout the region. Water chemistry is extremely variable in this area, partially due to high dissolved solids from evaporite deposits near the base of the Coconino aquifer in the southeastern part of the study area (Cooley and others, 1969; Mann, 1976). The U.S. Environmental Protection Agency (EPA) has established non-mandatory secondary drinking-water standards of 500 mg/L for TDS. Above this level, water may taste bad and (or) cause staining and corrosion. However, potable drinking water generally has TDS concentrations of less than 3,000 mg/L (U.S. Environmental Protection Agency, 1987; Stanton and others, 2017). The EPA formally defined potential underground sources of drinking water as having a TDS concentration less than 10,000 mg/L (U.S. Environmental Protection Agency, 1987). Although TDS concentrations in some groundwater in the study area far exceed the EPA secondary maximum contaminant level (SMCL) of 500 mg/L, other areas show substantially lower dissolved-solids concentrations (Hoffmann and others, 2006; Bills and others, 2007).
Besides TDS, other constituents, such as major cations and anions (calcium, magnesium, sodium, potassium, sulfate, chloride, and bicarbonate) and trace metals (arsenic, uranium, barium, lead, copper, and fluoride, among others), influence the suitability of groundwater for development. The U.S. Geological Survey (USGS), in cooperation with the Hopi Tribe, led this study to describe the basic groundwater chemistry of the Coconino aquifer. This effort provides information to identify potential areas for groundwater resource development.
Purpose and Scope
The purpose of this report is to describe the basic groundwater chemistry of the Coconino aquifer along the Interstate-40 corridor between Flagstaff, Ariz., and the area just east of Holbrook, Arizona. Specifically, major ion, trace metal, and TDS concentrations are presented and analyzed to identify differing groundwater chemistry in association with changes in geology and groundwater movement, and to compare groundwater chemistry to drinking-water standards to determine suitable areas for potential groundwater-resource development.
Previous Investigations
The hydrogeology and chemistry of the Coconino aquifer in the study area have been described in several previous studies. Darton (1910) compiled some of the first geologic data from the area between Kingman, Arizona, and Albuquerque, New Mexico, to explore groundwater prospects for the Atchison, Topeka, and Santa Fe Railway. Gregory (1916) described the geography, climate, surface water, and groundwater of the Navajo Nation and Hopi Reservations; the hydrogeology in this area was later expanded on by Cooley and others (1969). Harrell and Eckel (1939) presented a comprehensive groundwater study of the Holbrook area, including chemical analyses from 118 wells and springs. Bills and Flynn (2002) and Bills and others (2007) summarized the hydrogeology of the Coconino Plateau. Hart and others (2002) compiled existing Coconino aquifer data from the Little Colorado River Basin to produce a generalized groundwater budget. Hoffmann and others (2006) presented geological, hydrological, and chemical data from the Coconino aquifer near Leupp, Arizona, and Jones and Robinson (2021) presented groundwater levels and basic chemistry of the Coconino aquifer in northeastern Arizona.
Evaporites in the study area also have been explored. Bahr (1962) described evaporite karst features on the Holbrook Anticline. Mann (1976) characterized Coconino aquifer water in southern Navajo County and produced an early delineation of the extent of salt beds. Neal and others (1998, 2013) and Rauzi (2000) described evaporite karst in the Holbrook sedimentary basin. Neal and Colpitts (1997) and Neal and Johnson (2002) described specific Holbrook Basin karst expressions (Richard Lake and McCauley Sinks, respectively).
Description of Study Area
The study area is within the Little Colorado River Basin in the southern part of the Colorado Plateau, specifically between Flagstaff, Arizona, and the area just east of Holbrook, Arizona, and from south of the Little Colorado River to the southern end of the Hopi Reservation (Fenneman and Johnson, 1946; fig. 1). Most of the topography is developed on nearly horizontal sedimentary rocks around 5,000 ft in elevation (Hart and others, 2002). The primary surface feature is the Little Colorado River, which parallels Interstate-40 and discharges into the Colorado River northwest of the study area. The Little Colorado River, along with its tributaries, flows through incised canyons in the Coconino Sandstone. Other local topographic relief is provided by folds and solution-collapse features. More detail will be provided on the solution-collapse features in the “Geology” section of this report.
The climate in the study area is classified as arid to semi-arid (Bills and others, 2007). Average annual precipitation near Winslow was less than 8 inches (in.) from 1991 to 2020 (PRISM Climate Group, 2022). The months with the highest amount of rainfall, July–September, coincide with the North American monsoon (Adams and Comrie, 1997). Mean monthly temperature values from 1991 to 2020 near Winslow were highest in July and August at more than 75 degrees Fahrenheit, with the lowest temperatures in December and January at around 35 degrees Fahrenheit (PRISM Climate Group, 2022).
Geology
The Coconino aquifer is named after the primary water-bearing rock unit within the aquifer, the Coconino Sandstone, but the saturated and hydraulically connected parts of the Kaibab Formation, the Toroweap Formation, the Schnebly Hill Formation, and the upper and middle part of the Supai Formation also constitute part of the Coconino aquifer in the study area (fig. 2; Bills and others, 2000; Bills and Flynn, 2002; Hart and others, 2002; Bills and others, 2007).
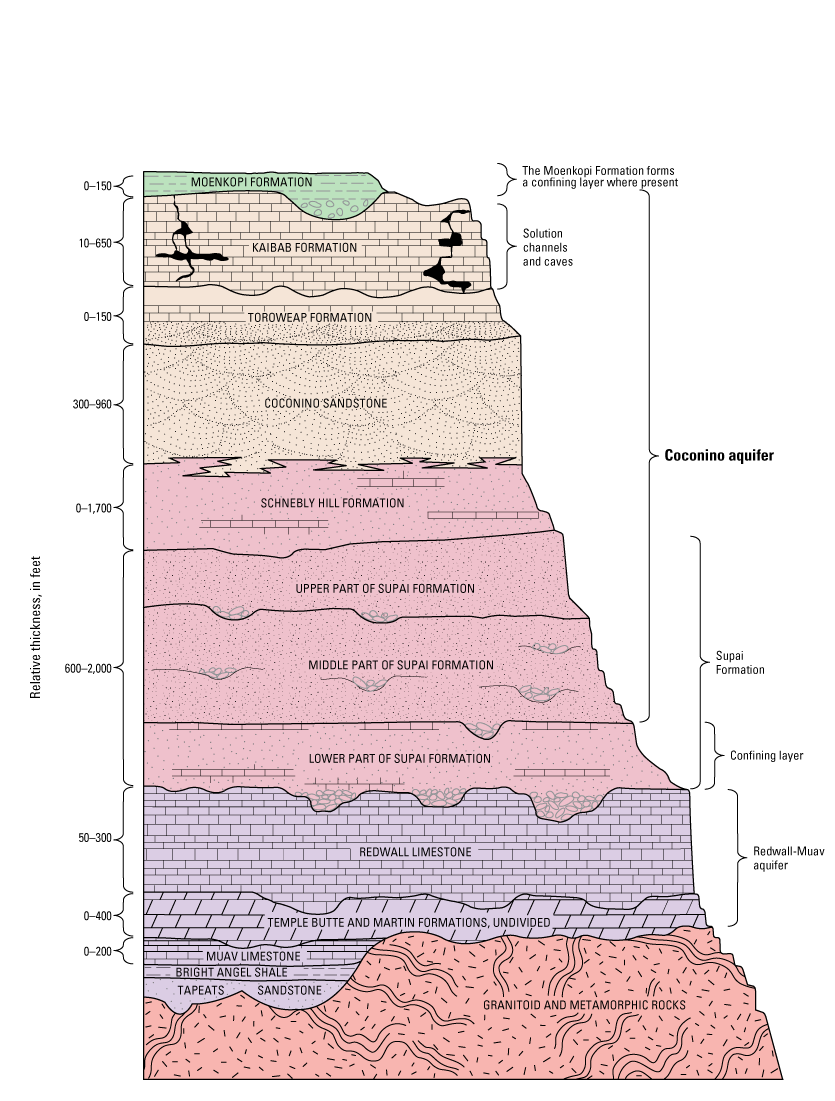
Generalized stratigraphic section of rock units in the study area and surrounding areas, northeastern Arizona. Modified from Bills and others (2007, fig. 11). Muav Limestone and Bright Angel Shale refer to the Muav Limestone and Bright Angel Shale of the Tonto Group. Thickness ranges for the Tapeats Sandstone and Bright Angel Shale are not noted due to lack of data in the study area.
The Supai Formation ranges in age from Pennsylvanian to Permian and consists of red siltstone and sandstone (Irwin and others, 1971; Blakey, 1990). Divided into three parts, only the upper and middle parts of the Supai Formation are hydraulically connected to the Coconino aquifer; the lower part of the Supai Formation acts as a confining layer for underlying groundwater in the Redwall-Muav aquifer (Bills and others, 2000).
The Hermit Formation overlies the Supai Formation in some areas of northern Arizona. Consisting of red-brown siltstone and sandstone, the Hermit Formation is lithologically similar to the Supai Formation. In much of the study area, the boundary becomes unclear and the Hermit and Supai Formations are indistinguishable. For this reason, the Hermit Formation is usually omitted from stratigraphic columns in this area (Irwin and others, 1971; Blakey, 1990; Bills and others, 2000).
The Permian Schnebly Hill Formation is an important Coconino-aquifer component in the Holbrook Basin, with a thickness as much as 1,700 ft (fig. 2; Blakey, 1990; Bills and others, 2000). The Schnebly Hill Formation is reddish brown to reddish orange and comprises sandstone, mudstone, limestone, and evaporites (Blakey, 1990). East of Holbrook, the Corduroy Member of the Schnebly Hill Formation contains halite and other evaporites of early Permian age as much as 650 ft thick (Blakey, 1990; Conway and Cook, 2013). When present, the Schnebly Hill Formation intertongues with the overlying Coconino Sandstone (Bills and others, 2000; Hoffmann and others, 2006).
The Permian Coconino Sandstone is typically the main water-bearing unit of the aquifer (Hart and others, 2002). The Coconino Sandstone is a tan to white, crossbedded, quartz sandstone of eolian origin (Darton, 1910; Blakey, 1990). In Leupp, geologic logs indicate thicknesses from 300 to 960 ft (Hoffmann and others, 2006). Near Winslow, Coconino Sandstone thickness is about 800 ft (Mann, 1976).
The Permian Toroweap Formation is only known to be present in the western part of the study area. Bills and others (2000; p. 26) describe the formation as beds of “carbonate sandstone, red beds, silty sandstone, siltstone, limestone, and thin layers of gypsum.” The formation is often indistinguishable from Coconino Sandstone, but according to Sorauf and Billingsley (1991), a distinction between the Toroweap Formation and the white, quartz sandstone of the Coconino Sandstone can be observed near Flagstaff to the west of the study area; where indistinct, the Toroweap Formation is often considered to be part of the Coconino Sandstone (Bills and others, 2000).
The Permian Kaibab Formation is often expressed as a light-gray limestone from 10 to 650 ft thick. Sinkholes and depressions formed by dissolution are present on the surface, as well as fractures formed by jointing and faulting in the subsurface (Irwin and others, 1971; Bills and others, 2000).
In parts of the study area where the Coconino aquifer is not exposed, the red to reddish-brown Triassic Moenkopi Formation overlies the aquifer (Mann, 1976). Consisting largely of mudstone and siltstone, the Moenkopi Formation acts as a confining layer when not heavily fractured. In some areas, the Moenkopi Formation can supply small amounts of water to wells (Cooley and others, 1969; Bills and others, 2000). North of the study area, the shallower Navajo, Dakota, and Toreva aquifers are present and often used for water supply (Mason, 2021).
Evaporites
Beds of halite underlie about 3,500 mi2 in the southeastern part of the study area, with a maximum thickness near the center of an aggregate of 655 ft of salt in 1,500 ft of Schnebly Hill Formation strata (fig. 3). Close to the depositional center of the halite, a zone of potash covers about 600 mi2. The potash, consisting of sylvite, carnallite, and polyhalite, is nearly 40 ft thick and overlies the halite (Rauzi, 2000). To the south and southeast, halite transitions into gypsum and anhydrite and extends farther than the halite (Rauzi, 2000, pl. 2).
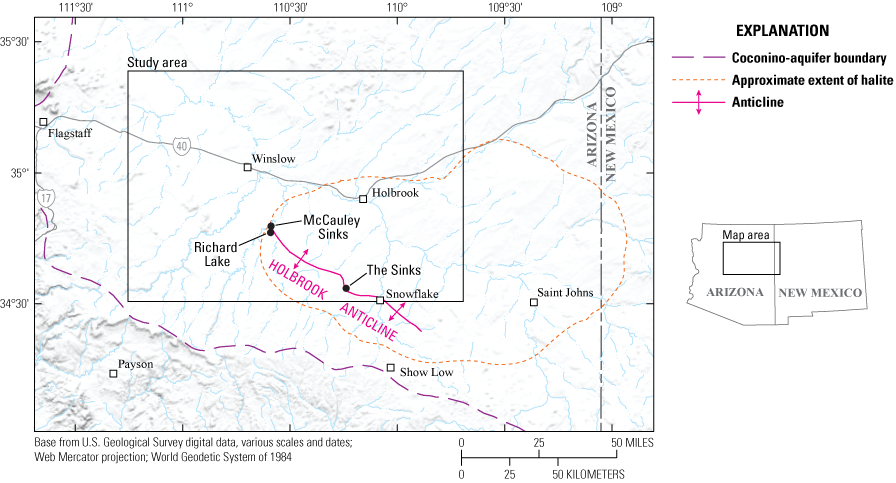
Approximate extent of halite, the Holbrook Anticline, and three surface solution-collapse features—McCauley Sinks, Richard Lake, and an area referred to as “The Sinks,” in northeastern Arizona. Halite extent is from the U.S. Geological Survey (USGS) National Map (https://www.usgs.gov/programs/national-geospatial-program/national-map).
Dissolution of evaporite beds by the movement of Coconino aquifer groundwater has led to numerous solution-collapse features in the study area. Solution-collapse features in evaporite rocks are developed similarly to those in limestone, but the time scale is shorter. Evaporites such as halite and gypsum can form karst features in a matter of days to years due to their high solubility. Evaporite karst features form near the outer edges of a salt deposit (Johnson, 1997). In the study area, the dissolution front is currently migrating to the northeast, and karst features are forming in real time (Bahr, 1962; Johnson, 1997; Neal and others, 1998).
The Holbrook Anticline is present near the southwestern extent of halite, and the axis can be mapped at the surface for more than 60 miles (mi; fig. 3). The northern flank follows a regional dip of about 2 degrees. On the southern side, the regional dip is interrupted and the average dip is about 15 degrees, although some dips can be steeper. Numerous karst sinks are present on the southern flank (Bahr, 1962). More than 500 sinkholes, joints, compression ridges, and other solution-collapse features have been identified along the Holbrook Anticline and the parallel Dry Lake Syncline to the immediate southwest (Mann, 1976; Conway and Cook, 2013). The Holbrook Anticline is not expressed below the salt layer, which may suggest that dissolution is a factor of its formation (Neal and others, 1998).
Just west of the Holbrook Anticline, near the western limits of evaporites of the Schnebly Hill Formation, McCauley Sinks provide a conspicuous karst surface expression (fig. 4). McCauley Sinks include about 50 sinkholes up to 50 meters (m) deep and 100 m in diameter. They appear in three semi-circular “rings” within a 3-kilometer (km) wide depression (Neal and Johnson, 2002). Along with several other, smaller depressions west of the Holbrook Anticline, these structures are related to the dissolution front of the halite and appear similar to breccia pipes on the Colorado Plateau (Neal and Johnson, 2002). However, where these other breccia pipes originate in the Mississippian Redwall Limestone and (or) the Cambrian Muav Limestone of the Tonto Group, the McCauley Sinks and Richard Lake likely originate due to collapse following salt dissolution in the Schnebly Hill Formation. Similar to other karst features in the area, pressure ridges following the general trend of the Holbrook Anticline are present near both structures (Neal and Johnson, 2002). To the southeast of the study location is an area known as “The Sinks,” which includes more than 250 sinkholes, joint fissures, and other collapse features also related to halite dissolution (Neal and others, 1998).
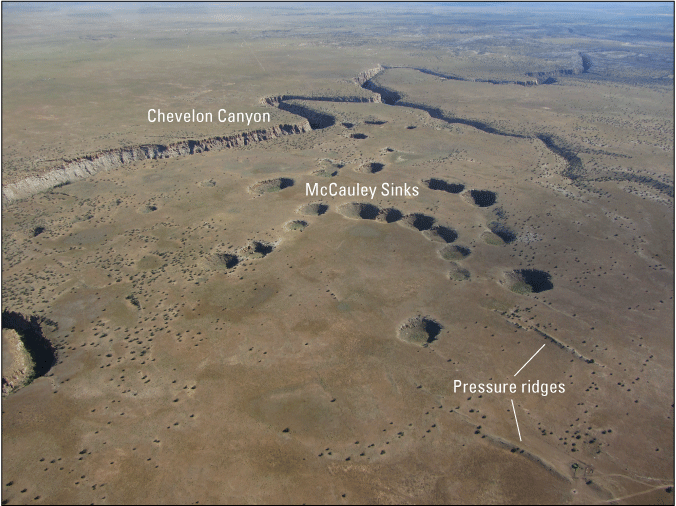
McCauley Sinks as seen looking north. Chevelon Canyon is in the background of the photograph. Pressure ridges are present in the foreground of the photograph. Photograph by Jon Mason, U.S. Geological Survey, June 27, 2020.
Groundwater Movement
Groundwater in the Coconino aquifer generally moves northward, parallel to the regional dip of the strata (Mann, 1976; Hart and others, 2002). Most recharge occurs as snowmelt near the Mogollon Rim to the south; rain events are often flashy and contribute to runoff (Mann, 1976). The Coconino aquifer is unconfined in most of the study area. To the north, the Moenkopi Formation creates confined conditions. The age of groundwater in the Coconino aquifer around Flagstaff in the eastern part of the study area has been estimated as modern to about 7,000 years (Bills and others, 2000).
Well yields from Coconino aquifer wells inventoried by previous studies varied substantially in the study area, from a few gallons per minute to about 2,800 gallons per minute (Mann, 1976; Bills and others, 2000; Hoffmann and others, 2006). Although several factors affect well yields, including pump design and formation lithology, Bills and others (2000) suggested that the greatest effect on Coconino aquifer well efficiency probably is due to proximity to faults and fractures.
Jones and Robinson (2021) discussed wells monitored as part of the USGS C-Aquifer Monitoring Program between Flagstaff and Holbrook, Arizona. They found that measured groundwater levels fluctuate seasonally, and suggested that infiltration from surface water from summer monsoon events and spring snowmelt have the potential to influence wells, as does higher rates of pumping in the summer months. Although some monitored wells have shown little change in groundwater levels (for example, USGS site number 351023111062002, near Leupp), others have shown decreasing water-level trends (for example, USGS site number 345023110111401, south of Holbrook, has decreased about 11 ft from 1969 to 2018; Jones and Robinson, 2021; U.S. Geological Survey, 2023).
Approach and Methods
This report assesses the distribution of major ions, trace metals, and total dissolved solids in the Coconino aquifer. Data used in this report were limited to water-chemistry results from well and spring samples available in the USGS National Water Information System (NWIS) database (U.S. Geological Survey, 2023). No new samples were collected as part of this study. Results within this report provide a representation of the groundwater resource in the Coconino aquifer area in relation to potential potable water based on major-ion chemistry, TDS, and selected trace elements.
Data Compilation
The USGS NWIS database was queried to find existing groundwater sites (wells and springs) that had water-chemistry data associated with them. Those groundwater sites with wells screened-in or springs discharging from the Coconino aquifer and having major ion and (or) TDS data were selected for inclusion in this study.
A total of 130 sites with samples dating from 1933 to 2008 were identified (fig. 1; table 1; U.S. Geological Survey, 2023). These sites were generally in proximity to the Little Colorado River and Interstate-40. Few wells are drilled into the Coconino aquifer in Hopi Tribal Lands or Navajo Nation north of Interstate-40. Some wells may be screened in multiple formations, and it is not always clear which unit(s) the well is producing from. The aquifer coded in NWIS is considered to be the producing unit for this study.
Table 1.
Well and spring locations and selected construction data for Coconino aquifer groundwater sites included in this study, northeastern Arizona (U.S. Geological Survey, 2023).[ft, feet; bls, below land surface; N/A, not applicable; --, information not available]
Most wells used (118) were screened in the Coconino Sandstone (fig. 1). Additionally, four of the spring sites discharge from the Coconino Sandstone where it is exposed in canyon walls along Clear and Chevelon Creeks. Three wells and one spring are sourced by the Kaibab Formation in the western part of the study area. Four wells are screened in the Supai Formation. No wells or springs sourced from the Hermit, Toroweap, or Schnebly Hill Formations were present in NWIS in the study area.
Numerous study sites have been sampled multiple times. When computing the median values from all sites for the parameters of pH, specific conductance, and total dissolved solids, the most recent values from each site were used. In three cases, the date when the most recent sample was collected had two samples collected; in those cases, the average value of the two samples was used in the statistical analysis. Additionally, there were 23 samples with estimated results for TDS that were used in the statistical analysis. When computing the water type for sites with multiple samples the most recent sample collected containing all the constituents necessary to compute water type was used.
Quality Assurance
Water-chemistry samples were analyzed using methods described in Fishman and Friedman (1989), Fishman (1993), and Fishman and others (1994). Major ion data included dissolved calcium, magnesium, sodium, potassium, chloride, sulfate, and bicarbonate (computed from alkalinity or acid-neutralizing capacity). When potassium was not measured, sodium was used by itself in the ion balance and analyses; potassium concentrations are considered minor. In order to validate the dissolved-ion data, the ion balance of samples was checked by converting the concentrations of cations and anions in the sample from milligrams per liter to milliequivalents per liter for comparison. Theoretically, if all ions have been correctly determined, the total milliequivalents per liter of cations should equal the total milliequivalents per liter of anions in a sample (Hem, 1985). Most samples had differences of less than 5 percent between cation and anion concentrations expressed as milliequivalents per liter. Four samples had ion balances with differences from 6 to 12 percent; these samples are included in this study because the percent differences are low, and other unmeasured ions and trace metals may potentially contribute to the ion balances (Hem, 1985). Potassium was not measured in all water samples which undoubtably affected the ion balance of samples where it was missing. However, because potassium is usually a minor constituent of natural waters the omission was considered acceptable. The TDS of groundwater was analyzed using the sum of constituents method (Fishman and Friedman, 1989). Specific conductance, or the ability of a solution to conduct an electric current, is a function of the concentration and charge of the ions (Hem, 1985; Fishman and Friedman, 1989). Specific conductance and TDS from samples used in this study showed a strong relationship as should be expected with an R2 value of 0.98.
Graphical and Statistical Analysis
The geochemical compositions of water-chemistry samples were graphically depicted with stiff and trilinear diagrams (similar to Piper [1944]). Analyses were performed using R statistical software (v.4.2.2; R Core Team, 2022). Water-chemistry data were downloaded from NWIS using the dataRetrieval package (De Cicco and others, 2022), and stiff diagrams and piper diagrams were created using the smwrGraphs package (Lorenz and Diekoff, 2017). Prior to plotting, concentration data, in milligrams per liter, were transformed to milliequivalents per liter. TDS were plotted in ArcMap (v. 10.8.1, Esri, Redlands, California) and interpolated using the “spline with barriers” method.
In addition to the graphical methods described above, principal component analysis (PCA) on the major ion data was performed in Primer 7 (Clarke and others, 2014; v7.0.17, PRIMER-E Ltd., Plymouth, United Kingdom) to investigate associations in the data. PCA was conducted on transformed and normalized major ion data to better understand how the selected factors explained the observed variation among sites (Clarke and others, 2014). Briefly, PCA captures as much of the variability in the original multi-dimensional space as possible within the two axes of the plane. Output from the PCA includes eigenvalues (variances of each principal component axis), eigenvectors (coefficients for the linear combination of input factors that defines the plane), and principal component scores (coordinates of the samples on the PC axes computed using eigenvector coefficients). A percent variance explained (from eigenvalues) is computed to quantify the extent to which the two principal component axes of the plane provide an accurate representation of the true association between the factors in the original multi-dimensional space.
Results
Water chemistry of the Coconino aquifer varied throughout the study area. The pH values for 112 sites ranged from 6.7 to 11.1, with a median of 7.6 (table 2, found at the end of this report). Three sites had samples that exceeded the SMCL range for pH for drinking water (6.5–8.5; U.S. Environmental Protection Agency, 2015). SMCLs are not enforced or considered to cause health effects, but may affect the taste, color, or corrosiveness of water. USGS site number 345757110484301 exceeded the SMCL with 1 pH value of 8.6, although 16 other samples from the site ranged from 7.4 to 8.1. USGS site number 351758111000901 exceeded the SMCL with a pH value of 9.2, and USGS site number 350407110332101 had the highest pH value of the sites with a pH of 11.1. Specific conductance values from 126 sites ranged from 110 to 15,200 microsiemens per centimeter (µS/cm), with a median of 1,220 µS/cm. Total dissolved solids ranged from 199 to 10,400 milligram per liter (mg/L) from 117 sites, with a median of 755 mg/L (table 2, found at the end of this report).
Maximum TDS exceeded the SMCL in about 73 percent of sites with data (85 of 117; fig. 5). TDS was highest (10,400 mg/L) at USGS site number 344407110171801. This 800-ft well is completed in the Coconino Sandstone and is located south of Holbrook in the southeastern part of the study area. Other sites with high TDS (USGS site number 350407110332101, 6,580 mg/L; USGS site number 351815110505001, 5,800 mg/L; USGS site number 351053110332501, 5,470 mg/L; and USGS site number 351052110491701, 5,030 mg/L; figs. 5 and 6) are located north of Winslow (table 2, found at the end of this report; fig. 5).
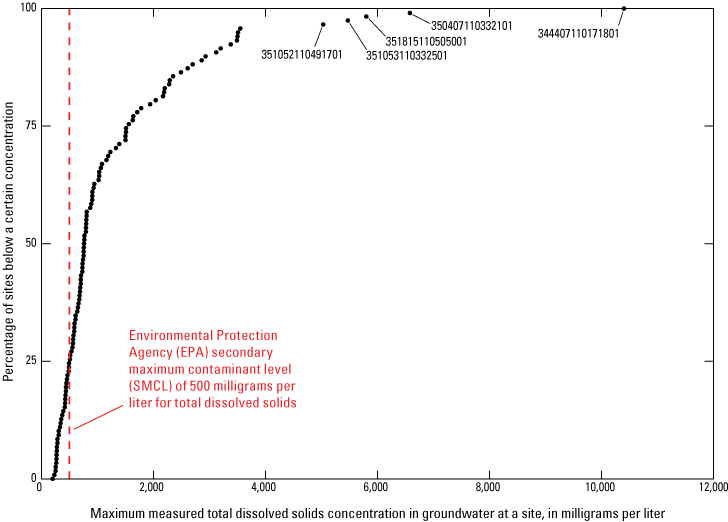
Distribution of the concentration of total dissolved solids (TDS) in Coconino aquifer groundwater samples from 117 sites in the northeastern Arizona study area. Five sites with the highest TDS are labeled with the corresponding U.S. Geological Survey site number.
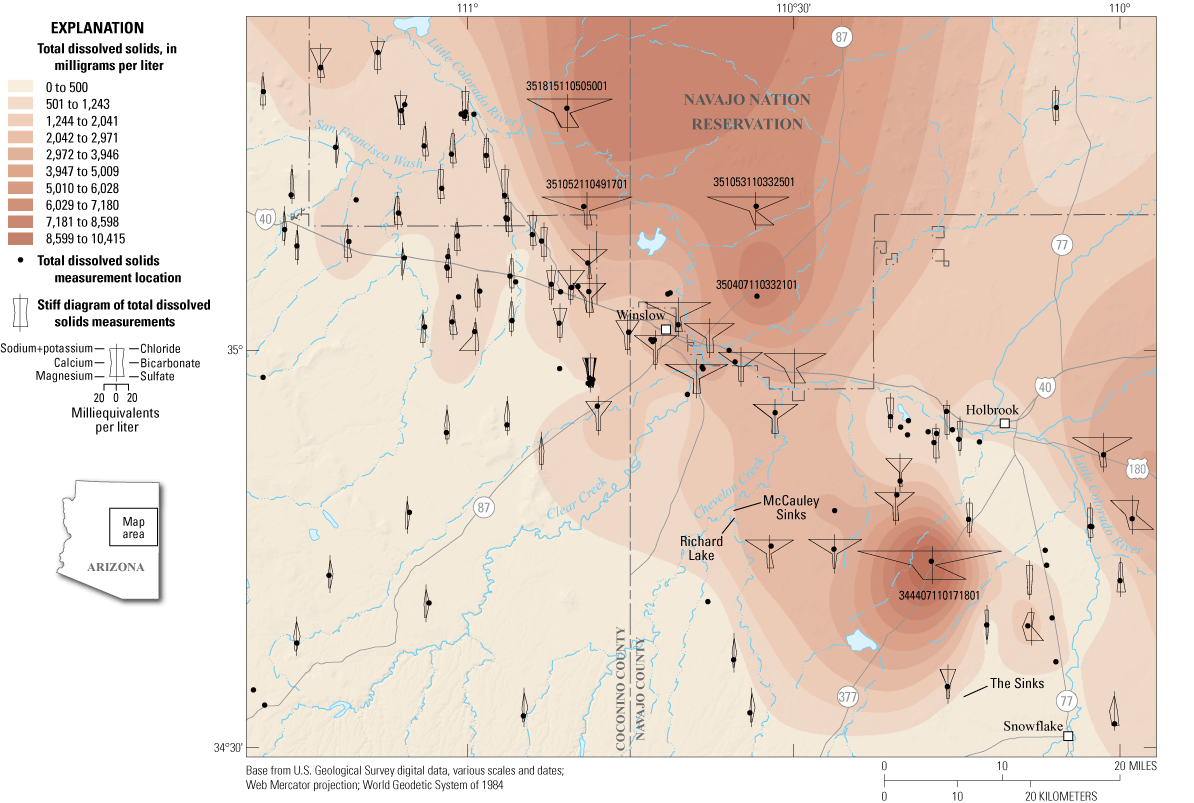
Interpolated total dissolved solids (TDS) and major ion chemistry distribution (U.S. Geological Survey, 2023) in the Coconino aquifer in the northeastern Arizona study area. Not all sites with TDS have major ion data to display. When sites with major ion data were too close together to distinguish, one representative diagram is displayed.
A map of interpolated TDS concentrations was created for the study area (fig. 6). Areas of high TDS include the area northwest of The Sinks and Snowflake in the southeastern part of the study area and a broad area north of Winslow. This broad area is unconstrained by TDS sample data; however, a well drilled in the mid-2000s by the Hopi Tribe at the Village of Moenkopi north of the study area required reverse osmosis treatment for municipal use demonstrating that salinity concentrations are elevated in that area (Jon Mason, oral commun., 2023). Spatial distributions of TDS are consistent with a similar map of the southeastern part of the study area from Mann (1976). Figure 6 also displays water-chemistry stiff diagrams at sites with available data. These stiff diagrams are used to spatially compare ionic composition of water samples (Stiff, 1951). Water-chemistry data were adequate to create stiff diagrams for 111 sites; when sites were too close together to distinguish, a representative diagram from one site is displayed in figure 6.
The chemical composition of groundwater was further characterized based on the ratios of major ions present in the water (Hem, 1985). This classification is typically called the water type. Water type is determined by comparing the relative concentrations in milliequivalents of the cations and anions in water separately. To be classified as a specific water type, there must be a dominant cation and anion each making up more than 50 percent of the total. For example, if calcium makes up more than 50 percent of the cations and bicarbonate makes up more than 50 percent of the anions in the water, it is classified as a calcium-bicarbonate water type (or just calcium-bicarbonate water). If no cations and anions make up more than 50 percent of the total, the water is classified as a mixed water type (Hem, 1985). The water types correspond to areas of a trilinear diagram (fig. 7).
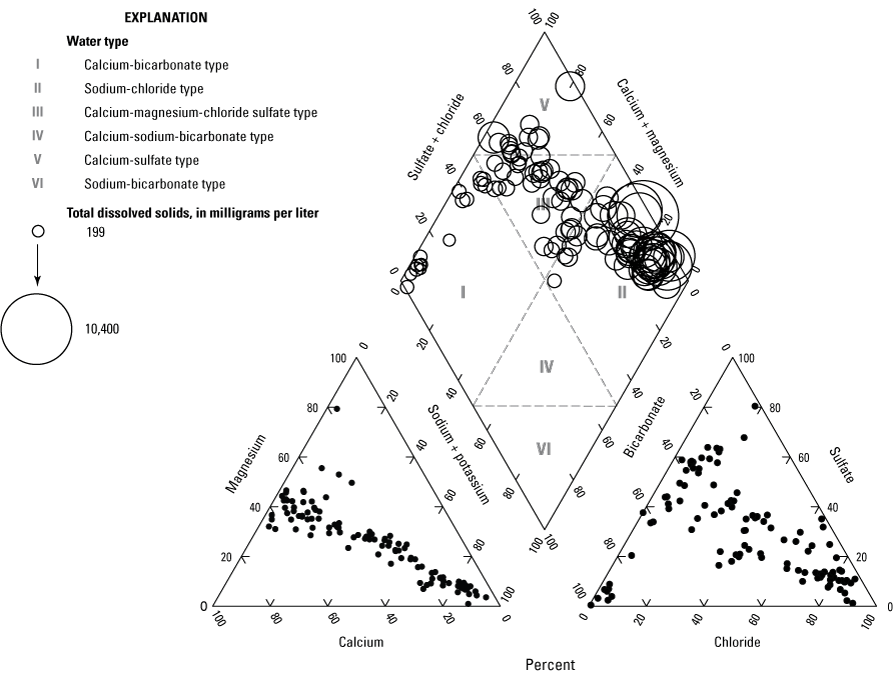
Trilinear diagram and water-type classification of groundwater samples in the Coconino aquifer in the study area. The relative size of the circles represents total dissolved-solids concentrations.
Using this method of classification, 42 percent of the sites (47 of 111) have a sodium-chloride water type. These sites correlate with high TDS in the study area, located to the southeast and north of the Little Colorado River (figs. 6, 7, and 8; table 2, found at the end of this report). Another 14 percent (15 of 111) of the sites are a calcium-sulfate water type. About 15 percent (17 of 111) of the sites are considered calcium-bicarbonate water. The calcium-dominated water is mostly located to the west of the study area (fig. 8; table 2, found at the end of this report). The remaining 29 percent (32 of 111) are a mixed water type. They are referred to as calcium-magnesium-chloride sulfate type because combinations of these cations and anions make the majority of the ions (fig. 7; table 2, found at the end of this report).
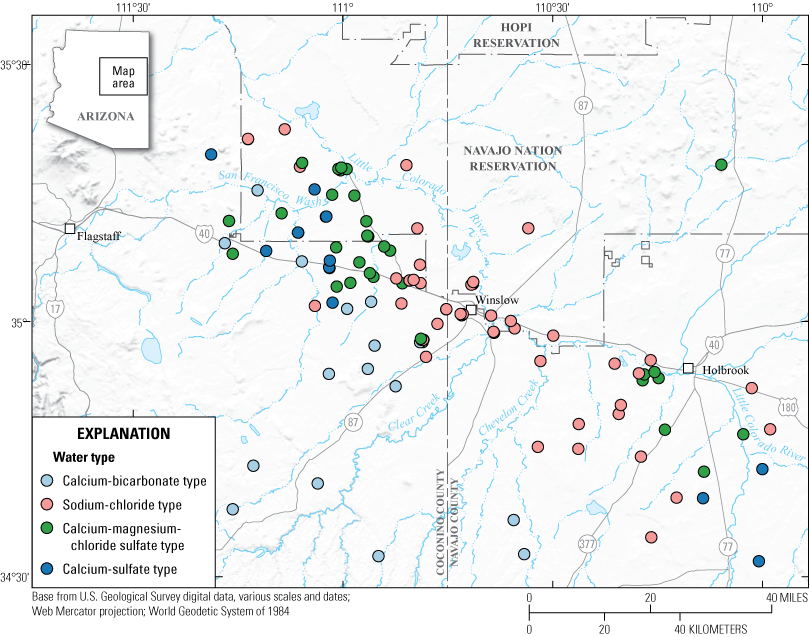
Groundwater types of sites in the Coconino aquifer in the study area, based on the ratios of major ions present.
The loading plot depicts computed PCA of the normalized major ion data and explains 66 percent of the cumulative variability among the data (fig. 9). The principal component along axis 1 (PC1) accounted for 46.1 percent of variation. The principal component along axis 2 (PC2) accounted for an additional 19.9 percent of variation. Vectors plotted on the PC1 represented a positive loading for bicarbonate and negative loading for all other variables. Vectors plotted on the PC2 represented a positive loading in calcium, magnesium, and sulfate, and a negative loading in sodium (+potassium), chloride, and bicarbonate ions. Additionally, non-sodium-chloride water types plotted along a line defined by the bicarbonate vector on one end to magnesium, calcium, and sulfate on the other end, whereas sodium-chloride water types changed along a different line that included the sodium and chloride vectors.
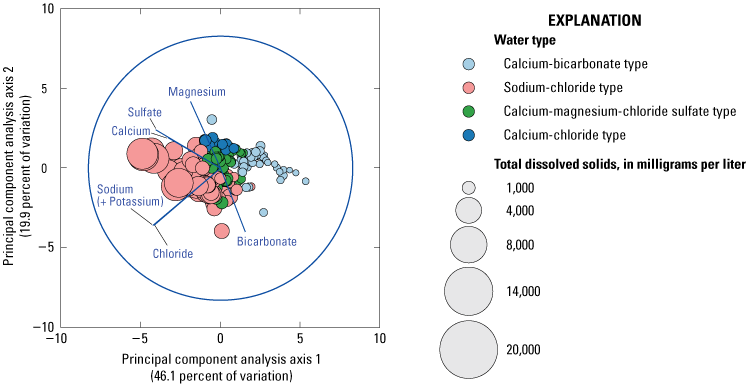
Principal component analysis (PCA) of major ions in the groundwater sites in the Coconino aquifer in the study area.
Of these major ions, chloride and sulfate have Environmental Protection Agency (EPA) SMCLs that affect drinking water (table 3; U.S. Environmental Protection Agency, 2015). The SMCL for both ions is 250 mg/L; exceedances can cause the water to taste salty. Chloride exceeded the SMCL in 122 samples from 50 sites (about 45 percent of the sites) in the study area. Sulfate exceeded the SMCL in 68 samples from 46 sites (about 41 percent of the sites). Either chloride, sulfate, or both ions exceeded the SMCL in 154 samples from 69 sites (about 62 percent of the sites)
Table 3.
Ranges of constituents in the study area and corresponding Environmental Protection Agency (EPA) maximum contaminant levels (MCLs), treatment techniques (TT), and (or) secondary maximum contaminant levels (SMCLs; U.S. Environmental Protection Agency, 2015), Coconino aquifer, northeastern Arizona.[Abbreviations: µg/L, micrograms per liter; mg/L, milligrams per liter; --, not applicable; <, less than]
Selected trace metals also were analyzed. Although most sites did not have any data (with the exception of fluoride, which was measured at 126 sites), available data are presented along with EPA regulations (table 3). Only one sample exceeded the EPA maximum contaminant limit (MCL) for any of the trace metals measured. Unlike SMCLs, MCLs are legal limits of constituents in drinking water that are designed to protect human health (U.S. Environmental Protection Agency, 2009). USGS site number 344407110171801, an 800-foot well in the Coconino Sandstone, exceeded the MCL and SMCL for fluoride (MCL is 4 mg/L; SMCL is 2 mg/L; and sample concentration was 5.4 mg/L). Fluoride concentrations for 126 sites ranged from 0 to 5.4 mg/L.
Arsenic, barium, copper, and lead were measured at 22 sites for a total of 38 samples. Arsenic concentrations ranged from less than 1 to 7 µg/L (MCL is 10 µg/L). Barium concentrations ranged from 11.8 to 262 µg/L (MCL is 2,000 µg/L). Copper and lead do not have an MCL, but instead are regulated in water systems by treatment techniques (TT). Treatment techniques do not apply to single elements, but no more than 10 percent of tap water samples can exceed the TT action level, or corrective measures must be used (U.S. Environmental Protection Agency, 2009). Copper concentrations ranged from 0.32 to 30 µg/L (TT action level is 1,300 µg/L). Lead concentrations ranged from less than 0.08 to 30 µg/L (TT action level is 15 µg/L). Uranium concentrations were only measured at two sites near Leupp, Arizona, in 2005, and were 2.45 and 4.60 µg/L (MCL is 30 µg/L).
Discussion
Subsurface deposits of halite in the southeastern part of the study area influence the groundwater chemistry. High TDS, which can occur naturally in groundwater due to the dissolution of rocks, likely results from the solution of halite along the regional groundwater flow path. Sodium-chloride is highly soluble in water but is concentrated in many of the groundwater sites in the study area, suggesting a persistent source.
Despite the salt-dissolution features at McCauley Sinks and Richard Lake, TDS is interpreted to be in a low range for the study area near these features (Neal and Johnson, 2002; fig. 6). This supports Neal and Johnson’s (2002) conclusion that dissolution here may indeed be less active than in the past, as the dissolution front migrates to the northeast. Another hypothesis presented by Neal and Johnson (2002) is that wells are too shallow to penetrate deep groundwater with high TDS. The top of the saltwater zone is variable, and well logs are not always available. Mann (1976) attributes this irregularity to fractures in the siltstone of the Supai Formation beneath the Coconino aquifer.
Other evaporites that are often present along with naturally forming halite can supply additional ions to groundwater (Richter and Kreitler, 1991). Calcium and sulfate in groundwater likely result from dissolution of gypsum (CaSO4 2H20) and anhydrite (CaSO4), which extend beyond the halite bed. Mann (1976) suggested that sodium, sulfate, and chloride in the Coconino aquifer also may be contaminated from the Moenkopi Formation when wells are open in both stratigraphic layers. However, due to the mudstone and siltstone present, the Moenkopi Formation acts as a confining unit unless heavily fractured.
The calcium, magnesium, and bicarbonate present in the west and southwest may be from water moving downward through the carbonate Kaibab Formation (Mann, 1976). Bills and others (2007) recorded low strontium-isotope (87Sr/86Sr) measurements from wells and springs near Flagstaff that indicate inflow interacting with the Kaibab Formation and volcanic rocks.
Potential for Use as Potable Water
High concentrations of TDS in much of the study area affect the quality of Coconino aquifer water for potential potable use. In the southeastern part of the study area, and north of the Little Colorado River, about 73 percent of Coconino aquifer samples contain TDS greater than the SMCL of 500 milligrams per liter (mg/L) up to concentrations greater than 10,000 mg/L. Although this falls into the TDS range that can be potentially remediated, desalination of groundwater for potable use can be costly and energy intensive (Stanton and others, 2017).
Trace metals have not been widely measured, but most concentrations are less than the MCLs for drinking water. Fluoride exceeded the MCL in one sample (table 3). Although both arsenic and uranium samples were less than the MCLs (10 µg/L As and 30 µg/L U), these elements have been a concern for the Navajo Nation and Hopi Tribe. Jones and others (2020) found that both arsenic and uranium exceeded the EPA MCL in western Navajo Nation in unregulated water sources, including around Leupp, Arizona.
Water containing elevated TDS can be used for livestock watering and (or) irrigation in some cases. Irrigation water with specific conductance values ranging from 750 to 1,500 µS/cm may have detrimental effects on sensitive crops, whereas higher specific conductance values may affect many crops (Zaman and others, 2018). Sodium hazard, which describes how sodium affects the soil, and ion toxicity are other potential hurdles.
Less is known about Coconino aquifer water north of the study area on the Hopi Reservation and Navajo Nation. Wells in these areas penetrate the shallower Navajo, Dakota, and Toreva aquifers (Mason, 2021). The Hopi Tribe did drill a single municipal well into the Coconino aquifer at the Village of Moenkopi north of the study area. Water from that well required reverse osmosis treatment demonstrating that salinity concentrations are elevated in that area (Jon Mason, oral commun., 2023). However, to the northeast of the study area, near Arizona’s border with New Mexico, Coconino aquifer water contains less dissolved solids (less than 500 mg/L; U.S. Geological Survey, 2023).
Conclusions
As population and development increase in the arid Hopi Reservation and Navajo Nation of northeastern Arizona, the Coconino aquifer has been considered for development as a supplemental groundwater resource. In cooperation with the Hopi Tribe and analyzing existing groundwater samples collected since 1933, the water chemistry of the Coconino aquifer was characterized to determine its potential suitability as a source of drinking water for the Hopi Tribe and Navajo Nation.
Buried halite bodies in the southeastern part of the study area influence the dissolved-solids concentrations in the area. As groundwater moves along the regional dip to the north, sodium, chloride, and other ions are dissolved and transported through the system. The resulting plume of sodium-chloride groundwater differs from the groundwater to the south and west. Total dissolved solids (TDS), sulfate, and chloride exceed the U.S. Environmental Protection Agency (EPA) secondary maximum contaminant level for taste and odor in many samples. Measured trace metals are less than the EPA maximum contaminant level (MCL), except for one sample of fluoride.
Water chemistry data from this study, indicate that in much of this area, while the aquifer is potentially productive, it will likely need treatment before it is suitable for human consumption. Few Coconino aquifer wells exist north of the study area in the Hopi Reservation and (or) Navajo Nation. Characterizing the groundwater chemistry of the aquifer resource in this area could reveal its suitability for development as a water supply.
Table 2.
Selected field parameters and water-chemistry data for Coconino aquifer groundwater sites included in this study, northeastern Arizona (U.S. Geological Survey, 2023).[Sample date: MM/DD/YYYY, month/day/year. Water type: Water type refers to major ion distribution and is only listed if used in the analysis (most recent complete sample). Abbreviations: SC, specific conductance; µS/cm, microsiemens per centimeter; Ca2+ , calcium; Mg+, magnesium; mg/L, milligrams per liter, Na+ + K+, sodium+potassium; SO42-, sulfate; Cl, chloride; HCO-, bicarbonate; TDS, total dissolved solids; --, no data available; E, estimate; <, less than]
References Cited
Bills, D.J., and Flynn, M.E., 2002, Hydrogeologic data for the Coconino Plateau and adjacent areas, Coconino and Yavapai Counties, Arizona: U.S. Geological Survey Open-File Report 2002–265, 29 p. [Also available at https://doi.org/10.3133/ofr02265.]
Bills, D.J., Flynn, M.E., and Monroe, S.A., 2007, Hydrogeology of the Coconino Plateau and adjacent areas, Coconino and Yavapai Counties, Arizona: U.S. Geological Survey Scientific Investigations Report 2005–5222, 101 p., 4 plates. [Also available at https://doi.org/10.3133/sir20055222.]
Bills, D.J., Truini, M., Flynn, M.E., Pierce, H.A., Catchings, R.D., and Rymer, M.J., 2000, Hydrogeology of the regional aquifer near Flagstaff, Arizona, 1994–97: U.S. Geological Survey Water-Resources Investigations Report 00–4122, 142 p. [Also available at https://pubs.usgs.gov/wri/2000/4122/report.pdf.]
De Cicco, L.A., Hirsch, R.M., Lorenz, D., Watkins, W.D., Johnson, M., 2022, dataRetrieval—R packages for discovering and retrieving water data available from Federal hydrologic web services, v.2.7.12., accessed May, 2022, at https://doi.org/10.5066/P9X4L3GE.
Fenneman, N.M., and Johnson, D.W., 1946, Physiographic divisions of the conterminous U.S.: U.S. Geological Survey data release. [Also available at https://doi.org/10.5066/P9B1S3K8.]
Fishman, M.J., ed., 1993, Methods of analysis by the U.S. Geological Survey National Water Quality Laboratory—Determination of inorganic and organic constituents in water and fluvial sediments: U.S. Geological Survey Open-File Report 93–125, 217 p. [Also available at https://doi.org/10.3133/ofr93125.]
Fishman, M.J., Raese, J.W., Gerlitz, C.N., and Husband, R.A., 1994, U.S. Geological Survey approved inorganic and organic methods for the analysis of water and fluvial sediments, 1954–94: U.S. Geological Survey Open-File Report 94–351, 55 p. [Also available at https://doi.org/10.3133/ofr94351.]
Hart, R.J., Ward, J.J., Bills, D.J., and Flynn, M.E., 2002, Generalized hydrogeology and ground-water budget for the C aquifer, Little Colorado River basin and parts of the Verde and Salt River basins, Arizona and New Mexico: U.S. Geological Survey Water-Resources Investigations Report 2002–4026, 45 p., [Also available at https://doi.org/10.3133/wri024026.]
Hem, J.D., 1985, Study and interpretation of the chemical characteristics of natural water: U.S. Geological Survey Water-Supply Paper 2254. [Also available at https://doi.org/10.3133/wsp2254.]
Hoffmann, J.P., Bills, D.J., Phillips, J.V., and Halford, K.J., 2006, Geologic, hydrologic, and chemical data from the C aquifer, near Leupp, Arizona: U.S. Geological Survey Scientific Investigations Report 2005–5280, 42 p. [Also available at https://pubs.usgs.gov/sir/2005/5280/.]
Jones, C.J.R., and Robinson, M.J., 2021, Groundwater and surface-water data from the C-aquifer monitoring program, northeastern Arizona, 2012–2019: U.S. Geological Survey Open-File Report 2021–1051, 34 p. [Also available at https://pubs.usgs.gov/publication/ofr20211051.]
Jones, L., Credo, J., Parnell, R. and Ingram, J.C., 2020, Dissolved uranium and arsenic in unregulated groundwater sources—Western Navajo Nation: Journal of Contemporary Water Research & Education, v. 169, no. 1, p. 27–43. [Also available at https://doi.org/10.1111/j.1936-704X.2020.03330.x.]
Lorenz, D.L., and Diekoff, A.L., 2017, smwrGraphs—An R package for graphing hydrologic data, version 1.1.2: U.S. Geological Survey Open-File Report 2016–1188, 17 p., accessed May, 2022, at https://doi.org/10.3133/ofr20161188. [Supersedes U.S. Geological Survey Open-File Report 2015–1202.]
Mason, J.P., 2021, Groundwater, surface-water, and water-chemistry data, Black Mesa area, northeastern Arizona—2016–2018: U.S. Geological Survey Open-File Report 2021–1124, 50 p. [Also available at https://doi.org/10.3133/ofr20211124.]
Neal, J.T., Colpitts, R., and Johnson, K.S., 1998, Evaporite karst in the Holbrook Basin, Arizona, in Borchers, J.W., ed., Land subsidence case studies and current research: Proceedings of the Dr. Joseph F. Poland Symposium on Land Subsidence, Association of Engineering Geologists, Special Publication No. 8, p. 373–384.
Piper, A.M., 1944, A graphic procedure in the geochemical interpretation of water analyses: EOS, Transactions American Geophysical Union, v. 25, no. 6, p. 914–928. [Also available at http://doi.org/10.1029/TR025i006p00914.]
PRISM Climate Group, 2022, Norm91m: PRISM Climate Group, Oregon State University, accessed June 13, 2023, at http://prism.oregonstate.edu.
R Core Team, 2022, R: A language and environment for statistical computing, R Foundation for Statistical Computing: Vienna, Austria, accessed May, 2022, at https://www.R-project.org/.
Robson, S.G., and Banta, E.R., 1995, Ground water atlas of the United States—Segment 2—Arizona, Colorado, New Mexico, Utah: U.S. Geological Survey Hydrologic Atlas 730-C, 32 p. [Also available at https://doi.org/10.3133/ha730C.]
Stanton, J.S., Anning, D.W., Brown, C.J., Moore, R.B., McGuire, V.L., Qi, S.L., Harris, A.C., Dennehy, K.F., McMahon, P.B., Degnan, J.R., and Böhlke, J.K., 2017, Brackish groundwater in the United States: U.S. Geological Survey Professional Paper 1833, 185 p. [Also available at https://doi.org/10.3133/pp1833.]
Stiff, H.A., Jr., 1951, The interpretation of chemical water analysis by means of patterns: Journal of Petroleum Technology, v. 3, no. 10, p. 15–17. [Also available at https://doi.org/10.2118/951376-G.]
U.S. Environmental Protection Agency, 1987, Guidance for determination of underground sources of drinking water (USDWs): U.S. Environmental Protection Agency Regional Guidance 3, 3 p., accessed August 26, 2023, at https://www.epa.gov/sites/default/files/2015-09/documents/r5-deepwell-guidance3-determination-underground-sources-drinking-water-19870205.pdf.
U.S. Environmental Protection Agency, 2009, National primary drinking water regulations: U.S. Environmental Protection Agency, 7 p., accessed August 26, 2023, at https://www.epa.gov/sites/default/files/2016-06/documents/npwdr_complete_table.pdf.
U.S. Environmental Protection Agency, 2015, Secondary drinking water standards—Guidance for nuisance chemicals: U.S. Environmental Protection Agency, accessed August 26, 2023, at https://www.epa.gov/sdwa/secondary-drinking-water-standards-guidance-nuisance-chemicals.
U.S. Geological Survey, 2023, USGS water data for the nation: U.S. Geological Survey National Water Information System database, accessed May 30, 2023, at https://doi.org/10.5066/F7P55KJN.
Zaman, M., Shahid, S.A., and Heng, L., 2018, Irrigation water quality, in Guideline for salinity assessment, mitigation and adaptation using nuclear and related techniques: Springer, chap. 5, p. 113–131. [Also available at https://doi.org/10.1007/978-3-319-96190-3_5.]
Conversion Factors
U.S. customary units to International System of Units
International System of Units to U.S. customary units
Temperature in degrees Fahrenheit (°F) may be converted to degrees Celsius (°C) as follows:
°C = (°F – 32) / 1.8.
Temperature in degrees Celsius (°C) may be converted to degrees Fahrenheit (°F) as follows:
°F = (1.8 × °C) + 32.
Datums
Vertical coordinate information is referenced to the North American Vertical Datum of 1988 (NAVD 88).
Horizontal coordinate information is referenced to the North American Datum of 1983 (NAD 83).
Supplemental Information
Specific conductance is given in microsiemens per centimeter at 25 degrees Celsius (µS/cm at 25 °C).
Concentrations of chemical constituents in water are given in either milligrams per liter (mg/L) or micrograms per liter (µg/L).
Tacoma and Moffett Field Publishing Service Centers
Manuscript approved for publication April 23, 2025
Edited by Jeff Suwak and Vanessa Ball
Illustration support by JoJo Mangano
Layout and design by Luis Menoyo
Disclaimers
Any use of trade, firm, or product names is for descriptive purposes only and does not imply endorsement by the U.S. Government.
Although this information product, for the most part, is in the public domain, it also may contain copyrighted materials as noted in the text. Permission to reproduce copyrighted items must be secured from the copyright owner.
Suggested Citation
Jones, C.J.R., 2025, Assessment of water chemistry of the Coconino aquifer in northeastern Arizona: U.S. Geological Survey Scientific Investigations Report 2025–5038, 30 p., https://doi.org/10.3133/sir20255038.
ISSN: 2328-0328 (online)
Study Area
| Publication type | Report |
|---|---|
| Publication Subtype | USGS Numbered Series |
| Title | Assessment of water chemistry of the Coconino aquifer in northeastern Arizona |
| Series title | Scientific Investigations Report |
| Series number | 2025-5038 |
| DOI | 10.3133/sir20255038 |
| Publication Date | July 03, 2025 |
| Year Published | 2025 |
| Language | English |
| Publisher | U.S. Geological Survey |
| Publisher location | Reston, VA |
| Description | viii, 30 p. |
| Country | United States |
| State | Arizona |
| Other Geospatial | Coconino aquifer |
| Online Only (Y/N) | Y |