

Stream Network Capacity to Support Beaver Dams in the Tualatin River Basin, Northwestern Oregon
Links
- Document: Report (5.9 MB pdf) , HTML , XML
- Larger Work: This publication is Chapter A of Beavers in the Tualatin River Basin, northwestern Oregon
- Data Releases:
- USGS data release - Beaver dam locations and beaver activity in the Tualatin Basin, Oregon
- USGS data release - Stream network capacity to support beaver dams, Tualatin River Basin, northwest Oregon
- Download citation as: RIS | Dublin Core
Acknowledgments
The authors are grateful to Carol Murdock, Bob Baumgartner (retired), Matthew Brennan, Anil Devnani, John Goetz, Rajeev Kapur, Kenneth Williamson, and Brian Shepard at Clean Water Services for their assistance and helpful discussions during this study. We thank all the organizations that contributed information to the inventory of beaver dams and beaver activity, including the City of Portland (Amin Wahab and Dave Helzer), Tualatin River Watershed Council (April Olbrich), Clean Water Services (Ben Protzman and Matthew Brennan), Tualatin Riverkeepers (Brian Wegener), Tualatin Hills Parks and Recreation District (Bruce Barbarasch and Greg Creager), Tigard Public Works (Carla Staedter and Theresa Reynolds), Portland Parks and Recreation Department (Janelle St. Pierre), The Wetlands Conservancy (Kaegan Scully-Engelmeyer and Megan Garvey), Bonneville Environmental Foundation (Kendra Smith), and Tualatin River National Wildlife Refuge (Trevor Sheffels). The authors also thank Erin Leahy, Alexandria Costello, and Gabriel Gordon of the U.S. Geological Survey for their help in compiling results and assistance with the inventory.
Preface
This is the first of four reports in a multichapter volume assessing the capacity of the stream network to support beaver dams and evaluating the effects of beaver dams and ponds on urban streams. These reports document the data collection from 2016–17 and the findings of these studies, which were done in partnership with Clean Water Services. Chapter A (this report) documents the locations of beaver dams in the Tualatin River Basin and how many beaver dams the stream network could support with existing and improved riparian vegetation. Beaver dam capacity was estimated by modifying existing tools to account for the low gradient of many streams in the Tualatin River Basin. Chapter B (White and others, 2025) describes the effects of beaver dams and ponds on hydrologic and hydraulic responses of storm flows. Hydrologic and hydraulic responses for two urban stream reaches were compared with and without beaver dams and ponds and for a range of streamflow conditions using two-dimensional hydraulic models. Chapter C (Doyle and others, 2025) characterizes the effects of beaver dams and ponds on the transport and deposition of suspended sediment. Continuous turbidity, discrete suspended-sediment samples, and streamflow measurements collected during storms and base-flow periods were used to assess: (1) suspended-sediment loads upstream and downstream from two beaver-affected reaches, and (2) seasonal and longitudinal turbidity patterns. Chapter D (Smith and others, 2025) describes the effects of beaver dams and ponds on longitudinal, spatial, and seasonal water-quality patterns. Continuous and synoptic water-quality data were collected along urban stream reaches, and net ecosystem production was calculated for two beaver-affected reaches. The findings of these studies illustrate that the effects of beaver dams and ponds on hydrology, hydraulics, suspended-sediment transport and deposition, and water quality are dependent on the characteristics of a stream reach (for example, channel gradient, groundwater exchange, and riparian vegetation) and the characteristics of beaver dams and ponds along that reach. This information can be used to consider the implications of beaver-assisted restoration in the Tualatin River Basin and the effects of beaver dams and ponds in urban streams.
Significant Findings
Beaver dams can help streams connect to their floodplains. These floodplain connections can expand the range of available aquatic habitats and aid in the restoration of stream and floodplain function and processes. American beavers (Castor canadensis) occupy a wide variety of aquatic habitats; however, their ability to build dams, the agent of stream and floodplain change, is constrained in large part by three physical variables—local vegetation, topography, and hydrology.
These three physical variables are combined in the Beaver Restoration Assessment Tool (BRAT), a geographic information system-based utility that uses a Fuzzy Inference System (FIS) to estimate the capacity of each reach within a stream network to support beaver dams. In this study, version 1.0 of BRAT was adapted and applied to the entire perennial stream network of Tualatin River Basin in northwestern Oregon. Beaver-dam locations in the Tualatin River Basin were compiled to (1) define the distribution of dams in the basin during 2013–16 and (2) provide necessary data for calibrating and validating BRAT predictions. BRAT was calibrated to the current known distribution of dams, as compiled in the inventory. The input FIS equations of the original BRAT model were adjusted to account for local topographic conditions; specifically, the low gradient of many streams in the basin, although subsequent updates to BRAT may obviate the need for these changes.
Results from this modified BRAT model reasonably simulated the dam inventory. Results show that beavers can currently build the greatest density of dams, defined as number of dams per kilometer of stream, in the higher-gradient forested streams of the basin, whereas they can build the fewest number of dams per kilometer in urban streams along the lower-gradient valley floor. Estimated dam density was generally 5-15 dams per kilometer (km) for forested streams and 2-4 dams/km for urban streams. Improving riparian vegetation along urban streams may allow beavers to build on average four additional dams per kilometer compared to current conditions. Results from this study may help inform local stream and stormwater management by (1) identifying stream reaches with the most potential to support beaver dams, (2) determining the likely factors limiting potential for dam building, and (3) identifying potential areas where dam building may affect human infrastructure.
Introduction
The role of American beavers (Castor canadensis) and their dams has long been recognized in shaping aquatic and riparian habitats and stream processes (Pollock and others, 1995, 2017). Beavers and their dams can greatly influence aquatic and terrestrial ecosystems (Wright and others, 2002), including increasing channel and thermal heterogeneity (Majerova and others, 2015; Stout and others, 2017) and improving fish habitat (Bouwes and others, 2016). Partly because of these potential benefits, activities encouraging beavers to re-occupy streams have become more frequent in the past decade (Pilliod and others, 2018) and are an increasingly common habitat restoration approach in the Pacific Northwest (Pollock and others, 2017). As the interest in using beavers to aid in stream restoration has increased, the need to determine where and how many beaver dams can be built along a stream network has increased (Pollock and others, 2017). This information is necessary to (1) prioritize locations of complimentary habitat restoration actions (such as riparian plantings) to support beaver-dam building, (2) identify suitable habitat restoration approaches for reaches unlikely to support dam building by beavers, (3) minimize potential conflicts between landowners and beavers, and (4) provide a context for how the local effects of beaver dams may scale to the broader basin.
Locations and number of beaver dams per length of stream (or dam density) can be counted directly with field surveys and from aerial imagery or estimated using modeling techniques. Counting dams provides an understanding of where dams are and are not located, but exhaustive on-the-ground surveys are impractical at large scales. Identifying dams from aerial imagery is ineffective in areas with dense coniferous and deciduous forests, which can obscure beaver dams beneath the forest canopy. Modeling where and how many dams beavers might build based on predictor variables allows for a basin-scale summary of the potential density of dams, but this modeling comes with inherent uncertainties that can be introduced by using algorithms and coarse datasets that attempt to predict the complex behaviors of beavers.
Habitat Suitability Indices (HSIs), such as the early beaver HSI by Allen (1983), are common approaches to modeling ecological habitats; they rely on functions quantifying a range of suitability (ranging from 0 to 1) for individual habitat variables that are then aggregated into a composite score for habitat suitability. However, HSI models do not account for interactions among habitat requirements inherent in ecosystems (Baldwin, 2013; Railsback, 2016; Macfarlane and others, 2017), which can be important in identifying where beavers may build dams. For example, dams built with predominantly woody material often are larger, more robust, and more likely to persist through high streamflows, compared to beaver dams that are built with only forbs and grasses. Thus, dam resiliency will vary greatly in two reaches with the same stream power but different local vegetation and building materials. HSI models, however, can only represent these variables individually and cannot account for how one variable affects the response of another.
More recently, Fuzzy Inference System (FIS) models, such as the Beaver Restoration Assessment Tool (BRAT; Macfarlane and others, 2017), allow for interaction between variables, and therefore can provide an improved approach to estimating beaver-dam habitat compared to HSI models (Jorde and others, 2000). Furthermore, FIS models acknowledge the inherent uncertainty of input variables and metrics by allowing partial membership in multiple categories. The BRAT accounts for interactions between physical habitat variables relevant to dam building and persistence of dams. The BRAT estimates the number of current and potential beaver dam density (dams per kilometer of stream length) at the reach scale.
The BRAT model was developed originally for the arid and mountainous region of northern Utah where streams have relatively steep channel gradients and hydrographs that are strongly influenced by snowmelt in the spring and summer. For example, the average gradient of the Bear River Basin, the largest tributary to the Great Salt Lake that was assessed with the original BRAT, is 16.8 percent (U.S. Geological Survey, 1999). Such conditions differ considerably from those in the temperate Tualatin River Basin of northwestern Oregon, where the average gradient is 7.7 percent (U.S. Geological Survey, 1999). Streams are steep in the headwaters of the Tualatin River Basin, but much flatter on the valley floor, and hydrographs indicate that streamflow is strongly influenced by winter rainfall. Because of these low gradients, stream power is pervasively low in the Tualatin River Basin compared to Bear River Basin streams modeled by the original BRAT, despite Tualatin River Basin streams typically having higher streamflow (Ries and others, 2017). Vegetation and land use also vary between the two basins. The riparian vegetation of the Bear River Basin consists largely of willows, cottonwoods, and aspen, with relatively sparse urban development, whereas the Tualatin River Basin contains dense coniferous and deciduous forests, grasses, and higher-density urban areas compared to the Bear River Basin. Acknowledging these fundamental differences in the two study areas, this study first assessed the viability of applying version 1.0 of the BRAT to the streams of the Tualatin River Basin and then made strategic adjustments to estimate current and potential beaver-dam densities.
Purpose and Scope
The goal of this study was to assess the existing (2017) and potential density of beaver dams along the mapped stream network of the Tualatin River Basin (fig. 1). To meet that goal, a beaver dam geodatabase for the Tualatin River Basin was created by compiling existing information from multiple sources and by surveying beaver dams along select tributaries in the field. The original BRAT was adapted to reflect the important physical constraints on beaver-dam building in the study basin; this modified version was then used to estimate the current and potential dam density along the stream network of the Tualatin River Basin. The modified BRAT results were validated through a comparison with the locations of dams in the beaver dam geodatabase. The study focused on accurately simulating the current and potential density of beaver dams throughout the stream network, then examining differences between the modified BRAT results and geodatabase results across the Tualatin River Basin, with an emphasis on urban streams and the relative importance and limitations of the physical factors. The purpose of this report is to document and describe the results of this study, document the FIS modifications in the application of the modified BRAT to analyze the Tualatin River Basin, and highlight implications for management and habitat restoration.
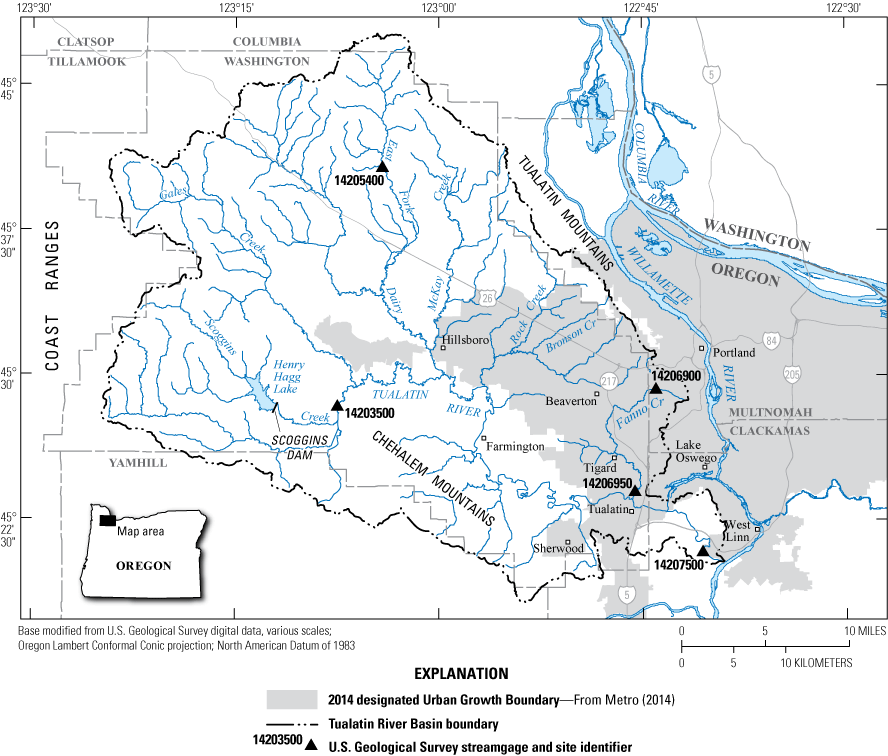
Tualatin River Basin and study extent in northwestern Oregon.
Study Area
This study focused on the stream network of the Tualatin River Basin in northwestern Oregon (fig. 1). The Tualatin River originates in the densely forested Coast Ranges and flows eastward toward the City of Tualatin. As the river exits the Coast Ranges, it flows through a broad, flat valley that underlain primarily by fine-grained sediments deposited during the Missoula Floods of the late Pleistocene (O’Connor and others, 2001), which are largely responsible for the low-gradient nature of streams. Land cover varies from predominantly forests in the headwaters to agriculture, suburban, and urban land use on the valley floor. The Urban Growth Boundary (UGB; fig. 1) surrounds most of the urban areas in the lower valley and is home to about 600,000 people (U.S. Census Bureau, 2018). The UGB is a land-use zoning classification that helps dictate the density of housing, commercial, and industrial development, and typically is surrounded by rural land.
The basin averages 43 inches of precipitation a year, most of which falls from October to May (Franczyk and Chang, 2009; Jung and Chang, 2012, respectively). This precipitation pattern results in high winter streamflows and late summer base flows. Most streams throughout the Tualatin River Basin are unregulated; however, Scoggins Dam impounds Scoggins Creek to create Henry Hagg Lake, a reservoir with a volume of 7.39×10⁷ cubic meters. Scoggins Dam reduces flood risk in the winter by impounding high streamflows, allowing this water to be released later in the summer. As a result, downstream streamflows on Scoggins Creek and the Tualatin River are lower in the winter and higher in the summer than they would be in an unregulated system. Many water withdrawals occur throughout the basin, varying in size from small seasonal withdrawals to large municipal withdrawals. Overall, these withdrawals reduce downstream streamflows; however, the magnitude of this change was not assessed in this study.
Methods
The BRAT assumes that the location and frequency of beaver dams along a stream network can be predicted using a combination of physical variables describing hydrologic, topographic, and vegetative conditions. The resulting estimates then can be compared to field observations of beaver-dam presence and spatial density of dams to aid in calibrating and validating model performance.
Beaver-Dam and Activity Inventory
Information on the locations of beaver dams in the Tualatin River Basin was gathered by consulting with and compiling existing data from the following 13 organizations:
-
• City of Portland Bureau of Environmental Services,
-
• Tualatin River Watershed Council,
-
• Tualatin Riverkeepers,
-
• Tualatin Hills Park and Recreation District,
-
• The Wetlands Conservancy,
-
• Clean Water Services,
-
• Bio-Surveys, LLC,
-
• Tigard Public Works,
-
• U.S. Department of Agriculture,
-
• Portland State University,
-
• Portland Parks and Recreation,
-
• Bonneville Environmental Foundation, and
-
• U.S. Fish and Wildlife Service.
Where the exact location of dams often was unknown, the general stream reach of beaver activity, including the locations of beaver chews and lodges, was documented. The compiled data also included the date on which the dam or activity was noted, the type of dam, and nearby potential conflicts with human infrastructure (table 1).
Table 1.
Additional information documented during the compilation of existing information about beaver dam locations and activity in the Tualatin River Basin, northwestern Oregon (Smith, 2017).The compiled information was supplemented with surveys of two Tualatin River tributaries (Fanno and Rock Creeks) within the UGB to improve the accuracy and completeness of beaver-dam location data in selected urban streams. Field-surveyed stream reaches were selected based on the BRAT model capacity estimates and physical stream access. These surveys were accomplished by walking the length of identified stream reaches, where possible, and documenting the locations and characteristics of beaver dams. In all, about 6 kilometers (km) of stream were surveyed by the U.S. Geological Survey (USGS) in 2016.
BRAT Inputs, Calibration, and Validation
The BRAT version 1.0 model estimates the beaver-dam capacity of a given stream reach by combining vegetation, topographic, and hydrologic data in a FIS (Macfarlane and others, 2017). For a given reach within the model, topographic and hydrologic data are combined to estimate stream power, which is used to determine the likelihood of successful dam building and dam survival, whereas the vegetation data are used to indicate the availability of food and dam-building materials, which also influence the ability and extent of dam building. A detailed description of the BRAT model (which, like this analysis, leveraged Matlab for FIS analysis) is available in Macfarlane and others (2017).
Stream-Power Inputs
The BRAT model uses stream power as a primary indicator of beaver-dam stability (Macfarlane and others, 2017). As stream power increases, beavers have greater difficulty building dams, and dams that are built are more likely to be destroyed during high streamflows. The BRAT evaluates the relation between stream power and dam resiliency by determining if (1) a stream reach has perennial streamflow, (2) stream power is sufficiently low during low streamflows for dams to be built, and (3) stream power during high streamflows is likely to cause an existing dam to be breached or “blown out.” Breaching occurs when a dam is damaged by high streamflows and pieces of the dam are removed and carried downstream. Blowouts occur when an entire dam fails, and no structure remains after the high streamflows subside.
To derive stream power along the stream network for low and high streamflows, the stream network from the USGS National Hydrography database (U.S. Geological Survey, 2014) was filtered to include only perennial streams. These perennial streams were delineated into 300-meter (m) reaches. For each reach, stream slope and discharge were calculated at base flow (a low-streamflow indicator) and a 0.5 annual exceedance probability (AEP, also known as a 2-year recurrence interval streamflow—a high-streamflow indicator). Reach slope was calculated by subtracting the lowest elevation along each 300-m reach from the highest elevation and dividing by reach length. The base-streamflow (95th-percentile exceedance streamflow) and high-streamflow (2-year recurrence interval streamflow) statistics for each reach were estimated using equation 1 from Risley and others (2008) and equation 2 from Cooper (2005), respectively, and inputs from USGS StreamStats (Ries and others, 2017; U.S. Geological Survey, 2019), as follows:
whereQ95
is the 95th-percentile exceedance streamflow in cubic feet per second,
DA
is the drainage area in square miles,
P
is the mean annual precipitation in inches per year, and
ANT
is the annual minimum air temperature in degrees Celsius (Risley and others, 2008).
Q2
is the 2-year recurrence interval streamflow in cubic feet per second,
DA
is the drainage area in square miles,
S
is the basin slope in degrees, and
P24
is the 2-year, 24-hour precipitation intensity in inches (Cooper, 2005).
The USGS has developed equations to estimate streamflow statistics at ungaged locations on unregulated streams for most of the United States; however, the streamflow statistics computed in each state vary. Macfarlane and others (2017) used the 80th-percentile exceedance streamflow during August to calculate base-flow stream power in the original BRAT model. No equation for that specific metric has been developed for Oregon, so the annual 95th-percentile exceedance streamflow was used instead as a similar base-flow metric. To ensure that the annual 95th-percentile exceedance streamflows provided base-flow information that was comparable to the 80th-percentile exceedance streamflows in August, these statistics were compared at USGS streamgages in the Tualatin River Basin. The resulting discharges were generally within 10 percent of gaged streamflow.
After the base-flow and high-streamflow discharge statistics were calculated for each 300-m reach in the stream network, stream power at low and high streamflows for each reach was calculated using:
whereSP
is the stream power in watts,
ρ
is the density of water in kilograms per cubic meter (assumed to be 1 gram per milliliter),
g
is the acceleration due to gravity in meters per second squared (assumed to be 9.8 meters per second squared),
Q
is the base-flow or high-flow stream discharge statistic in cubic meters per second, and
S
is the stream (reach) slope in degrees.
Equations to estimate streamflow were developed assuming an unregulated system. However, one major reservoir and several smaller reservoirs in the Tualatin River Basin violate this assumption on select reaches. As a result of these reservoirs, downstream reaches typically have higher base flows and lower peak streamflows than what is predicted using the regional streamflow equations. Furthermore, certain streamflow metrics have limits on the size of the drainage basin for which they are accurate. For example, Q95 is limited to basins with drainage areas of at least 9.3 square kilometers (km2), although, in this study, we have extrapolated to smaller basins. Despite these limitations, regulated stream reaches and reaches with drainage areas outside specified thresholds were included in the analysis to enable a network-scale analysis of beaver-dam capacity. However, estimates of dam density in these reaches have greater uncertainty than reaches that fulfill the equation assumptions.
Vegetation Inputs
The BRAT model uses two vegetation metrics to assess the capacity of stream networks to support beaver-dam building. These metrics are the dominant vegetation type within 30-m and 100-m riparian zones along a stream reach, which are computed for each of the modeled reaches along the stream network (Macfarlane and others, 2017). The 30-m buffer reflects the preferred beaver foraging area and is the dominant vegetation input to the model. However, beavers forage beyond 30 m from the stream if nearby vegetation is insufficient, and thus the 100-m buffer encompasses this less-preferred, but still-usable vegetation.
Many vegetation datasets could be used as inputs for the BRAT. For this study, as well as Macfarlane and others (2017), LANDFIRE vegetation datasets (U.S. Geological Survey and U.S. Forest Service, 2014) were used to develop vegetation classes within the 30-m and 100-m buffers for “current conditions” (as of 2014) and “vegetation potential.” The LANDFIRE datasets estimate current land cover and the biophysical vegetation potential at a 30-m pixel resolution. LANDFIRE data are produced by combining LANDSAT satellite spectral properties with local and regional biophysical variables, such as elevation and aspect, to predict the vegetation within each pixel. The current land-cover dataset estimates the dominant vegetation at each pixel, whereas the vegetation-potential dataset estimates what the vegetation cover of a location would be in an unaltered state. The hydrologic and topographic inputs to the BRAT were combined with the current and potential vegetation coverages to estimate the current and potential capacity of the stream network to support beaver dams. Vegetation classes for current and potential conditions were assigned dam-suitability scores from 0 to 4, using criteria from Macfarlane and others (2017). Vegetation scores from the 30-m and 100-m buffers were then combined in a FIS to estimate maximum dam density based solely on vegetation availability.
Fuzzy Inference System Overview, Calibration, and Validation
The BRAT includes two nested FIS models and associated algorithms developed and calibrated for streams in northern Utah to combine disparate variables of vegetation type and stream power to estimate maximum (potential) beaver-dam density along a stream network (Macfarlane and others, 2017). The first FIS model classifies the ability of nearby vegetation to support dams, and the second FIS model combines the vegetation FIS results with stream-power variables to estimate total stream-reach dam capacity, or an estimated number of beaver dams that a given reach can support. Recognizing the multiple sources of uncertainty, Macfarlane and others (2017) suggested that estimates of stream-reach dam capacity were more appropriately combined in the following ranges: “None” (0 dams), “Rare” (1 dam per kilometer [dam/km]), “Occasional” (2–4 dams/km), “Frequent” (5–15 dams/km), and “Pervasive” (16–29 dams/km).
The FIS models in the BRAT allow users to address uncertainty in input variables and interactions among input variables (Jorde and others, 2000)—two challenges relevant for estimating the capacity of stream networks to support beaver dams. For example, the FIS models allow for continuous variables (such as stream power) to be classified in partial membership functions or allow the same input to have membership in two categories at once, thus recognizing the inherent uncertainty (or “fuzzy-ness)” in classifying habitat suitability. The determination of the exact stream power required to breach a beaver dam is difficult and highly uncertain because of the many factors involved in dam stability. To address this challenge, the FIS allows the user to identify a lower threshold of stream power that might breach a dam and an upper threshold of stream power that likely would result in a dam breach (fig. 2), resulting in a classification of streamflows that are “likely” or “unlikely” to breach a dam. These limits can be developed through experiments, observations, or expert opinion, and are used as a method of model calibration. Once these ranges are developed, actual input streamflows then are assigned a membership, partial or full, in their respective categories (fig. 2).
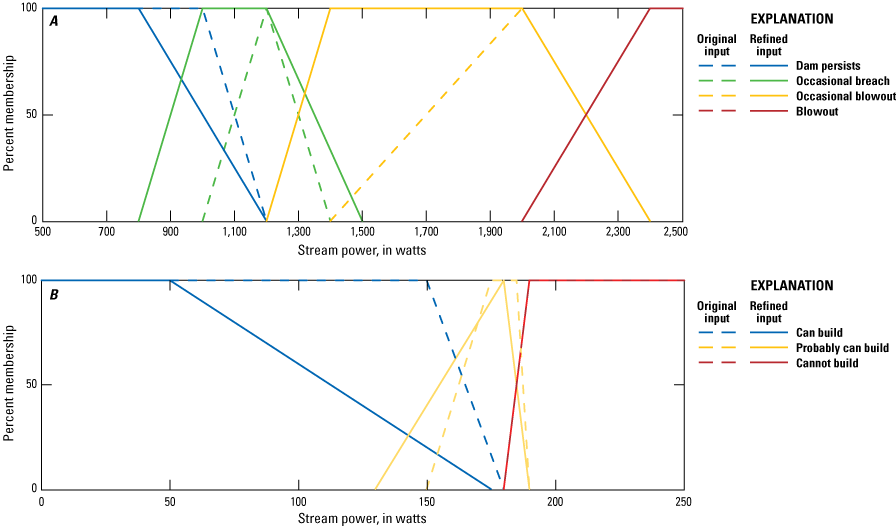
Fuzzy Inference System membership classification for the ability of beavers to build dams at low streamflow (A) and the likelihood a dam persists at high streamflow (B). Results from the original Beaver Restoration Assessment Tool (BRAT) developed for Utah is shown as dashed lines, whereas results from the modified BRAT for use in the Tualatin River Basin is shown as solid lines.
The FIS allows for interactions between variables following an “if-then” style rule table. These rule tables combine fuzzy input values, described in the preceding paragraph, of stream power and vegetation, and apply an if-or-then operator to generate a “fuzzy” output. This fuzzy output subsequently is “defuzzified” into a “crisp” value of the possible number of dams using a centroid Mirandi approach, as outlined by Macfarlane and others (2017). Through this method, the FIS provides a transparent set of equations describing how input variables are combined to infer the physical conditions that support beaver dams.
Initial application of the FIS algorithms from the BRAT to the Tualatin River Basin indicated that the model did not accurately simulate beaver-dam capacity for streams in the Tualatin River Basin. The BRAT model classified the Tualatin River and its large tributaries as suitable for dam building based on their low stream power, despite the wide and deep channels that would not likely support beaver dams. This discrepancy is attributable to how stream power is calculated (the product of discharge and slope) without inclusion of explicit terms for channel width and depth. Because of the low-gradient valley in which it is situated, the Tualatin River is a deeper and wider river compared to a river with similar peak streamflows in a steeper physiographic setting. Thus, although the total stream power of the Tualatin River may be low enough to accommodate dams, the river’s channel geometry likely locally limits dam building. To account for these differences in stream gradient and depth inherent in streams of the Tualatin River Basin, the sensitivity of the stream-power FIS equations was adjusted using an iterative process. This process decreased the frequency of predicted dams at lower stream power until a more-consistent pattern was achieved for the larger and deeper valley-bottom streams in the Tualatin River Basin compared to those used to develop the original BRAT model (fig. 2).
Results from the modified BRAT were compared with locations of known beaver dams from the beaver-dam inventory to assess how well the model simulated observed conditions. Stream-power FIS equations were adjusted and the model was rerun iteratively to improve model fit. No specific accuracy threshold was set to determine an acceptable fit, but each model run was compared to dam-inventory data for the ability to capture spatial trends in dam building for reaches with known beaver dams while also predicting the absence of dams in reaches where dam building was not possible.
Results and Discussion
Documentation of Recent Beaver-Dam Building in the Tualatin River
A total of 435 beaver dams and 100 reaches of beaver activity were identified in the inventory of known beaver dams and activity in the Tualatin River Basin, using data collected during 2013–16 (fig. 3; Smith, 2017). Beaver dams and activity (such as chewed trees and limbs or bank dens) were mostly noted along tributaries to the Tualatin River, with minimal beaver activity documented along the Tualatin River; however, it is unknown if this is because there are minimal beavers present along the Tualatin River, or if they have not been documented. A high density of dams inventoried in headwater streams in the northwestern part of the basin (for example, where reaches can contain 10 or more dams per stream kilometer) is a result of extensive field sampling and indicates that those streams provide suitable habitat for beavers. Headwater streams in other parts of the basin provide similar habitat, but no data exist to corroborate the presence of beaver dams. Farther downstream, in the urbanized basin, 79 dams were identified, indicating the ability of beavers to build dams in the urban streams of the basin.
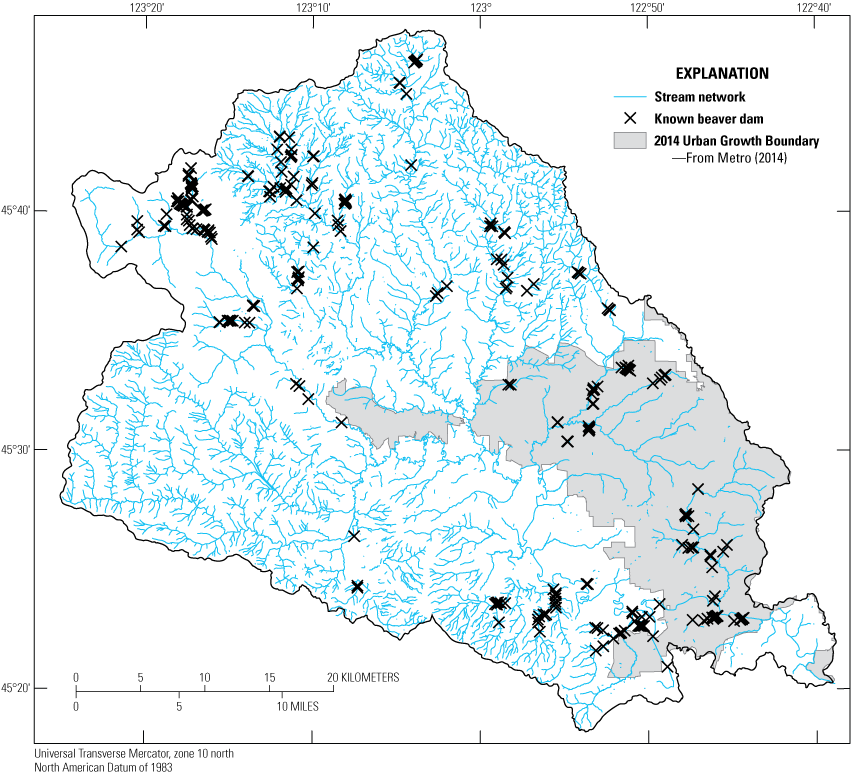
Beaver dams in the Tualatin River Basin, northwestern Oregon, 2013–16, as documented by Smith (2017). Data were collected during 2013–16 by various organizations listed in section, “Beaver-Dam and Activity Inventory“ and compiled by the U.S. Geological Survey.
Although substantial effort was made to gather all available information for the inventory, many reaches have no data available. The inventory of beaver dams (fig. 3) shows only where beaver dams were observed. The absence of beaver dams in many areas may indicate that no inventory was conducted in those areas. The dams inventoried in figure 3 are not permanent and some may no longer be present because of high-streamflow conditions, actions by resource managers, or natural abandonment.
Current and Potential Capacity of Streams in the Tualatin River Basin to Support Beaver Dams
Current Capacity of the Stream Network to Support Beaver Dams
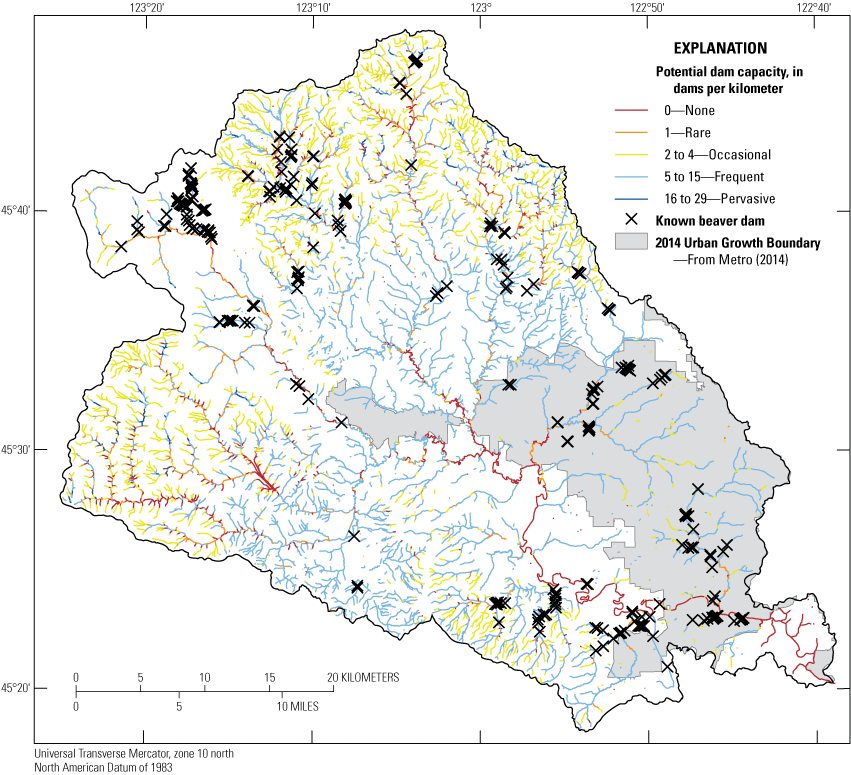
The predicted distribution of beaver-dam capacity under current conditions in the modified BRAT is determined by combining sub-model results from the stream-power and vegetation results, and largely follows the same patterns in the modified BRAT sub-model predictions of dam density derived solely from vegetation. The highest dam density was predicted for the upper, mountainous reaches of the basin where most streams had results in the “Frequent” dam-building category (5–15 dams/km). Many stream reaches within the UGB were classified as “Occasional,” or capable of supporting 2–4 dams/km (fig. 4). These urban reaches often were interspersed with reaches classified as “Rare,” or capable of supporting only 1 dam/km and reaches classified as “Frequent” dam capacity. The most-downstream reaches of the large, urbanized sub-basins generally showed a decrease in dam capacity because an increase in discharge (and thus stream power) in those reaches is more likely to destroy dams at high streamflows. All BRAT outputs can be accessed in the accompanying data release, White (2025).
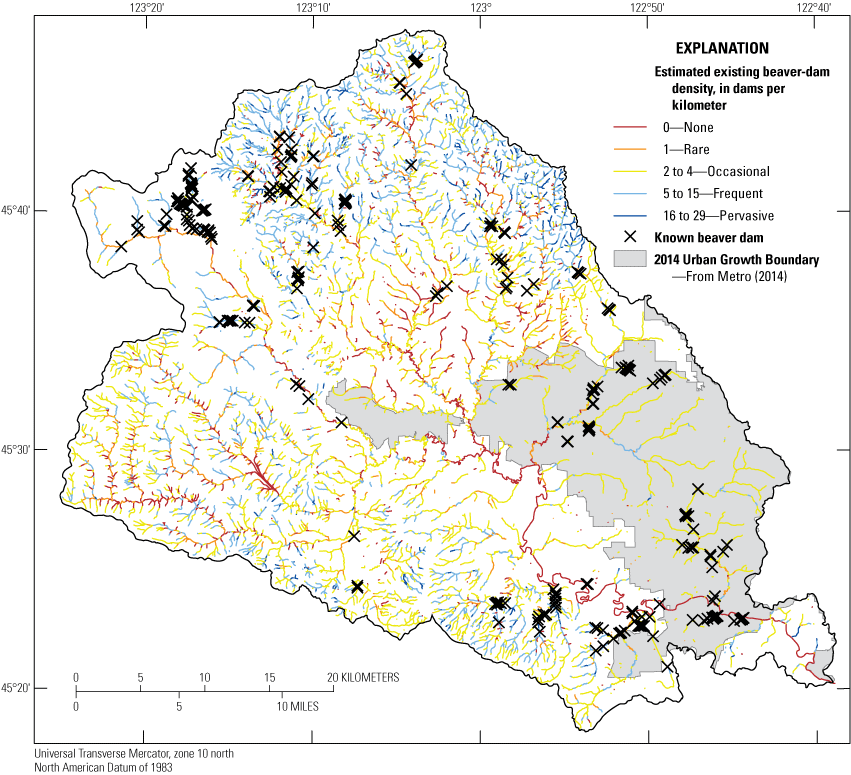
Estimated existing beaver-dam density under current conditions as determined with the modified Beaver Restoration Assessment Tool, throughout the Tualatin River Basin, northwestern Oregon.
A comparison of the vegetation-only FIS results and the vegetation-and-stream-power FIS results indicates that an absence of suitable vegetation along urban streams is the primary reason that stream reaches within the UGB have fewer predicted beaver dams than reaches outside urban areas. This can be seen by noting the difference between the mean dams per kilometer with the vegetation-only FIS in the potential-condition results. The differences of 0.8 dams/km and 1.7 dams/km inside and outside the UGB, respectively, indicate that this is the potential loss of capacity owing to inclusion of stream power in capacity estimates. Results for the vegetation-only FIS for current conditions show that streams within the UGB could support on average as many as 3 dams/km, whereas streams outside the UGB could support more than 6 dams/km (table 2). Furthermore, stream power appears to have a stronger negative influence on dam building outside the UGB than within it, as evidenced by the larger difference in dam densities from the vegetation-only FIS and the combined FIS. Under the combined FIS model, the areas within the UGB can support a mean of 2.6 dams/km, whereas areas outside the UGB can support a mean of 4.7 dams/km.
Table 2.
Summary statistics of predictions of beaver-dam capacity for the modified Beaver Restoration Assessment Tool model using current and potential vegetation conditions for the Tualatin River Basin, northwestern Oregon.[Abbreviations: FIS, Fuzzy Inference System; UGB, Urban Growth Boundary; km, kilometer; dams/km, dams per kilometer]
Potential Capacity of the Stream Network to Support Beaver Dams
The modified BRAT predictions of beaver-dam capacity using inputs from the LANDFIRE vegetation potential condition showed that most stream reaches in the basin—other than the largest, deepest, and steepest reaches—have expansive capacity for dam building, potentially supporting on average more than 6 dams/km. This prediction suggests that streams in the Tualatin River Basin could support extensive beaver populations (fig. 5) and is consistent with historical accounts of large beaver populations in the region (Cass and Miner, 1993). With the vegetation potential condition, urban and rural streams have similar dam capacity, which indicates no biophysical differences in vegetation potential for stream reaches within and outside the UGB (table 2). Similar values of 7.4 dams/km from within the UGB and 7.6 dams/km outside the UGB further highlight that existing vegetation conditions are the dominant factor that limits additional beaver-dam building in streams within the UGB.
Potential beaver-dam capacity with potential vegetation conditions, as determined with the modified Beaver Restoration Assessment Tool, throughout the Tualatin River Basin, northwestern Oregon.
Comparison of the BRAT Results with the Beaver-Dam Inventory
Results from the beaver-dam inventory were compared to the dam capacity predictions of the modified BRAT model for the Tualatin River Basin to evaluate the overall accuracy of the model and its ability to predict basin wide patterns of dam capacity (fig. 6). Only reaches with known beaver dams identified in the inventory were used for comparison; thus, areas of “beaver activity” were omitted, as beaver activity does not necessarily correlate with nearby dams. To account for the clustered nature of dam building by beaver family units, validation was assessed at a “beaver dam complex” (complex) scale. Complexes were defined as segments of stream with dams within 1 km of each other. Spatial gaps of 1 km or greater without dams ended the defined complex at the last dam. Thus, some complexes extended for several kilometers, whereas others consisted of a single dam. However, the modified BRAT results were summed along each reach, totaling the precise number of estimated dams and a range of expected dams following guidance categories from Macfarlane and others (2017). Although the BRAT model estimates precise dam abundance, reporting results with categories of “None,” “Rare,” “Occasional,” “Frequent,” and “Pervasive” help in the placement of estimates into broader ranges and the acknowledgment of uncertainty in the model results.
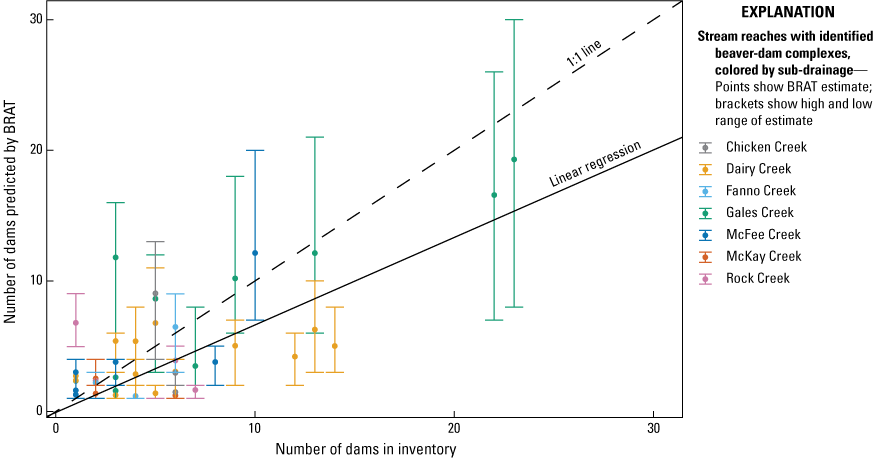
Number of dams estimated by the modified Beaver Restoration Assessment Tool (BRAT) model and the number of dams counted in the beaver inventory for stream reaches with identified beaver-dam complexes in the Tualatin River Basin, northwestern Oregon.
It is unknown whether reaches identified without known dams indicate the absence of dams or the absence of data on dam presence. Therefore, areas where no beaver dams were identified in the inventory were omitted from the calibration analysis. Because of this omission and the absence of data, the evaluation of reaches where the BRAT has predicted that dams cannot be built is not possible; therefore, the BRAT possibly overpredicts dam capacity by predicting capacity where there is none. However, because the BRAT predicts dam capacity at each reach, and it is unknown whether observed dam complexes are at capacity, the BRAT also possibly underpredicts capacity, as these complexes may not be at current capacity because of factors such as absence of beaver population to enable colonization. Obtaining additional data on dam presence or absence would help reduce uncertainty to the BRAT capacity findings.
Overall, the modified BRAT model simulates beaver-dam capacity reasonably well compared to where beaver dams have been located on the landscape (table 3), particularly when including the binned ranges of results as suggested by Macfarlane and others (2017). A best-fit linear regression shows that the model underpredicts capacity with a slope of 0.67; however, the y-intercept of 0.07 suggests that the model simulates low-capacity reaches well.
Table 3.
Goodness-of-fit statistics comparing modeled and observed dam abundance, Tualatin River Basin, northwestern Oregon.[Abbreviation: dams/km, dams per kilometer]
To assess if land-use type affected the ability of the modified BRAT to simulate observed beaver-dam occurrence, residuals from within and outside the UGB were compared. Overall, model accuracy was not strongly affected by land-use type, as shown by comparing residuals within and outside the UGB (fig. 7). Residuals highlight that the model tends to underpredict the observed number of dams; however, the magnitude of error is relatively low.
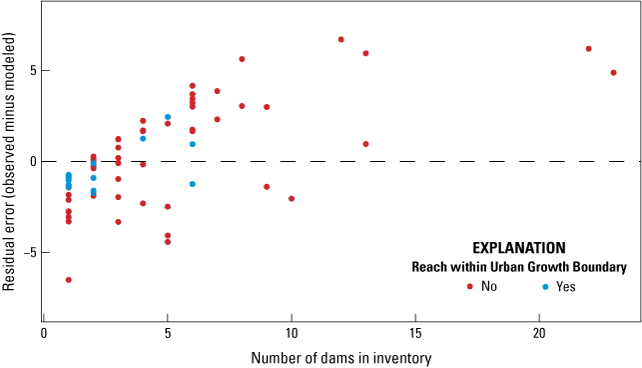
Residual graph showing magnitude of difference between the number of modeled and observed dams, Tualatin River Basin, northwestern Oregon.
Factors Influencing Beaver-Dam Densities
Results of the modified BRAT model are useful for estimating the numbers of current and potential dams that beavers could build along the Tualatin River Basin stream network. These results also are helpful in identifying the factors likely to limit dam building by beavers throughout the basin.
Vegetation
The modified BRAT model predicts beaver-dam capacity in two steps, with intermediate results solely derived from the vegetation data prior to combining results from vegetation and stream-power scores. Throughout the basin, vegetation within the riparian buffers varies greatly, with predominantly forested headwaters, agriculture and mixed vegetation in the middle valley, and a mix of human development and vegetation in urban areas of the valley floor. The transition from the forested uplands (Coast Ranges to the west, Chehalem Mountains to the south, and Tualatin Mountains to the north) to the agricultural valley is evident in the model results (fig. 8) as a stark reduction in suitable vegetation and associated potential dam density, as vegetation along the valley bottom streams typically is restricted to a narrow riparian corridor or no riparian vegetation is present at all. Because the modified BRAT classifies agricultural land use as unsuitable for dam building, this reduction of dam density in agricultural areas is not an unexpected result; however, no observed dam data in these areas were available to validate this assumption. Vegetation results are controlled by the type of vegetation within the 30- and 100-m buffers. Although the developed areas may have a narrow corridor of suitable vegetation, the 100-m “upland” areas in the urbanized reaches provide no suitable vegetation, resulting in much lower vegetation potential in the urbanized areas compared to non-urbanized areas. The LANDFIRE vegetation data are based on classifications of vegetation within 30-m pixels. Although a dataset with 30-m resolution may not adequately classify vegetation in narrow riparian corridors, preliminary comparisons of the modified BRAT results with the 30-m vegetation data and an unpublished 5-m vegetation dataset available for a part of the basin (J. Kagan, Oregon State University, written commun., 2017) did not indicate substantial improvements in model performance.
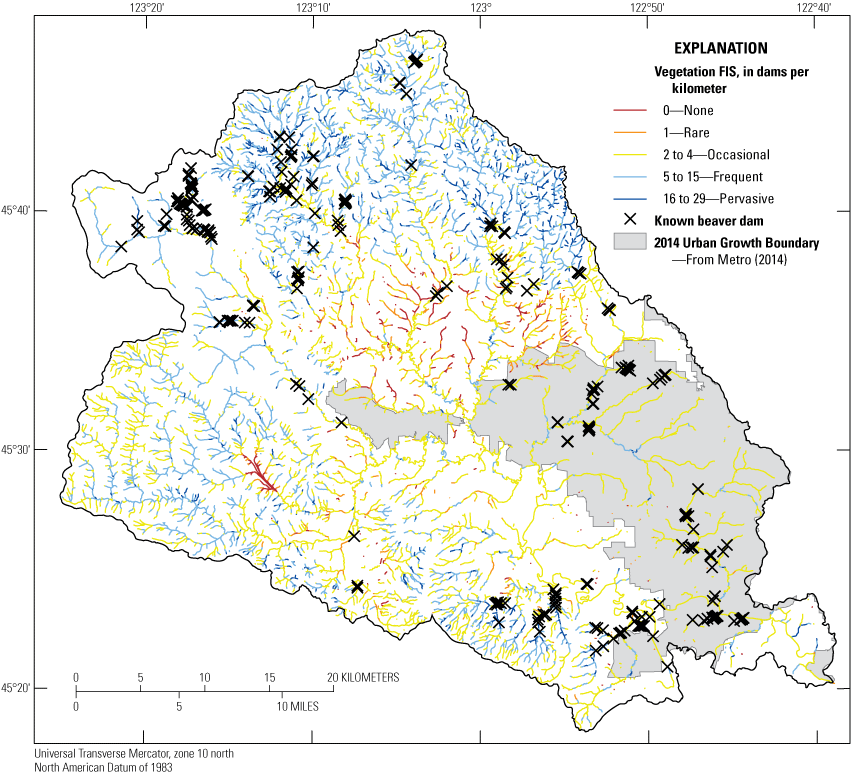
Modified Beaver Restoration Assessment Tool predictions of beaver-dam capacity, derived from the vegetation-only Fuzzy Inference System (FIS), in the Tualatin River Basin, northwestern Oregon.
Stream Power
Stream power during low streamflow is rarely the limiting factor for beaver-dam density in the Tualatin River Basin according to the modified BRAT capacity estimates because stream-channel gradients are low across most of the basin. The primary exception to this result is the reach of Tualatin River from its confluence with the Willamette River upstream past the confluence with Dairy Creek, where dam building during low streamflow is difficult because of a wide and deep channel. This result is consistent with field observations of no beaver dams and only the presence of beaver activity along selected stream banks in these reaches. Low- stream power does not reduce or inhibit dam building throughout most of the basin, including when the base-flow FIS functions were modified to exclude predictions of dam density at some low stream-power ranges.
High streamflow has a more limiting effect on dam building compared to low streamflow (fig. 9). These effects are most pronounced on large tributaries near their confluences with the Tualatin River and small streams in the upper reaches of the basin. The downstream ends of large tributaries (such as Fanno, Rock, and Dairy Creeks) possess sufficiently large high-streamflow stream power to result in occasional dam breaches or blowouts, thus decreasing predictions of dam persistence. Model results from the upper reaches of the basin indicate that some reaches probably are subjected to regular dam blowouts, primarily in third-order streams (Strahler, 1952) or higher, as well as areas of locally high stream gradient. Otherwise, beaver dams in most reaches of the Tualatin River Basin are predicted to be sufficiently resistant to breaches and blowouts at high streamflows.
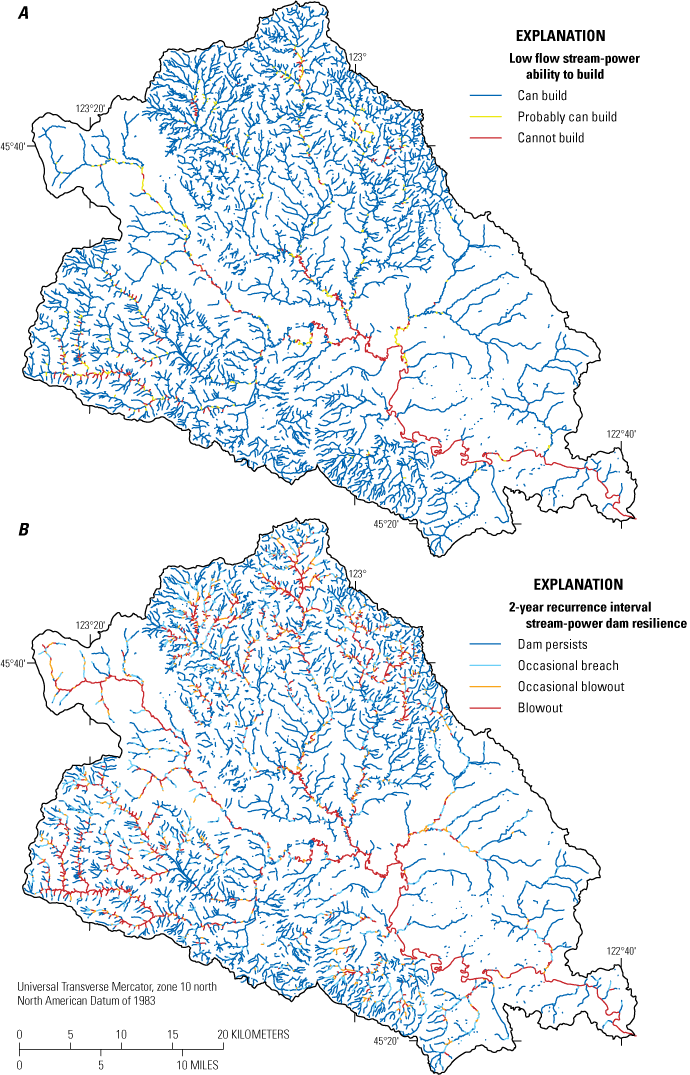
Maps of predictions of the modified Beaver Restoration Assessment Tool model showing results for two stream-power metrics on the predicted density and persistence of beaver dams at (A) base-streamflow and (B) under a 2-year recurrence interval streamflow, as applied to the Tualatin River Basin, northwestern Oregon.
The effects of stream power on modeled dam density are influenced by the low- and high-streamflow discharge statistics estimated using regional regression equations. To evaluate any potential bias introduced with the regional equations, streamflow statistics developed from the regional streamflow equations (and used in the BRAT computations) were compared to statistics of measured streamflows at USGS streamgages throughout the basin. Estimated and measured streamflows were similar at two Fanno Creek streamgages, but dissimilar for two streamgages on the Tualatin River (table 4). In Fanno Creek, an unregulated urban tributary to the Tualatin River, the base-flow and 2-year recurrence interval streamflows from the regional regression equations were similar to results calculated from the full period of measured streamflow at each streamgage. No effort was made to validate the National Hydrography Dataset filter of perennial streamflow. Thus, it is uncertain whether streams in the smallest drainages have perennial streamflow, or if there are additional upstream reaches that have perennial streamflow.
Table 4.
Comparison of modeled and measured streamflow statistics at selected sites in the Tualatin River Basin, northwestern Oregon.[Data from U.S. Geological Survey (2024). The 2-year recurrence interval represents a common high streamflow, and the annual 95th-percentile exceedance flow represents a low summer base-streamflow. USGS station ID: U.S. Geological Survey station identifier. Abbreviations: ft3/s, cubic feet per second; km2, square kilometers]
Streamflow statistics calculated with the regional regression equations for two streamflow-regulated sites on the Tualatin River differ from measured statistics, which is indicative of upstream streamflow management at Scoggins Dam, with higher base-streamflows and lower peak streamflows than those modeled assuming an unregulated system. Modeled high-streamflow statistics for the Tualatin River near Dilley and at West Linn are 71- and 48-percent lower, respectively, than those recorded during 1993–2018, a period reflecting modern streamflow management. During summer low streamflows, modeled 95th-percentile exceedance streamflows were 37- and 57-percent lower for the Tualatin River near Dilley and at West Linn, respectively, compared to statistics derived from the measured data. As a result of these discrepancies, base-flow stream power in the Tualatin River is higher than modeled in the BRAT because of upstream reservoir releases, potentially extending the reaches modeled as “Cannot Build” farther upstream. Conversely, with the lower 2-year recurrence interval stream power, beaver dams may be more resilient to blowouts at high streamflows, and dams might persist farther downstream than modeled in the modified BRAT. Taken together, the potential loss of low-streamflow reaches and potential gain of high-streamflow reaches in the Tualatin River may cancel each other out, resulting in actual beaver dam-building conditions consistent with dam capacity estimates modeled in the modified BRAT. This possibility is supported by no known observations of beaver dams downstream from reservoirs in the Tualatin River. Overall, approximately 100 km of the Tualatin River are subject to this uncertainty out of the about 2,700 km of streams modeled in this study.
Within the UGB, many streams have the expected characteristics of urbanized streams, such as increased flashiness, higher peak streamflows, and lower base flows compared to non-urbanized areas (Sobieszczyk and others, 2018). Because this altered hydrology is a product of local conditions, such as impervious land cover, it is not accounted for in the regional streamflow regression models that rely on basin-scale characteristics such as precipitation and temperature. Modeled streamflow results at both USGS streamgages in the Fanno Creek drainage suggest strong agreement between measured and modeled streamflow at base flow (table 4). During high streamflows, the farthest downstream streamgage, Fanno Creek at Durham, shows close alignment of modeled and measured streamflow statistics—about a 1-percent difference. Upstream at 56th Avenue, modeled high streamflows in Fanno Creek are about 45-percent lower than high streamflows derived from measurements. This discrepancy likely is caused partly by large impervious surface areas and an urban infrastructure that routes stormwater quickly to the stream. About 36 percent of the Fanno Creek Basin is covered by impervious surfaces, compared to about 7 percent for the full Tualatin River Basin. The better agreement at the Durham site also may be attributable to the difference in drainage area—the Durham site has an upstream drainage area of 81.6 km2, whereas the streamgage at 56th Avenue has an upstream drainage area of only 6.1 km2. Urbanization is not accounted for in the regional streamflow equations, and likely will have a more pronounced effect in smaller drainages than in larger drainages. If this is the case, the modified BRAT results at locations in small, urbanized basins also may have higher peak streamflows, potentially limiting the number of dams that could be built in those reaches.
Constraints on Beaver-Dam Building and Beaver Dam Persistence
Urban development can restrict the width and quality of riparian corridors, which could affect the amount and suitability of vegetation for building beaver dams. Based solely on the vegetation FIS, the modified BRAT estimated a mean dam density of more than 6 dams/km (Frequent) in stream reaches outside the UGB (table 2; fig. 8), but only 3 dams/km (Occasional) in urban areas. Vegetation-only FIS results show consistently smaller amounts of suitable vegetation in stream reaches within the UGB compared to those outside. Suitable vegetation also is scarce in the riparian zones of agricultural streams of the valley bottom, thus limiting the building and persistence of beaver dams not only in urban areas, but also in most valley-bottom streams in the basin (fig. 8).
In addition to the factors explicitly considered in the modified BRAT (stream power, channel slope, and adjacent vegetation), additional biotic and abiotic factors can influence the abundance and persistence of beaver dams. Other potentially important factors include the presence of predators, water quality, competition from other beavers or other aquatic and terrestrial species, as well as management actions such as trapping, dam removal, and other deterrents to dam building. Evaluating the effect of these other factors on current dam distribution or model results was outside the scope of this study; however, given that the modified BRAT explains roughly one-half of the variance of observed beaver-dam density, some or all of these additional factors likely are influential.
Fragmented habitat was predicted by the modified BRAT results in urban streams of the Tualatin River Basin, but the effects of fragmented habitat on beaver populations and dams are unknown. Because beavers and are known to travel considerable distances to reach food and building materials, it is likely that the dam potential of each reach is affected by surrounding reach quality. For example, if a reach with high-quality habitat is adjacent to poor-quality habitat, the actual potential for dam density in the reach may be less than that predicted by the modified BRAT. Conversely, a reach identified as having low dam density may, in fact, support considerable beaver activity if beavers are able to access woody material in nearby reaches. The effect of adjacent reach quality is not considered in the modified BRAT, nor was it evaluated in this study. However, adjacent reach quality may be an important consideration for managers when considering the likelihood and frequency of density of dam building.
Implications for Habitat Restoration
Results from the modified BRAT can help inform beaver-related restoration strategies and beaver management. Results from the Tualatin River Basin suggest that vegetation type and abundance are usually the limiting physical factors for beaver-dam building. A comparison of estimated densities of dams under current and potential vegetation conditions can indicate areas that have the highest potential for increased numbers of dams (fig. 10). Current (2022) estimates of dam density in most reaches of the upper basin are similar to what that density would be under the vegetation-potential simulation; thus, little potential exists for additional dams in the upland part of the basin. However, reaches in the agricultural region of the valley bottom show a high restoration potential, where improvements to vegetation could increase dam density by as many as 15 dams/km. Results suggest that stream reaches within the UGB also have considerable potential increases, and most urban reaches are not at their full potential for supporting beaver dams. These results can help managers target reaches where increased dam building is possible and estimate the number of dams that might be built if vegetation were restored.
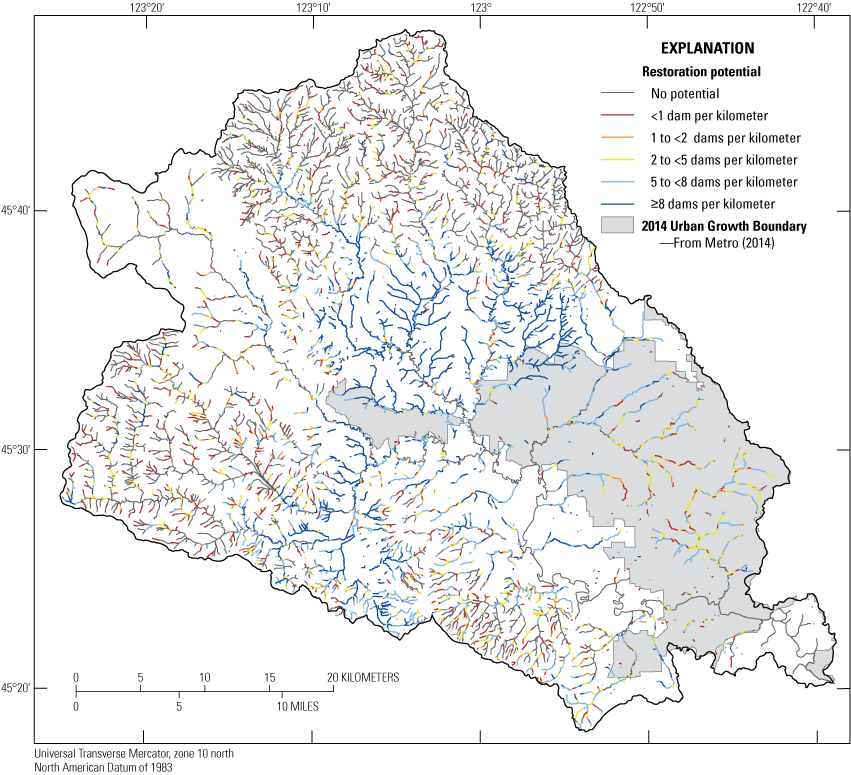
Potential increase in number of beaver dams per kilometer if existing vegetation were replaced by modeled vegetation potential for the Tualatin River Basin, northwestern Oregon.
Although vegetation is the dominant physical variable influencing beaver-dam capacity in the Tualatin River Basin, restoration efforts also can be informed by an analysis of stream power. Stream power is considerably more difficult to alter than riparian vegetation; therefore, reaches with prohibitively high stream power may not be good targets for beaver-related restoration. The modified BRAT can be used to identify these reaches and can be used to prioritize other types of restoration efforts that may be more applicable in these reaches. The pervasively low stream-power results also suggest that adding beaver-dam analogs or assisting dam establishment by installing wooden posts in the channel, both common approaches to encouraging beavers to build dams, may be less successful that planting vegetation.
Beaver dams have posed and continue to pose challenges in the Tualatin River Basin, such as property and infrastructure flooding and the unwanted felling of ornamental trees. Various methods are used to resolve these conflicts, including trapping/killing, pond water-level control devices, and beaver relocation. In addition to identifying where management actions might be used to increase the number of beaver dams, the modified BRAT results can be combined with data on adjacent land use and nearby infrastructure to identify stream reaches where challenges associated with beaver dams are likely. For example, reaches in public ownership with few bridges or culverts may be higher-priority restoration targets than reaches surrounded by private lands or those abutted by roads or culverts. Similarly, existing beaver populations likely are insufficient to use all available habitat, although no studies have confirmed this. However, as beaver populations increase, the modified BRAT results may help identify likely areas of colonization and dam building. Advanced identification of those reaches that have high dam-building potential but sensitive land use (such as residential or commercial land uses) can help managers and stakeholders prepare for or prevent beaver colonization.
Summary
Results from the modified Beaver Restoration Assessment Tool (BRAT) indicate there is ample habitat to support many beaver dams throughout the Tualatin River Basin of northwestern Oregon. The existing capacity of beaver dams in the basin is lower than its potential with restored vegetation. The modified BRAT results indicate that existing conditions support 2–4 fewer dams per stream kilometer than the stream network could support with restored vegetation. Urbanized stream reaches under existing conditions generally were predicted to have roughly one-half the dam capacity compared to reaches outside the Urban Growth Boundary (UGB). This finding primarily is attributable to lower vegetation availability or suitability within the UGB reaches compared to the reaches outside the UGB. Because of this absence of suitable vegetation, model results predicted that urban areas generally have the highest potential for restoration of beaver habitat; however, even with the existing vegetation distribution, considerable potential is available for beavers to build dams within the UGB.
Despite an incomplete tally of the number and location of beaver dams, model results show that the stream network in many parts of the basin, particularly with restored riparian vegetation, likely can support more dams than the current beaver population is able to build and maintain. Several factors may explain why some stream reaches have fewer dams than their predicted potential, such as slow recovery from historically low populations, predation (including trapping of nuisance beavers by humans), active deterrence by humans, insufficient or unsuitable riparian vegetation, or potential deleterious effects of poor water quality (if present).
Although the landscape and stream network have the capacity to support more beaver dams than currently are present, potential conflicts dictate that the modeled dam capacity likely is greater than the number of beaver dams that would occur in a highly managed urban stream system. Where such conflicts can be tolerated or managed, beaver dams can improve stream and floodplain habitat diversity while also modestly attenuating peak streamflows, trapping fine sediment, and creating a diversity of water quality conditions, thereby reducing some of the deleterious effects of urbanization on streams. The modified BRAT results may help balance these benefits against potential conflicts with local infrastructure by identifying the reaches having the highest potential to support dams, while also showing which reaches have little intrinsic ability to support dams.
References Cited
Allen, A., 1983, Habitat suitability index models—Beaver: U.S. Fish and Wildlife Service, Fort Collins, Colorado, accessed October 2018 at https://pubs.er.usgs.gov/publication/fwsobs82_10_30.
Bouwes, N., Weber, N., Jordan, C.E., Saunders, W.C., Tattam, I.A., Volk, C., Wheaton, J.M., and Pollock, M.M., 2016, Ecosystem experiment reveals benefits of natural and simulated beaver dams to a threatened population of steelhead (Oncorhynchus mykiss): Nature Scientific Reports, Report 6, article number 28581.
Cass, P.L., and Miner, J.R., 1993, The historical Tualatin River Basin: Corvallis, Oregon State University, Oregon Water Resources Research Institute, Tualatin River Basin Water Resources Management Report Number 7, 59 p., accessed July 2018, at https://ir.library.oregonstate.edu/concern/defaults/5q47rt00r.
Doyle, M.C., Smith, C.D., Jones, K.L., and Costello, A.E., 2025, Effects of beaver dams and ponds on the transport and deposition of suspended sediment in urban streams of the Tualatin River Basin, northwestern Oregon, chap. C of Jones, K.L., and Smith, C.D., eds., Beavers in the Tualatin River Basin, northwestern Oregon: U.S. Geological Survey Scientific Investigations Report 2025–5039–C, 41 p., https://doi.org/10.3133/sir20255039C.
Franczyk, J., and Chang, H., 2009, The effects of climate change and urbanization on the runoff of the Rock Creek Basin in the Portland metropolitan area, Oregon, USA: Hydrological Processes, v. 23, no. 6, p. 805–815, accessed July 2018, at https://doi.org/10.1002/hyp.7176.
Jung, I., and Chang, H., 2012, Climate change impacts on spatial patterns in drought risk in the Willamette River Basin, Oregon, USA: Theoretical and Applied Climatology, v. 108, nos. 3–4, p. 355–371, accessed June 2018, at https://doi.org/10.1007/s00704-011-0531-8.
Macfarlane, W.W., Wheaton, J.M., Bouwes, N., Jensen, M.L., Gilbert, J.T., Hough-Snee, N., and Shivick, J.A., 2017, Modeling the capacity of riverscapes to support beaver dams: Geomorphology, v. 277, p. 72–99, accessed January 2018, at https://www.sciencedirect.com/science/article/pii/S0169555X15302166?via%3Dihub.
Majerova, M., Neilson, B.T., Schmadel, N.M., Wheaton, J.M., and Snow, C.J., 2015, Impacts of beaver dams on hydrologic and temperature regimes in a mountain stream: Hydrology and Earth System Sciences, v. 19, no. 8, p. 3541–3556, accessed May 2018, at https://doi.org/10.5194/hess-19-3541-2015.
Metro, 2014, Urban growth boundary: Oregon Metro Regional Land Information System geographic information system (GIS) data, accessed June 2018, at https://www.arcgis.com/home/item.html?id=e3a9453a1ce547a7b2ee4baac037540e.
Pollock, M.M., Lewallen, G.M., Woodruff, K., Jordan, C.E., and Castro, J.M., eds., 2017, The Beaver restoration guidebook—Working with beaver to restore streams, wetlands, and floodplains (version 2.0): U.S. Fish and Wildlife Service, Portland, Oregon, 219 p. [Also available at https://www.fws.gov/oregonfwo/promo.cfm?id=177175812.]
Pollock, M.M., Naiman, R.J., Erickson, H.E., Johnston, C.A., Pastor, J., and Pinay, G., 1995, Beaver as engineers—Influences on biotic and abiotic characteristics of drainage basins, in Jones, C.G., and Lawton, J.H., eds., Linking species and ecosystems: Boston, Springer, p. 117–126, accessed January 2018, at https://doi.org/10.1007/978-1-4615-1773-3_12.
Railsback, S.F., 2016, Why it is time to put PHABSIM out to pasture: Fisheries, v. 41, no. 12, p. 720–725. Accessed February 2018 at https://doi.org/10.1080/03632415.2016.1245991.
Ries, K.G., III, Newson J.K., Smith, M.J., Guthrie, J.D., Steeves, P.A., Haluska, T.L., Kolb, K.R., Thompson, R.F., Santoro, R.D., and Vraga, H.W., 2017, StreamStats, version 4: U.S. Geological Survey Fact Sheet 2017–3046, 4 p., accessed December 2017, at https://doi.org/10.3133/fs20173046.
Risley, J.C., Stonewall, A., and Haluska, T., 2008, Estimating flow-duration and low-flow frequency statistics for unregulated streams in Oregon: U.S. Geological Survey Scientific Investigations Report 08–5126, 23 p., accessed November 2016, at https://doi.org/10.3133/sir20085126.
Smith, C.D., 2017, Beaver dam locations and beaver activity in the Tualatin Basin, Oregon, between 2013 and 2016: U.S. Geological Survey data release, accessed January 2018, at https://doi.org/10.5066/F7PZ57QP.
Smith, C.D., Leahy, E.K., Jones, K.L., and Rounds, S.A., 2025, Effects of beaver dams and ponds on water quality in urban streams of the Tualatin River Basin, northwestern Oregon, chap. D of Jones, K.L., and Smith, C.D., eds., Beavers in the Tualatin River Basin, northwestern Oregon: U.S. Geological Survey Scientific Investigations Report 2025–5039–D, 48 p., https://doi.org/10.3133/sir20255039D.
Sobieszczyk, S., Jones, K.L., Rounds, S.A., Nilsen, E.B., and Morace, J.L., 2018, Prioritization framework for ranking riverine ecosystem stressors using example sites from the Tualatin River Basin, Oregon: U.S. Geological Survey Scientific Investigations Report 2018–5153, 40 p., accessed April 2018, at https://doi.org/10.3133/sir20185153.
Stout, T.L., Majerova, M., and Neilson, B.T., 2017, Impacts of beaver dams on channel hydraulics and substrate characteristics in a mountain stream: Ecohydrology, v. 10, no. 1, p. e1767, accessed June 2018, at https://doi.org/10.1002/eco.1767.
U.S. Census Bureau, 2018, State and county quick facts for Washington County, Oregon: U.S. Census Bureau, accessed August 14, 2019, at https://www.census.gov/quickfacts/fact/table/washingtoncountyoregon,US/PST045218.
U.S. Geological Survey, 1999. National elevation dataset: U.S. Geological Survey database, accessed February 02, 2016, at https://www.usgs.gov/core-science-systems/national-geospatial-program/national-map.
U.S. Geological Survey, 2014, National hydrography dataset: U.S. Geological Survey database, accessed February 02, 2016, at https://www.usgs.gov/core-science-systems/national-geospatial-program/national-map.
U.S. Geological Survey, 2019, StreamStats: U.S. Geological Survey StreamStats program web page, accessed August 14, 2019, at https://streamstats.usgs.gov/ss/.
U.S. Geological Survey, 2024, National Water Information System: U.S. Geological Survey web interface, https://doi.org/10.5066/F7P55KJN. Cited May 2024 at https://nwis.waterdata.usgs.gov/nwis.
U.S. Geological Survey and U.S. Forest Service, 2014, LANDFIRE existing vegetation type (EVT) layer landscape fire and resource management planning tools project: LANDFIRE web page, accessed February 2, 2016, at https://landfire.cr.usgs.gov/viewer/.
White, J.S., 2025, Stream network capacity to support beaver dams, Tualatin River Basin, northwest Oregon: U.S. Geological Survey data release, https://doi.org/10.5066/P1SURYZ4.
White, J.S., Jones, K.L., and Rounds, S.A., 2025, Effects of beaver dams and ponds on hydrologic and hydraulic responses of storm flows in urban streams of the Tualatin River Basin, northwestern Oregon, chap. B of Jones, K.L., and Smith, C.D., eds., Beavers in the Tualatin River Basin, northwestern Oregon: U.S. Geological Survey Scientific Investigations Report 2025–5039–B, 38 p., https://doi.org/10.3133/sir20255039B.
Wright, J.P., Jones, C.G., and Flecker, A.S., 2002, An ecosystem engineer, the beaver, increases species richness at the landscape scale: Oecologia, v. 132, no. 1, p. 96–101, https://doi.org/10.1007/s00442-002-0929-1
Conversion Factors
International System of Units to U.S. customary units
Temperature in degrees Celsius (°C) may be converted to degrees Fahrenheit (°F) as follows:
°F = (1.8 × °C) + 32.
For information about the research in this report, contact the
Director, Oregon Water Science Center
U.S. Geological Survey
601 SW 2nd Avenue, Suite 1950
Portland, Oregon 97204
https://www.usgs.gov/centers/oregon-water-science-center
Manuscript approved on November 5, 2024
Publishing support provided by the U.S. Geological Survey
Science Publishing Network, Tacoma Publishing Service Center
Edited by John Osias and Esther Pischel
Illustration support and cover by JoJo Mangano
Layout by Luis Menoyo
Disclaimers
Any use of trade, firm, or product names is for descriptive purposes only and does not imply endorsement by the U.S. Government.
Although this information product, for the most part, is in the public domain, it also may contain copyrighted materials as noted in the text. Permission to reproduce copyrighted items must be secured from the copyright owner.
Suggested Citation
White, J.S., Smith, C.D., Jones, K.L., and Rounds, S.A., 2025, Stream network capacity to support beaver dams in the Tualatin River Basin, northwestern Oregon, chap. A of Jones, K.L., and Smith, C.D., eds., Beavers in the Tualatin River Basin, northwestern Oregon: U.S. Geological Survey Scientific Investigations Report 2025–5039–A, 20 p., https://doi.org/10.3133/sir20255039A.
ISSN: 2328-0328 (online)
Study Area
| Publication type | Report |
|---|---|
| Publication Subtype | USGS Numbered Series |
| Title | Stream network capacity to support beaver dams in the Tualatin River Basin, northwestern Oregon |
| Series title | Scientific Investigations Report |
| Series number | 2025-5039 |
| Chapter | A |
| DOI | 10.3133/sir20255039A |
| Publication Date | September 30, 2025 |
| Year Published | 2025 |
| Language | English |
| Publisher | U.S. Geological Survey |
| Publisher location | Reston, VA |
| Contributing office(s) | Oregon Water Science Center |
| Description | Report: viii, 20 p.; 2 Data Releases |
| Country | United States |
| State | Oregon |
| Other Geospatial | Tualatin River Basin |
| Online Only (Y/N) | Y |