

Effects of Beaver Dams and Ponds on Hydrologic and Hydraulic Responses of Storm Flows in Urban Streams of the Tualatin River Basin, Northwestern Oregon
Links
- Document: Report (6.9 MB pdf) , HTML , XML
- Larger Work: This publication is Chapter B of Beavers in the Tualatin River Basin, northwestern Oregon
- Data Release: USGS data release - Hydraulic models of two beaver affected reaches in the Tualatin Basin, Oregon
- Download citation as: RIS | Dublin Core
Acknowledgments
The authors thank Erin Leahy, Cassandra Smith, Brandon Overstreet, Micelis Doyle (retired), Alexandria Costello, Adam Stonewall, Mackenzie Keith, Joshua Price, and Gabriel Gordon from the U.S. Geological Survey for their technical and field contributions to this study. The authors also thank Rajeev Kapur, Anne MacDonald, Bob Baumgartner (retired), Carol Murdock, Matthew Brennan, Anil Devnani, John Goetz, Scott Mansell, and Kenneth Williamson from Clean Water Services and staff from the Tualatin Hills Parks and Recreation District for providing helpful information, insights, and logistical support.
Preface
This is the second of four reports in a multichapter volume assessing the capacity of the stream network to support beaver dams and evaluating the effects of beaver dams and ponds on urban streams. These reports document the data collection from 2016–17 and the findings of these studies, which were done in partnership with Clean Water Services. Chapter A (White and others, 2025) documents the locations of beaver dams in the Tualatin River Basin and how many beaver dams the stream network could support with existing and improved riparian vegetation. Beaver dam capacity was estimated by modifying existing tools to account for the low gradient of many streams in the Tualatin River Basin. Chapter B (this report) describes the effects of beaver dams and ponds on hydrologic and hydraulic responses of storm flows. Hydrologic and hydraulic responses for two urban stream reaches were compared with and without beaver dams and ponds and for a range of streamflow conditions using two-dimensional hydraulic models. Chapter C (Doyle and others, 2025) characterizes the effects of beaver dams and ponds on the transport and deposition of suspended sediment. Continuous turbidity, discrete suspended-sediment samples, and streamflow measurements collected during storms and base-flow periods were used to assess: (1) suspended-sediment loads upstream and downstream from two beaver-affected reaches, and (2) seasonal and longitudinal turbidity patterns. Chapter D (Smith and others, 2025) describes the effects of beaver dams and ponds on longitudinal, spatial, and seasonal water-quality patterns. Continuous and synoptic water-quality data were collected along urban stream reaches, and net ecosystem production was calculated for two beaver-affected reaches. The findings of these studies illustrate that the effects of beaver dams and ponds on hydrology, hydraulics, suspended-sediment transport and deposition, and water quality are dependent on the characteristics of a stream reach (for example, channel gradient, groundwater exchange, and riparian vegetation) and the characteristics of beaver dams and ponds along that reach. This information can be used to consider the implications of beaver-assisted restoration in the Tualatin River Basin and the effects of beaver dams and ponds in urban streams.
Significant Findings
American beaver (Castor canadensis) dams fundamentally alter stream hydraulics and hydrology by temporarily impounding water in stream channels. Water managers are interested in how this impoundment translates to changes in hydrograph dynamics, particularly regarding the magnitude and duration of high flows, the temporary storage of storm water, and the range and spatial distribution of water depths and velocities. High-resolution two-dimensional hydraulic models were developed to compare hydraulic responses to storm events in two 1-kilometer long, relatively small (less than 5-meter-wide channel), urban stream reaches in the Tualatin River Basin (northwestern Oregon) with and without beaver dams. Results from modeling unsteady storm events show that: (1) beaver dams generally attenuate (temporarily impound) more water during storm events than an undammed reach, (2) the timing and dynamics of this attenuation are complicated and thus do not always result in a reduction of peak flows, and (3) the influence of beaver dams on stream hydraulics diminishes as the magnitude of flow events increase. Local geomorphic conditions, specifically the presence of off-channel features, affect the extent to which dams alter hydrograph dynamics. Although the magnitudes of peak flows are not substantially affected by the beaver dams considered in this study, results show that beaver dams temporarily impound a considerable amount of water throughout the duration of storms, which slows water conveyance to downstream reaches. Steady-state streamflow simulations at several streamflow magnitudes were also used to assess how beaver dams affect stream depths, velocities, and inundated areas, which are important factors affecting aquatic habitats. Results show that beaver dams result in a more hydraulically diverse stream, with substantially more inundated area, lower velocities, and greater depths than corresponding undammed scenarios. However, these differences diminish as streamflows increase and the channels overflow their banks and become hydraulically connected to adjacent floodplains. Together, these results confirm that beaver dams can fundamentally change urban stream channel hydraulics, but the influence of these dams is bounded by local geomorphic controls and is diminished at large streamflows.
Introduction
American beaver (Castor canadensis; hereafter referred to as “beaver”) construct dams with woody vegetation, grasses, mud, and other material along streams. Beaver dams impound streams, resulting in increased depths and decreased velocities, which can turn free-flowing stream reaches into ponded reaches. In some instances, ponding may be confined within stream channels, but in other instances, dams can raise water levels sufficiently high to inundate local floodplains, thus facilitating hydraulic connectivity between the channel and its floodplain. Hydraulic changes associated with beaver dams, in turn, have substantial effects on stream geomorphology, hydrology, water quality, and ecology (Naiman and others, 1988). Recognizing the diverse effects of beavers on stream habitats, beaver-related habitat restoration is of growing interest in the United States and Europe as a relatively cost-effective and process-based approach for potentially improving stream and riparian habitats (Pollock and others, 2015; Pilliod and others, 2018).
Commonly cited goals of beaver-assisted habitat restoration include increasing floodplain connectivity, increasing the range of water depths and velocities, and attenuating storm flows (Pollock and others, 2015). An increasing number of studies in rural and mountainous environments have documented the effects of beaver dams and ponds on these issues (Bouwes and others, 2016; Nash and others, 2021) and several studies have focused on reducing peak streamflow magnitude (Nyssen and others, 2011; Puttock and others, 2017). However, as noted by Nash and others (2021), without pre-dam data, it is difficult to disentangle the specific role that beavers play in streamflow attenuation compared to other factors, such as stream morphology and watershed characteristics.
As of 2022, the hydraulic effects of beaver dams and ponds in urban and low-gradient streams, such as those in the Tualatin River Basin, remain less understood than their effects in rural and montane areas. Urban streams experience hydrological changes from urbanization, often resulting in a greater frequency and magnitude of high-flow events as well as increased flashiness that causes hydrographs to rapidly rise and fall with storm events (Booth and Jackson, 1997; Paul and Meyer, 2001; Walsh and others, 2005). The hydraulic changes caused by urbanization often are accompanied by geomorphic changes, such as bed lowering, channel enlargement, reduced channel complexity, and bank erosion (Booth and Jackson, 1997; Walsh and others, 2005; Hawley and others, 2012). Beaver dams and ponds in low-gradient, urban streams are hypothesized to help reduce and attenuate storm-flow events; however, the magnitude of peak flow changes associated with beaver dams in urban streams is not well studied and may be confounded by natural floodplain processes (such as floodplains providing water storage once the channel overflows its banks with or without beaver dams and ponds). Thus, quantifying the hydraulic and hydrologic effects of beaver dams and ponds is important to understanding the potential contributions of beaver dams and ponds to stormwater management in urban settings and learning more about the reach-scale characteristics that may increase or decrease those hydraulic effects.
In addition to the effects that beaver dams have on stream hydraulics, the presence of beaver dams and ponds can affect the types of available riparian and aquatic habitats and abundances of species that utilize those streams (Bouwes and others, 2016). Aquatic organisms, including fish, herpetofauna, birds, and vegetation, require suitable hydraulic conditions, such as specific ranges of water depths and velocities, to survive and complete their life cycles. Although an extensive body of literature exists documenting the general effects of beaver dams on stream ecosystems (Naiman and others, 1988), this report aims to specifically show how stream depths and velocities vary within the same urban stream reach with and without beaver dams. Furthermore, urban streams tend to have simplified channel morphologies and hydraulic conditions compared to streams in less altered settings, which can restrict the type and quantity of aquatic species that use them (Booth and Jackson, 1997). Quantifying the extent to which beavers influence stream hydraulics can aid managers in the Tualatin River Basin and other low-gradient urban watersheds to better anticipate potential habitat changes that may result from the addition or removal of beaver dams. This understanding could also be used to establish expectations of the species that may potentially benefit from the hydraulic conditions created by beaver dams in urban streams.
Purpose and Scope
The U.S. Geological Survey (USGS) study summarized in this report investigated the hydraulic effects of natural beaver dams and ponds during 2016–17 along two beaver-affected urban stream reaches in the Tualatin River Basin of northwestern Oregon (fig. 1). The two stream reaches were Fanno Creek at Greenway Park and Bronson Creek between Kaiser and Saltzman Roads (henceforth referred to as “Fanno and Bronson Creek study reaches”). The purpose of this study is to quantify the affect that beaver dams in these reaches have on hydrograph dynamics during storm events as well as channel hydraulics across a range of stream flows. Three related studies document current beaver-dam distributions and model the stream network’s capacity to support beaver dams in the Tualatin River Basin (White and others, 2025), investigate changes in water quality (Smith and others, 2025), and sediment transport and deposition (Doyle and others, 2025) along the Fanno and Bronson Creek study reaches. The overall purpose of this series of studies was to provide Clean Water Services of Washington County (the primary wastewater and stormwater management utility for the urban areas of Washington County, Oregon) with the data and insights needed to understand beaver-dam distributions and the physical and water-quality effects of beaver dams and ponds on urban streams in the Tualatin River Basin to inform beaver related restoration and management across the basin.
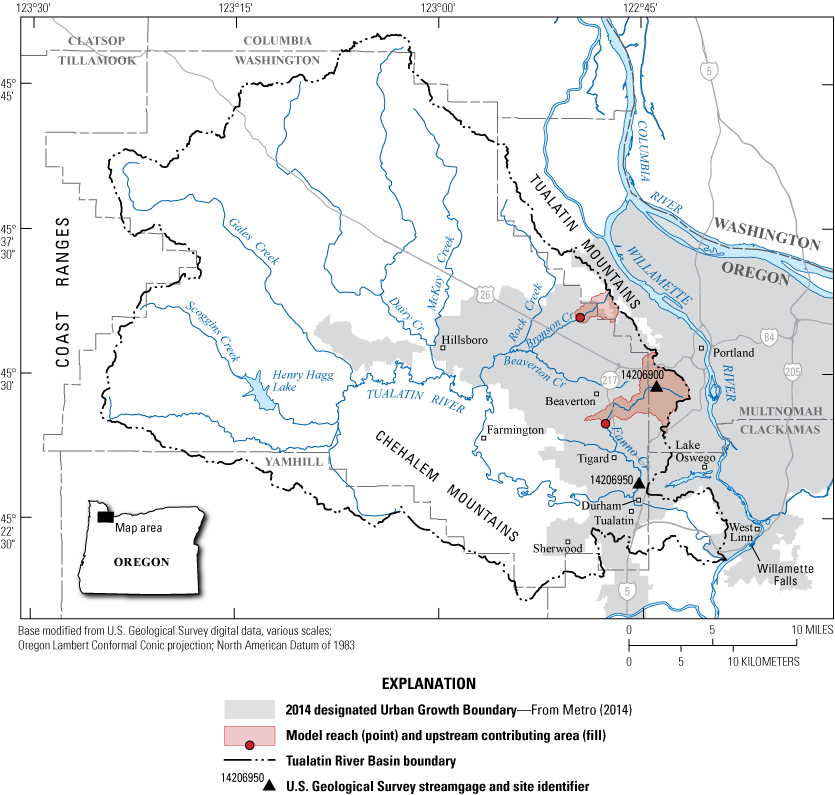
Locations of the model reaches along Fanno and Bronson Creeks in the urbanized metropolitan area of the Tualatin River Basin, northwestern Oregon, as well as U.S. Geological Survey stream gage locations (U.S. Geological Survey, 2025).
The goal of this study was to assess the effects of beaver dams and ponds on storm flow hydrographs and hydraulics along two urbanized and low-gradient reaches containing multiple beaver dams. To accomplish the goal, the study developed two-dimensional steady and unsteady hydraulic models to examine the effects of beaver dams on (1) storm flow dynamics for three different storm flow hydrographs with and without beaver dams and (2) stream hydraulics by modeling identical stream reaches with and without beaver dams. The effects of beaver dams in modifying storm flow hydrographs through attenuation and water storage were analyzed using two approaches: (1) a comparison of hydrographs to assess differences in travel time, streamflow magnitude, flow recession, and flow duration, and (2) a comparison of cumulative flow to assess differences in stored water volumes during the three storm events. To evaluate the role of beaver dams in altering hydraulic conditions in channel and floodplain areas, steady-state models were developed to simulate the study reaches with and without beaver dams for four streamflow magnitudes, ranging from base flow to relatively large storm flows. Hydraulic results from these steady-state simulations were output as rasters and analyzed using geographic information system (GIS) tools to examine differences in inundated area and water depth and velocity. A summary of the modeling approaches and objectives can be found in table 1, and the combined results from this study provide an initial quantitative framework to assess hydrologic and hydraulic changes to urban streams in the Tualatin River Basin that may result from beaver dams, including:
-
1. The role of beaver dams in altering storm flow hydrographs, specifically, changes in magnitudes, duration, and volumes associated with peak flows that may be expected in contrasting geomorphic settings for various storm magnitudes;
-
2. The role of beaver dams in altering hydraulic conditions and potential implications for aquatic habitats; and
-
3. The hydrograph and reach characteristics that influence the magnitude of hydrologic and hydraulic changes associated with beaver dams and ponds.
Table 1.
Conceptual overview of modeling objectives and their associated modeling approaches, analyses, and metrics used to support each objective.Tualatin River Basin and Study Reach Descriptions
The Tualatin River Basin drains 1,844 square kilometers (km2) of northwestern Oregon before joining the Willamette River just upstream from Willamette Falls (fig. 1). The Tualatin River headwaters begin in the eastern flanks of the Coast Ranges, which reach a maximum altitude of 1,057 meters (m) above sea level referenced to the North American Vertical Datum of 1988. Missoula Flood deposits blanket the lower Tualatin Valley in fine silt and clay (less than [<] 0.2 millimeters [mm] grain sizes), creating vast areas of low permeability soils (U.S. Department of Agriculture, Natural Resources Conservation Service, 2012). Land use within the basin is generally forested, agricultural, suburban, and urban areas from upstream to downstream, with the Urban Growth Boundary (UGB; fig. 1) restricting the extent of urban development in the lower valley. Beavers are native to the Tualatin River Basin and have been recolonizing forested and urban streams throughout the basin (Smith, 2017) after being nearly extirpated by hunting and trapping in the last 150 years.
The Tualatin River Basin averages 1.1 m of precipitation per year, with considerable differences between the highest elevation reaches and the lower valley (Franczyk and Chang, 2009). Most precipitation falls as rain during winter (Jung and Chang, 2012), and peak flows typically occur between December and February. Summers typically receive little precipitation, and streams tend to exhibit base-flow conditions between June and September.
Fanno Creek Study Reach
The Fanno Creek Basin drains 82 km2 and is approximately 89 percent urban, 8 percent forested, and 3 percent other land uses (U.S. Geological Survey, 2016). Doyle and others (2025) and Smith and others (2025) provide more detailed descriptions of the Fanno Creek Basin and subreach modeled in this report. Fanno Creek tends to have stormflows that quickly rise and fall in response to rain events (McCarthy, 2000; Sobieszczyk and others, 2018).
The Fanno Creek study reach has an upstream boundary at the Hall Boulevard bridge and extends about 1 km from north to south through Greenway Park, a popular urban park frequented by bikers, commuters, and nearby residents (fig. 2) in Tigard, Oregon. The reach is bordered to the west by residential development and to the east by the Koll Center Wetlands. Clean Water Services added meanders and large woods to the Fanno Creek channel and planted native vegetation from 2008 to 2012 (Smith and Ory, 2005). Beavers colonized the restored reach and began building dams and lodges in approximately 2012 (Matthew Brennan, Clean Water Services, oral commun., 2016). During this study (2017–19), the reach had three large channel-spanning beaver dams and two smaller beaver dams in off-channel features. The three largest dams were each at least 1-m tall. One of the channel-spanning dams was 30-m long and extended more than 10 meters onto the floodplain, creating a large pond (fig. 2; approximately 7,940 square meters in wetted surface area in base-flow conditions, referred to as “south pond”). Once the dam was built, the south pond flooded the main channel, nearby paths, and riparian areas throughout the year, even during periods of low flows. The north pond and adjacent Koll Center Wetlands are off-channel features not created by beaver dams. Just downstream from the 30-m-long south pond dam, the stream backwaters into a relic channel as a result of the downstream most dam in the reach. There are at least two small stormwater drainages that enter the Fanno Creek reach. These were observed to have flowing water during storm flows, but the flow was not measured.
The Fanno Creek study area reach drains 27 km2 (about 32 percent) of the overall Fanno Creek Basin, and its contributing drainage area has a mean basin slope of 5.7 degrees (U.S. Geological Survey, 2016). The study reach has a channel slope of 0.002 (fig. 2). Within the reach, Fanno Creek predominantly occupies a single thread channel flanked by streambanks typically rising 0.1–1 m above the low-flow water surface and is generally incised at least 1 meter deeper than the adjacent floodplain. From Hall Boulevard to the entrance to the south pond, about 800 m downstream, the main channel is narrow (2–3 m) and shaded by riparian vegetation, with a mean depth of 1.5 m during typical low-flow conditions. One channel-spanning beaver dam exists in this upper part of the reach, which backs water into the north pond. There are also two footbridges within this subreach; neither inhibit water flow at low flows, but the upstream-most footbridge is inundated at high flows, causing flow to backwater into the adjacent field. Within the south pond, the submerged main channel remains narrow and deep, whereas the ponded area is generally shallow (0.5 m on average) with limited riparian shade and some dead snags. Downstream from the south pond and to the end of the study reach, the main channel continues to be narrow (2–3 m wide), deep (about 1-m depth at low water), and shaded by riparian vegetation, with one large channel-spanning beaver dam. During some larger high-flow conditions, water flows from the south pond into the Koll Center Wetlands to the southeast (fig. 2). There is a final footbridge below the downstream-most dam; however, the footbridge did not inhibit flow at any observed flows (up to 6.8 cubic meters per second [m3/s]).
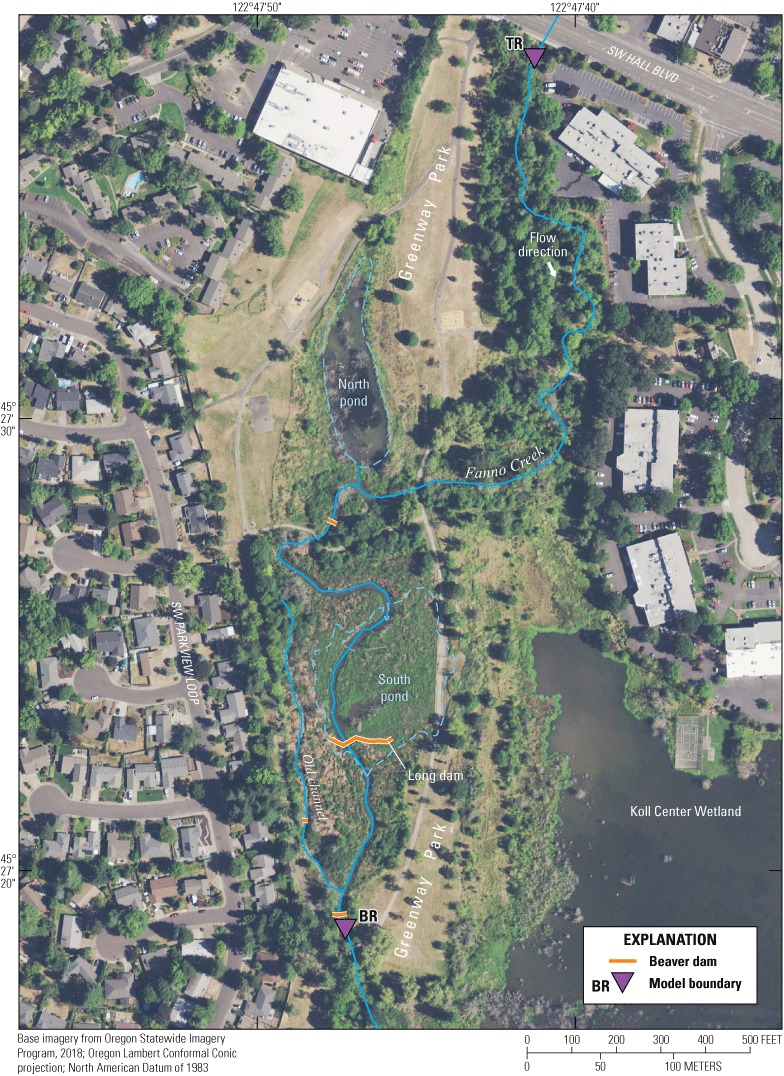
Fanno Creek reach as of 2017, Tigard, northwestern Oregon (White, 2025). TR, top of reach; BR, bottom of reach.
Bronson Creek Study Reach
The Bronson Creek Basin drains 12.7 km2 of a rapidly urbanizing area. As of 2016, the basin was approximately 50 percent developed land, 23 percent forest and land shrubs, 18.6 percent impervious area, and 1 percent wetland (U.S. Geological Survey, 2016). The Bronson Creek study reach is approximately 700-m long (fig. 3) and drains about 5.6 km2 of upland area with a mean basin slope of 8.96 degrees (U.S. Geological Survey, 2016). From 2004 to 2019, Clean Water Services planted vegetation and added large wood to the channel to improve water quality and enhance the stream and floodplain habitats (Smith and Ory, 2005). Beaver dam-building is believed to have begun sometime around 2010 (Matthew Brennan, Clean Water Services, oral commun., 2016).
The upstream end of the model reach is approximately 0.6 km downstream from Laidlaw Road, the nearest road crossing. The reach extends southwest for roughly 0.7 km downstream to a point near the intersection of Northwest Meisner Drive and Northwest Henninger Lane (fig. 3). The reach is bounded by relatively steep valley slopes on either side of the roughly 70-m-wide floodplain. The channel slope in the Bronson Creek study reach is 0.005, as derived from Global Navigation Satellite System (GNSS) stream surveys (White, 2025). Flow through the modeled reach is strongly influenced by three large channel-spanning beaver dams, each of which is greater than 1-m tall. Unlike the Fanno Creek reach, none of these dams extend into the adjacent floodplain. These dams have been present since at least 2015, based on aerial imagery of the site. Three smaller beaver dams also affect flow and water levels to varying degrees. In the upstream-most 150 m of the reach, Fanno Creek occupies a single narrow (<2 m) channel, with flow typically confined within that channel. The first large dam creates a backwatered pond at low flow and diverts water into several channels at high flow. The backwater pond is separated from the main channel by a narrow (<0.5 m) notch with a small sill, which limits water exiting the pond. Approximately 100 m downstream from the first dam is the second large dam, which diverts most of the flow into a 50-m long side channel, which re-enters the main channel approximately 50 m upstream from the downstream-most dam. The main channel between the second and third beaver dam is relatively narrow (2–3 m) and flanked by mostly deciduous trees along the banks. Water levels in ponded reaches (areas immediately upstream from beaver dams) often are near the top of the channel bank during low-flow conditions, and the adjacent floodplains are frequently inundated, even at moderate flows. Most of the floodplain is dominated by dense stands of reed canary grass (Phalaris arundinacea), whereas much of the main channel is bordered by a thin ribbon of deciduous and coniferous trees. The fourth and final large dam in the model reach is approximately 60 m upstream from the downstream reach boundary but does not create side channels at observed flows. One small drainage enters from the southwest approximately halfway down the study reach.
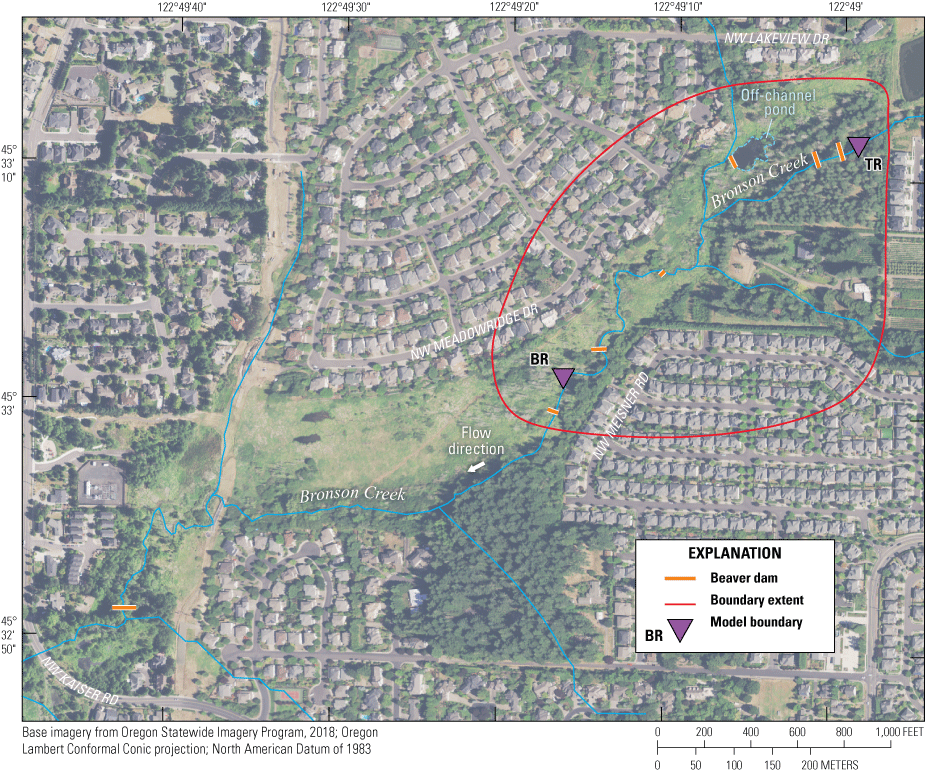
Bronson Creek reach as of 2017, Tualatin River Basin, northwestern Oregon (White, 2025). TR, top of reach; BR, bottom of reach.
Methods
The study summarized in this report used two-dimensional hydraulic models to evaluate the extent to which beaver dams influence streamflows and hydraulics in two beaver-affected urban stream reaches (figs. 2 and 3). Two-dimensional models can be used to simulate the complex flow patterns and lateral transfer of water (such as in side-channels, backwater ponds, and overbank areas) more accurately than typical one-dimensional models. Furthermore, two-dimensional models calculate depth and velocity at each computational node, as opposed to cross-sectionally averaged calculations in one-dimensional models, facilitating more reliable comparisons of stream hydraulics with and without beaver dams. The model platform was the Hydrologic Engineering Center River Analysis System (HEC-RAS) version 6.3 (U.S. Army Corps of Engineers, 2016), which solves simplified Navier-Stokes equations, or so-called shallow-water equations, to calculate the motion of fluid in the X and Y directions. These models rely on multiple inputs, including topography and its spatial discretization, boundary conditions describing how water enters and exits the models, and the distribution of hydraulic roughness throughout the reach. The following sections describe how these model inputs were developed.
Topographic Inputs
Accurate representations of channel bathymetry and floodplain topography are critical components of hydraulic modeling. Terrain models combining channel bathymetry and floodplain topography for the Fanno and Bronson Creek study reaches were created by collecting bathymetric and topographic survey data in the wetted channel and adjacent floodplain and combining those survey data with light detection and ranging (lidar) data collected in 2014 (Watershed Sciences, Inc., 2014).
Bathymetric and topographic survey data were collected in the Fanno Creek study reach in May 2016 and in the Bronson Creek study reach in March 2017. Surveys were completed during low streamflow conditions. In the Fanno Creek study reach, survey crews used inflatable kayaks to access the deepest parts of the channel; banks and floodplains were accessed on foot. In the Bronson Creek study reach, the channel was often too narrow to accommodate an inflatable kayak and too deep to wade; thus, a Seafloor Systems SonarMite single-beam echosounder was attached to an improvised hydro-board and pulled across the channel from the banks to survey the deepest parts of the channel. Both reaches were surveyed using real-time kinematic global positioning system (RTK GPS; Trimble R8) and Total Station (Trimble S6) surveys to create a point cloud density of approximately 0.35 pts/m2 in the stream channel and adjacent floodplain. Horizontal precision of the measurements was typically less than 0.05 m, whereas vertical precision was typically less than 0.1 m, as calculated by back sight checks with total stations and RTK supplied precision metrics. Surveys extended 10–20 m beyond the channel to capture any potential changes since the 2014 lidar data collection. Other survey points included the locations, crest heights, and endpoints of beaver dams. To aid in model calibration, points were collected at the edge of the wetted channel to measure water-surface elevations and inundated extents. Edges of water points were also collected during high-flow surveys (at streamflows 6.8 m3/s and 1.67 m3/s at Fanno and Bronson Creek reaches, respectively) at each reach to calibrate high-flow dynamics of the hydraulic model. In total, 2,437 points were collected at Fanno Creek and 7,155 points were collected at Bronson Creek. The reach at Bronson Creek included several complex side channels, necessitating the greater number of points.
The subsequent point clouds from the field surveys were converted into Triangular Irregular Networks (TIN) using ArcGIS 10.7. Breaklines were added to the TINs to denote locations of slope changes noted during the field surveys, such as the top and bottom of banks. Breaklines force interpolation between two points and prohibit interpolation through the line. The finalized TIN was converted to a rasterized 0.5 square meter (m2) digital elevation model (DEM) using a linear interpolation. The DEM was then combined with the lidar data to create a terrain model (White, 2025), incorporating both the stream channel and adjacent floodplain (fig. 4).
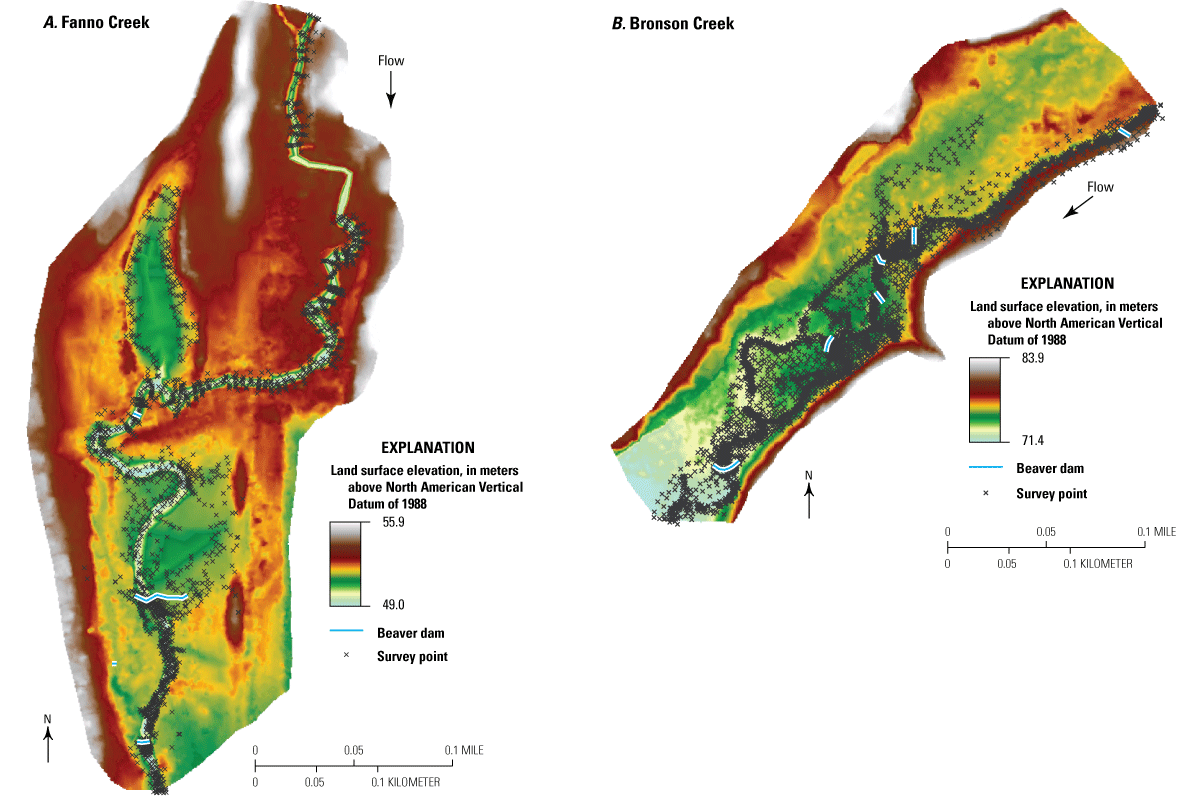
Modeled reaches of Fanno (A) and Bronson (B) Creeks, including survey points, interpolated digital elevation models, and beaver dam locations at the time of field surveys, Tualatin River Basin, northwestern Oregon (White, 2025).
Beaver dams are hydraulically complex, variably porous structures that, unlike earthen dams or other solid features, cannot accurately be represented by a simple topographic mound in a hydraulic model. After evaluating several approaches, the simplest and most effective method was to represent each dam as a staircase-shaped notch in a solid channel-blocking topographic mound (fig. 5). The elevation of the center and deepest notch was lower than the measured dam crest to facilitate some through-flow during low flows. The progressively higher notches to either side were raised 0.05–0.10 m from each previous step. The exact elevation of each notch, as well as associated roughness, was iteratively adjusted in calibration model runs by comparing pool inundation to measured inundation. Edits were made to the terrain model using standard editing tools in ArcGIS 10.7. This method of representing each beaver dam produced a more accurate representation of stage-discharge dynamics compared to a simple topographic mound because more flow passes over and through the dams as flows increase, which would be expected with actual beaver dams.
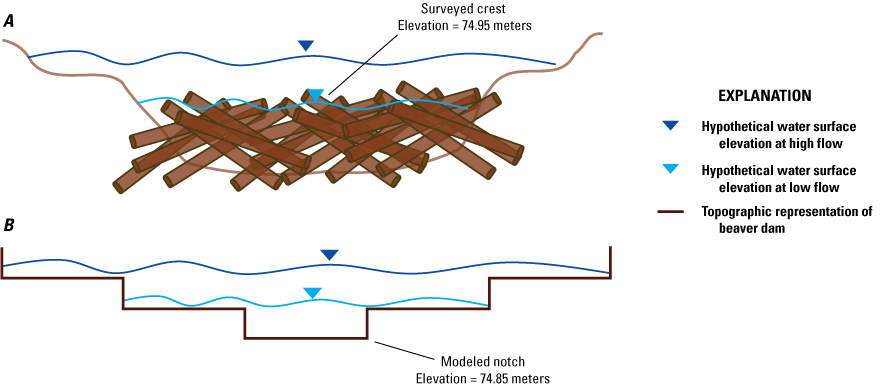
Cross-sectional schematics of a hypothetical beaver dam (A) and how such a dam would be replicated in the hydraulic models (B). Elevations are examples from the largest dam on the Bronson Creek model reaches and are referenced to North American Vertical Datum of 1988 (White, 2025).
To simulate the hypothetical scenarios in which the Fanno Creek and Bronson Creek study reaches do not contain beaver dams (figs. 2 and 3), the final TINs from the with-dam scenarios were copied and edited to remove the existing dams. This was accomplished by interpolating a linear channel gradient through the beaver dams, beginning from the depositional mound of sediment just upstream from each dam and extending downstream below the plunge-pool. No edits were made to other geomorphic features that may be different without beaver dams because these differences were assumed to be negligible. TINs where beaver dams were removed were rasterized identically to TINs with beaver dams. Final DEMs without beaver dams are henceforth referred to as the “no dam” DEMs.
Computational Mesh
Two-dimensional hydraulic models that simulate water movement require underlying topography to be spatially discretized into a computational mesh to apply the equations of flow. Final DEMs were imported into the HEC-RAS model framework as terrain files on which this computational mesh was created. HEC-RAS 2D uses an unstructured mesh approach, whereby model computational cells can be of varying size, shape, and orientation. An initial mesh was created by bounding the study extent with rectilinear cell dimensions of 2 × 2 m. A polygon was then manually digitized around the main channel, dams, and pools for a more refined sub-grid of 0.5 × 0.5 m. HEC-RAS leverages sub-grid bathymetry to enable coarser meshes, while still capturing detailed hydraulics. However, sub-grid bathymetry can result in spurious flow through topographic features if meshes are not properly aligned. To help prevent such errors, breaklines were added as necessary to features such as banks and levees. Breaklines force cell alignment and closure, thus ensuring that cell faces, which dictate hydraulic flow-through, have accurate representations in the model. Identical meshes were used for both with-dam and no-dam DEMs on each reach.
Roughness
All surfaces exert friction on flowing water, and the extent and magnitude of this friction are important inputs for hydraulic modeling. This friction is often referred to as “roughness,” and HEC-RAS uses Manning’s n values to simulate roughness. Once the computational mesh was created, Manning’s n roughness values were assigned to it. This was done by manually digitizing polygons around distinct and relatively homogenous features in the channel and floodplains, such as open channel, grassy fields, and dense vegetation. Roughness coefficients for each feature were then assigned initially from modeler experience and common guidelines (Barnes, 1967). Roughness values were then used to calibrate the model and were adjusted iteratively within reasonable ranges to improve model fit. Final calibrated roughness values can be found in table 2. Roughness values were held identical for the with-dam and no-dam model runs, except for roughness values at dam locations. At these locations, roughness in the no-dam scenarios was assigned the same value as the surrounding channel.
Table 2.
Manning’s roughness values (n) for Fanno Creek and Bronson Creek model reaches, Tualatin River Basin, northwestern Oregon.[Data from White (2025). Scientific names: Reed canary grass, Phalaris arundinacea. Symbol: —, no data available]
Boundary Conditions
Water can only enter and exit the hydraulic models at specified locations, referred to as boundary conditions. Boundary conditions require parametrization to accurately represent flow dynamics at those locations. The upstream boundary conditions for both study reaches rely on streamflow hydrographs, which were obtained from a related study (Doyle and others, 2025) that deployed temporary pressure transducers to measure water stage from May 2016 to November 2017. Refer to Doyle and others (2025) for details of the data collection and the subsequent development of the stream-discharge relations.
The downstream boundary condition for both models was a stage-discharge relation based on the hydraulic normal depth, whereby the model assumes steady uniform flow at the boundary and uses the Manning equation to calculate depth as a function of the energy slope. The energy slope for the normal depth was estimated from the topographic survey data, and a sensitivity analysis was conducted to assess the effect of errors in slope. Because both reaches have large beaver dams less than 50 m upstream from the downstream boundaries, the extent of hydraulic changes caused by changes in normal depth slope was small. In both reaches, the normal depth of the downstream boundary was much less than the height of the nearest upstream dam.
The Koll Wetlands border the southeast extent of the Fanno Creek model reach. At the highest modeled flows, water exits the south pond and enters the wetlands. To account for this outflow, an additional normal depth boundary condition was added, using the local topographic slope connecting the Fanno reach and the wetlands (about 0.0001), as measured from lidar data. Bronson Creek is bounded by relatively steep valley walls, and thus all water flowing through the stream channel exits through the downstream end of the modeled reach.
Continuous stage measurements were taken near the downstream model boundary at both reaches (figs. 2 and 3), and thus a time series of stage could have potentially been used as the downstream boundary condition instead of applying a normal depth boundary condition. However, this approach presented several limitations, including the following:
-
1. Discharge estimates from Doyle and others (2025) have relatively high uncertainty due to the short duration of gage deployment, and thus relatively few discharge measurements were available to establish stage-discharge rating curves;
-
2. Pressure transducers only characterize water-level changes in areas hydraulically connected to the main channel, but water may exit the reach in other locations, such as side channels; hence water levels recorded by the pressure transducers do not represent all the streamflow in the modeled reach;
-
3. Pressure transducers only recorded observed conditions with beaver dams present, and thus they cannot accurately represent no-dam conditions; and
-
4. Small but unquantified inflows of water occurred within each model reach, and thus the amount of water exiting the reach at pressure transducers was not equivalent to inflow at the upstream end of the reach.
A normal depth downstream boundary condition allows for substantial flexibility by estimating the rate at which flow exits the model at any location where flow is known to occur. Due to the potential uncertainties associated with a normal depth boundary condition, all time series of modeled discharge at the downstream end of the model were computed at a location 15 m upstream from the boundary, or about four times the channel width.
Ultimately, the primary goal of this analysis was to understand how the same reach responds with and without dams, not necessarily to simulate precise conditions of a given storm event. Thus, there are uncertainties in how much water enters the modeled reaches, but this uncertainty is included into both dam and no-dam scenarios, and the resulting differences are not sensitive to potential errors in streamflow. For example, if the peak streamflow of a modeled storm event was 20 percent higher than what was used as an input into the hydraulic model, the model will consequentially underestimate actual inundation from that event, but the relative difference between the dam and no dam model under this scenario is not sensitive to these differences because inputs to both scenarios are identical.
Model Runs
Two types of streamflow scenarios were simulated utilizing the two sets of terrain models (with-dams and no-dams) to quantify the role of beaver dams in altering hydraulic conditions (table 1). First, three storm events from the measured period of record at each reach were chosen to evaluate if and how beaver dams affect peak flow magnitude and attenuation, velocity distributions, and water storage in the channel and floodplain (fig. 6). These storms vary in the number of peaks, peak flow magnitude, and storm duration. For the Fanno Creek reach, events included the following:
-
1. A small storm flow that peaked at 1.50 m3/s and lasted for roughly 16.5 hours,
-
2. A moderate storm flow with four peaks of about 3.61 m3/s that lasted for roughly 100 hours, and
-
3. A large storm flow that peaked at 9.03 m3/s and lasted for 50 hours.
-
1. A small storm flow with two peaks of approximately 0.72 m3/s that lasted for roughly 24 hours,
-
2. A moderate storm flow that peaked at 1.25 m3/s and lasted for roughly 32.25 hours, and
-
3. A large storm flow that peaked at 2.25 m3/s and lasted for roughly 43.5 hours.
The various magnitude events were chosen independently for each site; thus, the dates of each modeled event are unique. No formal recurrence interval analysis was conducted on these storms because the period of record was short (May 2016 to November 2017). However, a cursory analysis of this limited record suggests the small storm event occurred about 10 times, the moderate storm event occurred 3–5 times, and the large event occurred 2–3 times during this 19-month period of record. An informal analysis of the gage record at USGS sites 14206900 (Fanno Creek at 56th Ave.) and 14206950 (Fanno Creek at Durham) suggests that 2016 and 2017 were both relatively wet winters (U.S. Geological Survey, 2025), with more numerous and larger storms than most years, though neither year or gage reached historical high flows. Each storm event was modeled both with and without dams.
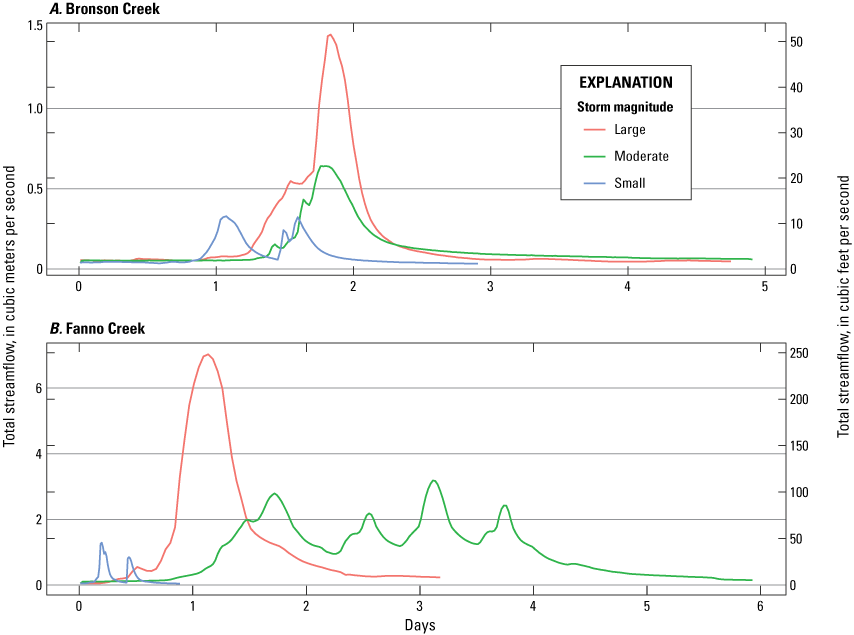
Hydrographs of the three storms simulated at the Bronson Creek (A) and Fanno Creek (B) reaches, Tualatin River Basin, northwestern Oregon (White, 2025).
In addition to modeling the three storm events for the two sets of terrain models (with-dams and no-dams), four steady-state hydrographs were developed to support direct comparisons between hydraulic conditions produced by identical discharges between with-dam and no-dam models (table 1). This direct comparison of hydraulic conditions is more challenging when comparing model output from the storm event scenarios because the changes in travel time between with-dam and no-dam conditions and the flashy nature of the hydrographs make comparison of equivalent hydrologic events difficult. Streamflow conditions of base-, low-, medium-, and high-flows were chosen for steady-state flow simulations (table 3). Streamflow values for these steady-state flow simulations were chosen at each reach based on a cursory analysis of the hydrographs spanning the study period. Base flow was identified as the stable summer streamflow, and low-, medium-, and high-flows were identified by categorizing storm events into three generalized bins that spanned measured peak streamflows associated with storm events. The magnitudes of these steady-state simulations are similar to respective peaks of the storm flow events, with the notable exception of at Fanno Creek, where the high-flow steady-state flows were about half the magnitude of the large storm peak flow.
Table 3.
Simulated steady-state streamflow conditions applied to the Fanno Creek and Bronson Creek hydraulic models to assess differences in hydraulic conditions produced by model simulations with and without beaver dams, Tualatin River Basin, northwestern Oregon.[Data from White (2025)]
Model Calibration
Hydraulic models require calibration of parameters to align modeled conditions with those measured in the field. Models simulating current with-dam conditions in both reaches were calibrated by comparing modeled inundated extent and water-surface elevation (WSE) to measured values. WSE values and inundated extent across each model reach were surveyed at low flow and during a storm event, as described previously. Where possible, data were collected along both banks; however, dense vegetation in some areas prevented data collection. Models were primarily calibrated by iteratively adjusting local hydraulic roughness coefficients to improve model fit. Final coefficients were constrained so that they would not exceed the typical range for the feature represented, as documented by previous studies and published references (Barnes, 1967). For example, the main channels at Fanno and Bronson Creeks were assigned Manning’s roughness coefficients of 0.04 and 0.05, respectively, which is within the expected range for low-gradient and silty-bottom streams. The topographic representation of dams was then adjusted to ensure that the model simulated flow characteristics over the dam as closely as possible. For example, if the pool behind a dam was significantly smaller than the measured pool, the staircase pattern of the dam was raised to reduce the amount of flow going through the modeled dam. If the inundated area of a modeled pool upstream from a beaver dam was similar to measured conditions at low flow but too large at high flow, the outermost area (shallowest part of the notch) of the dam was lowered to allow more flow-through at higher flows. These determinations were driven by modeler’s judgement. No calibration was performed on the hypothetical no-dam scenarios.
Analyses
A primary goal of this study was to assess the extent to which beaver dams influence hydrograph dynamics during storm flows. Model output of hydrographs and cumulative flows were compared from three measured storm events and terrains representing with-dams and no-dams conditions.
Analyses of streamflow hydrographs can be used to evaluate the rate at which water enters and exits the modeled reach; however, small differences in streamflow can result in large differences in the total volume of water exiting the reach when integrated over time. Hydrographs for the three storm events were compared between with-dams and no-dams to assess differences in flow magnitude, flow duration, and flow recession. Streamflow was evaluated at several locations in each model to compare upstream and downstream hydrographs both within individual model runs, as well as between with-dam and no-dam model runs.
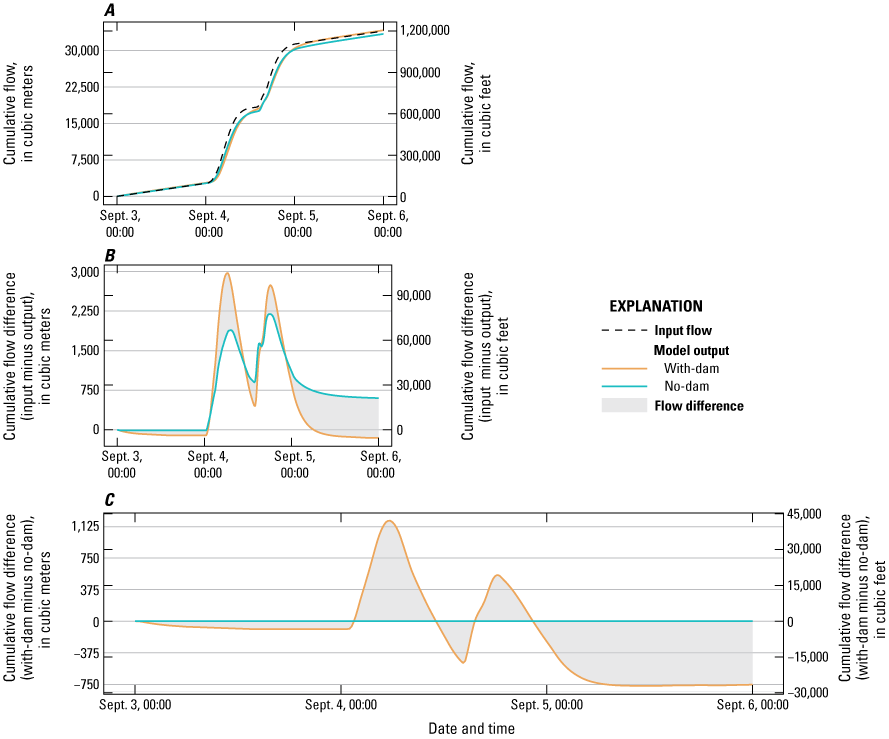
Comparing the total amount of water, or cumulative flow, that entered and exited each reach can be used to determine how beaver dams affect the storage of water throughout the duration of a storm event. Time series were generated whereby cumulative flow was calculated as the integral of streamflow. Time series of cumulative flow exiting each model reach (output flows) were subtracted from cumulative flow entering the model reach (input flows). Under steady-state conditions, where inflows equal outflows, there is effectively no change in transient storage in the model reach. When inflows exceed outflows, such as during storm events, the difference of cumulative flow between inputs and outputs is indicative of an increase in transient water storage provided by the channel and floodplains, including beaver ponds. Comparing input and output cumulative flow facilitates analysis of how much water is stored throughout the model reach at a given time in the analysis.
Outputs of the steady-state models at four flows were compared to make comparisons of depth, velocity, and inundated area between with-dam and no-dam scenarios to assess how beaver dams affect the hydraulic characteristics and area of potential aquatic habitats. Although these variables are interrelated, each are also individually important for characterizing aquatic habitats and ecosystems. Rasters of each parameter were exported from HEC-RAS as a geo-referenced Tagged Image File Format (GeoTIFF) file and analyzed in the R Programming Language (R Core Team, 2024). Water depth and velocity rasters from the with-dam scenario were summarized by assessing the distribution of each variable and then comparing those distributions to results from the no-dam model scenario. Total wetted area was calculated for each inundated area polygon to compare the total amount of water present in each model run.
Model Limitations
The two-dimensional hydraulic models created in this study facilitate comparison of channel hydraulics produced by storm events under with-dam conditions as well under theoretical no-dam conditions where no beaver dams are present along the study reaches. While this approach helps to characterize the specific role of beaver dams in influencing flow dynamics, it has three important limitations. First, the model does not allow for any infiltration of water into the subsurface. Enhanced hyporheic exchange associated with beaver dams has been demonstrated in other studies (Briggs and others, 2013; Majerova and others, 2015). However, the sediment composition at the Fanno Creek and Bronson Creek study reaches consists primarily of silts and clays, indicating the streambed has limited porosity and infiltration capacity, thus minimizing any errors associated with this model limitation. Nonetheless, an unknown but small amount of infiltration likely occurs along each reach, which could lead to small changes in streamflow dynamics. Similarly, because water can only exit the models at specified boundary conditions, it cannot infiltrate into the groundwater or evaporate. Thus, if a cell is wetted during high flows but is hydraulically disconnected or stranded on the floodplain as flows decrease, the model will represent this cell as pooled water. While this pooling occurs along these reaches, it is likely that the model overestimates this abandonment because water on the landscape can utilize flow-paths that are finer than the resolution of the DEMs. This may cause the models to exaggerate how much water is stored on the floodplains and by extension, the potential attenuation of peak flows. The exact amount of this erroneous storage is unknown but is likely small relative to the volume of water flowing through the reach. Second, the Fanno Creek study reach has two small footbridges that may affect channel hydraulics at high flow. These bridges were not included in the model because modeling software did not support two-dimensional bridge infrastructure at the time of model development. Two of the three bridges in Fanno Creek obstruct flow at observed flows of 3.8 m3/s, resulting in greater inundated areas than simulated. While this difference reduces the accuracy of replicating observed conditions during these flows, it also prevents misappropriating temporary storage due to bridges instead of dams. Finally, beavers create broader changes in stream channels and adjacent riparian areas than just building dams in the channel. For example, beavers source dam materials from local vegetation and dig access channels through ponded areas, altering floodplain roughness, and their dams result in an accumulation of sediment in the channel and the floodplain. These and other effects of beaver activity on hydraulics were not evaluated in this study; however, many secondary affects would be limited to where beavers colonize and build dams, not where human-made structures, such as beaver dam analogs, are built.
Results
Both the with-dam and no-dam scenarios for each of the three storm events and four steady-state streamflows were modeled for the Fanno Creek and Bronson Creek study reaches. Calibration models were run only on with-dam scenarios (table 4). Results of these 24 model runs (20 simulations to address study objectives; 4 calibration simulations) are described in this section.
Model Calibration
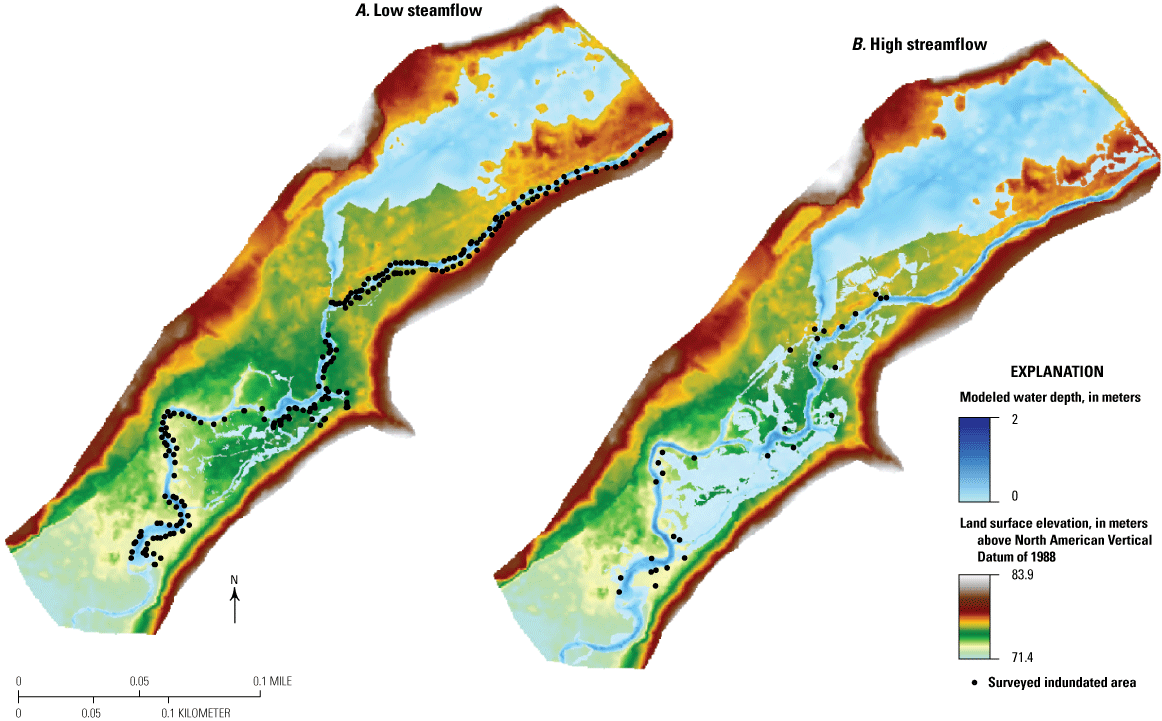
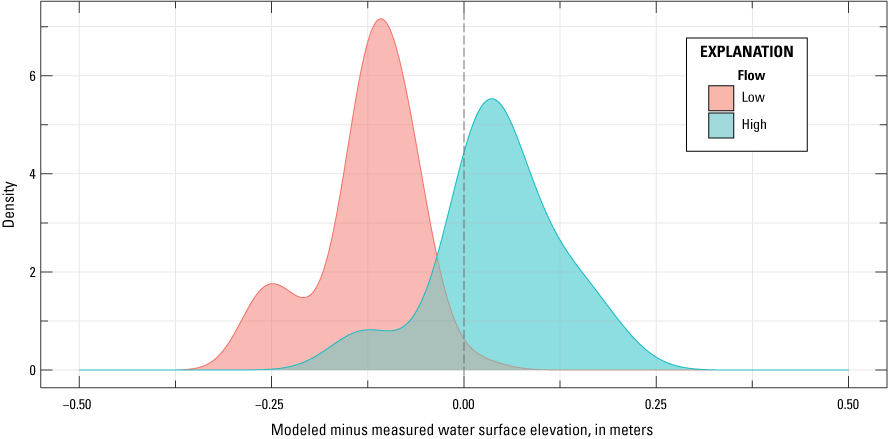
Overall, simulated water-surface elevations along both the Fanno Creek and Bronson Creek model reaches compared reasonably well to measured water-surface elevations over a range of streamflows (table 4; figs. 7–10). Patterns of inundation were also well represented by the hydraulic models, though the models generally produced slightly lower inundated area than observed. In both reaches, model residuals were greater at low flow than at high flow (table 4). The median low flow WSE error at Fanno and Bronson Creeks were −0.24 m and −0.12 m, respectively, whereas median high flow WSE errors were −0.11 and 0.05 m, respectively (table 4).
Simulated wetted area in the south pond at Fanno Creek was slightly less than measured conditions at both base and high flow (fig. 8). The shallow slope of the bathymetry of this pond, as well as the dam creating it, makes its volume and surface area sensitive to changes in WSE; thus, a small under representation of WSE can result in relatively large differences in wetted area. The floodplain in the northwest part of the Fanno Creek study reach shows a lower simulated inundated area than was measured at high flow. This is partly attributable to the footbridge downstream from the north pond; this bridge has a lower deck that diverts water onto the floodplain at high flows.
Table 4.
Goodness-of-fit statistics for water-surface elevation comparisons (modeled water-surface elevation minus measured) for Fanno and Bronson Creeks at low and high streamflows, Tualatin River Basin, northwestern Oregon.[Data from White (2025). Abbreviations: Q, streamflow; m3/s, cubic meter per second; m, meter; RMSE, root-mean square error]
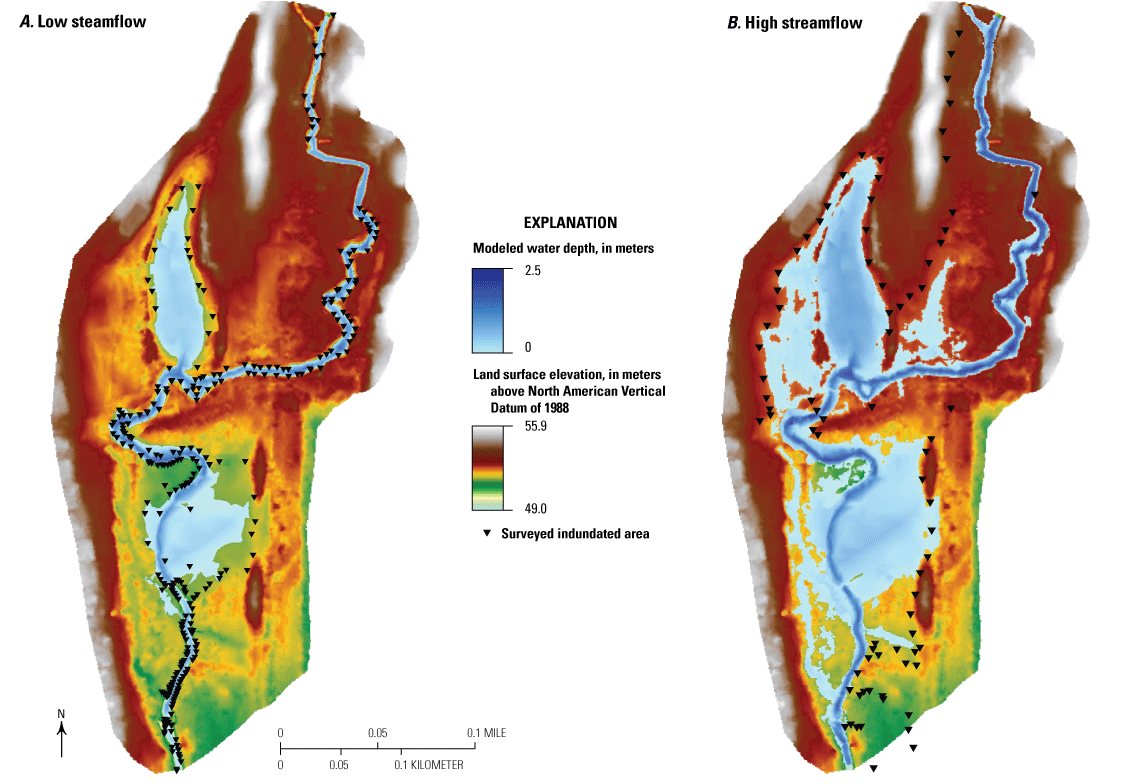
Modeled water depth and surveyed inundated area at low (0.04 cubic meters per second) and high (6.80 cubic meters per second) streamflows along the Fanno Creek study reach, Tualatin River Basin, northwestern Oregon (White, 2025).
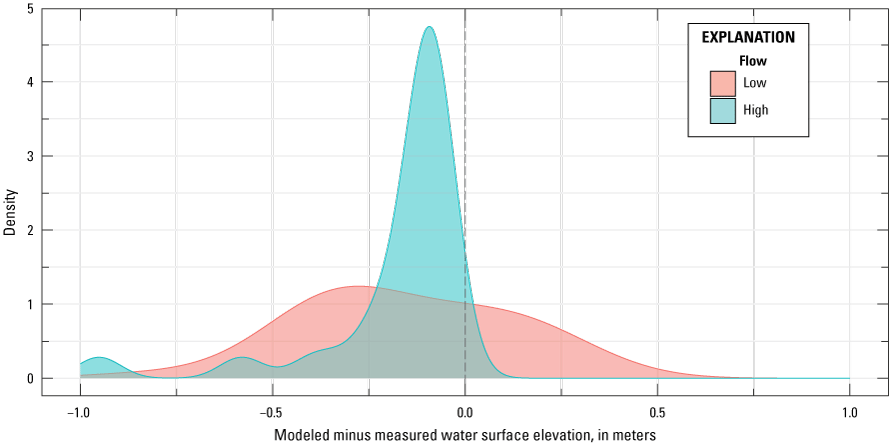
Distribution of water-surface elevation errors for low flow (0.04 cubic meters per second) and high flow (6.8 cubic meters per second) from calibration for the Fanno Creek study reach, Tualatin River Basin, northwestern Oregon (White, 2025). A total of 308 measurements were used for the low flow comparison, while 81 measurements were used for the high flow comparison.
Comparisons of modeled and measured WSEs for the Bronson Creek study reach show close agreement along the main channel and mid-reach side-channel during low flow (fig. 10). Modeled WSE at high water is overestimated compared to surveyed high water marks, where the error mode is about 0.03 m. Due to access difficulties, the inundated areas near the northern off-channel pond and side channel downstream from the second large beaver dam were not measured, which increases the uncertainty of this evaluation of model results under high flow conditions.
Modeled water depth and surveyed inundated area at low (0.031 cubic meters per second) and high (1.67 cubic meters per second) streamflows along the Bronson Creek study reach, Tualatin River Basin, northwestern Oregon (White, 2025).
Distribution of water surface model errors at low flow (0.031 cubic meters per second) and high flow (1.67 cubic meters per second) from calibration for the Bronson Creek study reach, Tualatin River Basin, northwestern Oregon (White, 2025). A total of 229 measurements were used in the low flow comparison, while 31 were used in the high flow comparison.
Hydrograph Comparison
Comparing input hydrographs with their downstream counterparts for both with-dam and no-dam models facilitates an analysis of differences in travel time, flow magnitude, and storm flow duration and recession (table 5; figs. 11–16). For the smallest modeled storm events, peak streamflow magnitude was reduced slightly by 2.0 percent (−0.027 m3/s) and 4.8 percent (−0.031 m3/s) along the Fanno and Bronson Creek study reaches, respectively (figs. 11 and 14, table 5). However, peak streamflow magnitudes increased slightly with dams for both reaches under moderate and large storms. Fanno Creek peak flows increased by 1.1 percent (0.039 m3/s) and 0.9 percent (0.079 m3/s) at moderate and large flows, respectively (figs. 12 and 13, table 5), whereas Bronson Creek peak flows increased by 4.6 percent and 2.8 percent (0.052 and 0.059 m3/s) (figs. 15 and 16, table 5).
In all modeled scenarios, the presence of beaver dams results in a short delay in the initiation of stormflows as well as a slight elongation of the receding limb of the hydrograph. At Fanno Creek, only the small storm showed a delay in timing of the peak streamflow magnitude as a result of dams; however, this delay was less than 15 minutes. The moderate storm event at Fanno Creek showed nearly identical timing in peak streamflow magnitudes, while the presence of dams during the large storm event caused the peak streamflow magnitude to occur roughly 30 minutes sooner than in the no-dams scenario. Peak streamflows at Bronson Creek were delayed roughly an hour for the small and moderate storm events with dams, although dams resulted in peak flows occurring roughly an hour sooner in the large storm event.
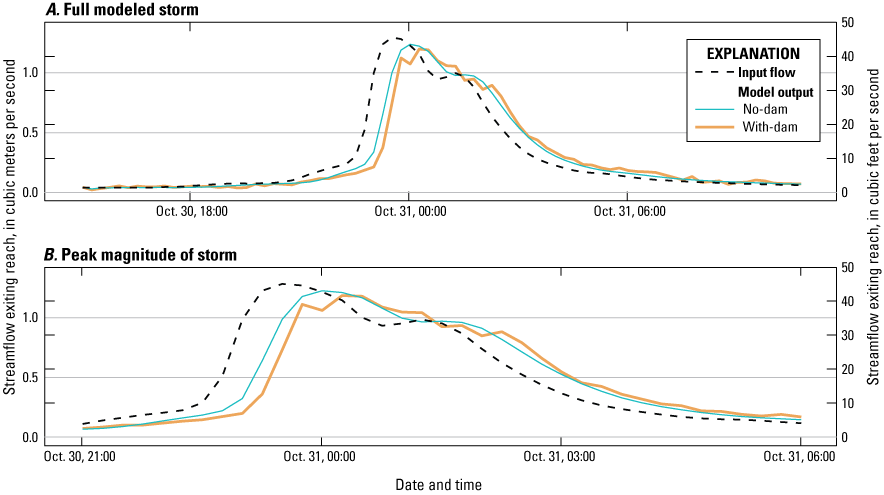
Input and output hydrographs for with-dams and no-dams scenarios during small storm simulation at Fanno Creek, Tualatin River Basin, northwestern Oregon (White, 2025). A, full modeled storm; B, peak magnitude of the event.
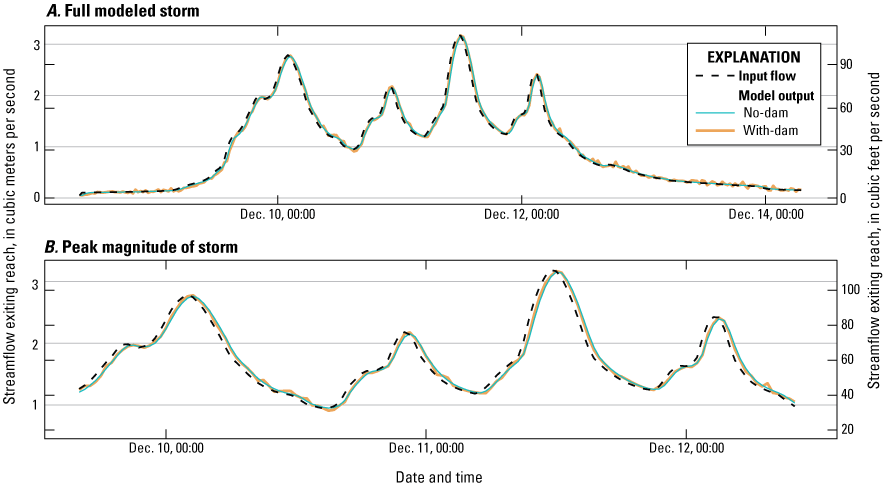
Input and output hydrographs for with-dams and no-dams scenarios during moderate storm simulation at Fanno Creek, Tualatin River Basin, northwestern Oregon (White, 2025). A, full modeled storm; B, peak magnitude of the event.
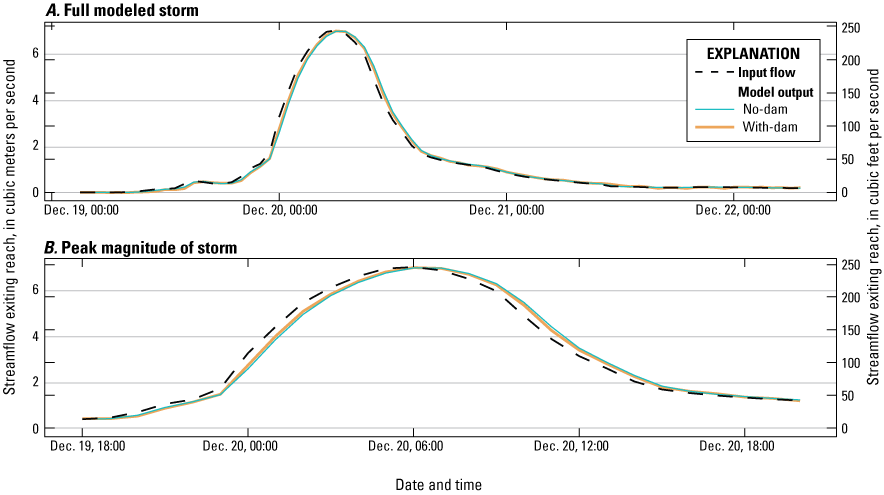
Input and output hydrographs for with-dams and no-dams scenarios during large storm simulation at Fanno Creek, Tualatin River Basin, northwestern Oregon (White, 2025). A, full modeled storm; B, peak magnitude of the event.
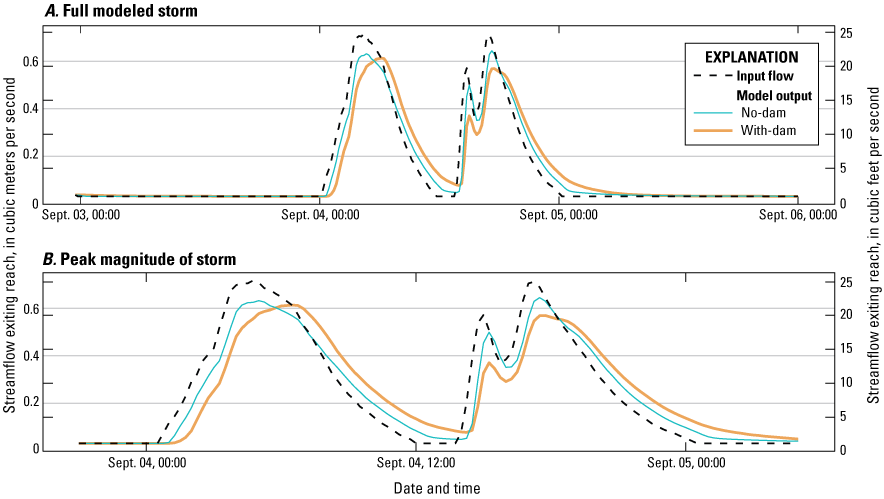
Input and output hydrographs for with-dams and no-dams scenarios during small storm simulation at Bronson Creek, Tualatin River Basin, northwestern Oregon (White, 2025). A, full modeled storm; B, peak magnitude of the event.
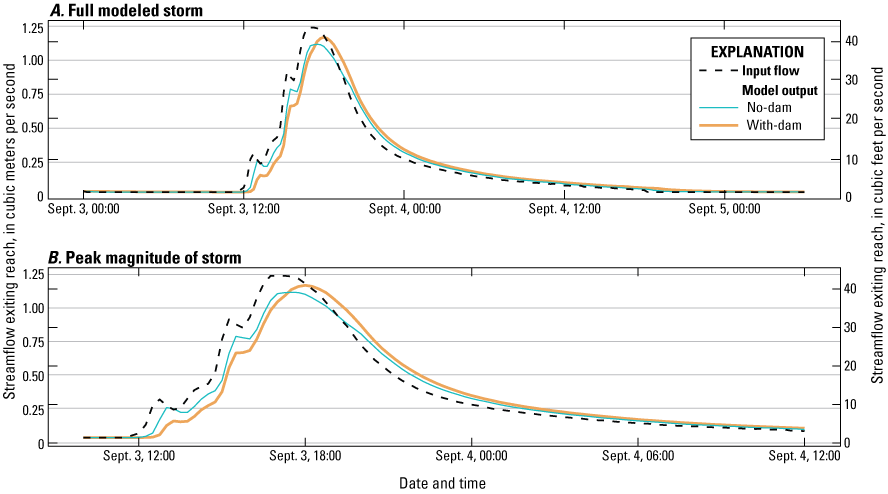
Input and output hydrographs for with-dams and no-dams scenarios during moderate storm simulation at Bronson Creek, Tualatin River Basin, northwestern Oregon (White, 2025). A, full modeled storm; B, peak magnitude of the event.
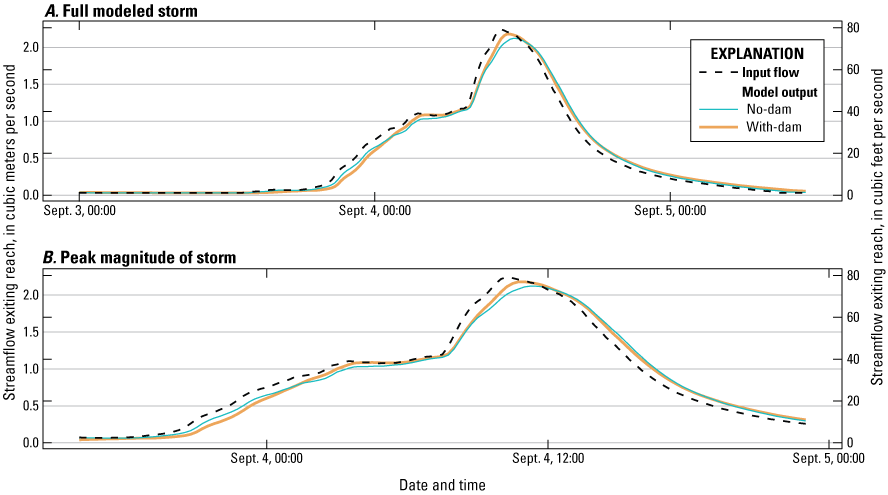
Input and output hydrographs for with-dams and no-dams scenarios during large storm simulation at Bronson Creek, Tualatin River Basin, northwestern Oregon (White, 2025). A, full modeled storm; B, peak magnitude of the event.
Cumulative Flow Comparison
Comparing the total volume of flow that has entered and exited each reach (henceforth referred to as “cumulative flow”) facilitates a comparison of results across the duration of the storm event. Model results show that reaches with beaver dams store considerably more water than their non-dammed counterparts (figs. 17–23). The magnitude and duration of these changes, however, varies by storm magnitude and reach.
Instantaneous streamflow can be used to track changes to streamflow peak magnitudes; however, differences in the cumulative volume of streamflow period provides a broader measure of beaver dams influence water storage. Cumulative flow between the with-dam and no-dam models shows that beaver dams increase storage of water in the channel and the floodplain during all storms, with the exception of the largest modeled storm at Bronson Creek. Differences in peak flows and volume are summarized in table 5.
Cumulative streamflow for the Fanno Creek study reach shows a consistent trend of water storage by beaver dams throughout all modeled storms. The presence of beaver dams results in considerably more water storage throughout the modeled events, storing 0.22–3.1 percent more water throughout the storm compared to the no-dams scenarios. During peak storm flows, dams resulted in 914–1,249 m3 more transient storage (figs. 17–19; table 5). During moderate and large storms in the with-dams scenario, some water in the floodplain becomes hydraulically disconnected as flows recede, resulting in a net positive amount of transient storage at the end of the modeled period.
Table 5.
Summary of peak flow and flow accumulation differences for the Fanno and Bronson Creek study reaches for with-dam and no-dam model scenarios.[Data from White (2025). All results reflect subtracting no-dam results from with-dam results. Abbreviations: m3/s, cubic meters per second; m3, cubic meters]
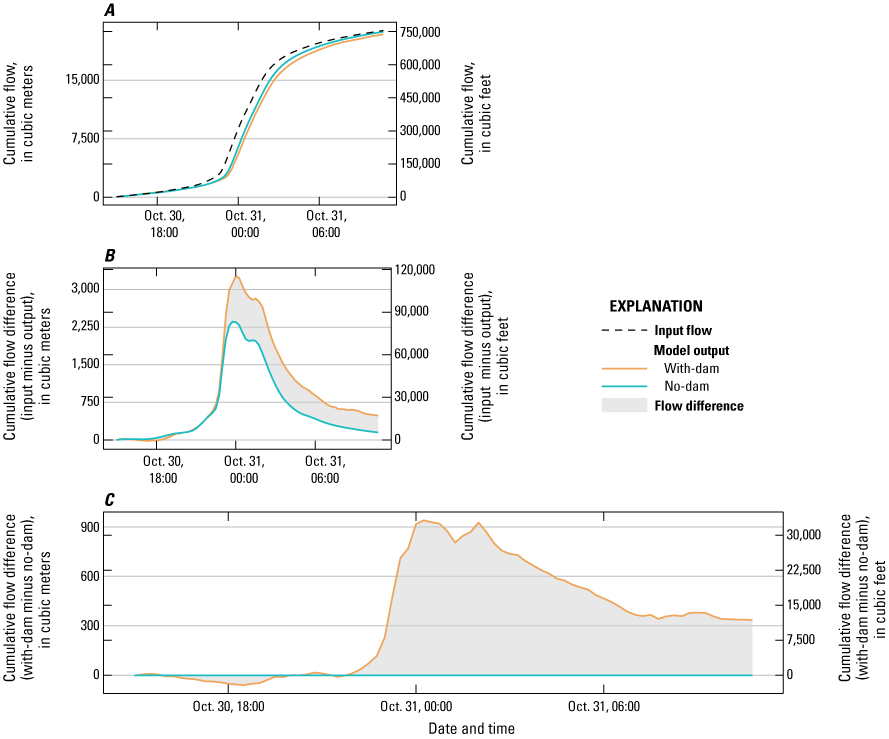
Cumulative flow data for small storm event at Fanno Creek, Tualatin River Basin, northwestern Oregon (White, 2025). Plot A is cumulative flow of input flows and downstream cumulative flows for with-dams and no-dams scenarios; plot B is time series difference of input minus output cumulative flows; and plot C is time series difference between the with-dams and no-dams models (the shaded area of plot B).
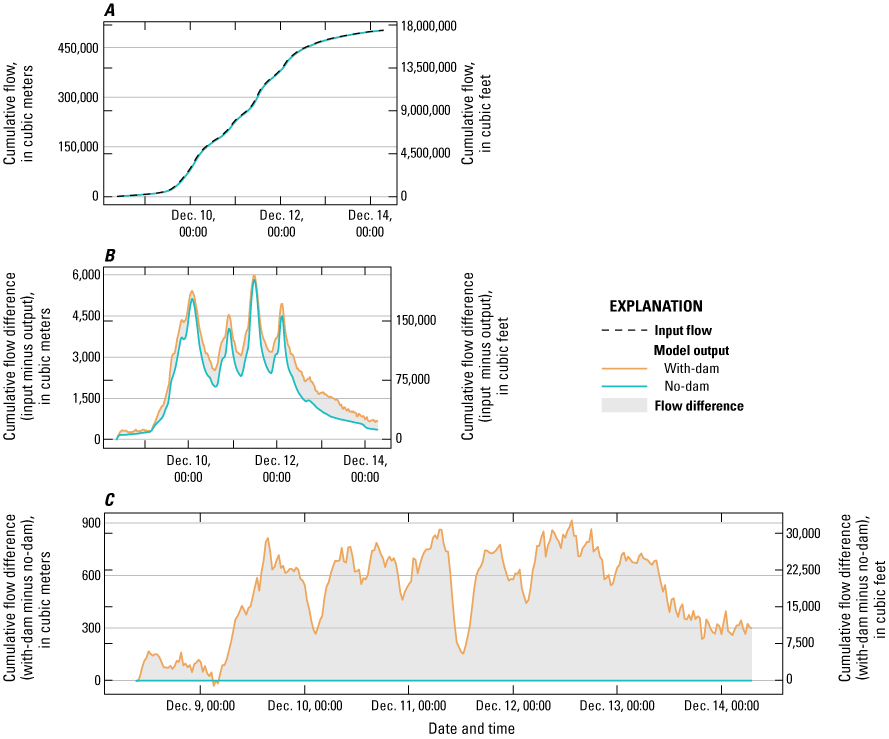
Cumulative flow data for moderate storm event at Fanno Creek, Tualatin River Basin, northwestern Oregon (White, 2025). Plot A is total cumulative flow of input flows and downstream cumulative flows for with-dams and no-dams scenarios; plot B is time series difference of input minus output cumulative flows; and plot C is time series difference between the with-dam and no-dam models (the shaded area of plot B).
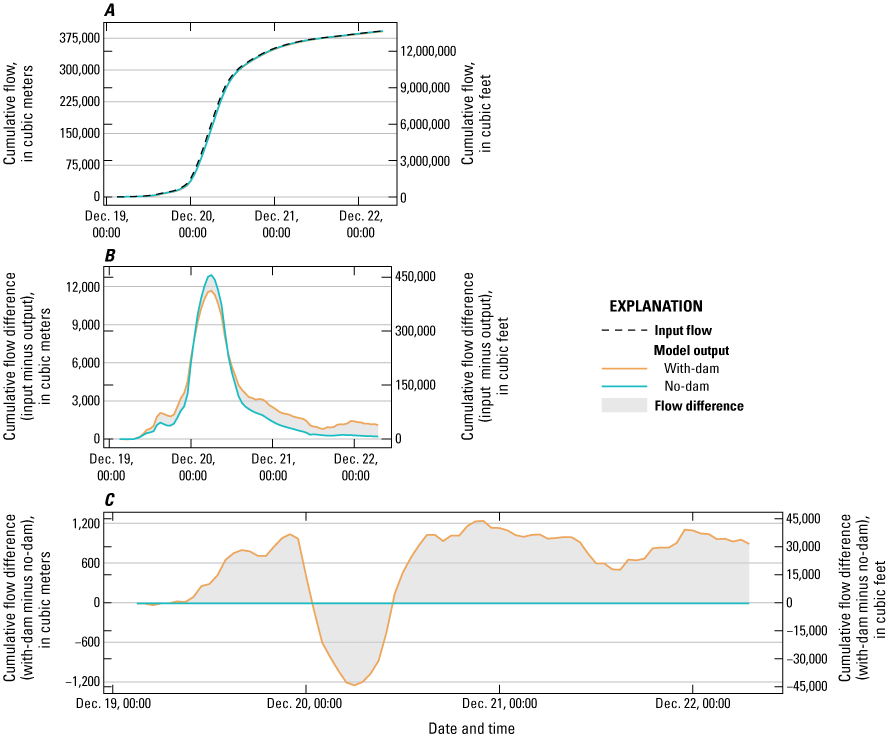
Cumulative flow data for large storm event at Fanno Creek, Tualatin River Basin, northwestern Oregon (White, 2025). Plot A is total cumulative flow of input flows and downstream cumulative flows for with-dams and no-dams scenarios; plot B is time series difference of input minus output cumulative flows; and plot C is the time series difference between the with-dam and no-dam models (the shaded area of plot B).
Cumulative flow results and analyses from the Bronson Creek study reach are complicated by the presence of a large off-channel pond in the upper and northern part of the reach (figs. 3 and 9). This pond is inundated during base flows in the with-dams scenario but is primarily dry during equivalent flows in the no-dams scenario. The narrow channel connecting this pond to the channel also contains an approximately 0.5 m tall sill, which acts to trap water behind it, once inundated. The pond becomes inundated during all storm events, however, and effectively traps water in the no-dam scenarios, resulting in some hydraulically disconnected water at the end of the storm events and a net positive difference of inflows minus outflows. Because the off-channel pond is primarily dry before storms in the no-dams scenario, more space is available for off-channel and floodplain storage of stormwater. Even though some of that off-channel storage is already filled prior to the arrival of the storm flows in the with-dams scenario, more water enters the pond under the with-dams scenario than under the no-dams scenario, but the same amount of water that enters the pond exits the pond by the end of the storm simulation (fig. 20).
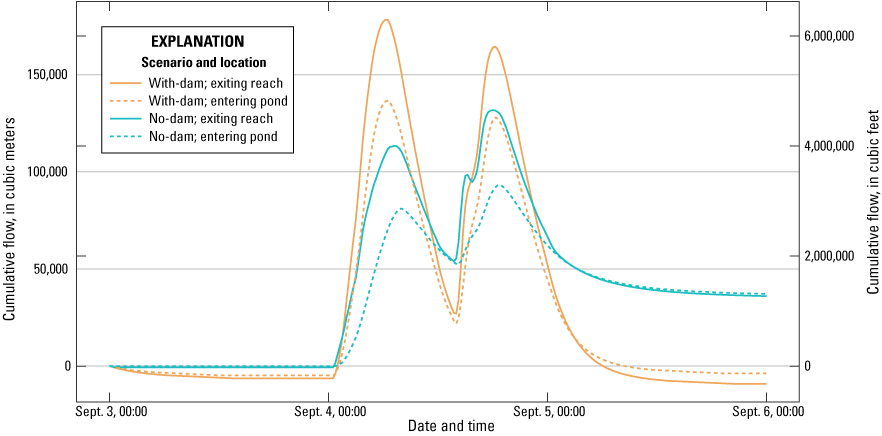
Example of the effect of water abandonment in the off-channel pond in the Bronson Creek study reach, Tualatin River Basin, northwestern Oregon, September 3–6 (White, 2025). More water enters the pond than exits under the no-dams model scenario.
Cumulative flow data for small storm event at Bronson Creek, Tualatin River Basin, northwestern Oregon (White, 2025). Plot A is total cumulative flow of input hydrographs and downstream cumulative flows for with-dams and no-dams scenarios; plot B is time series difference of input minus output cumulative flows; and plot C is the time series difference between the with-dam and no-dam models (the shaded area of plot B).
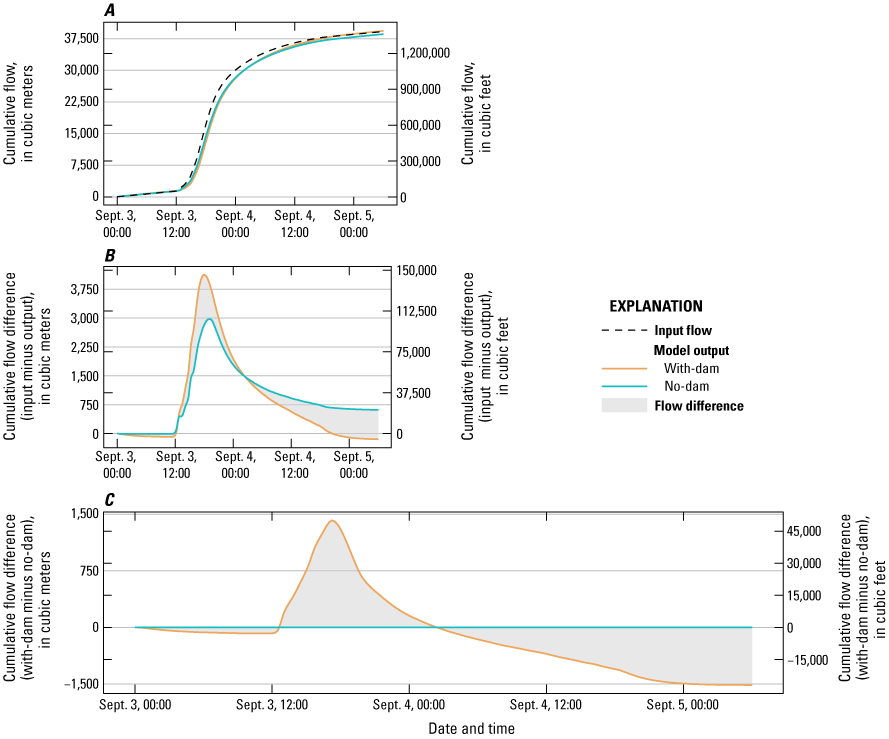
Cumulative flow data for moderate storm event at Bronson Creek, Tualatin River Basin, northwestern Oregon (White, 2025). Plot A is total cumulative flow of input hydrographs and downstream cumulative flows for with-dams and no-dams scenarios; plot B is time series difference of input minus output cumulative flows; and plot C is the time series difference between the with-dam and no-dam model (the shaded area of plot B).
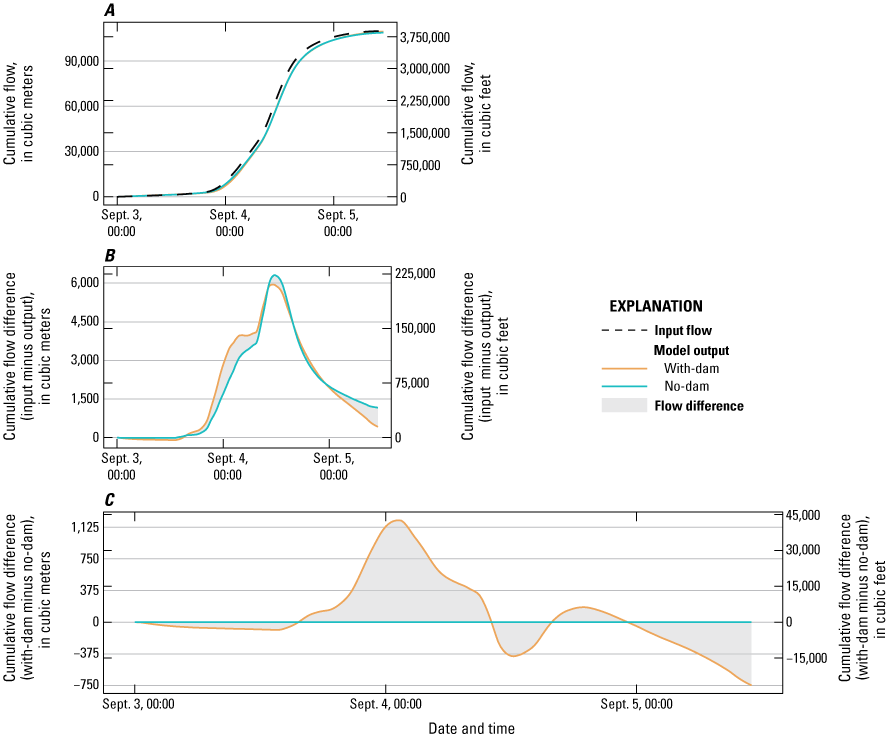
Cumulative flow data for large storm event at Bronson Creek, Tualatin River Basin, northwestern Oregon (White, 2025). Plot A is total cumulative flow of input hydrographs and downstream cumulative flows for with-dams and no-dams scenarios; plot B is time series difference of input minus output cumulative flows; and plot C is the time series difference between the with-dam and no-dam model (the shaded area of plot B).
Steady-State Comparison
Comparing depth, velocity, and inundated area between model scenarios with and without beaver dams at a variety of steady-state streamflows facilitates evaluation of the broad hydraulic effects of beaver dams on streams, which ultimately can manifest in changes to aquatic habitats. Model results of Fanno Creek and Bronson Creek study reaches show large differences in stream hydraulics between the with-dam and no-dam models but, as with the results of the storm flow analysis, these differences diminish as flows increase.
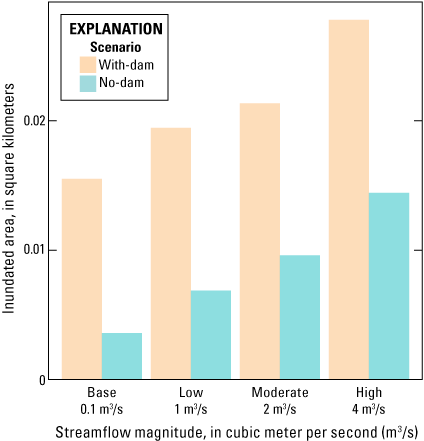
The presence of beaver dams results in more than four-times the inundated area at low flow compared to the no-dam scenarios (figs. 24 and 26). However, as flows increase, the inundated area of dammed reaches grows slower than in the no-dam models, resulting in progressively smaller differences between the two conditions. At the highest modeled steady-state streamflow, total inundated area for the with-dam scenario was less than twice as large as in the no-dam scenario.
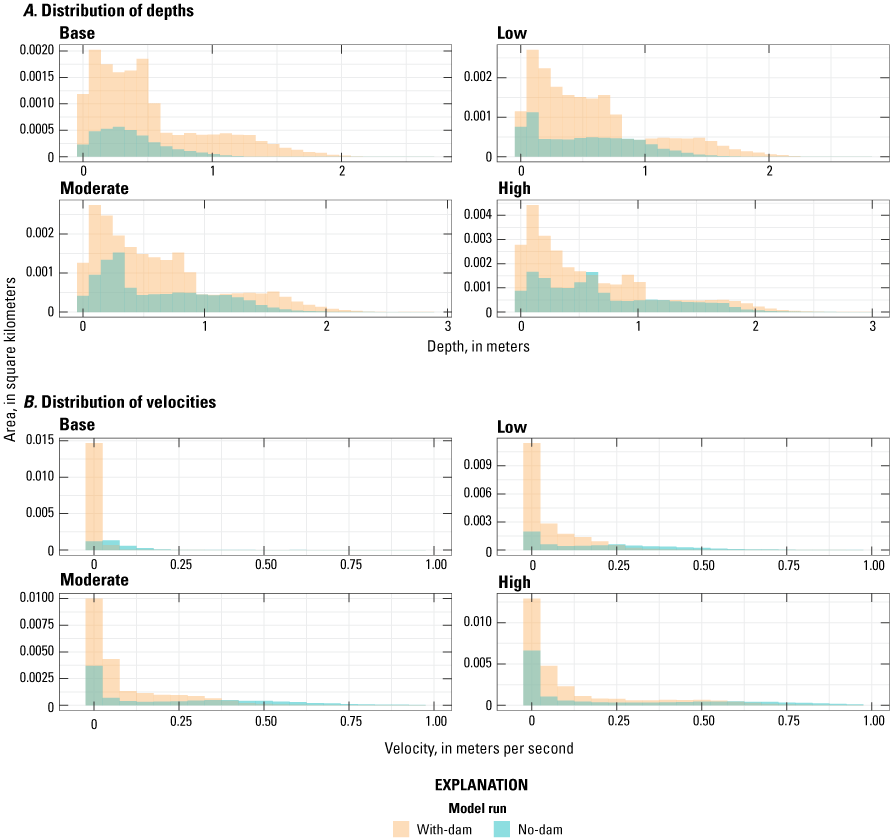
The differences in inundated areas are evident when comparing distributions of water depths and velocities (figs. 25 and 27) and suggest that differences between with-dam and no-dam model scenarios are greatest at low and moderate flows, but differences diminish as flows increase. Overall, median depths and inundated area are always greater with dams than without, while median velocities are always lower with dams than without. This aligns with results from the hydrograph findings that stream dynamics converge at the highest modeled flows.
Comparison of inundated area for with-dam and no-dam model scenarios during steady flows for base, low, moderate, and high flows in the Fanno Creek study reach, Tualatin River Basin, northwestern Oregon (White, 2025).
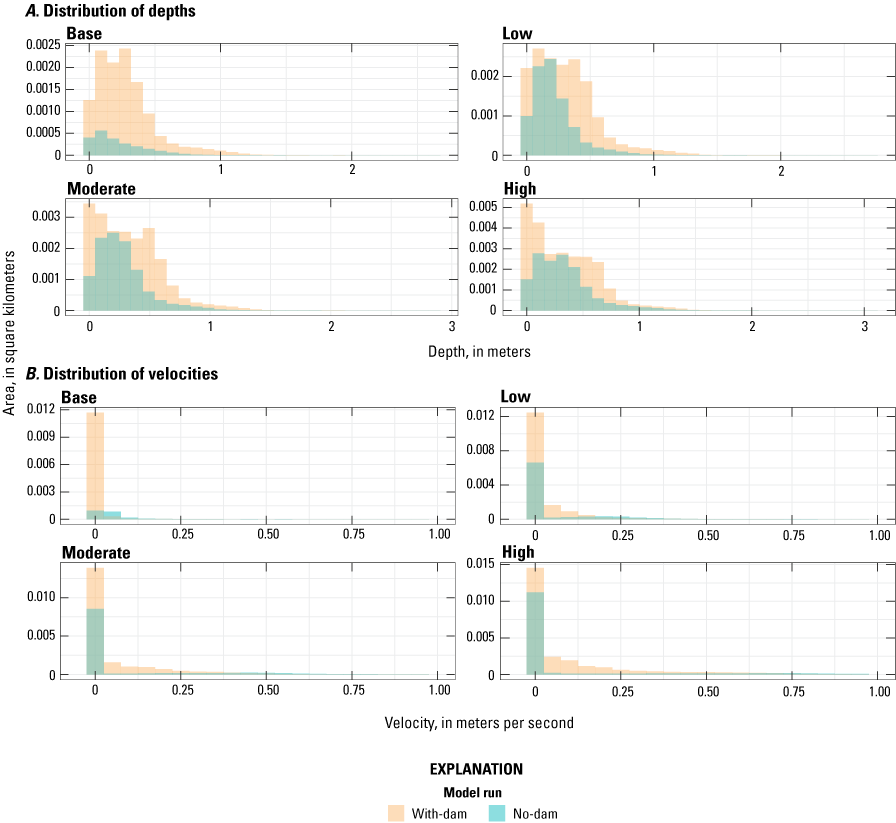
Distribution of depths (A) and velocities (B) of with-dam and no-dam steady-state streamflow scenarios for base, low, moderate, and high flows in the Fanno Creek study reach, Tualatin River Basin, northwestern Oregon (White, 2025). With-dam results are behind the no-dam results. [Base, 0.1 cubic meters per second (m3/s); Low, 1 m3/s; Moderate, 2 m3/s; High, 4 m3/s.]
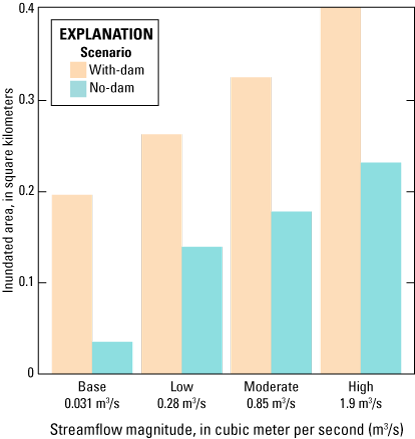
Comparison of inundated area for with-dam and no-dam model scenarios during steady flows for base, low, moderate, and high flows in the Bronson Creek study reach, Tualatin River Basin, northwestern Oregon (White, 2025).
Distribution of depths (A) and velocities (B) of with-dam and no-dam steady-state streamflow scenarios for base, low, moderate, and high flows in the Bronson Creek study reach, Tualatin River Basin, northwestern Oregon (White, 2025). With-dam results are behind the no-dam results. [Base, 0.031 cubic meters per second (m3/s); Low, 0.28 m3/s; Moderate, 0.85 m3/s; High, 1.9 m3/s.]
Discussion
Taken together, findings from the model scenarios highlight the role of beaver dams in affecting storm flow hydrology and channel hydraulics over a range of streamflows as measured by hydrograph characteristics as well as water depths, velocities, wetted areas, and storage in the channel and floodplain. However, the relative influence of beaver dams varies depending on the characteristics of the beaver dams, the channels, the surrounding floodplains, and the flow events. Results suggest that reach characteristics, particularly the presence of off-channel features, such as ponds and backwaters, are important to determining how much additional water storage is provided with beaver dams, as is the amount of antecedent storage that is available prior to and during a storm event. Beaver dams can facilitate hydraulic connectivity between the main channel and off-channel features, allowing them to be inundated at lower magnitude streamflows than would occur without dams. Although this increased “connectivity” to off-channel features increases the storage potential of the reach during small storm events, it also reduces the total amount of volume available for transient storm-related storage because these features are partially or fully filled at base flow or during relatively modest storms and cannot accrue substantial additional storm flows on the rising limb of larger peak flow events. In contrast, the same reach without dams may require larger flows to inundate off-channel features, but because they are mostly empty at base flows, those features provide larger amounts of temporary water storage during large storm events.
Model results from no-dam scenarios show that temporary storage and flow attenuation occur without dams as off-channel features are incrementally inundated (table 5), though to a smaller magnitude compared to with-dam scenarios. This usage of off-channel storage is most evident during large storms, in locations where both Fanno and Bronson Creeks flow overtop their banks and water flows into floodplains even in the absence of beaver dams. The hydraulic connections between these streams and their floodplains highlight two important points: (1) the urban streams and floodplains in this study can temporarily store water, and not all such storage is attributable to beaver dams; and (2) beaver dams are likely to have the largest relative effect on off-channel water storage in reaches that have fewer connections between the channel and the adjacent floodplain, such as in incised streams. The valley setting will also dictate hydraulic responses to beaver dams, as highly confined streams may not have adjacent floodplains that are readily inundated. The extent to which geomorphic setting, such as valley or bank confinement, influences the effectiveness of beaver dams at attenuating stormwater was beyond the scope of this study but could be considered by managers prioritizing locations and strategies for beaver-related stream restoration. Similarly, the influences of dam composition, orientation, and size were not evaluated but may be important considerations for how dams influence water storage. Furthermore, potential geomorphic or vegetative adjustments resulting from beaver dams, such as channel deposition or changes to adjacent riparian vegetation and roughness, were not evaluated in this study. Thus, the long-term effects of the presence of beaver dams on channel hydraulics are unknown.
Despite the relatively small changes in modeled peak flow magnitudes between with-dam and no-dam conditions, results from the cumulative flow analysis suggest that the presence of dams result in considerably more temporary water storage throughout the duration of storm events, particularly near the storm flow peak (table 5; figs. 18–23). Both reaches show that beaver dams result in more stored water during the highest flows of the storms for all modeled storm events, with the exception of the largest storm at Bronson Creek (figs. 18–23), where the no-dam model stored slightly more water at peak flows. While this increased storage does not translate into substantial differences in hydrographs between with-dam and no-dam model scenarios, the heightened storage may have important implications for downstream reaches. For example, results suggest that the presence of beaver dams can increase in-channel and floodplain water storage by between 0.5 and 2 percent of total storm flows, effectively slowing delivery of this water downstream (table 5). If this effect is cumulative in subsequent downstream reaches, a series of beaver dam complexes may provide enough storage to substantially reduce peak flows along an urban stream network.
Results from the model calibration suggest that the hydraulic models simulate observed water-surface elevations and, by extension, inundated extent reasonably well (figs. 7-10). Results from the model calibration also indicate that the modeled time series outputs of streamflow are reasonable, but these results are insufficient to formally quantify uncertainty in these time series outputs. Additionally, because the no-dam models rely on hypothetical topographic conditions, uncertainty in resulting time series outputs could not be quantified. Therefore, it is difficult to directly assess uncertainty in hydrograph comparisons and determine what differences are attributable to beaver dams versus model error. Many sources of potential error are consistent across the various modeled streamflows, and therefore, it is best to compare relative differences in hydrograph responses of the different storm magnitudes to evaluate how dams affect hydraulics and streamflow. For example, in both reaches, we see the greatest difference in streamflow and flow accumulation differences in the smallest modeled storm flows and, generally, the least at highest flows. These results align with findings from the steady-state modeling, which show that differences in hydraulic conditions at both reaches are the greatest at low flows and the lowest at high flows (figs. 24–27).
Overall, beaver dams in these two urban reaches do not appear to have a substantial effect on the duration, timing, and magnitude of streamflow events because changes in these hydrograph characteristics in the with-dams and no-dams scenarios are modest (table 5; figs. 11–16). All modeled storms show that beaver dams cause a slight elongation of the hydrograph, typically on the order of 1 hour or less. The timing of peak streamflow also does not appear to change with the presence of beaver dams because both studied stream reaches showed mixed results for the relative timing of model scenario peak streamflow timing. In two of the three instances when dams result in a delay of peak flow, the magnitude of peak flow is reduced; however, this is not the case for the moderate storm event at Bronson Creek. Overall, these results indicate that beaver dams can have a modest effect on storm flow hydrographs at small flows, but these effects are muted at higher flows, largely because higher flows that overtop channel banks in no-dams scenarios will eventually overwhelm the effects of the dams.
The general insights gained from these model results could be applicable to other urban stream environments with similar morphologies and valley settings, but other relevant factors (such as upstream drainage areas, reach length, and storm magnitudes) should be considered when placing this study’s findings in broader context and trying to extend the results to other urban streams. The study reaches at Fanno and Bronson Creeks drain 27 and 5.6 km2, respectively, and both reaches are roughly 1-km long. Even with the numerous large beaver dams present in both reaches, it is difficult for beaver dams to effect fundamental changes in the streams’ storm flow hydrographs due to the size of the stream and the length of the study reach compared to the upstream contributing area. Reaches with greater capacity to increase transient flow storage during flood events (such as longer reaches or more or larger beaver dams), may demonstrate a different relation between flood magnitude and attenuation, which highlights the importance of understanding how successive reaches with dams would further influence storm flows. Stream reaches with smaller upstream contributing areas may also experience larger hydrograph changes with beaver dams. Additionally, the modeled hydrographs in both reaches are flashy, even during small storms, such that the streams rise from base flow to over 20 times base flow then return to base flow in less than 24 hours. The quick pulses of storm flows in combination with the hydraulic characteristics of the modeled reaches may limit the ability of beaver dams to store and impede the added flow; however, this hypothesis would require additional modeling or observations for confirmation.
Beaver dams influence streams more broadly than potentially attenuating streamflows. By impounding water in the channel and floodplain, slowing streamflow, and dispersing stormwater across the local floodplains, beaver dams fundamentally change the local aquatic and adjacent riparian ecosystems. The steady-state streamflow analysis highlighted these effects, showing that dams alter channel hydraulics (depth, velocity, wetted area; figs. 24–27) and, by extension, aquatic habitats, during all modeled flows. Both the Fanno and Bronson Creek study reaches show that dams cause roughly 1.5–5 times more wetted area (figs. 24 and 26), and the additional wetted areas mostly have velocities less than 0.5 m/s (figs. 25 and 27). Differences in depths, velocities, and inundated areas between with-dam and no-dam conditions are most pronounced at low flows (figs. 24 and 26), with more convergence between with-dam and no-dam scenarios for all three parameters at successively higher flows. Dams in both study reaches generally result in more diverse hydraulic conditions compared to their respective undammed scenarios (figs. 24 and 26). Therefore, even if dams create an abundance of slow-water habitat, a broader range of conditions (including for example, swift areas in main channel immediately below the dams, coupled with margin areas with diverse depths and velocities) is available for organisms to inhabit when beaver dams and ponds are present.
The pooling of water created by beaver dams can also create complex thermal patterns and the trapping of fine sediment, as documented for the Fanno and Bronson Creek study reaches (Smith and others, 2025; Doyle and others, 2025). For example, the slowing and dispersing of water also increase sediment deposition and decrease suspended sediment transport from these reaches (Doyle and others, 2025). Additionally, thermal stratification has been measured in the slow pools behind beaver dams in Fanno Creek, resulting in a warm epilimnion and cooler hypolimnion (Smith and others, 2025). The slowing and dispersing of water also increases residence time of streamflows in reaches with beaver dams. In summer, the result of this increased residence time may be a net warming effect because a greater thermal load is exerted on a larger and often shallow pooled area of water. However, thermal response to the presence of dams will likely vary depending on the shape, size, and composition of individual beaver dams. The increase of hydraulic head caused by ponding behind dams has been shown to increase hyporheic flux in some river systems (Majerova and others, 2015), leading to localized cooling. Although some increase in hyporheic flow is likely with beaver dams in Tualatin River Basin streams, the extremely fine sediment and hard clay that blankets the valley bottom greatly diminish the potential for such hyporheic flow. Evaluating the extent to which dams increase this flux was beyond the scope of this study, but field measurements corroborated the existence of relatively low-permeability clays in some reaches of the studied stream channels. Although insights from this study likely can be extended to other streams, each stream system is unique, and the hydrologic, hydraulic, and thermal responses to beaver dams may differ depending on the characteristics of the channel, its substrate, the adjacent floodplain, and the upstream drainage area.
Conclusions and Implications for Management
Results from this study also suggested that the effect of beaver dams on the magnitude and timing of stormflows depends on the character of the storm event. Beaver dams may slightly reduce the peak magnitude of small storms but have little effect on peak flow magnitudes during moderate and large storms. However, beaver dams resulted in increased transient water storage in both reaches across all modeled stormflows. These findings demonstrate channel and dam conditions at the time of the study and thus are a snapshot in time of dynamic systems. How the interaction of beaver dams, sediment, and streamflow affect long-term changes in hydrogeomorphic conditions in the channel and floodplain is beyond this study but may be important when considering if the increased storage found in this study will persist through time. Furthermore, the effect of beaver dams in this study is limited to reaches roughly 1-km long. Hence, the cumulative effects of beaver dams on the hydrologic and hydraulic processes over larger reaches was not evaluated in the study but may be an important topic for future research.
Findings from this study also suggest that beaver dams can substantially alter the hydraulics of urban streams, creating a wider range of hydraulic conditions than would occur without dams. By creating local impoundments and raising water levels, beaver dams were shown to increase a stream’s hydraulic connectivity to its floodplain during small storms and to generally increase the in-channel and off-channel storage of storm-related flows. Findings show that beaver dams slow and disperse water laterally across the stream channel and adjacent floodplain areas, which leads to greater inundated area. This greater range of hydraulic conditions and enhanced connectivity between channel and floodplain has implications for agencies tasked with managing waterways, their associated ecosystems, and stormwater systems. These effects provide a wider range of potential aquatic habitats for a range of aquatic and avian species and also increase the total wetted area available to aquatic organisms, but what specific species would potentially benefit or be harmed from these changes was not evaluated.
The increases in inundated areas associated with beaver dams that were quantified in this study can lead to challenges for managers and local property owners. Findings from this study illustrate the importance of local geomorphic conditions, such as stream morphology and hydraulic connectivity with adjacent floodplains and the presence of off-channel ponds, in determining hydraulic conditions that result from beaver dams. This and other information could be used by managers to assess how successful beavers and their dams may be in achieving restoration goals and in identifying potential areas where flooding or other beaver activity may conflict with human uses of the floodplain. Modeling studies of urban stream reaches can help managers identify where beavers’ dam building may have the most benefit while limiting the potential impacts dams can have with their surroundings, such as where beaver dams inundate public recreational areas or private lands.
References Cited
Bouwes, N., Weber, N., Jordan, C.E., Saunders, W.C., Tattam, I.A., Volk, C., Wheaton, J.M., and Pollock, M.M., 2016, Ecosystem experiment reveals benefits of natural and simulated beaver dams to a threatened population of steelhead (Oncorhynchus mykiss): Scientific Reports, v. 6, no. 1, p. 28581, accessed June 2017 at https://doi.org/10.1038/srep28581.
Briggs, M.A., Lautz, L.K., Hare, D.K., and González-Pinzón, R., 2013, Relating hyporheic fluxes, residence times, and redox-sensitive biogeochemical processes upstream of beaver dams: Freshwater Science, v. 32, no. 2, p. 622–641, accessed June 2017 at https://doi.org/10.1899/12-110.1.
Doyle, M.C., Smith, C.D., Jones, K.L., and Costello, A.E., 2025, Effects of beaver dams and ponds on the transport and deposition of suspended sediment in urban streams of the Tualatin River Basin, northwestern Oregon, chap. C of Jones, K.L, and Smith, C.D., eds., Beavers in the Tualatin River Basin, northwestern Oregon: U.S. Geological Survey Scientific Investigations Report 2025–5039–C, 41 p., https://doi.org/10.3133/sir20255039C.
Franczyk, J., and Chang, H., 2009, The effects of climate change and urbanization on the runoff of the Rock Creek Basin in the Portland metropolitan area, Oregon, USA: Hydrological Processes, v. 23, no. 6, p. 805–815, accessed June 2017 at https://doi.org/10.1002/hyp.7176.
Jung, I., and Chang, H., 2012, Climate change impacts on spatial patterns in drought risk in the Willamette River Basin, Oregon, USA: Theoretical and Applied Climatology, v. 108, nos. 3–4, p. 355–371, accessed June 2017 at https://doi.org/10.1007/s00704-011-0531-8.
Majerova, M., Neilson, B.T., Schmadel, N.M., Wheaton, J.M., and Snow, C.J., 2015, Impacts of beaver dams on hydrologic and temperature regimes in a mountain stream: Hydrology and Earth System Sciences, v. 19, p. 3541–3556, accessed June 2017 at https://doi.org/10.5194/hess-19-3541-2015.
McCarthy, K.A., 2000, Phosphorus and E. coli in the Fanno and Bronson Creek subbasins of the Tualatin River Basin, Oregon, during summer low-flow conditions, 1996: U.S. Geological Survey Water-Resources Investigations Report 00–4062, 31 p. [Also available at https://doi.org/10.3133/wri004062.]
Metro, 2014, 2014 urban growth boundary: Oregon Metro Regional Land Information System geographic information system (GIS) data, accessed June 2018, at https://www.arcgis.com/home/item.html?id=e3a9453a1ce547a7b2ee4baac037540e.
Nash, C.S., Grant, G.E., Charnley, S., Dunham, J.B., Gosnell, H., Hausner, M.B., Pilliod, D.S., and Taylor, J.D., 2021, Great expectations—Deconstructing the process pathways underlying beaver-related restoration: Bioscience, v. 71, no. 3, p. 249–267, accessed June 2017 at https://doi.org/10.1093/biosci/biaa165.
Nyssen, J., Pontzeele, J., and Billi, P., 2011, Effect of beaver dams on the hydrology of small mountain streams—Example from the Chevral in the Ourthe Orientale basin, Ardennes, Belgium: Journal of Hydrology, v. 402, nos. 1–2, p. 92–102, accessed June 2017 at https://doi.org/10.1016/j.jhydrol.2011.03.008.
Pilliod, D.S., Rohde, A.T., Charnley, S., Davee, R.R., Dunham, J.B., Gosnell, H., Grant, G.E., Hausner, M.B., Huntington, J.L., and Nash, C., 2018, Survey of beaver-related restoration practices in rangeland streams of the Western USA: Environmental Management, v. 61, no. 1, p. 58–68, accessed June 2017 at https://doi.org/10.1007/s00267-017-0957-6.
Pollock, M.M., Lewallen, G., Woodruff, K., Jordan, C.E., and Castro, J.M., 2015, The beaver restoration guidebook—Working with beaver to restore streams, wetlands, and floodplains (ver. 1.02): Portland, Oregon, United States Fish and Wildlife Service, 189 p., accessed June 2017, at https://www.fws.gov/media/beaver-restoration-guidebook.
Puttock, A., Graham, H.A., Cunliffe, A.M., Elliott, M., and Brazier, R.E., 2017, Eurasian beaver activity increases water storage, attenuates flow and mitigates diffuse pollution from intensively-managed grasslands: Science of the Total Environment, v. 576, p. 430–443, accessed June 2017 at https://doi.org/10.1016/j.scitotenv.2016.10.122.
R Core Team, 2024, R—A language and environment for statistical computing (ver. 4.3.3): R Foundation for Statistical Computing, accessed February 2024 at https://www.R-project.org/.
Smith, C.D., Leahy, E.K., Jones, K.L., and Rounds, S.A., 2025, Effects of beaver dams and ponds on water quality in urban streams of the Tualatin River Basin, northwestern Oregon, chap. D of Jones, K.L., and Smith, C.D., eds., Beavers in the Tualatin River Basin, northwestern Oregon: U.S. Geological Survey Scientific Investigations Report 2025–5039–D, 48 p., https://doi.org/10.3133/sir20255039D.
Smith, C.D., 2017, Beaver dam locations and beaver activity in the Tualatin Basin, Oregon (ver. 2.0, November 2019): U.S. Geological Survey data release, accessed June 2019, at https://doi.org/10.5066/F7PZ57QP.
Smith, K., and Ory, J., 2005, Healthy streams plan: Hillsboro, Oreg., Clean Water Services, 59 p., accessed June 2017 at https://www.cleanwaterservices.org/media/1298/healthy-streams-plan.pdf.
Sobieszczyk, S., Jones, K.L., Rounds, S.A., Nilsen, E.B., and Morace, J.L., 2018, Prioritization framework for ranking riverine ecosystem stressors using example sites from the Tualatin River Basin, Oregon: U.S. Geological Survey Scientific Investigations Report 2018–5153, 40 p., accessed January 2019, at https://doi.org/10.3133/sir20185153.
U.S. Department of Agriculture, Natural Resources Conservation Service, 2012, Soil Survey Geographic database for Washington County, Oregon: U.S. Department of Agriculture Natural Resources Conservation Service Web Soil Survey website, accessed June, 2021 at https://websoilsurvey.sc.egov.usda.gov/.
U.S. Army Corps of Engineers, 2016, HEC-RAS River Analysis System hydraulic reference manual (ver. 6.3.0): Davis, California, U.S. Army Corp of Engineers, accessed April 10, 2022, at https://www.hec.usace.army.mil/software/hec-ras/download.aspx.
U.S. Geological Survey, 2016, The StreamStats program: U.S. Geological Survey web page, accessed August 20, 2020, at http://streamstats.usgs.gov.
U.S. Geological Survey, 2025, USGS water data for the Nation: U.S. Geological Survey National Water Information System database, accessed June 1, 2025, at https://doi.org/10.5066/F7P55KJN.
Walsh, C.J., Roy, A.H., Feminella, J.W., Cottingham, P.D., Groffman, P.M., and Morgan, R.P., 2005, The urban stream syndrome—Current knowledge and the search for a cure: Freshwater Science, v. 24, no. 3, accessed March 2019 at https://doi.org/10.1899/04-028.1.
White, J.S., 2025, Hydraulic models of two beaver affected reaches in the Tualatin Basin, Oregon: U.S. Geological Survey data release, https://doi.org/10.5066/P1VZGC3Z.
White, J.S., Smith, C.D., Jones, K.L., and Rounds, S.A., 2025, Stream network capacity to support beaver dams in the Tualatin River Basin, northwestern Oregon, chap. A of Jones, K.L., and Smith, C.D., eds., Beavers in the Tualatin River Basin, northwestern Oregon: U.S. Geological Survey Scientific Investigations Report 2025–5039–A, 20 p., https://doi.org.10.3133/sir20255039A.
Watershed Sciences, Inc., 2014, Oregon Lidar Consortium Metro 2014 final delivery: Oregon Lidar Consortium digital data. [Data used for analysis herein provided in hardcopy by cooperator. Data are available for download at https://gis.dogami.oregon.gov/maps/lidarviewer, accessible as of May 2025.]
Conversion Factors
U.S. customary units to International System of Units
International System of Units to U.S. customary units
Datums
Vertical coordinate information is referenced to the North American Vertical Datum of 1988 (NAVD 88).
Horizontal coordinate information is referenced to North American Datum of 1983 (NAD 83).
Elevation, as used in this report, refers to distance above the vertical datum.
For information about the research in this report, contact the
Director, Oregon Water Science Center
U.S. Geological Survey
601 SW 2nd Avenue, Suite 1950
Portland, Oregon 97204
https://www.usgs.gov/centers/oregon-water-science-center
Manuscript approved on July 30, 2025
Publishing support provided by the U.S. Geological Survey
Science Publishing Network, Tacoma Publishing Service Center
Edited by Jeffery Suwak and Esther Pischel
Illustration support by Yanis X. Castillo and JoJo Mangano
Layout by Luis Menoyo and cover by JoJo Mangano
Disclaimers
Any use of trade, firm, or product names is for descriptive purposes only and does not imply endorsement by the U.S. Government.
Although this information product, for the most part, is in the public domain, it also may contain copyrighted materials as noted in the text. Permission to reproduce copyrighted items must be secured from the copyright owner.
Suggested Citation
White, J.S., Jones, K.L., and Rounds, S.A., 2025, Effects of beaver dams and ponds on hydrologic and hydraulic responses of storm flows in urban streams of the Tualatin River Basin, northwestern Oregon, chap. B of Jones, K.L., and Smith, C.D., eds., Beavers in the Tualatin River Basin, northwestern Oregon: U.S. Geological Survey Scientific Investigations Report 2025–5039–B, 38 p., https://doi.org/10.3133/sir20255039B.
ISSN: 2328-0328 (online)
Study Area
| Publication type | Report |
|---|---|
| Publication Subtype | USGS Numbered Series |
| Title | Effects of beaver dams and ponds on hydrologic and hydraulic responses of storm flows in urban streams of the Tualatin River Basin, northwestern Oregon |
| Series title | Scientific Investigations Report |
| Series number | 2025-5039 |
| Chapter | B |
| DOI | 10.3133/sir20255039B |
| Publication Date | September 30, 2025 |
| Year Published | 2025 |
| Language | English |
| Publisher | U.S. Geological Survey |
| Publisher location | Reston, VA |
| Contributing office(s) | Oregon Water Science Center |
| Description | Report: viii, 38 p.; Data Release |
| Country | United States |
| State | Oregon |
| Other Geospatial | Tualatin River Basin |
| Online Only (Y/N) | Y |