

Effects of Beaver Dams and Ponds on Water Quality in Urban Streams of the Tualatin River Basin, Northwestern Oregon
Links
- Document: Report (7 MB pdf) , HTML , XML
- Larger Work: This publication is Chapter D of Beavers in the Tualatin River Basin, northwestern Oregon
- Data Releases:
- USGS data release - Water temperature, dissolved oxygen, and pH point measurements from a beaver pond along Fanno Creek, Oregon, on four hot days in summers 2016–17
- USGS data release - Beaver dam locations and beaver activity in the Tualatin Basin, Oregon
- USGS data release - Estimates of mean daily gross primary production and ecosystem respiration in beaver-affected reaches along Bronson and Fanno Creeks, OR
- Download citation as: RIS | Dublin Core
Acknowledgments
Designing and implementing this study were large tasks, and the authors are thankful for the assistance of several people and organizations. James White and Micelis Doyle (retired) (part of the U.S. Geological Survey [USGS] beaver team) provided useful discussions and support for the data collection and analyses. Dave Piatt (USGS) assisted with site installations and Amy Brooks (USGS) helped with the processing of all time-series water-quality datasets. Field assistance was provided by USGS employees, including Alexandria Costello, Kevin Pesola, Mackenzie Keith, David Weathers, Gabriel Gordon, Joseph Mangano, James White, and Laurel Stratton Garvin. The authors thank Carol Murdock, Rajeev Kapur, Bob Baumgartner (retired), Kenneth Williamson, Matthew Brennan, Anil Devnani, John Goetz, and Anne MacDonald of Clean Water Services for their assistance and insights. Staff from the Tualatin Hills Parks and Recreation District provided useful information and insights for the Fanno Creek study reach.
Preface
This is the fourth of four reports in a multichapter volume assessing the capacity of the stream network to support beaver dams and evaluating the effects of beaver dams and ponds on urban streams. These reports document the data collection from 2016–17 and the findings of these studies, which were done in partnership with Clean Water Services. Chapter A (White and others, 2025a) documents the locations of beaver dams in the Tualatin River Basin and how many beaver dams the stream network could support with existing and improved riparian vegetation. Beaver dam capacity was estimated by modifying existing tools to account for the low gradient of many streams in the Tualatin River Basin. Chapter B (White and others, 2025b) describes the effects of beaver dams and ponds on hydrologic and hydraulic responses of storm flows. Hydrologic and hydraulic responses for two urban stream reaches were compared with and without beaver dams and ponds and for a range of streamflow conditions using two-dimensional hydraulic models. Chapter C (Doyle and others, 2025) characterizes the effects of beaver dams and ponds on the transport and deposition of suspended sediment. Continuous turbidity, discrete suspended-sediment samples, and streamflow measurements collected during storms and base-flow periods were used to assess: (1) suspended-sediment loads upstream and downstream from two beaver-affected reaches, and (2) seasonal and longitudinal turbidity patterns. Chapter D (this report) describes the effects of beaver dams and ponds on longitudinal, spatial, and seasonal water-quality patterns. Continuous and synoptic water-quality data were collected along urban stream reaches, and net ecosystem production was calculated for two beaver-affected reaches. The findings of these studies illustrate that the effects of beaver dams and ponds on hydrology, hydraulics, suspended-sediment transport and deposition, and water quality are dependent on the characteristics of a stream reach (for example, channel gradient, groundwater exchange, and riparian vegetation) and the characteristics of beaver dams and ponds along that reach. This information can be used to consider the implications of beaver-assisted restoration in the Tualatin River Basin and the effects of beaver dams and ponds in urban streams.
Significant Findings
American beavers (Castor canadensis) are native to the Pacific Northwest, and their populations have increased in many locations after being nearly removed by historical trapping. Beaver dams have well-documented effects on water quality in forested streams, but their effects on water quality in urban streams have not been well characterized. This study documented the water-quality effects of beaver dams and beaver activity in selected urban streams of the Tualatin River Basin in northwestern Oregon. Variations in water quality upstream, downstream, and within ponded areas behind beaver dams were quantified with continuous measurements of water temperature, specific conductance, dissolved oxygen, and pH from May 2016 to November 2017 in two intensively monitored reaches of urban streams (Fanno and Bronson Creeks). Five other urban stream reaches were monitored upstream and downstream from beaver ponds using water-temperature sensors to document water-temperature changes in additional beaver-affected reaches. Spatial water-quality variations within a beaver pond along Fanno Creek were characterized in more detail on four hot summer afternoons with numerous measurements of temperature and dissolved oxygen. Results from the study were used to document and derive insights from measured patterns in the water-quality data, such as the following:
-
• Shallow and unshaded ponds created by beaver dams (such as at Fanno Creek) capture more solar radiation than channelized and shaded stream reaches, resulting in substantially warmer water temperatures during summer.
-
• A large beaver pond along Fanno Creek had variable water depths and riparian shade, resulting in a wide range of water-temperature and dissolved-oxygen conditions. Some conditions measured during summer were stressful for sensitive aquatic species, with temperatures higher than 18 degrees Celsius (°C) and (or) dissolved-oxygen concentrations less than 2 milligrams per liter (mg/L).
-
• Although water flowing out of beaver-affected reaches was warmer than water entering the reaches, water tended to cool downstream when streams returned to a more-shaded, confined channel (such as at Fanno Creek) or received subsurface inputs and exchange (such as at Bronson Creek).
-
• The magnitude of water-temperature increases in beaver ponds depended on site characteristics, such as the surface area and depth of the ponds, the extent of riparian shade, and the potential for subsurface exchange. Beaver dams caused Fanno Creek to overflow its banks, resulting in a wide and shallow floodplain pond that had little riparian shade in most places. In contrast, Bronson Creek remained in its stream channel behind the beaver dams, was often deeper and more shaded, and had more subsurface water exchange than the Fanno Creek reach. Despite the longer reach length, these differences caused the Bronson Creek reach to warm less than the Fanno Creek reach.
-
• Beaver dams trapped sediment and organic matter, and ponding increased the time available for organic matter to decompose in the trapped sediments, thus consuming dissolved oxygen. The construction of a beaver dam in the monitored reach of Bronson Creek during the study caused an increase in oxygen demands and a rapid decrease in dissolved-oxygen concentrations.
-
• Dissolved-oxygen concentrations in monitored study reaches were affected by primary production (algal photosynthesis) and respiration, and hypoxic (low to zero dissolved oxygen) conditions were measured in the two intensively monitored reaches for multiple weeks during summer. Two single-station stream metabolism models were used to calculate net ecosystem production in the two intensively monitored urban stream reaches. Results indicated that the reaches were heterotrophic, with respiration demands consuming more oxygen than what was produced through photosynthesis.
-
• Beaver ponds at all sites had a measurable effect on water quality, causing wider ranges in temperature and dissolved-oxygen conditions than would have occurred without ponding. That wider range (both spatially and temporally) might support a variety of aquatic organisms, but also is likely to increase the frequency of water-quality standard violations in those beaver-affected reaches. Any water-quality effects or standard violations associated with beaver dams and ponds, however, may be localized or transitory along the stream network. Restored stream reaches can attract beavers. Considering the potential for beaver colonization when designing habitat restoration plans will require evaluation of the potential water-quality changes associated with beaver dams and ponds alongside other desired physical changes.
Introduction
Water quality is a crucial component of healthy aquatic ecosystems, and water-quality regulations and criteria in the Pacific Northwest often are based on the needs of native salmonids. Anadromous and resident salmonids require cold-water temperatures and adequate dissolved oxygen to thrive. Many valley-bottom areas of the Tualatin River Basin in northwestern Oregon have low-gradient streams that flow over sand and silt substrate in urban settings. American beavers (Castor canadensis) historically built extensive dams in these streams. In recent years, beavers have been documented building dams again in the valley bottom, urban streams (Smith, 2017). The addition of beaver dams to urban streams is likely to have substantial effects on channel morphology, water quality, and the available habitat for various species. Such effects are better understood for forested and upland stream networks (Pollock and others, 2015), but have not been well documented for urban and valley-bottom streams.
Beavers use woody vegetation, grasses, and mud to form dams that span stream channels, create ponds, and retain water (Pollock and others, 2015). The shift from a flowing to a pooled reach can result in substantial changes to stream water quality and the diversity of resulting aquatic and riparian habitats (Naiman and others, 1988). Beaver impoundments generally result in warmer water temperatures downstream in most systems (McRae and Edwards, 1994; Alexander, 1998; Majerova and others, 2015) because ponding often increases the surface area of the body of water, thus allowing the capture of more solar radiation, and because beavers actively remove vegetation that provides shade (Jenkins, 1980; Collen and Gibson, 2001). Some studies have documented downstream cooling effects resulting from beaver dams and ponds, and the effect may be related to dam height and subsurface flows upwelling downstream from the dam (Pollock and others, 2007; Fuller and Peckarsky, 2011; Bouwes and others, 2016). In mountainous or semi-arid regions, warmer water temperatures within ponds and downstream may create optimal temperatures for fish rearing (Huey and Wolfrum, 1956). However, in altered landscapes or valley-bottom regions, elevated water temperatures often are stressful to native cold-water fish, such as salmonids. The surface area of a beaver pond and the residence time of water in that pond likely affect the degree of warming downstream (Majerova and others, 2015), but a robust relation has not been established and may be complicated by regional and site-specific factors (McRae and Edwards, 1994; Hoffman and Recht, 2013). Multiple beaver ponds in a series may have a cumulative warming effect on water temperature (Cook, 1940), and beaver ponds established in tributaries could potentially supply warmed water to larger rivers downstream.
Pond water is subjected to daily effects of wind and solar radiation, and water temperatures near the surface and edges can change substantially over the course of a day. At depth, pond water may be cooler, protected from warm surface water by thermal stratification that inhibits vertical mixing (Pollock and others, 2015). The cool water at the bottom of a deep pond may provide an area of thermal refuge during times of day when surface-water temperatures are highest (Hoffman and Recht, 2013). Beaver-dam building creates ponds with increased wetted area, leading to potential increases in riparian extent (Johnston and Naiman, 1990) and a variety of water depths. This increased morphological complexity may help create a mosaic of conditions that can support multiple plant and animal species (Majerova and others, 2015; Pollock and others, 2015).
Physical properties and biological processes are important factors affecting dissolved-oxygen concentrations in a pond. Water in a pond generally has slow movement and a low potential for reaeration (Naiman and others, 1988). Damming flowing water decreases water velocity, increasing the probability that suspended sediment and particulate organic matter drop out of suspension and accumulate in the pond (Naiman and others, 1988). Bacterial decomposition of organic matter depletes dissolved oxygen, causing ponds to be associated with decreased dissolved-oxygen concentrations (Naiman and others, 1988; Smith and others, 1991). However, the additional bioavailable nutrients released by microbial processes (Johnston and Naiman, 1990) and increased surface area for sunlight can intensify primary production (algal photosynthesis) in pond ecosystems, which adds dissolved oxygen to the water column during daylight hours. With the co-occurrence of decomposition, photosynthesis, respiration, changes to oxygen solubility based on temperature, and reaeration (transport of oxygen across the air/water interface) in a beaver pond, determining the net effect of the ponding of a previously flowing stream reach on dissolved-oxygen concentrations can be complicated and may require data collection to support the development of advanced models.
Like beaver activity, urbanization can affect stream water temperature through the removal of vegetation and the alteration of channel morphology and flow regimes (LeBlanc and others, 1997). Urbanization leads to increased impervious surface area, which changes the timing of surface water delivery to streams and reduces groundwater infiltration and stream base flows (LeBlanc and others, 1997). Additionally, elevated air temperatures in cities (Yuan and Bauer, 2007) may alter water temperatures in nearby streams. Industrial and municipal runoff can have high biochemical oxygen demands, affecting dissolved-oxygen concentrations in receiving waters. Considering that beaver activity and urbanization can affect water temperatures and dissolved-oxygen concentrations, beaver activity occurring in urban settings may have synergistic or offsetting effects on water quality.
The various effects of beaver ponds on water quality may affect the frequency or severity of exceedances of water-quality standards established to protect the designated beneficial uses of aquatic ecosystems. Such standards in the State of Oregon are basin-specific and often are based on the presence and activities (such as rearing and migrating) of sensitive cold-water fishes. Some of the key water-quality standards that apply to Tualatin River Basin streams state that (1) the 7-day moving average of the daily maximum water temperature (7dADM) should not exceed 18 °C during periods of fish rearing and migration (Oregon Department of Environmental Quality, 2019a), (2) instantaneous dissolved-oxygen measurements should be 4 mg/L or more, among other requirements (Oregon Administrative Rules, 340-041-0016[3]; Oregon Department of Environmental Quality, 2019b), and (3) pH values should remain in the range of 6.5 to 8.5 standard units (Oregon Administrative Rules, 340-041-0345[1]; Oregon Department of Environmental Quality, 2019c). Water-quality standards are applicable to all stream reaches; however, factors such as the proportion of ponding along a stream segment are considered when identifying representative values from a heterogenous ponded reach. The low-gradient urban streams of the Tualatin River Basin do not always meet the applicable water-quality standards (Oregon Department of Environmental Quality, 2020), and the addition of beaver activity may affect the frequency and duration of exceedances.
Purpose and Scope
Clean Water Services and its partners (Washington County and the 12 cities within the county) provide wastewater, stormwater, and watershed management services for the urban areas of Washington County, Oregon. The agencies often work within riparian and stream corridors by restoring riparian areas and implementing wetland and stream-enhancement projects. Some of their restoration sites have changed over time through natural processes and beaver activity, resulting in beaver dams and ponds. Following restoration activities, biodiversity monitoring has documented native turtles, amphibians, and many bird species (C. Murdock and T. Dunlin, Clean Water Services, written commun., 2017). Clean Water Services was interested in assessing the potential for beaver dams and ponds in the watershed and their effect on stream flashiness, urban runoff, sediment transport, erosion, water quality, and habitat issues. In order to write defensible plans and have science-based conversations with regulatory agencies, Clean Water Services required more data and insights into the quantitative and qualitative effects of beaver activity on those factors.
This study is part of a larger comprehensive study to understand beaver-dam distributions and quantify the physical effects of beaver dams and ponds on urban streams in the Tualatin River Basin. This report documents water-quality conditions along multiple urban streams with beaver activity during 2016–17. Related studies assess current beaver-dam distributions and model beaver-dam capacity in the basin (White and others, 2025a), simulate peak-flow attenuation and other hydraulic effects owing to beaver dams and ponds (White and others, 2025b), and assess the effects of beaver dams and ponds on sediment transport and deposition (Doyle and others, 2025).
Located west of Portland, Oregon, the headwaters of the Tualatin River originate in the Coast Ranges and the river drains 1,844 km2 before discharging into the Willamette River near West Linn, Oregon (fig. 1). Tributaries of the Tualatin River generally flow through forested, agricultural, suburban, and urban areas from upstream to downstream. The Tualatin River Basin has a population of more than 600,000 people as of 2018 (U.S. Census Bureau, 2020), and the Urban Growth Boundary (fig. 1) limits urban development in the lower valley.
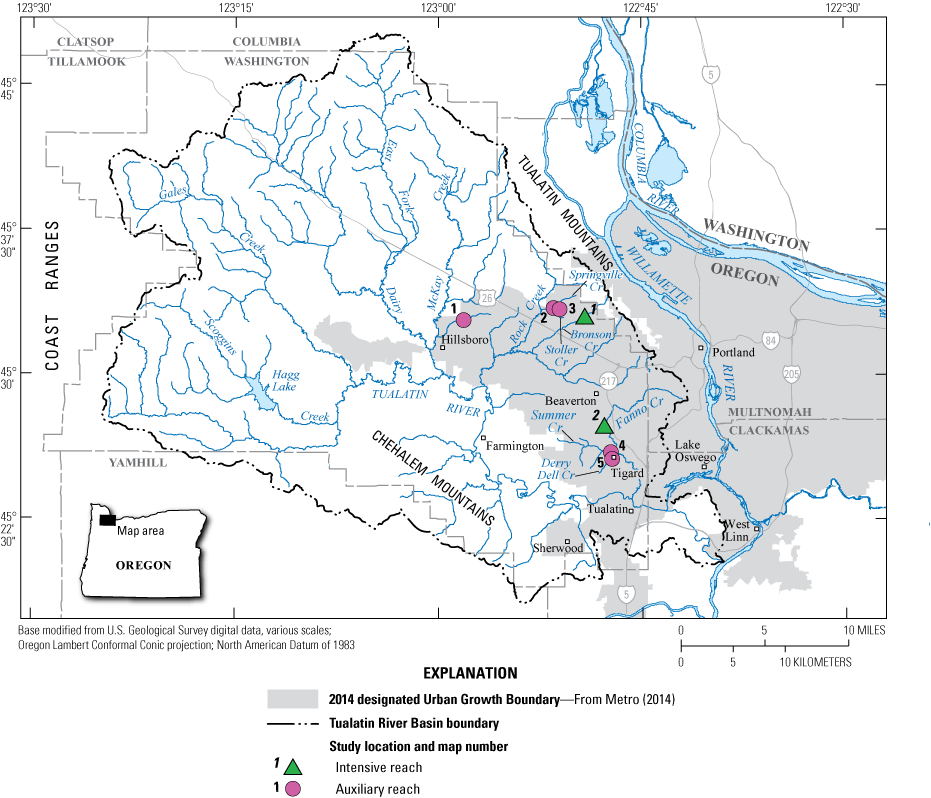
Study locations within the urbanized metropolitan area, Tualatin River Basin, northwestern Oregon. See table 1 for additional information about the auxiliary and intensive reaches.
Beavers are recolonizing streams throughout the Tualatin River Basin (Smith, 2017) after being nearly extirpated by trapping in the last 150 years. The return of beavers is likely to change aquatic and riparian habitats. Understanding their effects on water quality in urban streams is relevant context for informing ongoing habitat restoration and water-quality management in the basin. To date (2022), little is known about the effects of beavers on urban streams (Pollock and others, 2015) because most studies regarding the effects of beaver activity have focused on streams in rural and mountainous basins. This study aimed to answer the following questions:
-
1. How are water-quality parameters (including water temperature, dissolved oxygen, pH, and specific conductance) affected as water progresses longitudinally through beaver-affected reaches in urban streams, and how do those water temperatures and dissolved-oxygen measurements compare to the biologically relevant water-quality standards?
-
2. Does spatial and temporal variability in water temperature and dissolved-oxygen measurements exist in large ponds, such that areas with cool water and sufficient dissolved oxygen are available to aquatic organisms during summer?
-
3. What processes and factors are affecting water quality in the beaver-affected reaches?
-
4. Are the reaches net sources or net sinks for dissolved oxygen?
-
1. Documents continuous water-quality datasets (water temperature, dissolved oxygen, specific conductance, and pH) measured in selected urban tributaries of the Tualatin River that had beaver activity during 2016–17;
-
2. Describes the spatial variability (water temperature and dissolved oxygen) and temporal variability (water temperature) within a large beaver pond in an urban stream;
-
3. Characterizes the processes affecting water quality in beaver-affected reaches of selected urban streams; and
-
4. Quantifies the effects of beaver activity on water quality and processes, such as primary production (the combination of photosynthesis and respiration) in those streams.
The study focused on two urban stream reaches (Fanno Creek at Greenway Park and Bronson Creek between Kaiser and Saltzman Roads) and sites upstream and downstream from beaver ponds along five other urban streams.
Site Descriptions
Seven tributaries of the Tualatin River with beaver activity were selected for water-quality monitoring (fig. 1). The stream reaches along Fanno and Bronson Creeks were intensively studied with multiparameter water-quality data collection. These two urban stream reaches were the focus of recent habitat restoration projects but differ in their upstream drainage areas, percent impervious area, and number and types of beaver dams (table 1; app. 1). Most of the results from this study were derived from data gathered from these intensively studied reaches along Fanno and Bronson Creeks. Additional reaches (referred to as “auxiliary reaches”), were monitored for water temperature to determine if patterns measured along the intensive reaches were consistent with patterns measured in other reaches in the basin. Auxiliary reaches differ in site characteristics and provide a broader understanding of the effects of beaver activity on water temperature in urban streams.
Table 1.
Characteristics of beaver-affected streams monitored with multiparameter water-quality monitors and water-temperature sensors, Tualatin River Basin, northwestern Oregon, May 2016–November 2017.[Basin metrics were measured using StreamStats (U.S. Geological Survey, 2019a). Beaver dam-building dates were determined using Google Earth imagery. Abbreviations: km2, square kilometer; m3/s, cubic meter per second]
| Stream name | Beaver dam characteristics | Symbol and map number on figure 1 |
Upstream drainage area (km2) |
First signs of dam-building activity |
Average percent impervious area |
Mean basin slope (degrees) |
Length of study reach (river meters) |
Two-year peak flood (m3/s) |
|---|---|---|---|---|---|---|---|---|
| Bronson Creek | Multiple channel-spanning dams, heavily packed with mud. | Triangle 1 | 7.5 | Approximately 2010 | 19.5 | 8.2 | 1,610 | 3.1 |
| Derry Dell Creek | Multiple channel-spanning dams, made from mud and vegetation. | Circle 5 | 2.1 | 2009 | 42.2 | 4.5 | 480 | 0.7 |
| Fanno Creek | Multiple channel-spanning dams, made primarily with sticks; one large dam extends onto the floodplain, creating a large pond. | Triangle 2 | 27.2 | 2012 | 33.7 | 5.7 | 940 | 8.0 |
| Springville Creek | Multiple channel-spanning dams, made from sticks and mud. | Circle 2 | 7.5 | 2014 | 40.2 | 3.2 | 730 | 1.6 |
| Stoller Creek | 5+ channel-spanning dams and 3 dammed culverts, made from sticks and mud. | Circle 3 | 1.8 | 2013–14 | 55 | 3 | 880 | 0.5 |
| Summer Creek | Multiple channel-spanning dams, made from sticks. | Circle 4 | 15.8 | Unclear | 37.7 | 5.6 | 300 | 4.6 |
| Unnamed tributary to McKay Creek | Multiple channel-spanning dams, made from sticks and vegetation; one large dam extends onto the floodplain, creating a large pond. | Circle 1 | 5.2 | 2002–03 | 34.3 | 0.5 | 480 | 0.5 |
Fanno Creek at Greenway Park Intensive Study Reach
Fanno Creek originates in the northeastern hills of the basin on the west side of the City of Portland and is a major tributary to the Tualatin River (fig. 1). The upstream contributing area to the study reach is approximately 27 km2 of mostly low-gradient, urban lands (table 1). The study reach is in Greenway Park, a popular urban park. Greenway Park was the focus of restoration efforts from 2008 to 2012 by Clean Water Services. During that restoration, the channel, once straightened for agricultural purposes, was re-meandered, large wood was placed in the channel to provide habitat complexity, and native vegetation was planted throughout the park (Smith and Ory, 2005). Keith and others (2014) noted that the Greenway Park segment of Fanno Creek was one of the largest potential sinks for fine sediment along Fanno Creek, due to its low and wide floodplain and vegetation that decreases stream velocity by increasing surface roughness within the channel. Beavers colonized Fanno Creek in the park in 2012 and built multiple dams and a lodge within the study reach. One dam extending onto the floodplain was 30 m long and created a large pond (referred to as the “south pond”; fig. 2) that flooded the newly meandered channel, old channel, nearby paths, and riparian areas. Other floodplain features in the study reach included the north pond and adjacent Koll Center Wetland, which were both off-channel features that were present prior to the construction of beaver dams.
The 940-m study reach in Greenway Park decreases in elevation by approximately 1.9 m from the upstream to downstream monitoring sites, and the reach varies in channel characteristics and riparian shade along its length. The stream between Southwest Hall Boulevard and the south pond is channelized, as deep as 2.5 m, and often is shaded by riparian vegetation (fig. 2). Within the south pond, the water spreads onto the floodplain because the channel is blocked by the 30-m-long beaver dam. In this section of the study reach, the main channel is narrow and deep but is surrounded by a ponded area with a surface area of approximately 7,940 m2. This ponded area is generally shallow (0.5 m deep on average) with little riparian shade. Downstream from the south pond and long beaver dam, the channel is narrow, deep, and shaded by riparian vegetation. The old channel is shaded, narrow, and wadable except for deep areas upstream from the two beaver dams. Water velocity throughout the reach is slow during low flows (<0.01 m/s; White and others, 2025b).
Continuous multiparameter water-quality monitors were deployed in the following three locations: (1) Upstream at Fanno Creek (UF), (2) Ponded at Fanno Creek (PF), and (3) Downstream at Fanno Creek (DF; fig. 2). Similar conditions were measured at the UF and PF sites during this study, likely because channel characteristics and riparian shade were similar at the two sites and because the water remained within the channel in this section of the stream. The DF continuous monitor was downstream from the long dam, and measurements reflected processes occurring in the large south pond.
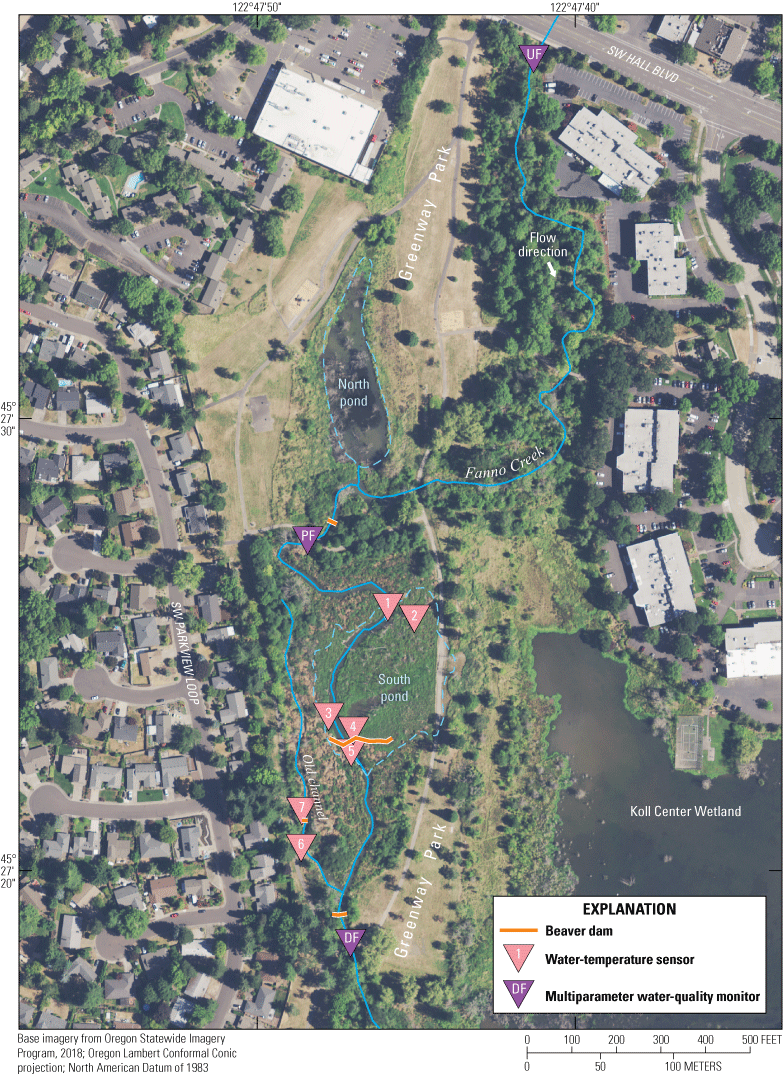
Water-quality monitoring equipment locations in Fanno Creek at Greenway Park, northwestern Oregon. Locations where continuous multiparameter water-quality monitors were deployed were referred to as Upstream at Fanno Creek (UF), Ponded at Fanno Creek (PF), and Downstream at Fanno Creek (DF). Water-temperature sensors (numbers 1–7) were deployed in the ponded reach. Lines across the creek and south pond are roughly proportional to the length of the beaver dams.
Bronson Creek Intensive Study Reach
Bronson Creek begins in the Tualatin Mountains, an area characterized by steep terrain, and flows in a southwesterly direction (fig. 1; table 1). The upstream contributing area to the Bronson Creek study reach is approximately 8 km2 of land that is rapidly transitioning from rural to urban land use. The 1,610-m-long reach has a wide, flat-valley floodplain that is surrounded by residential properties. Clean Water Services added large wood and planted riparian vegetation at the site from 2004 to 2019 in an effort to improve water quality and enhance habitat diversity of the floodplain and stream (Smith and Ory, 2005). The upstream part of the study reach is near the foothills in a forested area where the stream is confined to a narrow channel with various depths and ponded by multiple beaver dams (fig. 3). Downstream from the forested area, Bronson Creek splits into multiple side channels and has three large dams; the side channels flow through dense stands of reed canary grass (Phalaris arundinacea). Throughout the rest of the reach, Bronson Creek continues to flow diffusely in several channels through reed canary grass and forested areas and has an unknown number of beaver dams. Water velocity throughout the reach is slow during low flows (0.01 m/s; White and others, 2025b), and the banks of the stream often are full even in summer. The effects of subsurface water inputs and exchange on water quality are indicated at Bronson Creek; in this report, “subsurface water” refers to groundwater and (or) hyporheic water.
Continuous multiparameter water-quality monitors were deployed at the following three locations: (1) Upstream at Bronson Creek (UB), (2) Ponded at Bronson Creek (PB), and (3) Downstream at Bronson Creek (DB) (fig. 3). The UB site was free flowing for the first 3 months of the study, after which a beaver dam was built 20 m downstream from the water-quality monitor resulting in ponding at the site. During low flows, the PB site measured channelized, ponded water with minimal riparian shade. The DB site was approximately 980 m downstream from the PB site and measured channelized, ponded water that was partly shaded. The beaver-affected area continued downstream from the study reach, with additional beaver dams and ponding.
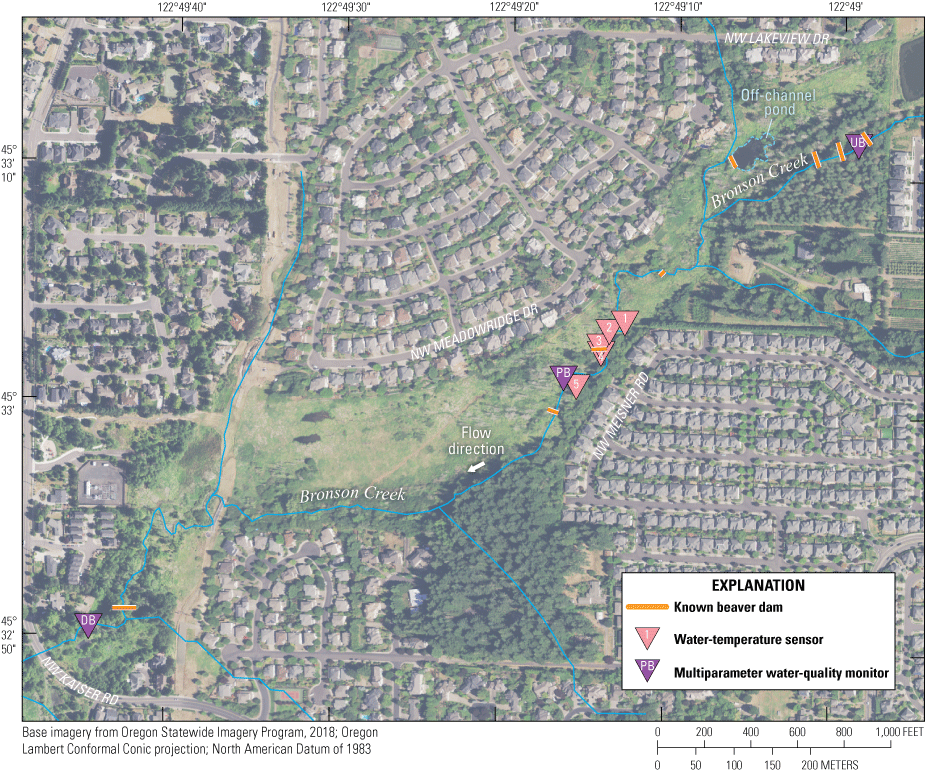
Water-quality monitoring equipment locations in Bronson Creek upstream from Northwest Kaiser Road, northwestern Oregon. Locations where continuous multiparameter water-quality monitors were deployed were referred to as Upstream at Bronson Creek (UB), Ponded at Bronson Creek (PB), and Downstream at Bronson Creek (DB). Water-temperature sensors (numbers 1–5) were deployed in the ponded reach. The reach likely contained more beaver dams than those indicated on the map. Lines across the creek and Off-Channel Pond are roughly proportional to the length of the beaver dams.
Auxiliary Reaches
The five auxiliary reaches used for characterizing longitudinal patterns in water temperature associated with beaver dams and ponds encompass greater ranges of basin area (about 2–16 km2) and greater percentages of impervious area (about 34–55 percent) than the Fanno and Bronson Creeks intensive reaches (fig. 1; table 1). Each reach contained at least three beaver dams made from a variety of materials, such as sticks (Stoller and Summer Creeks and the unnamed McKay Creek tributary), mud and grass (Springville Creek), or a combination of sticks, mud, and grass (Derry Dell Creek). Most of the auxiliary reaches included large beaver ponds, except for the Summer Creek reach where the ponding was contained in the stream channel. The sites had a range of riparian and shading conditions. Typically, the upstream part of the reaches was mostly shaded, whereas the areas with expansive beaver ponds had minimal shading. However, the entire study reach along Summer Creek was shaded.
Methods
Water-quality monitoring equipment was deployed for approximately 1.5 years at 32 locations to continuously measure conditions across multiple seasons. Equipment included six continuous water-quality monitors and 26 water-temperature sensors. Additional point measurements were collected in the large south pond at Fanno Creek to document spatial variability in water temperature, dissolved oxygen, and pH during summer. Data collection was aimed at measuring the spatial and temporal conditions upstream, within, and downstream from urban stream reaches with beaver activity and dams.
Statistical tests were used to compare differences between water-temperature means among sites (R Core Team, 2020). When comparing three means, an Analysis of Variance was used to determine if a mean was significantly different, and then a Tukey post-hoc pairwise comparison test was used to determine significant differences among pairs of means. To compare differences between two means, a Wilcoxon signed-rank test was used. Some statistical-test assumptions were violated because of the covariance of measurements collected from upstream to downstream and because of the autocorrelation of running averages (such as the 7dADM). Despite the violation of assumptions, statistical tests were used to emphasize relative differences among groups.
Continuous Water-Quality Monitors
Multiparameter water-quality monitors (model 6920-V2 instruments from Yellow Springs Instruments, Inc. [YSI], Yellow Springs, Ohio) were outfitted to measure water temperature, dissolved oxygen, pH, and specific conductance. Monitors were deployed to capture water-quality conditions in free-flowing water upstream, within, and downstream from the intensively monitored reaches at Fanno and Bronson Creeks (figs. 2 and 3; table 2). Locations were selected to target channelized, well-mixed stream water instead of the potentially heterogenous conditions in large, ponded areas.
Table 2.
Site names and site numbers of monitoring locations along two intensively studied beaver-affected reaches monitored with multiparameter water-quality monitors and water-temperature sensors, Tualatin River Basin, northwestern Oregon, May 2016–November 2017.[NWIS site name and NWIS site number: NWIS, National Water Information System; Blvd, Boulevard; Ct, Court; Dr, Drive; Ln, Lane; NW, Northwest; Rd, Road; SW, Southwest. Label on map: Fanno Creek sites shown on figure 2. Bronson Creek sites shown on figure 3. DB, Downstream at Bronson Creek; DF, Downstream at Fanno Creek; FDF, Farther downstream at Fanno Creek; PB, Ponded at Bronson Creek; PF, Ponded at Fanno Creek; UB, Upstream at Bronson Creek; UF, Upstream at Fanno Creek. Deployment depth: Multiparameter water-quality monitors were deployed in pipes so that the sensors remained at mid-water column in the stream channel. Water-temperature sensors were deployed at the bottom of the ponded area. Shallow sites within the pond were 0.5 meter deep or less and deep areas had 1 meter or more of water. Recorded parameters: Temp, water temperature; DO, dissolved oxygen; SC, specific conductance. Symbol: X, parameter was measured; –, parameter was not measured]
Each water-quality monitor was deployed in acrylonitrile butadiene styrene (ABS) pipe that was perforated with multiple 2.5-cm diameter holes to allow water to flow across the sensors. Rigid metal struts were driven into the streambed and stream bank and the ABS pipes were attached to the struts at an angle, such that one end of the pipe was accessible at the top of the bank and the bottom end was positioned in the middle of the water column. The deployment design ensured that sensors remained submerged during the lowest summer flows.
Water-quality monitors were deployed in May 2016 and removed in November 2017 at both intensive reaches. The initial data-collection frequency was hourly during summer 2016 but increased to every 30 minutes in October 2016. Operation and maintenance of the monitors and the application of data corrections followed U.S. Geological Survey (USGS) methods and protocols (Wagner and others, 2006). Data were loaded and archived in the USGS National Water Information System (NWIS) and are available to the public through the online NWIS–Web system (U.S. Geological Survey, 2019b). Sites were visited approximately every 4 weeks to clean the sensors and every 8 weeks to check sensor performance and recalibrate any sensors that were outside performance specifications. Site visit frequency was increased for sites along Fanno Creek during winter months to decrease fouling due to the deposition and accumulation of suspended sediment on the sensors.
Continuous Water-Temperature Sensors
Onset HOBO Water Temperature Pro v2 Sensors (Bourne, Massachusetts) were deployed within the ponded areas at the Fanno and Bronson Creek intensive study reaches to measure water temperature every 30 minutes in areas with varying water depths and amounts of riparian shade (figs. 2 and 3; table 2). An additional water-temperature sensor was deployed approximately 600 m downstream from the Fanno Creek study reach. Water-temperature sensors also were deployed in paired installations (upstream and downstream from a beaver-dam complex [>1 dam along the stream in close proximity]) in five other urban streams (referred to as “auxiliary reaches”) to measure the cumulative effects of beaver activity on stream temperature (fig. 1; table 3). Along some auxiliary reaches, additional sensors were placed farther upstream or downstream where they would measure temperature in locations that were not affected by beaver activity to determine whether longitudinal warming was occurring because of other processes (see “Additional control sensor” column in table 3).
Table 3.
Site names and site numbers of beaver-affected monitoring locations (referred to as “auxiliary reaches”) monitored with water-temperature sensors, Tualatin River Basin, Oregon, November 2016–December 2017.[NWIS site name and NWIS site number: NWIS, National Water information System; Ave, Avenue; Ct, Court; NE, Northeast; nr, near; NW, Northwest; SW, Southwest; OR, Oregon; –, additional sensor not deployed]
| Stream name | Label on figure 1 |
Sensor location upstream from beaver-dam complex1 | Sensor location downstream from beaver-dam complex1 | Distance between upstream and downstream sensors (meters) |
Additional control sensor1 | ||||
|---|---|---|---|---|---|---|---|---|---|
| NWIS site name | NWIS site number | NWIS site name | NWIS site number | NWIS site name | NWIS site number | Location | |||
| Unnamed tributary to McKay Creek | 1 | McKay Creek Tributary nr NE 14th Ave, Hillsboro, OR | 453248122580600 | McKay Creek Tributary nr NE 9th Drive, Hillsboro, OR | 453248122582100 | 350 | – | – | – |
| Springville Creek | 2 | Springville Creek near Lark Meadow Terrace | 453334122511500 | Springville Creek near NW 180th Place, Portland, OR | 453328122514600 | 760 | – | – | – |
| Stoller Creek | 3 | Stoller Creek near NW 166th Ave, Portland, OR | 453319122505000 | Stoller Creek near NW 167th Place, Portland, OR | 453320122505700 | 640 | Stoller Creek near Mouth nr Oakley Ct, Portland, OR | 453322122512200 | Farther upstream |
| Summer Creek | 4 | Summer Creek at Fowler Middle School, Tigard, OR | 452559122472401 | Summer Creek below Fowler Woods Trail, Tigard, OR | 452600122471700 | 320 | Summer Creek below Fowler Woods Trail, site 2 | 452600122471400 | Farther downstream |
| Derry Dell Creek | 5 | Derry Dell Creek near SW Derry Dell Ct, Tigard, OR | 452533122472600 | Derry Dell Creek near SW 107th Ct, Tigard, OR | 452538122471600 | 400 | Derry Dell Creek at SW Walnut Street, Tigard, OR | 452547122465900 | Farther upstream |
Water-temperature sensors were deployed upstream and downstream from a beaver-dam complex in each of the five streams. At Derry Dell and Stoller Creeks, an additional control sensor was deployed approximately 240 meters upstream from the dam complex. At Summer Creek, the additional control sensor was deployed 130 meters farther downstream from the dam complex.
Data from the water-temperature sensors generally were collected from June 2016 to November 2017. All water-temperature sensors were deployed by attaching them to the inside of square cinder blocks with cable ties, and then placing the cinder blocks on the stream (or pond) bottom where they would remain submerged for the entire measurement period. The blocks were attached to nearby woody vegetation with rope so that they could be easily found and retrieved. Site visits and data downloads occurred monthly, and all data were collected following USGS protocols (Wagner and others, 2006). Sensors were checked in the laboratory against a National Institute of Standards and Technology-certified thermistor over a range of water temperatures, before and after deployment, and met the USGS criterion of agreement within 0.2 °C.
Synoptic Sampling
Synoptic sampling is the collection of water-quality point measurements from many locations during a short period of time, typically over a few hours. This sampling technique was used to measure the spatial variability of water temperature, dissolved oxygen, and pH within the ponded area along Fanno Creek on four hot summer afternoons from August 2016 to September 2017. For these synoptic surveys, YSI EXO2 multiparameter water-quality monitors were outfitted to measure water temperature, dissolved oxygen, and pH. Monitors were calibrated in the laboratory on the morning of the data-collection effort. Spatially dense measurements were collected at various depths throughout the pond and the old channel over the course of several hours. After each survey, ArcGIS software (version 10.7.1) was used to generate a spatially interpolated map of the water temperature using the “natural neighbor” method within the 3D Analyst toolbox. Synoptic data were not collected at Bronson Creek owing to budget and access limitations.
Stream Photosynthesis and Respiration Analysis
Since the 1940s, scientists have worked to quantify net ecosystem production (NEP) for aquatic ecosystems because it indicates the biological community function and the dominant processes affecting the water chemistry (Odum, 1956). Continuous dissolved-oxygen and water-temperature data, in addition to other datasets, can be used to calculate gross primary production (GPP) and ecosystem, or community, respiration (ER) occurring in a stream reach. NEP, or the rate of change of dissolved oxygen per unit area, is estimated by combining the rates of GPP, ER, gas transfer across the air/water interface (reaeration), and other inputs (such as groundwater) (Odum, 1956). Estimates of NEP and ratios of gross primary production to ecosystem respiration (P:Rs) can be compared among systems, where P:R greater than (>)1 and P:R less than (<)1 indicate autotrophic and heterotrophic communities, respectively (Odum, 1956). For example, forested streams with canopy cover often are heterotrophic, meaning that biological activity is dominated by processes that use a source of organic compounds (such as leaf litter) for metabolic growth (Young and Huryn, 1999; Mulholland and others, 2001; Acuña and others, 2004). Systems with high GPP and P:R>1 may be characterized by high concentrations of nutrients and direct sunlight (Mulholland and others, 2001), meaning that biological activity and metabolic growth are driven by photosynthesis.
Factors that control NEP rates include light, nutrient concentrations (nitrogen and phosphorus), and channel characteristics (Young and Huryn, 1999; Mulholland and others, 2001). Both urbanization and beaver activity may affect NEP and ecosystem function through (1) the addition of nutrients, (2) the removal of trees and an associated decrease in shading, and (3) changes to channel morphology (such as width-to-depth ratio, sinuosity, and ponding). Excessive GPP may indicate eutrophication, which can lead to dissolved-oxygen instability and low concentrations when the photosynthetic organisms perish (Nebgen and Herrman, 2019). The net ecosystem production of a reach affects the organic matter and dissolved oxygen available to downstream reaches.
Estimates of stream photosynthesis, respiration, and NEP were calculated in this study using two methods:
-
• A USGS model designed for R software, streamMetabolizer (Appling and others, 2018); and
-
• A macro-enabled spreadsheet model, River Metabolism Analyzer (Washington State Department of Ecology, 2018).
Inputs for the models included sub-daily measurements of dissolved-oxygen concentration, water temperature, photosynthetically active radiation (PAR), and either pH or depth data, depending on the model. Solar radiation data collected at an AgriMet weather station in Aurora, Oregon (ARAO), were used for both creeks and models (Bureau of Reclamation, 2020). The spreadsheet model required additional location information (latitude, longitude, and elevation) and estimates of alkalinity and light-extinction coefficients, among other information. Both models used Bayesian computation to predict GPP, ER, and a reaeration coefficient. The two models were used to compare results and derive insights based on areas of general agreement or disagreement.
Single-station models were applied instead of two-station models to allow greater flexibility for comparisons among different streams and comparisons at one site at different times. One assumption of these single-station NEP models is that primary production in the reach is homogeneous. However, the studied reaches were heterogeneous in many ways, containing ponds where high primary production likely occurred as well as deep channels where primary production likely was lower. At some of the study sites, stream transport between a ponded area of high productivity and a downstream measurement site caused the peak measured dissolved-oxygen concentration to occur long after (8–14 hours) the peak PAR was measured each day. This offset between the expected peak primary production (during peak light conditions) and the actual peak primary production (as measured by the peak dissolved oxygen and [or] pH conditions) caused uncertainty in the model predictions. Based on conversations with the model developers, the PAR input data were shifted to align the diel fluctuations in PAR to the diel fluctuations in measured dissolved-oxygen concentration. Although this shift altered the reaeration coefficients, it was considered more appropriate to account for the long transport times. Although there was general agreement in model results using the original compared to shifted data, the results presented in this report use the shifted data. Because of the violation of the models’ assumption of homogeneity and the manual alignment of the PAR data with the dissolved-oxygen data, results from these models are presented as approximate ranges rather than absolute quantities.
Subsurface water inputs likely were negligible in the Fanno Creek study reach; however, subsurface inputs were evident at the UB site, which can affect estimates of photosynthesis and respiration (Hall and Tank, 2005). Future studies could refine the modeled metabolism results by comparing them to two-station model results, independently estimating reaeration coefficients, and quantifying the effect of subsurface inputs along the Bronson Creek study reach.
Effects of Beaver Activity on Water Quality
Results from this study are grouped into five subsections. First, water-quality parameters (including water temperature, dissolved-oxygen, pH, and specific conductance) and synoptic measurements collected in Fanno Creek are discussed. Second, water-quality parameters (including water temperature, dissolved oxygen, and specific conductance) collected in Bronson Creek are reported. The subsequent subsections address the effects of beaver activity on ecosystem production, similarities and differences in water quality between Fanno and Bronson Creeks, and finally, the water-temperature effects at the auxiliary reaches. In addition to the tables and figures included in the text, the key water-temperature results from various comparisons among the study sites and reaches are documented in appendix 2.
Water-Quality Effects of Beaver Activity in Fanno Creek
Water Temperature
Comparison of water temperatures from the three multiparameter monitors and one water-temperature sensor deployed in Fanno Creek (fig. 4) shows longitudinal patterns in water temperature along the study reach. Continuous water-temperature analyses used the 7-day moving average of the daily maximum (7dADM) in accordance with the criterion used in the State of Oregon water temperature standard (Oregon Department of Environmental Quality, 2019a). During summer 2016 (May 18–September 30), 7dADM measurements at the DF site were significantly (Tukey post-hoc p values <0.01) warmer than at the PF and UF sites (fig. 4), suggesting that the water in the unshaded and shallow areas of the south pond likely was warmed by solar radiation. The 7dADM water temperature at the DF site was greater than 18 °C—the criterion for the protection of fish rearing and migration uses in summer—during most of summers 2016 and 2017. However, hourly water-temperature measurements indicate that water exiting the intensively monitored beaver-affected reach (measured at DF) was sometimes cooler than 18 °C (from 7 to 11 a.m.; fig. 5). The 7dADM values were not significantly different among the three sites during the winter months. The pattern likely is driven by lower air temperatures, less sunlight, and increased cloud cover during the shorter winter days, along with increased streamflow and decreased residence time; however, separation of the DF site from UF and PF sites began to appear as early as March 2017 as warming occurred during spring (fig. 4)
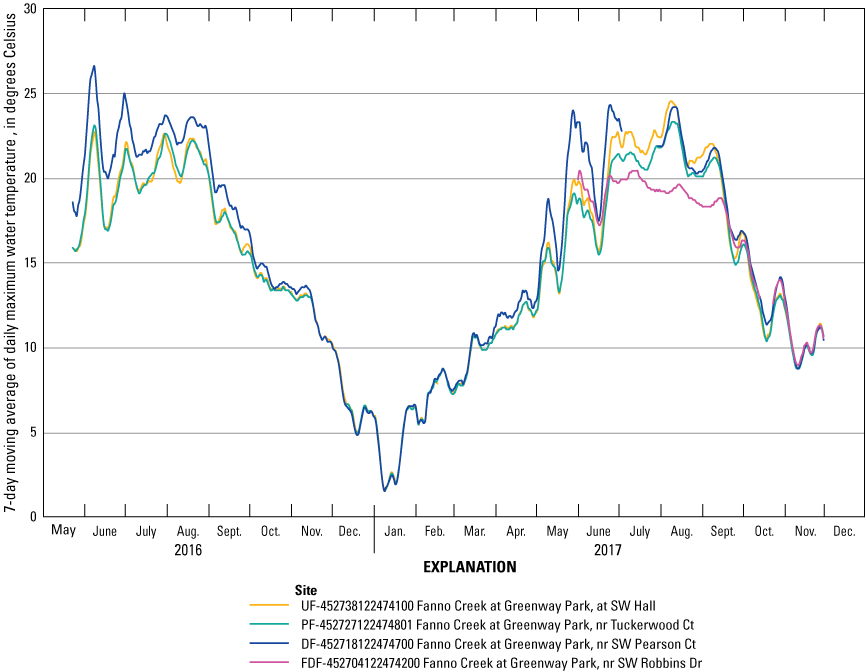
Seven-day moving average of the daily maximum water temperature measured upstream (UF; U.S. Geological Survey [USGS] site 452738122474100), in the ponded reach (PF; USGS site 452727122474801), downstream (DF; USGS site 452718122474700), and 600 meters farther downstream (FDF; 452704122474200) from a beaver-affected reach along Fanno Creek at Greenway Park, northwestern Oregon, May 2016–November 2017. Water-temperature sensor was deployed at the FDF location in June 2017. See figure 2 and table 2 for descriptions of the monitoring locations. Blvd, Boulevard; Ct, Court; Dr, Drive; nr, near; SW, Southwest.
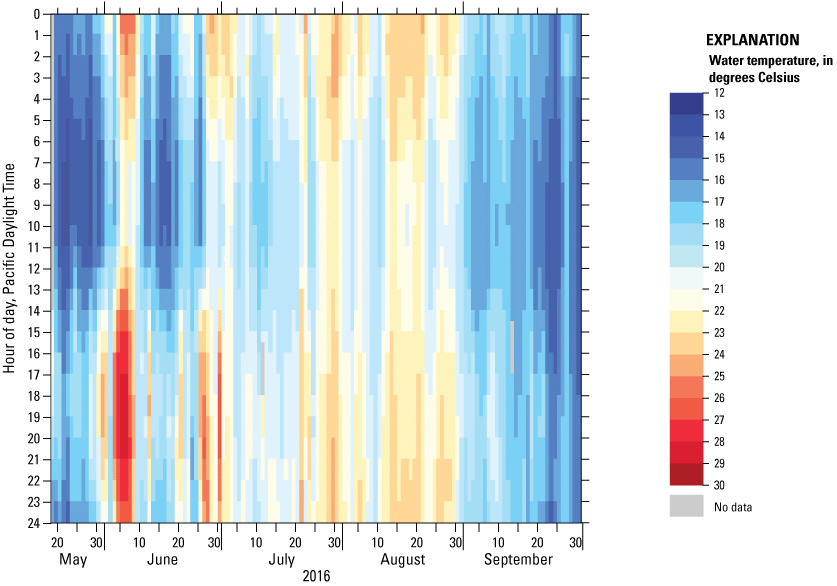
Hourly water temperature measured at the downstream site at Fanno Creek at Greenway Park, northwestern Oregon (DF; U.S. Geological Survey [USGS] site 452718122474700), summer 2016. A 24-hour format is used to present the hour of day along the y-axis and the date on the x-axis. Each vertical bar of color indicates one 24-hour period. Color maps can be created for other monitored sites by using the USGS Data Grapher system at https://or.water.usgs.gov/grapher/.
Downstream from the wide, unshaded, and warm beaver pond in Fanno Creek, the stream returned to a narrow, deep, and shaded channel. A water-temperature sensor placed 600 m downstream from the DF monitor (referred to as “Farther downstream at Fanno Creek” [FDF] [USGS site 452704122474200]; in free-flowing water not affected by beaver activity) indicated cooler water temperatures than those measured at the DF site (fig. 4). The cooling effect downstream from the large beaver pond likely was due to a shift in the heat budget of the stream, with a decreased total flux of incoming solar radiation in the narrower and more-shaded channel, thus allowing the stream to release a part of the heat it absorbed while in the shallow and unshaded beaver pond upstream.
The five continuous water-temperature sensors deployed in and around the large, south pond in Fanno Creek at Greenway Park showed diverse diel patterns. During summer, minimum daily water temperatures at the five sites were similar, but the daily maxima varied in their magnitude and timing (fig. 6). On July 26, 2017, at 1700 hours, the shallow, unshaded site (Site 2) measured 30.6 °C, whereas the deep, unshaded site (Site 3) measured 22.0 °C. Water temperatures at deep locations reached the daily maximum at around 2300 hours, whereas water temperatures at shallow locations reached the daily maximum at around 1700 hours each day. The 7dADM water temperatures for the five ponded sites were >20 °C during July and August 2017. Comparing water temperatures measured in a ponded reach to relevant water-quality standards can require identifying a representative sampling location, among other considerations; however, the water-temperature ranges indicate that on warm summer days, all sites within the ponded area may have thermally stressed sensitive aquatic life that prefer cool water.
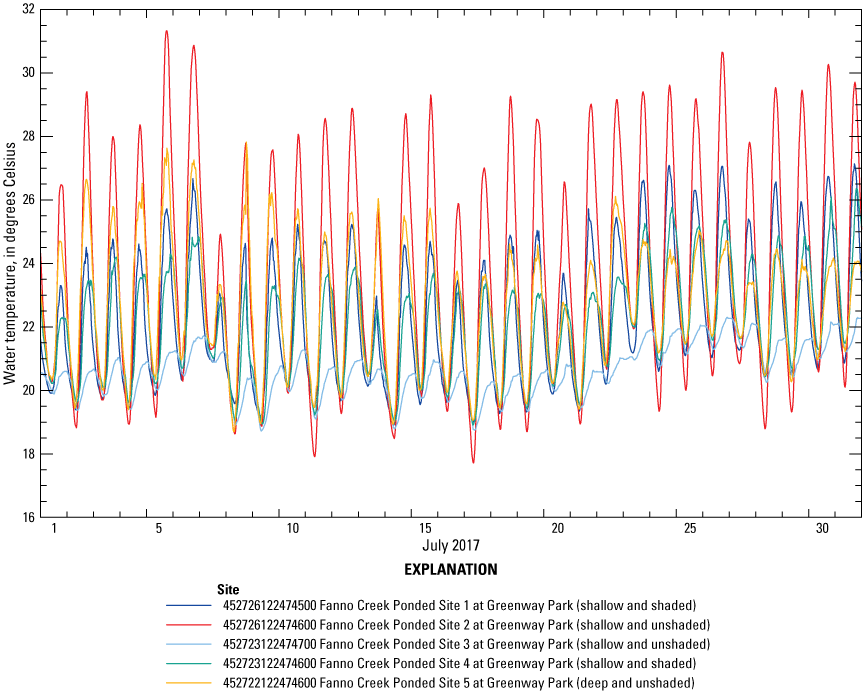
Water temperature measured every 30 minutes at five sites within the south pond along Fanno Creek at Greenway Park, northwestern Oregon, July 2017. The five sensors were deployed at various depths and in different shade conditions (table 2).
Dissolved Oxygen
Dissolved-oxygen concentrations in streams are affected by (1) the oxygen concentrations of incoming waters (such as creek water, runoff, and subsurface water), (2) inputs from photosynthesis, (3) losses to respiration and organic-matter decomposition, and (4) exchange with the atmosphere across the air/water interface (reaeration). In slow-moving or ponded reaches, reaeration tends to be slow. Photosynthesis requires sunlight as well as sufficient nutrients and favorable temperatures, and the plant species that photosynthesize—phytoplankton, macrophytes, or periphyton (which can have differential effects on primary production)— are themselves determined by other habitat variables such as flow velocity and substrate. Decomposition of organic matter occurs in suspension as well as at the sediment/water interface, and the rate increases with increasing temperature. Oxygen can exceed its water solubility when photosynthetic production is high, and concentrations can decrease to zero if consumption through respiration or decomposition is large; these effects are exaggerated when gas exchange with the atmosphere is slow, such as when water velocities or wind are low.
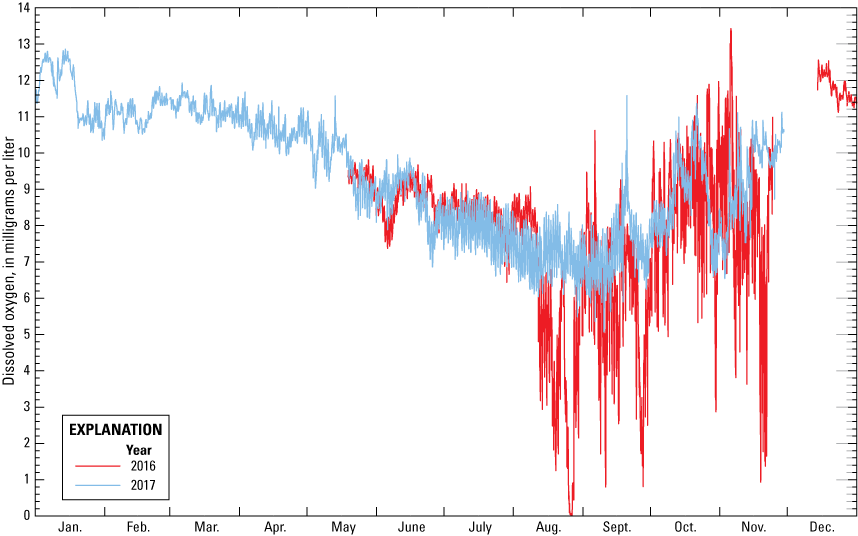
All three continuous-monitoring sites along Fanno Creek showed low dissolved-oxygen concentrations for parts of summers 2016 and 2017, less than the three-tiered cool-water dissolved-oxygen standard (Oregon Administrative Rules, 340-041-0016(3); Oregon Department of Environmental Quality, 2019b; table 4). Concentrations less than the standard are relevant because they may be indicative of stressful conditions for sensitive aquatic organisms. The water-quality standard sets the minimum instantaneous dissolved-oxygen concentration for cool-water aquatic life at 4 mg/L. Instantaneous dissolved-oxygen values measured at the UF site (and representing concentrations entering the study area) reached concentrations less than 3 mg/L on multiple days in August 2017 (fig. 7) but also reached as high as 10 mg/L that month. Measurements at the PF site showed a prolonged period of dissolved-oxygen concentrations less than 2 mg/L during August 2017, which may have been a result of relatively stagnant water (low streamflow), thermal stratification, and a proportionately high oxygen consumption from the decomposition of organic matter in surficial sediment (sediment oxygen demand; Rounds and Doyle, 1997; fig. 7). Dissolved-oxygen concentrations at the DF site varied substantially in the summer months, sometimes fluctuating more than 4 mg/L in a day. Water exiting the ponded area (measured at the DF site) was either oxygenated (50–70 percent oxygen saturation) or hypoxic (oxygen percentages and concentrations near zero) because of the primary productivity, respiration, and sediment oxygen demand occurring in the shallow waters of the south pond just upstream.
Table 4.
Percentage of time that measured dissolved-oxygen concentrations were less than the three-tiered criteria of the State of Oregon dissolved-oxygen water-quality standard for cool-water aquatic life, in Fanno Creek at Greenway Park, northwestern Oregon, 2016–17.[Data collection began on May 18, 2016. For this analysis, summer 2016 was defined as May 18, 2016, to September 30, 2016, and summer 2017 was defined as May 16, 2017, to September 30, 2017. Running averages were assigned to the last date in the 7-day or 30-day window. Values were rounded to the nearest integer. Abbreviation: mg/L, milligrams per liter]
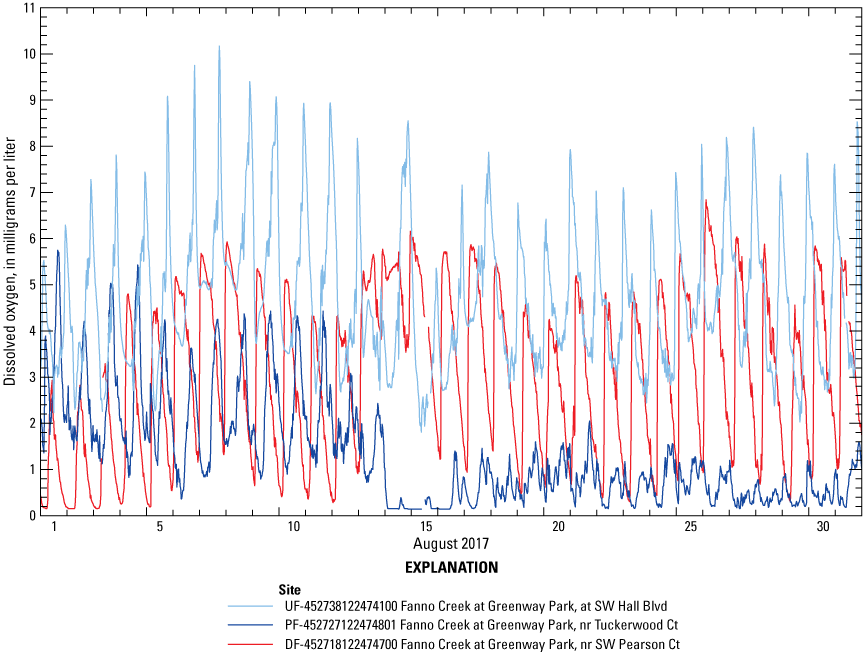
Dissolved-oxygen concentrations, measured every 30 minutes at the upstream (UF; U.S. Geological Survey [USGS] site 452738122474100), ponded (PF; USGS site 452727122474801), and downstream (DF; USGS site 452718122474700) locations along Fanno Creek at Greenway Park, northwestern Oregon, August 2017. Blvd, Boulevard; Ct, Court; nr, near; SW, Southwest.
The low dissolved-oxygen concentrations measured in the Fanno Creek reach were not unexpected because long-term monitoring stations throughout the Tualatin River Basin have established that dissolved-oxygen concentrations in valley-bottom streams can reach low concentrations during summer even in the absence of beaver dams and beaver activity (Sobieszczyk and others, 2014). In the hot, dry summer months (June–September) from 2009 through 2019, dissolved-oxygen concentrations measured in Fanno Creek at Durham (USGS site 14206950) typically ranged from 6 to 8 mg/L, with a few deviations <4 mg/L (U.S. Geological Survey, 2019b). Concentrations for the same dates in a nearby stream (Beaverton Creek; USGS site 453004122510301) mostly ranged from 3 to 6 mg/L and dissolved-oxygen concentrations <2 mg/L were measured for multiple weeks in some years (U.S. Geological Survey, 2019b). Although site characteristics differ between Beaverton and Fanno Creeks, the low gradient and large accumulation of decomposing organic matter in the sediments of valley-bottom streams in the Tualatin River Basin can cause low dissolved-oxygen concentrations in the absence of beaver dams.
pH
An important water-quality indicator is pH because it affects biological processes, organisms, and the solubility of many chemical constituents. A pH of 7.0 is neutral, whereas typical rainwater in northwestern Oregon is slightly acidic (pH=5.65) because atmospheric carbon dioxide reacts with rainwater to form carbonic acid. Photosynthesis causes pH to increase because that process removes dissolved carbon dioxide (and carbonic acid) from the water; respiration reverses the process and causes pH to decrease.
Values of pH in Fanno Creek generally remained within the 6.5 (minimum) to 8.5 (maximum) standard unit range specified by the State of Oregon water-quality standard (Oregon Department of Environmental Quality, 2019c; fig. 8). Values less than 6.5 standard units measured at the UF site corresponded with large streamflow events, indicating a larger proportion of water from slightly acidic rainfall during those storms. During the synoptic survey on May 23, 2017, an extensive algal bloom was observed and photographed in the south pond. Large amounts of photosynthesizing organisms in shallow water could increase the pH because of the uptake of dissolved carbon dioxide (and subsequent decrease in carbonic acid). High pH conditions are not uncommon during large algal blooms and typically are temporary. Values of pH were not recorded during the synoptic survey in the south pond on that date; however, elevated pH values were measured at the DF monitor, indicating that the affected water was transported downstream. During the synoptic survey on September 12, 2017, instantaneous pH values at multiple locations within the south pond exceeded the 8.5 maximum criterion (Poor, 2020), and another algal bloom was observed at that time. However, elevated pH values were not measured at the DF monitor.
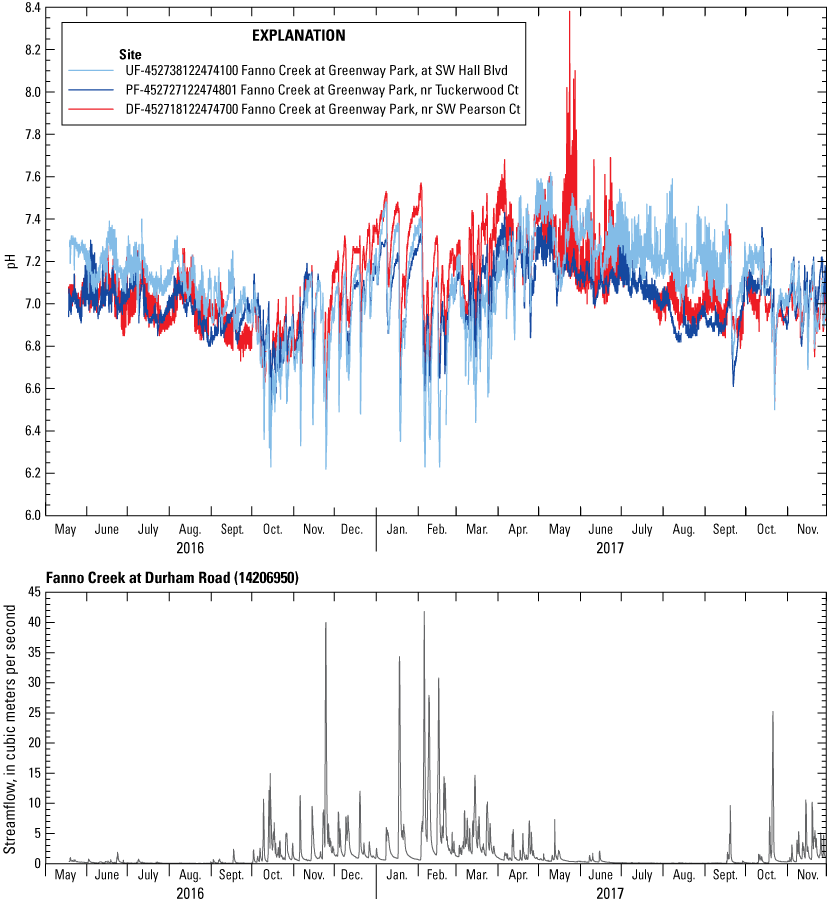
Continuous pH measured at the upstream (UF; U.S. Geological Survey [USGS] site 452738122474100), ponded (PF; USGS site 452727122474801), and downstream (DF; USGS site 452718122474700) locations along Fanno Creek at Greenway Park (top); and streamflow measured approximately 8.5 kilometers downstream from Greenway Park at Durham Road (USGS site 14206950; bottom), northwestern Oregon, May 2016–November 2017. Blvd, Boulevard; Ct, Court; nr, near; SW, Southwest.
Specific Conductance
The specific conductance of a waterbody is related to the concentration of charged solutes that it contains (such as bicarbonate [HCO3-], sodium ion [Na+], chloride ion [Cl-], potassium ion [K+], magnesium ion [Mg2+], etc.). Specific conductance often increases in a downstream manner, and patterns in the data may indicate the presence and locations of point sources or diffuse inputs such as subsurface water. For example, rainwater contains few solutes, and rainwater inputs result in localized decreases in specific conductance. Conversely, subsurface, agricultural, and municipal water inputs can contain high concentrations of solutes, increasing the specific conductance of the stream.
Specific conductance values measured in Fanno Creek at Greenway Park were high in summers 2016 and 2017, relative to historical measurements recorded 8.5 km downstream at Fanno Creek at Durham (USGS site 14206950). Values reached >1,000 µS/cm in summer 2016 in the study reach, whereas values reached a maximum of only 400 µS/cm that summer at Fanno Creek at Durham (fig. 9); a tributary entering Fanno Creek between Greenway Park and Durham diluted the specific conductance. A source of elevated conductance water upstream from Greenway Park likely caused the localized elevated specific conductance values in the study reach, which created a clear signal to trace from UF to DF.
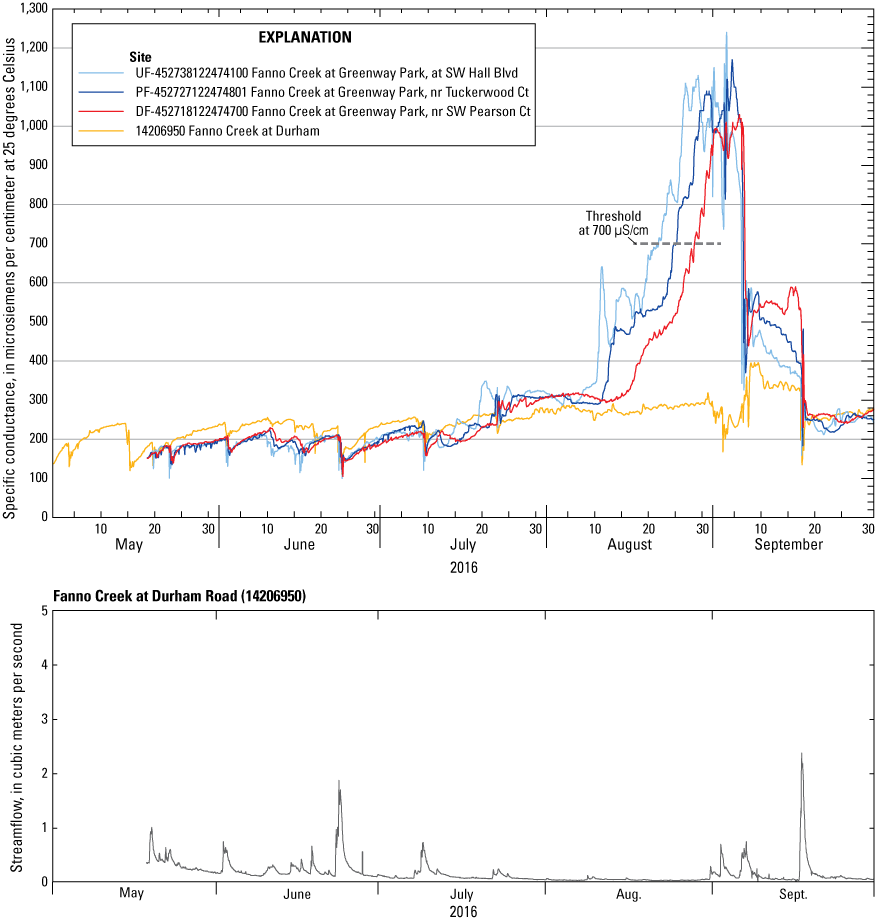
Specific conductance measured at four sites along Fanno Creek (top), and streamflow measured at the farthest downstream site and approximately 8.5 kilometers downstream from Greenway Park at Durham Road (U.S. Geological Survey [USGS] site 14206950; bottom), northwestern Oregon, May–September 2016. Three sites were located in the study reach in Greenway Park (UF, USGS site 452738122474100; PF, USGS site 452727122474801; DF, USGS site 452718122474700), and the fourth site was downstream at Durham Road (USGS site 14206950). Dashed line at 700 microsiemens per centimeter (µS/cm) shows one of the thresholds used to determine travel time from upstream to downstream through the study reach. Blvd, Boulevard; Ct, Court; nr, near; SW, Southwest.
Five discrete time periods in summer (low flows) and winter (high flows) were chosen to analyze the travel time of water between each continuous water-quality monitor in the Greenway Park study reach. For each period, the date and time were recorded when the measured specific conductance at each monitoring location (UF, PF, and DF) reached a designated threshold in the data (for example, ≥700 µS/cm in summer [fig. 9] and ≤140 µS/cm in winter). The time differences showed the travel time required for the pulse of upstream water with high specific conductance (summer) or the diluted rainwater (winter) to move through the study reach.
The average travel time from the UF to the DF sites (a distance of 940 m) during summer (low flow; n=5) was approximately 146 hours, or about 6 days (fig. 10). Travel time was longer through the large south pond (from PF to DF sites) compared to the channelized part of the reach from UF to PF sites, likely because of decreased water velocity in the beaver pond. In winter (high flow; n=5), the average travel time from UF to DF sites was approximately 3 hours, and the average travel times from UF to PF sites and from PF to DF sites were similar (fig. 10). These analyses were not conducive to determining the overall effect of the beaver dams on water velocity in the reach during high flows; however, hydraulic models were used to examine the effects of beaver dams in the Fanno Creek at Greenway Park study reach on water storage during storm events (see White and others, 2025b).
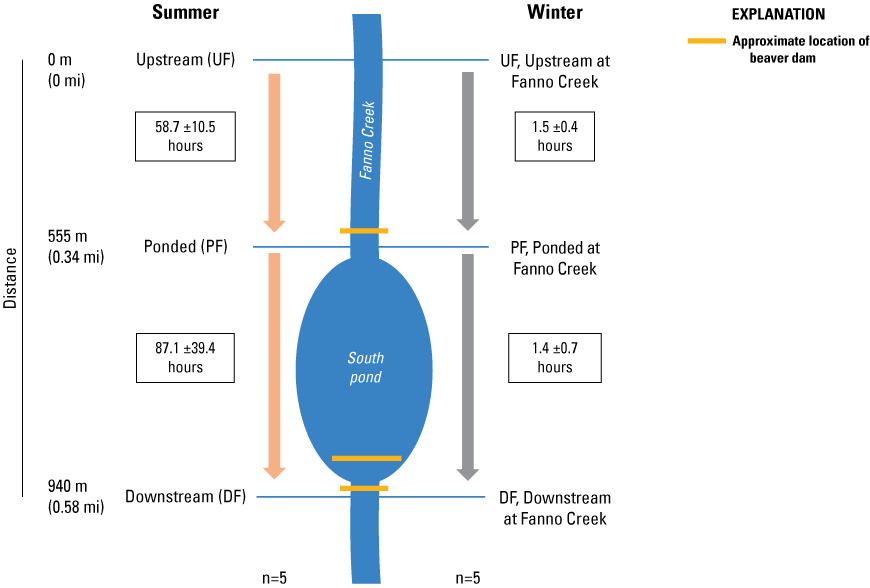
Distances and estimated travel times derived from specific conductance data collected in the Fanno Creek at Greenway Park study reach, northwestern Oregon. m, meters; mi, miles; n, number of time periods analyzed to obtain a mean travel time; ±, plus or minus.
Synoptic Measurements
Synoptic measurements were used to characterize the spatial variability in water temperature, dissolved-oxygen concentration, and pH in the south pond of the Greenway Park study reach during four hot summer afternoons (Poor, 2020). Data collected at the same depth (10 cm below the water surface) showed substantial spatial variation in water temperature and dissolved oxygen on the measurement dates in May, August, and September 2016–17 (fig. 11). During a synoptic sampling on September 12, 2017, dissolved-oxygen concentrations at a depth of 10 cm ranged from nearly anoxic (0.3 mg/L, 3 percent oxygen saturation) in the shaded old channel to supersaturated conditions (23.6 mg/L, 304 percent oxygen saturation) in the shallow, unshaded part of the pond (fig. 11).
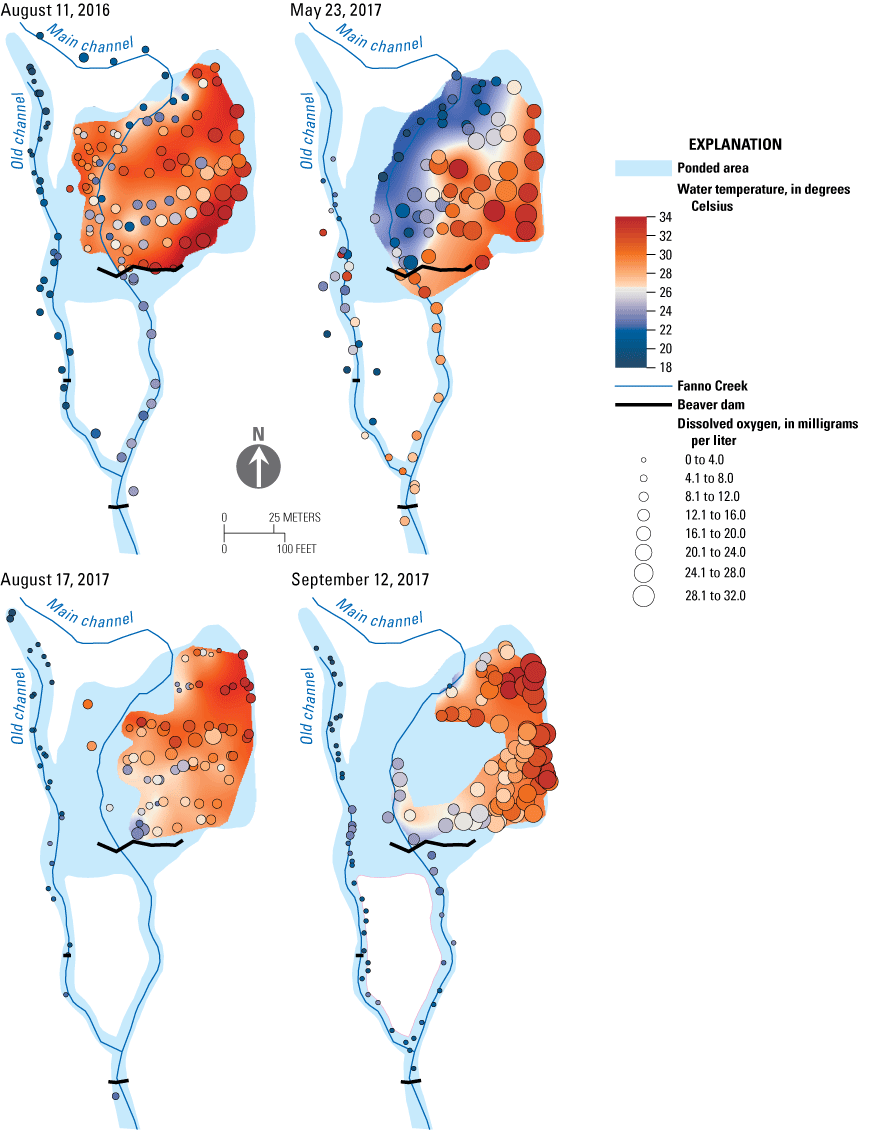
Spatially dense measurements of water temperature and dissolved oxygen collected over a few hours on four hot afternoons in the ponded section of Fanno Creek at Greenway Park, northwestern Oregon, August 2016–September 2017. Circles show the measurement locations, the size of the circle represents the dissolved-oxygen concentration, and the color inside the circle represents the measured water temperature. All measurements shown were collected at 10 centimeters below the surface of the water. Water temperatures were spatially interpolated between the measurement points to produce the continuous color map.
In addition to the synoptic measurements collected at a depth of 10 cm, measurements were collected at several other depths. In general, warmer water temperatures and higher dissolved-oxygen concentrations were measured in shallow and unshaded areas, and cooler water with lower dissolved oxygen was found in deeper channels and in areas with abundant riparian cover (fig. 12; Poor, 2020). Sunlight and warm water temperatures in the shallow, unshaded pond promoted algal growth and photosynthesis, resulting in supersaturated dissolved-oxygen concentrations and high-pH conditions. The abundant sunlight and warm-weather conditions caused the water to stratify, with less-dense warmer water floating on top of cooler water in the deeper areas, thus providing a separation of conditions from top to bottom. Water at greater depths showed less spatial variation in both water temperature and dissolved oxygen compared to surface measurements (fig. 12). In all areas of the pond, an accumulation of decomposing organic matter in the sediments, combined with warm water temperatures that increase the rate of organic-matter decomposition, likely resulted in a substantial rate of sediment oxygen demand (Rounds and Doyle, 1997). In the absence of photosynthesis in the shaded areas or near the bottom of a stratified water column, a high rate of sediment oxygen demand could explain the near anoxic conditions measured in deeper water during these synoptic samplings.
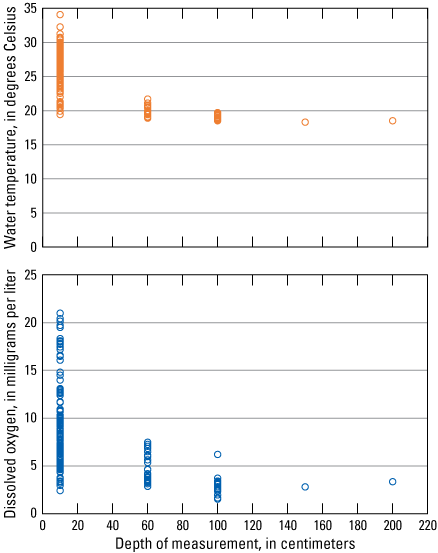
Spatially dense measurements of water temperature and dissolved-oxygen concentration collected at various depths and locations in the ponded section of Fanno Creek at Greenway Park, in northwestern Oregon during the afternoon of August 11, 2016. Each circle represents a water-temperature or dissolved-oxygen measurement at a different location.
Water-Quality Effects of Beaver Activity in Bronson Creek
Water Temperature
Water-temperature patterns in the Bronson Creek study reach (fig. 3) varied over the course of the year in response to changes in weather and flow conditions. Among the longitudinal monitoring sites (UB, PB, DB), the UB site was often the warmest location in winter and the coolest location in summer, probably because the creek’s source was subsurface water in the nearby foothills, and subsurface water temperatures are buffered compared to surface-water temperatures (Arrigoni and others, 2008). The upstream site also is partly shaded, which helps the water remain cooler during summer. Summertime temperatures were highest at the PB site, followed by the DB and UB sites (figs. 13 and 14), probably because of solar heating in unshaded reaches and surface/subsurface-water exchange processes occurring in the water-saturated areas of the valley bottom in the lower sections of the study reach.
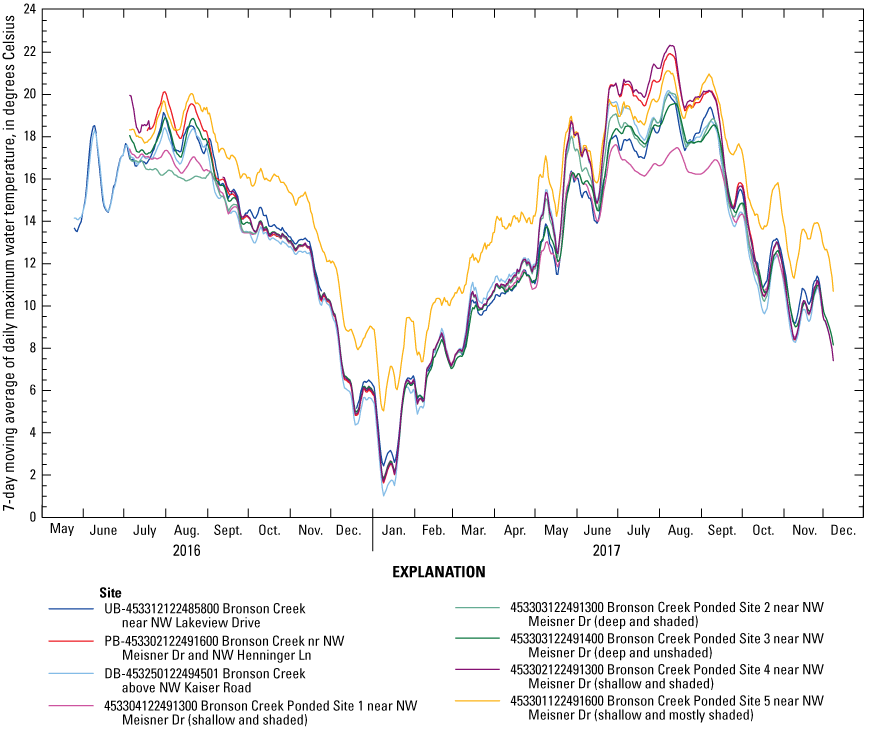
Seven-day moving average of the daily maximum water temperature measured at eight locations along a beaver-affected reach of Bronson Creek, northwestern Oregon, May 2016–December 2017. One monitoring site was located upstream from the beaver-affected reach (UB) and one site was located downstream from that reach (DB). The other six sites were located within the ponded area. Dr, Drive; Ln, Lane; nr, near; NW, Northwest.
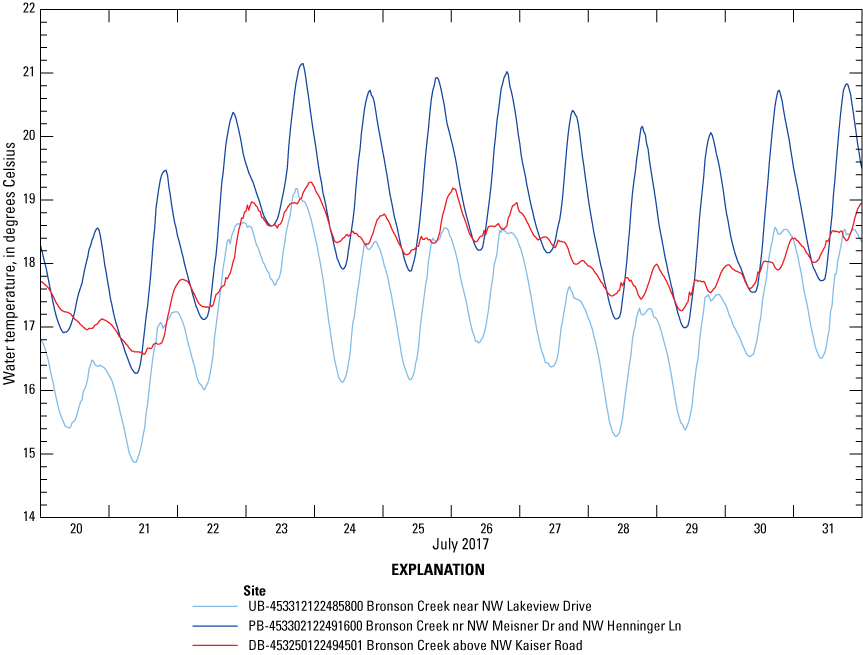
Water temperature measured every 30 minutes at three locations along the beaver-affected study reach of Bronson Creek, northwestern Oregon, July 20–31, 2017. Measurement sites were representative of upstream (UB; U.S. Geological Survey [USGS] site 453312122485800), ponded (PB; USGS site 453302122491600), and downstream (DB; USGS site 453250122494501) locations in the study reach. Dr, Drive; Ln, Lane; nr, near; NW, Northwest.
In the Bronson Creek study reach, the 7dADM water temperature at the PB site was significantly (Tukey post-hoc p values <0.01) warmer than at the UB and DB sites during summers 2016 (May 19–September 30) and 2017 (May 16–September 30). From July through September in 2016 and 2017, the instantaneous water-temperature patterns at the DB site were markedly different from those at the PB site. The DB site diel fluctuation became more muted, and its daily maxima were often multiple degrees cooler than those at the PB site (fig. 14). Water in the creek often was near bank-full in summer, and the floodplain seemed to be water-saturated, indicating that the water table was near the land surface. Ponding due to multiple beaver dams likely influenced that elevated water table and may have increased flow through the substrate of the floodplain. Subsurface flow is often characterized by dampened diel temperature variation, lag times in daily peak temperatures, low dissolved-oxygen concentrations, and elevated specific conductance (Arrigoni and others, 2008; Hinkle and others, 2014). During all seasons, water at the DB site had the most time and opportunity to interact with the subsurface system of the floodplain, compared to the PB and UB sites; the UB site was close to the subsurface water source in the steeper headwaters of Bronson Creek. The temperatures shown in figure 14 correspond to low streamflow conditions of late summer, a time period when the influx of subsurface water likely affected water temperature at the DB site proportionately more than at other times of the year because of the long residence time.
In addition to the three continuous multiparameter instruments, five continuous water-temperature sensors were deployed at locations with varying depths and shade in the ponded area near the PB continuous water-quality monitor (fig. 13; table 2). From October 2016 to May 2017, water-temperature sensors at Sites 1–4, which were placed in interconnected channels along Bronson Creek, collected similar temperature measurements. Temperatures recorded at Bronson Creek Site 5, in mostly shaded and shallow water, were multiple degrees Celsius warmer than those from the other sites from October to May, suggesting that this particular body of water may not have been part of the main channelized flow of the stream. Minimum instantaneous water temperatures often were coolest at Site 5 compared to other sites (June–September), with large diel fluctuations (not shown). In this case, separation from the main channel flow during summer may have allowed other factors (such as air temperature fluctuations and shading) to influence water temperatures in this small body of water, creating relatively cooler temperatures at certain times of day compared to other locations in the ponded area. Complex channel morphology and localized factors created local areas with a range of temperatures, potentially providing aquatic habitats for a diverse set of aquatic organisms.
Temperature sensors placed upstream (Site 3) and downstream (Site 4), but at similar distances, from one mud-packed dam in the Bronson Creek study reach measured substantially different 7dADM water temperatures during summer 2017 (May 16–September 30). The upstream site, located in an unshaded part of the channel, was significantly cooler (Wilcoxon signed-rank p value <0.05) than the downstream site that had approximately 40 percent canopy cover during summer. The 7dADM water temperature generally was more than 1 °C higher at the downstream site during summer 2017 (fig. 13). The measured temperature difference may be a result of the water depths and characteristics of the dam. This dam was packed with mud such that little to no water was observed leaking through the dam. During summer, water in the pond upstream from the dam became stagnant and probably was stratified as solar radiation heated the uppermost layer of the water column. The mud-packed dam likely prevented any deeper, cooler water in the lower layers of the water column from flowing downstream. Instead, the warmer upper layer of the water column flowed over the top of the dam, transporting warm water to the sensor located downstream from the dam. This result suggests that dam-construction materials and characteristics can have an important localized effect on stream temperature.
Dissolved Oxygen
Dissolved-oxygen measurements from the continuous multiparameter instruments varied among the three sites in the Bronson Creek study reach, with summertime oxygen concentrations decreasing from the UB to the DB site (fig. 15). Patterns in these data may be partially explained through an understanding of the physical characteristics of this reach. For example, water entering the reach from the upstream foothills probably was well oxygenated by the reaeration of water in the steeper slopes, despite the initially low dissolved oxygen of its subsurface source. Decreasing dissolved-oxygen concentrations at downstream sites likely were caused by (1) increased oxygen demands from decomposing organic matter deposited in the lower-velocity ponded areas, (2) decreased reaeration in those ponded areas, and (3) increased interactions with hypoxic subsurface water.
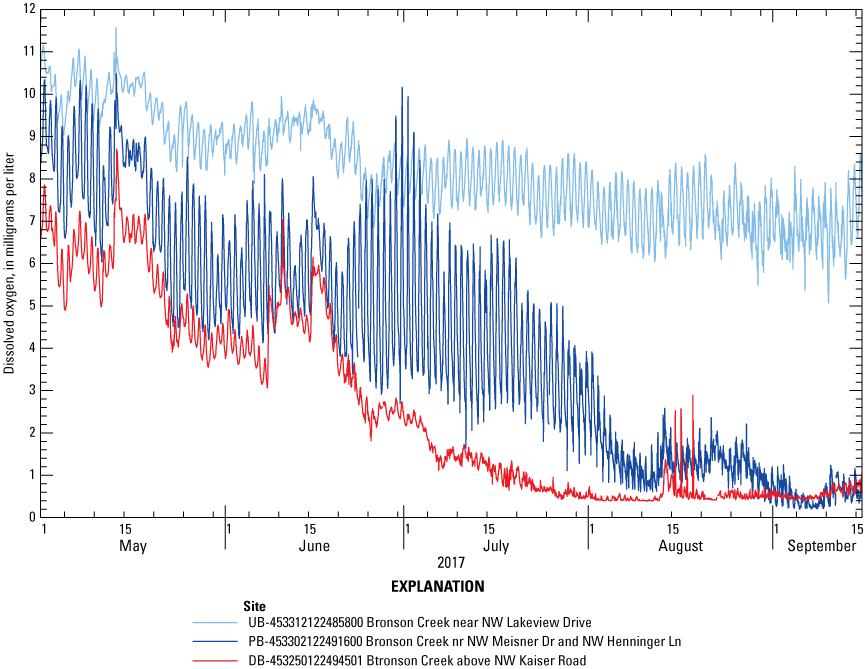
Dissolved-oxygen concentrations measured every 30 minutes at three locations along a beaver-affected reach of Bronson Creek, northwestern Oregon, May–September 2017. DB, downstream; Dr, Drive; Ln, Lane; nr, near; NW, Northwest; PB, ponded; UB, upstream.
Subsurface inputs and exchange can decrease the dissolved-oxygen concentration because of organic-matter decomposition and the general presence of a reducing environment in the subsurface. From May through September 2017, the PB site had a pronounced diel fluctuation—the effects of photosynthesis and respiration from the growth of algae and an accumulation of aquatic plants (fig. 15). However, the DB site did not have a defined diel pattern. The minimal diel fluctuations at the DB site were likely the result of little to no photosynthesis along with subsurface inputs containing low dissolved oxygen.
Specific Conductance
The hypothesis that subsurface flow interactions affected water quality at the DB site is supported by an examination of measurements of specific conductance. During summer, specific conductance increased by about 10 µS/cm from the UB to PB sites and increased by about 40 µS/cm from the PB to DB sites (fig. 16). A substantially higher specific conductance at the DB site is consistent with the movement of a fraction of the stream water through soil pore spaces because a greater interaction with soils tends to mobilize and transport dissolved solutes from the subsurface to the stream. Because the specific conductance was affected by subsurface exchange, a clear signal could not be traced from the UB to DB sites and the travel time of water through the reach could not be calculated as simply as it was in the Fanno Creek study reach; more explicit tracer tests, possibly combined with modeling efforts, would be needed to better estimate travel time and characterize interactions between subsurface and surface water at this location.
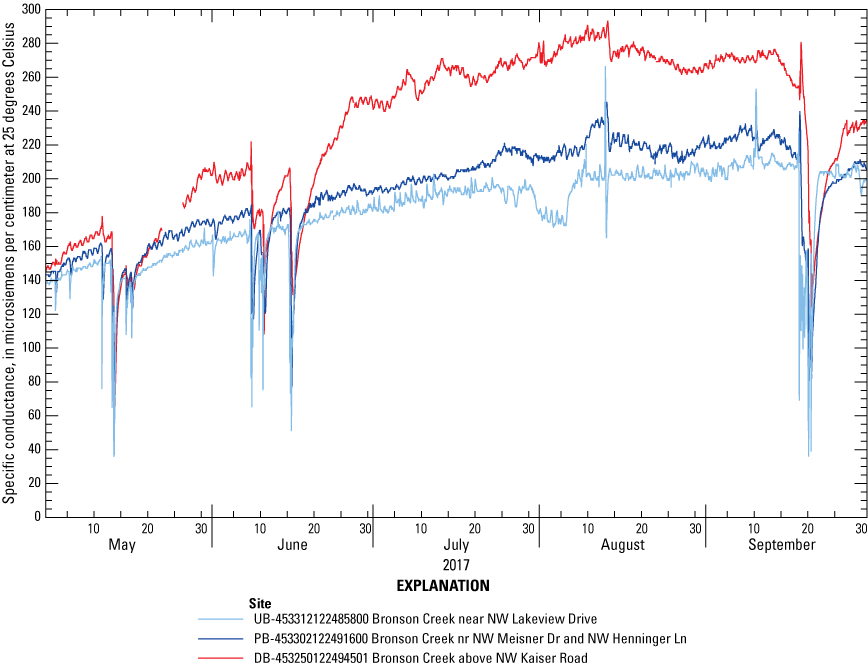
Specific conductance measured every 30 minutes at three locations along a beaver-affected reach of Bronson Creek, northwestern Oregon, May–September 2017. DB, downstream; Dr, Drive; Ln, Lane; nr, near; NW, Northwest; PB, ponded; UB, upstream.
Effects of Dam Building
The effects of beaver activity on water quality also were captured through an unintentional case study that occurred at the UB site of the Bronson Creek study reach. A continuous water-quality monitor was deployed in a free-flowing section in May 2016. Around August 11, 2016, beavers built a dam 20 m downstream from the monitor, turning the original free-flowing section into a slow-moving, narrow pond that began to accumulate sediment and organic matter, and causing the dissolved-oxygen concentration to decrease and become erratic (fig. 17; app. 3). During the 7 days prior to the dam construction, instantaneous dissolved-oxygen concentrations ranged from a minimum of 7.5 mg/L to a maximum of 9.1 mg/L, whereas instantaneous concentrations ranged from a minimum of 1.8 mg/L to a maximum of 7.0 mg/L during the 7 days following the dam construction. Field observations and data collected over the following months confirmed monitor readings and indicated that the site characteristics were changing. The dam caused the site to transition from free flowing to almost stagnant and ponded water during low streamflow. The sensors were closer to the streambed than before dam construction because of the accumulation of sediment behind the new beaver dam, and the sensors were temporarily buried by sediment during a large storm in November 2016. The erratic readings may have been caused by heterogeneous conditions in the newly ponded water column or by beavers stirring up sediment that affected oxygen measurements near the bed. Suspension of sediment that contains organic matter can temporarily increase the biochemical oxygen demand of a stream (Rounds and Doyle, 1997), a process that would be consistent with the erratic readings at this site. The monitor was repositioned to measure the middle of the new water column in December 2016. Dissolved-oxygen readings from December 2016 through August 2017 were less irregular, indicating that the site may have reached a new equilibrium with the beaver dam still in place.
Dissolved-oxygen concentrations measured every 30 minutes at the upstream site (UB; U.S. Geological Survey site 453312122485800) along Bronson Creek, northwestern Oregon, 2016–17.
Effects of Beaver Activity on Stream Photosynthesis and Respiration
Observations indicate that the magnitude of the effects that beaver dams have on streams in the Tualatin River Basin is partially dependent on local site characteristics, but some effects are consistent among sites. First, beaver dams cause ponding that changes the depth and often increases the surface area of the stream. Second, the slower-moving water and ponding create favorable areas for the growth of algae and aquatic plants and the deposition of sediment and particulate organic matter. Determining rates of net ecosystem production (NEP) by applying models can help quantify dissolved-oxygen budgets and result in insights into the effects of primary production and respiration on stream water quality. Two models were applied in this study to estimate the ranges of NEP and the ratios of gross primary production to ecosystem respiration (P:R) at different sites and different times.
The calculated production and respiration rates and P:R ratios were considered to be approximations due to model uncertainties. However, comparing rates and ratios among sites was useful for deriving insights into water-quality processes. Considering that weather (air temperature) and light conditions (season, cloud cover) affect primary production in aquatic ecosystems, it was important to calculate NEP and P:R ratios during the same time periods for different sites that would have had similar weather and light conditions, when applicable. Comparisons include:
-
• Upstream Fanno and Upstream Bronson (UF and UB sites; August 1–8, 2016)—This comparison indicated how site-specific characteristics affected NEP and P:Rs, and it determined NEP and P:Rs upstream from the two intensively monitored beaver-affected reaches.
-
• Upstream Fanno and Downstream Fanno (UF and DF sites; August 1–8, 2016)—This comparison determined the net effects of a beaver-affected reach (with negligible subsurface inputs) on NEP and P:Rs within Fanno Creek.
-
• Upstream Bronson Before Dam (August 1–8, 2016) and Upstream Bronson After Dam (August 12–21, 2016)—This comparison indicated whether the addition of a beaver dam, and the associated changes in water quality, affected NEP and P:Rs.
Analyses using two models (streamMetabolizer and River Metabolism Analyzer) provided a range of approximate NEP at each site (table 5). In early August 2016, the upstream sites at Fanno and Bronson Creeks were classified as heterotrophic because the approximate P:R was <1 (table 5), meaning that the daily ecosystem respiration was higher than the daily gross primary production, and that biological processes at the sites were consuming more oxygen than they produced. During this time (August 1–8, 2016), the UB site may have been less heterotrophic than the UF site, possibly because the UB site had higher water velocities (attributable to its proximity to nearby foothills) and a lower sediment oxygen demand (attributable to the absence of organic matter in its sediments), leading to decreased oxygen consumption. A comparison of conditions at UB before and after the beaver dam was built (on August 11, 2016) shows that the site was more heterotrophic (with higher ER) after the dam was built. The relative increase in ER was probably a result of the accumulation of particulate organic matter and sediment after the dam was built, which likely caused an associated increase in oxygen demand (Acuña and others, 2004).
Table 5.
Net ecosystem production rates and ratios of gross primary production to ecosystem respiration for three sites in the Tualatin River Basin, northwestern Oregon, August 2016.[Net ecosystem production (NEP) was calculated by subtracting the absolute value of the average ecosystem respiration (ER) from the average gross primary production (GPP). The ratio of GPP to ER was calculated by dividing the average GPP by the absolute value of the average ER. Ranges show the results from two different models; results from the Appling and others (2018) model are in boldface type, and results from the Washington State Department of Ecology (2018) model are not. NWIS site number: NWIS, National Water Information System. P:R: Ratio of gross primary production to ecosystem respiration. Abbreviation: g O2 m-2 day-1, grams of oxygen per square meter per day]
The south pond is a large unshaded pond resulting from beaver activity that separates the UF site from the DF site (fig. 2) and is the location where substantial primary productivity and ecosystem respiration occurs. Continuous water-quality monitoring data showed pronounced diel fluctuations of pH and dissolved oxygen (fig. 7), confirming the occurrence of photosynthesis in the pond. Synoptic measurements on warm summer afternoons also had confirmed supersaturated dissolved-oxygen concentrations (Poor, 2020) that were the result of substantial primary productivity. The NEP analyses suggest that the DF site (affected by processes occurring in the pond) was still heterotrophic (table 5), but less so than the UF site. Production occurring in the south pond resulted in a higher (but still negative) NEP measured at the DF site than at the UF site, but that production was not enough to shift the DF site from heterotrophic to autotrophic.
Both models approximated negative NEP values and P:Rs <1 for the three analyzed sites at the specified time periods. These results indicate that the study reaches were net sinks for dissolved oxygen and organic matter (Marzolf and others, 1994; Mulholland and others, 2001). The NEP rates upstream from the beaver-affected reaches (free-flowing upstream locations, August 1–8, 2016) were negative, indicating that they were heterotrophic without the influence of beavers, probably because of a baseline sediment oxygen demand and relatively low rates of productivity. The addition of the beaver dam at the UB location resulted in a decreased (more negative) NEP rate, indicative of the increased consumption of oxygen from organic-matter decomposition; this decreased NEP rate shows that beaver dams can alter ecosystem function through a shift in the relative importance of oxygen-producing or oxygen-consuming processes (Naiman and others, 1986; Naiman and others, 1988).
Similarities and Differences in Water Quality Between Fanno and Bronson Creeks
Although measurements of water-quality parameters differed between the intensively monitored sites on Fanno and Bronson Creeks, the underlying processes occurring at those sites generally were similar. Differences in water-quality measurements were caused by site-specific characteristics, specifically pond size, shade, and subsurface exchange differences among the sites. The temperature of water entering the Bronson Creek reach during summer was cooler than the temperature of water entering the Fanno Creek reach because the Bronson Creek study reach is located near its headwaters in the Tualatin Mountains, whereas the Fanno Creek study reach is located in the valley bottom of the basin. In both reaches, beaver dams slowed water velocity and created pools of water that were warmed through greater exposure to solar radiation. However, a comparison of the 7dADM water temperature from the upstream monitors (UB and UF sites) to the warmest downstream monitors (PB at Bronson Creek and DF at Fanno Creek sites) showed that the warming effect was greater at Fanno Creek (maximum warming of 4.3 °C at Fanno Creek compared to 2.7 °C at Bronson Creek; fig. 18). The greater warming in the Fanno Creek reach likely was because of the large surface area of the shallow south pond and the minimal amount of shading on that pond. In contrast, Bronson Creek did not have a large instream pond and the pooled water remained mostly within its deep channels in the study reach.
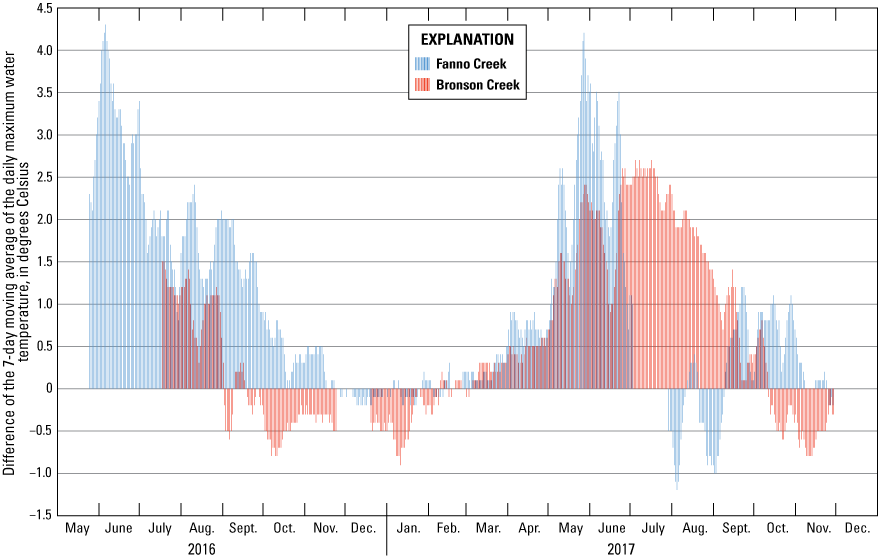
Differences in the 7-day moving average of the daily maximum (7dADM) water temperature measured at the upstream site and the warmest downstream site for the Fanno and Bronson Creek study reaches in the Tualatin River Basin, northwestern Oregon, May 2016–November 2017. Downstream water temperature minus upstream water temperature is shown for Fanno Creek. Ponded water temperature minus upstream water temperature is shown for Bronson Creek. Values greater than zero show that the downstream 7dADM water temperature was warmer than the upstream 7dADM water temperature. Data missing from either the upstream or downstream sites resulted in a gap in the graph for that reach.
Increased primary productivity and respiration were evident in the ponded areas at both sites. Primary production seemed to have a larger effect in Fanno Creek due to the characteristics of the pond. The primary productivity in the Fanno Creek ponded area and its associated release of dissolved oxygen resulted in pronounced diel variations in dissolved-oxygen concentrations, increasing oxygen concentrations to levels that might have made for more tolerable habitat for aquatic organisms at certain times of day. In contrast, some of the productivity in Bronson Creek at the ponded site was from floating aquatic plants, and emergent aquatic plants tend to release the photosynthetically produced oxygen directly to the atmosphere instead of the water column (Caraco and others, 2006). The beaver dams in both intensively monitored stream reaches caused the water velocity to decrease, particularly when water was pushed onto the wide floodplain, causing sediment to drop out of suspension. The deposition of sediment, accumulation of organic matter, and decreased flow resulted in prolonged periods of low dissolved-oxygen concentrations in Fanno and Bronson Creeks in summer.
A notable difference between the two stream reaches was the possible influence of subsurface inputs and exchange on water temperature, dissolved oxygen, and specific conductance in Bronson Creek (figs. 14–16). Beaver ponds increased the water levels in the stream, and likely in the adjacent water table, at both Bronson and Fanno Creeks. The elevated water level flowed onto the floodplain and created surface-water ponds along Fanno Creek. The elevated water table in the Bronson Creek study reach caused by the presence of multiple beaver dams seemed to allow for a greater amount of stream water to flow through and interact with the soil substrate and subsurface water, keeping downstream water temperatures cooler than the PB site, but likely decreasing dissolved-oxygen concentrations in that reach.
Effects of Beaver Activity on Water Temperature in Other Urban Streams
Water-temperature sensors were deployed in five auxiliary urban streams at locations upstream and downstream from beaver dams and ponds to measure water temperatures from a wide range of land use, shading conditions, and beaver-dam characteristics. Sites were chosen along Derry Dell, Springville, Stoller, and Summer Creeks, as well as an unnamed tributary to McKay Creek (fig. 1; tables 1 and 3). Sensors were deployed in free-flowing and well-mixed water that was representative of general stream conditions upstream and downstream from beaver dams and their associated ponds. Beaver dams and ponds can lead to stratification; therefore, measurement locations that were not locally affected by beaver activity were necessary to determine the net changes in representative water temperatures from upstream to downstream. Analysis of water-temperature data from these five auxiliary reaches showed that during warm periods with little to no precipitation (for example, June–September 2017), water temperatures downstream from multiple beaver dams (or a beaver dam complex) were warmer than upstream water temperatures at four of the five sites (fig. 19). The warming effect was greatest at Springville Creek, and the 7dADM water temperature increased from upstream to downstream (a distance of 760 m) by a maximum of 7.7 °C in summer 2017.
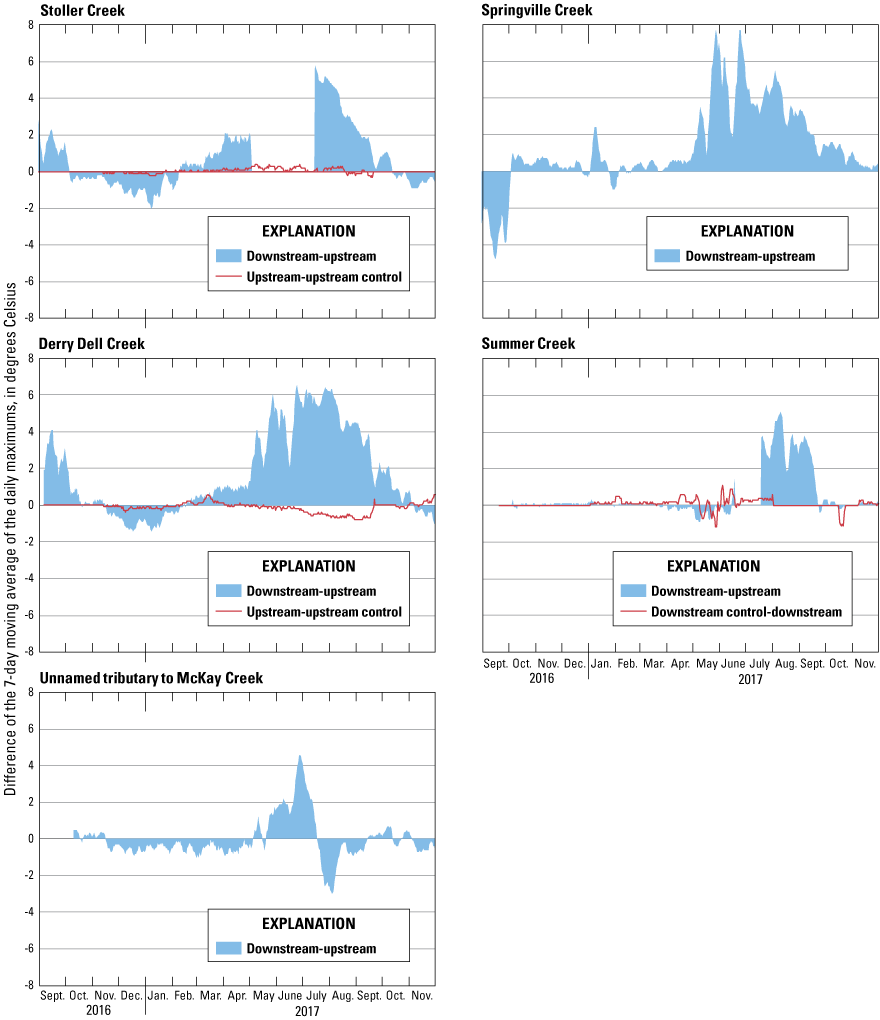
Differences between the 7-day moving average of the daily maximum (7dADM) water temperature measured upstream and downstream from a beaver dam complex at five “auxiliary reaches” in the Tualatin River Basin, northwestern Oregon, September 2016–November 2017. Positive values show when the downstream water temperature was warmer than upstream water temperature, and negative values show when the downstream water temperature was cooler than upstream water temperature. Additional control sensors were placed either farther upstream (in Stoller and Derry Dell Creeks) or farther downstream (in Summer Creek) of the beaver dam complex; differences between the 7dADM water temperatures from the control sensors also are shown compared to the 7dADM water temperatures from the closest upstream or downstream water-temperature sensor (shown as a line in Stoller, Derry Dell, and Summer Creeks).
Unlike the other four sites where downstream water temperatures were warmer in summer, the downstream water temperature was cooler in the unnamed McKay Creek tributary from late July to mid-September 2017 (fig. 19). Diel fluctuations in water temperature at the downstream site also decreased at that time (fig. 20). Possible explanations for this pattern include an increase in water depth or shade, but neither was observed at the downstream location. Several other processes might account for the pattern, including increases in subsurface water inputs or changes in the dam characteristics or depth of flow through the upstream beaver dam. Further study is required to determine the cause of these measurements.
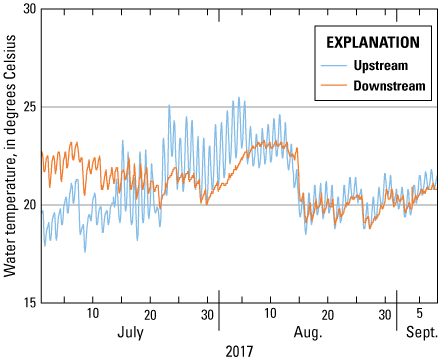
Sub-daily water-temperature data collected upstream (U.S. Geological Survey [USGS] site 453248122580600) and downstream (USGS site 453248122582100) from a beaver dam complex in an unnamed tributary to McKay Creek, northwestern Oregon, July–September 2017.
Additional temperature control sensors were placed farther upstream (in Derry Dell and Stoller Creeks) or farther downstream (in Summer Creek) to assess background longitudinal warming in the absence of a beaver dam complex (fig. 19). Temperature differences between the upstream control and upstream sensors at Derry Dell and Stoller Creek were less than the differences observed between the upstream and downstream sensors at these sites. The temperature differences between the downstream sensor and the downstream control sensor at Summer Creek also were usually less than temperature differences between the upstream and downstream sensors. Based on these comparisons, the warming observed in these creeks likely is a result of the beaver dams and associated ponding and not solely longitudinal warming. The warming trend likely was the result of the cumulative effects of solar radiation captured by multiple beaver ponds that were wider and less shaded than the stream channel upstream or downstream. During cooler, rainy periods, water temperature typically was cooler downstream from the beaver ponds, which may have been a result of cooler stormwater inputs throughout the study reach.
Implications for Monitoring and Management
Beaver activity in urban streams may create complex situations for resource managers attempting to optimize ecosystem services and aquatic and riparian habitats while also adhering to State-mandated water-quality standards. Beaver dams create ponds and, in the process, they alter many of the physical and biological interactions that affect the water quality of streams. Some beaver dams cause channelized water to overflow the stream banks and pond on the floodplain, creating shallow water that is more readily exposed to sunlight. Shallow water typically warms faster during summer, and the solar radiation can promote photosynthesis and respiration. Dams also slow the velocity of water, reducing physical reaeration processes as well as forming depositional areas that trap sediment and organic matter and have an elevated sediment oxygen demand, with a combined effect of decreasing dissolved-oxygen concentrations in the water column. Water temperatures and dissolved-oxygen concentrations in a reach also are affected by the temperature and dissolved-oxygen concentrations of the water entering the reach, as well as shade, weather conditions, water depth, pond size, and subsurface exchange, among other factors. Different combinations of these factors can create a wide range of water temperature and dissolved-oxygen conditions that vary spatially and temporally in beaver-affected reaches.
Given the variability in water-quality conditions in beaver-affected reaches, monitoring water temperature or dissolved oxygen in one location will not necessarily provide an accurate representation of the heterogeneity in water quality and physical habitat in a beaver-affected reach. To quantify conditions in a beaver-affected reach, best practices may involve monitoring multiple locations and depths and documenting the range of measured conditions as well as the average or median conditions. However, monitoring multiple beaver reaches for extended periods of time may not be feasible, and this study showed that site-specific differences can alter the effects of beaver activity on water quality. Therefore, identifying the key site-specific characteristics (such as soil permeability, slope, shade, pond characteristics, etc.) may allow for model development and assessment on a larger scale.
This study focused only on basic measurements and indicators of stream water quality in beaver-affected urban stream reaches. Other measures of water quality also may be important when evaluating potential risks associated with beaver activity. Contaminants associated with urban settings including metals and some pesticides are known to sorb (stick) to soil and sediment particles. Therefore, the sediments that accumulate in urban beaver ponds also may accumulate, and potentially bury, pesticides and metals. Breaches of beaver dams, whether intentional or caused by storms, might mobilize those contaminants along with the sediments. Additionally, anoxic and reducing conditions found in sediments behind beaver dams could increase mercury methylation and release nutrients that may fuel downstream algal blooms (Roy and others, 2009). An understanding of these processes and the associated risks to water quality is important when considering how best to manage and monitor the effects of beaver activity in urban stream networks.
Restoring stream reaches upstream from beaver activity may improve the quality of water that flows into the beaver-affected reaches. For example, increasing shading upstream can decrease water temperatures, whereas enhancing stream roughness (such as with large wood and boulders) may increase dissolved-oxygen concentrations through increased reaeration. Augmenting flows (by creating high-flow conditions) in reaches during summer low flows may increase dissolved-oxygen concentrations; increasing the water depth in a small stream by increasing the flow can decrease the effect of sediment oxygen demand (Rounds and Doyle, 1997).
Beaver-affected reaches also could be actively managed in urban areas for desired water temperatures and dissolved-oxygen concentrations. For example, planting vegetation that can tolerate saturated soils (such as wetland plants) may provide shade in areas ponded by beaver dams as well as provide bird habitat. Installing flow-through devices in dams at certain depths may pass cooler water downstream. Additionally, installing fountains or bubblers in ponded areas could increase reaeration and dissolved-oxygen concentrations in valley-bottom reaches.
Within the Tualatin River Basin, valley-bottom reaches affected by beaver dams may have water temperature and dissolved-oxygen conditions that deviate from the State water-quality standards, in part because of their physical characteristics. However, some conditions may be localized and transitory along the stream network and depend on the local site characteristics, such as water depth, channel width, riparian shade, etc. Incorporating beaver dams and ponds into habitat restoration will require consideration of (1) the potential water-quality effects associated with beaver activity; (2) other physical changes, such as increased deposition of fine sediment (Doyle and others, 2025); (3) the increased diversity of water depths and velocities (and potential aquatic habitats); and (4) the reduction of moderate peak flows (White and others, 2025b).
Summary and Conclusions
During this study, water temperature was measured at sites along seven urban stream reaches in the Tualatin River Basin of northwestern Oregon, and the water downstream from American beaver (Castor canadensis) dams was warmer than water upstream from the dams in six of the seven reaches. The magnitude of the warming effect was dependent on the characteristics of the stream and beaver dam. Water temperatures may cool downstream from a ponded area if the stream returns to a shaded and narrow channel farther downstream, or if other sources of water, such as subsurface water, enter the stream.
Dissolved-oxygen concentrations were affected by beaver activity in Fanno and Bronson Creeks. A combination of low summer flows and low velocities created depositional areas in beaver ponds and resulted in an accumulation of decomposing particulate organic matter that decreased dissolved-oxygen concentrations as water moved through the beaver-affected reaches. Low dissolved-oxygen concentrations may become stressful to aquatic life, especially if the reaches have (1) abundant riparian vegetation shade that limits photosynthetic production of oxygen, (2) wide ponds that trap sediment and have a large surface area to exert sediment oxygen demand, or (3) a proportionately large interaction with soils and subsurface water. Reaches with large unshaded ponds may have periods of high photosynthetic production and therefore periods of high dissolved-oxygen concentrations, which may offset sediment oxygen demand.
The Fanno Creek reach had a large amount of spatial and temporal variation in water quality. Large variations in water temperature and dissolved oxygen were measured over short distances and depths on hot summer afternoons. During these hot conditions, mobile aquatic organisms may find refuge in sections of the ponded area, whether they are seeking cool water or high dissolved-oxygen conditions (but not both). Fish may be able to target certain activities to the times of day or locations that are cooler and potentially less stressful than other times of day or locations. The variety of water temperature, dissolved oxygen, depth, and shade conditions in a large beaver pond may provide habitat for a diverse assemblage of aquatic organisms as well as the food webs that rely on those organisms.
Spatial and temporal monitoring may be necessary to measure and understand the variations in water quality within and downstream from beaver-affected reaches. Future data collection could be designed to support the creation of multi-dimensional models of water temperature in cross sections of beaver reaches to inform resource managers about the spatial and temporal heterogeneity and habitat availability in such systems, or to predict the effects of proposed management strategies. Additional studies could be conducted in urban stream reaches to better understand the diversity of water-quality effects that occur with beaver activity. Pairing future monitoring with the testing of various beaver-management strategies, such as pond levelers, would provide further insights into how the effects of beavers might be managed or mitigated in urban stream systems.
Beavers create heterogeneous aquatic and riparian habitats. Beaver dams cause a range of water velocities in the channel and wetted floodplain, and their ponds provide temporary water storage and decrease peak flows during small storms. Beaver ponds also have variable water depths and riparian shade conditions, resulting in a wide range of water-temperature and dissolved-oxygen conditions. The environments created by beaver dams and ponds support many bird species and provide slow-water habitat for native turtles and amphibians. Although the processes occurring in beaver-affected stream reaches are similar in many aquatic systems, the magnitude of the effect of each process varies according to site and stream conditions, and the resulting magnitudes and patterns of water temperature and dissolved-oxygen concentration in each reach likely will differ, as noted in this study.
References Cited
Alexander, M.D., 1998, Effects of beaver (Castor canadensis) impoundments on stream temperature and fish community species composition and growth in selected tributaries of Miramichi River, New Brunswick: Canadian Technical Report of Fisheries and Aquatic Sciences 2227, 53 p, accessed August 12, 2020, at https://waves-vagues.dfo-mpo.gc.ca/Library/227022.pdf.
Appling, A.P., Hall, R.O., Arroita, M., and Yackulic, C.B., 2018, streamMetabolizer—Models for estimating aquatic photosynthesis and respiration—R package version 0.10.9: GitHub web page, accessed May 14, 2018, at https://github.com/USGS-R/streamMetabolizer.
Arrigoni, A.S., Poole, G.C., Mertes, L.A.K., O’Daniel, S.J., Woessner, W.W., and Thomas, S.A., 2008, Buffered, lagged, or cooled?—Disentangling hyporheic influences on temperature cycles in stream channels: Water Resources Research, v. 44, 13 p., https://doi.org/10.1029/2007WR006480.
Bouwes, N., Weber, N., Jordan, C.E., Saunders, W.C., Tattam, I.A., Volk, C., Wheaton, J.M., and Pollock, M.M., 2016, Ecosystem experiment reveals benefits of natural and simulated beaver dams to a threatened population of steelhead (Oncorhynchus mykiss): Scientific Reports, 12 p., https://www.nature.com/articles/srep28581.
Bureau of Reclamation, 2020, AgriMet historical dayfile data access (Hourly interval data only): Bureau of Reclamation Columbia-Pacific Northwest Region AgriMet web page, accessed February 11, 2020, at https://www.usbr.gov/pn/agrimet/webaghrread.html.
Doyle, M.C., Smith, C.D., Jones, K.L., and Costello, A.E., 2025, Effects of beaver dams and ponds on the transport and deposition of suspended sediment in urban streams of the Tualatin River Basin, northwestern Oregon, chap C of Jones, K.L., and Smith, C.D., eds., Beavers in the Tualatin River Basin, northwestern Oregon: U.S. Geological Survey Scientific Investigations Report 2025–5039–C, 41 p., https://doi.org/10.3133/sir20255039C.
Hoffman, D., and Recht, F., 2013, Beavers and conservation in Oregon coastal watersheds—A background paper: Pacific States Marine Fisheries Commission Habitat Program, Portland, Oregon, 19 p., accessed December 28, 2020, at https://www.beaverinstitute.org/wp-content/uploads/2017/08/BeaversInOregon.pdf.
Keith, M.K., Sobieszczyk, S., Goldman, J.H., and Rounds, S.A., 2014, Investigating organic matter in Fanno Creek, Oregon, Part 2 of 3—Sources, sinks, and transport of organic matter with fine sediment: Journal of Hydrology, v. 519, Part D, p. 3010–3027, accessed August 11, 2020, at https://doi.org/10.1016/j.jhydrol.2014.07.027.
Metro, 2014, Urban growth boundary: Oregon Metro Regional Land Information System geographic information system (GIS) data, accessed June 2018, at https://www.arcgis.com/home/item.html?id=e3a9453a1ce547a7b2ee4baac037540e.
Mulholland, P.J., Fellows, C.S., Tank, J.L., Grimm, N.B., Webster, J.R., Hamilton, S.K., Marti, E., Ashkenas, L., Bowden, W.B., Dodds, W.K., McDowell, W.H., Paul, M.J., and Peterson, B.J., 2001, Inter-biome comparison of factors controlling stream metabolism: Freshwater Biology, v. 46, no. 11, p. 1503–1517.
Oregon Department of Environmental Quality, 2019c, Water quality standards—Beneficial uses, policies, and criteria for Oregon—Basin-specific criteria (Willamette)—Water quality standards and policies for this basin: Oregon Administrative Rules, 340-041-0345(1): Oregon Department of Environmental Quality, accessed December 29, 2020, at https://secure.sos.state.or.us/oard/viewSingleRule.action?ruleVrsnRsn=267395.
Oregon Department of Environmental Quality, 2019b, Water quality standards—Beneficial uses, policies, and criteria for Oregon—Dissolved oxygen: Oregon Administrative Rules, 340-041-0016(3): Oregon Department of Environmental Quality, accessed November 21, 2019, at https://secure.sos.state.or.us/oard/viewSingleRule.action?ruleVrsnRsn=256028.
Oregon Department of Environmental Quality, 2019a, Water quality standards—Beneficial uses, policies, and criteria for Oregon—Temperature: Oregon Administrative Rules, 340-041-0028(4): Oregon Department of Environmental Quality, accessed November 21, 2019, at https://secure.sos.state.or.us/oard/viewSingleRule.action?ruleVrsnRsn=244176.
Oregon Department of Environmental Quality, 2020, Archived integrated reports—2012 integrated report: Oregon Department of Environmental Quality, accessed December 30, 2020, at https://www.oregon.gov/deq/wq/Pages/pastir.aspx.
Pollock, M.M., Lewallen, G., Woodruff, K., Jordan, C.E., and Castro, J.M., 2015, The beaver restoration guidebook—Working with beaver to restore streams, wetlands, and floodplains (version 1.0): U.S. Fish and Wildlife Service, Portland, Oregon. 189 p., accessed December 28, 2020, at https://www.fws.gov/oregonfwo/ToolsForLandowners/RiverScience/Beaver.asp.
Poor, E.K., 2020, Water temperature, dissolved oxygen, and pH point measurements from a beaver pond along Fanno Creek, Oregon, on four hot days in summers 2016–17: U.S. Geological Survey data release, https://doi.org/10.5066/P9I91BVO.
R Core Team, 2020, R—A language and environment for statistical computing: Vienna, Austria, R Foundation for Statistical Computing, accessed April 15, 2020, at https://www.R-project.org/.
Rounds, S.A., and Doyle, M.C., 1997, Sediment oxygen demand in the Tualatin River Basin, Oregon, 1992–1996: U.S. Geological Survey Water-Resources Investigations Report 97–4103, 19 p., https://pubs.er.usgs.gov/publication/wri974103.
Smith, C.D., 2017, Beaver dam locations and beaver activity in the Tualatin Basin, Oregon (ver. 2.0, November 2019): U.S. Geological Survey data release, https://doi.org/10.5066/F7PZ57QP.
Smith, C.D., 2020, Estimates of mean daily gross primary production and ecosystem respiration in beaver-affected reaches along Bronson and Fanno Creeks, OR: U.S. Geological Survey data release, https://doi.org/10.5066/P9QYPFDX.
Smith, K., and Ory, J., 2005, Healthy streams plan: Hillsboro, Oregon, Clean Water Services, 59 p., accessed April 8, 2020, at https://www.cleanwaterservices.org/media/1298/healthy-streams-plan.pdf.
U.S. Census Bureau, 2020, QuickFacts—Washington County, Oregon: U.S. Census Bureau web site, accessed February 6, 2020, at https://www.census.gov/quickfacts/washingtoncountyoregon.
U.S. Geological Survey, 2019a, StreamStats application: U.S. Geological Survey web page, accessed December 4, 2019, at http://streamstats.usgs.gov.
U.S. Geological Survey, 2019b, National Water Information System—Web interface: U.S. Geological Survey web page, accessed July 5, 2019, at https://doi.org/10.5066/F7P55KJN.
Wagner, R.J., Boulger, R.W., Jr., Oblinger, C.J., and Smith, B.A., 2006, Guidelines and standard procedures for continuous water-quality monitors—Station operation, record computation, and data reporting: U.S. Geological Survey Techniques and Methods, book 1, chap. D3, accessed September 10, 2018, https://pubs.water.usgs.gov/tm1d3.
Washington State Department of Ecology, 2018, Models and tools for water quality improvement—River Metabolism Analyzer (RMA): Washington State Department of Ecology web page, accessed on December 4, 2018, at https://ecology.wa.gov/Research-Data/Data-resources/Models-spreadsheets/Modeling-the-environment/Models-tools-for-TMDLs.
White, J.S., Smith, C.D., Jones, K.L., and Rounds, S.A., 2025a, Stream network capacity to support beaver dams in the Tualatin River Basin, northwestern Oregon, chap. A of Jones, K.L., and Smith, C.D., eds., Beavers in the Tualatin River Basin, northwestern Oregon: U.S. Geological Survey Scientific Investigations Report 2025–5039–A, 20 p., https://doi.org/10.3133/sir20255039A.
White, J.S., Jones, K.L., and Rounds, S.A., 2025b, Effects of beaver dams and ponds on hydrologic and hydraulic responses of storm flows in urban streams of the Tualatin River Basin, northwestern Oregon, chap. B of Jones, K.L., and Smith, C.D., eds., Beavers in the Tualatin River Basin, northwestern Oregon: U.S. Geological Survey Scientific Investigations Report 2025–5039–B, 38 p., https://doi.org/10.3133/sir20255039B.
Appendix 1. Photographs Showing Intensive Study Reaches Along Fanno and Bronson Creeks and Beaver Dams Along Other Urban Streams, Tualatin River Basin, Northwestern Oregon
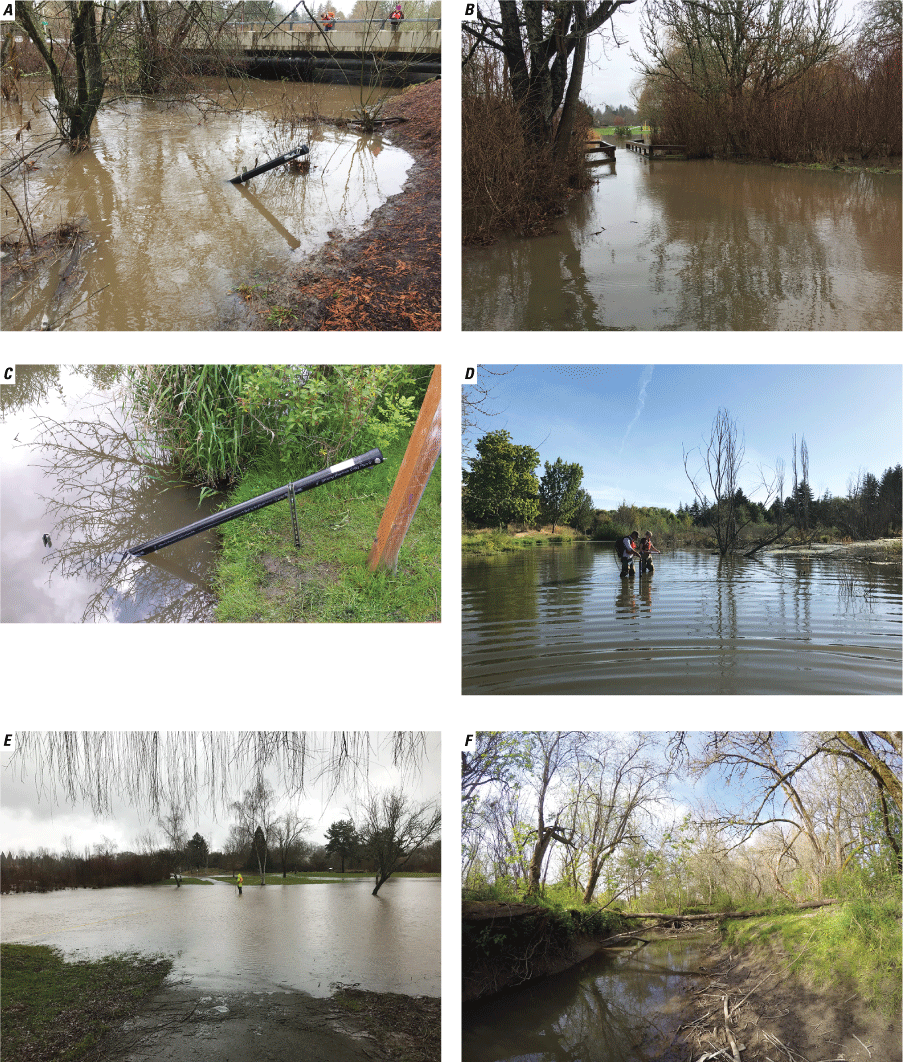
Photographs showing intensive study reach along Fanno Creek at Greenway Park, ordered from the most upstream location to downstream in the study reach, Tualatin River Basin, northwestern Oregon. (A) Continuous water-quality monitor deployment at the upstream location (UF) during high-flow conditions. (B) Paths along Fanno Creek at Greenway Park often flooded during large storms, as water backed up behind the beaver dams. (C) Continuous water-quality monitor deployment at the ponded location (PF). (D) Large, shallow pond located between PF and downstream (DF) monitoring sites. (E) Dams push water onto the floodplain during large storms. (F) Incised channel located downstream from the Fanno Creek study reach.
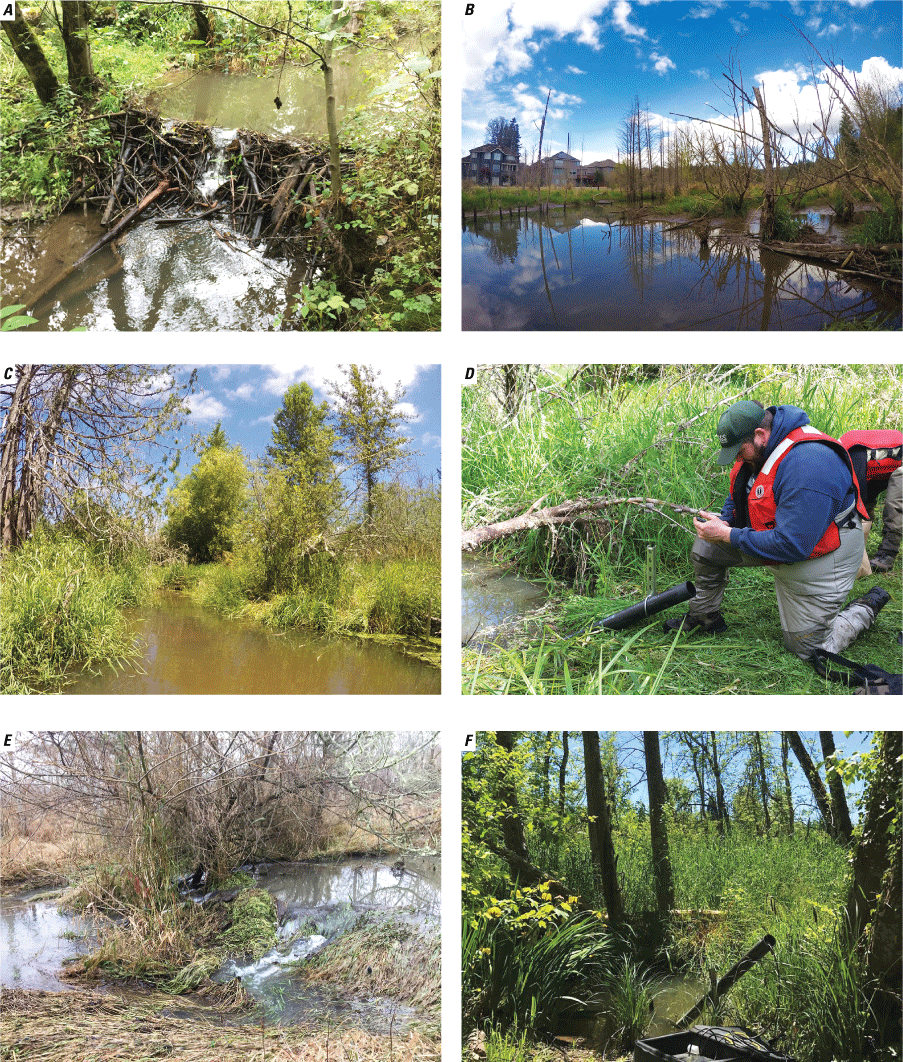
Photographs showing intensive study reach along Bronson Creek, ordered from the most upstream location to the downstream data-collection site, Tualatin River Basin, northwestern Oregon. (A) Beaver dam built in August 2016, approximately 20 meters downstream from the upstream continuous water-quality monitor location (UB). (B) Ponding behind a wide dam. (C) Reed canary grass covered much of the study reach. (D) In summer, water at the ponded (PB) location remained within the channel and was near bank-full. (E) Beaver dam made primarily of mud and reed canary grass. (F) Downstream monitoring location (DB) was channelized with low water velocity in summer.
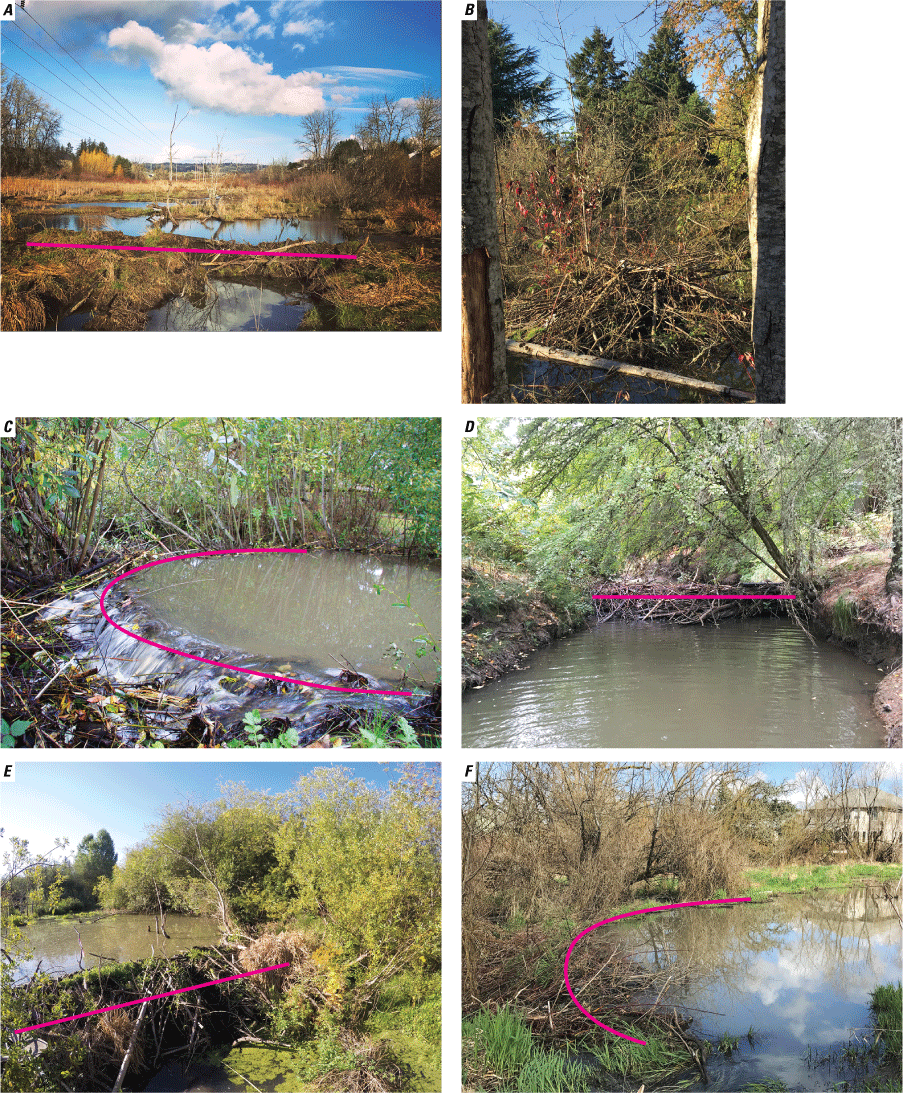
Photographs showing beaver dams and a beaver lodge in the Tualatin River Basin, northwestern Oregon. (A) Twenty-three-meter long dam built with sticks and mud in an unconfined valley-bottom stream. (B) Beaver lodge. (C) Water flowing over and through a 9-meter long stick dam in the Fanno Creek study reach. (D) Nine-meter long stick dam built across an incised stream channel. (E) Twenty-six-meter long channel-spanning beaver dam made primarily with sticks. (F) Thirty-meter long floodplain-spanning dam. Lines indicate the location of a beaver dam.
Appendix 2. Key Water-Temperature Results from Various Comparisons Among Sites Located Along Seven Beaver-Affected Reaches in the Tualatin River Basin, Northwestern Oregon
Table 2.1.
Key water-temperature results from various comparisons among sites, monitored with multiparameter water-quality monitors and water-temperature sensors, located along seven beaver-affected reaches in the Tualatin River Basin, northwestern Oregon, May 2016–November 2017.[Abbreviations: ANOVA, Analysis of Variance; cm, centimeter; DB, Downstream at Bronson Creek; DF, Downstream at Fanno Creek; FDF, Farther downstream at Fanno Creek; PB, Ponded at Bronson Creek; PF, Ponded at Fanno Creek; 7dADM, 7-day moving average of the daily maximum water temperature; UB, Upstream at Bronson Creek; UF, Upstream at Fanno Creek; WQ, water-quality; °C, degrees Celsius]
Appendix 3. Photographs Showing Monitoring Location Before and After a Beaver Dam Was Built
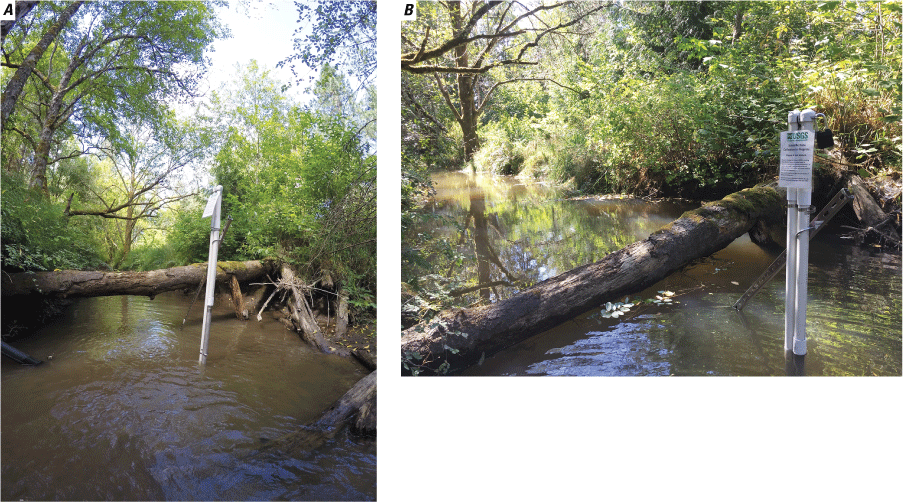
Photographs showing Upstream at Bronson Creek monitoring location (Bronson Creek near Northwest Lakeview Drive; U.S. Geological Survey site 453312122485800), Tualatin River Basin, northwestern Oregon, (A) before (June 29, 2016) and (B) after (August 19, 2016) a beaver dam was built approximately 20 meters downstream on August 11, 2016. Water level compared to the horizontal log and white pipe can be used as references.
Conversion Factors
International System of Units to U.S. customary units
Temperature in degrees Celsius (°C) may be converted to degrees Fahrenheit (°F) as follows:
°F = (1.8 × °C) + 32.
Datum
Vertical coordinate information is referenced to the North American Vertical Datum of 1988 (NAVD 88).
Supplemental Information
Specific conductance is given in microsiemens per centimeter at 25 degrees Celsius (µS/cm at 25 °C).
Concentrations of chemical constituents in water are given in milligrams per liter (mg/L).
All water-quality data collected during this study are available online in the U.S. Geological Survey (USGS) National Water Information System (https://waterdata.usgs.gov/nwis; U.S. Geological Survey, 2019b). Information regarding the two stream metabolism models and the associated data used for analyses are available in Smith (2020).
Abbreviations
7dADM
7-day moving average of the daily maximum water temperature
ABS
acrylonitrile butadiene styrene
DB
Downstream at Bronson Creek
DF
Downstream at Fanno Creek
ER
ecosystem respiration
FDF
Farther downstream at Fanno Creek
NEP
net ecosystem production (rate of change of dissolved oxygen per unit area)
PAR
photosynthetically active radiation
PB
Ponded at Bronson Creek
PF
Ponded at Fanno Creek
P:R
ratio of gross primary production to ecosystem respiration
UB
Upstream at Bronson Creek
UF
Upstream at Fanno Creek
USGS
U.S. Geological Survey
USGS NWIS
USGS National Water Information System
YSI
Yellow Springs Instruments, Inc.
For more information about the research in this report, contact
Director, Oregon Water Science Center
U.S. Geological Survey
601 SW 2nd Avenue, Suite 1950
Portland, Oregon 92704
https://www.usgs.gov/centers/or-water
Manuscript approved on February 24, 2022
Publishing support provided by the U.S. Geological Survey
Science Publishing Network, Tacoma Publishing Service Center
Edited by John Osias and Esther Pischel
Illustration support by Jackie Olson
Layout by Luis Menoyo and cover by JoJo Mangano
Disclaimers
Any use of trade, firm, or product names is for descriptive purposes only and does not imply endorsement by the U.S. Government.
Although this information product, for the most part, is in the public domain, it also may contain copyrighted materials as noted in the text. Permission to reproduce copyrighted items must be secured from the copyright owner.
Suggested Citation
Smith, C.D., Leahy, E.K., Jones, K.L., and Rounds, S.A., 2025, Effects of beaver dams and ponds on water quality in urban streams of the Tualatin River Basin, northwestern Oregon, chap. D of Jones, K.L., and Smith, C.D., eds., Beavers in the Tualatin River Basin, northwestern Oregon: U.S. Geological Survey Scientific Investigations Report 2025–5039–D, 48 p., https://doi.org/10.3133/sir20255039D.
ISSN: 2328-0328 (online)
Study Area
| Publication type | Report |
|---|---|
| Publication Subtype | USGS Numbered Series |
| Title | Effects of beaver dams and ponds on water quality in urban streams of the Tualatin River Basin, northwestern Oregon |
| Series title | Scientific Investigations Report |
| Series number | 2025-5039 |
| Chapter | D |
| DOI | 10.3133/sir20255039D |
| Publication Date | September 30, 2025 |
| Year Published | 2025 |
| Language | English |
| Publisher | U.S. Geological Survey |
| Publisher location | Reston, VA |
| Contributing office(s) | Oregon Water Science Center |
| Description | Report: ix, 48 p.; 3 Data Releases |
| Country | United States |
| State | Oregon |
| Other Geospatial | Tualatin River Basin |
| Online Only (Y/N) | Y |