

Aquifer Storage Change and Storage Properties, Rio Rancho, New Mexico, 2019–23
Links
- Document: Report (6.63 MB pdf) , HTML , XML
- Data Releases:
- USGS Data Release - Repeat microgravity data from Rio Rancho, New Mexico, 2019–2023
- USGS Data Release - Southwest Gravity Program Absolute-Gravity Database (updated 2025–05–14)
- USGS NWIS water data for the Nation - U.S. Geological Survey National Water Information System database
- Download citation as: RIS | Dublin Core
Acknowledgments
The authors would like to thank the Rio Rancho Utilities Department for their generous sharing of knowledge and financial support. Additional thanks to the staff at the New Mexico Bureau of Geology and Mineral Resources for their time and data sharing. The authors would like to thank the U.S. Geological Survey hydrologic technicians and hydrologists who collected hydrologic data and contributed to the development of this study.
Abstract
To better understand changes in groundwater storage and groundwater elevations, the U.S. Geological Survey, in cooperation with the City of Rio Rancho, New Mexico, carried out a multiyear groundwater monitoring project. Groundwater-level data were collected at 27 locations, including sites having multiple wells screened at different depths and those having long-term records. A repeat microgravity network of 20 stations was established, and surveys were carried out three times per year. The microgravity method provides a direct, quantitative measurement of mass change caused by aquifer filling or draining. Data collected during the 2019–23 study period indicate generally stable groundwater conditions, with small fluctuations in groundwater levels (increasing at some wells, declining at others), and small declines in groundwater storage over the period of record at most gravity locations (average = −0.33 foot of water per year). The discrepancy between the water-level and microgravity data may have been caused by a loss of soil moisture in the unsaturated zone, which is as much as 1,000 feet thick in some areas. At the Rio Rancho Advanced Water Treatment Facility, where the city recharges water through direct injection, there may be seasonal correlations in storage related to injection but no longer-term accumulation of recharged water in the immediate vicinity of the facility, indicating water is moving efficiently into the aquifer.
Introduction
The City of Rio Rancho, New Mexico, depends on groundwater pumped from the underlying Santa Fe Group aquifer system to serve a population of approximately 104,000 people (U.S. Census Bureau, 2020). This highly productive aquifer, consisting primarily of interbedded sedimentary deposits associated with the Rio Grande Rift, extends throughout the region and is shared among the City of Albuquerque and other incorporated and unincorporated areas of Sandoval and Bernalillo Counties. Groundwater is a heavily used resource in the arid southwestern United States; in 2015, it represented 69 percent of the total public water supply in the State of New Mexico (Magnuson and others, 2019). Surface water also plays an important role in the region, but the City of Rio Rancho has not used surface water to supplement its municipal water supply.
To better understand the spatial and temporal dynamics in groundwater storage change associated with pumping, the U.S. Geological Survey (USGS), in cooperation with the City of Rio Rancho, established groundwater-level and repeat microgravity (“gravity”) monitoring networks in 2019. Groundwater levels measured in monitoring wells provide high temporal-resolution data (from pressure transducers) at select locations, and quarterly data at other locations. Supplementing the groundwater-level network, the repeat microgravity network provides direct measurements of the change in “free-standing” water in the aquifer. The gravity measurements are independent of the aquifer porosity, which affects the magnitude of groundwater-level changes in wells. Some gravity stations (measurement locations) were collocated at groundwater-level monitoring locations, where data can be used together to estimate the specific yield of the aquifer. Additional gravity stations located throughout the study area were used to study spatial variation in groundwater storage and were not associated with groundwater-level monitoring locations.
Purpose and Scope
The purpose of this report is to describe groundwater-storage changes, trends, and aquifer storage properties in the Rio Rancho area for the period between 2019 and 2023, as determined from groundwater-level measurements and repeat microgravity measurements. Repeat microgravity data are presented for 20 monitoring sites from 11 surveys carried out during the study period. Groundwater-level data are presented for 27 wells. Specific yield is estimated at two locations.
Study Area
The study area is located in the Middle Rio Grande Basin (MRGB) in central New Mexico and includes the City of Rio Rancho (fig. 1). The area is semiarid and has a temperate climate. Average annual precipitation from 2006 through 2022 was 7.9 inches (in.) (National Oceanic and Atmospheric Administration [NOAA], 2022), with an average of 4.5 in. received during the summer monsoon season (June 15–September 30) (NOAA, 2022). Land surface elevation in the study area ranges from approximately 5,000 ft above sea level near the Rio Grande east of the study area to over 6,300 ft above sea level in the far western parts of the study area (U.S. Geological Survey, 2024a). Temperatures in July can range from an average daily low of 64 degrees Fahrenheit (°F) to an average daily high of 96 °F and, in January, from an average daily low of 23 °F to an average daily high of 48 °F (NOAA, 2022). As of December 2022, Rio Rancho and the surrounding area were in a state of moderate drought and have experienced exceptional drought five times since 2000 (U.S. Drought Monitor, 2022).
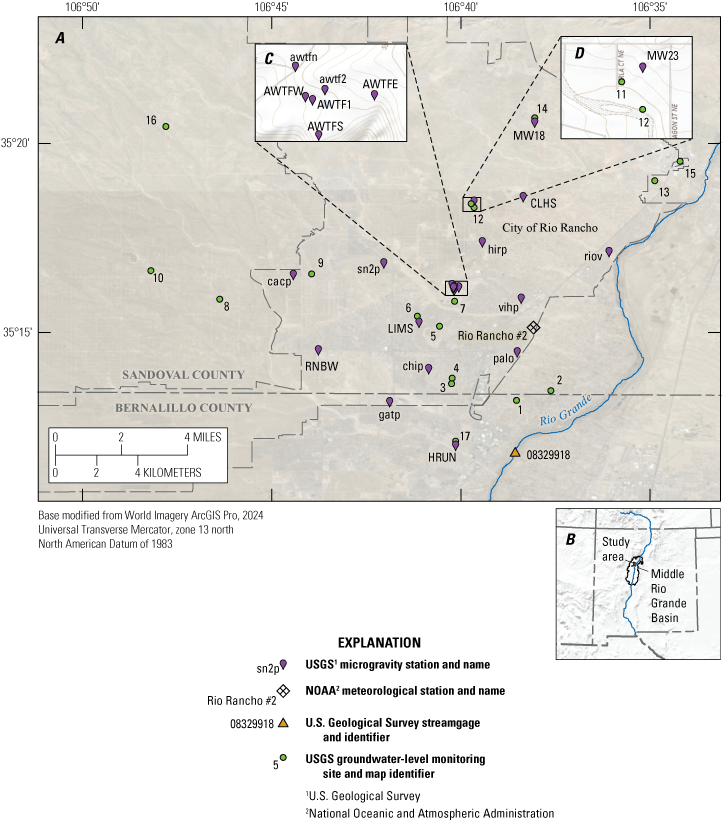
Monitoring locations in the study area. A, Microgravity network, including groundwater-level locations, microgravity stations, and the meteorological station; B, location of the study area in the context of the Middle Rio Grande Basin and State of New Mexico; C, detailed view of the dense microgravity network around the Advanced Water Treatment Facility (AWTF); D, detailed view of wells 11, 12, and gravity station MW23.
Geology and Hydrology
The Middle Rio Grande Basin (MRGB) (fig. 1B) is one of a series of alluvial basins created by extensional faulting in the Rio Grande Rift. The primary river in the MRGB is the Rio Grande, which flows north to south through the MRGB from its headwaters in Colorado and has a drainage area of approximately 14,900 square miles (Bartolino and Cole, 2002). The MRGB is bounded on the west by sedimentary rocks of the Colorado Plateau, and on the north, south, and east by uplifted basement rocks. Sediments in the MRGB were generally deposited in fluvial environments and primarily consist of alluvium and colluvium, which, in some areas west of the Rio Grande, are interbedded with volcanic rocks, specifically basalt flows and ejecta derived from local volcanoes (Bartolino and Cole, 2002).
The major structural feature in the study area is the Ziana horst, a zone of relative uplift oriented roughly north-northwest to south-southeast through Rio Rancho (Personius and others, 2000; Koning, 2022). Originally interpreted from geophysical (gravity) data as a plunging anticline, later reports have reinterpreted the feature as an uplifted fault block positioning lowermost middle Santa Fe Group rocks against middle and upper Santa Fe Group rocks (Personius and others, 2000). Borehole evidence confirms the existence and extent of the Ziana horst (Glorieta Geoscience, unpub. data, 2004). The feature potentially affects groundwater flow and availability in the study area, owing to the thinner aquifer and absence of the productive upper part of the Santa Fe Group where uplift is greatest (Koning, 2022).
The basin fill Santa Fe Group, in hydraulic connection with overlying Quaternary deposits, forms the primary aquifer system in the region and ranges from less than 2,000 ft thick at the margin boundaries of the MRGB to over 13,000 ft thick in the middle (Bartolino and Cole, 2002). In the study area, aquifer thickness west of the Rio Grande is greatest in the southern and western parts of Rio Rancho (Koning, 2022). The Santa Fe Group aquifer system is composed primarily of sand and silt, with smaller amounts of clay and gravel (Bartolino and Cole, 2002). Quaternary post Santa Fe Group deposits in the valley include river alluvium, alluvial fill terraces, eolian sand deposits, and colluvium (Williams and Cole, 2007).
The most recent groundwater-level maps in the MRGB indicate groundwater flow away from the Rio Grande throughout the Rio Rancho and Albuquerque area. In southern Rio Rancho, groundwater-level contours indicate a depression in the groundwater-level surface, although data are sparse and the direction of groundwater flow is uncertain. North of the study area, data indicate more north-to-south groundwater flow (Rawling, 2023), but recent groundwater-level maps (Falk and others, 2011; Galanter and Curry, 2019; Rawling, 2023) do not extend to the northern half of the study area. In addition to the regional Santa Fe Group aquifer system, shallow aquifers exist within the Quaternary fluvial sand and gravel deposits underlying the modern Rio Grande floodplain. These deposits range in thickness from 70 to 120 ft (Hawley and Haase, 1992) and serve as a source of groundwater to shallow wells in the area near the Rio Grande, as well as a conduit for recharge to the Santa Fe Group aquifer system (Logan, 1994). West of the Rio Grande, groundwater flow in the shallow alluvium is toward the southwest, and to the east of the Rio Grande, flow is toward the southeast (Rawling, 2023). This pattern is a result of seepage from the Rio Grande (Veenhuis, 2002; Rankin and others, 2016) and the location of major groundwater pumping centers to the west and east of the river (Bexfield and Anderholm, 2002).
Groundwater recharge in the study area occurs through seepage from the Rio Grande, infiltration from precipitation (primarily as runoff in ephemeral channels), leakage from water delivery systems and septic fields, over-watering of parks and golf courses, and direct injection wells (Bartolino and Cole, 2002). As part of the City of Rio Rancho’s water conservation and management program, construction of a managed aquifer recharge facility named the Advanced Water Treatment Facility (AWTF) began in 2010, with the final phase completed in May 2017 (Rio Rancho Utilities Division, 2017). Mountain-front recharge occurs along the west side of the Sandia Mountains east of the study area and east of the Rio Grande (Plummer and others, 2004). Although this source likely has a role in maintaining hydraulic head in the Rio Rancho study area, by reducing the amount of infiltration from the Rio Grande that would otherwise occur, its influence likely diminishes from east to west, and the river acts primarily as a hydraulic boundary between groundwater to the east and to the west (Bartolino and Cole, 2002). Recharge in the form of groundwater subflow may also occur from the north and west, but high-elevation (and therefore high-precipitation) regions in those directions are more distant, and the magnitude of this recharge, if any, is unknown.
Groundwater withdrawals in the study area occur primarily from wells associated with municipal, industrial, and agricultural uses. Well locations were retrieved from the New Mexico Office of the State Engineer (fig. 2; New Mexico Office of the State Engineer [NMOSE], 2023). Abandoned wells and those known to be monitoring wells only were removed. The City of Rio Rancho is permitted for total pumping as much as 24,020 acre-feet per year (acre-ft/yr), but actual annual pumping during the study period averaged approximately 11,000 acre-feet (acre-ft). The largest industrial groundwater user in Rio Rancho, Intel Corporation, is separately permitted to pump 3,250 acre-ft/yr (actual pumping during the study period was about 2,300 acre-ft/yr) from its own wells (NMOSE, 2023), and much of this water is treated and discharged to the Rio Grande. Other major water producers in the study area, which provide water for small farms, housing developments not serviced by large municipal providers, and light industry, are generally permitted to pump from 3 to 2,450 acre-ft/yr. Residential-use wells are permitted to pump as much as 3 acre-ft/yr. Most of the residential wells in the study area are in the Village of Corrales, located between Rio Rancho and the Rio Grande. A smaller number of residential wells exist in lower-density areas in the east-central and south-central parts of Rio Rancho (fig. 2). Treated wastewater in the City of Rio Rancho is used for irrigation, aquifer injection, and is also discharged to the Rio Grande.

Production wells and population density in the City of Rio Rancho and surrounding area. Permitted capacity refers to total annual allowed groundwater withdrawals by the permit holder. The largest category, 10,000–24,020 acre-feet per year, includes only the City of Rio Rancho and the Albuquerque Bernalillo County Water Utility Authority.
Previous Investigations
The importance of the regional aquifer for economic and population growth in the region drove many prior regional investigations that are summarized briefly here. Hawley and Haase (1992) compiled a conceptual hydrogeologic model of the northern Albuquerque Basin on behalf of the New Mexico Bureau of Mines & Mineral Resources to aid understanding of the regional groundwater system, as did Thorn and others (1993) for the USGS. In 1994, expansion of a large semiconductor manufacturing operation in Rio Rancho and an associated request to expand groundwater withdrawals prompted a geohydrologic study by the New Mexico State Engineer’s Office (Logan, 1994). Numerical modeling using groundwater-level data was completed in 1999 to understand the recharge rate from the Rio Grande to the Santa Fe Group aquifer system (Bartolino and Niswonger, 1999).
In 2002, the USGS issued a comprehensive report on the MRGB hydrologic system after completing a 6-year interagency basin study in the area, which synthesized much of the previous work into a broad overview (Bartolino and Cole, 2002). In 2004, Glorieta Geoscience conducted exploratory well drilling, water-quality testing, and geophysical logging to support Rio Rancho municipal water use (Glorieta Geoscience, unpub. data, 2004).
Connell (2008) proposed a revised three-unit stratigraphy for the Santa Fe Group, the major water-bearing formation of the Albuquerque Basin, based on newly available geologic mapping data. Rankin and others (2016) analyzed groundwater flux from the Rio Grande to the surrounding shallow alluvial aquifer and found that flow moved in a vertical gradient that rapidly shifted to horizontal flow with increasing distance from the river, and the aquifer slope was likely influenced by riverside drains and nearby groundwater wells. A 2019 study summarized groundwater depletion of the Santa Fe Group aquifer system in Albuquerque and Rio Rancho from the mid-20th century to 2016 and found that the largest declines occurred in the eastern and northwestern Albuquerque area of the MRGB (Galanter and Curry, 2019). However, the report also noted a recent rebound caused by reduced groundwater withdrawals since 2008. In a report showing groundwater-level change since predevelopment (before 1961), Rawling (2023) indicated decreases of as much as 69 ft in Rio Rancho. The median groundwater-level decline in Rio Rancho from predevelopment conditions was 36.5 ft (n = 10).
In a study similar to this one, Kennedy and Bell (2023) used groundwater-level and repeat microgravity data from 2016 to 2022 to identify spatiotemporal trends in groundwater storage in the Albuquerque area southeast of the present study area. From 2016 to 2019, widespread storage increases occurred in response to reduced groundwater pumping by the Albuquerque Bernalillo County Water Utility Authority, but storage decreased from 2020 to 2022 in response to increased pumping. A strong correlation between gravity and groundwater levels indicated water was being stored in or removed from unconfined storage at the uppermost level of the regional aquifer. Specific yield calculated using water level and microgravity data ranged from 0.04 to 0.39 (mean = 0.22) and was greatest in the central part of Albuquerque, east of the Rio Grande, where the most pumping has historically occurred.
Methods
The data collected by the USGS for this study were groundwater levels and repeat microgravity values. Additional data sources were the NOAA (2022) for precipitation data, and the NMOSE for groundwater withdrawals (NMOSE, 2023) and AWTF injection data (Dennis Gonzalez, Jacobs, contracted to the City of Rio Rancho Utilities Department, written commun., 2023)
Groundwater-Level Monitoring
For this project, groundwater-level monitoring in the Rio Rancho area began in 2019, although earlier records exist for many locations. At each location, measurements were made relative to a stable measuring point positioned using a survey-grade Global Positioning System (GPS) and the Online Positioning User Service (National Geodetic Survey, 2022). From 2019 to 2023, discrete groundwater levels were collected quarterly using an electric tape at 17 wells, and semiannually at 1 well (table 1). At two locations (LMS and Hunters Ridge), groundwater levels were recorded continuously in nine nested piezometers (multiple wells in a single borehole, open to the aquifer at different depths) using vented pressure transducers and data loggers recording at 15-minute or 1-hour intervals. Groundwater levels were collected, reviewed, and approved following standard USGS technical procedures (Cunningham and Schalk, 2011, and updates) and are available from the National Water Information System database (USGS, 2023).
Table 1.
Location of groundwater-level monitoring sites in the Rio Rancho area, New Mexico.[Data are from U.S. Geological Survey (USGS, 2023). NAD 83, North American Datum of 1983; ft, foot; NAVD 88, North American Vertical Datum of 1988; bls, below land surface; Q, data collected quarterly; S, data collected semi-annually; C, data collected continuously (15-minute or 1-hour interval); no., number; –, no data]
| Map identifier (fig. 1) | Local name | USGS station name | USGS site number | Latitude, north (decimal degrees NAD 83) | Longitude, west (decimal degrees NAD 83) | Land surface elevation (ft above NAVD 88) |
Screened interval (ft bls) |
Monitoring frequency |
|---|---|---|---|---|---|---|---|---|
| 1 | IMW B1 | 12N.03E.32.44344A | 351305106383101 | 35.21797 | 106.64217 | 5,003.66 | 30–50 | Q |
| 1 | IMW B2 | 12N.03E.32.44344B | 351305106383102 | 35.21797 | 106.64217 | 5,003.66 | 190–230 | Q |
| 1 | IMW B3 | 12N.03E.32.44344C | 351305106383103 | 35.21797 | 106.64217 | 5,003.66 | 710–790 | Q |
| 2 | IMW C5 | 12N.03E.33.414e | 351319106373505 | 35.22222 | 106.62706 | 5,003.13 | 710–790 | Q |
| 2 | IMW C6 | 12N.03E.33.414f | 351319106373506 | 35.22222 | 106.62706 | 5,003.13 | 1,360–1,490 | Q |
| 3 | Well 1 | 12N.03E.31.243 | 351332106401301 | 35.22533 | 106.67083 | 5,254.13 | 297–339 | Q |
| 4 | Well 2 | 12N.03E.31.132 | 351340106401401 | 35.22777 | 106.67053 | 5,268.17 | 570–813 | Q |
| 5 | Well 4 | 12N.02E.24.442 | 351459106403401 | 35.24915 | 106.67611 | 5,418.43 | 685–977 | Q |
| 6 | LMS | 12N.02E.24.144 | 351515106410401 | 35.25423 | 106.68514 | 5,437.15 | 1,200–1,240 | C |
| 6 | LMS A | 12N.02E.24.144A | 351515106410402 | 35.25423 | 106.68514 | 5,437.15 | 810–830 | C |
| 6 | 1LMS B | 12N.02E.24.144B | 351515106410403 | 35.25423 | 106.68514 | 5,437.15 | 490–590 | C |
| 7 | Monitoring well at well 21 | 12N.03E.18.343B | 351542106401001 | 35.26162 | 106.66946 | 5,311 | – | Q |
| 8 | Well 14 | 12N.02E.18.344 | 351545106462001 | 35.26254 | 106.77278 | 5,768.77 | 1,035–1,710 | Q |
| 9 | Well 8 | 12N.02E.16.214 | 351627106435301 | 35.27367 | 106.73250 | 5,823.27 | 982–1,599 | Q |
| 10 | Well 13 | 12N.01E.14.212 | 351630106481201 | 35.27509 | 106.80333 | 6,055.39 | 1,342–1,721 | Q |
| 11 | Exploratory well at #23 | 12N.03E.08.224A | 351813106394001 | 35.30482 | 106.66188 | 5,437 | 1,140–2,780 | Q |
| 12 | 1Well 23 | 12N.03E.08.224B | 351817106394201 | 35.30465 | 106.66163 | 5,454 | 778–1,699; 1,879–1,999 | Q |
| 13 | San Miguel | 13N.03E.36.132A | 351852106344901 | 35.31473 | 106.58128 | 5,155 | – | S |
| 14 | 1Well 18 | 13N.03E.21.3124 | 351909106383001 | 35.34244 | 106.63417 | 5,532.8 | 562–2,050 | Q |
| 15 | Well 11 | 13N.03E.25.42 | 351924106341001 | 35.32333 | 106.57011 | 5,131.1 | 257–315 | Q |
| 16 | Phoenix | 13N.01E.24.313 | 352019106474801 | 35.33861 | 106.79660 | 6,153.18 | 1,600–1,620 | Q |
| 17 | 11N.03E.07.141 Hunters Ridge No. 1 | 11N.03E.07.141 | 351201106400501 | 35.20005 | 106.66901 | 5,112.74 | 1,508–1,513 | C |
| 17 | 11N.03E.07.141A Hunters Ridge No. 1 | 11N.03E.07.141A | 351201106400502 | 35.20005 | 106.66901 | 5,112.74 | 845–850 | C |
| 17 | 11N.03E.07.141B 1Hunters Ridge No. 1 | 11N.03E.07.141B | 351201106400503 | 35.20005 | 106.66901 | 5,112.74 | 148–228 | C |
| 17 | 11N.03E.07.141C Hunters Ridge No. 2 | 11N.03E.07.141C | 351201106400504 | 35.20005 | 106.66901 | 5,113.35 | 349–354 | C |
| 17 | 11N.03E.07.141D Hunters Ridge No. 2 | 11N.03E.07.141D | 351201106400505 | 35.20005 | 106.66901 | 5,113.35 | 295–300 | C |
| 17 | 11N.03E.07.141E Hunters Ridge No. 2 | 11N.03E.07.141E | 351201106400506 | 35.20005 | 106.66901 | 5,113.35 | 238–258 | C |
Aquifer-Storage Monitoring
Changes in aquifer storage were monitored using the repeat microgravity method (Crossley and others, 2013; van Camp and others, 2017; Kennedy and others, 2021a). According to Newton’s Law of Universal Gravitation, the acceleration due to gravity at any point depends on the surrounding mass. In an aquifer, mass may change because of changes in groundwater storage caused either by recharge of the aquifer or by discharge, such as by groundwater pumping. When the mass of an aquifer changes, the gravitational acceleration measured at the land surface also changes; these small changes can be detected with gravity meters. Gravity measurements at a given location are also affected by Earth tides, barometric pressure changes, elevation changes, mass changes from volcanism, and other processes. These processes can be accounted for independently and removed from the signal either prior to or during data processing, or are considered negligible in the context of groundwater studies. Other factors that can affect gravity, often considered in studies interpreting the gravity field itself (instead of changes in the gravity field, as in this study), include latitude, topography surrounding the gravity station, and underlying geology. These factors are typically considered to be unchanging for repeat microgravity studies.
The gravitational effect of groundwater storage changes at the water table may be approximated using the Bouguer slab (that is, the horizontal infinite slab) approximation if the water table is approximately horizontal underneath the gravity station to a distance about 10 times the depth to water (Pool and Eychaner, 1995). Departures from the Bouguer slab approximation are usually small, even in the presence of significant groundwater mounding (Kennedy and others, 2021b). The Bouguer approximation allows for a direct conversion from the change in gravitational acceleration to a one-dimensional thickness of free-standing water:
whereΔt
is the thickness of free-standing water added to (or removed from) the aquifer, in feet; and
Δg
is the measured change in gravity, in microGals (1 µGal = 1 × 10⁻⁸ meter per second squared).
The significance of equation 1, and the value of the repeat microgravity method for groundwater hydrology, is that storage change can be estimated directly from the measured change in gravity independent of the depth to groundwater or the aquifer’s porosity (Pool, 2008).
Applications of the repeat microgravity method for groundwater investigations include mapping aquifer storage change (Pool and Anderson, 2008; Kennedy and Bell, 2023), estimating specific yield (Pool and Eychaner, 1995, Robertson and others, 2022), and monitoring recharge at artificial recharge facilities (Kennedy and others, 2014, 2016). For the present study, repeat microgravity was used to investigate changes in aquifer storage in the study area and to estimate site-specific specific yield where microgravity stations were collocated with groundwater-level monitoring locations.
Absolute and Relative Gravity Surveys
Microgravity data were collected from 2019 to 2023 at 20 stations (table 2) using absolute- and relative-gravity meters following procedures described in Kennedy and others (2021a). The gravity network comprised stations established at existing vertically stable locations (typically concrete sidewalks), and newly constructed stations consisting of 3-ft-tall, 18-in.-diameter round concrete forms. Four stations were collocated with groundwater-level measurement locations (monitoring wells), and five repeat microgravity monitoring stations were established near the AWTF to evaluate whether groundwater storage was increasing in the vicinity of the facility (table 2). Final gravity values at each station were determined by combining all data in a least-squares network adjustment.
Table 2.
Microgravity stations used in aquifer-storage change analysis, Rio Rancho area, New Mexico (Bell and Kennedy, 2025).[ID, identifier; USGS, U.S. Geological Survey; NAD 83, North American Datum of 1983; NAVD 88, North American Vertical Datum of 1988; NA, repeat microgravity station without collocated monitoring well]
At sites collocated with wells, this is the position of the gravity station and differs from the groundwater-level monitoring location.
The corresponding groundwater-level location at HRUN and LIMS is the shallow-most nested piezometer at the LMS and Hunters Ridge sites (table 1).
Absolute-gravity measurements were collected with a Micro-g LaCoste, Inc., A-10 free-fall absolute-gravity meter (serial number 008; Lafayette, Colorado) at a subset of the microgravity stations. Absolute gravity values provide a reference value, or datum, from which relative-gravity measurements are made. The A-10 meter measures the position of a mass as it falls through a vacuum, using a rubidium oscillator and laser interferometer as time and distance references, respectively. The interferometer is isolated from long-period seismic noise by an actively damped spring. The nominal accuracy of the A-10 is ±10 µGal, although an accuracy of ±5 to ±8 µGal in practice has been estimated (Schmerge and Francis, 2006).
Earth-tide corrections for absolute-gravity measurements were determined using the ETGTAB model available in the Micro-g Lacoste A-10 software (Micro-g LaCoste, 2024). Ocean-loading corrections were determined using the Schwiderski (1980) model. Polar-motion corrections were determined by the Micro-g Lacoste A-10 software using coordinates provided by the International Earth Rotation and Reference Systems Service (https://www.iers.org). A correction for barometric pressure was determined using the barometric pressure measured at the site during each gravity measurement and an admittance factor of 0.3 µGal per millibar. Absolute gravity measurements are documented in a data release that is revised periodically (USGS, 2021).
Relative-gravity measurements were collected using ZLS Corporation Burris gravity meters (Austin, Texas). This meter employs a zero-length spring, the length of which changes in response to gravitational changes. As the meter is moved from location to location, the spring shortens or lengthens, and a relative-gravity measurement is collected. A meter calibration factor is applied to each relative-gravity measurement by the meter’s internal software, along with additional corrections for Earth tides, temperature, and tilt (Kennedy and others, 2021a).
Relative gravity meters undergo “drift” in the zero-point, which requires making repeat measurements at some stations during a survey. The magnitude and consistency of the drift can be evaluated by comparing these repeated measurements, which are separated by tens of minutes to hours. The effect of drift on the measurements can be removed (corrected) by interpolating an intermediate value between repeated occupations, a technique known as the Roman (1946) method. Drift correction was carried out using GSadjust (Kennedy, 2020) and is documented in the accompanying data release (Bell and Kennedy, 2025).
Gravity values were not corrected for elevation or soil-moisture changes. Gravity stations occupied with the A-10 absolute gravity meter were located using a differential GPS receiver with station occupations of at least 30 minutes. Positions were determined using the Online Positioning User Service (National Geodetic Survey, 2022). The positions of gravity stations occupied only by relative gravity meters were estimated using hand-held GPS receivers. Soil moisture corrections (that is, the gravitational attraction of near-surface soil water not associated with aquifer recharge) used in some other studies (for example, Kennedy and others, 2019) were not applied, because extensive urban development in the study area has created significant impervious areas around the microgravity sites that limit the application of remote-sensing-derived soil moisture data.
The absolute- and relative-gravity measurements were combined using GSadjust software (Kennedy, 2020), which provides a graphical interface for organizing and processing datasets and carrying out least-squares network adjustment. Least-squares adjustment is a standard method for combining survey data of all types by minimizing the squared values of the observation residuals (Strang and Borre, 1997).
Results
Precipitation
Precipitation in the study area can lead to groundwater recharge, primarily in arroyos where concentrated flow can rapidly infiltrate sandy soils (Moore, 2007). The amount of direct land-surface recharge away from channels is unknown, but owing to the high evapotranspiration demand in the semiarid environment in the study area, it is likely minimal. Recharge along arroyos is greatest following relatively large flows and during periods of sustained precipitation lasting days to weeks. Conversely, small, infrequent precipitation is generally lost to evapotranspiration and does not lead to recharge (Moore, 2007).
Annual precipitation in the study area from 2019 to 2022 ranged from 4.8 in. for 2021 to 9.6 in. for 2022. The mean annual precipitation in the study area between 2006 and 2022 was 7.9 in. (NOAA, 2022). Precipitation during the study period followed the typical bimodal temporal pattern prevalent in the southwestern United States (fig. 3), with generally greater precipitation during the summer (July–September) than during other seasons. Summer rainfall is usually generated by convective thunderstorms, which can occur over small areas; the data from a single station shown in figure 3 may not represent average rainfall over the entire study area.
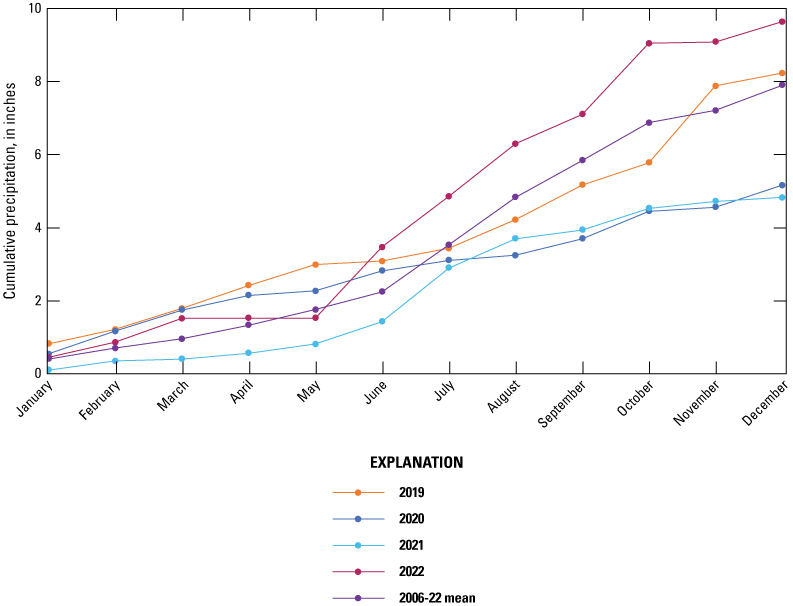
Cumulative monthly precipitation, by year, recorded at the Rio Rancho #2 meteorological station, 2019–22 (National Oceanic and Atmospheric Administration [NOAA], 2022).
Summer precipitation was generally below the 2006–22 average during 2019–21 but was average to well above average in 2022. Winter precipitation is generally low, and except for November 2019, observed rainfall was near the 2006–22 average for the study period. The year 2021 stands out as a particularly dry period; lack of rainfall during this period may contribute to the aquifer-storage declines observed in the summer of 2022.
Groundwater Additions and Withdrawals
Advanced Water Treatment Facility
Between February 2019 and June 2020, injection of treated water at the AWTF was regular and frequent, with noninjection periods of less than 3 weeks between injection events. Between July 2020 and September 2022, injection was less frequent, with noninjection periods as long as 4.5 months. A maximum daily volume of 1.94 acre-ft was injected into the aquifer on November 16, 2020. The record included 1,338 days, 640 of which had no injection. For the 698 days with an injection, the daily mean injected volume was 1.14 acre-ft. A total of 712 acre-ft of treated water was injected into the aquifer at the AWTF during the study period (Dennis Gonzalez, Jacobs, contractor for the City of Rio Rancho Utilities Department, written commun., 2023).
Groundwater Withdrawals
The City of Rio Rancho, like many municipalities in New Mexico, exclusively uses groundwater for water supply (Daniel B. Stephens & Associates, Inc., 2014). Information on Rio Rancho pumping wells in the study area was obtained from NMOSE (2023). Pumping from the City’s municipal wells between 2019 and early 2023 was spread across 12 active locations (NMOSE, 2023). Pumping generally followed a seasonal pattern, with less pumping during the winter and more pumping during the summer, primarily reflecting the demand for irrigation water (fig. 4). Pumping from nonmunicipal production wells has not been estimated here, although the broad spatial distribution of all permitted production wells (fig. 2) suggests this pumping may stress groundwater resources, particularly during years of below average precipitation.
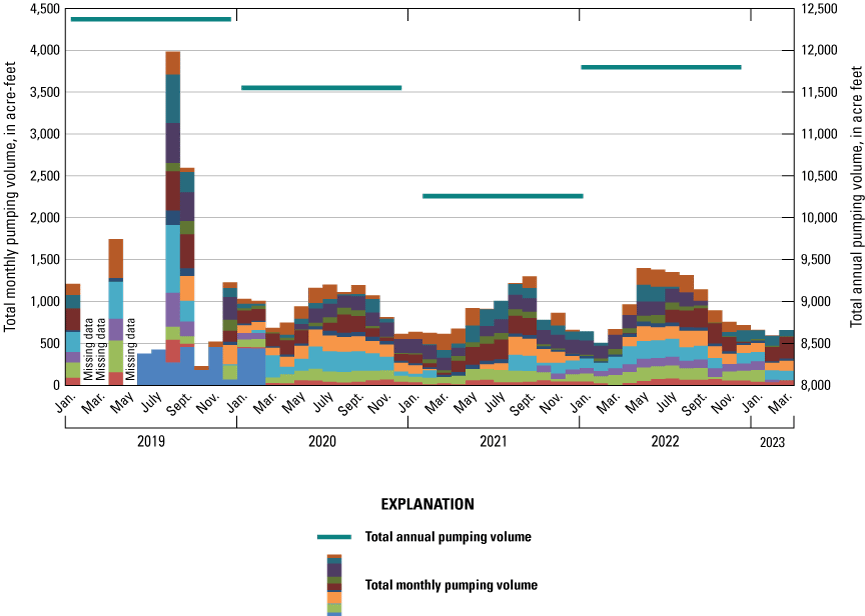
Total monthly and annual pumping volume at municipal wells in Rio Rancho, New Mexico, January 2019–March 2023, as reported to the New Mexico Office of the State Engineer (NMOSE, 2023). Each color represents pumping associated with a different production well.
Groundwater Levels
Groundwater levels were generally stable during the 2019–23 study period, although seasonal and longer-term fluctuations were observed (figs. 5 and 6). At the two sites where continuous (hourly) groundwater-level data are available (the LIMS and HRUN well nests), groundwater levels were consistently lower in summer (fig. 5), when groundwater pumping is greatest (fig. 4), than in other seasons when there is generally less groundwater pumping. At both sites, groundwater elevation was highest in the uppermost nested piezometer and lower in the piezometers open at a deeper level in the aquifer, indicating a downward gradient, potential downward flow, and focused recharge from the land surface. At each site, changes in groundwater elevation associated with pumping are visible—both the long-term, seasonal changes and higher-frequency, daily fluctuations—primarily in data from the lower two piezometers, which are open at deeper depths in the aquifer (more than 835 ft below land surface). The absence of these fluctuations in the uppermost screened interval at both sites (fig. 5) suggests that confining units in the Santa Fe Group basin-fill aquifer system between the aquifer being pumped and the uppermost unconfined aquifer may be more laterally or vertically extensive (that is, there is greater separation between units) than has been observed in the same aquifer in the basin-fill sediments underlying the City of Albuquerque about 10 miles to the southeast (Kennedy and Bell, 2023).
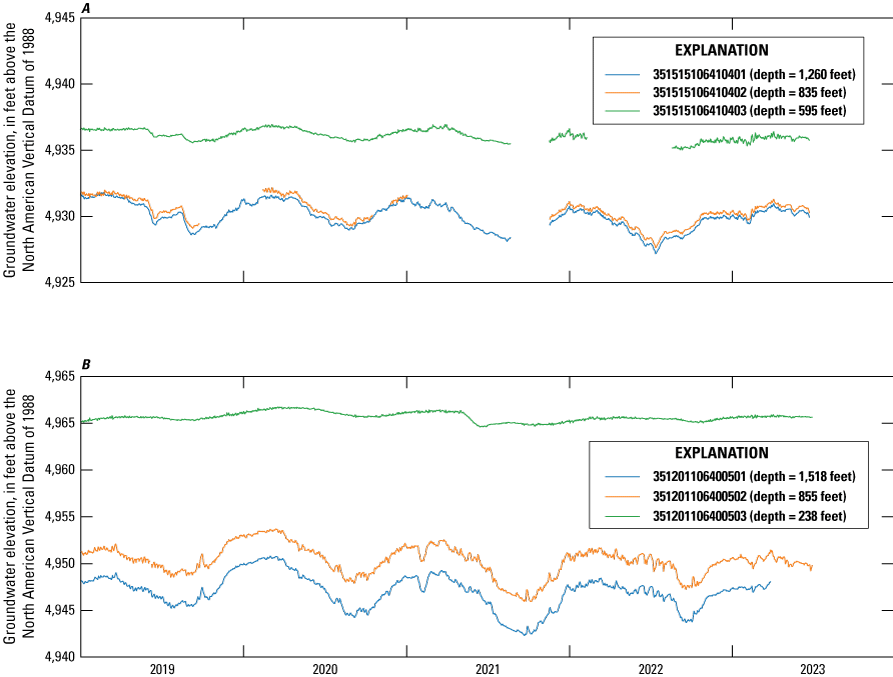
Daily mean groundwater elevation at the A, LIMS piezometer well nest, and B, HRUN piezometer well nest in the Rio Rancho, New Mexico area, 2019–23.
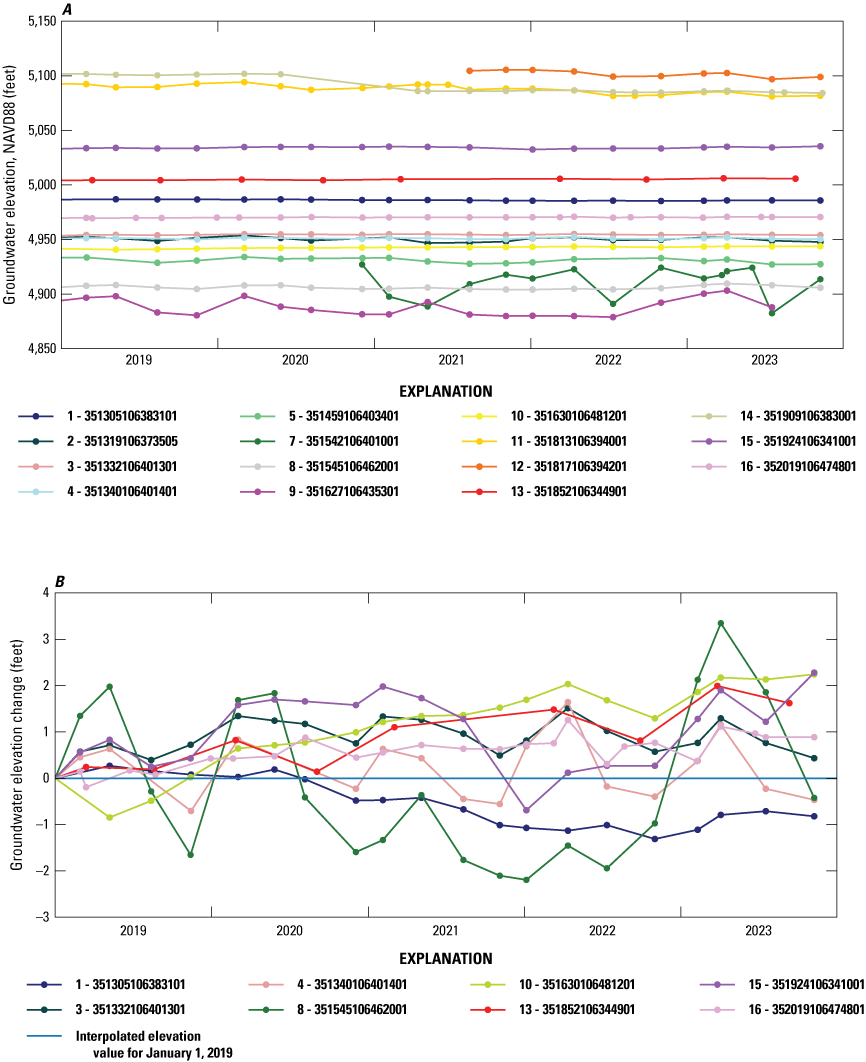
Discrete groundwater elevation in the Rio Rancho, New Mexico area, 2019–23. A, Groundwater elevation; B, groundwater elevation relative to an interpolated elevation value on January 1, 2019. Sites included in graph A having a groundwater-elevation change greater than 6 feet are excluded from graph B to show detail in the latter. Map key numbers in explanation refer to those in figure 1 and table 1.
Discrete quarterly groundwater-level measurements show generally small changes and no clear trends over the study period (fig. 6). The data are insufficient for showing seasonal or subannual trends. Only two stations, 351542106401001 (monitoring well at well 21) and 351627106435301 (well 8), had large changes (greater than 10 ft) in groundwater elevation (fig. 6). Monitoring well at well 21 is near an active production well that is likely to influence nearby water levels. The decrease in groundwater elevation at station 351909106383001 (well 18) in the winter of 2020–21 is likely related to an issue with the well screen or well construction and does not accurately reflect a change in groundwater elevation. During the study period, groundwater elevations have increased at the westernmost stations in the study area, 351630106481201 (well 13) and 352019106474801 (Phoenix), continuing longer-term trends prior to the present study period. Additional groundwater-level data at these sites are available in the National Water Information System (USGS, 2023).
Groundwater Storage Change and Storage Properties
Gravity surveys were carried out at 20 microgravity stations seasonally from April 2019 through January 2023, usually three times per year (in April, August, and December) to capture differences related to seasonal groundwater pumping; no data were collected in April 2020. Gravity change, and therefore storage change, can be calculated between any two surveys. The average measurement uncertainty (standard deviation) of the network-adjusted gravity values is 3.0 µGal, and the average uncertainty of gravity change between surveys is 5.2 µGal, equivalent to 0.41 ft of free-standing water (eq. 1; Bell and Kennedy, 2025). The microgravity stations are split into two groups for discussion: the stations in the vicinity of the AWTF (AWTF1, awtf2, AWTFW, AWTFE, AWTFS, awtfn), which are grouped together as their general purpose is to monitor groundwater storage near an injection well, and the remaining stations, which are grouped together to monitor groundwater storage over the entirety of the study area. Capitalized identifiers denote absolute-gravity stations (relative-gravity measurements were also made at most of these stations). Uncapitalized identifiers denote stations where only relative-gravity measurements were made. Gravity change at each station, measured in units of microGals, has been converted to units of “thickness of free-standing water,” in feet, using the Bouguer slab approximation (eq. 1).
Advanced Water Treatment Facility
Six stations were located at the AWTF to monitor storage change near a well injecting treated water into the subsurface (fig. 1C). One station was discontinued after the initial survey (AWTF1) owing to its proximity to a nearby station (AWTFW). Gravity measurements at the AWTF stations followed a general seasonal pattern, with increases in gravity, and therefore groundwater storage, during the winter and spring surveys, followed by decreases in gravity and groundwater storage during the summer surveys (fig. 7). At the end of the study in January 2023, following the recovery from summer 2022, storage at all stations near the AWTF was slightly greater than at the beginning of the study in August 2019.

Monthly volume of injected water at the Advanced Water Treatment Facility and groundwater storage change measured at the microgravity network, 2019–23.
Comparison of the change in aquifer storage at the AWTF with the volume of water injected into the subsurface at the injection well (fig. 7) may indicate a delayed positive response in groundwater storage to injection, but that injected water dissipates quickly, as indicated by the absence of persistent storage increases at these stations. Ultimately, however, the total volume of water injected during the 4-year study period, 712 acre-ft, is much less than the volume pumped (from 500 to 1,000+ acre-ft per month; fig. 4).
Regional Groundwater Storage Change
Over the study period, groundwater storage decreased slightly across the network; average gravity change from August 2019 to January 2023, exclusive of the AWTF stations, was −0.66 ft of free-standing water (fig. 8). Overall, gravity changes between surveys were small, mostly less than ±1 ft of water, but larger declines were measured in the summer of 2022. From April to August 2022, widespread groundwater-storage declines were observed across the network, with the greatest changes occurring in the southeastern part of the study area, at stations nearest to the Rio Grande (stations riov, vihp, and palo). From August 2022 to January 2023, storage rebounded, with increases recorded across the network. Several factors may have contributed to this decrease and rebound. First, groundwater pumping by Rio Rancho was higher in the summer of 2022 than in other periods during the study (fig. 4). Second, at the nearest streamgaging station on the Rio Grande, Rio Grande at Alameda Bridge at Alameda, New Mexico (USGS site number 08329918; USGS, 2023), streamflow was at its lowest during the study period in the summer of 2022, then increased throughout the fall of 2022 (fig. 9). Systematic measurement error in the absolute-gravity measurements, which provide the datum, or reference level, for the relative-gravity measurements, may also be a possibility. However, systematic error would have to affect all the absolute-gravity stations equally for this to be an important factor; that is, the measurements would need to have all been biased toward low values, rather than simply exhibiting increased random error for this survey. Errors at individual stations are usually apparent on the basis of their relation to the relative-gravity measurements during the least-squares network adjustment (that is, they present as statistical outliers). The absolute gravity meter was serviced by the manufacturer in June 2022, including calibration of the laser and clock frequencies that are the basis for the gravity acceleration measurement. Similar low gravity values were not observed on other projects carried out around the same time. Finally, the magnitude of the gravity change, greater than 20 µGal in most cases, is much larger than the expected measurement error, 5–8 µGal (Schmerge and Francis, 2006), and larger than the estimated average station standard deviation for this survey from least-squares statistics, 2.8 µGal (Bell and Kennedy, 2025).
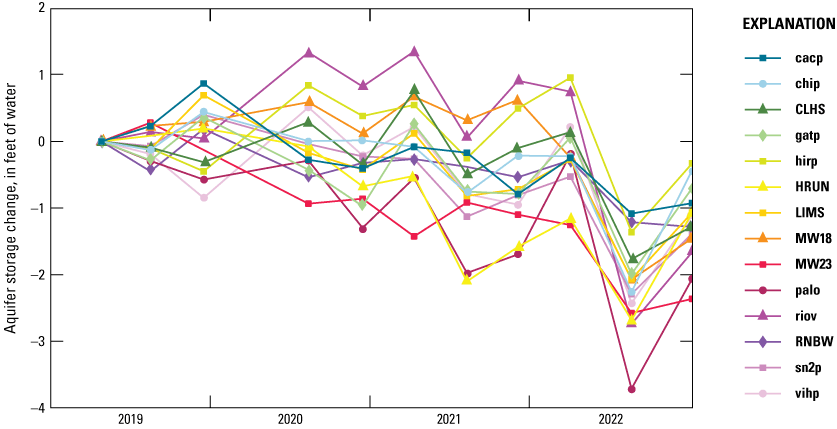
Aquifer storage change from repeat microgravity data in the Rio Rancho, New Mexico area, 2019–23.

Mean daily streamflow at U.S. Geological Survey (USGS) streamgage Rio Grande at Alameda Bridge at Alameda, New Mexico (USGS site number 08329918), 2019–22 (USGS, 2023).
Map view plots show the seasonality of groundwater-storage change. During the April–August period when groundwater pumping is greatest, storage declines occur at almost all stations (fig. 10). Minimal storage declines were observed in the summer of 2019, mostly less than the estimated uncertainty of 0.5 ft of free-standing water. This period had higher flows in the Rio Grande (fig. 9) than subsequent summer periods. The August–December and December–April intervals (fig. 10, left and right columns), were largely periods of increasing storage. Overall, storage changes are relatively small, with the largest changes occurring in the eastern part of the study area near the Rio Grande. Larger storage changes, and higher volumes of groundwater pumping, occur in Albuquerque directly southeast of the study area (Kennedy and Bell, 2023).
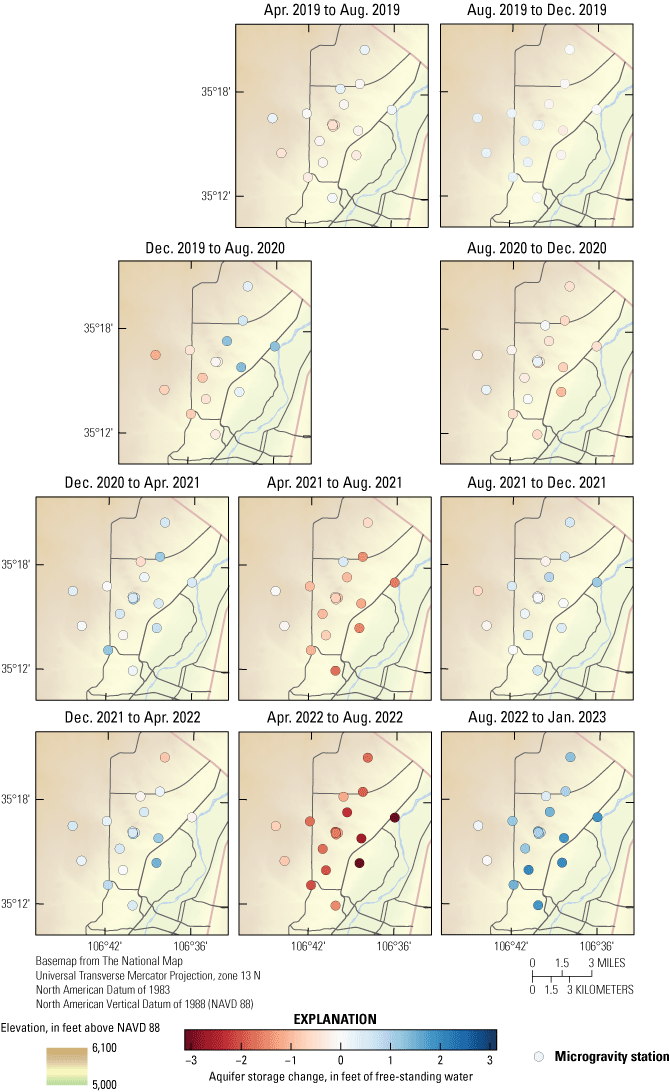
Groundwater storage change in the Rio Rancho, New Mexico area between each repeat microgravity survey. Each column represents a time interval (December–April, April–August, August–December). No data were collected in April 2020, so the December 2019–August 2020 graphic straddles the left and middle columns.
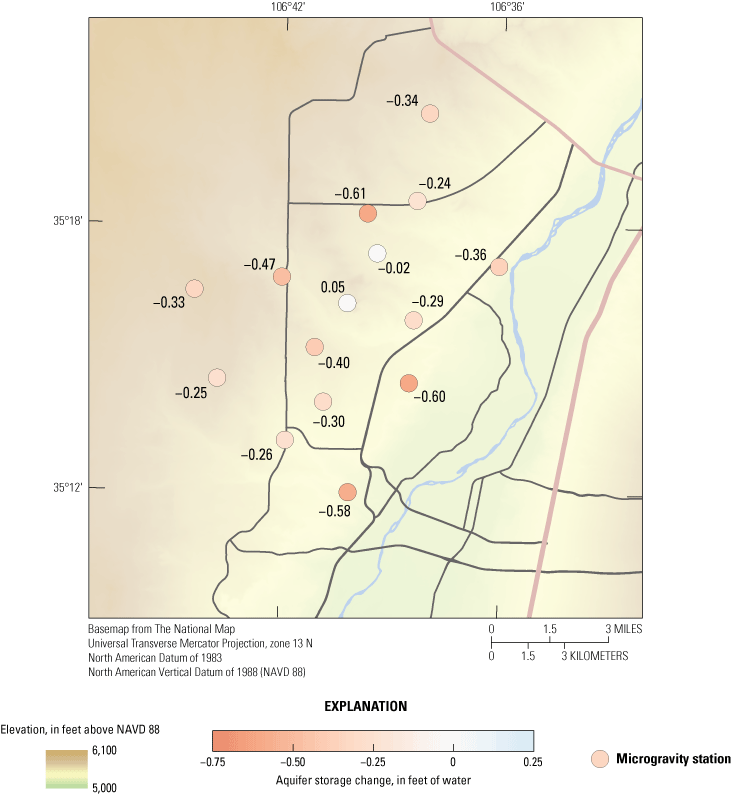
Cumulative groundwater-storage change during the study period and groundwater-level change are shown in figure 11 and table 3. At wells with only quarterly discrete data, groundwater levels at the time of the gravity survey were estimated using linear interpolation between the nearest values in time. At wells with rapid groundwater-level changes, such as 351545106462001 (well 14), this need to interpolate in time demonstrates one of the limitations of spatially interpolating groundwater-levels to create head maps, and in particular, head-change maps: groundwater-level measurements collected at different times (for example, over a several-month period) and combined in a single map may not represent a “snapshot” of the aquifer. (The same limitation would apply to gravity data if a survey was carried out over a long time period.) At this well, the large increase in groundwater level (2.7 ft, one of the westernmost wells in fig. 11), viewed in context of the entire record (U.S. Geological Survey, 2024b), appears to represent short-term fluctuations in groundwater head and may not indicate an actual large storage change because of delayed drainage/filling caused by capillary effects, and (or) confined or semiconfined aquifer conditions. In contrast, the large increase in groundwater level at the two wells (sites 350950106434001 and 350918106425401) in the southwestern part of the map area on figure 11 near the southern boundary appears to represent a years-long, steady increase in groundwater level, likely caused by a reduction in pumping in nearby wells, and interpolation in time introduces less error. A further limitation of combining groundwater-level data from multiple wells is introduced when different wells are open to different parts of the aquifer, with different screen lengths, creating a heterogeneous dataset. In contrast, repeat microgravity data, despite having less precision, are more uniform in their region of sensitivity across the network because the instrument is measuring approximately the same volume of the subsurface at each location.
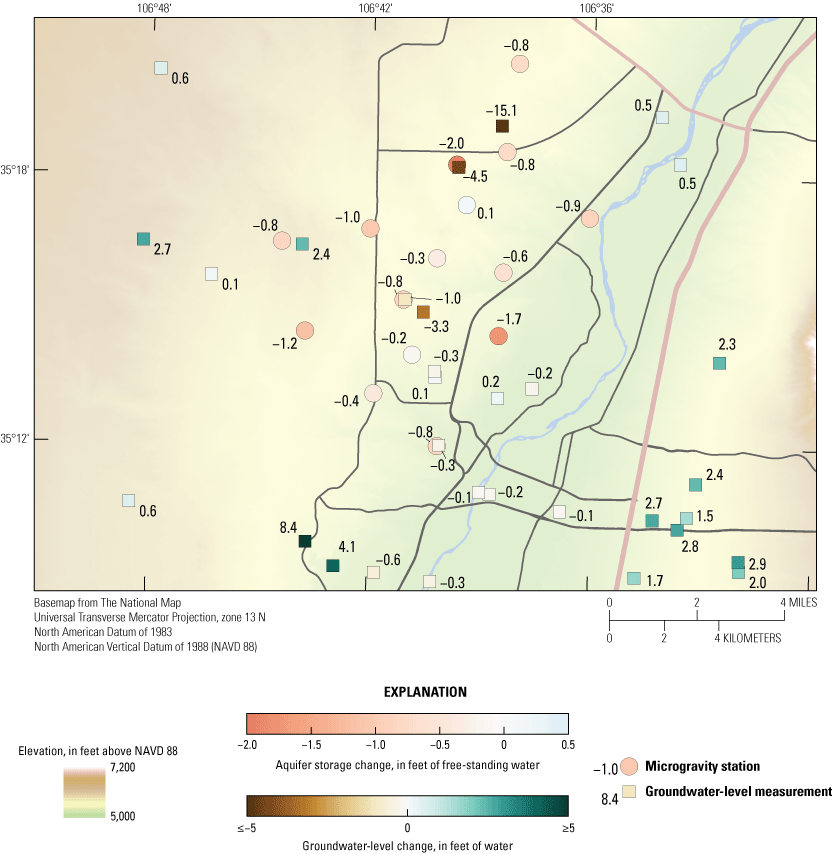
Cumulative groundwater storage change and groundwater-level change in the Rio Rancho, New Mexico, area for the duration of the study (April 2019–January 2023).
Table 3.
Linear trends in groundwater-storage change from repeat microgravity data in the Rio Rancho, New Mexico area (2019–23).[ID, identifier; n, number of observations used in trend analysis; Apr., April; Jan., January; NA, not applicable]
Spatial changes in gravity and groundwater levels generally agree (fig. 11). Declines are greatest in the northern and central parts of the network, and less in the southern and western parts. Groundwater-level changes are near zero in the south-central part of the study area, whereas large increases have occurred in the far southwestern and southeastern parts. These increases were caused by decreased groundwater pumping by the Albuquerque Bernalillo County Water Utility Authority beginning in 2010 (followed by an increase in pumping in 2020) and are supported by repeat microgravity monitoring data (Albuquerque Bernalillo County Water Utility Authority, 2022; Kennedy and Bell, 2023). Groundwater levels in the southern part of the study area reached their maximum in 2020 and have stabilized or declined slightly between 2020 and 2023 (USGS, 2023).
Trends in Groundwater Storage and Groundwater Levels
To evaluate change in groundwater storage during the entire study period, a linear trend was fit to the time-series data at each location (table 3). The coefficient of determination (R2) values are low (mean = 0.36) because of unaccounted-for seasonality in the data, low signal-to-noise ratios, and the large decreases and increases in storage during the last two surveys. Nevertheless, the trends are nearly all negative, ranging from 0.06 (station AWTFS) to −0.61 (station MW23) ft of water per year. The largest negative trends occur along a north-south line in the central part of the study area (fig. 11). The trend for AWTF1 is the highest computed of the study at 0.64 ft of water per year, but is not included in the general comparison discussion because gravity data were collected during only 5 events early in the study, whereas all other stations had gravity data collected during at least 10 events.
The small but widespread decline in groundwater storage over the study period (fig. 12) may be reconciled with the generally stable to slightly increasing groundwater levels (figs. 5 and 6), in part, by a change in water content in the unsaturated zone. Depth to groundwater in the study area is nearly 200 ft below land surface near the Rio Grande and over 1,000 ft below land surface in the western part of the study area. The gravity-change measurement is interpreted as reflecting water-storage change at the water table, but it also includes water stored in the unsaturated zone. Although the change in unsaturated-zone water content is generally small, owing to the high rate of evapotranspiration relative to precipitation, a small change summed over a sufficiently thick unsaturated zone may produce a measurable gravity signal. Drying of the unsaturated zone could manifest as decreasing gravity during the study period without affecting groundwater levels, but over time, this drying will lead to less recharge reaching the aquifer and an eventual lowering of groundwater levels. The timescale of unsaturated-zone drying is difficult to determine but likely occurs over several years to decades (Dickinson and Ferré, 2018).
Trend in aquifer-storage change in the Rio Rancho, New Mexico, study area from April 2019 to January 2023.
Specific Yield
Specific yield estimates are possible at locations having collocated repeat microgravity data and water-level data. For any particular increment of groundwater-storage change, the specific yield can be calculated as the ratio of groundwater storage change (from gravity data) to groundwater-level change. Where time-series data exist, groundwater-storage change data for the interval between each gravity survey can be plotted against groundwater-level change for the same interval, and specific yield can be estimated as the slope of the best-fit line.
In the Rio Rancho study area, four locations had collocated gravity and groundwater-level data. Specific yield estimates had high associated uncertainty because groundwater-level (and groundwater-storage) changes were small. At two of the four locations (MW18 and HRUN), specific yield estimates were unrealistic (negative or greater than 1) and are not presented here. A reasonable estimate, 0.20 ±0.07, was obtained at site MW23, which had over 3 ft of groundwater-level change during the study period (fig. 13). An unreasonably high estimate with high uncertainty, 0.71 ±0.23, was obtained at site LIMS, which had about 0.5 ft of groundwater-level change during the study period (fig. 13). Published values of specific yield for basin-fill aquifers similar to the Santa Fe Group aquifer system range from approximately 0.1 to 0.25 (Johnson, 1967). Specific yield values used in groundwater flow models of the Santa Fe Group range from 0.15 to 0.20 (Kernodle and others, 1995; Tiedeman and others, 1998; Barroll, 2001). Nevertheless, the relatively large gravity changes at MW23 and LIMS that are correlated with groundwater-level changes provide evidence that groundwater-storage changes are occurring at the water table in unconfined storage, indicating a degree of connection between the water table and deeper aquifer layers where municipal pumping occurs.
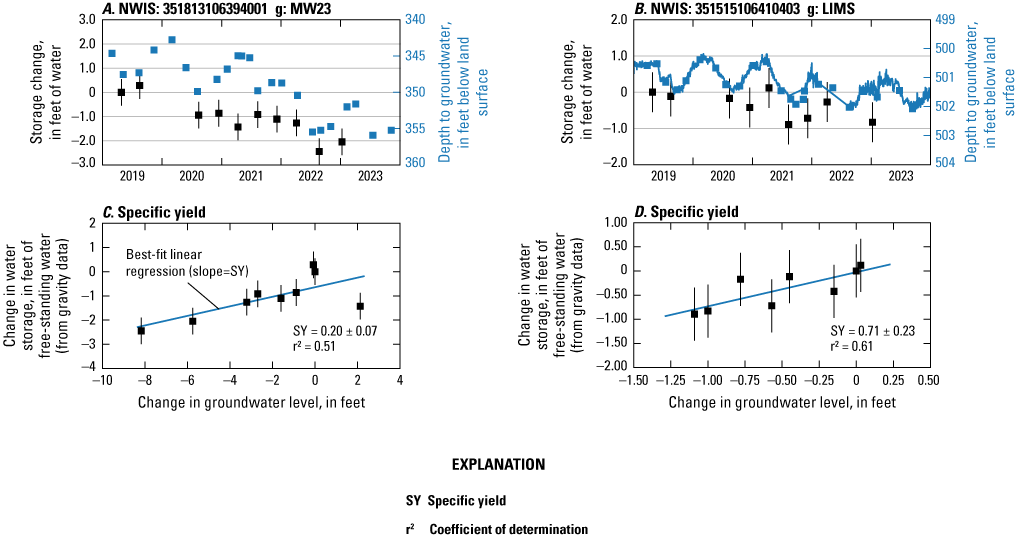
Estimated specific yield (SY) and associated source data at two locations within the City of Rio Rancho, New Mexico. A, Source data at MW23; B, source data at LIMS; C, SY at MW23; and D, SY at LIMS. SY is the slope of a regression line between groundwater-storage change and groundwater-level change. NWIS, National Water Information System site number; g, gravity station identifier; r2, coefficient of determination.
Summary and Conclusions
In 2019, the U.S. Geological Survey, in cooperation with the City of Rio Rancho, began a groundwater-monitoring program for the aquifer that provides all of the water for municipal and commercial use within the city. The primary aquifer exists within sediments of the Santa Fe Group and is pumped by several other entities, including the Albuquerque Bernalillo County Water Utility Authority.
The monitoring network included 18 wells where groundwater-level data were collected quarterly or semiannually and two locations (one just south of Rio Rancho) where data were collected hourly in nested piezometers. The network also included 20 repeat microgravity monitoring stations where the acceleration due to Earth’s gravity was measured three times per year. Changes in gravity were readily converted to changes in groundwater storage using the linear horizontal-infinite slab approximation.
Precipitation during the study period included periods of above-average precipitation (summer and fall 2022) and below-average precipitation (summer 2020 and 2021). Groundwater-level and repeat microgravity data indicate aquifer storage was generally stable during the 2019–23 study period, during which time the average annual pumping by the City of Rio Rancho was about 11,000 acre-feet. Some monitoring well locations experienced small increases in groundwater levels and others experienced small decreases, whereas most gravity stations exhibited a small decline in storage during the study period. The generally stable groundwater-storage metrics indicate recharge into the aquifer was about equal to pumping from the aquifer (including non-Rio Rancho pumping) during the study period. Slightly declining groundwater storage (gravity) data accompanied by stable to increasing groundwater levels could indicate drying of the unsaturated zone.
On the basis of repeat microgravity data, the Advanced Water Treatment Facility appears to not be accumulating storage, as groundwater mounding, in the direct vicinity. Excess groundwater mounding (which would cause an increase in gravity) can indicate a poorly transmissive aquifer and diminished prospects for long-term sustainability of a managed aquifer recharge site. At the Advanced Water Treatment Facility, injected water appears to displace aquifer water and flow according to the local groundwater gradient away from the facility, indicating it is operating efficiently and as intended.
Because of the small groundwater-level changes during the study period, accurate specific yield estimates were limited to a single well: 0.20 ±0.07 at MW23. Nevertheless, large gravity changes, and correlated gravity and groundwater-level changes, indicate storage changes are occurring at the water table as unconfined storage, as opposed to confined storage, which would present as large groundwater-level changes and minimal gravity change.
Although groundwater conditions are currently stable, the Rio Rancho metropolitan area is rapidly growing, and increased groundwater demand is anticipated. Increased groundwater withdrawals or reduced recharge in the future may lead to a decrease in groundwater storage. Groundwater-level measurements (especially transducer measurements) provide high temporal resolution and precise information about the hydraulic gradients that drive groundwater flow but are limited to existing monitoring well locations or depend on new wells that can be expensive to drill. Repeat microgravity measurements provide a quantitative measurement of groundwater-storage change, and stations can be located nearly anywhere on the land surface. Limitations include relatively low precision and the requirement for expensive instrumentation. Together, groundwater levels and repeat microgravity data can support water-resource management decisions by providing more complete insight into aquifer storage change than either method alone.
References Cited
Albuquerque Bernalillo County Water Utility Authority, 2022, Annual information statement: Albuquerque Bernalillo County Water Utility Authority, 189 p., accessed April 22, 2024, at https://www.abcwua.org/wp-content/uploads/2022/03/ABCWUA-AIS-2022-03.23.2022-FINAL.pdf.
Bell, M.T., and Kennedy, J.R., 2025, Repeat microgravity data from Rio Rancho, New Mexico, 2019–2023: U.S. Geological Survey data release, https://doi.org/10.5066/P14NKDR2.
Cunningham, W.L., and Schalk, C.W., comps., 2011, Groundwater technical procedures of the U.S. Geological Survey: U.S. Geological Survey Techniques and Methods book 1, chap. A1, 151 p., accessed December 30, 2022, at https://pubs.usgs.gov/tm/1a1/.
Daniel B. Stephens & Associates, Inc., 2014, City of Rio Rancho water resources management plan implementation plan update: Prepared for the City of Rio Rancho, New Mexico, 34 p., accessed April 30, 2025, at https://www.rrnm.gov/427/Water-Resources-Management-Plan.
Falk, S.E., Bexfield, L.M., and Anderholm, S.K., 2011, Estimated 2008 groundwater potentiometric surface and predevelopment to 2008 water-level change in the Santa Fe Group aquifer system in the Albuquerque area, central New Mexico: U.S. Geological Survey Scientific Investigations Map 3162, 1 sheet, accessed May 11, 2022, at https://doi.org/10.3133/sim3162.
Galanter, A.E., and Curry, L.T.S., 2019, Estimated 2016 groundwater level and drawdown from predevelopment to 2016 in the Santa Fe Group aquifer system in the Albuquerque area, central New Mexico: U.S. Geological Survey Scientific Investigations Map 3433, 1 sheet, 13-p. pamphlet, accessed May 10, 2022, at https://doi.org/10.3133/sim3433.
Johnson, A.I., 1967, Specific yield—Compilation of specific yields for various materials: U.S. Geological Survey Water-Supply Paper 1662–D, 74 p., accessed March 13, 2024, at https://pubs.usgs.gov/wsp/1662d/report.pdf.
Kennedy, J.R., 2020, GSadjust v1.0: U.S. Geological Survey software release, accessed December 20, 2020, at https://doi.org/10.5066/P9YEIOU8.
Kennedy, J.R., and Bell, M.T., 2023, Measuring basin-scale aquifer storage change and mapping specific yield in Albuquerque, New Mexico, USA, with repeat microgravity data: Journal of Hydrology—Regional Studies, v. 47, accessed October 25, 2023, at https://doi.org/10.1016/j.ejrh.2023.101413.
Kennedy, J.R., Ferré, T.P.A., and Creutzfeldt, B., 2016, Time-lapse gravity data for monitoring and modeling artificial recharge through a thick unsaturated zone: Water Resources Research, v. 52, no. 9, p. 7244–7261, accessed January 29, 2024, at https://doi.org/10.1002/2016WR018770.
Kennedy, J.R., Ferré, T.P.A., Güntner, A., Maiko, A., and Creutzfeldt, B., 2014, Direct measurement of subsurface mass change using the variable baseline gravity gradient method: Geophysical Research Letters, v. 41, no. 8, p. 2827–2834, accessed January 29, 2024, at https://doi.org/10.1002/2014GL059673.
Kennedy, J.R., Kahler, L.M., and Read, A.L., 2019, Aquifer storage change and storage properties, 2010–2017, in the Big Chino Subbasin, Yavapai County, Arizona: U.S. Geological Survey Scientific Investigations Report 2019–5060, 39 p., accessed August 2, 2022, at https://doi.org/10.3133/sir20195060.
Kennedy, J.R., Pool, D.R., and Carruth, R.L., 2021a, Procedures for field data collection, processing, quality assurance and quality control, and archiving of relative- and absolute-gravity surveys: U.S. Geological Survey Techniques and Methods, book 2, chap. D4, 50 p., accessed June 5, 2022, at https://doi.org/10.3133/tm2D4.
Kennedy, J.R., Wildermuth, L., Knight, J.E., and Larsen, J., 2021b, Improving groundwater model calibration with repeat microgravity measurements: Groundwater, v. 60, no. 3, p. 393–403, accessed May 4, 2022, at https://doi.org/10.1111/gwat.13167.
Koning, D., 2022, Where are the best aquifers under Rio Rancho?: New Mexico Bureau of Geology and Mineral Resources Fact Sheet, 4 p., accessed December 30, 2024, at https://geoinfo.nmt.edu/geoscience/research/documents/134/RioRanchoFactSheet_web.pdf.
Magnuson, M.L., Valdez, J.M., Lawler, C.R., Nelson, M., and Petronis, L., 2019, New Mexico water use by categories 2015: New Mexico Office of the State Engineer Technical Report 55, 126 p., accessed December 23, 2024, at https://www.ose.nm.gov/Library/tech_reports.php.
Micro-g LaCoste, 2024, “g” Absolute gravity processing software, version 9.21.01: Micro-g Lacoste web page, accessed April 30, 2025, at https://microglacoste.com/product/micro-g-lacostes-g-absolute-gravity-processing-software/.
Moore, S.J., 2007, Streamflow, infiltration, and recharge in Arroyo Hondo, New Mexico, in Stonestrom, D.A., Constantz, J., Ferre, T.P.A., and Leake, S.A., eds., Ground-water recharge in the arid and semiarid southwestern United States: U.S. Geological Survey Professional Paper 1703–F, p. 137–155, accessed December 30, 2024, at https://pubs.usgs.gov/pp/pp1703/f/.
National Geodetic Survey, 2022, Online Positioning User Service: National Geodetic Survey database, accessed October 22, 2022, at https://geodesy.noaa.gov/OPUS/.
National Oceanic and Atmospheric Administration [NOAA], 2022, National Weather Service online weather data: National Oceanic and Atmospheric Administration database, accessed December 5, 2022, at https://www.weather.gov/wrh/Climate?wfo=abq.
New Mexico Office of the State Engineer [NMOSE], 2023, New Mexico Water Rights Reporting System: New Mexico Office of the State Engineer database, accessed November 29, 2023, at http://nmwrrs.ose.state.nm.us/nmwrrs/index.html.
Plummer, L.N., Bexfield, L.M., Anderholm, S.K., Sanford, W.E., and Busenberg, E., 2004, Geochemical characterization of ground-water flow in the Santa Fe Group Aquifer System, Middle Rio Grande Basin, New Mexico (ver. 1.2, November 20, 2012): U.S. Geological Survey Water-Resources Investigations Report 03–4131, 391 p., accessed October 11, 2024, at https://pubs.usgs.gov/wri/wri034131/.
Pool, D.R., 2008, The utility of gravity and water-level monitoring at alluvial aquifer wells in southern Arizona: Geophysics, v. 73, no. 6, p. WA49–WA59. [Also available at https://doi.org/10.1190/1.2980395.]
Pool, D.R., and Anderson, M.T., 2008, Groundwater-storage change and land subsidence in Tucson Basin and Avra Valley, southeastern Arizona, 1998–2002: U.S. Geological Survey Scientific Investigations Report 2007–5275, 34 p., accessed January 26, 2024, at https://pubs.usgs.gov/sir/2007/5275/.
Pool, D.R., and Eychaner, J.H., 1995, Measurements of aquifer-storage change and specific yield using gravity surveys: Ground Water, v. 33, no. 3, p. 425–432. [Also available at https://doi.org/10.1111/j.1745-6584.1995.tb00299.x.]
Rankin, D.R., Oelsner, G.P., McCoy, K.J., Moret, G.J.M., Worthington, J.A.S., and Bandy-Baldwin, K.M., 2016, Groundwater hydrology and estimation of horizontal groundwater flux from the Rio Grande at selected locations in Albuquerque, New Mexico, 2009–10: U.S. Geological Survey Scientific Investigations Report 2016–5021, 75 p., accessed March 8, 2022, at https://doi.org/10.3133/sir20165021.
Rawling, G., 2023, Winter 2021–2022 water-level elevation map for the Albuquerque metropolitan area: New Mexico Bureau of Geology and Mineral Resources Open-File Report 625, 18 p., accessed April 28, 2024, at https://geoinfo.nmt.edu/publications/openfile/details.cfml?Volume=625.
Rio Rancho Utilities Division, 2017, Rio Rancho . . . Leading the State in recharging our aquifer: City of Rio Rancho Injection Newsletter 03062017, accessed April 29, 2025, at https://rrnm.gov/DocumentCenter/View/69831/Injection-Newsletter_03062017?bidId=.
Robertson, A.J., Kennedy, J.R., Wildermuth, L.M., Bell, M.T., Fuchs, E.H., Rinehart, A., and Fernald, I., 2022, Determining seasonal recharge, storage changes, and specific yield using repeat microgravity and water-level measurements in the Mesilla Basin alluvial aquifer, New Mexico, 2016–2018: Journal of Applied Geophysics, v. 209, accessed December 30, 2024, at https://doi.org/10.1016/j.jappgeo.2022.104916.
Roman, I., 1946, An observational method to overcome zero drift error in field instruments: Geophysics, v. 11, no. 4, p. 466–490. [Also available at https://doi.org/10.1190/1.1437276.]
Schmerge, D., and Francis, O., 2006, Set standard deviation, repeatability and offset of absolute gravimeter A10-008: Metrologia, v. 43, no. 5, p. 414–418, accessed November 25, 2022, at https://doi.org/10.1088/0026-1394/43/5/012.
U.S. Census Bureau, 2020, 2020 census of population and housing: U.S. Census Bureau database, accessed January 24, 2023, at https://www.census.gov/quickfacts/fact/table/rioranchocitynewmexico/POP010220.
U.S. Drought Monitor, 2022, National Oceanic and Atmospheric Administration National Integrated Drought Information System: National Oceanic and Atmospheric Administration database, accessed December 5, 2022, at https://www.drought.gov/location/Rio%20Rancho%2C%20New%20Mexico.
U.S. Geological Survey [USGS], 2021, Southwest Gravity Program Absolute-Gravity Database (updated 2025-05-14): U.S. Geological Survey data release, https://doi.org/10.5066/P984HN6J.
U.S. Geological Survey [USGS], 2023, USGS water data for the Nation: U.S. Geological Survey National Water Information System database, accessed July 7, 2023, at https://doi.org/10.5066/F7P55KJN.
U.S. Geological Survey [USGS], 2024a, The National Map: U.S. Geological Survey database, accessed January 4, 2024, at https://apps.nationalmap.gov/viewer/.
U.S. Geological Survey [USGS], 2024b, USGS 351627106435301 12N.02E.16.214, in USGS water data for the Nation: U.S. Geological Survey National Water Information System database, accessed June 16, 2024, at https://doi.org/10.5066/F7P55KJN. [Site information directly accessible at https://waterdata.usgs.gov/monitoring-location/351627106435301.]
van Camp, M., de Viron, O., Watlet, A., Meurers, B., Francis, O., and Caudron, C., 2017, Geophysics from terrestrial time-variable gravity measurements: Reviews of Geophysics, v. 55, no. 4, p. 938–992. [Also available at https://doi.org/10.1002/2017RG000566.]
Conversion Factors
U.S. customary units to International System of Units
Temperature in degrees Celsius (°C) may be converted to degrees Fahrenheit (°F) as follows:
°F = (1.8 × °C) + 32.
Temperature in degrees Fahrenheit (°F) may be converted to degrees Celsius (°C) as follows:
°C = (°F – 32) / 1.8.
Datums
Vertical coordinate information is referenced to the North American Vertical Datum of 1988 (NAVD 88).
Horizontal coordinate information is referenced to the North American Datum of 1983 (NAD 83).
Elevation, as used in this report, refers to distance above the vertical datum.
For more information about this publication, contact
Director, New Mexico Water Science Center
U.S. Geological Survey
6700 Edith Blvd. NE
Albuquerque, NM 87113
For additional information, visit
https://www.usgs.gov/centers/nm-water
Publishing support provided by
Lafayette Publishing Service Center
Disclaimers
Any use of trade, firm, or product names is for descriptive purposes only and does not imply endorsement by the U.S. Government.
Although this information product, for the most part, is in the public domain, it also may contain copyrighted materials as noted in the text. Permission to reproduce copyrighted items must be secured from the copyright owner.
Suggested Citation
Kennedy, J.R., Bell, M.T., and Seelig, W.G., 2025, Aquifer storage change and storage properties, Rio Rancho, New Mexico, 2019–23: U.S. Geological Survey Scientific Investigations Report 2025–5040, 25 p., https://doi.org/10.3133/sir20255040.
ISSN: 2328-0328 (online)
Study Area
| Publication type | Report |
|---|---|
| Publication Subtype | USGS Numbered Series |
| Title | Aquifer storage change and storage properties, Rio Rancho, New Mexico, 2019–23 |
| Series title | Scientific Investigations Report |
| Series number | 2025-5040 |
| DOI | 10.3133/sir20255040 |
| Publication Date | June 25, 2025 |
| Year Published | 2025 |
| Language | English |
| Publisher | U.S. Geological Survey |
| Publisher location | Reston, VA |
| Contributing office(s) | New Mexico Water Science Center |
| Description | Report: viii, 25 p.; 3 Data Releases |
| Country | United States |
| State | New Mexico |
| City | Rio Rancho |
| Online Only (Y/N) | Y |