

Estimated Hydrogeologic, Spatial, and Temporal Distribution of Self-Supplied Domestic Groundwater Withdrawals for Aquifers of the Virginia Coastal Plain
Links
- Document: Report (13.5 MB pdf) , HTML , XML
- Data Release: USGS data release - Estimated aquifer distribution for private domestic wells; estimated spatial distribution of the self-supplied domestic population for 2020 and 2010; and estimated monthly domestic self-supplied withdrawals of groundwater for the Virginia Coastal Plain
- NGMDB Index Page: National Geologic Map Database Index Page (html)
- Download citation as: RIS | Dublin Core
Acknowledgments
The authors would like to acknowledge the support and assistance of the Virginia Department of Environmental Quality and the Eastern Virginia Groundwater Management Advisory Committee.
The authors thank Scott Bruce and Gouri Mahadwar of the Virginia Department of Environmental Quality, Megan Senseman of the Virginia Department of Health, and Ivy Ozmon of the Hampton Roads Planning District Commission for the collection and provision of data used in this report.
The authors thank Rowan Johnson, Rebecca Ransom, and Josh Kasper of the U.S. Geological Survey for their assistance with figures and review of the manuscript of this report.
Finally, the authors posthumously acknowledge Tyler Johnson of the U.S. Geological Survey for his contributions towards estimating domestic water use and his encouragement of further advances.
Abstract
Water use from private-domestic wells accounts for nearly 40 percent of total groundwater withdrawals in the Virginia Coastal Plain Physiographic Province (henceforth called the Virginia Coastal Plain). However, because self-supplied domestic water use generally falls below the Virginia Department of Environmental Quality (VDEQ) reporting and management threshold of 300,000 gallons per month, quantifying these withdrawals is challenging. This report builds upon the foundation of previous U.S. Geological Survey investigations by providing revised techniques to improve estimates of the aquifer source, spatial distribution, and monthly magnitude of these groundwater withdrawals.
The aquifer sources of private-domestic wells in the Virginia Coastal Plain were estimated by cross-referencing 8,264 well records from the VDEQ and the Virginia Department of Health to a digital model of the Virginia Coastal Plain hydrogeologic framework. This analysis highlights the regional importance of the Yorktown-Eastover, Potomac, and surficial aquifers. Collectively, these three aquifers account for 80 percent of self-supplied domestic groundwater withdrawals.
The population using self-supplied domestic water was estimated using census blocks, well-use ratios, building footprints, and land-use and land-cover data to produce a high-resolution, disaggregated, raster-based dataset. This approach improves upon previous models at the census-block or road-network scale by reducing the low-density spread of the self-supplied domestic population across undeveloped areas and concentrating the population and its corresponding water use in the areas where it is most likely to occur. Results show the greatest concentration of self-supplied domestic population in the suburbs surrounding the larger cities of the Virginia Coastal Plain, and overall growth in the self-supplied domestic population of 5.7 percent since 2010. Estimates could be further refined with the addition of current and complete spatial data on public water-system service areas.
The quantity of water used by the self-supplied domestic population was estimated by modifying published state per-capita water-use coefficients with the corresponding monthly variability assessed from Virginia Coastal Plain public water-system withdrawal data. This analysis estimates an average increase of 12 percent from June through August and an average decrease of 8 percent from December through March from the baseline annual average of 80 gallons per day per capita, which generally matches similar studies in the eastern United States.
The application of these revised methodologies for the estimation of private-domestic wells and the self-supplied domestic population improves understanding of domestic groundwater use in the Virginia Coastal Plain across hydrogeologic, spatial, and temporal scales. These revisions help better inform water-resource managers and decision makers and support higher resolution groundwater modeling. Furthermore, these methods are transferrable to other areas where self-supplied domestic water withdrawals are important to the overall water budget.
1. Introduction
Groundwater is a key resource to support the population and economic activity of the Virginia Coastal Plain Physiographic Province, henceforth called the Virginia Coastal Plain. Use of confined aquifers in the Virginia Coastal Plain has received increased attention and regulation over time in an effort to manage groundwater in a sustainable manner and avoid negative effects to water quality, water availability, and land subsidence. An analysis of private-domestic groundwater wells in the Virginia Coastal Plain by Pope and others (2008) found that three-quarters of self-supplied domestic water withdrawals come from deep, confined aquifers, and total self-supplied domestic water withdrawals may compose about one-third of all groundwater withdrawals. Because self-supplied domestic groundwater withdrawals fall below 300,000 gallons per month, users are not required by the Virginia Department of Environmental Quality (VDEQ) to acquire water-use permits or report their water use. Therefore, the development of modeling and estimation techniques to accurately represent the distribution of domestic water use across the landscape and within the aquifer system is necessary to properly manage the Virginia Coastal Plain’s water resources.
Although the previous private-domestic well study by Pope and others (2008) advanced our knowledge of water use in the Virginia Coastal Plain, the spatial resolution of their water-use estimates was limited by data available at the time. Improvements in digital well records, high-resolution land-use and land-cover data, water-use data, and hydrogeologic models have created an opportunity to improve upon the previous study and provide water-resource managers with updated information to support water budget calculations, modeling, management, and decision making.
1.1. Purpose and Scope
Sustainability of groundwater resources in Virginia Coastal Plain aquifers is a concern for water-resource managers and planners. The U.S. Geological Survey (USGS) and the VDEQ have cooperated on numerous studies to better understand the hydrogeologic framework, groundwater flow, and water use of the Virginia Coastal Plain aquifers (including McFarland and Bruce, 2006; Pope and others, 2008; Heywood and Pope, 2009; and Pope and others, 2016). This study builds upon previous USGS investigations, namely Pope and others (2008), to update estimation of domestic water use in the Virginia Coastal Plain across hydrogeologic, spatial, and temporal scales. These revisions will support higher resolution groundwater modeling and better inform water-resource managers and decision makers. Because each component of the revised analysis—distribution of wells among the aquifers, spatial distribution of users, and temporal distribution and amount of withdrawals—was completed with independent data sources and methods, this report covers each topic separately and in turn.
1.2. Description of Study Area
The Virginia Coastal Plain occupies the entire eastern part of Virginia between approximately longitude 77°30′ W and the Atlantic Ocean, including the Virginia Eastern Shore on the peninsula between the Chesapeake Bay and the Atlantic Ocean (fig. 1). The area is bordered by Maryland and North Carolina to the north and south, respectively. Geologically, the Virginia Coastal Plain is defined by a wedge of unconsolidated sediments of fluvial-deltaic and marine origin that rests on consolidated bedrock, hereafter referred to as the basement. This sediment wedge thins to the west and pinches out in the Fall Zone, where crystalline rock of the Piedmont Physiographic Province outcrops. Along the Atlantic Coast of Virginia, the total thickness of Virginia Coastal Plain sediments is greater than 6,000 feet (ft; McFarland and Bruce, 2006).
Fifty Virginia counties and independent cities, henceforth referred to as localities, lie entirely or partially within the Virginia Coastal Plain. Population is concentrated in large urban areas, including the northern Virginia metropolitan area near Washington, D.C.; the Cities of Fredericksburg, Richmond, and Petersburg along the western boundary of the Coastal Plain; and the Cities of Chesapeake, Hampton, Norfolk, Portsmouth, and Virginia Beach in the southeast near the mouth of the Chesapeake Bay (fig. 1; U.S. Census Bureau, 2021). The remainder of the Virginia Coastal Plain is more sparsely populated and includes small towns and outlying rural areas of forest, agriculture, and wetland. The climate of the Virginia Coastal Plain is humid and temperate, with annual mean precipitation of approximately 45 inches (National Oceanic and Atmospheric Administration, 2024). The topography of the Virginia Coastal Plain is characterized by rolling terrain with deeply incised stream valleys in the northwest and gently rolling to level terrain with broad stream valleys in the east and south. Land-surface elevations generally decline seaward, from over 300 ft in the western Virginia Coastal Plain to 0 ft (sea-level) along the Atlantic coast. Several major rivers drain eastward into the Chesapeake Bay, creating three prominent peninsulas. From north to south these peninsulas are referred to as the Northern Neck (between the Potomac and Rappahannock Rivers), the Middle Peninsula (between the Rappahannock and York Rivers), and the York-James Peninsula (between the York and James Rivers; McFarland and Bruce, 2006). These major rivers become brackish as they enter estuarine areas east of the Fall Zone. Consequently, the Virginia Coastal Plain is heavily reliant upon groundwater resources (Pope and others, 2008).
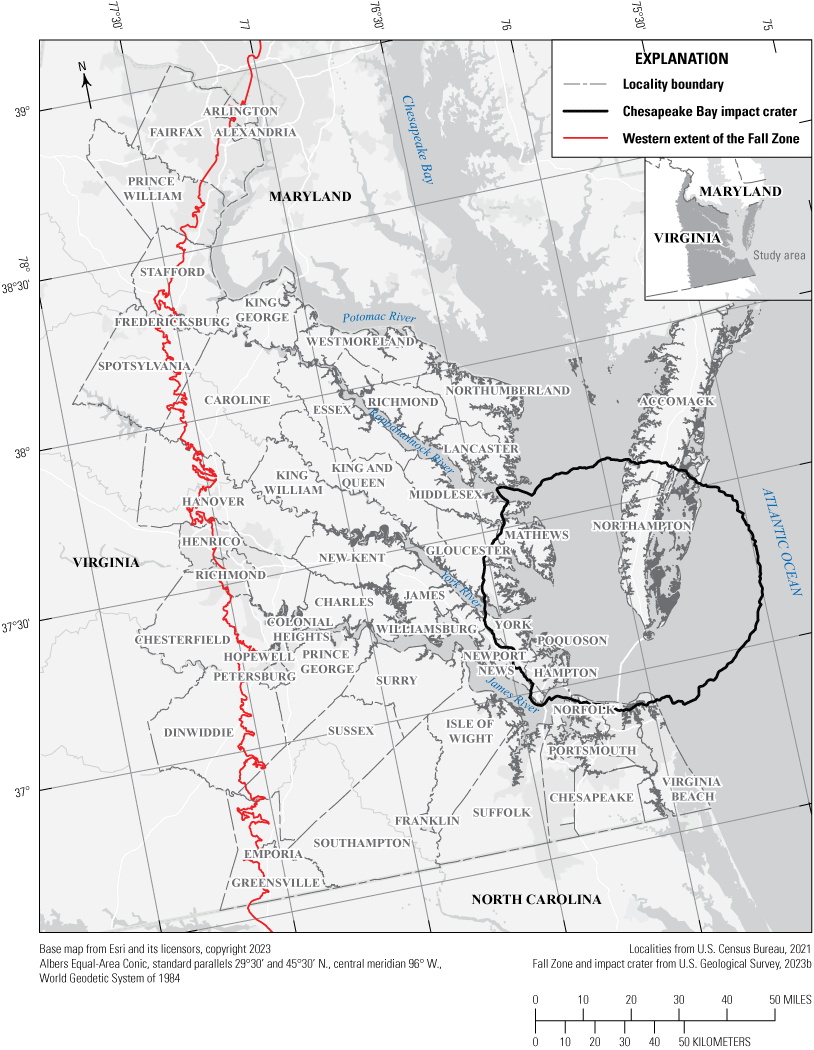
Map showing the locations of localities (Virginia counties and independent cities) and other important geographic and physiographic features of the Virginia Coastal Plain.
The USGS previously estimated groundwater use at 5-year intervals for the 50 localities all or partially within the Virginia Coastal Plain as part of national water-use data compilation efforts (table 1; fig. 2). Note that this estimated groundwater use is for the entire locality and not limited to the Virginia Coastal Plain. From 2000 to 2015 (the latest year for which USGS data were available), overall groundwater use has slightly decreased, predominantly because of a decline in groundwater use for industrial activity since 2005 (U.S. Geological Survey, 2024b). By 2015, self-supplied domestic groundwater withdrawals collectively accounted for 46 million gallons per day (Mgal/d) and made up the largest portion of groundwater use (39 percent). Industrial use of groundwater accounted for 39 Mgal/d (33 percent), and public supply from groundwater accounted for 24 Mgal/d (21 percent).
Table 1.
Aggregate estimated groundwater use in the 50 localities of the Virginia Coastal Plain by water-use category, 2000–15.[Data from U.S. Geological Survey (2024b). Groundwater withdrawals are in million gallons per day (Mgal/d)]

Bar graph showing aggregate estimated groundwater use in the 50 localities of the Virginia Coastal Plain by water-use category, 2000–15.
Most of the Virginia Coastal Plain is included within the two State-designated Groundwater Management Areas: Eastern Virginia and Eastern Shore. In these areas, large groundwater withdrawals are regulated by the VDEQ, which generally requires well owners to obtain a permit to withdraw 300,000 or more gallons per month. Under the conditions of these permits, well owners collect various information, including well construction details, withdrawal amounts, and water-level and (or) water quality data. This information is reported to the VDEQ to support greater understanding of the effect large withdrawals have on the aquifers of the Virginia Coastal Plain (B. Campbell, Virginia Department of Environmental Quality, written commun., 2025).
In comparison, information from the approximately 200,000 private-domestic wells in the Virginia Coastal Plain is far less comprehensive (Pope and others, 2008). Well-completion records are required by Virginia state regulation and maintained in various forms by the Virginia Department of Health (VDH) or the VDEQ, depending on the well’s age and location within the Groundwater Management Areas. The availability, quality, and variability of well-completion records represents change in reporting requirements, data entry, and data management over time, as well as the different, and sometimes overlapping, authorities of the VDH and the VDEQ over private-domestic wells in the Virginia Coastal Plain (B. Campbell, Virginia Department of Environmental Quality, written commun., 2025). Efforts to improve data collection and move from paper records to electronic well databases are ongoing among both agencies, but legacy records still contain missing or imprecise information (Pope and others, 2008). Given the magnitude of self-supplied domestic water use and the lack of complete data for private-domestic wells, accurate estimation of the source aquifer, location, and rates of these groundwater withdrawals is important to better understand the water resources of the Virginia Coastal Plain.
1.3. Aquifers of the Virginia Coastal Plain
The Virginia Coastal Plain aquifer system is a part of the more extensive Northern Atlantic Coastal Plain aquifer system. The geology of this region consists of a seaward-thickening wedge of eastward-dipping strata of unconsolidated to partly consolidated Cretaceous, Tertiary, and Quaternary sediments that overlie a basement of consolidated bedrock (fig. 3; McFarland and Bruce, 2006). The groundwater within the Virginia Coastal Plain primarily originates from precipitation that infiltrates the surficial, water-table aquifer and then flows laterally to discharge in nearby streams or downward to recharge deeper confined aquifers (Pope and others, 2008). The hydrogeology of the Virginia Coastal Plain is covered extensively in previous USGS publications, including McFarland and Bruce (2006), Pope and others (2008), Masterson and others (2016), and McFarland and Beach (2019). A brief overview of the aquifers of the Virginia Coastal Plain is provided in this report to provide context for the analysis herein.
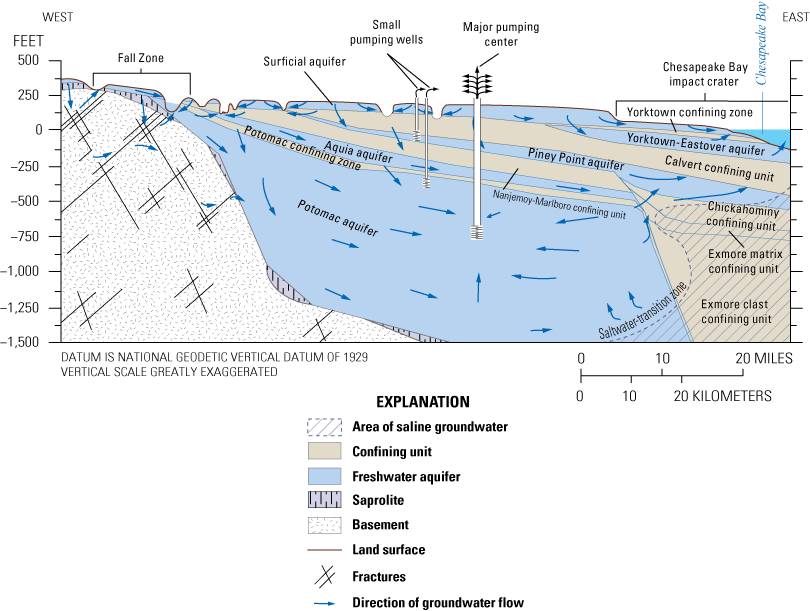
Generalized hydrogeologic section showing principal aquifers, confining beds, and conceptual patterns of groundwater flow in the Virginia Coastal Plain. Modified from Foster and others (2024).
1.3.1. Surficial Aquifer
The surficial aquifer comprises a series of primarily fluvial-deltaic and estuarine quartz sands and gravels of variable texture with interbedded silts and clays (McFarland and Bruce, 2006). The surficial aquifer covers the entire Virginia Coastal Plain (fig. 3). The top of the aquifer is at land surface, and its thickness ranges from many tens of feet in western upland areas to a few tens of feet or less in the east. Most of the surficial aquifer is underlain by various confining units or zones. However, near the Fall Zone or along major rivers, the surficial aquifer directly overlies and may be connected to deeper aquifers. Because it is shallow and most readily accessed, the surficial aquifer historically has been an important water supply, but drought and decreasing water quality in recent years have caused users in some locations to abandon wells in the surficial aquifer in search of more dependable water supplies in deeper aquifers (Pope and others, 2008).
1.3.2. Yorktown-Eastover Aquifer
The Yorktown-Eastover aquifer extends across most of the Virginia Coastal Plain except for several of the northwestern counties (fig. 3). The upper part of the Yorktown-Eastover aquifer consists of estuarine to marine, variably textured, glauconitic, phosphatic, and fossiliferous quartz sands and interbedded silts and clays; the lower part consists of abundantly fossiliferous sands (McFarland and Bruce, 2006). The Yorktown-Eastover aquifer is overlain across most of its extent by the Yorktown confining zone; however, in locally incised areas along rivers where it outcrops on steep slopes, the Yorktown-Eastover aquifer usually is covered by sediments of the surficial aquifer.
The Yorktown-Eastover aquifer is hydraulically continuous on a regional scale but can exhibit local discontinuities as the result of interbedded fine-grained sediments. The “Yorktown-Eastover aquifer system” of the Virginia Eastern Shore has been subdivided to include separate upper, middle, and lower confined aquifers that are each overlain by corresponding confining units (Sanford and others, 2009; McFarland and Beach, 2019). Furthermore, sediments in buried paleochannels cutting through the Yorktown-Eastover aquifer system have been recently designated as upper and lower paleochannel aquifers separated by a paleochannel confining unit (McFarland and Beach, 2019). For the purposes of this report, subdivisions of the Yorktown-Eastover aquifer system or the associated paleochannel aquifers are generically classified with the Yorktown-Eastover aquifer for better comparison across the Virginia Coastal Plain.
Because it is a shallow aquifer with high-quality water, the Yorktown-Eastover aquifer is a major source for private-domestic water supplies, especially in the eastern part of the Virginia Coastal Plain (Pope and others, 2008).
1.3.3. St. Marys Aquifer
The St. Marys aquifer consists of two separate areas. The northern part of the St. Marys aquifer is composed of Miocene marine sands and shells ranging in thickness from 150 to 200 ft and covers most of the Virginia Eastern Shore (McFarland and Bruce, 2006). The southern part of the St. Marys aquifer, mostly in the City of Suffolk, includes a coarse-grained basal deposit of silty, glauconitic, phosphatic, and micaceous quartz sands and fossil shells approximately 50 ft thick (McFarland and Bruce, 2006). The southern part of the St. Marys aquifer is a marginal water-production aquifer, and the northern part contains brackish water (Pope and others, 2008). Because the St. Marys aquifer has a limited regional extent overlying the Calvert confining unit, it is not shown in figure 3.
1.3.4. Piney Point Aquifer
The Piney Point aquifer extends across most of the Virginia Coastal Plain, except in the southern part near the Fall Zone (fig. 3). The Piney Point aquifer is composed of a closely associated group of several geologic formations, consisting generally of marine, medium- to coarse-grained, glauconitic, phosphatic, variably calcified, and fossiliferous quartz sands up to 150 ft thick (McFarland and Bruce, 2006). The Piney Point aquifer is a moderately used groundwater resource in the central sections of the Northern Neck Peninsula, Middle Peninsula, and York-James Peninsula, where withdrawals are primarily from a section of the aquifer identified by McFarland (2017) as consolidated limestone. The Piney Point aquifer is not considered a productive aquifer south of the James River (Pope and others, 2008).
1.3.5. Aquia Aquifer
The Aquia aquifer extends across much of the Virginia Coastal Plain except in the most eastern and southern areas (fig. 3). The Aquia aquifer consists of marine, medium- to coarse-grained, glauconitic, and fossiliferous quartz sands and is generally no more than 50 ft thick (McFarland and Bruce, 2006). The Aquia is a minor water-supply resource, used most heavily in the northern and central part of the Virginia Coastal Plain, possibly because of its thinness relative to other aquifers (Pope and others, 2008).
1.3.6. Peedee Aquifer
The Peedee aquifer is composed of discontinuous fine-grained sediments interbedded with coarse-grained sediments that overlay the Virginia Beach confining zone. The extent of the Peedee aquifer is limited to the southern parts of the Cities of Chesapeake and Virginia Beach, and it is never more than several tens of feet thick. Though it may be locally important as a pathway for groundwater flow, the Peedee aquifer is thought to be unused as a source of groundwater in Virginia (McFarland and Bruce, 2006). Consequently, this aquifer is not shown in figure 3, and it is not discussed further in this report.
1.3.7. Virginia Beach Aquifer
The Virginia Beach aquifer consists of primarily fluvial-deltaic and variably textured quartz sands and gravels attaining thicknesses up to 70 ft (McFarland and Bruce, 2006). Of limited regional extent and not shown in figure 3, the Virginia Beach aquifer extends across most of Virginia Beach, westward across Chesapeake and Suffolk, and into the southeastern corner of Southampton County. The Virginia Beach aquifer is a hydraulically continuous unit and provides water supplies mostly in the City of Suffolk (Pope and others, 2008).
1.3.8. Potomac Aquifer
The Potomac aquifer overlies the basement and occupies the lowermost position in the hydrogeologic system (fig. 3). This aquifer extends across nearly the entire Virginia Coastal Plain, except for the Chesapeake Bay impact crater (fig. 1), and is overlain by the Potomac confining zone across most of its extent, except for incised areas along major river channels and near the Fall Zone. In these areas, the Potomac aquifer may outcrop but is usually covered by sediments of the surficial aquifer, possibly providing direct hydraulic connections between the confined and unconfined systems (Pope and others, 2008).
The Potomac aquifer is the thickest aquifer in the Virginia Coastal Plain aquifer system and ranges in thickness from a thin edge near the Fall Zone to several thousand feet at the coast. The Potomac aquifer consists primarily of fluvial-deltaic coarse-grained quartz and feldspar sands and gravels (McFarland and Bruce, 2006). The Potomac aquifer is hydraulically continuous on a regional scale, but its composition is heterogeneous, and fine-grained clay interbeds may impede groundwater flow locally (Pope and others, 2008).
The hydrogeologic framework of the larger Northern Atlantic Coastal Plain aquifer system (Masterson and others, 2016) has divided the Potomac aquifer into the Potomac-Patapsco and Potomac-Patuxent aquifers in the vicinity of and north of the Maryland state line. Although this division likely continues into the northernmost portions of the Virginia Coastal Plain, insufficient borehole data exist to explicitly define the extent and thickness of the intervening confining unit south of the Potomac River before the two aquifers, as described in Maryland, merge into a single undivided Potomac aquifer across most of the Virginia Coastal Plain (McFarland, 2013). For continuity with previous Virginia Coastal Plain hydrogeologic investigations and current VDEQ regulations, this report will treat the Potomac aquifer as a single unit.
The Potomac aquifer is the largest and most heavily used source of groundwater in the Virginia Coastal Plain. Decreasing water levels in Potomac aquifer wells in recent decades have caused concern about additional withdrawals from this aquifer in areas where it is heavily used, especially in growing metropolitan areas of the southeastern Virginia Coastal Plain, but withdrawals and groundwater levels have stabilized since about 2010 (U.S. Geological Survey, 2023b).
2. Distribution of Private-Domestic Wells Among Virginia Coastal Plain Aquifers
Groundwater-well data availability impeded the investigation by Pope and others (2008) into the distribution of private-domestic well withdrawals from the aquifers of the Virginia Coastal Plain. Well locations, obtained from paper records, were only known at the locality scale, requiring the use of generalized representations of land-surface elevation and hydrogeologic information to estimate the aquifer used by each well. More recent efforts by State agencies to improve and digitize Virginia well-construction information and by Masterson and others (2016) to model the Northern Atlantic Coastal Plain aquifer system (which includes the Virginia Coastal Plain) presented an opportunity to refine the estimates from Pope and others (2008) and establish a more efficient and repeatable methodology.
2.1. Study Methods
Electronic private-domestic well-completion records from Virginia Coastal Plain localities were obtained from the Virginia Department of Health (VDH) Environmental Health Database, the successor to the Virginia Environmental Information System (M. Senseman, Virginia Department of Health, written commun., 2021). Coordinate locations provided by the VDH for these wells were derived from the Virginia Geographic Information Network (VGIN) Composite Geocoding Service using the North American Datum of 1983 (NAD 83; Virginia Department of Emergency Management, 2013). VDH well records without VGIN geocoding were processed with the Esri ArcGIS World Geocoding Service (Esri Inc., 2023) and projected using NAD 83. Many of the VDH well records were “location only” and therefore lacked data on well or screen depth. Of the 100,930 well records provided by the VDH, 4,884 (4.8 percent) had usable location and well or screen depth information.
Additional electronic well-completion records from Virginia Coastal Plain localities were obtained from the VDEQ Groundwater Characterization Program (T.S. Bruce, Virginia Department of Environmental Quality, written commun., 2019). VDEQ well records were filtered by “domestic” or “household” use categories to identify private-domestic wells. Well coordinates were provided using NAD 83. The source of coordinate data was an included field of the well construction record, indicating use of GPS or map interpolation, but most of the records were reported without this information. From 3,555 VDEQ private-domestic well construction records, 3,401 (97 percent) had usable location and well or screen depth information. Twenty-one duplicate well records shared by the VDH and the VDEQ were removed before combining the agencies’ data into a common dataset with location and well or screen depth information for 8,264 private-domestic wells in the Virginia Coastal Plain.
Elevations for the land surface and subsurface hydrogeologic layers at each well coordinate were obtained by extracting raster values from a Digital Elevation Model (DEM; 100 ft grid cells) and the digital representation of the individual aquifers within the Northern Atlantic Coastal Plain aquifer system (1/2-mile grid cells; Pope and others, 2016) using ArcGIS Pro (Esri Inc., 2023). Ladd and others’ (2024) hydrogeologic framework (125-meter grid cells) was used for wells in the Virginia Eastern Shore. A script was written in the statistical programming language “R” to compute the well-screen elevation using the DEM land-surface elevation and screen depth (R Core Team, 2023). For wells without screen depth information, the well depth or hole depth was assumed equivalent to the screen depth. Where well construction records indicated multiple well screens (44 records), the bottom of the bottommost screen was used (greatest depth). The well-screen elevation was compared to the aquifer elevations in a scripted series of logical expressions to estimate the aquifer intersected by each well (fig. 4).

Conceptual diagram illustrating the relationship among well depth, screen depth, land-surface elevation, and hydrogeologic unit elevations. Modified from Pope and others (2008).
For any well initially determined to exist in a confining unit (21 percent), the script reassigned the well to the nearest available aquifer above or below that confining layer using the absolute value of the elevation differences. Complex hydrogeology (for example, two confining units adjacent to each other without an aquifer in between) confounded the scripted logic and 261 well records were flagged for manual review and corrected to the nearest aquifer. A well located in the confining unit could be an error related to the 1/2-mile resolution of the hydrogeologic information; an error in either coordinate, screen, or well-depth information; or poor well-screen placement. However, local-scale geologic variability, including potential heterogeneity in the confining unit itself, could allow a well drilled in the confining unit to yield adequate water (Pope and others, 2008). For the purposes of this study, all wells were assumed to utilize the known aquifers.
The method used to estimate the distribution of private-domestic wells among Virginia Coastal Plain aquifers is summarized in figure 5.
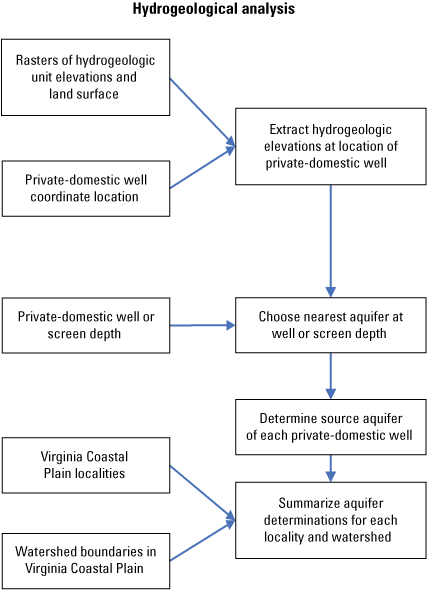
Flow chart summarizing the method used to estimate the distribution of private-domestic wells among Virginia Coastal Plain aquifers.
2.2. Discussion of Results
The basic distribution of domestic well aquifer utilization in the Virginia Coastal Plain matches current understanding of aquifer extent, characterization, and yield (fig. 6). Shallow wells in either the surficial aquifer or the basement predominate in the northern and western extremes of the Virginia Coastal Plain near the Fall Zone. Deeper aquifers, particularly the Potomac aquifer, are used throughout the central portion of the Virginia Coastal Plain. In the south and east near the mouth of the Chesapeake Bay and along the Atlantic coast, use of shallower aquifers like the Yorktown-Eastover and surficial aquifers is more prevalent because the deeper aquifers become brackish.
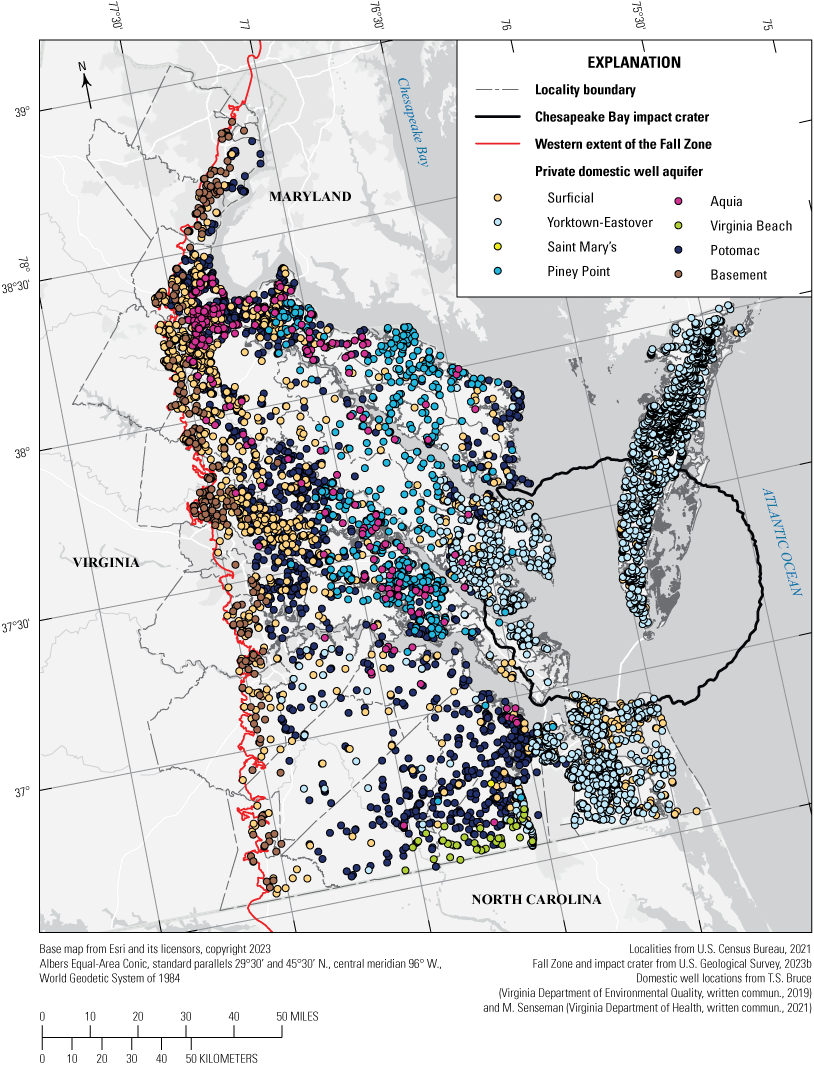
Map showing the locations and aquifer designations of 8,264 private-domestic wells within the Virginia Coastal Plain.
Overall, as shown in table 2, available well records suggest that the greatest domestic use occurs in the Yorktown-Eastover aquifer (35 percent), followed closely by the Potomac aquifer (31 percent). The surficial aquifer accounts for 21 percent of the aquifer distribution, with the remaining 6 aquifers and the basement combined for the final 13 percent of the domestic use. Despite the use of more generalized well and hydrogeologic information in Pope and others (2008), the private-domestic well aquifer distribution using the revised method in this report corroborates many of the findings of the previous effort. The most substantial differences exist with the smallest aquifers, especially the Aquia aquifer, because the generalization techniques of 2008 likely assumed a larger aquifer extent or thickness than those digitally modeled by Pope and others (2016). The difference in basement wells in the two analyses is due primarily to the exclusion of certain counties in the northern and western extremes of the Virginia Coastal Plain by Pope and others (2008).
Table 2.
Aquifer distribution from analysis of 8,264 private-domestic well records in the Virginia Coastal Plain, with comparison to the distribution reported by Pope and others (2008) from analysis of 2,846 private-domestic well records.With 8,264 location-specific data points, including the estimated aquifer assignment of each well, aggregation of aquifer utilization can occur on various spatial scales and with different boundary datasets, including Virginia Coastal Plain localities (table 3). The USGS Watershed Boundary Dataset (U.S. Geological Survey, 2023a), includes watersheds of various nested sizes defined by nested hydrologic units that may provide another useful spatial context for groundwater withdrawals, particularly for hydrologic modeling or water budgets. Appendix 1 contains aquifer distribution by watershed at the 8-digit hydrologic unit code (HUC8) scale and appendix 2 contains aquifer distribution by watershed at the 10-digit hydrologic unit code (HUC10) scale.
Caution is advised when using these aggregation results. As spatial units become smaller, fewer wells exist in each unit, approaching the limits of representative aggregation and increasing uncertainty. Furthermore, because geopolitical or watershed boundaries do not necessarily align with hydrogeologic ones, comparisons from one scale to another are difficult to make. For example, while a certain percentage of a locality’s total number of wells may be in the basement, the use of that hydrogeologic unit declines rapidly eastward of the Fall Zone.
Tabular data of the aquifer distribution of private-domestic wells for the Virginia Coastal Plain at both the county- and watershed-scale are available as a USGS data release in Kearns and Pope (2025).
Table 3.
Aquifer distribution by locality from analysis of 8,264 private-domestic well records in the Virginia Coastal Plain.[FIPS, Federal Information Processing Standard]
2.3. Assumptions and Limitations
The primary limitation of the aquifer distribution analysis is the quality and availability of the electronic private-domestic well data from the VDH and the VDEQ. These data are derived from Water Well Completion Reports submitted to the VDH and the VDEQ. The availability, quality, and variability of electronic well-completion records represents change in reporting requirements, data entry, and data management over time, as well as the different, and sometimes overlapping, authorities of the VDH and the VDEQ over private-domestic wells in the Virginia Coastal Plain (B. Campbell, Virginia Department of Environmental Quality, written commun., 2024).
A further limitation is whether these electronic well-completion records are representative of the actual distribution of aquifer use. The electronic well-completion records used in this analysis were not systematically sampled but compiled from available sources. This methodology introduces uncertainty while also increasing the sample size nearly three times over the number of paper well records reviewed by Pope and others (2008). The 8,264 electronic well records in this analysis represent approximately 4 percent of the estimated 200,000 private-domestic wells in the Virginia Coastal Plain (Pope and others, 2008). A sample of this size is adequate to statistically represent the population with a margin of error of about 1 percent with a standard 95-percent confidence interval. Although the computed numerical sampling error is small, the other potential sources of uncertainty discussed here are difficult to quantify and likely vary spatially across the study area.
The methods in this report inherit any error or bias present in the electronic well-completion records. Small coordinate errors, in either measurement or data entry, that incorrectly place the well elsewhere in the Virginia Coastal Plain are difficult to detect, and records using geocoding for coordinates are less precise than coordinate measurements made at the well. Horizonal datum and method of coordinate determination were seldom recorded; NAD 83 was assumed in these instances. One potentially significant source of bias could be the age of the well records; for example, a bias towards modern wells having electronic records. Unfortunately, the inconsistent format used for data entry of the “date” field in the well records prevented machine-readable import and manual entry1 of that variable and any analysis of a temporal trend or bias in the data. Additionally, some well records could be for out-of-service private-domestic wells, particularly in the Cities of Norfolk and Chesapeake or in other areas with rapidly expanding public water system (PWS) service areas.
The order and number of digits used for the year, month, and day of the “date” field in well records was inconsistent. For example, 193009 in the “date” field could refer to 09/1930 or 09/30/2019.
General private-domestic well data availability was also a limiting factor, with unequal sample size across Virginia Coastal Plain localities. Sparse coverage of well records in the southwest corner of the Virginia Coastal Plain and areas with a larger portion of public supply water use results in some localities or watersheds with few records and thus, higher uncertainty in the aquifer distribution. Nine counties had fewer wells included in this revised aquifer analysis than the one completed by Pope and others (2008) using paper records. Conversely, an abundance of electronic well records from the Virginia Eastern Shore, which lacks aquifers deeper than the Yorktown-Eastover aquifer, potentially skews overall aquifer source distribution of the Virginia Coastal Plain. Aquifer distributions might also vary significantly within a locality, depending on the scale of analysis and complexity of local hydrogeology. For example, although localities in the west of the Virginia Coastal Plain may have an overall percentage of wells in the basement, the likelihood of basement wells decreases rapidly with distance east of the Fall Zone.
Finally, there is the limitation of the current hydrogeologic framework of the Virginia Coastal Plain. As a subset of the digital model for the greater Northern Atlantic Coastal Plain (Pope and others, 2016), Virginia Coastal Plain aquifer characterization is available in 1/2-mile grid cells. This resolution supports the analysis of general aquifer-utilization patterns across a region; however, variability in hydrogeology or other unique, localized conditions could lead to discrepancies at finer scales. Contemporary understanding of the aquifers of the Virginia Coastal Plain suggests small heterogeneities and discontinuities are present in many of the aquifers. However, the overall similarities in the well distribution between this report and the previous efforts of Pope and others (2008) using different methods and data suggests a relative insensitivity of general private-domestic well patterns to minor variations. Such similarities may also retroactively confirm the assumptions and generalizations made by Pope and others (2008) in adapting the hydrogeologic framework at the locality scale for the low-relief topography and hydrogeology of the Virginia Coastal Plain.
3. Spatial Distribution of Self-Supplied Domestic Population Across the Virginia Coastal Plain
Rather than attempting to pinpoint all private-domestic wells across the Virginia Coastal Plain, the distribution of the self-supplied domestic population was estimated at a high spatial resolution to approximate both the location and the demand for groundwater use. This high-resolution spatial-estimation is a two-step process: first, estimate how many people use private-domestic wells—the self-supplied domestic population—in a given area, then estimate the distribution of that population across the same area.
Self-supplied domestic population estimates were derived from estimates of private-domestic well use at the 2020 census-block scale by Murray and others (2021, 2023). Their approach builds off data collected by the 1990 “long-form” census, which asked respondents about their home water source; it remains one of the primary sources for domestic water-use information (Johnson and Belitz, 2017; Johnson and others, 2019; Murray and others, 202125). However, water-use information from the 1990 census was aggregated to the “block group,” a coarse geographical scale with an average area of 8 square miles (Manson and others, 2023). Murray and others (2021, 2023) estimated the number of wells in each 2020 census block (average area of 0.24 square miles) using the 1990 census-block group survey, census-block crosswalk tables, housing density weighting, a machine-learning decision tree, and a reclassification technique to eliminate “islands” of private water use within a larger PWS service area.
Because the exact location of private wells across a given area is rarely known with certainty, various techniques have been used to model the distribution of the private-domestic population. Consider the hypothetical census block in figure 7A. The simplest method is to distribute population uniformly across a census unit (block group or block), as used in national-scale models by Johnson and Belitz (2017), Johnson and others (2019), and Murray and others (2021) (fig. 7B). However, when modeling or decision-making needs require population information at sub-census-block scales, or when aggregation zones (watersheds, model cells, and so on) cross census-block boundaries, the assumptions of a uniform population distribution models become limiting. The road network was used by Pope and others (2008), Johnson and Belitz (2017), and Johnson and others (2019) to constrain the distribution of population within a census block to the area most likely to contain residences. Although this represents an improvement over more uniform distribution techniques, “road network” distribution models begin to break down at the smallest spatial scales by, for example, placing population uniformly along a rural road through uninhabited forest or farmland (fig. 7C). This study improves upon the road-based self-supplied domestic population distribution model from Pope and others (2008) by using high-resolution data for building footprints and developed land cover (fig. 7D), techniques similarly explored by Wu and others (2008), Sleeter (2008), and Johnson and others (2021).

Conceptual figure highlighting the resolution and concentration of various spatial disaggregation techniques applied to a hypothetical census block with 100 persons and 100 model cells: A, the houses and roads of a hypothetical census block, B, a uniform population distribution using all 100 model cells, C, simulated population distribution using linear feet of road in 32 of the model cells, and D, simulated population distribution using building density in 14 of the model cells.
3.1. Study Methods
The 2020 census-block population, housing, and geospatial data for Virginia were downloaded from the TIGER line dataset published by the U.S. Census Bureau (2021). The ratio of households using private-domestic wells in each census block was determined by dividing the 2020 estimated well count from Murray and others (2023) by the 2020 census housing-unit count. This well-use ratio was then multiplied by the 2020 census-block population and rounded to the nearest whole person to estimate the self-supplied domestic population in each census block. Estimates for the 2010 self-supplied domestic population and number of wells, used for comparison to previously published USGS estimates, were obtained by weighting the 2010 census block population and housing-unit counts to 2020 census block geographies using National Historic Geographic Information System (NHGIS) crosswalk tables (Manson and others, 2023), multiplying each by the 2020 well-use ratio, and rounding to the nearest whole number.
The primary dataset used for the spatially weighted estimated distribution of self-supplied domestic population was a 2018 building footprint sum analysis at 30-meter resolution, available for each state in the conterminous United States, by Heris and others (2020). For example, a 30-meter cell that was 50-percent covered by building footprints would have a cell value of 450 square meters. The building footprint dataset for Virginia (Heris and others, 2020) was re-projected in ArcGIS Pro to match the grid of the 2019 National Land Cover Database (Dewitz, 2021). A “Zonal Statistics” ArcGIS Pro tool was used to calculate the total building footprint area from all 30-meter cells within each 2020 census block (Esri Inc., 2023). The previously estimated self-supplied domestic population for each census block was divided by this total building footprint area, to derive a density value of the estimated self-supplied domestic population per square meter of building footprint. Using the “Polygon to Raster” and “Raster Calculator” ArcGIS Pro tools (Esri Inc., 2023), the density values unique to each 2020 census block were converted to a raster format and multiplied by the sum value of each cell in the building footprint dataset. This operation converts the density value into a number representing the estimated self-supplied domestic population for each 30-meter building footprint cell within any given census block.
Because of errors in either census or building footprint data, 2 percent of 2020 census blocks had a self-supplied domestic population greater than zero where no building footprints were identified. For these census blocks, the 2019 National Land Cover Database (NLCD; Dewitz, 2021) was used as an alternate data source. The NLCD includes a developed cell classification generally defined by the percentage of impervious surface cover (Dewitz, 2021). Although impervious features other than residential housing (including roads, parking lots, or commercial and industrial structures) make the NLCD less desirable for spatially distributing the self-supplied domestic population, the wider categorization ensures fewer census blocks are omitted from the analysis. The 30-meter cells classified as high-, medium-, and low-intensity developed were extracted from the NLCD and converted to a raster value of 900, 600, and 300, respectively. This conversion approximated square-meter values from the Heris and others (2020) building footprint summary dataset based on the percent of impervious cover from the NLCD cell classification. These NLCD-derived proxy values then were totaled for each census block and used in the same density and population conversion operations and calculations as the building footprints.
The final raster analysis combined the self-supplied domestic population estimated from the building footprints with the self-supplied domestic population estimated from the NLCD. By combining the estimates, the number of census blocks with a self-supplied domestic population greater than zero but with no identified building footprints or NLCD developed cells decreased to 0.1 percent of 2020 census blocks, representing 0.08 percent of the 2020 self-supplied domestic population. Without a corresponding building footprint or NLCD developed cell within the census block, this small part of the self-supplied domestic population is lost from the analysis. Temporal differences in the estimated population (2020), building footprints (2018), and NLCD (2019) data sources may provide some explanation of this variability, as does the potential of intentional noise or unintentional miscounts in the census data itself (Hill and others, 2022; U.S. Census Bureau, 2022).
Note that the mathematical operations of this disaggregation method will produce non-integer population estimates in each raster cell. The authors recommend that, if any rounding is necessary, it is delayed until raster cells are aggregated to the desired spatial zone or scale. For example, as a quality control check on the disaggregation technique, ArcGIS Pro’s “Zonal Statistics” (Esri Inc., 2023) was used to sum the 30-meter raster of estimated 2020 self-supplied domestic population for each census block in the Virginia Coastal Plain and compare it to the original values calculated from the 2020 census-block population and ratio of well use from Murray and others (2023). Aside from the 0.08 percent population discrepancy for census blocks without qualified building or development land-cover cells previously noted, the results were equivalent.
Self-supplied domestic population estimates were constrained to the Virginia Coastal Plain by extracting only those raster cells within the spatial extent of the Northern Atlantic Coastal Plain (Pope and others, 2016) with the “Extract by Mask” ArcGIS Pro tool (Esri Inc., 2023). The method used to estimate the spatial distribution of the self-supplied domestic population across the Virginia Coastal Plain is summarized in figure 8. Thirty-meter rasters of the estimated self-supplied domestic population of the Virginia Coastal Plain for 2020 and 2010 are available as a USGS data release in Kearns and Pope (2025).
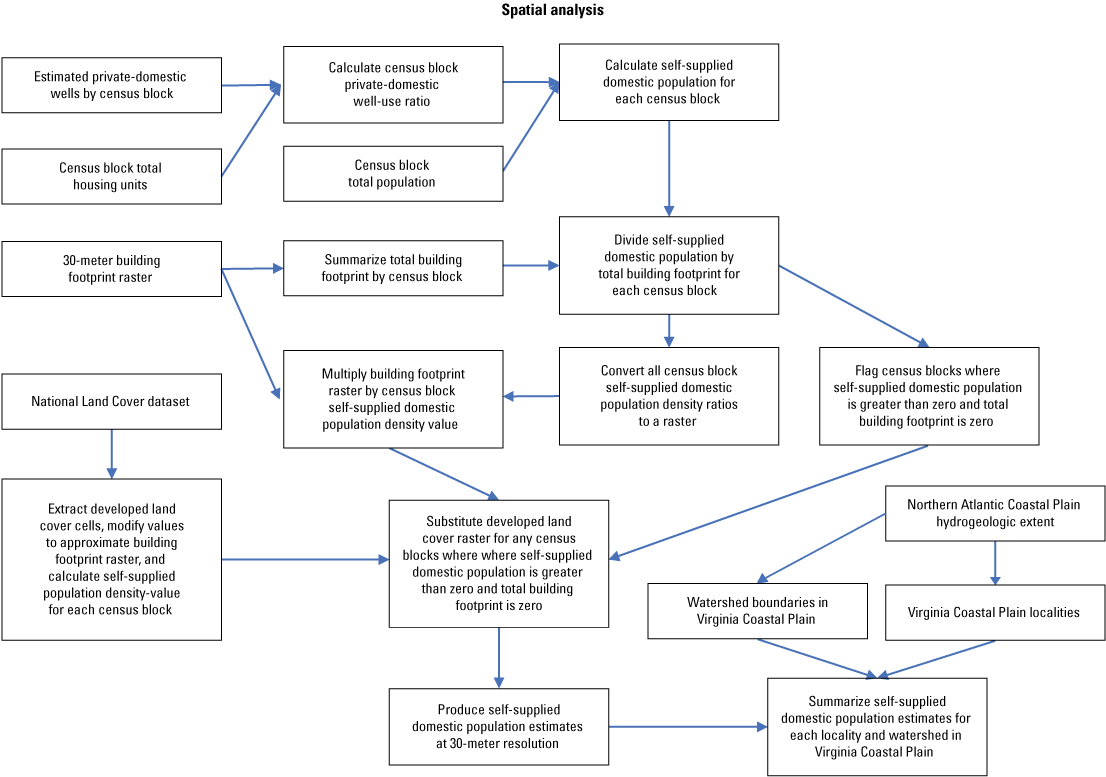
Flow chart summarizing the method used to estimate the spatial distribution of the self-supplied domestic population across the Virginia Coastal Plain. [PWS, public service area]
3.2. Discussion of Results
In 2020, there were an estimated 475,332 people, approximately 12.5 percent of the total population, that depended upon private-domestic wells across the Virginia Coastal Plain.2 Because the 30-meter population raster produced in this analysis has cells too small for practical use as a page-sized figure of the Virginia Coastal Plain in this report, the USGS 1-kilometer National Groundwater Model Grid (Clark and others, 2018) was used to aggregate the data release and is presented in figure 9. This figure indicates that, although the proportion of the population served by private-domestic wells is highest in the most rural areas of the Virginia Coastal Plain, a higher total population shifts the areas of greatest overall self-supplied domestic population to the suburban fringes of the larger cities. Other regions with significant self-supplied domestic population include the Virginia Eastern Shore and the Middle Peninsula.
The total population was estimated from census blocks within the Virginia Coastal Plain.
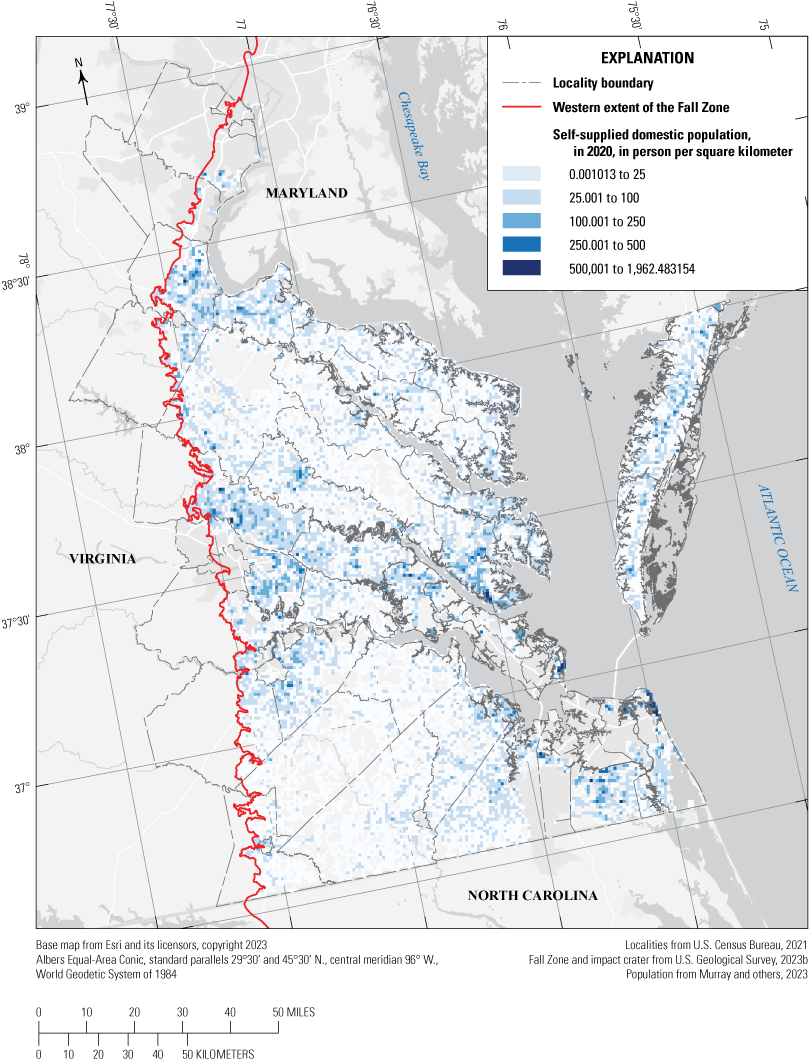
Map showing the Virginia Coastal Plain self-supplied domestic population in 2020, aggregated to a 1-kilometer grid.
The self-supplied domestic population of the Virginia Coastal Plain increased 5.7 percent during the period 2010–20; this increase is slightly less than the total population change of approximately 8 percent (fig. 10; table 4) estimated from census blocks within the Virginia Coastal Plain. The suburban fringe experienced the most self-supplied domestic population growth, and the more rural areas held constant or experienced slight decreases in population. As mentioned in section 3.1, it is critical to note that in the context of this analysis, any change in the self-supplied domestic population from 2010 to 2020 is due solely to changing population dynamics in census blocks dependent upon private-domestic wells. The changes presented here are not due to expansion of PWS service areas over time, and the rate of well use was held constant from 2010 to 2020 using Murray and others (2023).
The spatial disaggregation technique used in this study permits analysis of self-supplied domestic population at scales other than census blocks or county boundaries. Appendix 1 contains an estimate of the 2010 and 2020 self-supplied domestic populations by HUC8 watersheds and appendix 2 contains the 2010 and 2020 self-supplied domestic populations by HUC10 watersheds. Note that because these two different spatial units were rounded to the nearest whole person, totalized self-supplied domestic population values may vary slightly.

Map showing the change in self-supplied domestic population within the Virginia Coastal Plain from 2010 to 2020, aggregated to a 1-kilometer grid.
Table 4.
Estimated self-supplied domestic population within the Virginia Coastal Plain in 2020 and 2010, by locality.[FIPS, Federal Information Processing Standard]
Comparisons to previous self-supplied domestic water-use studies can help ascertain the uncertainty of the estimates in this report. Pope and others (2008) had previously estimated the domestic self-supplied population of the Virginia Coastal Plain to be 514,390 in 2000. However, their 2000 estimate is higher than the 475,332 estimated by this study for 2020, despite the general population growth in the Virginia Coastal Plain in the intervening 20 years, and possibly indicative of even greater uncertainty in the methods or datasets used by Pope and others (2008). Other comparisons are possible using county-level estimates of water use for the Nation, including self-supplied domestic population, published by the USGS every 5 years since 1985; however, a transition in the methodology used at the national level has delayed the release of the 2020 estimates (U.S. Geological Survey, 2024a). Therefore, at the time of publication, estimates made for the 2010 self-supplied domestic population by Maupin and others (2014) and Johnson and others (2019) provide the best opportunity to assess previous results against the analysis of this report (table 5). To compare equivalent population estimates, both Johnson and others (2019) and the results of this analysis were aggregated to the locality level for the 50 localities with all or part of the locality in the Virginia Coastal Plain. In other words, although the population numbers presented in table 4 only include the portion of each locality within the Virginia Coastal Plain, the population numbers in table 5 also include the portions of those localities outside the Virginia Coastal Plain for the sake of comparison.
Table 5.
Comparison of total population and self-supplied domestic populations from multiple sources for 50 localities in the Virginia Coastal Plain in 2010, 2015, and 2020.| Year | Total | Self-supplied domestic | ||
|---|---|---|---|---|
| Population estimate | Source | Population estimate | Source | |
| 2010 | 5,094,692 | U.S. Census Bureau, 2021 | 503,367 | Johnson and others, 2019 |
| 639,112 | Kearns and Pope, 2025 | |||
| 640,509 | Maupin and others, 2014 | |||
| 2015 | 5,373,515 | U.S. Census Bureau, 2021 | 579,121 | Dieter and others, 2018 |
| 2020 | 5,550,819 | U.S. Census Bureau, 2021 | 687,019 | Kearns and Pope, 2025 |
The 2010 estimate of self-supplied domestic population from this analysis closely aligns with that from Maupin and others (2014). It is 27 percent higher than the estimate made by Johnson and others (2019), which was done at a national scale with coarser census-block groups. Direct comparison beyond 2010 is difficult because of the temporal differences in the datasets. However, a relative comparison suggests a ratio of self-supplied domestic population to total population of 12.6 percent in 2010 (Maupin and others, 2014), 10.7 percent in 2015 (Dieter and others, 2018), and 12.4 percent in 2020 from this analysis. Given the reliance on private-domestic well-use data from 1990, the difficulty of obtaining datasets that represent the continued expansions to PWS service areas, and the lower estimates from Dieter and others (2018) and Johnson and others (2019), it is likely that the self-supplied domestic population estimates from this report are toward the upper end of the range of actual private-domestic well use.
3.3. Assumptions and Limitations
One of the primary limitations of self-supplied domestic population estimation is the reliance on the 1990 long-form census. For current high-resolution water-use modeling, this original census-block group dataset is coarse in scale and dated. Thirty years of subsequent development and population growth have undoubtedly altered the private well and public-supply conditions extant during the 1990 census. Housing density thresholds have been explored by Johnson and others (2019) and Murray and others (2021) to account for new development and accompanying expansion of public supply; however, these modeled relations will not precisely hold in every census block. Furthermore, the retroactive application of 2020 census block private-well-use rates to 2010 in this report would capture increases and decreases in the self-supplied domestic population solely from census-block demographic change and not from PWS service area expansions.
Good data on the current extent of PWS service areas could supplement the 1990 long-form census data and other estimates of PWS or private well distribution, including Murray and others (2023). The authors of this report found PWS data within the Virginia Coastal Plain to be inconsistent, available in a patchwork from local governments or PWS, and with substantial variation in data quality, publication date, and update frequency. With a lack of consistent PWS service area data for the entire Virginia Coastal Plain, the decision was made to use nationally available and (or) peer-reviewed datasets for our analysis.
For further analysis at local scales or in the fastest growing areas, the 30-meter raster dataset of 2020 self-supplied domestic population estimates produced by the methodology described in this report could potentially be improved by using geographic information system (GIS) clipping or masking tools to remove the raster cells of self-supplied domestic population within a given spatial boundary dataset of a PWS service area. A PWS service area may contain private-domestic wells, but use of such wells in those areas would likely be greatly reduced. The USGS offers a national-scale estimate of PWS service area boundaries (Buchwald and others, 2022); however, service area proxies, such as municipal political limits, were used in areas of limited data availability, including for PWS in the Virginia Coastal Plain. Therefore, given the spatial and temporal variability of PWS service areas over time, obtaining the most recent GIS files from local authorities likely would prove more accurate. For example, the use of a 2009 GIS file of PWS service areas within the Hampton Roads Planning District Commission (HRPDC; I. Ozmon, Hampton Roads Planning District Commission, written commun., 2024) to extract the 2020 self-supplied domestic population estimated from this analysis described in this report suggested 62,174 people use private-domestic wells within the HRPDC PWS service areas, against a total 2020 population of 1,415,651 (estimated from census blocks within the HRPDC PWS service areas; U.S. Census Bureau, 2021). Within the greater HRPDC PWS service area, the Virginia Beach PWS accounts for the largest share of this potential discrepancy, with an estimated 22,162 self-supplied domestic population within the PWS service area of 434,245 people (approximately 5 percent). It is known that some private-domestic well use is occurring in the Virginia Beach PWS service area, particularly for outdoor water use (Eggleston, 2010); however, it is likely that the water-source data from the 1990 census and subsequent adjustments by Murray and others (2023) are not keeping pace with actual PWS expansion in this area. By applying this example to other fast-growing localities in Virginia Coastal Plain, the authors’ previous conclusion that this analysis likely represents the upper end of the actual self-supplied domestic population is further supported.
Other assumptions and limitations apply to the distribution of the self-supplied domestic population within a census block. The primary dataset used for internal census block disaggregation was the building footprints estimate at 30-meter resolution (Heris and others, 2020). Because this dataset makes no distinction between residential, commercial, industrial, institutional, or auxiliary structures, the method described herein equally distributed any self-supplied domestic population evenly across any building structure footprint within the census block. This does lead to error in “mixed use” census blocks where residential buildings are intertwined with other structures and population is distributed across nonresidential building footprints. However, because each census block has a unique self-supplied domestic population density value, any error within a census block is confined to that block, minimizing the overall impact of any erroneous distribution.
The building footprint dataset from Heris and others (2020) did not identify buildings in approximately 2 percent of census blocks with a population greater than zero. This is due either to an error with the census reporting a population in a block that has none, or an error within the building footprints dataset. The authors of this report noted possible remote sensing errors where isolated linear gaps in the building footprint dataset exist; these errors were most apparent in the Richmond suburbs. Furthermore, the mismatch between the 2018 building footprint dataset and the 2020 census suggests the possibility of new residential construction in certain census blocks that would not show up in the slightly older building footprints. To fill in these data gaps, the 2019 NLCD was chosen to supplement the building footprint dataset because of its national extent and proximate temporal period. However, the NLCD categorization is broader than the building footprint dataset, encompassing all impervious surfaces—including buildings, parking lots, and roads—within the “developed” land-use classification. This broader definition ensures fewer census blocks with a population greater than zero are left without qualifying raster cells for the population density metrics performed in this analysis but would suggest that the self-supplied domestic population within those census blocks are distributed across cells that might not contain only residential structures. However, this tradeoff in using a broader dataset ensures that error of omission is reduced from 2 percent to 0.1 percent of census blocks when the NLCD density analysis is combined with the building footprint density analysis in the final estimate of self-supplied domestic population. The remaining 0.1 percent of census blocks, representing 0.08 percent of the self-supplied domestic population, have no “qualifying” building footprint or NLCD developed raster cells to place the estimated population and are lost in the final raster analysis. Some of this discrepancy could be explained by errors in the 2020 census (such as estimated counts of people in blocks that have zero actual population) or by the statistical noise added by the U.S. Census Bureau to protect individual privacy (Hill and others, 2022; U.S. Census Bureau, 2022).
Although this method for spatial disaggregation is intended to improve the resolution of self-supplied domestic population estimates, as the desired spatial coverage decreases in size (smaller area) the uncertainty of the estimate within proportionally increases. The intent of this data analysis was to support regional groundwater modeling and management efforts with reasonably accurate population and distribution estimates. Groundwater models or other use cases at extremely localized scales would benefit from additional data collection or verification of the estimates herein.
4. Temporal Distribution of Self-Supplied Domestic Withdrawals in the Virginia Coastal Plain
Estimates of the rate and volume of self-supplied domestic water withdrawals are complicated by a lack of actual measurements, or for studies with measured data, limited in spatial and temporal extent (Kenny and Juracek, 2012). Therefore, self-supplied domestic per-capita water-use coefficients are often derived from PWS withdrawals and service area population, assuming similar water use between households with private or public water supply. However, these PWS-derived per-capita water-use coefficients are themselves complicated by poor water-withdrawal delivery data (not all public water goes to domestic customers) and population estimates for the service area. Acknowledging these complications, this analysis uses previously published per-capita water-use coefficients to estimate self-supplied domestic water withdrawals.
Virginia’s domestic water use in 2015 was estimated to be 80 gallons per day (gal/d) per capita by Dieter and others (2018) using both public and private supply data. However, multiple studies across the United States have shown domestic water use to fluctuate seasonally, generally coinciding with increased outdoor water use during the summer growing season (Shaffer, 2009; Kenny and Juracek, 2012). Published ranges indicate seasonal variability between 10 and 25 percent above and below annual averages are common in regions climatically similar to the Virginia Coastal Plain (Shaffer and Runkle, 2007; Shaffer, 2009; Kenny and Juracek, 2012).
Rather than using PWS withdrawal data to estimate monthly per-capita self-supplied domestic water withdrawals directly, the method in this report uses the temporal trend from PWS withdrawal data to disaggregate Virginia’s published annual per-capita water-use coefficient to estimated monthly values.
4.1. Study Methods
This study refines the seasonal variability in domestic water use in the Virginia Coastal Plain with a localized, data-driven approach. Using a fundamental assumption that households on public or private water supply would have similar water-use patterns, monthly water-withdrawal records from 293 PWSs from localities within the Virginia Coastal Plain were obtained from the VDEQ (G. Mahadwar, Virginia Department of Environmental Quality, written commun., 2022) and assessed for temporal variation between 2010 and 2019.
Forty-five of these PWSs were excluded from further analysis because of seasonality-exhibiting outlier behavior, defined in this report as any monthly water use above or below three standard deviations from the mean. PWSs with outlier monthly water use likely serve transient or non-community populations, such as a seasonal campground, that do not represent the water-use patterns of primary residents included within the self-supplied domestic population estimated from census data.
Depending on the community, a large portion of PWS withdrawals could be used for nondomestic (commercial, industrial, and so on) use, lost to leaks in the distribution system, or other factors generally uncharacteristic of private-domestic water use (Kenny and Juracek, 2012). Initial analysis suggested using the aggregate withdrawal for all PWSs would skew any temporal signal in favor of the biggest systems; the four largest PWSs account for more than half of all public-supply withdrawals in the Virginia Coastal Plain. An additional 28 PWSs with an average withdrawal over 1 Mgal/d from 2010 to 2019 were therefore excluded from further analysis to isolate the smaller PWSs (assumed to be the closest match for domestic water use patterns) within the Virginia Coastal Plain. Using 80 gal/d per capita, this 1 Mgal/d threshold would approximate a community of 12,500 or fewer people. The remaining 220 systems, which withdrawal less than 1 Mgal/d, comprise 70 percent of the total number of PWSs in the Virginia Coastal Plain, but only account for 2.5 percent of the total volume of PWS water withdrawal.
For these 220 PWSs within the Virginia Coastal Plain, the cumulative average withdrawal for each month from 2010 to 2019 was divided by the days in each month. The monthly average gallons-per-day withdrawal was compared to the annual average gallons-per-day withdrawal, creating 12 monthly-to-annual water-use ratios. These monthly-to-annual ratios were multiplied by the annual average 80 gal/d per capita water-use established by Dieter and others (2018) to estimate the variation of monthly domestic water use (table 6).
Table 6.
Monthly variation of water withdrawal for 220 small public water systems (PWSs) in Virginia Coastal Plain, 2010–19, applied to annual self-supplied domestic water-use estimate of 80 gallons per day (gal/d) per capita.[A small PWS withdrawals less than 1 million gallons per day (Mgal/d), on average. WD, withdrawal; n.d., no data]
The method used to estimate the temporal distribution of self-supplied domestic water withdrawals in the Virginia Coastal Plain is summarized in the flow chart of figure 11.

Flow chart summarizing the method used to estimate the temporal distribution of self-supplied domestic water withdrawals in the Virginia Coastal Plain.
4.2. Discussion of Results
Applying Dieter and others’ (2018) annual estimate of 80 gal/d per capita to the monthly variability of PWS withdrawals in the Virginia Coastal Plain suggests domestic water use ranges from 72 to 93 gal/d per capita over the course of a year. The general temporal variability suggests withdrawals from June to August are 12 percent higher than the annual average, and withdrawals from December to March are 8 percent lower than the annual average (fig. 12). This range is within the seasonal variability of self-supplied domestic water withdrawals from other studies in regions climatically similar to the Virginia Coastal Plain (Shaffer and Runkle, 2007; Shaffer, 2009; Kenny and Juracek, 2012).
Although the confined aquifers of the Virginia Coastal Plain are not affected by seasonal changes in groundwater recharge and availability, approximately 20 percent of private-domestic wells are screened in the surficial aquifer, as discussed in section 2.2 of this report. The higher rate of self-supplied domestic water withdrawal in summer coincides with elevated groundwater withdrawal from other uses (like irrigation) and lower groundwater recharge, driven by increased evapotranspiration. This seasonal mismatch in groundwater demand and supply from the surficial aquifer may strain resources during dry seasons or droughts, as the elevated summer withdrawal comes at a time when demand upon groundwater resources is highest.
It is critical to note that the VDEQ PWS water-withdrawal data were not used to directly revise quantitative estimates of annual or monthly per-capita water-use metrics. Only the monthly temporal variation of the PWS withdrawal above or below the annual average, a dimensionless ratio, was applied to previously published annual water-use estimates to disaggregate the annual value for use in monthly estimates for water-use modeling or other purposes. Therefore, these monthly ratios could be similarly applied to disaggregate previous or future annual water-use estimates. Tabular data of the monthly ratios and estimated monthly self-supplied domestic water withdrawal for the Virginia Coastal Plain are available as a USGS data release in Kearns and Pope (2025).
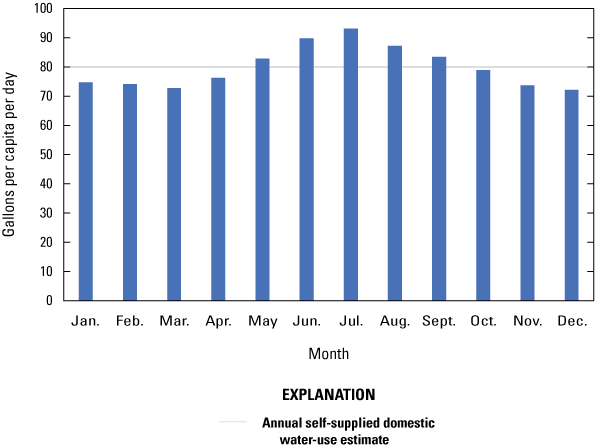
Bar graph showing the monthly variation of water withdrawals for 220 public water systems in the Virginia Coastal Plain from 2010 to 2019 applied to Dieter and others’ (2018) annual self-supplied domestic water-use estimate of 80 gallons per day per capita.
4.3. Assumptions and Limitations
Because self-supplied domestic water withdrawals are rarely metered or reported, USGS estimates have typically used a coefficient-based approach, multiplying an estimate of the self-supplied domestic population by an estimate of daily per-capita water use. These coefficients are averages often derived from population estimates in areas served by public supply and a general representation of the numerous ways water is used indoors and outdoors at private residences (Dieter and others, 2018). By applying a single, average value for all self-supplied domestic water use across the Virginia Coastal Plain, the greatest uncertainty will exist at the smallest scales, at which localized conditions or factors may cause deviation from the mean. As one example, the extent of outdoor water use in Virginia Beach previously documented by Eggleston (2010) may not be sufficiently represented by Virginia’s average of 80 gal/d per capita for domestic water use estimated by Dieter and others (2018) and used in this report.
Previous research by Kenny and Juracek (2012) suggests there are many demographic and socioeconomic variables that correlate with domestic water use, including population age, housing density, housing stock age, and income level. These variables may be proxies for conditions with a direct impact on water use, including the use of water-saving appliances in the home and the presence and extent of outdoor irrigation. The complexity, variability, and availability of these demographic or socioeconomic variables makes refining self-supplied domestic water-use estimates with this information beyond the scope of this report. However, the USGS has a national effort underway to use large machine-learning models to further refine self-supplied domestic water-use estimates (U.S. Geological Survey, 2024a).
5. Estimated Self-Supplied Domestic Water Withdrawal in the Virginia Coastal Plain
The component results from sections 2, 3, and 4 of this report can be combined to produce an estimate of the total self-supplied domestic water withdrawal in the Virginia Coastal Plain with respect to source aquifer proportions, population distribution, and temporal period. Table 7 contains self-supplied domestic water withdrawal estimates aggregated by locality, using the average annual estimate of 80 gal/d per capita (Dieter and others, 2018). However, information elsewhere in this report and the associated data release (Kearns and Pope, 2025) would permit analysis at other spatial scales, including HUC8 or HUC10 watersheds, and at monthly timesteps.
Table 7.
Estimated self-supplied domestic water withdrawal in the Virginia Coastal Plain in 2020, by aquifer and locality, in million gallons per day, using an annual average of 80 gallons per day per capita.[FIPS, Federal Information Processing Standard, Mgal/d, million gallons per day. Units of estimated withdrawal values are in million gallons per day]
The aquifer subtotals of the estimated self-supplied domestic water withdrawal indicate the relative importance of the Potomac, Yorktown-Eastover, and surficial aquifers. Combined, these three aquifers account for 80 percent of the total withdrawal. The total estimated self-supplied domestic water withdrawal of nearly 38 million gallons per day (annual average) for the Virginia Coastal Plain is similar to that found by Pope and others (2008). However, that similarity masks the complexity of comparing numbers or values generated from different methods and assumptions. In section 3, the estimated self-supplied domestic population used by Pope and others (2008) for the year 2000 was determined to be higher than the estimated self-supplied domestic population for 2020 using the methods in this report. The similarity in the overall estimated water withdrawal is because of the use of the per-capita water-use estimate (75 gal/d per capita) available at the time of publication in Pope and others (2008), which was lower than that used in this study (80 gal/d per capita). This difference highlights some of the uncertainty in the per-capita water use coefficient approach: a small change can have a substantial impact at larger scales and aggregate calculations use multiple variables that can change over time or area. Furthermore, this difference suggests that population changes do not necessarily generate directly proportional changes in overall water use. More or less per-capita water use can either offset or compound changes in population size and the subsequent water withdrawal.
The combination of these component results into aggregate self-supplied domestic water withdrawal estimates for the Virginia Coastal Plain carries forward all the assumptions, limitations, and potential error sources of each component method, data, and result. The selection of the spatial units for any aggregation will have considerable impact on the resulting water withdrawal estimate. One would get an entirely different result for self-supplied domestic water withdrawal by multiplying the total self-supplied domestic population (table 4) by the overall aquifer distribution within the entire Virginia Coastal Plain (table 2) and the 80 gal/d per capita annual average. This discrepancy exists because the population using private domestic wells is not uniformly distributed, the use of specific aquifers varies geographically, and the spatial distribution of available well records does not correspond to the population distribution. Therefore, it is appropriate to compute withdrawal estimates only at scales for which well data and population can be more closely aligned. The authors recommend computing overall self-supplied domestic water withdrawal estimates at smaller spatial scales, such as the localities presented in table 7, and then aggregating subtotals from these smaller units if more generalized totals are required. This small-scale to large-scale approach better leverages the strengths of the high-resolution analysis of this report compared to previous estimation methods. However, this approach is not without its own shortcomings because some spatial areas or localities, such as Petersburg, have an indicated self-supplied domestic population but no corresponding well records with which to distribute water use among the aquifers of the Virginia Coastal Plain, removing that (small) population from the total water use calculation.
6. Summary
Self-supplied domestic water withdrawals account for a substantial portion of the total fresh groundwater withdrawal in the Virginia Coastal Plain Physiographic Province (henceforth called “Virginia Coastal Plain”). Continuous improvement to the techniques used to estimate the hydrogeologic source, location, magnitude, and timing of these withdrawals are needed to fill in gaps from limited data on private-domestic wells. This report builds upon the foundation from previous investigations and presents revised methodologies that incorporate recent improvements in electronic well records, hydrogeologic modeling, high-resolution land-use and land-cover data, and census block well-count estimates.
The aquifer distribution of self-supplied domestic water withdrawals from groundwater throughout the Virginia Coastal Plain was modeled using well-construction information from the Virginia Department of Environmental Quality and the Virginia Department of Health cross-referenced to a digital model of the Virginia Coastal Plain hydrogeologic framework. The specific location and depth information in the well-construction databases and hydrogeologic model is more detailed than the county-level aggregate statistics used to estimate source-aquifer distribution by Pope and others (2008). Our analysis highlights regional patterns in aquifer use consistent with current geologic understanding of aquifer extent, water quality, and yield. The Yorktown-Eastover, surficial, and Potomac aquifers are the most important water sources for private-domestic wells, accounting for an estimated 80 percent of total self-supplied domestic water use.
The location of private-domestic wells across the Virginia Coastal Plain was approximated with a high-resolution estimate of the self-supplied domestic population. Population and well-use estimates from 2020 census blocks were disaggregated into a raster-based population dataset using building footprints and land-use and land-cover data. In contrast, Pope and others (2008) used methods that distributed population along the road network but could not distinguish between roads through developed areas and roads through unpopulated fields or forests. This revised method reduces the total area of population distribution, reducing the low-density spread of water use across a larger area, and concentrating the private self-supplied domestic population and its corresponding water use in the areas it is most likely to exist. Our results show the greatest concentration of self-supplied domestic population in the suburbs surrounding the larger cities of the Virginia Coastal Plain, and overall growth in the self-supplied domestic population of 7.5 percent since 2010.
The quantity of water used by the self-supplied domestic population was estimated with published state per-capita statistics, modified by seasonal variability in water withdrawals from trends in local public water-supply withdrawals. Local analysis matches previously published results in the eastern United States, suggesting higher amounts of water use June through August and correspondingly lower water use December through March. This increased summer water use coincides with a general decrease in water availability because of higher evapotranspiration. Although the confined aquifers of the Virginia Coastal Plain are largely insulated from seasonal fluctuation, availability of water resources could be a concern for the fraction of private-domestic wells (20 percent) in the surficial aquifer.
Results in this report confirm many of the general trends and findings in Pope and others (2008) with updated methodologies that leverage advances in data availability to increase resolution geologically, spatially, and temporally. The combination of source aquifer proportions, self-supplied domestic population distribution, and monthly quantity of per-capita domestic water use in this report can be used to simulate private-domestic wells at various resolutions, supporting water-resource managers and future groundwater modeling efforts.
References Cited
Buchwald, C.A., Houston, N.A., Stewart, J.S., York, B.C., and Valseth, K.J., 2022, Public-supply water service areas within the conterminous United States, 2017: U.S. Geological Survey data release, accessed August 22, 2024, at https://doi.org/10.5066/P9I22Z24.
Clark, B., Barlow, P., Peterson, S., Hughes, J., Reeves, H., and Viger, R., 2018, National-scale grid to support regional groundwater availability studies and a national hydrogeologic framework: U.S. Geological Survey data release, accessed August 10, 2023, at https://doi.org/10.5066/F7P84B24.
Dewitz, J., 2021, National Land Cover Database (NLCD) 2019 products: U.S. Geological Survey data release, accessed August 10, 2023, at https://doi.org/10.5066/P9KZCM54.
Dieter, C.A., Maupin, M.A., Caldwell, R.R., Harris, M.A., Ivahnenko, T.I., Lovelace, J.K., Barber, N.L., and Linsey, K.S., 2018, Estimated use of water in the United States in 2015: U.S. Geological Survey Circular 1441, 65 p., accessed August 9, 2021, at https://doi.org/10.3133/cir1441.
Eggleston, J.R., 2010, Outdoor water use and water conservation opportunities in Virginia Beach, Virginia: U.S. Geological Survey Fact Sheet 2010–3007, 2 p. [Also available online at https://doi.org/10.3133/fs20103007.]
Esri Inc., 2023, ArcGIS Pro (ver. 3.1.2): Esri Inc. software, available at https://www.esri.com/en-us/arcgis/products/arcgis-pro/overview.
Foster, B.M., Lopez, R., Crawford, E.R., Cook, W., Krigsvold, J., Langston, J.H., Langston, T., Miles, G., Moore, K., Garman, G.C., Rice, K.C., and Jastram, J.D., 2024, Characterization of the water resources of the Pamunkey River watershed in Virginia—A review of water science, management, and traditional ecological knowledge: U.S. Geological Survey Scientific Investigations Report 2024–5024, 64 p., accessed April 17, 2025, at https://doi.org/10.3133/sir20245024.
Heris, M.P., Foks, N., Bagstad, K., and Troy, A., 2020, A national dataset of rasterized building footprints for the U.S.: U.S. Geological Survey data release, https://doi.org/10.5066/P9J2Y1WG.
Heywood, C.E., and Pope, J.P., 2009, Simulation of groundwater flow in the Coastal Plain aquifer system of Virginia: U.S. Geological Survey Scientific Investigations Report 2009–5039, 115 p. [Also available at https://doi.org/10.3133/sir20095039.]
Hill, C., Heim, K., Hong, J., and Phan, N., 2022, 2020 post-enumeration survey estimation report: U.S. Census Bureau PES20-G-02RV, accessed February 26, 2024, at https://www2.census.gov/programs-surveys/decennial/coverage-measurement/pes/census-coverage-estimates-for-people-in-the-united-states-by-state-and-cen sus-operations.pdf.
Johnson, T.D., and Belitz, K., 2017, Domestic well locations and populations served in the contiguous U.S.—1990: Science of the Total Environment, v. 607–608, p. 658–668, https://doi.org/10.1016/j.scitotenv.2017.07.018.
Johnson, T.D., Belitz, K., and Lombard, M.A., 2019, Estimating domestic well locations and populations served in the contiguous U.S. for years 2000 and 2010: Science of the Total Environment, v. 687, p. 1261–1273, https://doi.org/10.1016/j.scitotenv.2019.06.036.
Johnson, T.D., Belitz, K., Kauffman, L.J., Watson, E., and Wilson, J.T., 2021, Populations using public-supply groundwater in the conterminous U.S. 2010; Identifying the wells, hydrogeologic regions, and hydrogeologic mapping units: Science of The Total Environment, v. 806, 15 p., https://doi.org/10.1016/j.scitotenv.2021.150618.
Kearns, M.R., and Pope, J.P., 2025, Estimated aquifer distribution for private domestic wells; estimated spatial distribution of the self-supplied domestic population for 2020 and 2010; and estimated monthly domestic self-supplied withdrawals of groundwater for the Virginia Coastal Plain: U.S. Geological Survey data release, https://doi.org/10.5066/P1QJQ2CB.
Kenny, J.F., and Juracek, K.E., 2012, Description of 2005—10 domestic water use for selected U.S. cities and guidance for estimating domestic water use: U.S. Geological Survey Scientific Investigations Report 2012–5163, 31 p. [Also available at https://doi.org/10.3133/sir20125163.]
Ladd, D.E., Pope, J.P., McFarland, E.R., and Beach, T.A., 2024, Hydrogeologic framework top-surface altitude rasters for the Virginia Eastern Shore: U.S. Geological Survey data release, https://doi.org/10.5066/P13TTDP4.
Manson, S., Schroeder, J., Van Riper, D., Knowles, K., Kugler, T., Roberts, F., and Ruggles, S., 2023, IPUMS National Historical Geographic Information System (ver. 18.0): IPUMS Center for Data Integration dataset, accessed April 5, 2024, at https://doi.org/10.18128/D050.V18.0.
Masterson, J.P., Pope, J.P., Fienen, M.N., Monti, J., Jr., Nardi, M.R., and Finkelstein, J.S., 2016, Assessment of groundwater availability in the Northern Atlantic Coastal Plain aquifer system from Long Island, New York, to North Carolina: U.S. Geological Survey Professional Paper 1829, 76 p., https://doi.org/10.3133/pp1829.
Maupin, M.A., Kenny, J.F., Hutson, S.S., Lovelace, J.K., Barber, N.L., and Linsey, K.S., 2014, Estimated use of water in the United States in 2010: U.S. Geological Survey Circular 1405, 56 p., https://doi.org/10.3133/cir1405.
McFarland, E.R., 2013, Sediment distribution and hydrologic conditions of the Potomac aquifer in Virginia and parts of Maryland and North Carolina: U.S. Geological Survey Scientific Investigations Report 2013–5116, 67 p., https://doi.org/10.3133/sir20135116.
McFarland, E.R., 2017, Hydrogeologic framework and hydrologic conditions of the Piney Point aquifer in Virginia: U.S. Geological Survey Scientific Investigations Report 2017–5041, 63 p., 2 pl., and CD-ROM, https://doi.org/10.3133/sir20175041.
McFarland, E.R., and Beach, T.A., 2019, Hydrogeologic framework of the Virginia Eastern Shore: U.S. Geological Survey Scientific Investigations Report 2019–5093, 26 p., 13 pl., https://doi.org/10.3133/sir20195093.
McFarland, E.R., and Bruce, T.S., 2006, The Virginia Coastal Plain Hydrogeologic Framework: U.S. Geological Survey Professional Paper 1731, 118 p., 25 pls. [Also available online at https://pubs.water.usgs.gov/pp1731/.]
Murray, A., Hall, A., and Kremer, F., 2023, U.S. private domestic well density—2020 update: Office of Research and Development Sub Product SHC.404.2.1.1, U.S. Environmental Protection Agency, accessed March 6, 2024, at https://epa.maps.arcgis.com/home/item.html?id=034d058a2bd94c389c608719ccde1182.
Murray, A., Hall, A., Weaver, J., and Kremer, F., 2021, Methods for estimating locations of housing units served by private domestic wells in the United States applied to 2010: Journal of the American Water Resources Association, v. 57, no. 5, p. 828–843, https://doi.org/10.1111/1752-1688.12937.
National Oceanic and Atmospheric Administration, 2024, Climate at a glance—Divisional time series: National Oceanic and Atmospheric Administration National Centers for Environmental Information database, accessed July 18, 2024, at https://www.ncei.noaa.gov/access/monitoring/climate-at-a-glance/divisional/time-series/4401/pcp/1/0/1900-2023.
Pope, J.P., McFarland, E.R., and Banks, R.B., 2008, Private domestic-well characteristics and the distribution of domestic withdrawals among aquifers in the Virginia Coastal Plain: U.S. Geological Survey Scientific Investigations Report 2007–5250, 47 p. [Also available at https://doi.org/10.3133/sir20075250.]
Pope, J.P., Andreasen, D.C., McFarland, E.R., and Watt, M.K., 2016, Digital elevations and extents of regional hydrogeologic units in the Northern Atlantic Coastal Plain aquifer system from Long Island, New York, to North Carolina (ver. 1.1, January 2021): U.S. Geological Survey data release, https://doi.org/10.3133/ds996.
R Core Team, 2023, R—A language and environment for statistical computing, version 4.2.3: R Foundation for Statistical Computing, accessed March 15, 2023, at https://www.R-project.org.
Sanford, W.E., Pope, J.P., and Nelms, D.L., 2009, Simulation of groundwater-level and salinity changes in the Eastern Shore, Virginia: U.S. Geological Survey Scientific Investigations Report 2009–5066, 125 p. [Also available online at https://doi.org/10.3133/sir20095066.]
Shaffer, K.H., 2009, Variations in withdrawal, return flow, and consumptive use of water in Ohio and Indiana, with selected data from Wisconsin, 1999–2004: U.S. Geological Survey Scientific Investigations Report 2009–5096, 93 p. [Also available at https://doi.org/10.3133/sir20095096.]
Shaffer, K.H., and Runkle, D.L., 2007, Consumptive water–use coefficients for the Great Lakes Basin and climatically similar areas: U.S. Geological Survey Scientific Investigations Report 2007–5197, 191 p. [Also available at https://doi.org/10.3133/sir20075197.]
Sleeter, R., 2008, A new method for mapping population distribution: U.S. Geological Survey Fact Sheet 2008-3010, accessed November 15, 2024, at https://pubs.usgs.gov/fs/2008/3010/.
U.S. Census Bureau, 2021, TIGER 2020 tabulated census block shapefile: U.S. Census Bureau, accessed September 26, 2022, at https://www2.census.gov/geo/tiger/TIGER2020/.
U.S. Census Bureau, 2022, Understanding disclosure avoidance-related variability in the 2020 census redistricting data, accessed February 26, 2024, at https://www.census.gov/library/fact-sheets/2022/variability.html?utm_campaign=20220131msdecs1ccdtars&utm_medium=email&utm_source=govdelivery.
U.S. Geological Survey, 2023a, National Hydrography Dataset (NHD)—USGS National Map downloadable data collection: U.S. Geological Survey data release, accessed March 1, 2024, at https://www.sciencebase.gov/catalog/item/4f5545cce4b018de15819ca9.
U.S. Geological Survey, 2023b, Virginia and West Virginia groundwater levels and trends, accessed February 27, 2025, at https://rconnect.usgs.gov/vawv-groundwater/
U.S. Geological Survey, 2024a, Water use in the United States: U.S. Geological Survey website, accessed March 1, 2024, at https://www.usgs.gov/mission-areas/water-resources/science/water-use-united-states.
U.S. Geological Survey, 2024b, USGS water data for the Nation: U.S. Geological Survey National Water Information System database, accessed March 1, 2024, at https://doi.org/10.5066/F7P55KJN.
Virginia Department of Emergency Management, 2013, Virginia Geographic Information Network Composite Geocoding service: Virginia Department of Emergency Management software, accessed June 16, 2024, at https://vgin.vdem.virginia.gov/content/64216809ef54479e95535fa822cbd6ee/about.
Wu, S.-S., Wang, L., and Qiu, X., 2008, Incorporating GIS building data and census housing statistics for sub-block-level population estimation: The Professional Geographer, v. 60, no. 1, p. 121–135, https://doi.org/10.1080/00330120701724251.
Glossary
- localities
Counties and independent cities. The U.S. Census Bureau considers independent cities to be county-equivalent entities for most purposes and includes independent cities with counties as primary subdivisions of a state. Virginia is one of four States with independent cities.
- domestic water use
Also called “household” water use, this category includes water used for all indoor household purposes, such as drinking, preparing food, bathing, clothes and dish washing, and toilet flushing, and for outdoor purposes, such as lawn and garden watering.
- private-domestic well
A private well supplying water to an individual residence for domestic use. Refer to “domestic water use.”
- self-supplied domestic population
The number of self-supplied domestic water users in a given area. Refer to “domestic water use.”
- self-supplied domestic water use
Domestic use of water withdrawn directly from the source by a user. Refer to “domestic water use.”
- self-supplied domestic water withdrawal
Water withdrawn directly from the source by a user for domestic use. Refer to “domestic water use.”
- public supply
Water withdrawn by public and private water suppliers that furnish water to at least 25 people or have a minimum of 15 connections. Water is publicly supplied for a variety of uses, including domestic, commercial, industrial, and thermoelectric uses.
Appendix 1. Private-Domestic Well Aquifer Distribution and Self-Supplied Domestic Population for HUC8 Watersheds in the Virginia Coastal Plain, 2010–20
Table 1.1.
Aquifer distribution by watershed at the 8-digit hydrologic unit (HUC8) scale watershed from analysis of 8,264 private-domestic well records in the Virginia Coastal Plain.Table 1.2.
Estimated self-supplied domestic population within the Virginia Coastal Plain by watershed at the 8-digit hydrologic unit (HUC8) scale, 2020 and 2010.References Cited
Dewitz, J., 2021, National Land Cover Database (NLCD) 2019 products: U.S. Geological Survey data release, accessed August 10, 2023, at https://doi.org/https://doi.org/10.5066/P9KZCM54.
Esri Inc., 2023, ArcGIS Pro (ver. 3.1.2): Esri Inc. software, available at https://www.esri.com/en-us/arcgis/products/arcgis-pro/overview.
Heris, M.P., Foks, N., Bagstad, K., and Troy, A., 2020, A national dataset of rasterized building footprints for the U.S.: U.S. Geological Survey data release, https://doi.org/10.5066/P9J2Y1WG.
Ladd, D.E., Pope, J.P., McFarland, E.R., and Beach, T.A., 2024, Hydrogeologic framework top-surface altitude rasters for the Virginia Eastern Shore: U.S. Geological Survey data release, https://doi.org/10.5066/P13TTDP4.
Murray, A., Hall, A., and Kremer, F., 2023, U.S. private domestic well density—2020 update: Office of Research and Development Sub Product SHC.404.2.1.1, U.S. Environmental Protection Agency, accessed March 6, 2024, at https://epa.maps.arcgis.com/home/item.html?id=034d058a2bd94c389c608719ccde1182.
Pope, J.P., Andreasen, D.C., McFarland, E.R., and Watt, M.K., 2016, Digital elevations and extents of regional hydrogeologic units in the Northern Atlantic Coastal Plain aquifer system from Long Island, New York, to North Carolina (ver. 1.1, January 2021): U.S. Geological Survey data release, https://doi.org/10.3133/ds996.
U.S. Census Bureau, 2021, TIGER 2020 tabulated census block shapefile: U.S. Census Bureau, accessed September 26, 2022, at https://www2.census.gov/geo/tiger/TIGER2020/.
U.S. Geological Survey, 2023, National Hydrography Dataset (NHD)—USGS National Map downloadable data collection: U.S. Geological Survey data release, accessed March 1, 2024, at https://www.sciencebase.gov/catalog/item/4f5545cce4b018de15819ca9.
Appendix 2. Private-Domestic Well-Aquifer Distribution and Self-Supplied Domestic Population for HUC10 Watersheds in the Virginia Coastal Plain, 2010–20
Table 2.1.
Aquifer distribution by watershed at the 10-digit hydrologic unit code (HUC10) scale from analysis of 8,264 private-domestic well records in the Virginia Coastal Plain.Table 2.2.
Estimated self-supplied domestic population within the Virginia Coastal Plain by watershed at the 10-digit hydrologic unit code (HUC10) scale, 2020 and 2010.References Cited
Dewitz, J., 2021, National Land Cover Database (NLCD) 2019 products: U.S. Geological Survey data release, accessed August 10, 2023, at https://doi.org/https://doi.org/10.5066/P9KZCM54.
Esri Inc., 2023, ArcGIS Pro (ver. 3.1.2): Esri Inc. software, available at https://www.esri.com/en-us/arcgis/products/arcgis-pro/overview.
Heris, M.P., Foks, N., Bagstad, K., and Troy, A., 2020, A national dataset of rasterized building footprints for the U.S.: U.S. Geological Survey data release, https://doi.org/10.5066/P9J2Y1WG.
Ladd, D.E., Pope, J.P., McFarland, E.R., and Beach, T.A., 2024, Hydrogeologic framework top-surface altitude rasters for the Virginia Eastern Shore: U.S. Geological Survey data release, https://doi.org/10.5066/P13TTDP4.
Murray, A., Hall, A., and Kremer, F., 2023, U.S. private domestic well density—2020 update: Office of Research and Development Sub Product SHC.404.2.1.1, U.S. Environmental Protection Agency, accessed March 6, 2024, at https://epa.maps.arcgis.com/home/item.html?id=034d058a2bd94c389c608719ccde1182.
Pope, J.P., Andreasen, D.C., McFarland, E.R., and Watt, M.K., 2016, Digital elevations and extents of regional hydrogeologic units in the Northern Atlantic Coastal Plain aquifer system from Long Island, New York, to North Carolina (ver. 1.1, January 2021): U.S. Geological Survey data release, https://doi.org/10.3133/ds996.
U.S. Census Bureau, 2021, TIGER 2020 tabulated census block shapefile: U.S. Census Bureau, accessed September 26, 2022, at https://www2.census.gov/geo/tiger/TIGER2020/.
U.S. Geological Survey, 2023, National Hydrography Dataset (NHD)—USGS National Map downloadable data collection: U.S. Geological Survey data release, accessed March 1, 2024, at https://www.sciencebase.gov/catalog/item/4f5545cce4b018de15819ca9.
Conversion Factors
U.S. customary units to International System of Units
Datums
Vertical coordinate information is referenced to the North American Vertical Datum of 1988 (NAVD 88).
Horizontal coordinate information is referenced to the North American Datum of 1983 (NAD 83).
Elevation, as used in this report, refers to distance above or below the vertical datum.
For additional information contact:
Director, Virginia and West Virginia Water Science Center
U.S. Geological Survey
1730 East Parham Road
Richmond, Virginia 23228
or visit our website at
https://www.usgs.gov/centers/virginia-and-west-virginia-water-science-center
Publishing support provided by the Baltimore Publishing Service Center.
Disclaimers
Any use of trade, firm, or product names is for descriptive purposes only and does not imply endorsement by the U.S. Government.
Although this information product, for the most part, is in the public domain, it also may contain copyrighted materials as noted in the text. Permission to reproduce copyrighted items must be secured from the copyright owner.
Suggested Citation
Kearns, M.R., and Pope, J.P., 2025, Estimated hydrogeologic, spatial, and temporal distribution of self-supplied domestic groundwater withdrawals for aquifers of the Virginia Coastal Plain: U.S. Geological Survey Scientific Investigations Report 2025–5051, 45 p., https://doi.org/10.3133/sir20255051.
ISSN: 2328-0328 (online)
ISSN: 2328-031X (print)
Study Area
| Publication type | Report |
|---|---|
| Publication Subtype | USGS Numbered Series |
| Title | Estimated hydrogeologic, spatial, and temporal distribution of self-supplied domestic groundwater withdrawals for aquifers of the Virginia Coastal Plain |
| Series title | Scientific Investigations Report |
| Series number | 2025-5051 |
| ISBN | 978-1-4113-4609-3 |
| DOI | 10.3133/sir20255051 |
| Publication Date | June 17, 2025 |
| Year Published | 2025 |
| Language | English |
| Publisher | U.S. Geological Survey |
| Publisher location | Reston, VA |
| Contributing office(s) | Virginia and West Virginia Water Science Center |
| Description | Report: vii, 45 p.; Data release |
| Country | United States |
| State | Virginia |
| Other Geospatial | Virginia Coastal Plain |
| Online Only (Y/N) | N |
| Additional Online Files (Y/N) | N |