

Hydrogeologic Framework and Conceptual Model of the Red River Alluvial Aquifer East of Lake Texoma, Southeastern Oklahoma, 1980–2022
Links
- Document: Report (19.8 MB pdf) , HTML , XML
- Data Release: USGS Data Release - Soil-Water-Balance model of the Red River alluvial aquifer east of Lake Texoma, southeastern Oklahoma, 1980–2022
- NGMDB Index Page: National Geologic Map Database Index Page (html)
- Download citation as: RIS | Dublin Core
Acknowledgments
The authors value the contributions of the Oklahoma Water Resources Board (OWRB) and U.S. Geological Survey (USGS) staff that led to the successful completion of the project. The authors thank the OWRB for support on this project, especially Division Chief (Water Rights Administration Division) Christopher Neel, who provided hydrogeologic data and aided in defining study objectives and deliverables.
The authors express gratitude to USGS employees who performed data-collection activities in the field. Levi Close, Kyle Cothren, Nick Pierson, and Kevin Smith collected synoptic base-flow measurements during 2023. The authors also thank USGS employees Michael T. Pavelko and Adam R. Trevisan, who performed detailed technical reviews of this report and the accompanying data release. The authors acknowledge and appreciate the professionalism, experience, and dedication of these helpful and resourceful colleagues.
Abstract
The 1973 Oklahoma Groundwater Law (Oklahoma Statutes §82-1020.5) requires that the Oklahoma Water Resources Board conduct hydrologic investigations of the State’s groundwater basins to support a determination of the maximum annual yield for each groundwater basin. At present (2025), the Oklahoma Water Resources Board has not established a maximum annual yield for the Red River alluvial aquifer east of Lake Texoma. To support the evaluation and determination of a maximum annual yield, a hydrogeologic framework and conceptual groundwater-flow model were developed to assess groundwater availability in the Red River alluvial aquifer east of Lake Texoma.
The scope of this hydrologic investigation is the alluvium and terrace containing the Red River alluvial aquifer in Oklahoma between Lake Texoma, the Texas State line, and the Arkansas State line, an extent referred to in this report as “the eastern part of the Red River alluvial aquifer.” Parts of the alluvium and terrace extent in Arkansas and Texas are included in some analyses to address hydrologic influences from outside the aquifer’s boundaries in Oklahoma.
The eastern part of the Red River alluvial aquifer in southeastern Oklahoma consists of approximately 401,280 acres of Quaternary alluvium and terrace deposits associated with the Red River and its major tributaries. Mean annual recharge to the aquifer for the 1980–2022 study period was estimated to be 8.62 inches per year, or 17.98 percent of the mean annual precipitation over the same period (47.94 inches). This mean annual recharge rate is equivalent to an inflow of approximately 288,250 acre-feet per year for the eastern part of the Red River alluvial aquifer. Recharge estimated using the Soil-Water-Balance code accounts for 98.7 percent of the conceptual-model inflows to the eastern part of the Red River alluvial aquifer. Saturated-zone evapotranspiration accounts for 11.9 percent and net streambed seepage accounts for 87.4 percent of the outflows in the conceptual model.
Introduction
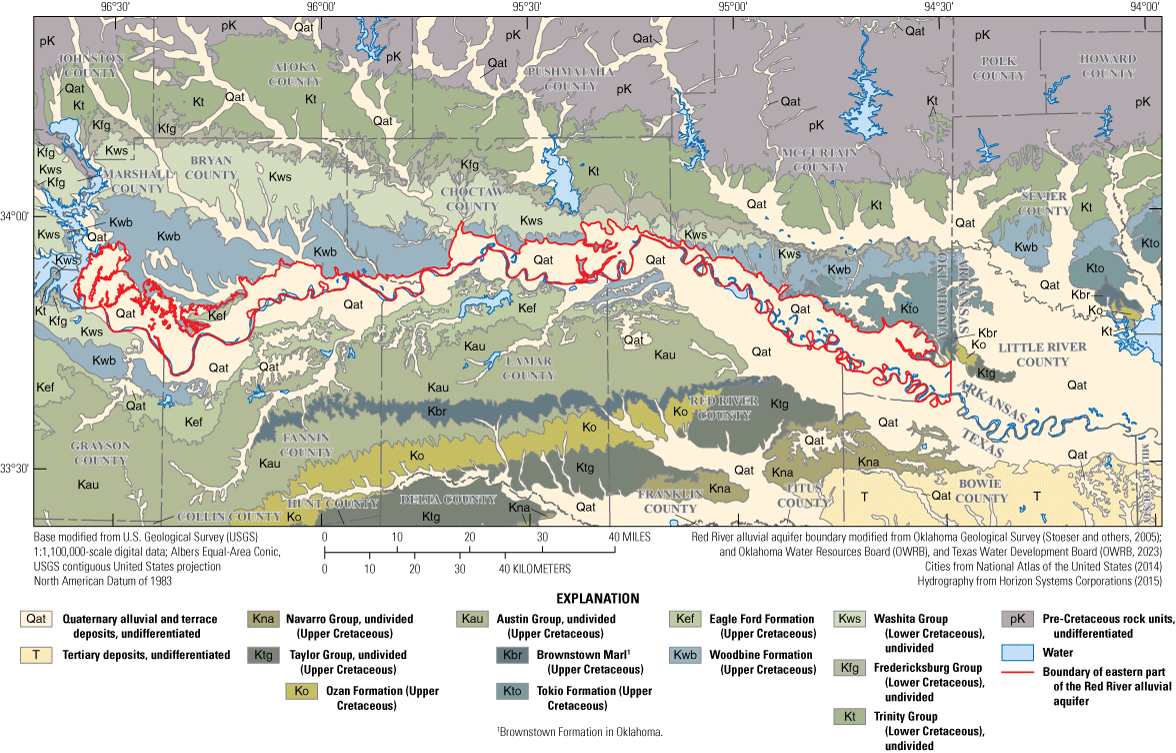
The Red River alluvial aquifer extends more than 500 miles (mi) along the Oklahoma and Texas State line (fig. 1; Kent, 1980). The Red River alluvial aquifer is considered a major alluvial aquifer by the Oklahoma Water Resources Board (OWRB), and wells completed in this aquifer yield more than 1,000 gallons per minute in some localized areas (OWRB, 2012a). The aquifer supplies groundwater for irrigation, livestock, household, municipal, and industrial purposes (OWRB, 2012a). By 2060, total water demand for the Red River alluvial aquifer in the central part of the aquifer in Bryan County and the western extent of Choctaw County is projected to reach 85,700 acre-feet per year (acre-ft/yr), an increase of approximately 24,300 acre-feet (acre-ft; about 40 percent) from the reported 2010 water demand for this part of the aquifer (OWRB, 2012b). Total water demand for the Red River alluvial aquifer in the easternmost part of Choctaw County and McCurtain County is projected to reach 72,930 acre-ft/yr, an increase of approximately 14,830 acre-ft (about 26 percent) from the 2010 demand of 58,100 acre-ft for this part of the aquifer (OWRB, 2012d).
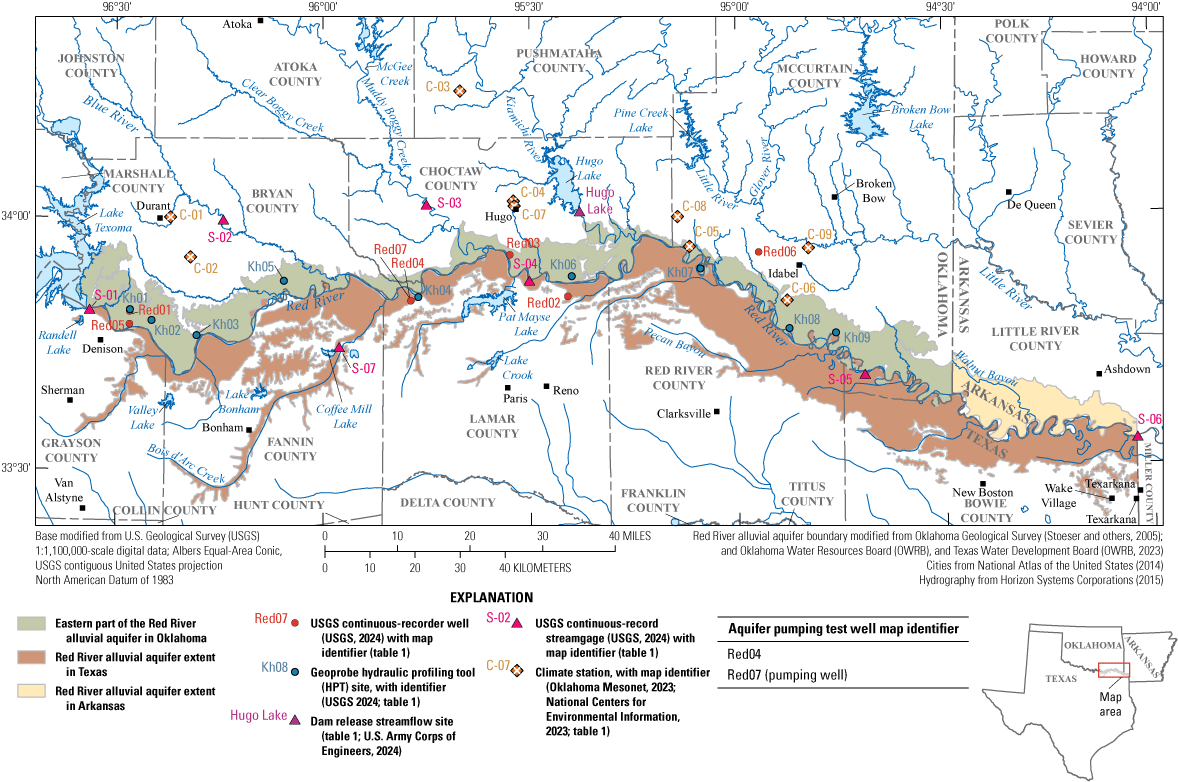
Extent of the eastern part of the Red River alluvial aquifer, with selected data-collection stations in southeastern Oklahoma, northeastern Texas, and southwestern Arkansas.
The 1973 Oklahoma Water Law (Oklahoma Statutes §82-1020.5 [Oklahoma State Legislature, 2021b]; OWRB 2024a) requires the OWRB to conduct hydrogeologic investigations of Oklahoma’s groundwater basins (aquifers) to support a determination of the maximum annual yield (MAY), the amount of fresh groundwater that can be withdrawn annually while ensuring a minimum 20-year life of the groundwater basin, for each aquifer. Groundwater is considered fresh by the OWRB if the dissolved-solids concentration is less than 5,000 milligrams per liter (mg/L) (OWRB, 2012c). For alluvium and terrace aquifers, the groundwater-basin-life requirement is satisfied if, after 20 years of MAY withdrawals, 50 percent of the groundwater basin retains a saturated thickness of at least 5 feet (ft). When a MAY has been established, the amount of land owned or leased by a permit applicant determines the annual volume of water allocated to that applicant. The annual volume of water allocated per acre of land is known as the equal-proportionate-share pumping rate (OWRB, 2024a). Computation of the equal proportionate share is complex and can benefit from a comprehensive hydrologic investigation. This paragraph was adapted from Fetkovich and others (2025, p. 1).
Water withdrawals for the Red River alluvial aquifer are the subject of ongoing studies, and at present (2025), the OWRB has yet to establish the MAY for the eastern part of this alluvial aquifer. To help support the OWRB’s determination of the MAY, the U.S. Geological Survey (USGS), in cooperation with the OWRB, conducted a hydrologic investigation with the following objectives: (1) describe the hydrogeologic framework of the eastern part of the Red River alluvial aquifer, which includes the delineation of the aquifer boundaries, hydraulic properties, surface-water flows, and groundwater levels; and (2) develop a conceptual-flow model for the eastern part of the alluvial aquifer for a 1980–2022 study period.
Purpose and Scope
The purpose of this report is to describe the hydrogeology and conceptualize groundwater flow for the part of the Red River alluvial aquifer contained in the alluvium and terrace deposits east of Lake Texoma in southeastern Oklahoma to the north-south Oklahoma-Arkansas State line. This report presents a hydrogeologic framework of the eastern part of the alluvial aquifer and documents the development of a conceptual groundwater-flow model of the aquifer during the study period 1980–2022. The part of the Red River alluvial aquifer in Oklahoma described herein is referred to as the “eastern part of the Red River alluvial aquifer.” Although the focus herein is on this part of the aquifer within Oklahoma, the study area also includes parts of the alluvium and terrace containing the Red River alluvial aquifer in Texas and Arkansas (fig. 1). Although the study areas differ, the organization and the wording of sections in this report are modified from those in Smith and others (2017, 2021).
Description of Study Area
The eastern part of the Red River alluvial aquifer in southeastern Oklahoma consists of approximately 401,280 acres of Quaternary alluvium and terrace deposits associated with the Red River and its major tributaries. The Red River alluvial aquifer is an expansive aquifer along the southern border of Oklahoma, although the geographic scope of this report is the alluvium and terrace deposits containing the Red River alluvial aquifer in Oklahoma between Lake Texoma and the Arkansas State line (fig. 1). Some analyses in this report include the alluvial and terrace deposits in Texas and Arkansas to address hydrologic influence from surrounding areas. Similar to the rest of the Red River alluvial aquifer, the eastern part of this aquifer is hydrologically connected to the Red River and its major tributaries and is composed of unconsolidated terrace and alluvial deposits associated with the Red River and selected tributaries (fig. 1).
Land Use
Land-use data for the study area in southeastern Oklahoma, northeastern Texas, and southwestern Arkansas were obtained from the CropScape database, which includes land-cover characteristics compiled at 30-meter (m) resolution for 2022 (figs. 2, 3; National Agricultural Statistics Service, 2024; U.S. Department of Agriculture [USDA], 2023). Land cover overlying the eastern part of the Red River alluvial aquifer is primarily cropland (81.6 percent), which is concentrated near the southern extent of the aquifer (figs. 2, 3). The remainder of the land-cover types are forest or shrubland (13.4 percent); developed (3.2 percent); and other, which includes water, wetlands, or barren land (1.9 percent). Predominant crops contributing to the total percentage of cropland in the study area are winter wheat (54.9 percent), cotton (17.7 percent), and hay or alfalfa (9.4 percent). Sorghum, corn, and soybeans account for a combined 8.4 percent of the total cropland. Fallow or idle cropland accounted for 9.5 percent of the cropland. The percentages for crop-cover types are long-term mean values and are subject to change in any given year because of seasonal, economic, and hydrologic factors. Percentages may not sum to 100.0 percent because of rounding.
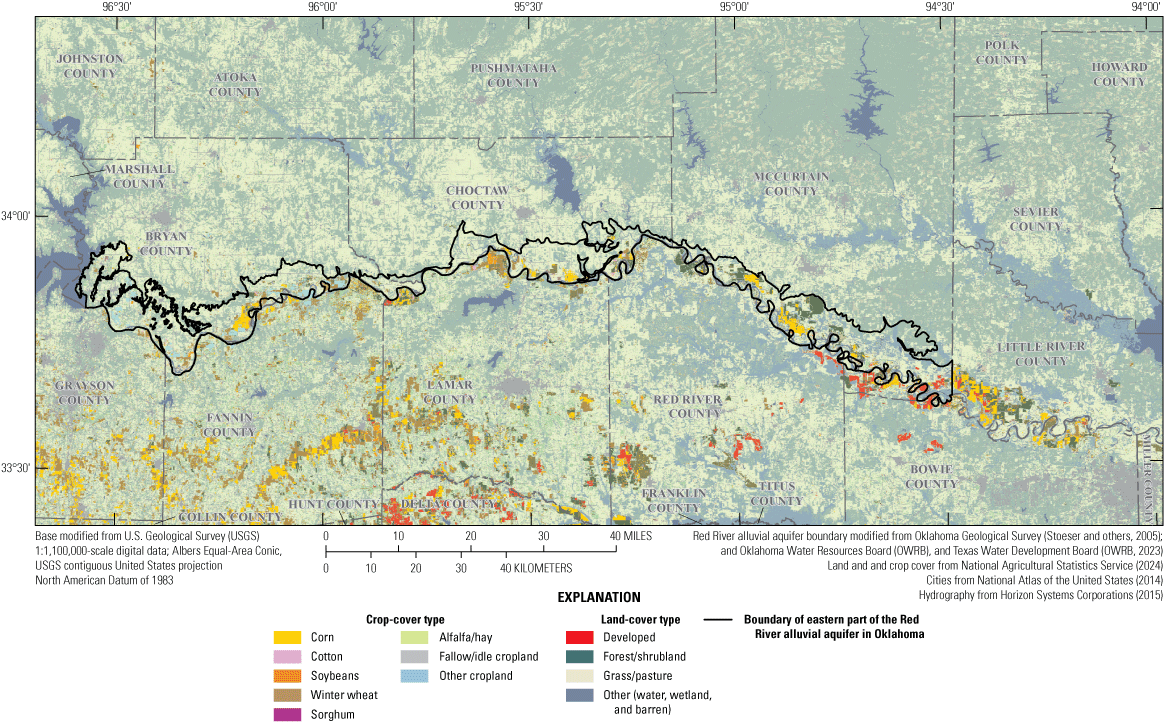
Distribution of land- and crop-cover types for the study area, southeastern Oklahoma, northeastern Texas, and southwestern Arkansas, 2022.
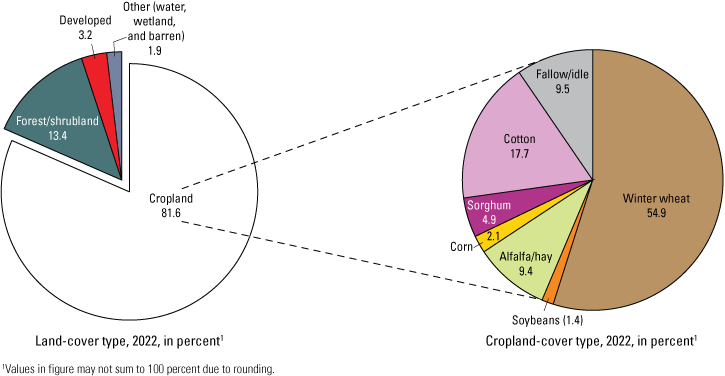
Proportions of land- and crop-cover types for the eastern part of the Red River alluvial aquifer, southeastern Oklahoma, 2022 (National Agricultural Statistics Service, 2024; U.S. Department of Agriculture, 2023).
Long-Term Climate Patterns
The climate of southeastern Oklahoma is characterized as humid subtropical (Kottek and others, 2006). Daily climate data (mean, maximum, and minimum temperature, and mean precipitation) were compiled from nine selected climate stations near or within the study area (fig. 1, table 1) operated as part of the Oklahoma Mesonet network (Oklahoma Mesonet, 2023) or the National Centers for Environmental Information (NCEI, 2023). Climate data were used to assess patterns in long-term (1916–2023) annual and monthly temperature and precipitation for the study area. A locally weighted scatterplot smoothing (LOWESS) curve (Cleveland, 1979) was applied to the annual data to determine periods of above- or below-mean precipitation or temperature (fig. 4).
Table 1.
Data-collection locations in and near the eastern part of the Red River alluvial aquifer study area, southeastern Oklahoma, northeastern Texas, and southwestern Arkansas.[U.S. Geological Survey (USGS) 2024 data can be accessed using the 8- or 15-digit station number or other identifier. mm/dd/yyyy, month/day/year; NAD 83, North American Datum of 1983; NAVD 88, North American Vertical Datum of 1988; Tex., Texas; Okla., Oklahoma; Ark, Arkansas; crk, creek; FM, farm to market road; nr, near; --, unknown or not applicable]
| Station name | Map identifier (fig. 1) | Station number or station identifier (fig. 1) | Station short name | Latitude (decimal degrees NAD 83) |
Longitude (decimal degrees NAD 83) |
Period of record (may contain gaps) |
Land-surface altitude (feet above NAVD 88) | Well or hole depth (feet below land surface) | |
|---|---|---|---|---|---|---|---|---|---|
| (mm/dd/yyyy) | |||||||||
| Begin | End | ||||||||
| Red River at Denison Dam near Denison, Tex. | S-01 | 07331600 | -- | 33.819 | −96.563 | 01/01/1924 | Present (2025) |
494.79 | -- |
| Blue River near Blue, Okla. | S-02 | 07332500 | Blue River streamgage | 33.997 | −96.241 | 06/10/1936 | Present (2025) |
496.97 | -- |
| Muddy Boggy Creek near Unger, Okla. | S-03 | 07335300 | Muddy Boggy streamgage | 34.027 | −95.750 | 10/18/1961 | Present (2025) |
393.23 | -- |
| Red River at Arthur City, Tex. | S-04 | 07335500 | Arthur City streamgage | 33.875 | −95.502 | 10/01/1905 | Present (2025) |
374.85 | -- |
| Red River near De Kalb, Tex. | S-05 | 07336820 | -- | 33.684 | −94.694 | 01/03/1968 | Present (2025) |
303.08 | -- |
| Red River at Index, Ark. | S-06 | 07337000 | Index streamgage | 33.552 | −94.041 | 10/01/1986 | Present (2025) |
246.55 | -- |
| Bois D’Arc Crk at FM 409 nr Honey Grove, Tex. | S-07 | 07332622 | Bois D’Arc streamgage | 33.744 | −95.961 | 06/03/2009 | Present (2025) |
448.39 | -- |
| 08S-08E-33-DAD (Red01) | Red01 | 334847096275901 | -- | 33.813 | −96.466 | 11/19/2021 | Present (2025) |
611.81 | 70 |
| RT-17-13-3xx (Red02) | Red02 | 335030095243401 | -- | 33.842 | −95.410 | 11/19/2021 | Present (2025) |
411.47 | 17 |
| 07S-17E-29-BAA 1 (Red03) | Red03 | 335528095325701 | -- | 33.924 | −95.549 | 12/14/2021 | Present (2025) |
414.01 | 63 |
| RT-17-10-301 (Red04) | Red04 | 335001095471701 | -- | 33.834 | −95.788 | 12/14/2021 | Present (2025) |
442.85 | 45 |
| 09S-08E-09-ADD 1 (Red05) | Red05 | 334717096280101 | -- | 33.788 | −96.467 | 12/15/2021 | Present (2025) |
547.99 | 13.3 |
| 07-22E-24-DDD 1 (Red06) | Red06 | 335535094565301 | -- | 33.926 | −94.948 | 12/13/2021 | Present (2025) |
466.46 | 25 |
| RT-17-10-6xx (Red04 Pmp01) | Red07 | 334959095471701 | -- | 33.833 | −95.788 | 11/06/2023 | 12/06/2023 | 442.00 | 43.27 |
| Durant | C-02 | DURA | -- | 33.921 | −96.320 | 01/01/1994 | Present (2025) |
-- | -- |
| Antlers | C-03 | ANT2 | -- | 34.250 | −95.668 | 04/15/2011 | Present (2025) |
-- | -- |
| Hugo | C-04 | HUGO | -- | 34.031 | −95.540 | 01/01/1994 | Present (2025) |
-- | -- |
| Valliant | C-05 | VALL | -- | 33.939 | −95.115 | 10/14/2015 | Present (2025) |
-- | -- |
| Idabel | C-06 | IDAB | -- | 33.830 | −94.880 | 01/01/1994 | Present (2025) |
-- | -- |
| Durant, Okla. | C-01 | Durant | -- | 34.000 | −96.389 | 08/03/1901 | 03/21/2022 | -- | -- |
| Hugo, Okla. | C-07 | Hugo | -- | 34.021 | −95.538 | 01/01/1915 | 04/30/2006 | -- | -- |
| Valliant, Okla. | C-08 | Valliant | -- | 33.998 | −95.143 | 09/09/1941 | 01/31/2015 | -- | -- |
| Idabel, Okla. | C-09 | Idabel | -- | 33.934 | −94.828 | 02/22/1907 | Present (2025) |
-- | -- |
| 08S-08E-11-BBB 1 (HPT01) | Kh01 | 335254096265401 | -- | 33.817 | −96.466 | -- | -- | 719 | 54.75 |
| 09S-09E-06-CCC 1 (HPT02) | Kh02 | 334743096244901 | -- | 33.795 | −96.414 | -- | -- | 587 | 31.25 |
| 09S-10E-19-BAB 1 (HPT03) | Kh03 | 334556096181801 | -- | 33.766 | −96.305 | -- | -- | 508 | 28.35 |
| RT-17-10-3xx (HPT04) | Kh04 | 335028095461201 | -- | 33.841 | −95.770 | -- | -- | 438 | 43.15 |
| 08S-11E-12-DAA 1 (HPT05) | Kh05 | 335225096054001 | -- | 33.874 | −96.095 | --- | -- | 511 | 52.35 |
| 08S-18E-11-CBC 1 (HPT06) | Kh06 | 335215095235801 | -- | 33.881 | −95.400 | -- | -- | 397 | 49.15 |
| 08S-21E-03-AAA 1 (HPT07) | Kh07 | 335341095051901 | -- | 33.895 | −95.089 | -- | -- | 373 | 53.9 |
| 09S-23E-14-ACB 1 (HPT08) | Kh08 | 334628094523101 | -- | 33.774 | −94.876 | -- | -- | 355 | 56.65 |
| 09S-24E-24-BBB 1 (HPT09) | Kh09 | 334553094454801 | -- | 33.765 | −94.764 | -- | -- | 342 | 47.35 |
| Hugo Lake | Hugo Lake | HGLO2 | -- | 34.012 | −95.380 | 12/01/1971 | Present (2025) | 452.50 | -- |
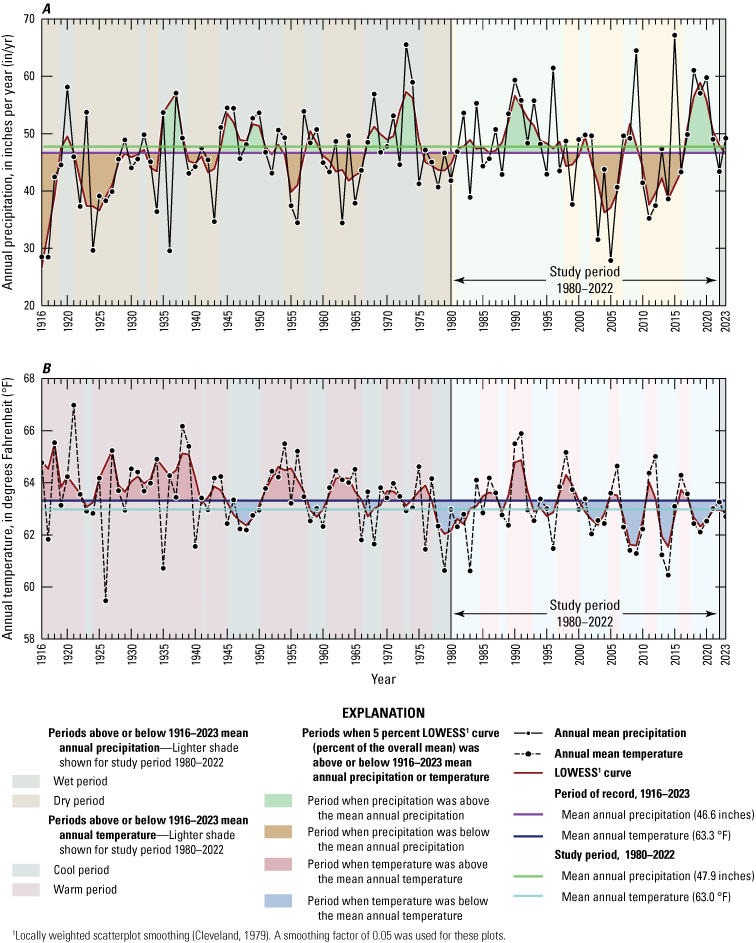
A, Long-term precipitation, and B, long-term temperature within the study area overlain with locally weighted scatterplot smoothing (LOWESS) curves and estimated cool or warm and wet or dry periods for the period of record, southeastern Oklahoma,1916–2023 (Oklahoma Mesonet, 2023; National Centers for Environmental Information, 2023).
Mean annual precipitation in the study area for the 1916–2023 period of record was 46.6 in., and the mean annual temperature was 63.3 degrees Fahrenheit (°F). Compared to those values, the mean annual precipitation was 1.3 inches (in.) higher, and the mean annual temperature was 0.3 °F lower for the 1980–2022 study period. Within the study area, precipitation data display temporal variations. Minimum annual precipitation was 27.9 in. during 2005, and maximum annual precipitation was 67.2 in. during 2015 (fig. 4A). Temperature is also variable over the period of record; the minimum annual mean temperature was 59.5 °F in 1926, and the maximum annual mean temperature was 67.0 °F in 1921 (fig. 4B).
Monthly precipitation is typically greatest in April and May, and steadily increases from January to May. Monthly precipitation is lowest in January, and annual snowfall in the study area is the lowest in the State (Oklahoma Climatological Survey, 2024). The mean monthly precipitation for the 1980–2022 study period was greatest (6.1 in.) in May and least (2.9 in.) in January (fig. 5A). The mean monthly temperature during 1980–2022 was highest (81.8 °F) in July and lowest (42.2 °F) in January (fig. 5B). Patterns in mean monthly precipitation and temperature were similar over the combined period of record for both precipitation and temperature (1916–2023) and during the study period (1980–2022).
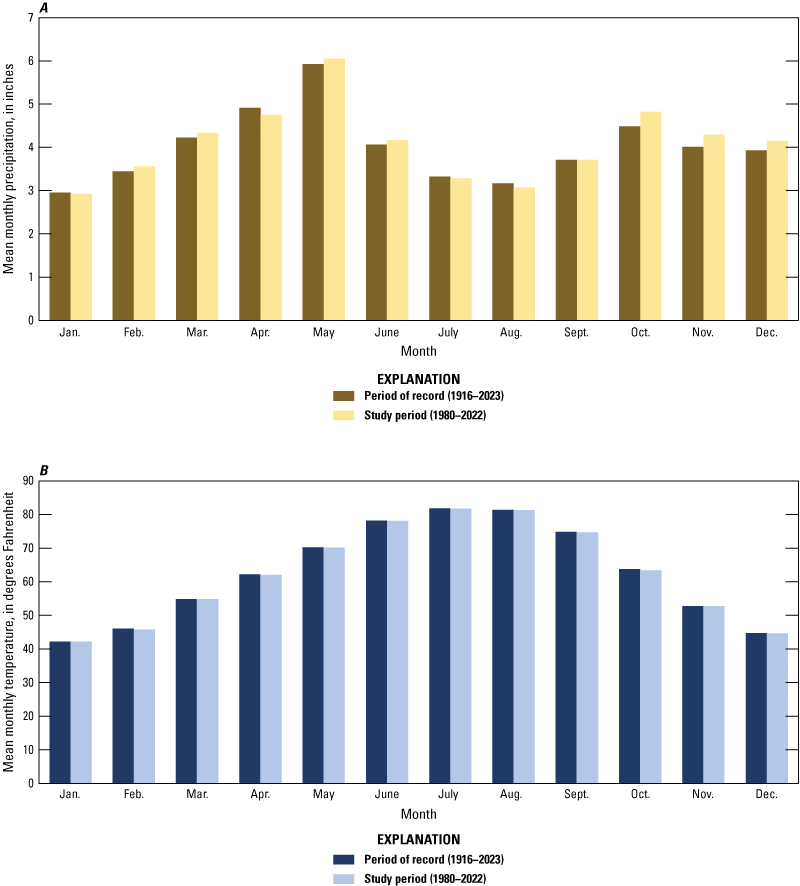
A, Mean monthly precipitation, and B, mean monthly temperature within the study area for the period of record (1916–2023) and the study period (1980–2022), southeastern Oklahoma (Oklahoma Mesonet, 2023; National Centers for Environmental Information, 2023).
Streamflow and Base-Flow Patterns
Daily streamflow data were recorded at selected USGS streamgages in the study area (fig. 1) and summarized for the 1980–2022 study period (table 2). Streamflow is primarily the sum of runoff and base flow; precipitation that falls directly on a stream is a small, nearly negligible component of streamflow (Barlow and Leake, 2012). Runoff refers to surface runoff (overland flow) that drains into a stream channel and subsurface stormflow (interflow) that originates from surface runoff. Base flow is the streamflow component supplied by groundwater discharge to streams (Barlow and Leake, 2012).
Table 2.
Mean annual streamflow, base flow, and base-flow index for the period of record at selected U.S. Geological Survey streamgages (1937–2022) and for the study period (1980–2022) in the eastern part of the Red River alluvial aquifer study area in Southeastern Oklahoma.[Values computed by using the Base-Flow Index (BFI) code (Wahl and Wahl, 1995) in the U.S. Geological Survey (USGS) Groundwater Toolbox (Barlow and others, 2015). ft3/s, cubic foot per second; POR, period of record; Okla., Oklahoma; Tex., Texas; Ark., Arkansas; %, percent]
| Station name | USGS streamgage number (table 1) | Station short name | Map identifier (fig. 1) | Mean annual streamflow1 (ft3/s) |
Mean annual base flow1 (ft3/s) |
Mean annual BFI (%) |
|||
|---|---|---|---|---|---|---|---|---|---|
| Study period (1980–2022) | POR (1937–2022) |
Study period (1980–2022) | POR (1937–2022) | Study period (1980–2022) | POR (1937–2022) | ||||
| Blue River near Blue, Okla. | 07332500 | Blue River streamgage | S-02 | 351 | 324 | 103 | 92.2 | 32.1 | 31.1 |
| Red River at Arthur City, Tex. | 07335500 | Arthur City streamgage | S-04 | 10,150 | 9,100 | 5,670 | 4,300 | 52.0 | 43.5 |
| Red River at Index, Ark. | 07337000 | Index streamgage | S-06 | 14,000 | 12,800 | 5,170 | 6,780 | 58.3 | 50.9 |
Data from USGS National Water Information System (USGS, 2024).
For this report, streamflow-hydrograph data obtained from the USGS National Water Information System (NWIS; USGS, 2024) were separated into runoff and base-flow components by using the Base-Flow Index (BFI) code (Wahl and Wahl, 1995) in the USGS Groundwater Toolbox (Barlow and others, 2015). The BFI code uses the minimum streamflow in a moving n-day window as a basis for hydrograph separation, where n is the user-defined number of days. Turning points are then determined by comparing minimums to adjacent minimums on the base-flow hydrograph. If 90 percent of a given minimum is less than the preceding and succeeding minimums, then that minimum is considered a turning point. Turning points can then be used to linearly interpolate base flow by connecting adjacent values with a straight line (Moix and Galloway, 2005). With these data, the BFI (or the percentage of base flow per streamflow) can be calculated. Multiple n-day bins were tested by plotting mean BFI against different n-day values. For consistency, a 5-day window and an f-statistic of 0.9 were used for all streamgages in this report.
Three USGS streamgages in the study area were used for BFI analysis: 07332500 Blue River near Blue, Okla. (map identifier S-02) (hereinafter referred to as the “Blue River streamgage”); 07335500 Red River at Arthur City, Tex. (map identifier S-04) (hereinafter referred to as the “Arthur City streamgage”); and 07337000 Red River at Index, Ark. (map identifier S-06) (hereinafter referred to as the “Index streamgage”). Data from the Blue River, Arthur City, and Index streamgages were analyzed for the period 1937–2022 to depict monthly base flow, monthly streamflow, and the annual base-flow index with an associated 5-year moving average (fig. 6). Streamgage data for the Arthur City and Index streamgages indicate BFI values generally increased over the first part of the 1937–2022 period of record and were in a slightly downward or stable pattern from the mid-1990s through 2022. Data from the Blue River streamgage indicate relatively consistent BFI values over the 1937–2022 period of record. Mean annual BFI values for the Blue River, Arthur City, and Index streamgages over the 1980–2022 period were 32.1, 52.0, and 58.3 percent, respectively (table 2). The mean annual base flows for the Blue River, Arthur City, and Index streamgages for the 1980–2022 period were 103.4; 5,670; and 5,170 cubic feet per second (ft3/s), respectively. For the overall 1937–2022 period of record, there is a slight upward pattern in annual base-flow values for all three sites (fig. 6A–C).
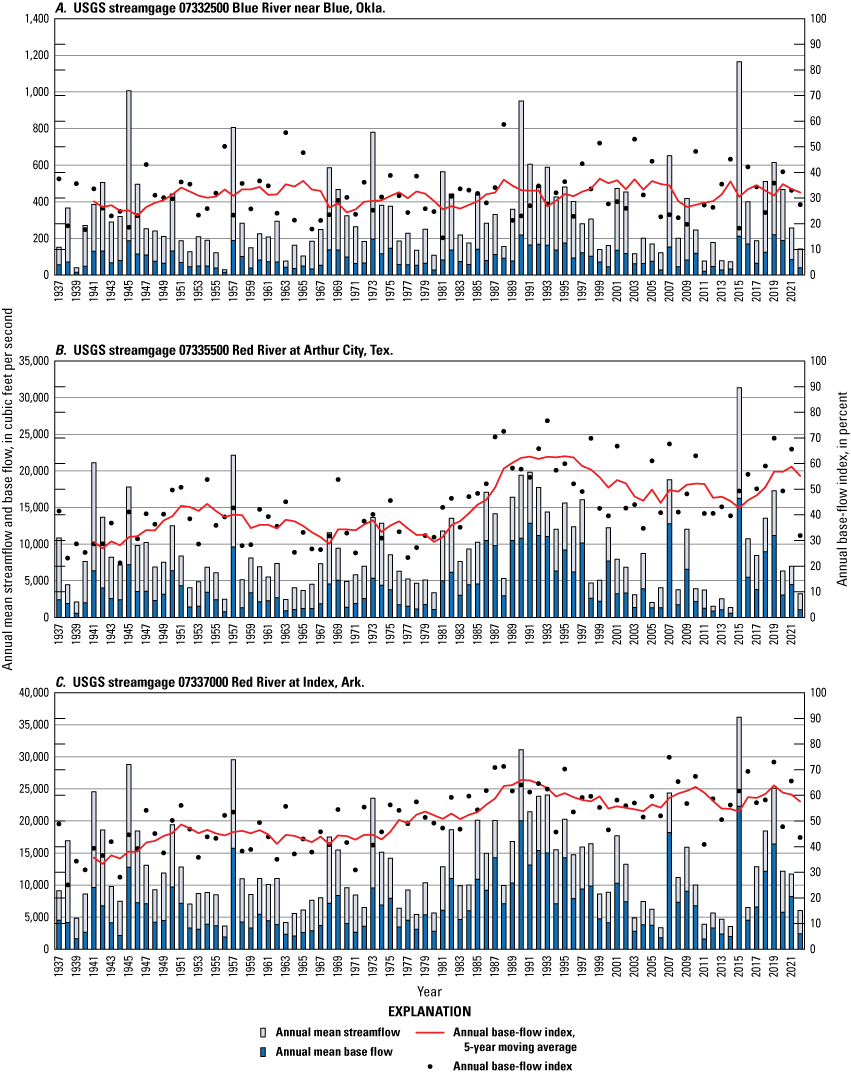
Annual base flow, annual streamflow, and annual base-flow index for A, U.S. Geological Survey streamgage 07332500 Blue River near Blue, Oklahoma (map identifier S-02; table 1); B, U.S. Geological Survey streamgage 07335500 Red River at Arthur City, Texas (map identifier S-04; table 1); and C, U.S. Geological Survey streamgage 07337000 Red River at Index, Arkansas (map identifier S-06; table 1).
Groundwater Use
The OWRB permits and regulates all groundwater use except for groundwater withdrawals less than 5 acre-ft/yr used for domestic purposes for irrigating less than 3 acres of land for growing gardens, orchards, or lawns in Oklahoma (Oklahoma Statutes §82–1020.1[2] [Oklahoma State Legislature, 2021a]; OWRB, 2012c; Oklahoma Statutes §82–1020.3 [Oklahoma State Legislature, 2021c]). Since 1980, permitted users have self-reported groundwater-use data annually to the OWRB. Groundwater permits issued by the OWRB are divided into nine categories: (1) irrigation; (2) public supply; (3) industrial; (4) power; (5) mining; (6) commercial; (7) recreation, fish, and wildlife (hereinafter referred to as “recreation”); (8) agricultural; and (9) other. Groundwater use reports submitted to the OWRB by 702 permitted users that withdraw water from the eastern part of the Red River alluvial aquifer were summarized for 1967–2022 (OWRB, 2024b).
Most of the reported groundwater withdrawn from the eastern part of the Red River alluvial aquifer was used for irrigation and accounted for a long-term mean of 1,440 acre-ft/yr, or approximately 84 percent of the total reported groundwater use of 1,720 acre-ft/yr for 1967–2022 (fig. 7A; table 3). Over the same period, a mean of 263 acre-ft/yr, or approximately 15 percent of total groundwater use, was for public supply and the approximately remaining 1 percent was for agriculture (slightly more than 0.9 percent) and a combination of other, industrial, and recreation (slightly less than 0.1 percent). For the purposes of this long-term (1967–2022) analysis, the categories other, industrial, and recreation were combined, owing to their comparatively small shares of total groundwater use in the focus area (slightly less than 0.1 percent of total groundwater use combined). Although the proportions of individual permit categories fluctuated throughout the 1967–2022 period, irrigation was the predominant use category for most years analyzed (fig. 7B). Total reported groundwater use data also fluctuated throughout the study period but indicated an upward pattern overall, especially during 2012–22 for which mean annual groundwater use was 2,235 acre-ft/year greater than the 1967–2022 long-term mean (fig. 7B). This upward pattern in groundwater use is further indicated by comparing mean annual water use during the 1980–2022 study period to the 1967–2022 period of record in which reported nondomestic groundwater use increased approximately 277 acre-ft/yr (table 4). Changes in groundwater use were also observed to coincide with changes in the amount of precipitation falling on the eastern part of the Red River alluvial aquifer. During the 2007–09 period, groundwater use was relatively low (fig. 7B), and precipitation exceeded the long-term mean, which lessened the demand for groundwater withdrawals for irrigation (fig. 4A; Oklahoma Mesonet, 2023; NCEI, 2023). The portion of groundwater use reported for public supply was greater than usual compared to irrigation for the 1982–99 period, which was also a period when annual precipitation exceeded the long-term mean annual precipitation, thereby decreasing groundwater use for irrigation. Total permitted water use increased over the period of record and has not exceeded the total permitted amount (fig. 7B).
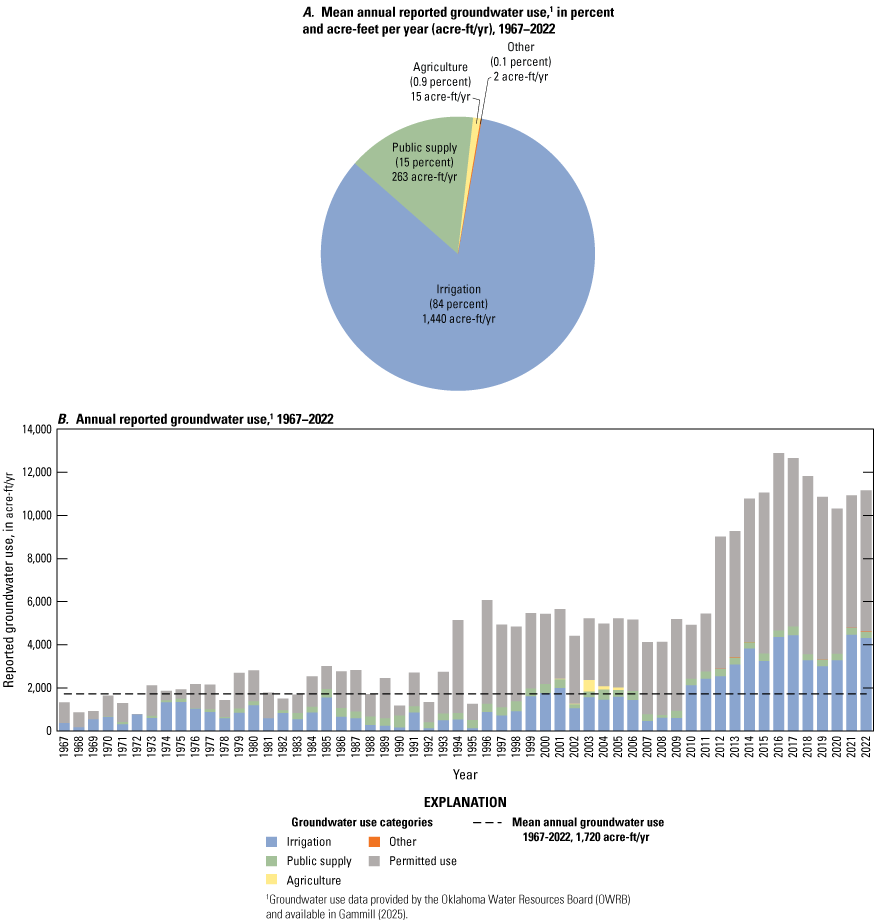
A, Mean annual reported groundwater use by category, and B, annual reported groundwater use, eastern part of the Red River alluvial aquifer, southeastern Oklahoma, 1967–2022.
Table 3.
Reported mean annual groundwater use by type for various periods between 1967 and 2022 for the eastern part of the Red River alluvial aquifer in southeastern Oklahoma.[All values are in acre-feet per year. Groundwater use data were provided by the Oklahoma Water Resources Board and are available in the accompanying data release (Gammill and others, 2025). Table only includes regulated groundwater uses. The category “other” is a sum of the categories other, industrial, and recreation, fish, and wildlife. Table excludes groundwater use less than 5 acre-feet per year for domestic and agricultural purposes and groundwater use for irrigation of fewer than 3 acres of land for growing of gardens, orchards, or lawns (Oklahoma Statutes §82-1020.3)]
Table 4.
Summary statistics of reported groundwater use for various periods between 1967 and 2022 for the eastern part of the Red River alluvial aquifer in southeastern Oklahoma.[All values are in acre-feet per year. Groundwater use data were provided by the Oklahoma Water Resources Board and are available in the accompanying data release (Gammill and others, 2025). Table excludes groundwater use less than 5 acre-feet per year for domestic and agricultural purposes and groundwater use for irrigation of fewer than 3 acres of land for growing of gardens, orchards, or lawns (Oklahoma Statutes §82-1020.3)]
Currently (2025), the OWRB permits active groundwater wells within the study area to withdraw water for various use categories (fig. 8). Across the eastern part of the Red River alluvial aquifer, the predominant use type for these wells is irrigation, with a large concentration near Lake Texoma (fig. 8). All reported annual groundwater use data are published in the accompanying data release (Gammill and others, 2025).
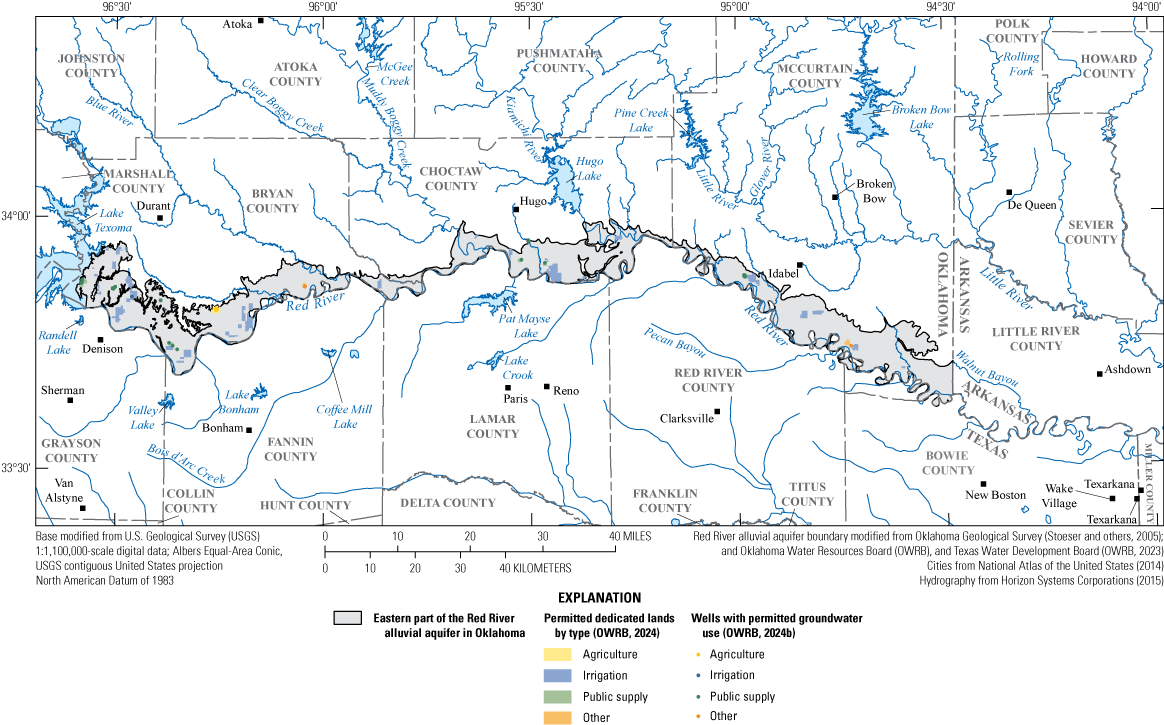
Dedicated land areas and wells permitted for groundwater use in the eastern part of the Red River alluvial aquifer, southeastern Oklahoma, 2024.
Hydrogeology of the Eastern Part of the Red River Alluvial Aquifer
The eastern part of the Red River alluvial aquifer in Oklahoma is contained in Quaternary sedimentary deposits, primarily alluvium and terrace deposits associated with the Red River and its major tributaries. Bedrock units underlying the eastern part of the alluvial aquifer consist mostly of consolidated sandstone and shale. Although faulting occurs within the study area, faults are unlikely to penetrate the alluvium and terrace deposits composing the eastern part of the alluvial aquifer or affect groundwater flow within the aquifer (Huffman and others, 1978).
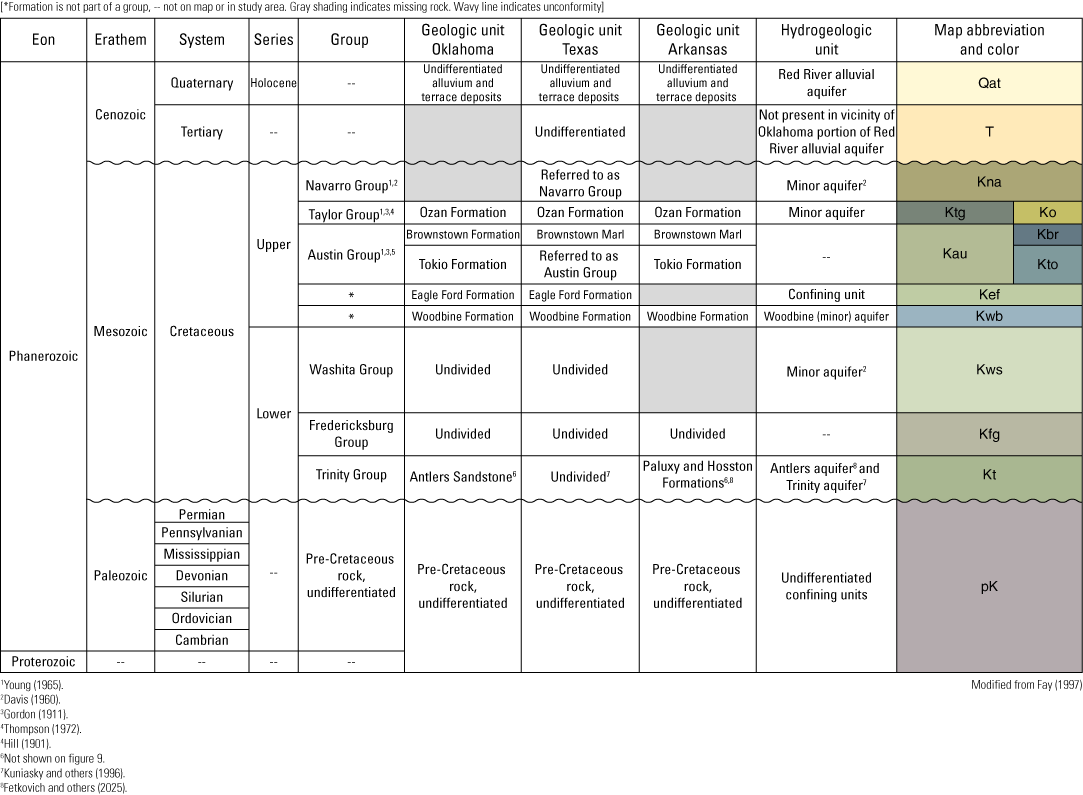
Quaternary Sedimentary Deposits and Cretaceous Bedrock Units
The Quaternary sedimentary deposits in the study area primarily consist of alluvium and terrace deposits formed by the Red River and its tributaries (fig. 9; Ryder, 1996; Stoeser and others, 2005). Alluvium deposits contain sand, silt, and clay (Frye and Leonard, 1963; Huffman and others, 1978). Frye and Leonard (1963) subdivided terrace deposits along the Red River in northern Texas by land-surface altitude, slight compositional and structural differences, and fossil assemblages. The terrace deposits consist of gravel, sand, silt, and clay, and differ slightly in composition and thickness across the study area (Huffman and others, 1978).
Surficial extent of geologic units in the Red River alluvial aquifer study area, southeastern Oklahoma, northeastern Texas, and southwestern Arkansas (Stoeser and others, 2005).
Units that make up the bedrock beneath the eastern part of the Red River alluvial aquifer consist of consolidated units distinct from the alluvium or terrace deposits. In the study area, sedimentary bedrock units deposited during the Cretaceous underlie the alluvium or terrace deposits composing the eastern part of the Red River alluvial aquifer. The Oklahoma Geological Survey described geology at the county scale in Bryan, Choctaw, and McCurtain Counties (Davis, 1960; Huffman and others, 1975, 1978), the three counties east of Lake Texoma that contain the eastern part of the Red River alluvial aquifer in Oklahoma (fig. 1).
The Oklahoma Geological Survey (Huffman and others, 1978) conducted a geology and mineral resources study in Bryan County, documenting that Lower Cretaceous bedrock units from the Trinity Group are exposed at the surface and overlain by extensive Quaternary terrace and alluvium deposits near streams. Lower Cretaceous bedrock units are divided into the Trinity, Fredericksburg, and Washita Groups. Within this area, the Trinity Group is represented in Bryan County by sandstone exposures; the Fredericksburg Group is represented by limestone exposures, sometimes fossiliferous and interbedded with fissile shale; and the Washita Group is represented by sandstone, limestone (sometimes fossiliferous and interbedded with shale), limestone-shale, shale, and marlstone with nodular limestone exposures (Huffman and others, 1978).
The Oklahoma Geological Survey (Huffman and others, 1975) described the geology and mineral resources in Choctaw County, noting that Mississippian or Cretaceous bedrock units are exposed at the surface in Choctaw County. In areas where Lower Cretaceous bedrock units (Trinity, Fredericksburg, and Washita Groups) have been eroded away (or partially eroded away in the case of the Washita Group) in the southeastern part of Choctaw County, the Upper Cretaceous Woodbine Formation unconformably overlies basal layers of the Washita Group. The Woodbine aquifer is considered a minor bedrock aquifer by the OWRB (fig. 10). As in Bryan County, Cretaceous bedrock units in Choctaw County are overlain by extensive Quaternary terrace and alluvium deposits.
Surficial geologic and hydrogeologic units in the Red River alluvial aquifer study area, southeastern Oklahoma, northeastern Texas, and southwestern Arkansas.
The Oklahoma Geological Survey (Davis, 1960) investigated the geology and groundwater resources of southern McCurtain County. In McCurtain County, the Upper Cretaceous Tokio and Woodbine Formations underlie the units containing the eastern part of the Red River alluvial aquifer along most of the southern part of the county. In the southeastern part of McCurtain County along its eastern border, a small exposure of the undifferentiated Upper Cretaceous Ozan and Brownstown Formations underlie units containing the eastern part of the Red River alluvial aquifer. As in Bryan and Choctaw Counties, the Cretaceous bedrock units in McCurtain County are overlain by extensive Quaternary terrace and alluvium deposits.
Groundwater Levels
Hydrologic stressors, such as drought and flooding, can cause groundwater-level fluctuations on a spatial and temporal basis. Various hydrologic stressors affect groundwater-level fluctuations in an alluvial aquifer, including recharge, evapotranspiration, groundwater withdrawal, and streambed seepage (Freeze and Cherry, 1979). In 2021, continuous groundwater-level recorders were installed in six pre-existing wells completed in the eastern part of the Red River alluvial aquifer (wells Red01–Red06) (fig. 1; table 1; USGS, 2024). Seasonal groundwater-level patterns were similar for these six wells (fig. 11A–D). Groundwater levels typically decreased during summer and winter and increased during spring and fall. Precipitation data collected at nearby USGS streamgages were compared to groundwater levels from each USGS groundwater well. Groundwater levels measured at wells Red02, Red05, and Red06 displayed large changes in response to precipitation, whereas the changes in groundwater levels measured at wells Red03 and Red04 were muted following precipitation. The pattern of changes in groundwater levels recorded in wells Red03 and Red04 in response to groundwater withdrawals from nearby irrigation wells was characterized by rapid decreases in groundwater levels when irrigation withdrawals were occurring and slow recoveries after the withdrawals ceased. The groundwater-levels measured in well Red01 do not change appreciably as a result of changes in groundwater withdrawals for irrigation or in response to precipitation, but they do display seasonal fluctuations similar to those observed in the groundwater levels measured in wells Red02, Red05, and Red06.
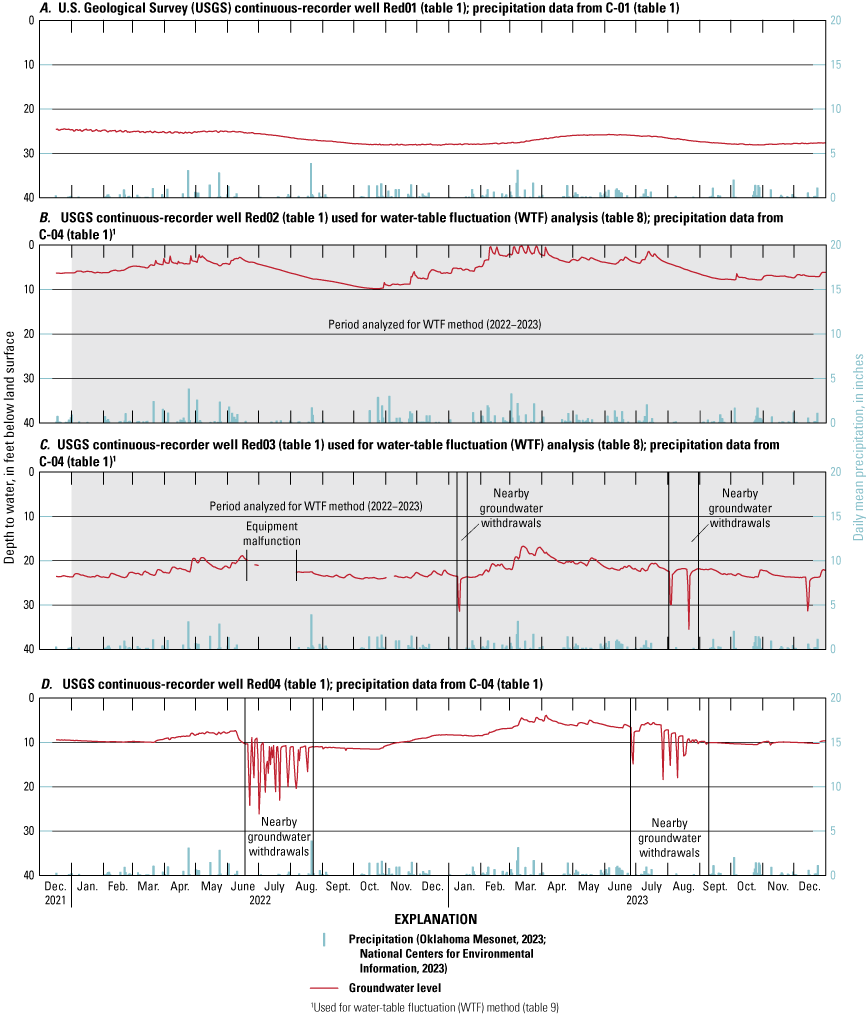
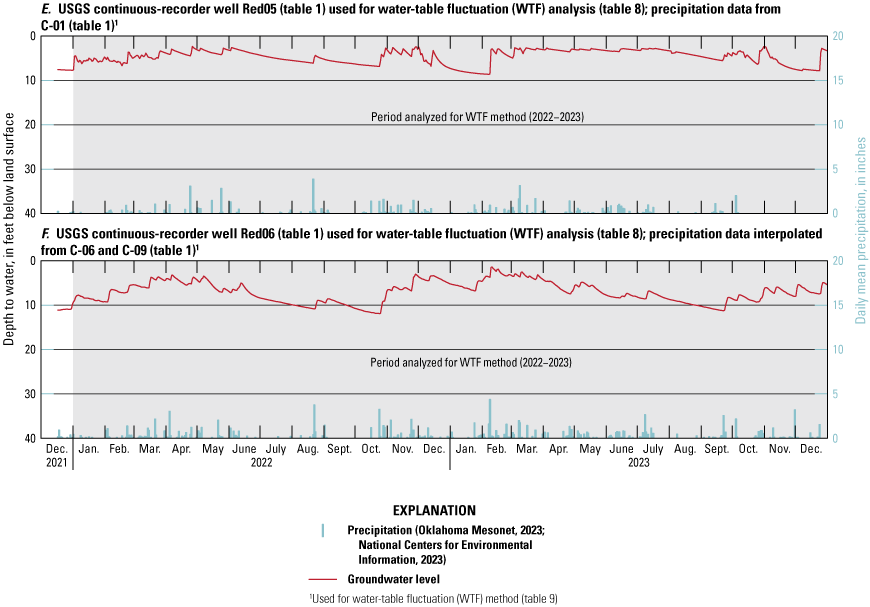
Groundwater levels measured in continuous U.S. Geological Survey recorder wells in the eastern part of the Red River alluvial aquifer study area in southeastern Oklahoma and northeastern Texas.
Water Quality
Because of the considerable surface-water-groundwater interaction in alluvial aquifers (Winter, 1995), a combination of surface-water and groundwater samples were used to assess water quality in the eastern part of the Red River alluvial aquifer. The OWRB collected groundwater-quality samples at sites in the study area in August 2015 and again in June 2019 as part of their Groundwater Monitoring and Assessment Program (OWRB, 2018). In addition to the groundwater-quality data collected by the OWRB, surface-water-quality data were obtained from the NWIS database (USGS, 2024) from USGS sites in the study area sampled between October 1, 1959, and October 27, 2011. Water-quality data from 21 samples collected at 16 OWRB groundwater sites and 189 samples collected at 3 USGS streamgage sites (S-01, S-04, S-05; fig. 1; table 1) in the study area were used for analysis after omitting samples with incomplete data or samples with an ionic charge-balance error exceeding 20 percent after the major-ion concentrations were converted into milliequivalents (Hem, 1985). USGS surface-water samples used in this analysis were collected from the Red River.
Major cations and anions were examined using the Piper (1944) method (fig. 12). For this method, the selected major cations were calcium (Ca2+), magnesium (Mg2+), potassium (K+), and sodium (Na+), and the selected major anions were bicarbonate (HCO3−), carbonate (C032−), chloride (Cl−), fluoride (F−), and sulfate (SO42−). Samples lacking data for more than two major ions were not included in the analysis. Water-quality data were converted from milligrams per liter to milliequivalents per liter before the charge-balance error was calculated for each sample by using the following equation:
whereis the charge-balance error, in percent;
is the sum of the selected major cations, in milliequivalents; and
is the sum of the selected major anions, in milliequivalents.
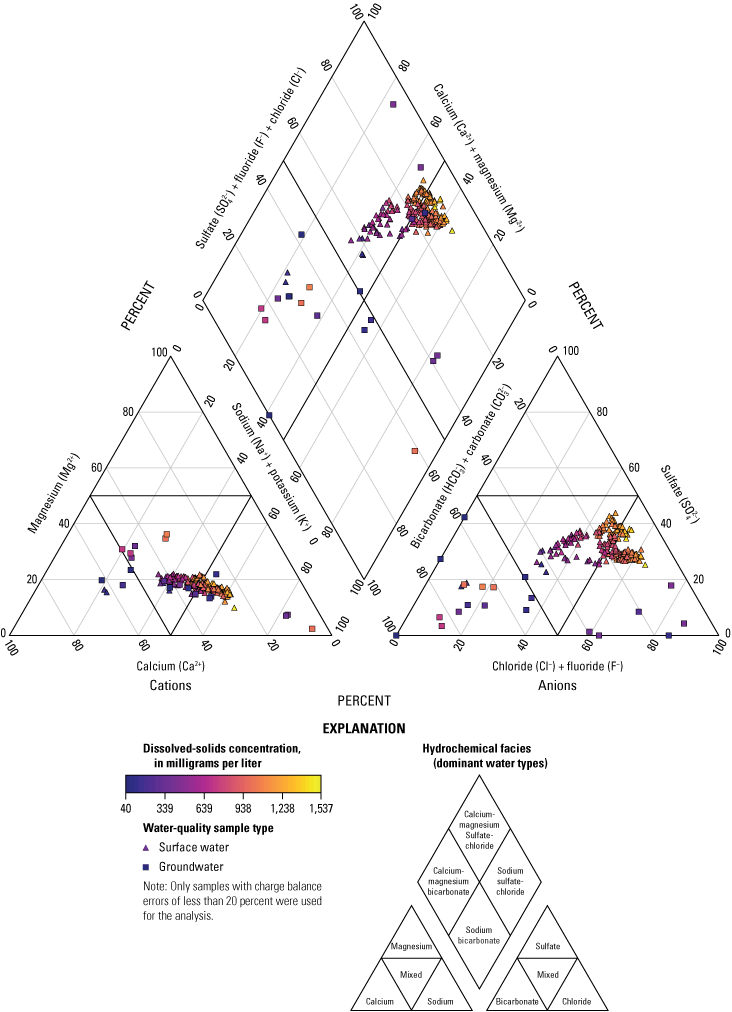
Relations between major cations and anions measured in water-quality samples collected from the eastern part of the Red River alluvial aquifer study area in southeastern Oklahoma, 1996–2019 (Oklahoma Water Resources Board, 2023; U.S. Geological Survey, 2024).
Surface-water quality samples tended to tightly cluster on the Piper diagrams and proportionally contained higher concentrations of magnesium, sodium, potassium, sulfate, and chloride, with dominant water types of Ca-Mg-SO4-Cl and Na-SO4-Cl. OWRB groundwater-quality samples were less clustered compared to surface-water samples. Groundwater-quality samples displayed higher concentrations of sodium, potassium, bicarbonate, carbonate, and chloride (fig. 12).
Dissolved-solids concentrations in the reported water-quality samples ranged from 40 to 1,537 mg/L, with a mean concentration of 893 mg/L and a median concentration of 977 mg/L (Gammill and others, 2025). The U.S. Environmental Protection Agency (2017) has established a secondary drinking-water standard of 500 mg/L for dissolved-solids concentrations, and the State of Oklahoma designates a domestic beneficial use for groundwater with dissolved-solids concentrations of less than 3,000 mg/L (OWRB, 2015). Dissolved-solids concentrations in groundwater-quality samples tended to be lower compared to those in surface-water samples. Results from OWRB groundwater-quality samples used for this analysis indicated dissolved-solids concentrations ranged from 40 to 1,064 mg/L, with a mean of 385 mg/L. In contrast, dissolved-solids concentrations in surface-water samples ranged from 106 to 1,537 mg/L, with a mean of 947 mg/L. Altogether, 179 of the 209 total number of samples used for Piper (1944) analysis exceeded the U.S. Environmental Protection Agency secondary drinking-water standard of 500 mg/L for dissolved-solids concentrations.
Textural and Hydraulic Properties
The distribution and variability of textural and hydraulic properties of aquifer materials were assumed to be the primary controls on groundwater flow in the eastern part of the Red River alluvial aquifer. Methods used to estimate the range of hydraulic conductivity values in the aquifer included hydraulic profiling in test holes, analysis of cored material, summary of lithologic logs, and a multiwell aquifer test.
Horizontal Hydraulic Conductivity Estimated From Test Holes and Cores
A direct-push Geoprobe hydraulic profiling tool (HPT) (Geoprobe Systems, 2015) was used to estimate horizontal hydraulic conductivity at nine test holes (Kh01–Kh09) across the eastern part of the Red River alluvial aquifer (fig. 1; table 1). To estimate horizontal hydraulic conductivity, water was injected at 0.05-ft depth intervals, and electrical conductivity, injection pressure (corrected for the hydrostatic pressure gradient when saturated), and injection rate were recorded. Horizontal hydraulic conductivity was calculated from data collected in each test hole at selected depth intervals by using the ratio of injection flow rate and injection pressure (Geoprobe Systems, 2015). This ratio method (McCall, 2010) is appropriate for estimating horizontal hydraulic conductivity where it is less than 150 feet per day (ft/d) in the saturated zone of an unconsolidated aquifer. All nine HPT sites were drilled to a depth of refusal, which was assumed to be the contact of the alluvium and terrace deposits with underlying bedrock units (Rogers and others, 2023).
The nine test holes were drilled to a range of 28.4 to 56.7 ft below land surface (table 5). At these test holes, the estimated depth to water ranged from 17.3 to 42.9 ft below land surface, and the mean horizontal hydraulic conductivity at each test hole ranged from 7.5 to 113 ft/d, with an overall mean of 62.2 ft/d (table 6). The distribution of discrete HPT horizontal hydraulic conductivity values is depicted in fig. 13A, B.
Table 5.
Horizontal hydraulic conductivities calculated by using a Geoprobe hydraulic profiling tool at nine test holes in southeastern Oklahoma and northeastern Texas.Table 6.
Summary statistics of horizontal hydraulic conductivities obtained at nine test holes by using a Geoprobe hydraulic profiling tool (HPT) in southeastern Oklahoma and northeastern Texas (fig. 1; tables 1, 5).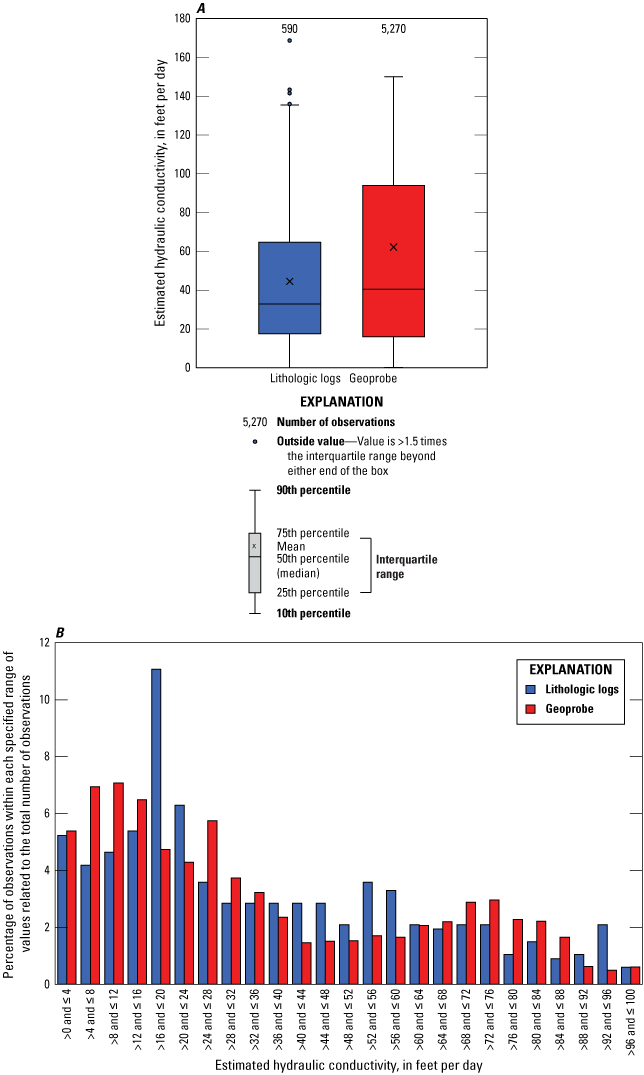
A, Range of estimate hydraulic conductivity values, and B, distribution of estimated hydraulic conductivity values and estimated horizontal hydraulic conductivity obtained from lithologic logs and by using Geoprobe hydraulic profiling tool (HPT) in the Red River alluvial aquifer in southeastern Oklahoma and northeastern Texas.
At one HPT test-hole site, Kh02 (fig. 1; table 1), a 27-foot core sediment sample was collected to check the accuracy of the HPT horizontal hydraulic conductivity measurements. Sediment cores were retrieved in 48-in.-long plastic tubes with a 2.25-in. diameter. The sediment core measured in the Kh02 test hole, like all other HPT measurements, was obtained by drilling from land surface to a depth of refusal, which was assumed to be the bedrock contact. Sediment cores were described in small depth increments by noting changes to grain size, sorting, and Munsell (1912) color; the data produced by this effort are included in the accompanying data release (Gammill and others, 2025). The lithologic descriptions of the sediment cores were grouped into one of six lithologic categories based on the dominant grain size: fine sand, medium sand, coarse sand, gravel, and clay. Lithologic descriptions obtained from the core were then correlated to the HPT values at the same depth to estimate horizontal hydraulic conductivity for each lithology (table 7). Mean horizontal hydraulic conductivity for the core collected at the Kh02 test hole was 29 ft/d (table 7).
Horizontal Hydraulic Conductivity Estimated From Lithologic Logs
Horizontal hydraulic conductivity distribution across the eastern part of the Red River alluvial aquifer was estimated by using information obtained from lithologic logs (OWRB, 2023; Texas Water Development Board [TWDB], 2023). Hydraulic conductivity is a measure of the capacity of a porous medium to transmit water (Driscoll, 1986). Lithologic logs were compiled and analyzed to characterize the alluvium and terrace deposits of the eastern part of the Red River alluvial aquifer. Because the OWRB and TWDB have not currently (2025) required standardized reporting of lithologic-log descriptions for the rocks and sediments recovered during drilling, lithologic logs sometimes used different terms for describing the same or similar rocks and sediments. For this report, descriptions of the rocks and sediments were standardized by using the techniques described in Mashburn and others (2014).
Lithologic-log descriptions of sediments contained in the eastern part of the Red River alluvial aquifer were classified by using the following standard lithologic categories (Wentworth, 1922; Guy, 1969; Mashburn and others, 2014):
-
• silt and clay (less than or equal to 0.0625 millimeter [mm] to less than 0.125 mm),
-
• fine sand (0.125 mm to less than 0.25 mm),
-
• medium sand (0.25 mm to less than 0.50 mm),
-
• coarse sand (0.50 mm to less than 1 mm),
-
• very coarse sand (1 mm to less than 2 mm), and
-
• fine gravel (2 mm to less than 4 mm).
As described in the “Spatial Distribution of Lithologic Categories” section of Paizis and Trevisan (2021, p. 23), for each section of a lithologic log, a percentage of coarse materials ranging from 0 percent coarse materials (no coarse materials, only silt and clay) to 100 percent coarse materials (only fine gravel or larger particles) was assigned by evaluating the sediment composition:
-
• If the given section of the lithologic log was classified as silt and clay, it was assumed to have 0–20 percent coarse material.
-
• If the given section of the lithologic log was classified as fine sand, it was assumed to have 21–40 percent coarse material.
-
• If the given section of the lithologic log was classified as medium sand, it was assumed to have 41–60 percent coarse material.
-
• If the given section of the lithologic log was classified as coarse sand/very coarse sand, it was assumed to have 61–80 percent coarse material.
-
• If the given section of the lithologic log was classified as fine gravel, it was assumed to have 81–100 percent coarse material.
Lithologic-log descriptions with obvious errors were corrected, and lithologic logs were omitted from the study if the descriptions contained unclear, few, or no descriptions of sediments and rocks. Additionally, lithologic logs for wells drilled less than 15 ft deep were excluded from the analysis, as lithologic-log descriptions from those wells were assumed to not be representative of the aquifer. The lithologic logs were then used to calculate hydraulic conductivity by using the following equation, modified from Ellis and others (2017):
whereKh
is the horizontal hydraulic conductivity, in feet per day; and
Ps
is the percentage-coarse-material value.
Calculated hydraulic conductivity values from lithologic logs ranged from approximately 0.02 to 169 ft/d, with a mean of 44.5 ft/d (fig. 13A). Hydraulic conductivity values derived from lithologic logs are similar to hydraulic conductivity values obtained by using a Geoprobe HPT (fig. 13B).
Hydraulic Properties Estimated From a Multiwell Aquifer Test
Multiwell aquifer tests are a more accurate method for estimating mean hydraulic conductivity and storage properties of aquifer materials compared to other methods such as deriving conductivity from grain size (Freeze and Cherry, 1979). A multiwell aquifer test was completed in November 2023 at an irrigation well in the eastern part of the Red River alluvial aquifer (well Red07; fig. 1; table 1). To conduct the test, well Red07 groundwater was withdrawn at an approximately constant rate of 316 gallons per minute for approximately 21 hours until the water levels measured in the designated observation well for the aquifer test (well Red04) stabilized (fig. 14A). The observation well Red04 was approximately 233 ft from the pumping well (well Red07). Pumping induced a maximum drawdown of 25.8 ft in the pumping well (Red07) (fig. 14A) and 1.33 ft in the observation well (Red04) (fig. 14C).
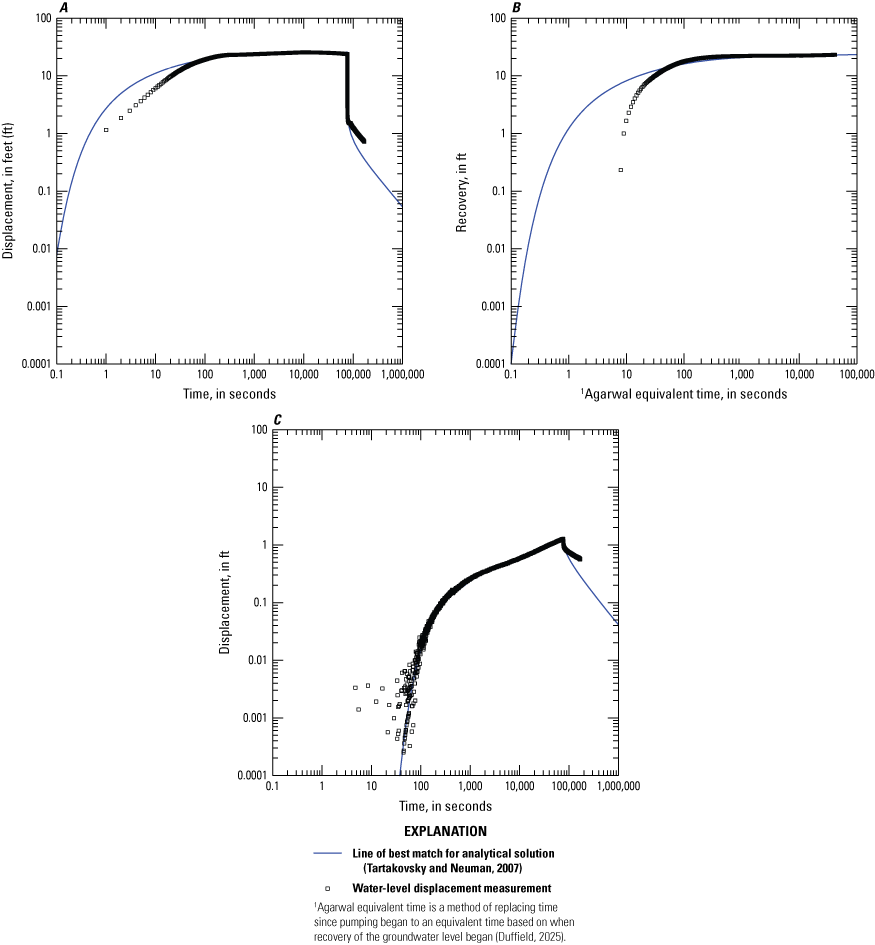
A, Pumping drawdown data curve for well Red07; B, pumping recovery curve from well Red07; and C, pumping drawdown curve from observation well Red04, with best-fit Tartakovsky-Neuman method for unconfined aquifer analysis (Tartakovsky and Neuman, 2007; Gammill and others, 2025).
Water levels from the pumping and recovery period were matched to a curve defined by the Tartakovsky and Neuman (2007) method, which computes drawdown in an unconfined aquifer using the following equation:
whereS
is the drawdown in an unconfined aquifer;
ST
is the drawdown for a fully penetrating well in a nonleaky confined aquifer;
SH
is the drawdown correction for partial penetration in a nonleaky confined aquifer; and
SU
is the drawdown correction for saturated-unsaturated flow in an unconfined aquifer.
Drawdown and recovery data obtained using the Tartakovsky and Neuman (2007) method were reported in either standard time or Agarwal equivalent time—an adjustment that transforms standard time into an equivalent time that is relative only to recovery time (Duffield, 2025). The Tartakovsky and Neuman (2007) method is most appropriate for evaluating groundwater flow in an unconfined aquifer, such as the eastern part of the Red River alluvial aquifer. The multiwell aquifer test was analyzed by using the AQTESOLV software package (Hydrosolve, Inc., 2011). Hydraulic properties presented in this report were collected from the observation well (Red04). Transmissivity, specific yield, and the storage coefficient were estimated by using the Tartakovsky and Neuman (2007) method with a user-specified saturated thickness value. A saturated thickness value of 116.5 ft was used for the observation well (Red04) and was computed from the saturated thickness map as discussed in the “Potentiometric Surface and Saturated Thickness” section herein. Transmissivity in the observation well was approximately 7,900 square feet per day (ft2/d). Geohydrologic-unit hydraulic conductivity was estimated at 67.49 ft/d. Specific yield (unitless) was estimated at 0.038, and the estimated storage coefficient (also unitless) was estimated at 0.002 (fig. 14).
Hydraulic Properties From Previous Reports
Although published reports describing the textural and hydraulic properties specific to the eastern part of the Red River alluvial aquifer were not found during the literature review, those properties have been described for the alluvial aquifers associated with selected tributaries to the Red River. Smith and others (2017, 2021) described the North Fork Red River aquifer and the Salt Fork Red River aquifer and included data relevant to the hydraulic and textural properties of these aquifers. The methods and data described in Smith and others (2017, 2021) for estimating hydraulic properties were also used in this report.
Smith and others (2017) estimated textural and hydraulic properties of the North Fork Red River aquifer by using lithologic logs, Geoprobe HPT logs, and a multiwell aquifer test. Mean hydraulic conductivity values estimated from lithologic logs and HPT were 52 and 61 ft/d, respectively. Mean horizontal hydraulic conductivity values were 4 ft/d higher when they were estimated by using well logs and 1 ft/d lower when they were estimated by using HPT in the North Fork Red River aquifer compared to the well log and HPT estimates of mean hydraulic conductivity for the eastern part of the Red River alluvial aquifer, respectively. Mean transmissivity estimated from the multiwell aquifer test ranged from 5,900 to 7,900 ft2/d for the North Fork Red River aquifer, which was comparable to the estimate obtained from the multiwell aquifer test described in this report (7,900 ft2/d).
Smith and others (2021) estimated horizontal hydraulic conductivity properties of the Salt Fork Red River aquifer by using lithologic logs and Geoprobe HPT logs. For the Salt Fork Red River aquifer, the mean hydraulic conductivity estimated from lithologic logs was 45 ft/d, and the mean hydraulic conductivity estimated from Geoprobe HPT logs was 51 ft/d. The mean horizontal hydraulic conductivity estimated from lithologic logs in Smith and others (2021) was 3 ft/d less than the 48-ft/d mean estimated from lithologic logs for the eastern part of the Red River alluvial aquifer. The mean horizontal hydraulic conductivity estimated from Geoprobe HPT logs in the Salt Fork Red River aquifer was 51 ft/d, which was 11 ft/d less than the 62 ft/d mean estimated for the eastern part of the Red River alluvial aquifer by using Geoprobe HPT logs.
Hydrogeologic Framework
A hydrogeologic framework serves as a three-dimensional model of an aquifer, illustrating its interactions with adjacent geologic formations and influences on groundwater flow. For alluvial and terrace deposits in the eastern part of the Red River alluvial aquifer, this framework incorporates revised definitions of the aquifer’s boundaries and potentiometric surface, along with an analysis of the hydraulic and textural characteristics of aquifer materials. This hydrogeologic framework was utilized to develop a conceptual groundwater-flow model for the eastern part of the Red River alluvial aquifer presented in this report.
Aquifer Extent
The spatial extent of the eastern part of the Red River alluvial aquifer was determined by using 1:250,000-scale geologic maps (Stoeser and others, 2005). The eastern part of this alluvial aquifer extends vertically from land surface to the depth of the geologic contact of the alluvium and terrace deposits with underlying bedrock units. The spatial extent of the aquifer is further defined by the eastern border of Lake Texoma, the Oklahoma-Texas State line, and the confluence of the Blue River with the Red River.
Where the eastern part of the Red River alluvial aquifer is present, the top of the Red River alluvial aquifer was defined as the land-surface altitude obtained from a 10-m (horizontal resolution) digital elevation model (DEM) (USGS, 2015) with filled depressions. The altitude of the base of the eastern part of the aquifer was contoured at a 20-ft interval from bedrock depths obtained from lithologic logs, well-completion reports, and test-hole data (OWRB, 2023; TWDB, 2023). The potentiometric surface of the aquifer was constructed using groundwater-level data and was used to determine saturated thickness for the aquifer by subtracting the base-of-aquifer altitude. The altitude of the base of the aquifer was calculated by subtracting the measured bedrock depth from the land-surface altitude. For consistency, the land-surface altitude was obtained from the 10-m DEM, even when the data source provided a land-surface altitude.
Lithologic logs obtained from the OWRB (2023) and the TWDB (2023) were used to construct the alluvium and bedrock surface contact of the Red River alluvial aquifer in records where the bedrock contact could be determined. Permian bedrock unit terms were used to identify red or consolidated materials such as “red bed,” “bedrock,” and “shale.” The bedrock surface was defined at the base of the aquifer by the presence of a red sand or shale on an impervious red clay layer adjoining an alluvial sand or gravel. The altitude of the base of the aquifer, determined from well logs, was contoured at a 20-ft interval. The altitude of the base of the eastern part of the Red River alluvial aquifer (fig. 15) ranged from 220 to 580 ft. The base of the aquifer dips downward from the aquifer’s border with Lake Texoma in the west eastward toward the Arkansas State line.
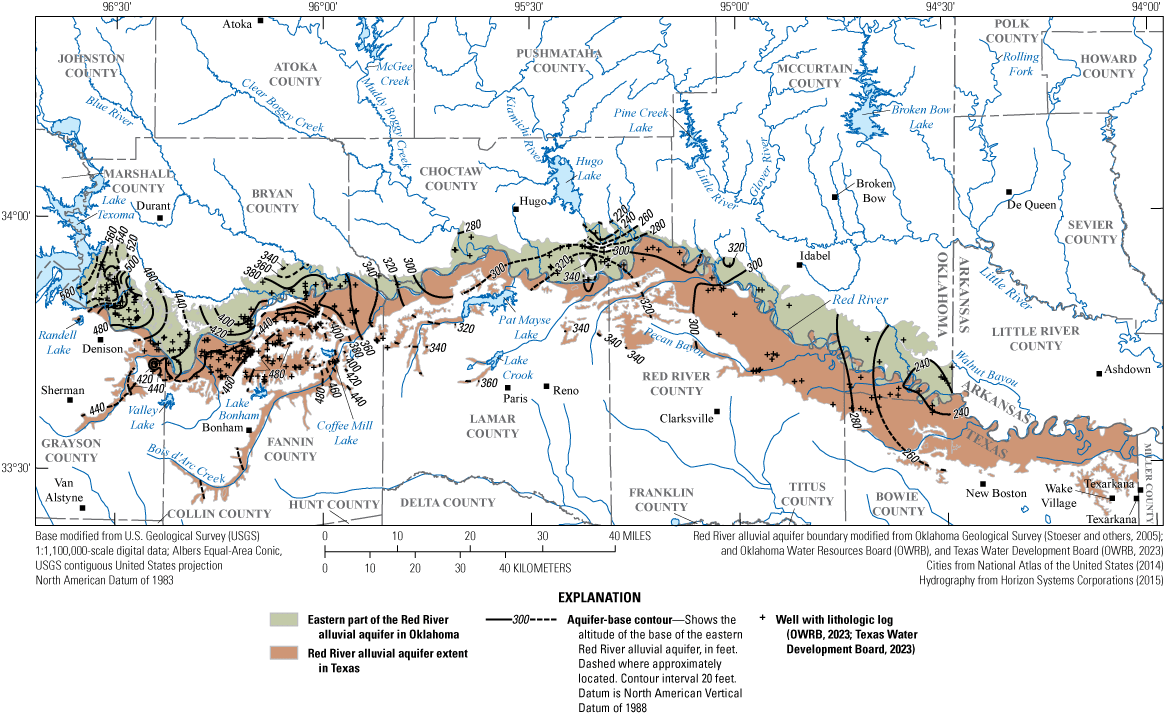
Altitude of the base of the eastern part of the Red River alluvial aquifer, constructed by using data from lithologic logs, in southeastern Oklahoma and northeastern Texas (Oklahoma Water Resources Board, 2023; Texas Water Development Board, 2023).
Potentiometric Surface and Saturated Thickness
A potentiometric surface is a theoretical topographic surface that displays the altitude at which water would have stood in tightly cased wells at a specified time across a given aquifer (Fetter, 2001). Potentiometric surface maps can be used to identify general groundwater-flow directions and delineate subsurface groundwater basins within an aquifer. Groundwater generally flows perpendicularly to contours from areas of high potentiometric altitudes to areas of low potentiometric altitudes (Freeze and Cherry, 1979).
A potentiometric surface map was constructed for the eastern part of the Red River alluvial aquifer by interpolating synoptic groundwater-level altitude data to create a continuous surface. Synoptic data were measured at wells constructed with steel or polyvinyl chloride casings with sand backfill surrounding the outside of the casings. To determine groundwater-level altitudes, the depth to water below land-surface datum was measured at each well by using a calibrated electric tape following methods described in Cunningham and Schalk (2011). The depth to water was subtracted from the land surface datum, referenced to the North American Vertical Datum of 1988 (NAVD 88), to compute the groundwater-level altitude at each well (Cunningham and Schalk, 2011). A stream is an expression of the groundwater-level altitude, so additional water-surface altitudes along streams were obtained from the 10-meter DEM and used as control points to create the potentiometric surface map (USGS, 2015). The groundwater-level altitudes, including the water-surface altitudes along streams, were interpolated by using inverse-distance-weighted interpolation methods in ArcGIS (Esri, 2024a). Contours were constructed from the interpolated surface and compared to altitude data from the DEM to ensure that potentiometric contours were below land surface.
During February 28–March 2, 2022, synoptic groundwater-level-altitude measurements were made at 44 wells across the Red River alluvial aquifer study area. Depth to the water table ranged from 1.36 to 65.85 ft below land surface datum. Additional groundwater-level altitude measurements were compiled from OWRB well-completion reports, which provided the interval depth at which water was first observed during the well drilling process (OWRB, 2023). Groundwater generally flowed in the same east-west direction as the flow of the Red River from a water-level altitude of approximately 680 ft near Lake Texoma in the west to 240 ft near the Arkansas State line in the east (fig. 16).
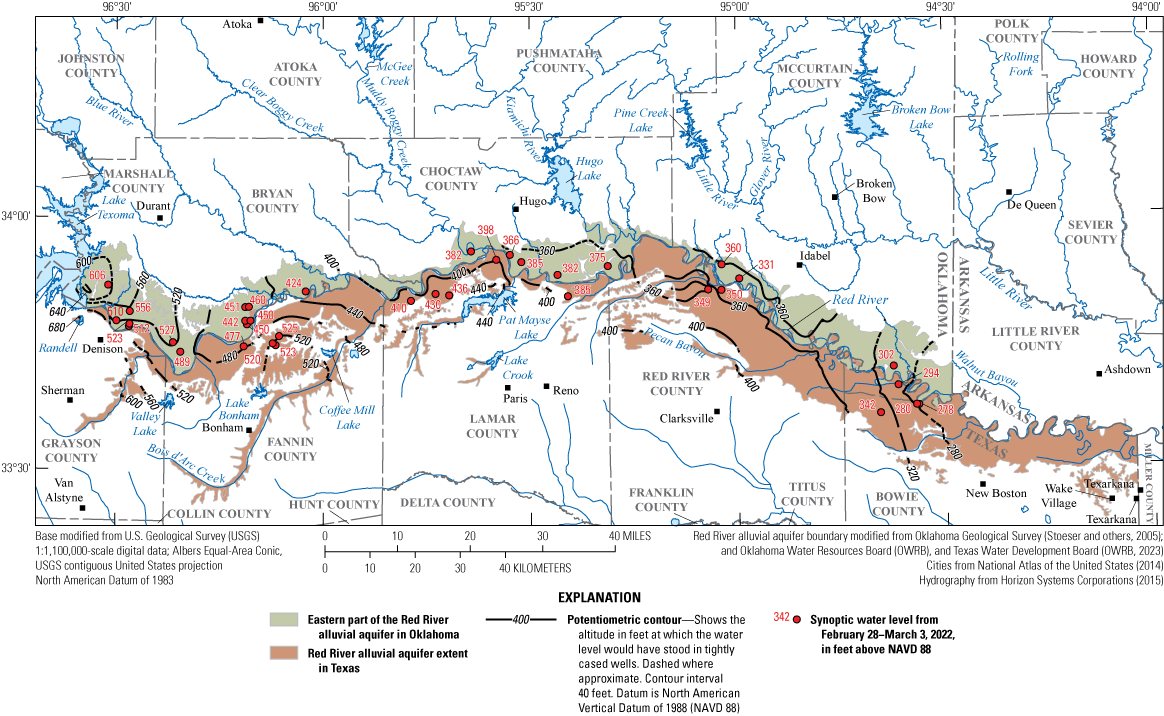
Potentiometric surface of the Red River alluvial aquifer in February and March 2022, southeastern Oklahoma and northeastern Texas.
Saturated thickness was determined by subtracting the estimated altitude of the aquifer base—specifically, the contact between the base of alluvium that contains the aquifer and the top underlying bedrock—from the simulated groundwater-level altitude. Data from 211 lithologic logs were carefully checked to eliminate inaccurate point data, such as negative saturated thickness values that could affect saturated thickness interpolation, and then used to estimate saturated thickness (fig. 17). Saturated thickness was not calculated in parts of the study area where data were not available (fig. 17). Given the insufficient quantity of groundwater-level altitude measurements for parts of the aquifer within 1 mi of the Red River, some saturated thickness values were initially simulated as negative values. To eliminate negative saturated thickness values simulated within 1 mi of the Red River, a minimum of 20 ft of saturated thickness was required. This assumed minimum value is considered conservative based on the assumed 35–50 ft of saturated thickness of the similar sand-channel Washita alluvial aquifer (Hart, 1965). Bedrock altitudes determined from lithologic log point-data were used to create a topographic raster that in turn was used to create bedrock altitude contours. The bedrock-altitude contours were compared to potentiometric surface contours to ensure that bedrock contours were always lower in altitude than potentiometric contours. Simulated saturated thickness within the aquifer included a minimum thickness of 0 ft, a maximum thickness of 141.19 ft, and a mean thickness of 62.13 ft.
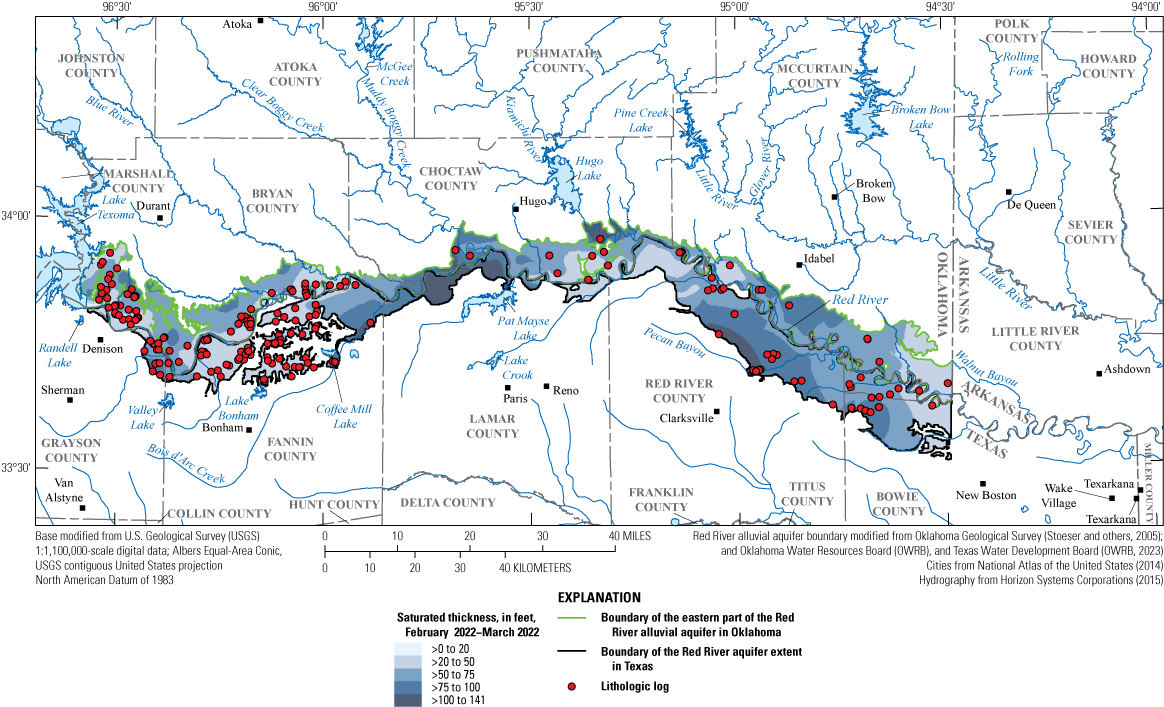
Estimated saturated thickness of the Red River alluvial aquifer in February and March 2022, southeastern Oklahoma and northeastern Texas.
Conceptual Groundwater-Flow Model and Water Budget
A conceptual groundwater-flow model (hereinafter referred to as the “conceptual model”) is a simplified representation of the groundwater-flow system that accounts for the major inflow and outflow sources across hydrologic boundaries for a specified period. For this report, hydrologic boundaries are boundaries based upon the hydrogeologic framework where groundwater flows into or out of an aquifer, potentially affecting the total storage of the aquifer. The conceptual-model water budget (fig. 18; table 8) was used to estimate mean annual inflows and outflows for the eastern part of the Red River alluvial aquifer during the 1980–2022 study period. Estimated groundwater flows in the conceptual model were assumed to be analogous to those in similar alluvial aquifers in Oklahoma (Ryter and Correll, 2016; Ellis and others, 2017, 2020; Smith and others, 2017, 2021; Rogers and others, 2023).
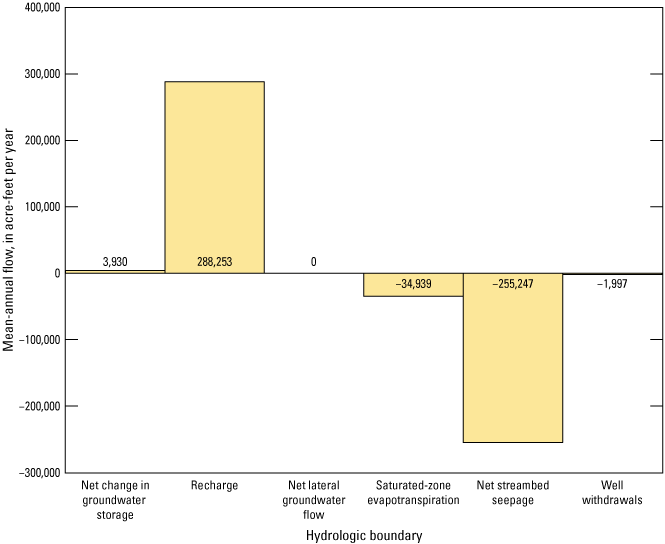
Estimated mean annual inflows and outflows by water-budget component for the conceptual model of the eastern part of the Red River alluvial aquifer, southeastern Oklahoma, 1980–2022.
Table 8.
Conceptual-model water budget of estimated mean annual inflows and outflows for hydrologic boundaries for the eastern part of the Red River alluvial aquifer, southeastern Oklahoma, 1980–2022.[acre-ft/yr, acre-foot per year; in/yr, inch per year; USGS, U.S. Geological Survey; NWI, National Wetlands Inventory; OWRB, Oklahoma Water Resources Board; --, not quantified; %, percent]
| Hydrologic boundary | Mean annual inflow or outflow amount (acre-ft/yr) | Percentage of water budget | Notes |
|---|---|---|---|
| Recharge | 288,250 | 98.7% | 8.62 in/yr or 17.98 percent of mean annual precipitation estimated using the Soil-Water-Balance code (Westenbroek and others, 2010). |
| Net change in groundwater storage | 3,930 | 1.3% | Assumed to be a negligible part of water budget, used to balance the model. |
| Total inflow | 292,183 | 100% | |
| Net streambed seepage | 255,247 | 87.4% | Estimated from streamflow and base-flow data at selected USGS streamgages and streamflow at Hugo Lake Dam (U.S. Army Corps of Engineers, 2024). |
| Net lateral groundwater flow | -- | -- | Assumed to be negligible part of water budget. |
| Saturated-zone evapotranspiration | 34,939 | 11.9% | 1.8 in/yr multiplied by the total NWI wetland area of 232,926 acres (U.S. Fish and Wildlife Service, 2023) overlying 58% of the eastern part of the Red River alluvial aquifer. Evapotranspiration value adjusted from White (1932) to account for differences in climate and length of growing season. |
| Well withdrawals | 1,997 | 0.7% | From OWRB reported groundwater use data (table 3). Mean reported use for the study period 1980–2022 (OWRB, 2024b). |
| Total outflow | 292,183 | 100% |
Hydrologic Boundaries
For the purposes of the conceptual model discussed in this report, hydrologic boundaries represent sources (inflows) and sinks (outflows) of water to and from the eastern part of the Red River alluvial aquifer. Some hydrologic boundaries can function as both sources of inflows and sinks for outflows and were classified as locations of “net inflows” or “net outflows” in this report, depending on which is the dominant flow component.
Recharge
For the purposes of this report, recharge is the infiltration of precipitation through the soil zone to the saturated zone. Infiltration occurs when precipitation falls on the land surface and percolates downward into the unsaturated zone (Freeze and Cherry, 1979). Many factors affect the amount of recharge to the aquifer, such as the amount of water stored in the unsaturated zone, the slope of the land surface, the composition of rocks and soils that contain the aquifer, the type of vegetation and general land use over the aquifer, and the intensity and duration of precipitation. Because many factors affect recharge, estimates are difficult to quantify. Two methods were used in this study to estimate recharge: the water-table fluctuation (WTF) method, used to estimate local recharge for the 2021–23 period, and application of the Soil-Water-Balance (SWB) code, used to model regional, spatially distributed recharge rates across the study area for 1980–2022 study period.
WTF Method
The WTF method (Healy and Cook, 2002) was used to estimate localized recharge for the eastern part of the Red River alluvial aquifer. The WTF method assumes that short-term level rises, lasting hours to days, in unconfined groundwater wells are attributable to precipitation causing recharge in the saturated zone of an aquifer. The WTF method is best applied to groundwater wells placed in locations with a shallow water table that display rapid responses to precipitation. The WTF method requires knowledge or estimation of specific yield, which can be variable across an aquifer. The WTF method was used to directly calculate recharge at specified groundwater wells using the following formula:
whereR
is recharge, in inches per year;
Sy
is the specific yield of the aquifer (dimensionless);
Δh
is the change in water-level altitude, in inches; and
Δt
is the change in time, in years.
Water-level hydrographs from four of the six USGS continuous groundwater-level recording wells in the study area were used for WTF analysis because their hydrographs and locations were appropriate for the requirements and assumptions of the WTF method (Healy and Cook, 2002); the four wells used in the analysis were wells Red02, Red03, Red05, and Red06 (fig. 11A–D; table 9; USGS, 2024). Well Red01 was excluded from WTF analysis because of inadequate signals in water-level fluctuation, whereas well Red04 was excluded because the groundwater withdrawals at this well were much larger than the groundwater withdrawals at any of the other wells. The groundwater withdrawals at wells Red02, Red03, Red05, and Red06 were analyzed for 2022 and 2023. A specific yield () value of 0.038 was estimated by using the Tartakovsky and Neuman (2007) method with the data collected from observation well Red04 during the multiwell aquifer test and was used for WTF analysis. Daily precipitation data for the period 1980–2023 were obtained from climate sites closest to each USGS continuous groundwater-level recording well (fig. 1; table 1; Oklahoma Mesonet, 2023; NCEI, 2023).
Table 9.
Summary of recharge estimates using the water-table fluctuation method for the Red River alluvial aquifer in southeastern Oklahoma and northeastern Texas, 2022–23.[NCEI, National Centers for Environmental Information; Dates in mm/dd/yyyy format. Continuous water-level recorder wells Red01 and Red04 were not suitable for analysis with the water-table-fluctuation method. Estimated specific yield values are provided in E notation. %, percent; --, not applicable]
| Descriptor | U.S. Geological Survey continuous water-level-recorder well (fig. 1; table 1) | |||
|---|---|---|---|---|
| Red02 | Red03 | Red05 | Red06 | |
| Mean annual precipitation during 1980–2022, in inches, from nearby NCEI climate stations | 46.2 | 46.2 | 44.1 | 47.6 |
| Applicable NCEI or Oklahoma Mesonet climate stations | C-04, C-07 | C-04, C-07 | C-01, C-02 | C-06, C-09 |
| Estimated specific yield | 3.8E-02 | 3.8E-02 | 3.8E-02 | 3.8E-02 |
| Year 1, date range | 01/01/2022–12/31/2022 | 01/01/2022–12/31/2022 | 01/01/2022–12/31/2022 | 01/01/2022–12/31/2022 |
| Station annual precipitation, in inches | 43.0 | 43.0 | 37.0 | 48.1 |
| Sum of water-level rises, in feet | 22.5 | 27.5 | 34.5 | 35.4 |
| Recharge, in inches per year | 10.3 | 12.5 | 15.7 | 16.2 |
| Recharge, expressed as the percentage of annual precipitation | 23.8% | 29.1% | 42.4% | 33.6% |
| Recharge, in inches per year, normalized to mean annual precipitation, 1980–2022 | 11.0 | 13.5 | 18.7 | 16.0 |
| Year 2, date range | 01/01/2023–12/31/2023 | 01/01/2023–12/31/2023 | 01/01/2023–12/31/2023 | 01/01/2023–12/31/2023 |
| Station annual precipitation, in inches | 42.0 | 42.0 | 45.0 | 58.3 |
| Sum of water-level rises, in feet | 36.6 | 31.8 | 35.6 | 36.2 |
| Recharge, in inches per year | 16.7 | 14.5 | 16.2 | 16.5 |
| Recharge, expressed as the percentage of annual precipitation | 39.6% | 34.5% | 36.1% | 28.3% |
| Recharge, in inches per year, normalized to mean annual precipitation, 1980–2022 | 18.3 | 16.0 | 15.9 | 13.5 |
| Mean annual recharge 2022–2023, in feet per year, normalized to mean annual precipitation, 1991–2020 | -- | -- | -- | 1.33 |
WTF-estimated mean annual recharge for the 2022–23 period was 16.0 inches per year (in/yr) (approximately 35.1 percent of mean annual precipitation for the period 1980–2022) (table 9; Oklahoma Mesonet, 2023; NCEI, 2023). The 1.33-ft/yr recharge rate multiplied by the 401,280-acre extent of the eastern part of the Red River alluvial aquifer in Oklahoma is equivalent to an estimated inflow volume of approximately 534,000 acre-feet per year (acre-ft/yr).
SWB Code
Spatially distributed groundwater recharge for a selected grid area within the study area (fig. 19) was estimated by using the SWB code (SWB version 1.2.511; Westenbroek and others, 2010). The SWB code uses a gridded data structure to compute the amount of daily infiltration resulting from precipitation, accounting for losses, that exceeds the storage capacity of the plant root zone (the depth below ground surface to which plant roots extend) and evapotranspiration demand from vegetation. Data required by the SWB code include climatological characteristics (precipitation and temperature) and landscape characteristics (soil-water storage capacity, hydrologic soil group, land-cover type, and land-surface gradient). The input data files and output recharge data files discussed in this report are included in the accompanying data release (Gammill and others, 2025). The SWB code uses the following equation to estimate recharge (modified from Westenbroek and others, 2010):
whereR
is recharge, in inches per day;
P
is precipitation, in inches per day;
S
is snowmelt, in inches per day;
Ri
is surface runoff, in inches per day;
Int
is plant interception, in inches per day;
R0
is surface runoff outflow, in inches per day;
Pet
is reference evapotranspiration, in inches per day; and
is the change in soil moisture, in inches per day.
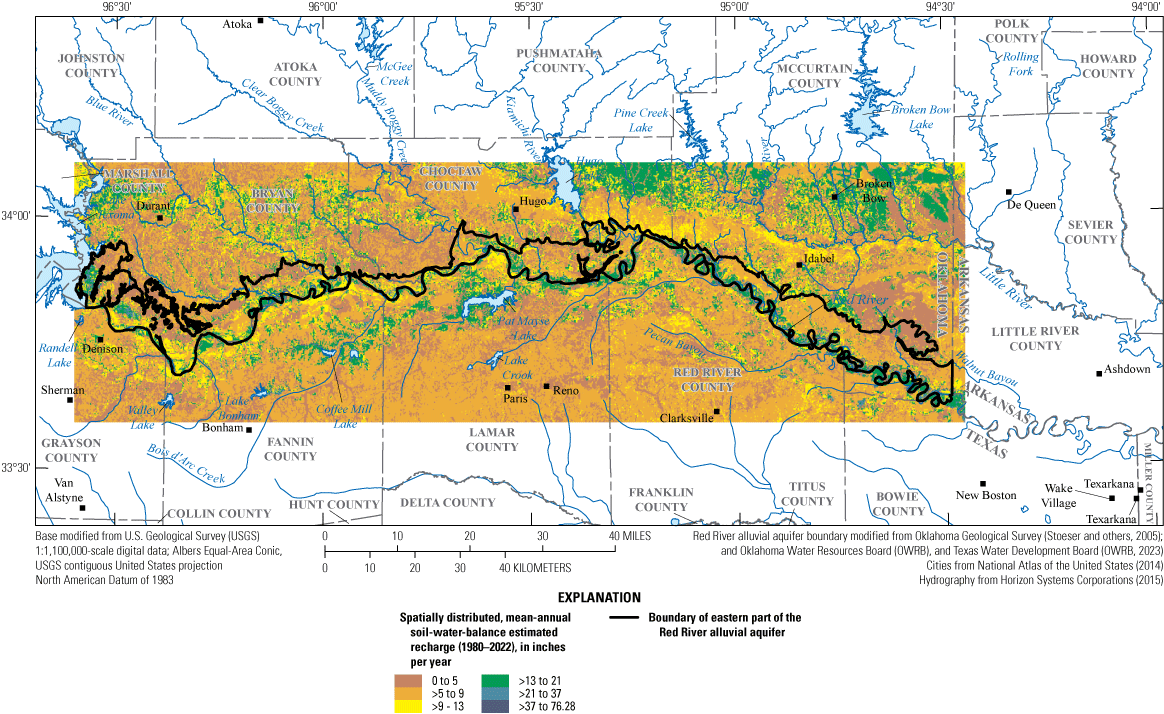
Spatially distributed mean annual recharge for a selected grid area within the study area estimated with the Soil-Water-Balance code (Westenbroek and others, 2010), southeastern Oklahoma, northeastern Texas, and southwestern Arkansas, 1980–2022.
The SWB code estimates recharge (R) over a user-defined grid by using a modified Thornthwaite-Mather method (Thornthwaite and Mather, 1957). To estimate reference evapotranspiration (Pet) in the study area, the Hargreaves and Samani (1985) method for a reference latitude of 33.4–34.2 degrees was applied by using the SWB code. Land-cover data from the National Land Cover Database (Multi-Resolution Land Characteristics Consortium, 2023) were resampled to the SWB model grid resolution using the most common land-cover type within each cell. Land-cover data and hydrologic soil group data obtained from the Gridded Soil Survey Geographic database (USDA, 2021) were used to separate daily precipitation (P) into plant interception (Int) and surface runoff (Ri and R0). To avoid unrealistic overestimations of recharge related to surface runoff, the D8 method (Greenlee, 1987) was used to calculate land-surface gradient from a 10-meter resolution DEM (USGS, 2015) that was resampled to the resolution of the SWB grid. Depressions, or sinks, in the DEM were filled using the ArcGIS Fill tool to ensure correct routing of surface runoff (Esri, 2024b). Daily precipitation, minimum temperature, and maximum temperature grids for the 1980–2022 SWB model period were obtained from the Daymet database (version 4; Thornton and others, 2020). Default plant root-zone depths for the SWB code, which are modeled from permeable glacial deposits in Wisconsin, were scaled to 25 percent for this analysis. Smaller root-zone depths resulted in increased recharge and decreased evapotranspiration of water from the plant root zone. SWB-estimated mean annual recharge within the eastern part of the Red River alluvial aquifer extent was 8.62 in/yr, or 17.98 percent of the mean annual precipitation over the same period (47.94 in/yr). The SWB-estimated mean annual recharge rate of 8.62 in/yr was approximately half of the WTF-estimated mean annual recharge rate of 16.0 in/yr for the 1980–2022 study period (fig. 19).
SWB-estimated recharge rates were summarized annually and monthly in conjunction with precipitation data to calculate recharge efficiency, which is the ratio of recharge to precipitation. Annual SWB-estimated recharge rates for southeastern Oklahoma ranged from 2.82 to 16.60 in/yr for the period 1980–2022, corresponding to years of below-mean and above-mean precipitation, respectively (figs. 4A, 20A). During the 1980–2022 study period, monthly recharge efficiency was equal to or above 20 percent from November to March, when evapotranspiration tends to be at a minimum because of decreased temperatures and precipitation (figs. 5, 20B). Monthly recharge efficiency did not exceed 15 percent for the warmer, wetter months of April through September, when evapotranspiration is generally higher compared to the mostly cooler months of October through March (figs. 5, 20B).
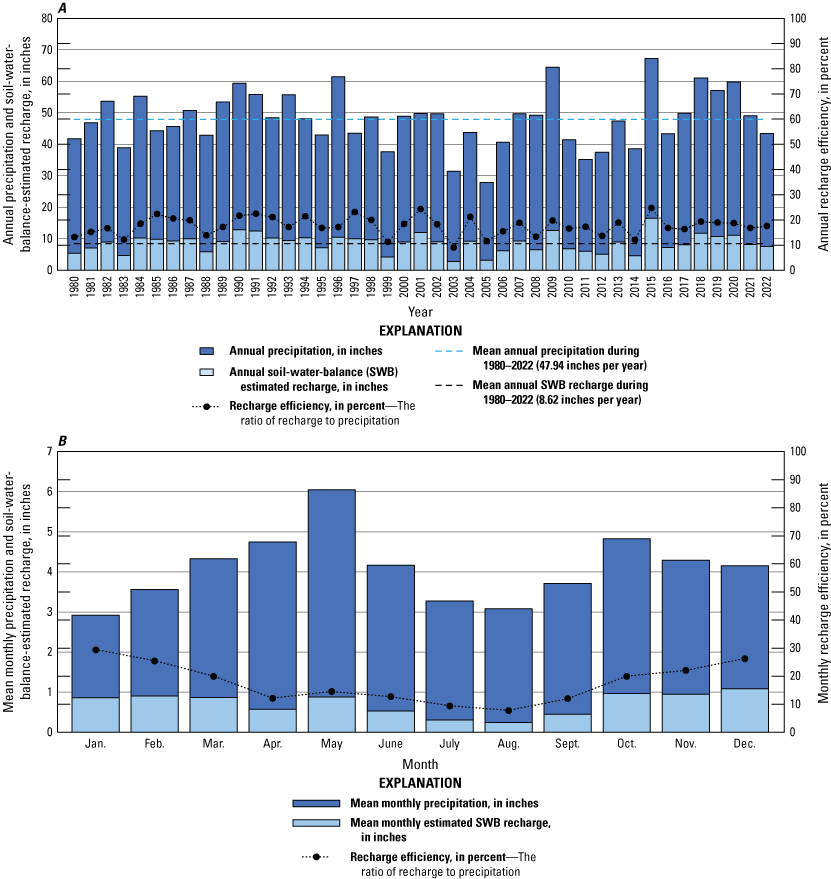
A, Annual precipitation and Soil-Water-Balance (SWB) estimated recharge; and B, monthly precipitation and SWB-estimated recharge for a selected grid area within the study area, southeastern Oklahoma, northeastern Texas, and southwestern Arkansas, 1980–2022 (Oklahoma Mesonet, 2023; National Centers for Environmental Information, 2023).
SWB-estimated recharge within the aquifer extent was used to approximate recharge for the eastern part of the Red River alluvial aquifer conceptual model because the SWB code accounts for various inputs over the entire aquifer, as opposed to the localized estimates gathered by the WTF method. Recharge was estimated as an inflow of 288,250 acre-ft/yr or 98.7 percent of the estimated inflows of the conceptual model water budget (fig. 18; table 8).
Saturated-Zone Evapotranspiration
Evapotranspiration is the process by which water is transferred to the atmosphere directly through evaporation and indirectly through plant transpiration. Most evapotranspiration occurs at the land surface where precipitation pools as surface water or where it infiltrates the soil unsaturated zone and becomes available to plant root zones; most precipitation does not reach the aquifer saturated zone (Lubczynski, 2009). Saturated-zone evapotranspiration mostly occurs in areas of the aquifer where the water table is close to the land surface and the saturated zone intersects the plant root zones, commonly in lower altitude areas such as near streams and wetlands (Lubczynski, 2009). Saturated-zone evapotranspiration was an essential consideration for the conceptual-model water budget, as approximately 58 percent, or 232,926 acres, of the eastern part of the Red River alluvial aquifer was classified as wetlands according to the U.S. Fish and Wildlife Service’s National Wetlands Inventory (fig. 21; table 8; U.S. Fish and Wildlife Service, 2023). Wetlands are land areas that are frequently saturated or flooded and are heavily concentrated along the Red River within the eastern part of the Red River alluvial aquifer. The National Wetlands Inventory’s classification of wetlands is different than that of the National Agricultural Statistics Service’s classification of wetlands, as the National Agricultural Statistics Service only classified 1.9 percent of the eastern part of the Red River alluvial aquifer as other, which includes wetlands, water, and barren land (figs. 2–3; National Agricultural Statistics Service, 2024; USDA, 2023). The National Wetlands Inventory is built upon a biological definition of wetlands, whereas the National Agricultural Statistics Service is focused on overlying vegetation used for agricultural purposes (U.S. Fish and Wildlife Service, 2024; National Agricultural Statistics Service, 2024).
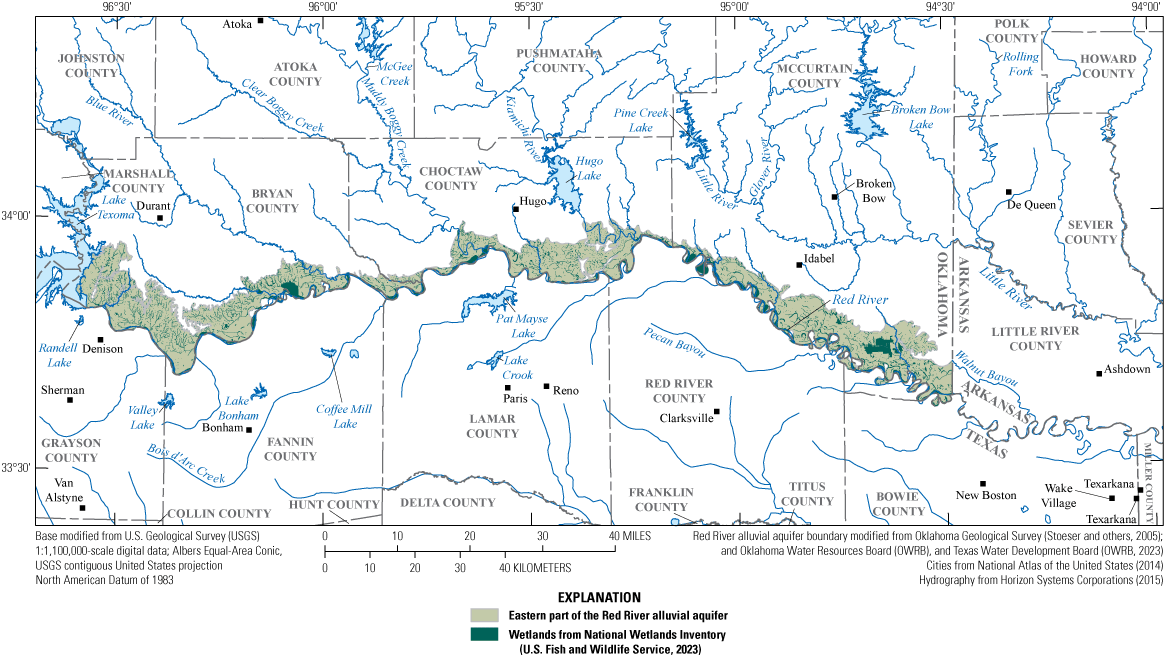
Wetlands in the eastern part of the Red River alluvial aquifer. Coverage from National Wetlands Inventory, southeastern Oklahoma (U.S. Fish and Wildlife Service, 2023).
Streambed Seepage
As explained in the “Streamflow and Base-flow Patterns” section of this report, streamflow is primarily a combination of two components, runoff and base flow (Rantz, 1982). Quantifying the amount of base flow in the eastern part of the Red River alluvial aquifer was useful for the conceptual model, as conceptual-model net streambed seepage was assumed to equal net base flows from the aquifer. Base flow can be approximated from streamflow measurements when the runoff component of streamflow is negligible (Garner and Bills, 2012). When base-flow measurements are collected at multiple locations during a short period of time (within 1–3 days), they are commonly referred to as synoptic “base-flow measurements” or “seepage-run measurements”; the latter term is used in this report.
Seepage-run measurements were made at 13 sites within the spatial extent of the eastern part of the Red River alluvial aquifer during January 17–19, 2023. Streamflow was measured during the winter to minimize the effects of evapotranspiration, peak annual water usage, precipitation, and other factors that contribute to streamflow. (For example, in the study area, peak annual water usage occurs in the spring and summer, and winter is the driest season of the year.) Streamflow measurements made as part of a seepage-run analysis can be used to determine whether stream reaches flowing across the surficial extent of an aquifer are gaining (increasing in streamflow in the downstream direction) or losing (decreasing in streamflow in the downstream direction). A seepage gain or loss is calculated by subtracting inflow from a given stream and associated tributaries from outflow on the same stream at a point downstream (Niswonger and others, 2005). Although 13 streamflow measurements were collected for streambed seepage analysis, additional measurement sites that would have helped pinpoint locations of gains and losses were inaccessible because they were on private land, and permission to make the measurements was not obtained.
The conceptual model incorporated the amount of base flow measured during the seepage run and base flow from ungaged tributaries corrected for dam releases (table 8; fig. 18). Net streambed seepage in the eastern part of the Red River alluvial aquifer was estimated as follows. Mean annual streamflow at USGS streamgage 07331600 Red River at Denison Dam near Denison, Tex. (hereinafter referred to as the “Denison Dam streamgage”) (map identifier S-01) was collected for the 1980–2022 study period. Mean annual streamflow at Hugo Lake dam (fig. 1; table 1; U.S. Army Corps of Engineers, 2024) was multiplied by 0.43 to account for the portion of the gaged stream outside the boundary of the eastern part of the Red River alluvial aquifer. The multiplier used for the Hugo Lake dam streamflow measurement was approximated from the mean annual BFI value from the nearby Arthur City streamgage for the 1937–2022 period (fig. 6B; table 2). Mean annual base flow from the Blue River streamgage was multiplied by 2 to account for ungaged drainage areas both upstream and downstream. Mean annual base flow from the Index streamgage was multiplied by 0.85 to account for the portion of the gaged stream that extends beyond the boundary of the eastern part of the Red River alluvial aquifer. Long-term mean annual base-flow values were computed from the annual mean base flows from USGS streamgage 07335300 Muddy Boggy Creek near Unger, Okla. (hereinafter referred to as the “Muddy Boggy streamgage”) (map identifier S-03) and USGS streamgage 07332622 Bois D’Arc Creek at Farm-to-Market Road 409 near Honey Grove, Tex. (map identifier S-07) (hereinafter referred to as the “Bois D’Arc streamgage”) for the 1980–2022 study period. The mean annual streamflow at Hugo Lake dam and the Denison Dam streamgage along with the estimated mean annual base flow from the Blue River, Muddy Boggy, and Bois D’Arc streamgages were subtracted from the estimated mean annual base flow at the Index streamgage to estimate net streambed seepage for the eastern part of Red River alluvial aquifer. The total net streambed seepage estimated for the eastern part of the Red River alluvial aquifer was 255,247 acre-ft/yr and accounted for 87.4 percent of total outflows in the conceptual-model water budget (fig. 18; tables 8 and 10).
Table 10.
Summary of streambed seepage estimates obtained from streamflow and base flow estimates for streams crossing the Red River alluvial aquifer in southeastern Oklahoma, northeastern Texas, and southwestern Arkansas.[USGS, U.S. Geological Survey; acre-ft/yr, acre-foot per year; BFI, base-flow index; --, not applicable]
| Station number or identifier (USGS, 2024; U.S. Army Corps of Engineers, 2024) | Map identifier (fig. 1) | Mean streamflow, 1980–2022 (thousands of acre-ft/yr) | Mean base flow, 1980–2022 (thousands of acre-ft/yr) | Multiplier | Net streambed seepage, 1980–2022 (acre-ft/yr) |
|---|---|---|---|---|---|
| 07331600 | S-01 | 13,832.13 | 1,560.0 | -- | 3,832,130 |
| 07332500 | S-02 | 254.3 | 174.8 | 22.00 | 149,600 |
| 07335300 | S-03 | 1,385.3 | 1302.5 | -- | 302,503 |
| 07337000 | S-06 | 10,240.7 | 16,165.41 | 20.85 | 5,240,600 |
| 07332622 | S-07 | 191.1 | 119.5 | -- | 19,500 |
| HGLO2 | Hugo Lake | 11,585.1 | -- | 30.43 | 681,593 |
| Total | -- | -- | -- | -- | 255,247 |
Well Withdrawals
Mean annual well withdrawals were assumed to be equivalent to the mean annual reported groundwater use for the period 1980–2022, or 1,997 acre-ft/yr (tables 3–4). Well withdrawals in the eastern part of the Red River alluvial aquifer are predominantly used for irrigation purposes. Well withdrawals were observed to decrease during wet and cool years as increased precipitation lessens the demand for irrigation (figs. 4, 7). The well withdrawal rate of 1,997 acre-ft/yr for the study period accounted for 0.7 percent of outflows in the total conceptual water budget (fig. 18; table 8).
Lateral Groundwater Flows
No data were available to estimate lateral groundwater flows across the boundaries of the eastern part of the Red River alluvial aquifer in Oklahoma. Lateral groundwater flows were assumed to be into the aquifer from Lake Texoma and from flow across the aquifer from west to east as groundwater travels from Oklahoma into Arkansas. It is possible that lateral groundwater flow may occur as an interaction between the underlying minor Woodbine bedrock aquifer but is likely negligible because of the Woodbine aquifer’s comparatively lower estimated hydraulic conductivity value of 0.5 ft/d (Wilkins, 1998). The net lateral groundwater flow of the eastern part of the Red River alluvial aquifer was assumed to be a negligible component of the conceptual-model water budget.
Change in Groundwater Storage
Annual groundwater-level measurements for the 1980–2022 study period from wells completed within the eastern part of the Red River alluvial aquifer were not available; therefore, it was not possible to estimate net storage change in the aquifer. Net change in groundwater storage was calculated as the difference between the aquifer inflows (recharge) and the aquifer outflows (saturated-zone evapotranspiration, streambed seepage, and well withdrawals) and was used to balance the conceptual-model water budget. Net change in groundwater storage in the eastern part of the Red River alluvial aquifer was estimated to be a net inflow of 3,930 acre-ft/yr or 1.3 percent of the conceptual model inflows (table 8).
Conceptual-Model Water Budget
The conceptual-model water budget (fig. 18; table 8) summarizes mean annual inflows to, and outflows from, the eastern part of the Red River alluvial aquifer during 1980–2022. Recharge, estimated from the SWB method, accounts for 98.7 percent of the conceptual-model inflows to the eastern part of the Red River alluvial aquifer. Saturated-zone evapotranspiration accounts for 11.9 percent, and net streambed seepage accounts for 87.4 percent of the outflows for the conceptual model (table 8). The contributions to outflows from saturated zone evaporation and net streambed seepage are essentially the inverse of those for other alluvial aquifers in Oklahoma (Ryter and Correll, 2016; Ellis and others, 2017, 2020; Smith and others, 2017, 2021; Rogers and others, 2023), likely because the part of the study area overlain by wetlands for the eastern part of the Red River alluvial aquifer was much larger compared to most alluvial aquifers in Oklahoma. In the eastern part of the Red River alluvial aquifer, a total of 232,926 acres, or 58 percent of the study area, is covered by wetlands (fig. 21; table 8), which could cause the higher percentage of saturated-zone evapotranspiration as seen in the conceptual model. Comparatively higher saturated-zone evapotranspiration could also be due to the comparatively warmer and wetter environment of the eastern part of the Red River alluvial aquifer (Kottek and others, 2006), because warmer temperatures allow for more atmospheric evapotranspiration storage and more frequent or abundant precipitation may allow greater availability of groundwater to the plant root zone. Net changes in groundwater storage (1.3 percent), and well withdrawals (0.7 percent) each accounted for less than 5 percent of conceptual water-budget inflows or outflows. The net change in groundwater storage of the eastern part of the Red River alluvial aquifer was assumed to be a small component of the conceptual model and was used to balance the water budget.
Summary
The 1973 Oklahoma Groundwater Law (Oklahoma Statutes §82-1020.5) requires that the Oklahoma Water Resources Board conduct hydrologic investigations of the State’s groundwater basins to support a determination of the maximum annual yield for each groundwater basin (hereinafter referred to as an “aquifer”). The maximum annual yield allocated per acre of land is known as the equal-proportionate-share pumping rate. At present (2025), the Oklahoma Water Resources Board has not established a maximum annual yield and equal-proportionate-share pumping rate for the Red River alluvial aquifer east of Lake Texoma. To provide information to support the evaluation and determination of a maximum annual yield, the U.S. Geological Survey, in cooperation with the Oklahoma Water Resources Board, conducted a hydrologic investigation and evaluated the effects of potential groundwater withdrawals on groundwater availability in the Red River alluvial aquifer east of Lake Texoma.
This report describes a hydrologic investigation of the eastern part of the Red River alluvial aquifer east of Lake Texoma in southeastern Oklahoma that includes (1) a description of the aquifer including the definition of a hydrogeologic framework of the aquifer using historical and new data, and (2) the development of a conceptual flow model of the aquifer during the 1980–2022 study period. The geographic scope of the hydrologic investigation is specific to the part of the Red River alluvial aquifer in southeastern Oklahoma between Lake Texoma and the Arkansas and Texas State lines. The eastern part of the Red River alluvial aquifer in southeastern Oklahoma consists of approximately 401,280 acres of Quaternary alluvium and terrace deposits associated with the Red River and major tributaries. Additionally, to address hydrologic influences from surrounding regions, the study area includes segments of the alluvial aquifer in Texas. Although the study area extends into Arkansas and Texas, the report primarily focuses on the aquifer's scope within Oklahoma, referred to in the report as “the eastern part of the Red River alluvial aquifer.”
In the study area, the predominant land-cover type is cropland (81.6 percent), with the predominant crop type being winter wheat (54.9 percent). Long-term climate patterns for the period 1916–2023 were analyzed for the study area. The mean annual precipitation and mean annual temperature for the period of record were approximately 46.6 inches per year (in/yr) and 63.3 degrees Fahrenheit, respectively. The mean annual temperature was about 0.3 degrees Fahrenheit lower, and the mean annual precipitation was about 1.3 in/yr higher, for the 1980–2022 study period than for 1916–2023. Daily streamflow data were summarized for three U.S. Geological Survey streamgages in the study area for the 1980–2022 study period. Streamflow data displayed increasing base flow over the period of record for all three sites and an increase in base-flow index for two of the three sites analyzed. The mean annual reported groundwater use was 1,720 acre-feet per year for the 1967–2022 period of record and 1,997 acre-feet per year for the 1980–2022 study period. The predominant category of groundwater use in the study area is irrigation, which was the primary category of use over the entire 1967–2022 period of record.
The extent of the eastern part of the Red River alluvial aquifer was updated from previously published extents using data from detailed geologic maps, completed lithologic well log reports, synoptic groundwater-level measurements, and interpretation. The altitude of the base of the eastern part of the Red River alluvial aquifer was assumed to be equivalent to the altitude of bedrock contacts extrapolated from completed lithologic log reports. The altitude of the base of the eastern part of the Red River alluvial aquifer ranged from 220 to 580 feet. A potentiometric surface for the eastern part of the Red River alluvial aquifer was constructed using synoptic groundwater-level measurements. The potentiometric surface of the eastern part of the Red River alluvial aquifer depicts decreasing potentiometric contours from west to east, with a maximum altitude of 680 ft to a minimum of 240 ft. Using the potentiometric surface map and data from lithologic logs, a saturated thickness map of the aquifer was constructed. Estimated saturated thickness of the eastern part of the Red River alluvial aquifer ranged from a minimum of 0 ft to a maximum of 141.19 ft; the mean was 62.13 ft.
Hydraulic and textural properties for the eastern part of the Red River alluvial aquifer were estimated using in-place estimation in test holes, analysis of core material, summary of data in lithologic logs, and a multiwell aquifer test. Horizontal hydraulic conductivity estimated by using the Geoprobe hydraulic profiling tool in test holes ranged from 0.2 to 150 feet per day (ft/d) with a mean value of 62.2 ft/d. The mean horizontal hydraulic conductivity value estimated from one core collected in the study area was 29 ft/d. The horizontal hydraulic conductivity estimated from lithologic logs ranged from approximately 0.02 to 169 ft/d with a mean of 44.5 ft/d. Transmissivity estimated from a multiwell aquifer test was approximately 7,900 square feet per day. Geohydrologic-unit hydraulic conductivity from the multiwell aquifer test was estimated to be 67.49 ft/d and provided a specific yield value of 0.038. A storage coefficient of 0.002 was also estimated from the aquifer test.
A conceptual groundwater-flow model of aquifer inflows and outflows was developed for the eastern part of the Red River alluvial aquifer for the 1980–2022 study period. The conceptual-model water budget estimated mean annual inflows to, and outflows from, the eastern part of the Red River alluvial aquifer. Recharge is the predominant inflow to the eastern part of the Red River alluvial aquifer. The mean annual recharge rate to the eastern part of the Red River alluvial aquifer for the period 1980–2022 was estimated to be approximately 8.62 in/yr, or 17.98 percent of the mean annual precipitation for the same period (47.94 in/yr). This 1980–2022 mean annual recharge rate is equivalent to a mean annual recharge rate of approximately 288,250 acre-feet per year for the eastern part of the Red River alluvial aquifer. Recharge estimated using the Soil-Water-Balance code accounts for 98.7 percent of the conceptual-model inflows to the eastern part of the Red River alluvial aquifer. Saturated-zone evapotranspiration accounts for 11.9 percent of the outflows for the conceptual model and net streambed seepage accounts for 87.4 percent.
References Cited
Barlow, P.M., Cunningham, W.L., Zhai, T., and Gray, M., 2015, U.S. Geological Survey Groundwater Toolbox, a graphical and mapping interface for analysis of hydrologic data (version 1.0)—User guide for estimation of base flow, runoff, and groundwater recharge from streamflow data: U.S. Geological Survey Techniques and Methods, book 3, chap. B10, 27 p., accessed December 27, 2023, at https://doi.org/10.3133/tm3B10.
Barlow, P.M., and Leake, S.A., 2012, Streamflow depletion by wells—Understanding and managing the effects of groundwater pumping on streamflow: U.S. Geological Survey Circular 1376, 84 p., accessed December 27, 2023, at https://doi.org/10.3133/cir1376.
Cleveland, W., 1979, Robust locally weighted regression and smoothing scatterplots: Journal of the American Statistical Association, v. 74, no. 368, p. 829–836, accessed February 26, 2024, at https://doi.org/10.1080/01621459.1979.10481038.
Cunningham, W.L., and Schalk, C.W., comps., 2011, Groundwater technical procedures of the U.S. Geological Survey: U.S. Geological Survey Techniques and Methods, book 1, chap. A1, 151 p., accessed May 11, 2023, at https://doi.org/10.3133/tm1A1.
Davis, L.V., 1960, Geology and ground-water resources of southern McCurtain County, Oklahoma: Oklahoma Geological Survey, Bulletin 86, 108 p., accessed February 28, 2024, at http://ogs.ou.edu/docs/bulletins/B86.pdf.
Duffield, G.M., 2025, Representative values of hydraulic properties: AQTESOLV web page, accessed February 4, 2025, at http://www.aqtesolv.com/pumping-tests/recovery-tests.htm.
Ellis, J.H., Mashburn, S.L., Graves, G.M., Peterson, S.M., Smith, S.J., Fuhrig, L.F., Wagner, D.L., and Sanford, J.E., 2017, Hydrogeology and simulation of groundwater flow and analysis of projected water use for the Canadian River alluvial aquifer, western and central Oklahoma: U.S. Geological Survey Scientific Investigations Report 2016–5180, 64 p., accessed March 11, 2024, at https://doi.org/10.3133/sir20165180.
Ellis, J.H., Ryter, D.W., Fuhrig, L.T., Spears, K.W., Mashburn, S.L., and Rogers, I.M.J., 2020, Hydrogeology, numerical simulation of groundwater flow, and effects of future water use and drought for reach 1 of the Washita River alluvial aquifer, Roger Mills and Custer Counties, western Oklahoma, 1980–2015: U.S. Geological Survey Scientific Investigations Report 2020–5118, 81 p., accessed March 11, 2024, at https://doi.org/10.3133/sir20205118.
Esri, 2024a, Tool reference—Topo to Raster (Spatial Analyst): Esri web page, accessed November 15, 2024, at https://pro.arcgis.com/en/pro-app/latest/tool-reference/spatial-analyst/topo-to-raster.htm.
Esri, 2024b, Tool reference—Fill (Spatial Analyst): Esri web page, accessed November 15, 2024, at https://pro.arcgis.com/en/pro-app/latest/tool-reference/spatial-analyst/fill.htm.
Fay, R.O., 1997, Stratigraphic units in Oklahoma, Texas, Arkansas, and adjacent areas: Oklahoma Geological Survey Open-File Report OF 2–97, 229 p., accessed December 16, 2024, at https://ngmdb.usgs.gov/Prodesc/proddesc_98100.htm.
Fetkovich, E.J., Morris, A.S., Dale, I.A., Codner, C., Kirby, E.A., Baciocco, C.A., Rogers, I.M.J., Wagner, D.L., Tomlinson, Z.D., and Fiorentino, E.G., 2025, Hydrogeologic investigation, framework, and conceptual flow model of the Antlers aquifer, southeastern Oklahoma, 1980–2022: U.S. Geological Survey Scientific Investigations Report 2025–5013, 55 p., https://doi.org/10.3133/sir20255013.
Frye, J.C., and Leonard, A.B., 1963, Pleistocene geology of Red River Basin in Texas: Austin, Tex., University of Texas, Bureau of Economic Geology, Report of Investigations No. 49, 48 p., accessed December 4, 2023, at https://doi.org/10.23867/RI0049D.
Gammill, N.C., Codner, C.E., Dale, I.A., Morris, A.S., Kirby, E.A., Graves, G.M., Fetkovich, E.J., Wagner, D.L., Sanford, J.E., and Baciocco, C.A., 2025, Soil-Water-Balance model of the Red River alluvial aquifer east of Lake Texoma, southeastern Oklahoma, 1980–2022: U.S. Geological Survey data release, https://doi.org/10.5066/P1KUH5DS.
Garner, B.D., and Bills, D.J., 2012, Spatial and seasonal variability of base flow in the Verde Valley, central Arizona, 2007 and 2011: U.S. Geological Survey Scientific Investigations Report 2012–5192, 33 p., accessed December 12, 2023, at https://doi.org/10.3133/sir20125192.
Geoprobe Systems, 2015, Geoprobe Hydraulic Profiling Tool (HPT) system, standard operating procedure: Salina, Kans., Kejr, Inc., Technical Bulletin MK3137, 22 p., accessed February 29, 2024, at https://geoprobe.com/literature/hpt-sop.
Gordon, C.H., 1911, Geology and underground waters of northeastern Texas: U.S. Geological Survey Water-Supply Paper 276, 78 p., accessed November 25, 2024, at https://pubs.usgs.gov/wsp/0276/report.pdf.
Greenlee, D.D., 1987, Raster and vector processing for scanned linework: Photogrammetric Engineering and Remote Sensing, v. 53, no. 10, p. 1383–1387, accessed May 28, 2024, at https://www.asprs.org/wp-content/uploads/pers/1987journal/oct/1987_oct_1383-1387.pdf.
Guy, H.P., 1969, Laboratory theory and methods for sediment analysis: Techniques of Water-Resources Investigations of the U.S. Geological Survey, book 5, chap. C1, 59 p., accessed April 16, 2025, at https://pubs.usgs.gov/twri/twri5c1/pdf/TWRI_5-C1.pdf.
Hargreaves, G.H., and Samani, Z.A., 1985, Reference crop evapotranspiration from temperature: Applied Engineering in Agriculture, v. 1, no. 2, p. 96–99, accessed August 3, 2022, at https://doi.org/10.13031/2013.26773.
Hart, D.L., Jr., 1965, Ground water in the alluvial deposits of the Washita River between Clinton and Anadarko, Oklahoma: Oklahoma Water Resources Board, Bulletin 26, 25 p., accessed November 25, 2024, at https://www.owrb.ok.gov/studies/reports/reports_pdf/Bulletin%2026_Ground%20Water%20in%20Alluvial%20Deposits_Washita.pdf.
Healy, R.W., and Cook, P.G., 2002, Using groundwater levels to estimate recharge: Hydrogeology Journal, v. 10, no. 1, p. 91–109, accessed August 3, 2022, at https://doi.org/10.1007/s10040-001-0178-0.
Hem, J.D., 1985, Study and interpretation of the chemical characteristics of natural water: U.S. Geological Survey Water-Supply Paper 2254, 264 p., accessed October 17, 2024, at https://doi.org/10.3133/wsp2254.
Hill, R.T., 1901, Geography and geology of the Black and Grand Prairies, Texas, pt. 7 of Twenty-first annual report of the Director of the United States Geological Survey, 1899–1900: U.S. Geological Survey, 666 p., accessed November 21, 2024, at https://ngmdb.usgs.gov/Prodesc/proddesc_93154.htm.
Horizon Systems Corporation, 2015, National Hydrography Dataset Plus (NHDPlus) version 1: Horizon Systems Corporation website, accessed June 6, 2023, at https://nhdplus.com/NHDPlus/.
Huffman, G.G., Alfonsi, P.P., Dalton, R.C., Duarte-Vivas, A., and Jeffries, E.L., 1975, Geology and mineral resources of Choctaw County, Oklahoma: Oklahoma Geological Survey, Bulletin 120, 39 p., accessed December 5, 2023, at http://www.ogs.ou.edu/pubsscanned/BULLETINS/Bulletin120mm.pdf.
Huffman, G.G., Hart, T.A., Olson, L.J., Currier, J.D., and Robert, W., 1978, Geology and mineral resources of Bryan County, Oklahoma: Oklahoma Geological Survey, Bulletin 126, 105 p., accessed December 5, 2023, at https://digitalprairie.ok.gov/digital/collection/stgovpub/id/90910/.
Hydrosolve, Inc., 2011, Aqtesolv for Windows: Hydrosolve, Inc. website, accessed June 1, 2023, at http://www.aqtesolv.com/.
Kent, D.C., 1980, Evaluation of aquifer performance and water supply capabilities of alluvial and terrace deposits of the north fork of the Red River in Beckham, Greer, Kiowa and Jackson Counties, Oklahoma: Stillwater, Okla., Oklahoma State University, administrative report, accessed September 24, 2021, at https://www.owrb.ok.gov/studies/reports/reports_pdf/RedRiverNFork1980.pdf.
Kottek, M., Grieser, J., Beck, C., Rudolf, B., and Rubel, F., 2006, World map of the Köppen-Geiger climate classification updated: Berlin, Meteorologische Zeitschrift, v. 15, no. 3, p. 259–263, accessed March 25, 2024, at https://doi.org/10.1127/0941-2948/2006/0130.
Kuniansky, E.L., Jones, S.A., Brock, R.D., and Williams, M.D., 1996, Hydrogeology at Air Force Plant 4 and vicinity and water quality of the Paluxy aquifer, Fort Worth, Texas: U.S. Geological Survey Water-Resources Investigations Report 96–4091, 1 p., accessed November 21, 2024, at https://doi.org/10.3133/wri964091.
Lubczynski, M.W., 2009, The hydrogeological role of trees in water-limited environments: Hydrogeology Journal, v. 17, no. 1, p. 247–259, accessed December 12, 2023, at https://doi.org/10.1007/s10040-008-0357-3.
Mashburn, S.L., Ryter, D.W., Neel, C.R., Smith, S.J., and Correll, J.S., 2014, Hydrogeology and simulation of groundwater flow in the central Oklahoma (Garber-Wellington) aquifer, Oklahoma, 1987 to 2009, and simulation of available water in storage, 2010–2059: U.S. Geological Survey Scientific Investigations Report 2013–5219, 92 p., accessed June 5, 2020, at https://doi.org/10.3133/sir20135219.
McCall, W., 2010, Tech guide for calculation of estimated hydraulic conductivity (Est. K) log from HPT data: Salina, Kans., Kejr, Inc., 20 p., accessed August 3, 2022, at https://geoprobe.com/sites/default/files/pdfs/tech_guide_estk_v5_0_0.pdf.
Moix, M.W., and Galloway, J.M., 2005, Base flow, water quality, and streamflow gain and loss of the Buffalo River, Arkansas, and selected tributaries, July and August 2003: U.S. Geological Survey Scientific Investigations Report 2004–5274, 36. p., accessed April 16, 2025, at https://doi.org/10.3133/sir20045274.
Multi-Resolution Land Characteristics Consortium, 2023, National Land Cover Database 2021 (NLCD 2021): U.S. Geological Survey database, accessed April 16, 2025, at https://www.mrlc.gov/data.
Munsell, A.H., 1912, A pigment color system and notation: American Journal of Psychology, v. 23, no. 2, p. 236–244, accessed November 26, 2024, at https://doi.org/10.2307/1412843.
National Agricultural Statistics Service, 2024, Research and science, cropland data layers—FAQs: U.S. Department of Agriculture database, accessed November 24, 2024, at https://www.nass.usda.gov/Research_and_Science/Cropland/sarsfaqs2.php#how.
National Atlas of the United States, 2014, Global map—Cities and towns of the United States, 2014: National Atlas of the United States, accessed April 16, 2025, at https://earthworks.stanford.edu/catalog/stanford-nh933kw1202.
National Centers for Environmental Information [NCEI], 2023, Climate data online: National Oceanic and Atmospheric Administration database, accessed July 24, 2023, at https://ncei.noaa.gov/maps/daily/.
Niswonger, R.G., Prudic, D.E., Pohll, G., and Constantz, J., 2005, Incorporating seepage losses into the unsteady streamflow equations for simulating intermittent flow along mountain front streams: Water Resources Research, v. 41, no. 6, p. 1–16, accessed November 15, 2024, at https://doi.org/10.1029/2004WR003677.
Oklahoma Climatological Survey, 2024, Normal annual snowfall: Oklahoma Climatological Survey web page, accessed February 26, 2024, at https://climate.ok.gov/index.php/climate/map/normal_annual_snowfall/oklahoma_climate.
Oklahoma Mesonet, 2023, Daily data retrieval: Oklahoma Climatological Survey database, accessed May 16, 2023, at https://www.mesonet.org/index.php/weather/daily_data_retireval.
Oklahoma State Legislature, 2021a, Definitions, chap. 1020, section 1 of Waters and water rights: Oklahoma Statutes, title 82, accessed October 19, 2021, at https://oksenate.gov/sites/default/files/2019-12/os82.pdf.
Oklahoma State Legislature, 2021b, Determination of maximum annual yield, chap. 1020, section 5 of Waters and water rights: Oklahoma Statutes, title 82, accessed October 19, 2021, at https://oksenate.gov/sites/default/files/2019-12/os82.pdf.
Oklahoma State Legislature, 2021c, Domestic use—Spacing of wells and waste, chap. 1020, section 3 of Waters and water rights: Oklahoma Statutes, title 82, accessed October 19, 2021, at https://oksenate.gov/sites/default/files/2019-12/os82.pdf.
Oklahoma Water Resources Board [OWRB], 2012a, Oklahoma Comprehensive Water Plan 2012 update—Upper Arkansas Watershed Planning Region report: Oklahoma Water Resources Board, 121 p., accessed August 4, 2022, at https://oklahoma.gov/content/dam/ok/en/owrb/documents/water-planning/ocwp/upper-arkansas-planning-region-report.pdf.
Oklahoma Water Resources Board [OWRB], 2012b, Oklahoma Comprehensive Water Plan—Blue-Boggy Watershed Planning Region report: Oklahoma Water Resources Board, 115 p., accessed April 16, 2025, at https://oklahoma.gov/content/dam/ok/en/owrb/documents/water-planning/ocwp/blue-boggy-planning-region-report.pdf.
Oklahoma Water Resources Board [OWRB], 2012c, Oklahoma Comprehensive Water Plan—Executive report (updated 2012): Oklahoma Water Resources Board, 151 p., accessed April 16, 2025, at https://oklahoma.gov/content/dam/ok/en/owrb/documents/water-planning/ocwp/OCWPExecutiveRpt.pdf.
Oklahoma Water Resources Board [OWRB], 2012d, Oklahoma Comprehensive Water Plan—Southeast Watershed Planning Region report: Oklahoma Water Resources Board, 101 p., accessed April 16, 2025, at https://oklahoma.gov/content/dam/ok/en/owrb/documents/water-planning/ocwp/southeast-planning-region-report.pdf.
Oklahoma Water Resources Board [OWRB], 2015, Produced water reuse in Oklahoma—Regulatory considerations and references: Oklahoma Water Resources Board, 50 p., accessed April 16, 2025, at https://oklahoma.gov/content/dam/ok/en/owrb/documents/water-planning/pwwg/GWPC-Ok-Produced-Water-Project-Summary-Report.pdf.
Oklahoma Water Resources Board [OWRB], 2018, 2018 Oklahoma groundwater report—Beneficial Use Monitoring Program: Oklahoma Water Resources Board, 84 p., accessed April 16, 2025, at https://oklahoma.gov/content/dam/ok/en/owrb/documents/maps-and-data/water-monitoring/oklahoma-groundwater-monitoring-report.pdf.
Oklahoma Water Resources Board [OWRB], 2023, Groundwater: Oklahoma Water Resources Board web page (including data and maps), accessed September 8, 2023, at https://www.owrb.ok.gov/maps/pmg/owrbdata_GW.html.
Oklahoma Water Resources Board [OWRB], 2024a, Maximum annual yield determinations: Oklahoma Water Resources Board Fact Sheet, 1 p., accessed February 23, 2024, at https://oklahoma.gov/content/dam/ok/en/owrb/documents/science-and-research/hydrologic-investigations/maximum-annual-yield-determinations-fact-sheet.pd f.
Oklahoma Water Resources Board [OWRB], 2024b, OWRB open data—Permitted wells & dedicated lands: Oklahoma Water Resources Board database, accessed March 6, 2024, at https://oklahoma.gov/owrb/data-and-maps/gis-data.html.
Paizis, N.C., and Trevisan, A.R., 2021, Cimarron River alluvial aquifer hydrogeologic framework, water budget, and implications for future water availability in the Pawnee Nation Tribal jurisdictional area, Payne County, Oklahoma, 2016–18: U.S. Geological Survey Scientific Investigations Report 2021–5073, 49 p., accessed October 17, 2024, at https://doi.org/10.3133/sir20215073.
Piper, A.M., 1944, A graphic procedure in the geochemical interpretation of water-analyses: American Geophysical Union Transactions, v. 25, p. 914–923, accessed April 16, 2025, at https://doi.org/10.1029/TR025i006p00914.
Rantz, S.E., 1982, Measurement and computation of streamflow—Volume 1. Measurement of stage and discharge: U.S. Geological Survey Water-Supply Paper 2175, 284 p., accessed June 8, 2023, at https://doi.org/10.3133/wsp2175.
Rogers, I.M.J., Smith, S.J., Gammill, N.C., Gillard, N.J., Lockmiller, K.A., Fetkovich, E.J., Correll, J.S., and Hussey, S.P., 2023, Hydrogeology and simulated groundwater availability in reaches 3 and 4 of the Washita River aquifer, southern Oklahoma, 1980–2017: U.S. Geological Survey Scientific Investigations Report 2023–5072, 83 p., accessed March 15, 2024, at https://doi.org/10.3133/sir20235072.
Ryder, P.D., 1996, Groundwater atlas of the United States—Segment 4, Oklahoma, Texas: U.S. Geological Survey Hydrologic Investigations Atlas 730–E, 30 p., accessed November 21, 2024, at https://doi.org/10.3133/ha730E.
Ryter, D.W., and Correll, J.S., 2016, Hydrogeological framework, numerical simulation of groundwater flow, and effects of projected water use and drought for the Beaver-North Canadian River alluvial aquifer, northwestern Oklahoma (ver.1.1, February 2016): U.S. Geological Survey Scientific Investigations Report 2015–5183, 63 p., accessed March 15, 2024, at https://doi.org/10.3133/sir20155183.
Smith, S.J., Ellis, J.H., Paizis, N.C., Becker, C.J., Wagner, D.L., Correll, J.S., and Hernandez, R.J., 2021, Hydrogeology and model-simulated groundwater availability in the Salt Fork Red River aquifer, southwestern Oklahoma, 1980–2015: U.S. Geological Survey Scientific Investigations Report 2021–5003, 85 p., accessed March 15, 2024, at https://doi.org/10.3133/sir20215003.
Smith, S.J., Ellis, J.H., Wagner, D.L., and Peterson, S.M., 2017, Hydrogeology and simulated groundwater flow and availability in the North Fork Red River aquifer, southwest Oklahoma, 1980–2013: U.S. Geological Survey Scientific Investigations Report 2017–5098, 107 p., accessed March 15, 2024, at https://doi.org/10.3133/sir20175098.
Stoeser, D.B., Green, G.N., Morath, L.C., Heran, W.D., Wilson, A.B., Moore, D.W., and Van Gosen, B.S., 2005, Preliminary integrated geologic map databases for the United States—Central States—Montana, Wyoming, Colorado, New Mexico, North Dakota, South Dakota, Nebraska, Kansas, Oklahoma, Texas, Iowa, Missouri, Arkansas, and Louisiana: U.S. Geological Survey Open-File Report 2005–1351, accessed March 11, 2024, at https://pubs.usgs.gov/of/2005/1351/.
Tartakovsky, G.D., and Neuman, S.P., 2007, Three-dimensional saturated-unsaturated flow with axial symmetry to a partially penetrating well in a compressible unconfined aquifer: Water Resources Research, v. 43, no. 1, W01410, accessed November 14, 2024, at https://doi.org/10.1029/2006WR005153.
Texas Water Development Board [TWDB], 2023, Groundwater database reports and downloads: Texas Water Development Board database, accessed September 21, 2023, at https://www.twdb.texas.gov/groundwater/data/gwdbrpt.asp.
Thompson, G.L., 1972, Groundwater resources of Navarro County, Texas: Texas Water Development Board Report 160, 63 p., accessed November 25, 2024, at https://www.twdb.texas.gov/publications/reports/numbered_reports/doc/R160/R160.pdf.
Thornthwaite, C.W., and Mather, J.R., 1957, Instructions and tables for computing potential evapotranspiration and the water balance—Centerton, N.J., Drexel Institute of Technology, Laboratory of Climatology: Publications in Climatology, v. 10, no. 3, p. 185–311, accessed November 14, 2024, at https://www.wrc.udel.edu/wp-content/publications/ThornthwaiteandMather1957Instructions_Tables_ComputingPotentialEvapotranspiration_Water%20Balance.pdf.
Thornton, M.M., Shrestha, R., Wei, Y., Thornton, P.E., Kao, S., and Wilson, B.E., 2020, Daymet—Daily surface weather data on a 1-km grid for North America, version 4: Oak Ridge, Tenn., Oak Ridge National Laboratory Distributed Active Archive Center database, accessed February 23, 2024, at https://doi.org/10.3334/ORNLDAAC/1840.
U.S. Army Corps of Engineers, 2024, HGLO2—Hugo Lake: U.S. Army Corps of Engineers web page, accessed March 29, 2024, at https://www.swt-wc.usace.army.mil/HUGO.lakepage.html.
U.S. Department of Agriculture [USDA], 2021, Gridded Soil Survey Geographic (GSSURGO) database for the conterminous United States: Natural Resources Conservation Service database, accessed December 15, 2023, at https://gdg.sc.egov.usda.gov/.
U.S. Department of Agriculture [USDA], 2023, National Agricultural Statistics Service (NASS), 20240131, Cropland data layer: Washington, D.C., USDA NASS Marketing and Information Services Office, accessed April 16, 2025, at https://croplandcros.scinet.usda.gov/.
U.S. Environmental Protection Agency, 2017, Drinking water regulations and contaminants: U.S. Environmental Protection Agency web page, accessed April 16, 2025, at https://www.epa.gov/sdwa/drinking-water-regulations-and-contaminants.
U.S. Fish and Wildlife Service, 2023, National Wetlands Inventory—Download seamless wetlands data by State: U.S. Fish and Wildlife Service database, accessed April 4, 2024, at https://www.fws.gov/program/national-wetlands-inventory/download-state-wetlands-data.
U.S. Fish and Wildlife Service, 2024, Wetlands data limitations, exclusions and precautions: U.S. Fish and Wildlife Service web page, accessed November 21, 2024, at https://www.fws.gov/node/264582.
U.S. Geological Survey [USGS], 2015, National Elevation Dataset (NED) 1/3 arc-second DEM: U.S. Geological Survey database, accessed April 27, 2023, at https://apps.nationalmap.gov/downloader/#/10/34.77438352431586/-97.66967773437258/usgs_topo/elevation-products-three-dep/.
U.S. Geological Survey [USGS], 2024, USGS water data for Oklahoma in USGS water data for the Nation: U.S. Geological Survey National Water Information System database, accessed December 15, 2023, at https://waterdata. usgs.gov/nwis. [State water data directly accessible at https://waterdata.usgs.gov/ok/nwis.]
Wahl, K.L., and Wahl, T.L., 1995, Determining the flow of Comal Springs at New Braunfels, Texas, in Texas Water ‘95—A Component Conference of the First International Conference on Water Resources Engineering, San Antonio, Texas, August 16–17, 1995, [Proceedings]: American Society of Civil Engineers, p. 77–86, accessed October 17, 2024, at https://www.usbr.gov/tsc/techreferences/hydraulics_lab/pubs/PAP/PAP-0708.pdf.
Wentworth, C.K., 1922, A scale of grade and class terms for clastic sediments: The Journal of Geology, v. 30, no. 5, p. 377–392, accessed April 16, 2025, at https://doi.org/10.1086/622910.
Westenbroek, S.M., Kelson, V.A., Dripps, W.R., Hunt, R.J., and Bradbury, K.R., 2010, SWB—A modified Thornthwaite-Mather Soil-Water-Balance code for estimating groundwater recharge: U.S. Geological Survey Techniques and Methods, book 6, chap. A31, 60 p., accessed June 6, 2023, at https://doi.org/10.3133/tm6A31.
White, W.N., 1932, A method of estimating ground-water supplies based on discharge by plants and evaporation from soil—Results of investigations in Escalante Valley, Utah: U.S. Geological Survey Water-Supply Paper 659–A, 105 p., accessed February 22, 2024, at https://doi.org/10.3133/wsp659A.
Wilkins, K., 1998, Hydrologic report of the Woodbine, Marietta, and Texoma minor bedrock groundwater basins and the Haworth terrace and Little River alluvial and terrace minor groundwater basins: Oklahoma Water Resources Board Planning & Management Division Technical Report 99–2, 26 p., accessed July 25, 2024, at https://oklahoma.gov/content/dam/ok/en/owrb/documents/science-and-research/hydrologic-investigations/woodbine-marietta-texoma-1999.pdf.
Winter, T.C., 1995, Recent advances in understanding the interaction of groundwater and surface water: Reviews of Geophysics, v. 33, no. S2, p. 985–994, accessed March 29, 2024, at https://doi.org/10.1029/95RG00115.
Young, K., 1965, A revision of Taylor nomenclature, Upper Cretaceous, central Texas: Austin, Tex., University of Texas, Bureau of Economic Geology Geological Circular, no. 65–3, 10 p., accessed November 25, 2024, at https://ngmdb.usgs.gov/Geolex/UnitRefs/TaylorRefs_6230.html.
Conversion Factors
U.S. customary units to International System of Units
Temperature in degrees Fahrenheit (°F) may be converted to degrees Celsius (°C) as follows:
°C = (°F – 32) / 1.8.
Datum
Vertical coordinate information is referenced to the North American Vertical Datum of 1988 (NAVD 88).
Horizontal coordinate information is referenced to the North American Datum of 1983 (NAD 83).
Altitude, as used in this report, refers to distance above the vertical datum.
Supplemental Information
Concentrations of dissolved solids in water are given in milligrams per liter (mg/L).
Abbreviations
BFI
base-flow index
DEM
digital elevation model
HPT
hydraulic profiling tool
LOWESS
locally weighted scatterplot smoothing
MAY
maximum annual yield
NCEI
National Centers for Environmental Information
NWIS
National Water Information System
OWRB
Oklahoma Water Resources Board
SWB
soil-water-balance
TWDB
Texas Water Development Board
USDA
U.S. Department of Agriculture
USGS
U.S. Geological Survey
WTF
water-table fluctuation
For more information about this publication, contact
Director, Oklahoma-Texas Water Science Center
U.S. Geological Survey
1505 Ferguson Lane
Austin, TX 78754–4501
For additional information, visit
https://www.usgs.gov/centers/ot-water
Publishing support provided by
Lafayette Publishing Service Center
Disclaimers
Any use of trade, firm, or product names is for descriptive purposes only and does not imply endorsement by the U.S. Government.
Although this information product, for the most part, is in the public domain, it also may contain copyrighted materials as noted in the text. Permission to reproduce copyrighted items must be secured from the copyright owner.
Suggested Citation
Codner, C., Gammill, N.C., Dale, I.A., Morris, A.S., Kirby, E.A., Graves, G.M., Fetkovich, E.J., Wagner, D.L., Sanford, J.E., and Baciocco, C.A., 2025, Hydrogeologic framework and conceptual model of the Red River alluvial aquifer east of Lake Texoma, southeastern Oklahoma, 1980–2022: U.S. Geological Survey Scientific Investigations Report 2025–5054, 46 p., https://doi.org/10.3133/sir20255054.
ISSN: 2328-0328 (online)
Study Area
| Publication type | Report |
|---|---|
| Publication Subtype | USGS Numbered Series |
| Title | Hydrogeologic framework and conceptual model of the Red River alluvial aquifer east of Lake Texoma, southeastern Oklahoma, 1980–2022 |
| Series title | Scientific Investigations Report |
| Series number | 2025-5054 |
| DOI | 10.3133/sir20255054 |
| Publication Date | July 18, 2025 |
| Year Published | 2025 |
| Language | English |
| Publisher | U.S. Geological Survey |
| Publisher location | Reston, VA |
| Contributing office(s) | Oklahoma-Texas Water Science Center |
| Description | Report: x, 46 p.; Data Release |
| Country | United States |
| State | Arkansas, Oklahoma, Texas |
| Other Geospatial | Red River alluvial aquifer |
| Online Only (Y/N) | Y |