

Sources of Water and Salts for the Zuni Salt Lake in West-Central New Mexico
Links
- Document: Report (10.3 MB pdf) , HTML , XML
- Data Releases:
- USGS Data Release - Aerial imagery, digital elevation model, orthomosaic image, ground control points, and bathymetry surveys to identify sources of water and salts for the Zuni Salt Lake in west-central New Mexico, United States
- Bureau of Relamation Dataset - Zuni Salt Lake weather monitoring data
- USGS Dataset - USGS water data for the Nation
- NGMDB Index Page: National Geologic Map Database Index Page (html)
- Download citation as: RIS | Dublin Core
Acknowledgments
The authors would like to thank the staff from the Zuni Tribe of the Zuni Reservation, New Mexico for their assistance on the project and insights into the ecology and history of the Zuni Salt Lake.
The authors would also like to thank U.S. Geological Survey colleagues Jeff Worthington, Hal Nelson, Rob Henrion, Fletcher Brinkerhoff, and Eric Joseph for their tireless data collection efforts.
Abstract
The Zuni Salt Lake is located in a maar in west-central New Mexico and contains hypersaline water that has long been used by Native Americans for religious purposes and the collection of salt. There have been several investigations suggesting different sources for the water and salt to the lake. Springs, seeps, and ephemeral streamflow have all been observed to contribute freshwater to the lake, and brackish to hypersaline seeps have been documented along the banks of the lake. This report summarizes the findings of a study that characterizes the lake’s hydrology, its water and salinity sources, and the hydrogeologic conceptual model. Regional groundwater levels indicate that each of the aquifers in the area have the potential to discharge groundwater to the lake. There is also evidence of vertical groundwater flow pathways at the maar that were likely created by the igneous intrusion that fractured the intersecting aquifers. A detailed water budget was constructed from continuous lake stage, precipitation, and evaporation data to estimate the groundwater inflow to the Zuni Salt Lake. It was determined that groundwater inflow to the lake is 441 ±94 acre-feet per year, which composes as much as 77 percent of the total inflows. The high sodium and chloride concentrations measured in two hypersaline samples collected near the lake indicate that the majority of the dissolved solids entering the lake are from a hypersaline groundwater source. The geochemical and isotopic compositions measured in the lake and surrounding features support the interpretation that hypersaline groundwater is the primary source of salts to the lake, which is likely sourced from the older (and deeper) Permian units. The hypersaline groundwater samples collected during this investigation have a unique aqueous chemistry relative to each of the mapped aquifers, and variability in groundwater compositions is interpreted to result from differences in minerology and residence time.
Introduction
The Zuni Salt Lake, along with a small cinder cone pool, are located in a maar in west-central New Mexico (fig. 1). The lake contains hypersaline water having dissolved solid concentrations that range from 136,000 to 356,000 milligrams per liter (mg/L) with a median of 328,000 mg/L. The lake has long been used by Native Americans for religious purposes and the collection of salt (Myers, 1992). Beginning in 1938, the State of New Mexico began leasing mineral rights to the salt. Between 1938 and 1954, a small business was able to produce about 1,200 tons of salt per year, but subsequent businesses failed to profitably extract the salt (Zillmer, 1973). In 1986, ownership of the lake was transferred to the Zuni Tribe of the Zuni Reservation, New Mexico, which has managed it as a natural and cultural resource for the continued use by all Native peoples (LaDuke, 2002). Presently, the area hosts regional tribal ceremonial events and salt collection activities.

Location of study area showing the Zuni Salt Lake, New Mexico, regional groundwater-quality sampling locations, and faults.
On the basis of stratigraphic analysis, optical stimulated luminescence, and carbon-14 (14C) dating, Onken and Forman (2017) inferred that the volcanic and phreatic explosions that created the maar most likely occurred between 12.3 and 11 kilo-annum (ka) during the late Pleistocene. Volcanic activity at the Zuni Salt Lake may be related to the northeast-striking normal faults in the area (Onken and Forman, 2017), particularly the Zuni Salt Lake fault just northwest of the maar (Anderson, 1994).
Several investigations have suggested that different sources of water and salt to the Zuni Salt Lake. Springs, seeps, and ephemeral streamflow have all been observed to contribute freshwater to the lake, and brackish to saline seeps have been documented along the banks of the lake. Freshwater has low dissolved-solids content (less than 1,000 mg/L), whereas saline water has higher dissolved solids content (equal to or more than 1,000 mg/L). Saline water can further be classified as brackish, on the low end of salinity with dissolved solids content ranging from 1,000 to 10,000 mg/L, and hypersaline, having greater dissolved solids than seawater (35,000 mg/L; Rich and Maier, 2015; Stanton and others, 2017). These brackish and hypersaline seeps have been proposed to be upwelling through preferential pathways created where the igneous intrusion that formed the features of the maar may have fractured, intersecting aquifers within the Cretaceous Dakota Sandstone, and the Permian San Andres Limestone, Glorieta Sandstone, Abo Formation, and Yeso Formation (Bradbury, 1971; Myers, 1992). Bradbury (1971) suggests that the saline water inflow to the Zuni Salt Lake is likely derived in part from the dissolution of evaporite beds within the Yeso Formation. However, a Bureau of Indian Affairs report (King Engineering, 2001, cited in Drakos and others [2001]), proposed the source of salinity to the lake being the evaporation of low-salinity Dakota Sandstone and the Late Cretaceous Atarque Sandstone aquifer waters, alluvial aquifer waters, and surface runoff. Much of this previous work was performed in order to examine the impact of a proposed coal mine on the hydrology of the lake and the groundwater development that accompanies the mining. Although the original mining proposal was withdrawn, development of mineral or water resources remains a potential source of impacts to the area hydrology.
A combination of data collection and interpretative analyses were undertaken during this study, conducted by the U.S. Geological Survey in cooperation with the Bureau of Reclamation (Reclamation), to refine the conceptual model of groundwater contributions to the Zuni Salt Lake and to better understand the lake hydrology and water chemistry. This information will help characterize the effects of mineral resource and groundwater development under different water-use scenarios on the hydrology and chemistry of the lake and can support resource managers in ensuring protection of the lake. One major limitation of this study is the scarcity of groundwater wells in each of the underlying aquifers, limiting the ability to characterize spatial variability and, in the case of the Abo and Yeso Formations, make comparisons between seeps and those formations’ groundwater composition. Despite these limitations, the findings in this report provide information on the lake’s hydrology and its function in the regional groundwater system and could provide focus for further research.
Purpose and Scope
The purpose of this report is to summarize the findings of a study that focused on characterizing the Zuni Salt Lake’s hydrology, its water and salinity sources, and the hydrogeologic conceptual model (for example, salt and water balance). This report covers the data collection efforts that began in the fall of 2019 and continued through the end of 2022.
Site Description
The Zuni Salt Lake is located in the Little Colorado River watershed, within a broad valley near the ephemeral Largo Creek and is surrounded by mesas and volcanic features (fig. 1). The lake drains about 19,000 acres, covers about 150 acres, and is typically about 2 feet (ft) deep (Bradbury, 1971). The elevation of the study area ranges from slightly less than 6,000 ft where Largo Creek crosses the New Mexico-Arizona State line on the west side of the study area to about 8,110 ft above NAVD 88 on Mariano Mesa to the east. The vegetative regions range from grasslands to pinyon-juniper parklands (Myers, 1992). The climate of the study area is semiarid, and the average annual rainfall at Quemado, New Mexico (for the period of record, 1915–2005), southeast of the lake, is 10.8 inches (in.), with more than half of the precipitation falling during summer monsoons (Western Regional Climate Center [WRCC], 2024). The maximum mean monthly temperature at Quemado is 85.3 degrees Fahrenheit in July and the minimum mean monthly temperature is 13.2 degrees Fahrenheit in January (WRCC, 2024).
The study area, which is defined by potential groundwater contributions and data availability, incorporates the area surrounding the Zuni Salt Lake on the Mogollon Slope. The latter dips gently to the northeast and is within the Datil Section of the southern part of the Colorado Plateaus province (Fenneman, 1946; McLellan and others, 1982). The region is characterized by several structural basins, sags, and upwarps. Rocks of Triassic, Cretaceous, Tertiary, and Quaternary age crop out in and near the study area (fig. 2; Anderson, 1994; Myers, 1992).

Schematic geologic cross section of the Zuni Salt Lake area (modified from Anderson, 1994).
The region’s structural features are the result of late Cretaceous to early Tertiary folding, thrust faulting, and volcanism; Oligocene volcanic activity and high-angle normal faulting in some areas; and volcanic and tectonic activity following the Miocene deposition of the Fence Lake Formation (McLellan and others, 1982). During the Cretaceous, a lobe of the Western Interior Seaway expanded into western New Mexico (Hook and others, 1980) with several periods of transgression and regression causing the intertonguing relation of the Cretaceous units within the study area (Myers, 1992).
Hydrologic Framework
Several sources of water are reported to feed the Zuni Salt Lake (Myers, 1992). Groundwater flows into the lake from seeps and springs, whereas precipitation and occasional runoff following precipitation events result in lake levels fluctuating several feet between the dry and wet season. As a terminal lake, the only water loss is through evaporation.
There are no perennial streams in the area, making groundwater the dominant local water resource. Most of the groundwater wells within the study area are stock or domestic wells that produce less than 10 gallons per minute (gal/min) (Myers, 1992). Recharge to different aquifers varies by location and unit depth (Baldwin and Rankin, 1995). Recharge to shallow units occurs primarily from precipitation and runoff into the alluvium or over bedrock outcrops. The local recharge to exposures, particularly at higher elevations, results in groundwater flow and spring and seep discharge under topographic controls. Recharge in deeper aquifers is thought to occur outside the study area where units outcrop in the Zuni Mountains about 50 miles (mi) to the north and beneath the basalt flows about 30 mi to the northeast (Orr, 1987; Drakos and others, 2013), resulting in groundwater flow down the head gradient in the aquifers toward areas of discharge such as the Zuni Salt Lake. Though the direction of groundwater flow is mainly controlled by head differences in the aquifers, groundwater may be constrained to follow a geologic unit if the unit is bound between other confining geologic units, such as shales, that have very low hydraulic conductivity.
The aquifers, from oldest to youngest, in the area include the Permian San Andres Limestone/Glorieta Sandstone aquifer, which overlays the largely uncharacterized Upper Pennsylvanian to lower Permian Abo and Yeso Formations. The Triassic Chinle Formation unconformably overlies the San Andres Limestone/Glorieta Sandstone aquifer and contains relatively thin sandstone and conglomerate lenses. Cretaceous units that overlie the Chinle Formation include the Dakota Sandstone, which intertongues with the overlying Mancos Shale, and the Mesaverde Group. The Atarque Sandstone and Moreno Hill Formation are reported as undivided late Cretaceous deposits, but for this report are included in the Mesaverde Group aquifer because of the hydrologic connections (Myers, 1992). Groundwater in the Quaternary basalts and alluvium is primarily found in the maar and in valley bottoms surrounding the Zuni Salt Lake (fig. 2). Except where exposed, the Paleozoic, Triassic, and Cretaceous rocks compose semiconfined to confined aquifers. This report focuses on the aquifers that are either present beneath the lake or adjacent to it and are distinguished as the San Andres Limestone/Glorieta Sandstone aquifer, Dakota Sandstone aquifer, Mesaverde Group aquifers, and the saturated Quaternary deposits and are often discussed in terms of the era of their deposition. Although locally important, the sandstone and conglomerate lenses of the Chinle Formation are not considered in this report because of their reported discontinuous nature and lack of pertinent data.
Precambrian gneissic granite forms the basement rock about 2,000–3,000 ft below the land surface and only crops out north of the study area in the Zuni Mountains (Foster, 1957; Levitte and Gambill, 1980). The Paleozoic section unconformably overlies the basement rock and is composed of about 800 ft of the Upper Pennsylvanian to lower Permian Abo and Yeso Formation red beds, 300 ft of Permian Glorieta Sandstone, and 100 ft of the Permian San Andres Limestone (Read and Wanek, 1967). Foster (1957) reported thick evaporites in the Paleozoic sections were encountered in several oil and gas exploratory wells drilled in the area. The structural tendency of the Paleozoic formations is to dip, and thin, to the east (Rauzi, 2009). No known groundwater wells have been completed in either the Abo or Yeso Formations in the study area, and future development is unlikely because of their great depth, presumed small hydraulic conductivity, and unsuitable water quality.
The Triassic units include siltstones, mudstones, sandstones, and limestone of the continental Chinle Formation and range in thickness from about 1,500 ft near the Arizona border to less than 170 ft to the southwest of the study area (Myers, 1992). The Chinle Formation crops out west of the Zuni Salt Lake in Largo Creek and consists of reddish-brown to purple and light-greenish-gray to white claystone, shale, siltstone, and mudstone interbedded with thin lenses of poorly sorted sandstone and conglomerate (Willard and Weber, 1958; Foster, 1957; McLellan and others, 1982). With about 60 percent of the formation composed of shale (Foster, 1957), the Chinle Formation generally is a confining bed within the study area. Small quantities of water are produced from thin lenses of poorly sorted sandstone and conglomerate where the formation crops out in Largo Creek west of Zuni Salt Lake (Akers, 1964). The Jurassic units are absent in the study area, pinching out just north of it (Levitte and Gambill, 1980).
The Cretaceous Dakota Sandstone is as much as 100 ft thick and is overlain by about 250 ft of Mancos Shale (Anderson, 1994). In order to avoid confusion, this report only analyzed groundwater wells reportedly completed in the main body of the Dakota Sandstone. The Mancos Shale is considered an impermeable confining unit, except where there are thin sandstone lenses (Myers, 1992). Secondary porosity, in the form of fractures, increases the permeability of the Dakota Sandstone in places. Myers (1992) cites reported ranges of hydraulic conductivities for the Dakota Sandstone in the region from a low of 0.0004 foot per day (ft/d) in the San Juan Basin (Stone and others, 1983) to 100 ft/d east of the Zuni Mountains (Risser and Lyford, 1983). Closer to the Zuni Salt Lake, Myers (1992) reported on the completion and test of a flowing artesian groundwater well north and west of the lake in the main body of the Dakota Sandstone in 1983. The well is 1,080 ft deep and penetrates the main body of the Dakota Sandstone from 957 to 1,062 ft below land surface. The well flowed at a rate of 122 gal/min before the test was started and resumed artesian flow within 3 minutes after a 350-gal/min pump test of the well that lasted for 28.5 hours. The hydraulic conductivity was calculated to be 6.8 ft/d.
The Mancos Shale is overlain by about 100 ft of marine Atarque Sandstone and about 600 ft of the nonmarine coal-bearing Moreno Hill Formation. The coal beds have been considered for mining (McLellan and others, 1983). Although the Atarque Sandstone and the Moreno Hills Formation are not formally recognized units in the Mesaverde Group, regionally these units are hydraulically connected and are included in the Mesaverde Group aquifer as a single aquifer. Locally, however, conditions in the aquifer may be semiconfined to confined because of localized variations in lithology within the various formations and members. On a regional scale, the locally semiconfined and water-yielding zones are hydraulically connected. Secondary porosity, in the form of fractures, increases permeability in some areas. More stock, domestic, and test groundwater wells are completed in the Mesaverde Group aquifer within the study area than in any other unit. Tertiary deposits are largely absent in the immediate area surrounding the maar but form the caprock mesas to the east and south.
Quaternary alluvium is generally less than 200 ft thick and consists of clay, silt, sand, and gravel present in the washes and arroyos within the study area (Myers, 1992). No groundwater wells within the Largo Creek drainage near the Zuni Salt Lake are reportedly completed in the Quaternary alluvium. Myers (1992) reported the installation of an alluvial groundwater well east of the lake in Frenches Draw (fig. 1). The alluvial well was completed to 177 ft below land surface, and a pumping test yielded a hydraulic conductivity between 10 and 20 ft/d.
Groundwater in the area surrounding the Zuni Salt Lake is generally considered to flow from areas of higher groundwater elevations, where recharge occurs, to areas of lower groundwater elevations, where discharge occurs. This often means that groundwater flows along topographic controls in the shallow aquifers and along orientations of major geologic structures in deeper aquifers. However, groundwater flow near the lake has not been well constrained because of the lack of data. Myers (1992) constructed potentiometric surface maps of several Cretaceous and Tertiary aquifers, and apart from the Mesaverde Group aquifer, the lack of data is evident near the lake. For the Dakota Sandstone, Myers (1992) generally depicted flow north of the lake from east to west with a gradient of 0.003 foot per foot (ft/ft). However, the only data used to construct these potentiometric surface maps were collected more than 15 mi to the north and thus are insufficient to determine the direction of groundwater flow near the lake. A potentiometric surface map of the Mancos Shale constructed with data collected at eight groundwater wells indicates a convergence of groundwater flow in the Largo Creek drainage near the Zuni Salt Lake (Myers, 1992). That convergence also appears to reflect the groundwater flow directions depicted in the Mesaverde Group aquifer potentiometric surface map, indicating that the direction of groundwater flow in the Mesaverde Group aquifer is controlled by the surface-water drainage system and the topography. The map also includes a groundwater divide north of the lake around the Santa Rita Mesa (fig. 1). Younger, Tertiary sediments are absent in the area, but the potentiometric surface maps constructed by Myers (1992) indicate a northwesterly groundwater flow south and east of the lake. No known groundwater wells have been completed in the Abo or Yeso Formations in the area. Since the Myers (1992) report, there has not been an increase in the number of groundwater wells available to refine previous potentiometric surface maps, and the effects of faulting in the area complicate that effort.
Faulting in the area as recent as the late Tertiary (Miocene) is typically normal and northeast trending. The Zuni Salt Lake fault is a northeast-trending, vertical fault with an inferred displacement of 500–1,000 ft (fig. 2; Anderson, 1994; Rauzi, 2009). Within the maar, the Smith Springs fault has an offset of about 50 ft (fig. 3; Drakos and others, 2006). It is not clear how groundwater hydrology is affected by these faults, but estimates of potential impacts are discussed in later sections.

Water-quality sampling locations within the Zuni Salt Lake maar. Photographs by Andrew Robertson, U.S. Geological Survey.
Methods
The methods used to characterize the hydrology of the Zuni Salt Lake and update its conceptual model included discrete groundwater level measurements, water-quality sampling, lake stage monitoring, climate data collection, geographic position surveying, aerial topography surveying, bathymetry surveying, and accompanying analyses. Continuous data collected at the lake (Zuni Salt Lake near Quemado, N. Mex.; site number 09386189), including water temperature, specific conductivity, lake stage, and precipitation, are available from the U.S. Geological Survey (USGS) National Water Information System (NWIS) website (USGS, 2023). Air temperature, relative humidity, barometric pressure, solar radiation, net radiation, wind speed, and estimated evaporation data are available through Reclamation’s data sharing website, Reclamation Information Sharing Environment (Reclamation, 2024). Aerial topography and bathymetric surveying results were combined to estimate lake water volume as a function of lake stage in this report (Bosch and others, 2025). Sites where the data collection just described took place are listed in tables 1 and 2.
Table 1.
Summary of location and construction information for data-collection sites used in this study, and links to data associated with study.[Source of data is the National Water Information System (NWIS) website (U.S. Geological Survey [USGS], 2023). ID, identifier; no., number; analysis, type of data used in analysis; NAVD 88; North American Vertical Datum of 1988; lat, latitude; long, longitude; NAD 83, North American Datum of 1983; mg/L, milligram per liter; GW elevation, groundwater average elevation; distance, distance from Zuni Salt Lake; nr, near; NM, New Mexico; n/a, not applicable; LK, lake; QW, water quality; WL, water level; ND, not determined; SP, spring; TD, temperature/depth]
For this report, the Atarque Sandstone and Moreno Hill Formation are included in the Mesaverde Group aquifer because of the hydrologic connections (Myers, 1992).
Table 2.
Summary of monitoring information for data-collection sites used in this study, and links to data associated with study.[Source of data is the National Water Information System (NWIS) website (U.S. Geological Survey [USGS], 2023). ID, identifier; no., number; analysis, type of data used in analysis; NAVD 88; North American Vertical Datum of 1988; lat, latitude; long, longitude; NAD 83, North American Datum of 1983; mg/L, milligram per liter; GW elevation, groundwater average elevation; distance, distance from Zuni Salt Lake; nr, near; NM, New Mexico; n/a, not applicable; LK, lake; QW, water quality; WL, water level; ND, not determined; SP, spring; TD, temperature/depth]
For this report, the Atarque Sandstone and Moreno Hill Formation are included in the Mesaverde Group aquifer because of the hydrologic connections (Myers, 1992).
Groundwater Elevation and Spring Discharge Measurements
In order to determine the hydraulic potential for groundwater in study area aquifers that flow to the Zuni Salt Lake, groundwater elevations were measured on an infrequent basis from the fall of 2019 to the fall of 2021. Depth to water was determined by using calibrated electric or steel tapes and measured from the top of the well casing. Where needed, survey-grade positions were acquired for well location and elevation. Groundwater-elevation data were quality assured following USGS protocols (Cunningham and Schalk, 2011) and are publicly available at the USGS NWIS website (USGS, 2023). Except when discussing changes in groundwater elevations over time, elevations are reported as the average of all available measurements. Discharge was measured infrequently at Smith Spring (fig. 3) using volumetric methods (Turnipseed and Sauer, 2010). Discrete water levels are available at the USGS NWIS website (USGS, 2023)
Water-Quality Sampling and Data
Fourteen water-quality samples were collected in September 2019 and June 2020 following USGS protocols (USGS, variously dated) from the Zuni Salt Lake and from groundwater wells, springs, and seeps near the lake that were suspected of contributing water and salt (figs. 1 and 3; tables 1 and 2). Study sites sampled within the maar included the pool within the cinder cone (Cinder Cone pool), Smith Spring, two groundwater wells completed in the Atarque Sandstone (MW1 and MW2), a spring box at the location of an old windmill (Spring Box), and hypersaline groundwater from seeps issuing from the east shore (East Shore seeps) and the Cinder Cone well (fig. 3; tables 1 and 2). Samples were also collected from groundwater wells outside the maar that are reportedly completed in aquifers that are potential sources of water to the Zuni Salt Lake, including DKOT-17, DKOT-35, MVRD-24, MVRD-58, SAGA-09, and SAGA-10 (fig. 1; tables 1 and 2). Noble gas and other dissolved gas samples were collected from groundwater wells and springs where water could be collected prior to exposure to the atmosphere.
Multiple sources with variable salinity that are contributing water to the Zuni Salt Lake have been documented, and stratification of the lake following precipitation events has been observed (Bradbury, 1971). However, stratification is short-lived because of the shallow depths that minimize thermal or density-driven stratification, and because of wind effects and diffusion. For this reason, the water-quality sample was collected a few inches below the surface and is considered to be representative of the lake as a whole. This is not true of the Cinder Cone pool, where some field parameters changed about 13 ft below the water surface in the depth profile (USGS, 2023). At that depth, temperature increased by about 1 degree Celsius and specific conductivity increased about 3,000–4,000 microsiemens per centimeter at 25 degrees Celsius (μs/cm at 25 °C). The water-quality sample for this study was collected below this halocline and most likely does not represent the composition at shallower depths. Water-quality samples were analyzed for major ions, trace elements, tritium, and the isotopes of water, sulfate, strontium, boron, uranium, and carbon. Measured field parameters included temperature, dissolved oxygen, pH, and specific conductivity at each sample location.
Samples collected for major ions and trace elements were analyzed at the USGS National Water Quality Laboratory in Denver, Colorado. The stable isotopes of water (deuterium [δ2H] and oxygen-18 [δ18O]) and sulfate (sulfur-34 [δ34S] and [δ18O]) were analyzed at the USGS Reston Stable Isotope Laboratory in Reston, Virginia. Strontium (87Sr/86Sr) and boron (δ11B) isotopes were analyzed by the USGS Menlo Park Metal Isotope Lab in Menlo Park, California. The carbon isotopes of dissolved inorganic carbon (carbon-13 [δ13C] and carbon-14 [14C]) were analyzed at the Woods Hole National Oceanographic Institute in Woods Hole, Massachusetts. Tritium (3H) content was analyzed at the University of Miami in Coral Gables, Florida. Water samples to be used for noble gas concentrations and helium isotope analyses were collected and shipped in copper tubing to the USGS Noble Gas Laboratory in Denver, Colo. Water-quality data have been quality assured following internal USGS protocols and are publicly available at the Water Quality Portal website (National Water Quality Monitoring Council, 2021).
To assess the quality of the laboratory data for major ions, the anion and cation data were evaluated for ion electrical balance. The differences between the milliequivalents of anions and cations for the 14 samples were all within 5 percent (average was 1.5 percent), except for the Cinder Cone pool sample (−14.3 percent), which may be due to the high chloride to sodium ratio. Given the high dissolved solids of this sample and good comparison to historical data, the uncertainty in the sample analysis is considered to not substantially affect the interpretations.
Replicate samples were collected for all analytes at the Zuni Salt Lake and SAGA-09 sites. The relative percent difference (RPD) between the two samples’ concentrations was used to determine the variability in the samples. The RPD for values of all analytes in the replicate samples was within 10 percent, except for bromide (56 percent) and molybdenum (14 percent) in the Zuni Salt Lake sample, and lead (18 percent) and cobalt (10 percent) in the SAGA-09 sample. Bromide uncertainty in the lake sample did not substantially alter the interpretations of the chloride/bromide analysis because of the exceedingly high chloride concentrations. None of the other constituents with uncertainties above 10 percent were used in the analysis.
Field blanks were collected at well MW1 and the Spring Box (fig. 3) and analyzed for major ions and trace elements. All constituents analyzed had results below the detection limit, except for calcium, chloride, sulfate, cobalt, antimony, and bromide in the MW1 well, and silica in the Spring Box. The calcium, bromide, and cobalt blank detections were below the reporting limits but above detection limits. In this range, there is greater uncertainty associated with the results and the source of the contamination is unclear. Because of the minimal difference in the major ion balance and similarity to historical results, it was determined that the environmental sample from MW1 was not affected by the blank contamination.
Lake Water Budget
In order to estimate groundwater contributions to the Zuni Salt Lake, water-surface elevation data were collected and related to lake geometry to determine changes in lake storage. The lake geometry was determined by constructing a digital elevation model (DEM) from images collected by uncrewed aerial systems (UASs; that is, drones) and a bathymetric survey, which can be found in the accompanying data release by Bosch and others (2025). Precipitation was measured and evaporation was estimated to determine the observable inflows and outflows. The imbalance between the changes in water stored in the Zuni Salt Lake and the inflows and outflows was used to determine the groundwater volume contributions. The amount of halite entering the maar from different groundwater sources was also estimated by pairing the groundwater volume estimate with measured concentrations of sodium and chloride in groundwater samples collected near the Zuni Salt Lake.
Position Determination
Survey grade positions were determined at several locations from 2019 to 2021 around the Zuni Salt Lake using the National Geodetic Survey’s Online Positioning User Service (National Geodetic Survey, 2015) at a Geodetic Survey marker (base station [BS]) on the maar’s rim. A real time kinematic (RTK) survey was made from the BS to establish control points and positions at other sites. The quality indicators for the rapid static occupation at the BS were 87 percent of the observations used, a quality indicator of 8.67/27.57, and a normalized RMS of 0.262 relative to the common datums North American Datum of 1983 (NAD 83) and North American Vertical Datum of 1988 (NAVD 88). However, the BS station position was verified to within 1.6 in. horizontally and 3.5 in. vertically by comparing prior reported elevations of the BS survey mark and secondary Online Positioning User Service occupations on positions determined by RTK survey from the BS. In addition, all of the locations and elevations relative to each other can be considered to have a relative accuracy of within about 0.4 in. horizontally and about 0.6 in. vertically, because all of the locations were determined by RTK survey less than 1.25 mi from that BS.
Digital Elevation Model Construction
The surrounding topography of the Zuni Salt Lake was mapped using UAS based imagery and analyzed with Agisoft Metashape Professional version 1.6.1 build 10009 (Agisoft, 2023). The UAS survey was conducted in the fall of 2019 and covered 1.1 mi with 1,404 images. The structure from motion (SfM) process was used to create the resulting DEM, which was verified with five control points established by the RTK survey at various locations around the lake. The root mean square error (RMSE) of the elevations from the SfM compared with surveyed point elevations was 0.1 ft. The bathymetry of the lake was estimated by interpolating water depths measured with staff rods from kayaks at 133 locations and recorded to the nearest 0.01 ft and UAS imagery shoreline estimates at 403 locations (total observation data count = 536). Measured water depths ranged from 0.22 to 5.50 ft (median = 0.83 ft, average = 1.01 ft); however, 75 percent of the depths were between 0.25 and 1.00 ft, indicating a relatively flat bottom. A small depression near a former pump house, and the current location of a water-level gage in the lake, was where most depths deeper than 1 ft were recorded.
Lake bottom elevation was interpolated by fitting a thin-plate spline to the point measurements. The spline model was fit by using the Tps function of the fields package (version 9.8-6; Nychka and others, 2021) in R (version 3.5.3; R Core Team, 2023). Spline complexity (in other words, effective degrees of freedom) was determined by using five-fold cross validation (CV; James and others, 2013). This CV methodology randomly reserves 20 percent of the data as test data while using the remaining 80 percent of the data to train the spline model. The fitted spline model is then used to predict the test data to assess its ability to accurately make predictions. This process is repeated four additional times in one five-fold CV run, so that eventually all of the data are used as test data in the analysis. The five-fold CV procedure was run 500 times for spline complexities ranging from 3 to 200 degrees of freedom for a total of 495,000 model fits. The RMSE was calculated for all model runs as a function of spline complexity.
Mean CV RMSE was minimized by the spline model with 121 degrees of freedom. A “one-standard error” rule was used to choose the most parsimonious model whose mean CV RMSE was no more than one standard error above the minimum mean RMSE; this is commonly done in CV in favor of simplicity and to avoid over-fitting the data (Hastie and others, 2009, p. 244). This approach reduced the final model complexity to 98 degrees of freedom (−19 percent) while increasing mean CV RMSE by just 0.0005 ft (0.15 percent).
Leave-one-out cross validation (LOOCV) was also performed on the final model to further evaluate its predictive abilities and spatial sensitivities. LOOCV is similar to five-fold cross validation, except that only one observation is withheld as test data for each model fit (James and others, 2013). LOOCV errors were generally small (mean error = 0.0002 ft) and only increased appreciably where there were abrupt changes in the Zuni Salt Lake bottom elevation. Increased model sensitivity near these types of features is inherently expected because of practical observation data density limitations and suggests that some of these more localized features are smeared (that is, smoothed over) where observation data are sparse. As a whole, LOOCV RMSE was 0.3450 ft, and LOOCV predictions correlated well with observed data (Pearson correlation coefficient = 0.82). Model predictions also lacked notable correlation with LOOCV residuals (Pearson correlation coefficient = 0.03), thereby indicating minimal systematic bias in model predictions.
The final thin-plate spline model was used to make predictions at rasterized locations throughout the Zuni Salt Lake bottom to estimate continuous lake bathymetry. A uniform raster cell size of 1 ft was selected as an adequate balance between computational expense and minimizing interpolation errors introduced by rasterizing the domain. The model parameters, predictive performance criteria, and LOOCV results are summarized in table 3, whereas the estimated bathymetric surface is presented in figure 4 (Bosch and others, 2025). Overall, the spline model represents the observed bathymetry data well, despite smearing some of the more localized elevation anomalies, and demonstrates adequate predictive capabilities for the purposes of this study.
Table 3.
Model parameters, predictive performance criteria, and leave-one-out cross validation (LOOCV) results.[RMSE, root mean square error; ft, foot]
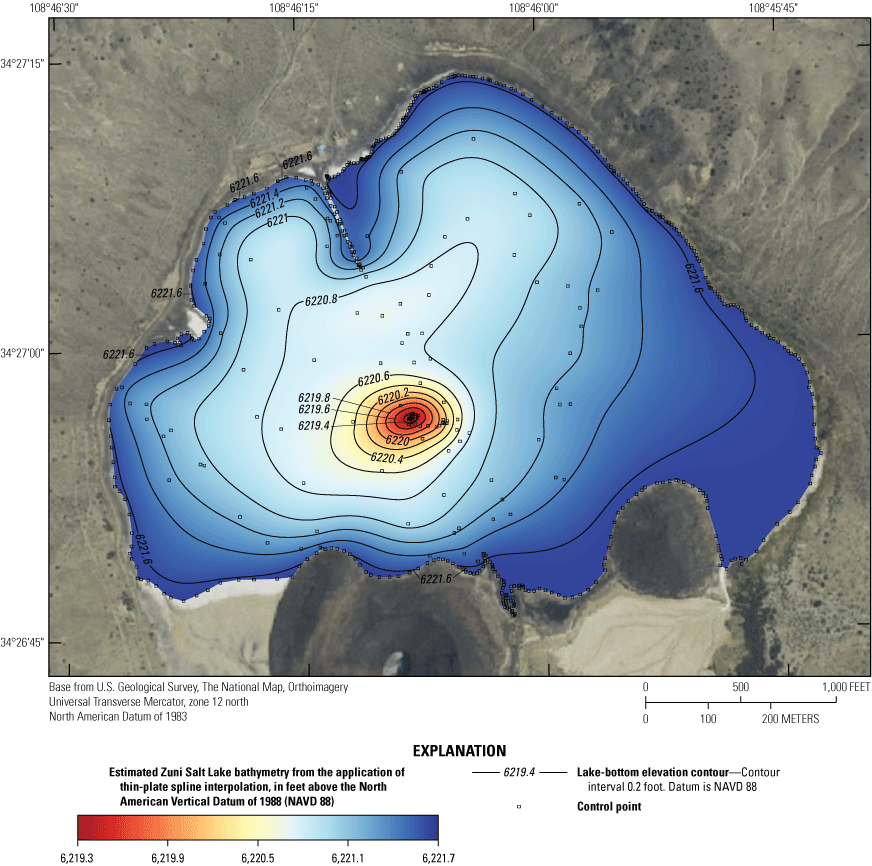
Predicted bathymetric surface of the Zuni Salt Lake.
The interpolated bathymetric surface was combined with local UAS-based topography in ArcGIS Pro (Esri, Redlands, Calif.) to permit Zuni Salt Lake volume estimation as a function of measured lake stage. The topography within the adjacent cinder cone was removed from the combined surface to facilitate hydrologically accurate lake volume estimates. The final raster is shown in figure 5.

Zuni Salt Lake digital elevation model from bathymetric survey and unmanned aerial survey conducted in the fall of 2019. The data used to construct the digital elevation model can be found in the accompanying data release by Bosch and others (2025).
Volume Determination
The lake volume was estimated using the resulting DEM to develop a rating curve between the Zuni Salt Lake stage (elevation) and volume using the U.S. Army Corps of Engineers Reservoir Inundation Calculator tool in ArcGIS. The greatest lake depth, 5.5 ft at the depression near current location of the lake gage, corresponds to an elevation of 6,216.1 ft above NAVD 88. However, smoothing in the spline interpolation and rasterization of the surface, along with the small, localized nature of the deeper parts of the lake, yield negligible storage estimates (less than 1 acre-foot [acre-ft]) below an elevation of about 6,220.0 ft above NAVD 88 (1.7 ft depth). The analysis steps from 6,219.0 to 6,227.0 ft above NAVD 88 at 0.1 ft increments. The resulting rating curve may be approximated by two linear segments, from elevations of 6,219.9 to 6,220.9 ft above NAVD 88 and from 6,221.0 to 6,227.0 ft above NAVD 88 (fig. 6).

The Zuni Salt Lake rating curve between the water-surface elevation and lake storage, including linear equation approximations.
Based on the elevation uncertainty estimates of the bathymetric survey (LOOCV elevation errors = 0.0002 ft) and the RMSE in the DEM created from the aerial survey (0.01 ft), the uncertainty in the Zuni Salt Lake storage was estimated as a function of the lake elevation from the rating curve. Storage changes corresponding to elevation changes of 0.01 ft as computed by the Reservoir Inundation Calculator tool, are between 0 and 2 acre-ft, with a mean change of 1.5 acre-ft and a median change of 1.7 acre-ft. The percent errors associated with this relationship decrease with increasing storage; for example, the percent errors in storage above a lake elevation of 6,221.5 ft above NAVD 88 are just under 20 percent, and the percent error is under 10 percent for lake elevations higher than 6,222.2 ft above NAVD 88. Approximately 80 percent of the daily lake elevations were higher than 6,221.5 ft above NAVD 88, so assuming a 20-percent error in the storage would represent a conservative estimate.
Precipitation
Precipitation was measured at the Zuni Salt Lake using a tipping-bucket rain gage. The tipping-bucket rain gage measures precipitation events using two identical chambers that alternately fill and drain. As each chamber fills, it tips, simultaneously draining it, bringing up the second bucket under the collector funnel and recording a known amount of precipitation, 0.01 in. The precipitation total for each day is computed by summing the number of tips that occur on that date. Data from tipping-bucket instruments are reported to the nearest 0.01 in. and are available at the USGS NWIS website (USGS, 2023).
Evaporation
The Collison Floating Evaporation Pan (CFEP; Collison, 2019) was used to estimate evaporation from the Zuni Salt Lake from September 2020 to January 2023. The automated design of the CFEP for measuring atmospheric conditions and water-level changes in the pan with native water was considered to be an important feature for this remote location. The CFEP is designed so that a decrease in water level within the evaporation pan per unit of time equals the evaporation rate (Collison, 2019). The water level is measured with a linear potentiometer and two pumps are used to fill, or drain, the pan to a set water level each night. Errors associated with this technique include thermal expansion of the pan and (or) the water inside the pan, pan oscillations from wave and wind action, and other types of instrument error. Based on the results from Collison (2019) and Reclamation (2021, 2023), the CFEP measurements are in reasonable agreement with measurements obtained from other evaporation techniques, including very low error (average percent difference less than 2 percent) when compared with three discrete hemispherical evaporation chamber (Stannard, 1988) measurements and seasonally variable errors (cumulative average errors on the order of 10 percent) when compared to Hamon equations and adjusted Penman equations. Comparisons of the estimated evaporation measured with the CFEP with eddy covariance and aerodynamic mass-transfer estimates indicated the CFEP estimates generally agree with the eddy covariance and aerodynamic estimates in the winter and greatly exceed them in the summer. Comparing daily and cumulative evaporation estimates from the CFEP with modified Penman and Hargreaves-Samani (Hargreaves and Samani, 1985) estimates show large variability day to day, with only about 50 percent of the daily data having differences of less than 0.04 inch per day [in/d], but good agreement on seasonal trends and excellent agreement over the period of record (RPD less than 2 percent; Reclamation, 2024). Without a clear determination of the inherent error in this method, a 10-percent error was assumed for the evaporation data and considered to be a conservative estimate, based on previous studies (Collison, 2019; Reclamation, 2021, 2023).
During the period, there were 159 days where the CFEP’s water-level change measurement was unusable because of logger issues, major rain events, and sensor malfunctions because of salt and (or) salt encrusting the fill pump. To gap-fill these days, a modified Penman evaporation estimation equation, equation 3.8 in Collison (2019), was fit to the CFEP’s estimated evaporation on a 15-minute time step:
whereE
is the evaporation, in inches per day;
Fitcoef
is the fitting coefficient to the CFEP evaporation measurement;
Δ
is the slope of saturated vapor pressure curve, in kilopascals per degree Celsius;
γ
is the psychrometric constant, in kilopascals per degree Celsius;
Qn
is the effective net radiation, in millimeters per day; and
Epan
is the amount of evaporation from a theoretical Class A Pan, in inches per day.
Atmospheric data collected by the CFEP (air temperature, relative humidity, wind speed, barometric pressure, surface-water temperature, and net radiation) were used in the modified Penman equation. This equation was then fit to the CFEP’s estimated evaporation using an average monthly fitting coefficient (equaling for example, the average of three September monthly averages), with a total of twelve individual monthly fitting coefficients representing the entire year. The fitting coefficients are 0.33, 0.37, 0.43, 0.45, 0.57, 0.41, 0.55, 0.67, 0.47, 0.41, 0.39, and 0.34 for January to December, respectively. The daily evaporation estimates produced by the fitted modified Penman equation were used as the evaporation dataset in other analyses throughout this report. Estimated evaporation was lowest (average daily rates of 0.04 in/d) in the winter months of December and January and increased to an average daily rate of over 0.31 in/d in May until the summer monsoons reduced the vapor pressure deficit (fig. 7).

Maximum, average, and minimum daily evaporation estimates for each month as determined by the adjusted Penman method for evaporation estimation (Bureau of Reclamation, 2024) and the sum of monthly precipitation for the Zuni Salt Lake (U.S. Geological Survey, 2023).
A review of the daily evaporation estimates with atmospheric data displays predicted responses in which increasing evaporation is associated with increasing temperatures and wind speed and decreasing evaporation is associated with decreasing temperatures and precipitation events (Reclamation, 2024; USGS, 2023). The daily estimated evaporation volume was computed as the product of the daily estimated evaporation rate and the average daily Zuni Salt Lake surface area.
Results
In this section, the groundwater elevation data and selected water-quality parameters collected as part of this study are analyzed to further refine the conceptual model of groundwater flow near the Zuni Salt Lake by examining hydrologic gradients and the potential for upwelling from deep aquifers. Using a water budget analysis, an estimate of the groundwater contributions to the lake is made and compared with previous estimates. These groundwater inflow estimates are paired with dissolved solids concentrations of groundwater samples to examine the potential amounts of salt inflows. Finally, water-quality data from the lake and nearby groundwater are used to identify potential groundwater sources to the lake.
Groundwater Flow
Because of the lack of substantial groundwater development or withdrawals in the region, the groundwater system appears to have been relatively stable over the last 5 decades, as indicated by historical groundwater elevation data. Groundwater elevations representing multiple aquifers at 11 wells (tables 1 and 2) within 10 mi of the Zuni Salt Lake measured in 1985 compared to the elevations measured in 2020 show minimal change (USGS, 2023). The elevation changes in 11 groundwater wells over those 35 years range from a decline of 8 ft to an increase of 11 ft, with an average change of less than 1 ft.
Groundwater in shallow aquifers in the area surrounding the Zuni Salt Lake generally may be characterized as flowing along topographic controls, because it originates as recharge in higher elevations and flows to lower elevation discharge points preferentially through sediments of higher permeability (Freeze and Cherry, 1979). Groundwater in deeper aquifers generally flows along major geologic structural orientations from areas of more distant recharge on uplifted outcrops to discharge points near structural lows. The regional stratigraphic record is one of alternating high and low hydraulically conductive materials, imparting confining conditions on the region’s aquifers. Because of these confining conditions, the potentiometric surface in many of these aquifers is substantially higher than the top of the formation hosting the aquifer. Based on geologic mapping by Anderson (1994) and Drakos and Riesterer (2007), the Mesaverde Group aquifer (specifically the Atarque Sandstone and Moreno Hill Formation) and Mancos Shale compose the consolidated rock outcrops of the edges of the maar. The top of the Dakota Sandstone is reported to be more than 500 ft below the Zuni Salt Lake, and the top of the San Andres Limestone/Glorieta Sandstone aquifer is as much as 2,000 ft below the lake. Despite the differences in the depths of each formation, the groundwater elevations within 1 mi of the lake are quite similar (fig. 8).

Groundwater elevations in wells and springs within 10 miles of the Zuni Salt Lake. Labels for data points are the local identifiers from tables 1 and 2. For this report, the Atarque Sandstone and Moreno Hill Formation are included in the Mesaverde Group aquifer because of the hydrologic connections (Myers, 1992).
Within 10 mi of the Zuni Salt Lake, measured groundwater elevations range from 6,223 to over 6,500 ft above NAVD 88 (fig. 8), with a clear pattern of higher elevations further from the lake. Assuming that there are no barriers to horizontal flow, each aquifer has the potential to discharge to the lake. Despite the lack of comprehensive spatial data to determine the groundwater flow direction of each aquifer near the lake, the overall trend of groundwater elevations indicates that the lake is a discharge point for the region’s aquifers.
Based on two nearby groundwater wells (SAGA 09 and SAGA 10, tables 1 and 2, fig. 1), the hydraulic gradient in the San Andres Limestone/Glorieta Sandstone aquifer is 0.004 ft/ft west to east, but this gradient may be complicated by the Moreno Hill fault or pumping regimes from these two wells. Groundwater flow in the San Andres Limestone/Glorieta Sandstone aquifer north of the Zuni Salt Lake, as previously estimated by Orr (1987), is away from the Zuni Mountains, and to the west from the Continental Divide (fig. 1). The gradient between two groundwater wells (site numbers 342823108422901 and 342808108492301) reportedly completed in the Dakota Sandstone (tables 1 and 2), is 0.002 ft/ft from east to west, and both groundwater elevations are substantially lower than the contours to the north constructed by Myers (1992). Recharge at outcrops to the east of the Zuni Salt Lake fault could result in locally higher groundwater elevations creating the east to west gradient, but this gradient may also be complicated by the fact that the two wells lie on opposite sides of the Zuni Salt Lake fault.
The Zuni Salt Lake fault is estimated to have an offset of 500–750 ft and has been mapped from the Arizona-New Mexico State line southwest of the Zuni Salt Lake to Santa Rita Mesa to the north (Anderson, 1994; Rauzi, 2009). The vertical offset of the Zuni Salt Lake fault (up-thrown on the west side) results in the Dakota Sandstone being exposed at the land surface west of the lake and potentially places a large portion of its thickness in direct contact with the Mancos Shale or Moreno Hill Formation, depending on the amount of offset near the lake (fig. 2). No springs or seeps have been reported or observed on the west side of the lake, possibly because of the low hydraulic conductivity of the Mancos Shale that could restrict flow from the Dakota Sandstone to the east where this contact occurs. Similarly, the offset of the fault may also result in the Dakota Sandstone on the east side of the fault being in contact with the largely lower hydraulic conductivity rock of the Chinle Formation, restricting east to west flow in the Dakota Sandstone (fig. 2). This configuration could result in minimal groundwater contributions to the Zuni Salt Lake from the Dakota Sandstone west of the maar and may enhance groundwater contribution from the Dakota Sandstone east of the maar by restricting westerly flow. Similar conditions may exist in the San Andres Limestone/Glorieta Sandstone aquifer where the bulk of the San Andres Limestone/Glorieta Sandstone aquifer west of the maar may be in contact with the Chinle Formation (fig. 2), restricting west to east flow, and the bulk of the San Andres Limestone/Glorieta Sandstone aquifer east of the lake may be in contact with the Permian rocks of the Abo and Yeso Formations. Except for groundwater elevations in the two Dakota Sandstone wells, there are no groundwater well data on either side of the Zuni Salt Lake fault to compare how it may be affecting groundwater flow.
Groundwater Temperature
In order to test whether vertical groundwater flow is occurring in the area, temperatures and depths in groundwater wells and springs were compiled and evaluated. Temperature as a function of depth can aid in identifying areas and structural features where groundwater has a downward or upward flow component. Temperatures measured as a function of depth in wells can be affected by regional heat flow, changes in surface temperature, and vertical movement of groundwater (Bredehoeft and Papadopulos, 1965). In the absence of groundwater flow, the geothermal gradient usually is represented by an increase of 25–50 degrees Celsius per kilometer of depth (°C/km) (Anderson, 2005). However, temperatures can also be disturbed by advective heat transfer through fluid flow.
Although no temperature profiles were collected for this project because of the lack of open wells, several groundwater temperatures associated with groundwater wells having reported depths were compiled and compared with data from a geothermal study of the area (Levitte and Gambill, 1980). The Levitte and Gambill (1980) study explored the geothermal potential in the area and estimated the thermal gradient near the Zuni Salt Lake to be about 35 °C/km. That study also identified areas with high thermal gradients to the north (60 °C/km) and to the west, in Arizona (>70 °C/km). The authors concluded that the high temperatures measured in Arizona, about 35 miles southwest of the study area, were due to warm water circulating up from depth.
Groundwater temperatures were compiled from NWIS (USGS, 2023) and are presented in relation to well or borehole depth in figure 9. Because the maar represents a depression of about 300 ft, depths of wells and springs within the maar were normalized to the surrounding landscape by computing the difference between the feature elevation and the rim elevation (6,500 ft above NAVD 88). This assumption does not fully account for the seasonal conductive heating at the land surface in Smith Spring, East Shore seeps, Spring Box, and MW1, but does represent a depth in the absence of the maar. The temperatures in the surficial zone (depths less than 50 ft) are influenced by seasonal heating and cooling of the land surface (Anderson, 2005). The average annual temperature reported for the nearby town of Quemado, N. Mex. is 8.9 °C (the period of record is 1915–2005; WRCC, 2024). The higher temperatures relative to the average annual air temperature in the two shallow samples may reflect the season (spring) in which they were collected or indicate that more recharge is occurring in the warmer months of the monsoon. The groundwater temperatures associated with deeper wells are generally warmer than predicted by the estimated thermal gradient of 35 °C/km (Levitte and Gambill, 1980). It should be noted that the temperature of groundwater being discharged from a well or spring is not equivalent to a bottom hole temperature or temperature/depth profile, because the temperature of the discharging groundwater may represent fluid temperatures from depths above or below the reported well depth or multiple depths. That said, it is often the case that groundwater wells are completed in the most productive zones, and therefore these temperatures can provide an indication of subsurface temperature profile. The least-squares regression of the groundwater temperature as a function of the reported well or hole depth yields a temperature gradient of about 79 °C/km. The trend is largely driven by the two San Andres Limestone/Glorieta Sandstone aquifer wells, but one can be reasonably confident in the relative temperature to depth relationship because of the reported thickness of the formation and overlying confining Chinle Formation. This high temperature to depth relationship indicates a substantially higher thermal gradient than previously reported. It is unclear if this finding represents a localized shallow high temperature source or advective heat flux through fluid flow from depth. It is notable that the groundwater temperature in DKOT-17 is near the predicted temperature for the 35 °C/km gradient for its reported depth, whereas the two San Andres Limestone/Glorieta Sandstone aquifer wells are substantially warmer. This may be explained by the ability for upflow to the San Andres Limestone/Glorieta Sandstone aquifer but not to the Dakota Sandstone because of the presence of the Chinle Formation between them. Upflow may also be elevating the temperatures in groundwater samples collected from in and near the maar because of fractures associated with the volcanic intrusion that created the maar.
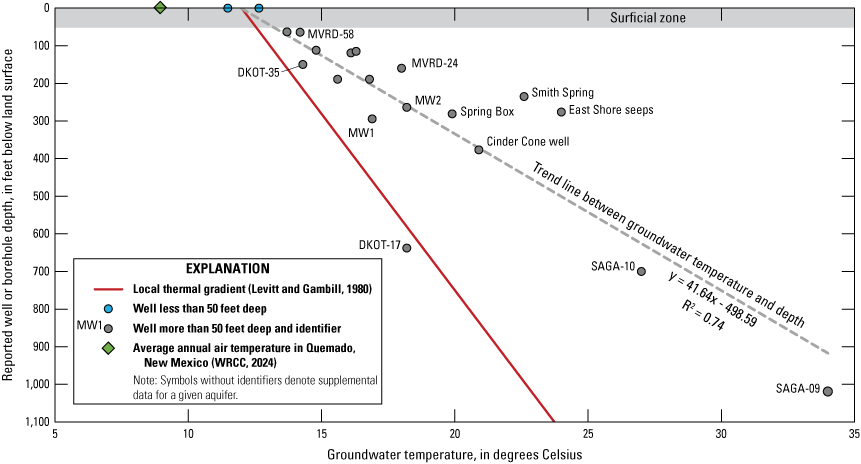
Groundwater temperatures in wells and springs with reported depths near the Zuni Salt Lake (U.S. Geological Survey, 2023). Well and spring depths within the maar were normalized to the maar rim elevation of 6,500 feet above the North American Vertical Datum of 1988.
Noble Gas
Vertical groundwater flow can also be indicated by the noble gas content of groundwater (Ballentine and others, 2002). Deviations from atmospheric concentrations can aid in understanding the age, source, and flow conditions of groundwater. Recharge water, having atmospherically derived noble gases, percolates through the vadose zone, and eventually mixes with groundwater. Being in equilibrium with the atmosphere, the noble gas concentrations in the recharge water have a defined composition and can be assumed to be air equilibrated water (AEW). In the groundwater system, additional noble gasses may be produced from radioactive decay of uranium, thorium, and potassium in the Earth’s crust (known as radiogenic noble gases) or from the migration of primordial noble gases from the mantle in areas of continental extension or magmatic activity (Ballentine and others, 2002). In this study, we focused on concentrations and isotopic compositions of helium in groundwater. Additional helium in the groundwater is normalized to the atmospheric component by comparing helium-4 (4He) to neon-20 (20Ne), the dominant isotopes in the critical zone (Ballentine and others, 2002), and expressed as the He/Ne ratio where the AEW He/Ne is 0.290. The process by which the additional helium is added to the groundwater can be delineated by the isotopic composition of helium. Although both processes (radiogenic helium production and addition of mantle-derived gases) increase the concentration of helium, 4He is produced by radioactive decay, whereas 3He is remanent primordial helium from the mantle. The 3He/4He is expressed as R and is compared with the AEW value (Ra; Ballentine and others, 2002). The mantle end member was assumed to have an R/Ra of 8±1 (Graham, 2002) and a He/Ne of 10,000 (Morikawa and others, 2008). The radiogenic end member was assumed to have an R/Ra of 0.02 (Oxburgh and others, 1986) and He/Ne of 10,000 (Morikawa and others, 2008).
Based on the work of Pinti and others (2019), a mixing line was developed between AEW and the radiogenic end member (fig. 10). This line, with increasing He/Ne ratio, may be thought of as representing increasing time since recharge; in other words, a sample with higher radiogenic 4He and therefore higher He/Ne is likely to be older than one with lower He/Ne. Although the radiogenic 4He production rate for the formations in the area are not known, the extremely low rates reported in other formations (Solomon, 2000; Ballentine and others, 2002) indicated that groundwater with elevated He has been in contact with aquifer material for at least 1,000 years. Hypothetical “old water” end members (fig. 10) were selected along the mixing line between AEW and the radiogenic end member and a new mixing line was developed between the “old water” end members and the mantle end member.
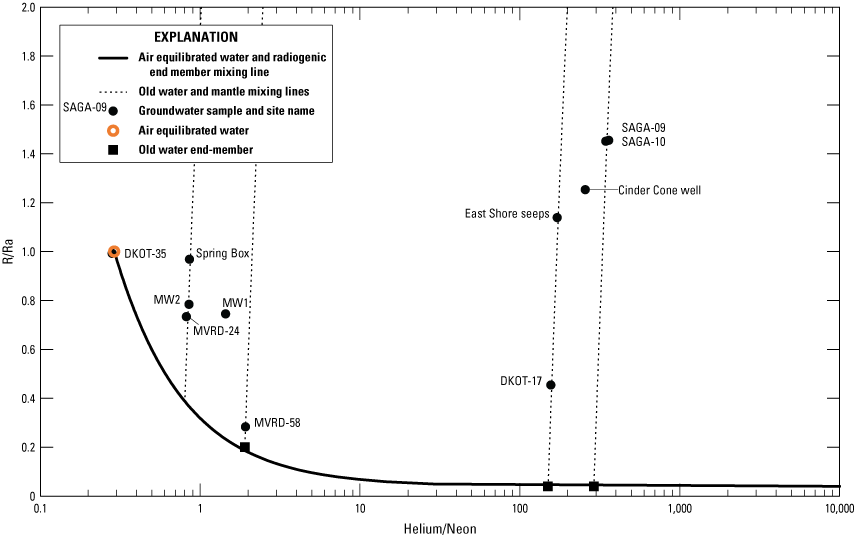
Helium (He)/Neon gas concentrations and the isotopic ratio of 3He/4He ratios (R) normalized to that of the atmosphere (Ra) in groundwater near the Zuni Salt Lake. Mixing lines were developed between air equilibrated water (AEW) and a radiogenic end member and several old water end members (selected from points along the AEW and radiogenic end member mixing line) and a mantle end member.
The East Shore seeps, the Cinder Cone well, DKOT-17, and the two San Andres Limestone/Glorieta Sandstone aquifer wells have a He/Ne ratio greater than 150, indicating that less than 1 percent of the helium content is from modern recharge (AEW; fig. 10). Additionally, the East Shore seeps, Cinder Cone well, and the two San Andres Limestone/Glorieta Sandstone aquifer wells have R/Ra values greater than 1, indicating that more than 12 percent of the dissolved helium is derived from a mantle source, whereas DKOT-17, with an R/Ra value of 0.46 only has about 4 percent mantle contribution. The difference in the amount of primordial helium between the DKOT-17 sample and the two San Andres Limestone/Glorieta Sandstone aquifer wells supports the previous interpretation of restricted vertical flow in Dakota Sandstone at DKOT-17 caused by the presence of overlying and underlying aquitards and adds evidence that there may be some deep exchange of fluid or gas in the Permian units beneath the Chinle Formation. The relatively high R/Ra values in the Cinder Cone well and East Shore seeps also support the concept that the intrusion that formed the maar may be acting as a pathway for deeper fluids (or gases) to make their way to the surface of the maar. Wells MVRD-24 and MW2 had about 34 percent helium from recent recharge and only 5 percent primordial helium, whereas the Spring Box had 8 percent helium from a mantle source, possibly indicating mixing between nearby Mesaverde Group aquifer water and deeper mantle-rich groundwater like the San Andres Limestone/Glorieta Sandstone aquifer or the East Shore seeps. The sample collected from DKOT-35 has a helium content very similar to AEW, indicating relatively recent recharge, whereas the helium content in MVRD-58 has only about 1 percent mantle helium, further supporting the interpretation that vertical groundwater flow is restricted through confining units beyond the maar.
Lake Hydrology
In order to estimate groundwater contributions to Zuni Salt Lake, water-surface elevations were related to lake geometry to determine changes in lake storage. Additionally, evaporation from the lake was estimated with the modified Penman equation fitted with the CFEP, and lake inflows were measured or estimated through direct measurement of springs with volumetric methods and real-time precipitation measurements. This water balance approach can also be used with dissolved solid concentrations to estimate the amount of salt entering the lake.
Water Budget
Between August 2019 and March 2023, daily stage at the Zuni Salt Lake fluctuated between 6,221.11 and 6,222.72 ft above NAVD 88, which corresponds to lake storage ranging from 22.7 to 261.3 acre-ft. Lake storage typically began declining in March because of dry conditions and increasing temperatures and began recovering in June–July with the onset of monsoon moisture (fig. 11). Change in the lake stage was recorded on more than 60 percent of the days but did not exceed 0.02 ft/d, except during large precipitation events. The annual volume of direct precipitation falling on the lake was calculated to be 135 acre-ft in calendar year 2021 and 132 acre-ft in calendar year 2022, which is very close to the average annual volume of 135 acre-ft calculated from average annual precipitation at a local meteorological station and the area of the lake. The estimated annual evaporation from the lake was determined to be 627 acre-ft in 2021 and 742 acre-ft in 2022. Based on pan evaporation data from several nearby stations, Bradbury (1971) estimated annual evaporation losses of about 872 acre-ft.
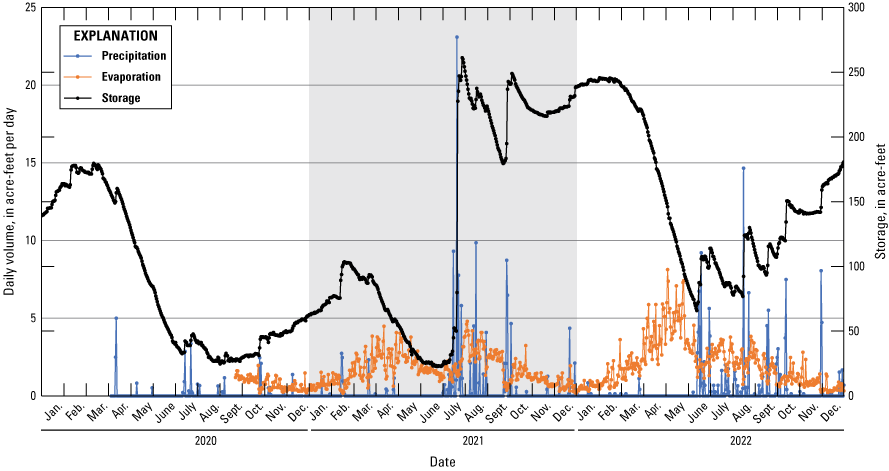
Zuni Salt Lake storage and estimated gains from precipitation and losses from evaporation reported as daily volume.
Groundwater contributions were estimated using a water balance approach by comparing daily storage changes with inflow (precipitation) and outflow (evaporation). The resulting imbalance is assumed to be groundwater inflows. The daily balance is highly variable, ranging from −2.1 to 18.2 cubic feet per second (ft3/s) with an average of 0.7 and a median of 0.5 ft3/s indicating a normal distribution of data with a slight bias toward positive imbalances (fig. 12). In order to minimize the error associated with unaccounted inflows from surface runoff following precipitation events, a second water balance calculation was conducted, whereby the inflows and outflows around precipitation events were not included. The data were reduced by removing daily budget data on the day prior to recorded precipitation (because of daily averaging) and 2 days following the event to avoid response lags. This data reduction resulted in the elimination of 398 days (from 829 to 431) from the analysis. The resulting imbalance was far less variable, ranging between −1.0 and 3.1 ft3/s, but with a comparable mean and median of 0.6 and 0.5 ft3/s respectively, indicating some stability in the method. The uncertainty associated with this imbalance was estimated to be 22 percent by combining errors in the components of the water budget using the root sum of squares (20 percent for storage changes and 10 percent for evaporation).

Zuni Salt Lake storage and difference in the daily changes in storage and the daily difference between the precipitation and evaporation (balance). The balance for the entire dataset is shown, as well as the edited dataset in which days with measurable precipitation have been removed.
The groundwater contributions of 0.61 ±0.13 ft3/s (441 ±94 acre-feet per year [acre-ft/yr]) to the Zuni Salt Lake is inferred from the mean budget imbalance. By visually inspecting the balance over time (fig. 12), the groundwater contributions appear to be relatively stable (30-day moving average generally being within estimated uncertainty) over the period of data collection (September 2020–January 2023) and over variable lake volumes. The increasing imbalance during the periods of falling lake levels may indicate higher groundwater discharge or may represent increasing uncertainty in the evaporation estimates.
Salt Budget
The disparity of dissolved solids concentrations in groundwater samples necessitates an understanding of the salt contributions to the Zuni Salt Lake in order to understand the end-member chemistry and resulting lake composition. Several authors report the existence of salt beds beneath the lake in Paleozoic units in the subsurface (Levitte and Gambill, 1980; Maxwell and Nonini,1977; Zillmer, 1973). Based on the concentration of sodium and chloride measured as a part of this study and the groundwater seepage estimated above, the amount of potential halite entering the maar from different groundwater sources can be estimated.
Identifying Distinct Water Inflows
There are numerous potential sources of water and salt to the Zuni Salt Lake, including saline seeps, freshwater springs, direct precipitation, and surface runoff. The multiple geologic units intersected by the lake and remanent intrusion mean that groundwater from multiple aquifers with different flow paths may mix to form the unique features and aqueous chemistry of the lake. By using the water budget approach, the volume of groundwater entering the lake is better constrained, and the salt budget analysis provided evidence that small changes in contributions of the saline discharge relative to fresh and brackish discharge can greatly change the salt balance.
Near-Lake Water Levels
Within the maar, water levels between the Zuni Salt Lake, Cinder Cone pool, Cinder Cone well, Spring Box, and East Shore seeps are very similar and require survey-grade positions to determine the gradients. Assessment of these gradients can enhance understanding of whether the lake is the source of salinity to the surrounding features or these features are a source of water and salt to the lake.
Water-level comparisons between the Zuni Salt Lake and the Spring Box show that between summer 2019 and fall 2021 the groundwater elevation of the Spring Box was consistently about 3 ft above the lake. The variability in the Spring Box groundwater elevations could either be related to seasonal changes in the source groundwater or be the result of transpiration demands of nearby phreatophytes (fig. 13). During the period of investigation, the Cinder Cone pool elevation only varied by about 7 in. and was more than 6 in. higher than the lake elevation until the lake elevation rose sharply in July 2021; thereafter, the difference in water-surface elevation between the lake and pool remained within 3 in. (fig. 13). The Cinder Cone pool elevations likely respond similarly to the lake elevations, with increases resulting from precipitation events and decreases resulting from evaporation. However, because of the smaller surface area of the pool and the sheltering provided by high, steep walls, those responses are minimized. The consistently higher elevations observed in the Cinder Cone pool indicate additional groundwater seepage discharging directly into the Cinder Cone pool. The groundwater elevation in the Cinder Cone well varied by about 8 in. during the investigation and averaged about 5 in. above the Zuni Salt Lake elevation. That difference, however, decreased to less than 1 in. during the high lake levels in late 2019 and early 2020, and was lower than the lake elevation recorded in September 2021 (fig. 13). Lastly, the elevations of the East Shore seeps are not well constrained; however, observations of the seeps along the shoreline indicated flow into the lake.
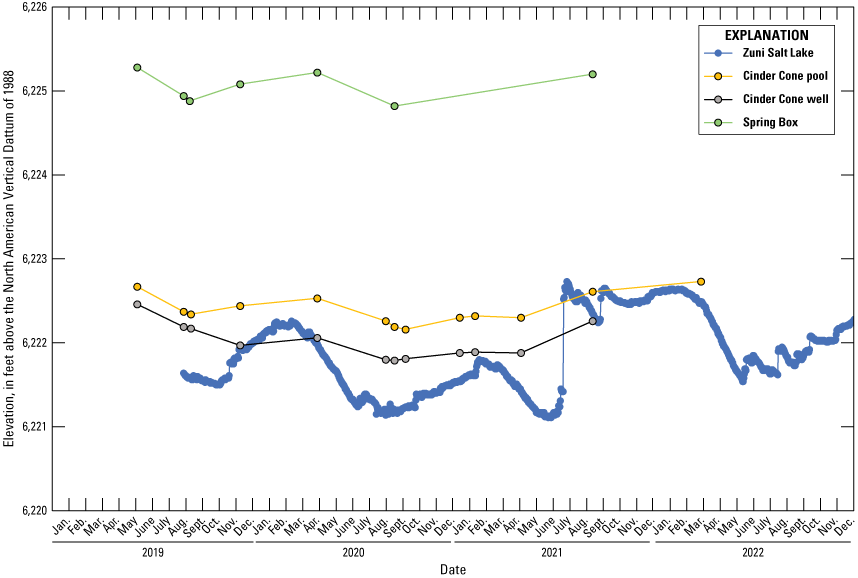
Water-surface elevations in the Zuni Salt Lake maar. Solid lines connecting discrete measurements are included to make data easier to interpret but are not an interpolated water level between measurements.
On the basis of the observations just presented, each of the features discussed is inferred to be a potential source of water to the Zuni Salt Lake. Likewise, the evaluation of hydraulic potential and the possible evidence of advective flux does not exclude any of the regional aquifers as a possible source of water and salt to the lake.
Geochemistry and Isotopic Composition
Because of the numerous inflows to the Zuni Salt Lake and the successive precipitation and redissolution of minerals, simple mixing models with a few end members are not adequate to identify a source of water or salt to the lake. Numerous aqueous chemical concentrations and isotopic compositions were analyzed from the lake and surrounding aquifer samples in order to better characterize the potential inflow sources.
Major Ions and Bromide
The major ion composition of natural water in the study area can offer insights into groundwater mixing and geochemical evolution. The major ion composition of surface-water and groundwater samples collected from and near the Zuni Salt Lake are presented on a Piper diagram (fig. 14), which is a trilinear diagram designed to illustrate the hydrochemical facies of a water sample (Hem, 1985). The percentages on the axes of the diagram represent the relative abundance of ions in percent milliequivalents.

Major ion relations between the Zuni Salt Lake and groundwater from the study area. Precipitation chemistry data are from the National Atmospheric Deposition Program (University of Wisconsin, 2024) and average seawater (Millero and others, 2008). For this report, the Atarque Sandstone and Moreno Hill Formation are included in the Mesaverde Group aquifer because of the hydrologic connections (Myers, 1992).
Examination of the major ions (fig. 14) illustrates the different hydrochemical facies between the Zuni Salt Lake and surrounding groundwater. Both the lake and Cinder Cone pool are dominated by sodium (Na+) and chloride (Cl−) ions, as are the samples collected the Cinder Cone well and East Shore seeps. Each of these samples contains over 100,000 mg/L of dissolved solids and is classified as hypersaline. There is relatively minimal abundance of Cl− in all other samples, with most samples having proportionally more bicarbonate (HCO3−). The anion abundance in the two San Andres Limestone/Glorieta Sandstone aquifer samples is approximately 50 percent HCO3− and almost 40 percent sulfate, likely because of the abundance of limestone and gypsum in the formation (Baldwin and Anderholm, 1992). The sample from MVRD-58 has a similar anion composition as the San Andres Limestone/Glorieta Sandstone aquifer samples, but with slightly more sulfate and slightly less Cl−, proportionally. Other than MVRD-58, anion composition in Cretaceous groundwater samples is dominated by HCO3−. The Spring Box sample contains similar amounts (about 40 percent) of HCO3− and Cl−, possibly indicating mixing between the Cl−-dominated hypersaline waters and most waters in Cretaceous aquifers. Cations are dominated by Na+ in all the samples except for the two San Andres Limestone/Glorieta Sandstone aquifer wells and the DKOT-35 well. Given the similar anion compositions in many of the groundwater samples and the reported presence of clay, cation exchange may be responsible for the distinct facies. The elevation of Smith Spring coincides with the Mesaverde Group aquifer; therefore, its major ion composition would be expected to resemble samples from the Mesaverde Group aquifer, which is supported by its plotting near samples from Mesaverde Group wells on the Piper diagram.
In Na+-Cl− type brines, like those present in the Zuni Salt Lake and Cinder Cone pool, the enrichment of Na+ and Cl− in solution through mineral precipitation processes can be difficult to distinguish from the addition of Na+ and Cl- by halite dissolution. Relations between bromide (Br−), Na+, and Cl− plotted as combinations of isometric log ratios can be helpful in determining which of these processes is occurring (fig. 15; Davis and others, 1998; Engle and Rowan, 2012). Br− is more soluble than both Na+ and Cl−; therefore, halite precipitation has the effect of increasing the amount of Br− in solution relative to Na+ and Cl−. As Br− is excluded from the crystal lattice of halite, halite dissolution increases the content of Na+ and Cl− in solution relative to Br− while driving the Na+/Cl− ratio of the solution towards unity (zero for isometric log ratios). The Na+/Cl− ratio and Na+ and Cl− enrichment relative to Br− in hypersaline groundwater at the site (Cinder Cone well and East Shore seeps) indicates that the surrounding groundwater at the site could not have geochemically evolved to the composition of hypersaline groundwater without dissolving halite. Furthermore, the Zuni Salt Lake and Cinder Cone pool compositions have a similar Na+/Cl− ratio (near unity) as hypersaline groundwater, although the surface waters exhibit lower ratios of Na+ and Cl− to Br−, supporting the interpretation that the lake and Cinder Cone pool are sufficiently evaporated to precipitate halite, and that the source is hypersaline groundwater.
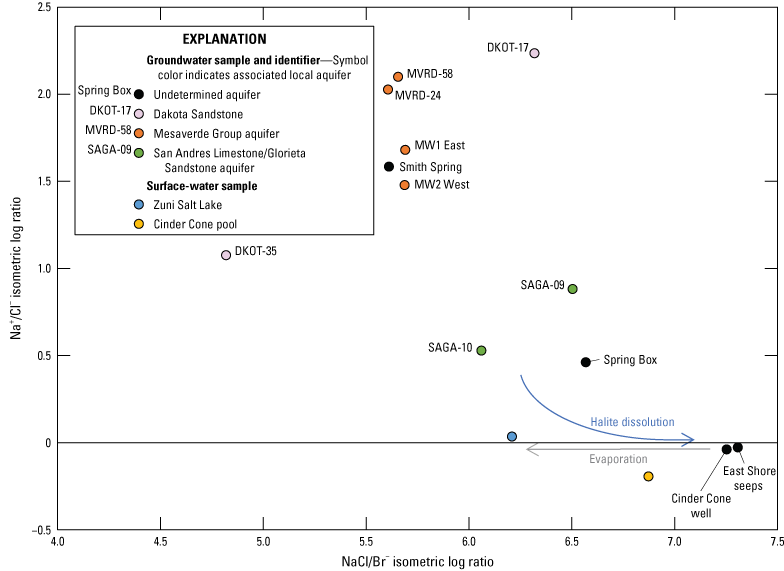
Relation between sodium-to-chloride (Na+/Cl−) isometric log ratio and sodium and chloride to bromide (NaCl/Br−) isometric log ratio. Isometric log ratios are based on molar concentrations and calculations are provided by Engle and Rowan (2012).
Stable Water Isotopes
Samples of the Zuni Salt Lake and possible groundwater sources were collected and analyzed for the isotopic compositions of the stable isotopes of water (δ2H and δ18O). The compositions were analyzed to constrain groundwater recharge and flow spatially and temporally. The variation in the isotopic composition of various potential recharge waters may help identify the source of recharge because of the mass-dependent fractionation of water isotopes resulting from temperature changes during the formation of precipitation and during evaporation prior to infiltration into the aquifer (Genereux and Hooper, 1998; Ingraham, 1998). This mass-dependent fractionation results because the various isotopic forms of water have different vapor pressures. Therefore, warmer-temperature precipitation contains a greater number of heavier isotopes (less negative δ18O and δ2H values) than cooler-temperature precipitation (Ingraham, 1998). Similarly, the water left after evaporation will contain a larger number of heavier isotopes than water that has not been subjected to evaporation. The stable-isotope ratios, reported in per mil (‰) relative to Vienna Standard Mean Ocean Water, of water from various sources are plotted in figure 16.
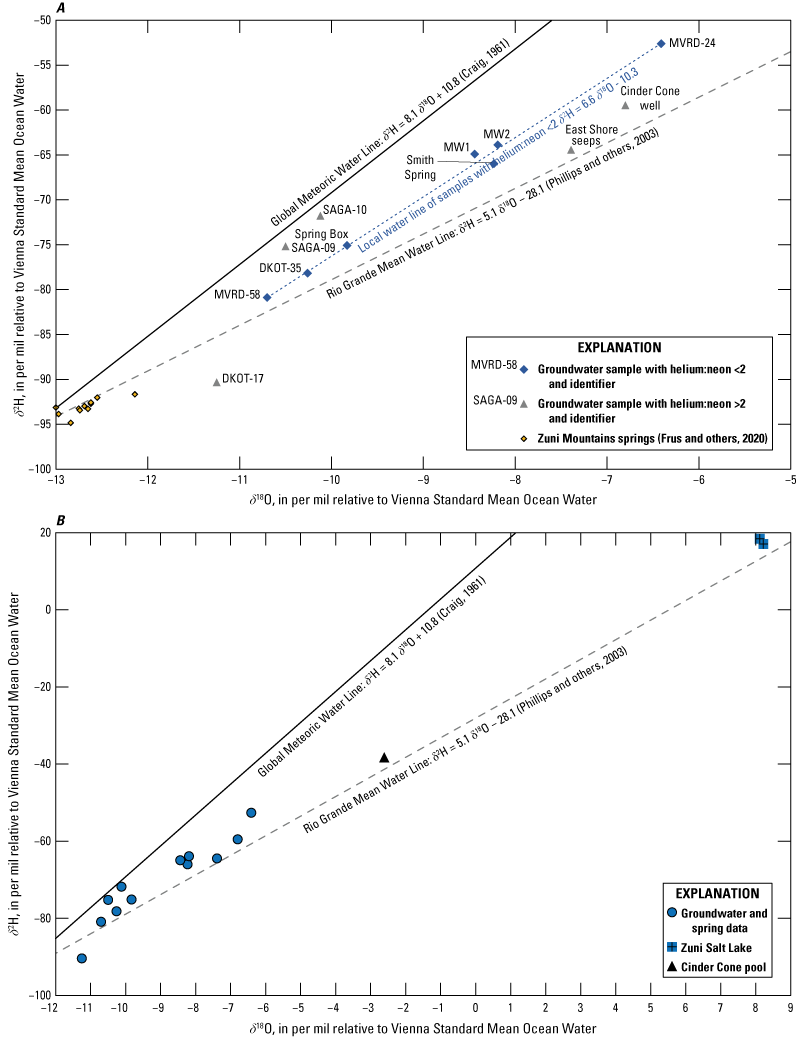
Stable isotopes of water (δ2H and δ18O) compositions from samples collected from the Zuni Salt Lake and nearby groundwater wells and springs. A, Zoomed-in portion of the entire dataset to display the relation between groundwater samples, and, B, the entire dataset. The samples are classified on the basis of the ratio of helium to neon concentrations.
Groundwater δ2H and δ18O values in the study area plot below (to the right of) the Global Meteoric Water Line (GMWL) (Craig, 1961) (fig. 16). The overall position of the δ2H and δ18O values compared to the GMWL is typical of the arid and semiarid southwestern U.S. climate, where there is a large evaporation component to the water budget (Friedman and others, 1992). For reference, the isotopic composition of water collected from high mountain springs in the Zuni Mountains (Frus and others, 2020) are also plotted in figure 16. The spring samples are far more depleted in δ2H and δ18O than the water samples collected in and around the Zuni Salt Lake and indicate that recharge to the groundwater surrounding the lake is from warmer, lower elevation precipitation. The study samples are further classified in figure 16 using the noble gas concentrations reported in the “Noble Gas” section herein as a proxy for relative groundwater age. Lower He/Ne ratios indicate limited addition of helium from mantle or radiogenic sources and therefore shorter residence times relative to groundwater with higher He/Ne ratios. Groundwater samples were classified in terms of their He/Ne ratio being either greater than 2 or less than 2. The least-squares regression of groundwater isotopic compositions with low He/Ne ratios near the Zuni Salt Lake yields a strong correlation (R2 = 0.99) and, for the purpose of comparison, is considered a local water line. The position of the line relative to the GMWL and the smaller slope indicates considerable evaporation following precipitation events and before this water recharged the aquifer. Groundwater samples with higher He/Ne ratios plot both above and below this local water line, indicating large variations in recharge temperature and subsequent evaporation.
The Zuni Salt Lake and Cinder Cone pool samples are far more enriched in heavy isotopes than any other samples and are indicative of evaporative effects. The isotopic composition of these samples relative to the nearby groundwater and the spring samples in the Zuni Mountains (Frus and others, 2020) are within expected range of evaporative effects (slopes between 3 and 6) according to Coplen and others (2000) and close to a slope of 5 reported by Phillips and others (2003) for samples representing increasing evaporation from the Rio Grande, N. Mex. The isotopic compositions of the Zuni Salt Lake (and Cinder Cone pool) water indicate that evaporation of many of the nearby samples could result in an isotopic composition similar to the lake, and therefore each aquifer may be a plausible source of the lake’s water.
Another process that may affect the isotopic compositions of the groundwater samples near the Zuni Salt Lake is the so-called oxygen isotope shift. This shift was first interpreted by Craig (1961) to result from isotopic equilibration of water with rock minerals rich in oxygen with high δ18O values. Increasing temperature allows for increasing exchange between groundwater and the higher δ18O rock content, resulting in groundwater having higher δ18O without a corresponding change in δ2H. That appears to be the condition of the DKOT-17 sample. If this shift did occur, it would also indicate the recharge water was derived from a cooler source, such as higher elevation precipitation (similar to the Zuni Mountain springs) or much older recharge when global temperatures were cooler, as during the Pleistocene (Dam, 1995). Although the relatively cool groundwater temperature measured at DKOT-17 does not support the high temperature oxygen isotope shift, the enriched δ18O may simply result from longer residence times. The oxygen isotope shift could also be interpreted to be affecting the Cinder Cone well and East Shore seeps samples; however, it is also entirely plausible that evaporation is the dominant process. The isotopic compositions that, through evaporation, could yield the isotopic composition of the hypersaline samples (East Shore seeps and Cinder Cone well) include those similar to Spring Box, MVRD-58, and DKOT-35, or depleted compositions associated with cooler recharge like the springs in the Zuni Mountains. The strong evaporation signal of the Zuni Salt Lake and Cinder Cone pool and the variability of nearby groundwater samples do not indicate any one source of water to the lake nor to the hypersaline groundwaters.
Age Tracers
Radioactive isotopes are frequently used to approximate the age of groundwater. Tritium (3H) and carbon-14 (14C) are used to determine the amount of time that groundwater has been disconnected from the atmosphere. 3H is a radioactive isotope of hydrogen that is short-lived, with a half-life of 12.32 years (Lucas and Unterweger, 2000). During the late 1950s to the mid-1960s, testing of nuclear weapons raised the atmospheric concentrations of 3H hundreds of times above normal background concentrations (Plummer and Friedman, 1999). 14C has a half-life of 5,730 years and is produced in the upper atmosphere by the interaction of cosmic rays and atmospheric nitrogen. The cosmogenic 14C is rapidly oxidized and becomes incorporated into biological and hydrologic processes as carbon dioxide (14CO2) (Plummer and others, 2012). Because of its long half-life, the amount of 14C in dissolved inorganic carbon (DIC) may be used to estimate groundwater ages ranging from 1 ka to about 30 ka (Clark and Fritz, 1997). 3H is incorporated as part of the water molecule itself, whereas the 14C is measured in DIC and can have multiple sources.
DIC in natural waters is most often the result of the dissolution of calcite and (or) dolomite, which is greatly enhanced by dissolving gaseous carbon dioxide (CO2), usually from soil gas, to create a weak acid (Han and others, 2012). The stable carbon isotope composition of delta carbon-13 (δ13C) is a useful indicator of the sources of dissolved inorganic carbon in groundwater (Chapelle and Knobel, 1985) because of the different isotopic composition of CO2, calcite, and other organic constituents that may become part of the dissolved phase in groundwater.
A graphical analysis of the δ13C and 14C data from samples collected at and near the Zuni Salt Lake (fig. 17; Han and others, 2012; Han and Plummer, 2016) was performed by comparing the sample compositions to the probable isotopic compositions of dissolved CO2 equilibrated with soil gas (point A1, where δ13C is −18‰, from Truini and Longsworth [2003]), DIC in an open system in equilibrium with soil gas (point A3), DIC in a closed system in equilibrium with carbonates (point M”), and DIC when water has equilibrated with soil CO2 and carbonates in a closed system (point O). Prior to carbonate dissolution, the DIC of the water (made up mostly of dissolved CO2) will be near point A1 in figure 17.

Carbon-14 (14C) and delta carbon-13 (δ13C) isotopic composition of the samples collected in and near the Zuni Salt Lake, New Mexico. A graphical analysis of data (Han and others, 2012; Han and Plummer, 2016) was performed by comparing the sample compositions to the probable isotopic compositions of dissolved carbon dioxide (CO2) equilibrated with soil gas (point A1), dissolved inorganic carbon (DIC) in an open system in equilibrium with soil gas (point A3), the isotopic composition of DIC in a closed system in equilibrium with carbonates (point M”), and the isotopic composition of DIC when water has equilibrated with soil CO2 and carbonates in a closed system (point O).
The Zuni Salt Lake tritium content is close to the atmospheric level (between 5 and 9 TU; Eastoe and others, 2012) indicating that the lake water is in equilibrium with atmospheric levels through diffusive exchange and mixing with air-equilibrated precipitation and surface runoff entering the lake (fig. 17). The Cinder Cone pool tritium content is also considered modern but is below the atmospheric level. Because the sample was collected below the halocline, the lower tritium content of the Cinder Cone pool sample compared with the Zuni Salt Lake sample may indicate that there is minimal mixing between water above and below the halocline and that the diffusive processes at depth are slower. This hypothesis is also consistent with the inferred existence of seepage from deep groundwater directly to the Cinder Cone pool. Except for Smith Spring, all groundwater is premodern based on tritium content. The presence of some tritium in Smith Spring likely results from mixing of older groundwater and recent recharge from precipitation in and adjacent to the ephemeral stream channel near the spring.
The 14C and δ13C content of the Zuni Salt Lake samples is unique and has an uncertain origin. The δ13C in the lake is substantially enriched (5.9 ‰) above any potential groundwater source or calcite or CO2 source (fig. 17) and indicates that the enrichment of δ13C is occurring within the lake. Processes that may be responsible for the enrichment of δ13C include continuous dissolution and re-precipitation of calcitic materials (Smith and others, 1975) and methanogenesis (Han and others, 2012). Both processes are viable at the lake and may be co-occurring. Calcite dissolution and re-precipitation can occur as freshwater inflows reduce the saturation indices and evaporation drives dissolved solid concentrations higher. Methanogenesis would have to occur at depth where oxygen has been consumed in the lake. Although observations of methane are not known, hydrogen sulfide observations made during this study and by Bradbury (1971) when lake sediments are disturbed confirm the presence of reducing conditions at depth.
The Cinder Cone pool, DKOT-35, and the two San Andres Limestone/Glorieta Sandstone aquifer samples plot near the equilibration and exchange pathway between dissolved CO2 in equilibrium with soil gas (point A1) and the composition of DIC in equilibrium with solid carbonates in a closed system (point M”; δ13C = −1.8‰ and 14C = 0 percent modern carbon) (fig. 17). The San Andres Limestone/Glorieta Sandstone aquifer and DKOT-35 samples represent different degrees of carbon exchange between DIC and solid carbonates in the aquifer, indicating that the exchange reaction may be limited at DKOT-35 (for example, if the availability of carbonate solids is limited) or that DKOT-35 is less geochemically evolved (and likely younger) than water at SAGA-9 and SAGA-10. The samples collected from the Cinder Cone well, the East Shore seeps, and the DKOT-17 well plot below the carbon exchange pathway, indicating additional radioactive decay at various stages of exchange between the soil gas and carbonates. Samples from Mesaverde Group aquifer groundwater wells, Smith Spring, and the Spring Box plot within, or very close to, the lower left quadrant of figure 17, which Han and others (2012) suggest may be due to additional carbon introduced by oxidation of old organic matter. Oxidation of organic fossil material would increase the DIC, lower the 14C, and lower the 13C value.
Sulfate Isotopes
Variations in the sulfur-34 (δ34S) values of sulfate are caused by two kinds of processes: reduction of sulfate to sulfide by anerobic bacteria, which results in an increase in the δ34S of the residual sulfate, and various kinds of exchange reactions, which result in δ34S being concentrated in the compound with the highest oxidation state of sulfur (Mitchell and others, 1998). Depending on the reaction responsible for sulfate formation, between 12.5 and 100 percent of the oxygen in sulfate is derived from the oxygen in the environmental water, whereas the remaining oxygen comes from oxygen gas, that is in addition to any fractionation effects (Clark and Fritz, 1997; Taylor and others, 1984).
The Zuni Salt Lake sulfate isotopic composition is very similar to the isotopic composition of the East Shore seeps and the Cinder Cone well, with δ34S around 15‰ and δ18O above 14‰ (fig. 18). The Cinder Cone pool is slightly more enriched in both δ34S and δ18O, whereas the San Andres Limestone/Glorieta Sandstone aquifer samples, MW1 and MW2, and the DKOT-17 are slightly more depleted (around 11‰ and 10‰, respectively), but all plot as marine sediments or evaporites (Clark and Fritz, 1997) and close to Paleozoic marine Yeso Formation and San Andres Limestone water measured in southern New Mexico (Szynkiewicz and others, 2012). The δ34S in groundwater samples from the Mesaverde Group aquifer range from 4.5 to 9.8‰. The Spring Box, Smith Spring, and a MVRD-24 plot within atmospheric values, as do MW1 and MW2. DKOT-35 and MVRD-58 plotted in the range typical of terrestrial evaporites, partially because the δ18O was below 2‰. (It is unclear why MVRD-58 is depleted in δ18O.) DKOT-35 had the only negative δ34S composition. Based on the older age interpreted for the deep groundwater wells (SAGA-09, SAGA-10, and DKOT-17) and the more recent recharge interpreted in DKOT-35, the variability in the sulfate isotopic composition may be related to the equilibrium between the sulfate content at recharge, or at the surface, and contact time with the Mesozoic marine sediments. The range of sulfate isotope values in groundwater samples collected from the Mesaverde Group aquifer indicates differences in dominant sulfate source. However, enrichment of the sulfate isotopes by the reduction of sulfate to sulfide cannot be ruled out, given the presence of organic carbon and reducing conditions.
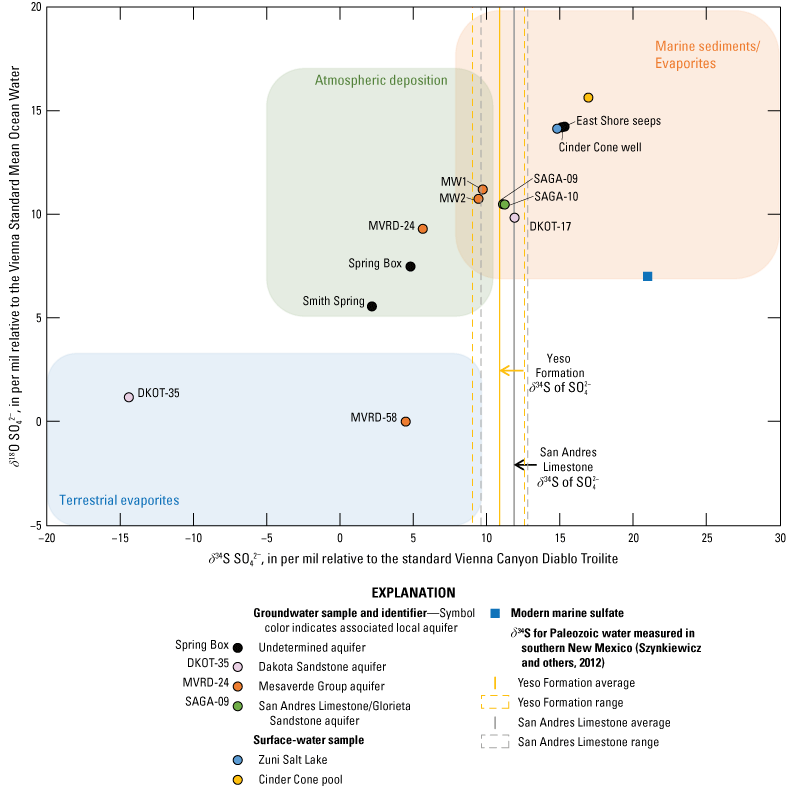
Delta sulfur-34 of sulfate (δ34S SO42−) and delta oxygen-18 of sulfate (δ18O SO42−) composition of water samples in and around the Zuni Salt Lake. Bounding boxes and modern marine sulfate are from Clark and Fritz (1997); the range of groundwater δ34S data from the Yeso Formation and San Andres Limestone in the Sacramento Mountains, New Mexico, are from Szynkiewicz and others (2012). For this report, the Atarque Sandstone and Moreno Hill Formation are included in the Mesaverde Group aquifer because of the hydrologic connections (Myers, 1992).
Strontium
Differences in the isotopic composition of strontium (Sr) (87Sr/86Sr) arise from the parent mineral, and given sufficient time, the radiogenic production of strontium-87 (87Sr) from the decay of rubidium-87 (87Rb) (Bullen and Kendall, 1998). The half-life of 87Rb is such that considerable variations exist in the present-day 87Sr/86Sr ratio in minerals. 87Sr/86Sr in minerals and rocks ranges from about 0.7 to greater than 4.0 (Faure, 1986). Aqueous Sr, derived from any mineral through weathering reactions, will have the same 87Sr/86Sr as the mineral largely because Sr isotopes are not measurably fractionated by geological processes, unlike the isotopes of the light elements. Therefore, differences in 87Sr/86Sr among waters require either differences in mineralogy along the contrasting flowpaths, or differences in the relative amounts of Sr derived from the different minerals.
Because of the ionic and size similarities between calcium and strontium, there is an expected linear relation between the concentrations of each ion in the samples collected in and near the Zuni Salt Lake (fig. 19). The range in Ca/Sr values results from relatively high calcium concentrations in the San Andres Limestone/Glorieta Sandstone aquifer, a very low strontium concentration in the Spring Box sample, and a relatively high strontium concentration in the lake sample. The ratios of 87Sr/86Sr of the samples at and near the lake are considerably depleted in the heavy isotope and have little variability, indicating the isotopic composition of Cretaceous rocks and the groundwater moving through them are indistinguishable in the area. The notable exceptions are the two samples from the San Andres Limestone/Glorieta Sandstone aquifer wells, which have 87Sr/86Sr values at the higher end of most marine materials and are more commonly associated with weathering of continental rocks (Capo and others, 1998). The distribution of 87Sr/86Sr values in the lake and the groundwater samples indicates large contributions of strontium from nearby Cretaceous aquifers and minimal contributions from groundwater resembling the two San Andres Limestone/Glorieta Sandstone aquifer samples.

Strontium isotope ratio (87Sr/86Sr) relative to the calcium-strontium (Ca/Sr) ratio of samples collected in and near the Zuni Salt Lake. For this report, the Atarque Sandstone and Moreno Hill Formation are included in the Mesaverde Group aquifer because of the hydrologic connections (Myers, 1992).
Discussion
Despite the lack of data to confidently predict groundwater flow patterns, regional groundwater levels indicate that the Zuni Salt Lake is a potential discharge point for each of the area’s aquifers. This is strongly supported by data indicating groundwater flow east of the lake, but the presence, and reported offset, of the Zuni Salt Lake fault complicate the flow of groundwater from the west. This is an important consideration when evaluating the potential sources of water and salt to the lake. The regional stratigraphic record is one of alternating high and low hydraulically conductive materials, imparting confining conditions on the region’s aquifers. Because of these confining conditions, the potentiometric surface in many of these aquifers is substantially higher than the top of the formation hosting the aquifer. The extent of these confining conditions is not well characterized, but faults and poorly completed wells could act as vertical conduits for flow. An analysis of groundwater temperature and of noble gas concentrations indicate that upward flow may be occurring below the Triassic Chinle Formation and to the surface within the maar because of the remnant intrusion. However, these analyses indicate that the vertical flow is restricted for the Cretaceous aquifers outside the maar. The results of this part of the investigation indicate that each of the region’s aquifers may be contributing groundwater flow to the Zuni Salt Lake, but that fluid flow between the San Andres Limestone/Glorieta Sandstone aquifer, the Dakota Sandstone, and Mesaverde Group aquifer without a structural or other preferential pathway is limited.
The annual volume of direct precipitation measured at the Zuni Salt Lake for 2021 and 2022 was 135 and 132 acre-ft, respectively, whereas the evaporation estimated at the lake was 627 and 724 acre-ft, respectively. The annual precipitation volume at the lake compares well to the average annual volume of 135 acre-ft calculated as the product of the average annual precipitation in Quemado, N. Mex. (10.76 in) and the average area of the lake (150 acres).The estimated evaporation compares reasonably well with an estimate using the annual pan evaporation at Shiprock, N. Mex., with a typical pan coefficient of 0.75 (686 acre-ft/yr). (The pan coefficient is used to correct the measured pan evaporation rates, which overestimate evaporation. The usual practice is to multiply the pan evaporation rate by a reduction ratio that typically ranges from 0.5 to 0.85 [Allen and others, 1998].)
On the basis of observations of seeps and springs, groundwater inflow has been documented at the Zuni Salt Lake (Bradbury, 1971; Myers, 1992). Previous estimates of groundwater contributions include one based on the difference between estimated Zuni Salt Lake level declines from reported pan evaporation data and observed lake level declines between March and July 1964. In this analysis, Bradbury (1971) estimated groundwater seepage to be 728 acre-ft/yr. In another analysis, Drakos and Riesterer (2007) used Darcy’s Law to estimate groundwater discharge to the lake from the Atarque Sandstone and Dakota Sandstone aquifers. Aquifer discharge from the Atarque Sandstone to the lake was estimated to be 10.2 acre-ft/yr (0.01 ft3/s) based on 40 ft of saturated thickness, 7,600 ft of length of the Atarque expressed around the lake, a hydraulic conductivity of 1.0 ft/d (from an aquifer test of the well MW1), and the regional gradient of 0.004 ft/ft from Myers (1992). They also estimated the discharge of the Dakota Sandstone to be between 153 and 450 acre-ft/yr (0.21 and 0.62 ft3/s) on the basis of a hydraulic conductivity of 9.4 ft/d (estimated from pumping tests associated with a proposed coal mining project), a saturated thickness of 55 ft, and a gradient of 0.009 ft/ft. The difference in the Dakota Sandstone aquifer estimates results from the uncertainty in the length of Dakota Sandstone in contact with the maar; the smaller contact length (3,950 ft) represents the easterly contact, whereas the larger contact (11,700 ft) represents the entire perimeter of the maar. The uncertainty stems from lack of information concerning groundwater flow in the Dakota Sandstone aquifer around the Zuni Salt Lake caused by faulting. Smith Spring to the south also contributes perennial flow to the alluvial sediments in the maar. Discharge at Smith Spring was measured at 2.2–5.1 acre-ft/yr (0.003–0.007 ft3/s) during this study (between September 2019 and May 2021). These measurements may not represent the entire spring flow and do not account for the evapotranspiration losses between emergence and infiltration, but they do help constrain a reasonable estimate of perennial flow. The sum of the Darcy’s Law estimates and Smith Spring discharge is between 165 and 465 acre-ft/yr.
Using continuous lake stage, evaporation, and precipitation measurements, this investigation estimated the groundwater inflow to be 441 ±94 acre-ft/yr, or about 77 percent of the total inflows in 2021 and 2022. The estimated groundwater inflow from the water budget calculations is robust over long-term averaging and agrees well with previous estimates that range from 165 to 728 acre-ft/yr. The water budget developed here can offer insights into the hydrologic functions of the Zuni Salt Lake.
It is recognized that the Zuni Salt Lake is a terminal lake, and that high dissolved solids can be achieved simply through evaporation of freshwater sources, as has been proposed. Previous investigations at the lake concerning salt as an economic resource determined the high purity of the salt and attempted to estimate the amount present. Reporting on tests of the lake water, Zillmer (1973) indicated that 1 ft of water would yield 3 in. of salt by evaporation. However, he added that “extended use of the salt lakes for centuries does indicate substantial replenishment of salt into the lake.” Zillmer (1973, p. 81) estimated between 0.042 and 2.7 million tons of salt were available in the maar. He cited several studies on the salt volumes and estimated a production rate of 20,000–25,000 tons annually. It is not clear whether this estimate represents a yield that could be maintained in perpetuity or if it was a yield specific to a given period of mining activity. According to Maxwell and Nonini (1977), private interests have produced about 1,200 tons per year, which may represent a demand limit; no interpretations are provided indicating whether the Zuni Salt Lake could reproduce that amount annually in perpetuity. Regardless of the uncertainty in these analyses, it may be concluded with some certainty that the amount of salt entering the lake is substantial.
Based on the concentration of sodium and chloride measured as a part of this study and the groundwater seepage estimated above, the amount of potential halite entering the maar from different groundwater sources can be estimated. The concentration of sodium and chloride measured in samples was 281 mg/L at the Atarque Sandstone well (MW1), 223 mg/L at the Dakota Sandstone well (DKOT 17), and 327 mg/L at Smith Spring; the average of the two hypersaline samples (East Shore seeps and Cinder Cone well) was 11,524 mg/L. The annual tonnage of halite entering the Zuni Salt Lake if the entire 441 acre-ft/yr of groundwater seepage were from individual sources is as follows: Atarque Sandstone, 168 tons; Dakota Sandstone, 134 tons; Smith Spring, 194 tons, and saline sources, 66,270 tons. It is clear that in order for more than 1,000 tons of halite to enter the lake annually, a saline source is necessary.
An examination of sodium and chloride concentrations of the potential sources to the lake reveals that a saline source need only contribute a small fraction of the total groundwater inflow to be the dominant source of dissolved solids. It is therefore important to keep in mind the disparity between the volume of water and the mass of salt when comparing geochemical constituents in the lake to potential sources. Based on the difference between the groundwater inflow estimated through the water budget analysis and the estimates of groundwater discharge using Darcy approximations and measured spring flow, between 0 and 276 acre-ft/yr of groundwater may be coming from sources deeper than the Dakota Sandstone. However, based on estimates of salt inflow being over 1,000 tons per year to the lake from previous production assessments, a saline source is required. Even if the hypersaline seeps only contributed 1.5 percent (6.6 acre-ft/yr) of the annual groundwater flow, the annual salt input would exceed 1,100 tons and account for almost 86 percent of the salt.
Discrete water-level measurements of the Cinder Cone pool, Cinder Cone well, and East Shore seeps indicate that elevations are higher than the Zuni Salt Lake surface and therefore are likely maintained by groundwater discharge and not lake remnants. This interpretation is also supported by the noble gas concentrations in which the He/Ne ratio for the Cinder Cone well, East Shore seeps, and three deep groundwater wells is greater than 100, indicating long groundwater residence times.
Although the geochemical evolution of closed-basin brines is driven by a variety of mechanisms (including selective dissolution, sediment interactions such as exchange and sorption, degassing, and oxidation-reduction reactions), perhaps the most influential control is mineral precipitation caused by evaporation and oversaturation (Jones and Deocampo, 2003). As water evaporates and the dissolved content becomes more concentrated, mineral precipitation conditions are encountered for a series of mineral phases. As minerals precipitate, the more abundant ion in solution for each precipitation reaction becomes more concentrated relative to the less abundant ion, having the effect of amplifying the existing ionic ratio (Eugster and Jones, 1979; Jones and Deocampo, 2003). In this way, brine composition is influenced by the composition of inflow and the degree of evaporation, with precipitation of the highly soluble mineral halite only occurring in the most evaporated conditions.
Given the complexity of the Zuni Salt Lake chemistry, multiple geochemical and isotopic compositions of samples were examined to estimate sources from within and outside the maar. The major ion chemistry (fig. 14) indicates that the hypersaline samples from the lake, Cinder Cone pool, Cinder Cone well, and East Shore seeps all had similar relative ion compositions and were unique in terms of the relative chloride amounts. The major ion composition in all but two Cretaceous samples was sodium bicarbonate. Variations in the cation composition likely resulted from the degree of cation exchange, and in one sample (MVRD-58), an unknown source of gypsum may have led to the high relative amount of sulfate. Samples from the two San Andres Limestone/Glorieta Sandstone aquifer wells were calcium carbonate dominated and may also have experienced different amounts of cation exchange relative to each other. Smith Spring has a major ion composition similar to the Cretaceous formation water, whereas the Spring Box major ion composition indicates mixing between the Cretaceous formation water and groundwater with a major ion composition similar to the hypersaline samples. The unique major ion composition of water in the Cinder Cone well and the East Shore seeps relative to other formation waters indicates a unique hypersaline groundwater inflow and potential mixing between it and the Cretaceous aquifers that results in the brackish water observed in the Spring Box. Relations between Br–, Na+, and Cl– plotted as combinations of isometric log ratios indicate that the surrounding groundwater at the site could not have geochemically evolved to the composition of hypersaline groundwater without dissolving halite. Furthermore, the Zuni Salt Lake and Cinder Cone pool are sufficiently evaporated to precipitate halite, and the source of the halite is primarily the hypersaline groundwater.
Unlike the other aqueous chemical compositions, the stable isotopes of water can be interpreted without the complicated interactions involving dissolved species. The stable isotopes of water clearly show a pronounced evaporative effect in the Zuni Salt Lake and the Cinder Cone pool. Because of this high enrichment, it is difficult to determine which samples, if any, were more likely to have been evaporated to yield the isotopic composition of water in the lake and Cinder Cone pool. The range of stable isotopes of water compositions in the Cretaceous samples (excluding the deep groundwater well, DKOT-17) indicate warmer, lower elevation recharge, with evaporative fractionation. The deeper San Andres Limestone/Glorieta Sandstone aquifer wells do not have an evaporative signal but are more enriched than high elevation springs in the Zuni Mountains, indicating a warmer recharge source. In contrast, the isotopic composition in the deeper Dakota Sandstone well (DKOT-17) appears to reflect an oxygen isotope shift from a cooler high mountain source, clearly indicating a different recharge location and groundwater flow path. The compositions of the two hypersaline groundwater samples are also unique and do appear to have evaporative influence. Assuming no mixing, the plausible isotopic composition that would yield the hypersaline water composition would be evaporation of the depleted local water (for example MVRD-58, Spring Box, or DKOT-35) or cooler high mountain recharge characterized by the Zuni Mountains spring water compositions (fig. 16). It has been reported that the Zuni Mountains (fig. 1) are an important recharge point for the San Andres Limestone/Glorieta Sandstone aquifer in the area and the underlying Abo and Yeso Formations (Baldwin and Anderholm, 1992). Although the isotopic composition of the hypersaline groundwater samples does not appear to be related to the San Andres Limestone/Glorieta Sandstone aquifer isotopic composition, it could be sourced from the Abo or Yeso Formations. It is unclear why these samples would then display an evaporative effect, but a few possibilities exist: first, the slow and dispersed seepage allows for evaporation to outpace deep depleted water replacement; second, the act of purging the well during sampling created a localized drawdown inducing shallow water into the borehole and mixing with the sample; and lastly, there could be mixing between the deep upflow and the shallow waters. One last consideration is that the water is locally derived and is flowing through a remnant salt bed. One line of evidence contradicting groundwater flow north of the Zuni Salt Lake from the Zuni Mountains is the estimated groundwater flow path of the San Andres Limestone/Glorieta Sandstone aquifer off the Zuni Mountains. Orr (1987) proposed that most water in the San Andres Limestone/Glorieta Sandstone aquifer moves west and northwest after flowing south from the Zuni Mountains. There are no data supporting an interpretation of groundwater flow direction in the Abo and Yeso Formations in the study area, but based on points of recharge and geologic structure, it is reasonable to assume that the groundwater flow direction in the Abo and Yeso Formations is similar to the direction of flow in the San Andres Limestone/Glorieta Sandstone aquifer.
The carbon isotopes and tritium age-tracers in the Zuni Salt Lake and the Cinder Cone pool are interpreted as dominated by processes occurring at the surface and are not reflective of inflows. Based on tritium concentrations, all of the groundwater is premodern with the exception of Smith Spring, which has a mix of modern and old water. The two San Andres Limestone/Glorieta Sandstone aquifer samples have δ13C and 14C compositions of DIC that reflect a closed system in equilibrium with carbonates, and along with the noble gas concentrations, indicate very old water (likely greater than 1,000 years). The δ13C and 14C compositions of the Mesaverde Group aquifer water, including Smith Spring and the Spring Box, indicate similar DIC sources and decay, unique to the other formation waters. The Dakota Sandstone δ13C and 14C DIC compositions indicate two vastly different ages, which is supported by the noble gas concentrations. The δ13C and 14C compositions from the two hypersaline groundwater samples collected from the Cinder Cone well and East Shore seeps are also unique and plot just below the mixing line of soil gas and carbonate compositions, indicating old water (likely greater than 1,000 years). Along with the noble gas concentrations, the δ13C and 14C compositions of the two hypersaline samples support the existence of an older groundwater source that is not represented by the aquifers sampled during this study (figs. 10 and 17).
The two hypersaline groundwater samples (Cinder Cone well and East Shore seeps) each have sulfate and strontium isotopic compositions that are similar to those in the Zuni Salt Lake and the Cinder Cone pool samples, further indicating that they represent the dominant source of dissolved solids to the lake. The San Andres Limestone/Glorieta Sandstone aquifer strontium isotopic composition is unique from that of the other formation samples, further indicating that the aquifer is not notably contributing water or salt to the lake. One important point to reiterate is that the two San Andres Limestone/Glorieta Sandstone aquifer samples are located on the west side of the Zuni Salt Lake fault and may have a different chemical composition than water in the San Andres Limestone/Glorieta Sandstone aquifer east of the fault. The groundwater samples from the Cretaceous formations generally have strontium isotopic compositions like each other and have some similarities to samples from the Zuni Salt Lake; however, the large differences in the sulfate isotopic compositions are primarily related to the interpreted difference in residence time. Despite the inferred long residence times in the San Andres Limestone/Glorieta Sandstone aquifer and the Dakota Sandstone, the low dissolved solids concentrations indicate that these aquifers have hosted, and likely still host, a substantial amount of groundwater flow that has dissolved and displaced much of the more soluble species.
Several authors report the existence of salt beds beneath the Zuni Salt Lake and in the underlying Paleozoic units (Levitte and Gambill, 1980; Maxwell and Nonini, 1977; Zillmer, 1973). The results of this investigation indicate that the unique chemical and isotopic composition of the hypersaline groundwater in the East Shore seeps and the Cinder Cone well may be the surface expression of upwelling groundwater moving through those salt beds. Although there is no direct evidence that saline groundwater exists in regional aquifers, the existence of such water is supported by qualitative evidence gathered during this investigation from drilling logs of exploratory oil and gas wells obtained from the New Mexico Oil Conservation Division (NMOCD, 2023). Two well logs from locations southwest of the lake and east of the Zuni Salt Lake fault describe freshwater at the depth equivalent to the San Andres Limestone/Glorieta Sandstone aquifer and saline water at depths equivalent to the Yeso Formation. The log for another well that was drilled into the Precambrian granite southeast of the lake notes that both freshwater and saline water were encountered, but the depths were not recorded.
Based on the data collected during this study and compiled from previous studies, the source of salts is likely the Abo and Yeso Formations and has been dissolved in groundwater upwelling through fractures associated with the intrusion that formed the maar. Although the groundwater flow through the underlying salt beds is not known, the observed contributions of the freshwater from the Cretaceous formations are critical to sustaining the Zuni Salt Lake’s unique aquatic environment. The fresh groundwater discharge likely contributes about 75 percent of the total inflows to the lake.
A new, deep groundwater well installed near the Zuni Salt Lake, on the east side of the Zuni Salt Lake fault, could provide information about the underlying Abo and Yeso Formations and the effects of faulting on the hydrology and geochemistry of the San Andres Limestone/Glorieta Sandstone aquifer. Assuming good water quality in the aquifer, the well could be completed and used later after determining the water levels and collecting a water-quality suite similar to the one used in this study from the overlying Dakota Sandstone and the underlying Abo and Yeso Formations.
Summary
The Zuni Salt Lake is located in a maar in west-central New Mexico and contains hypersaline water that has long been used by Native Americans for religious purposes and the collection of salt. Several investigations have suggested different sources for the water and salt to the lake. Springs, seeps, and ephemeral streamflow have all been observed to contribute freshwater to the lake, and brackish to hypersaline seeps have been documented along the banks of the lake.
This report summarizes the findings of a study that focused on characterizing the Zuni Salt Lake’s hydrology, its water and salinity sources, and the hydrogeologic conceptual model (for example, salt and water balance). Based on regional groundwater levels, each of the area’s aquifers have the potential to discharge groundwater to the lake, but the complex hydrogeology and sparsity of data make understanding regional groundwater flow patterns difficult. Interpretations of groundwater temperatures and noble gas compositions indicate the presence of vertical groundwater flow pathways at the maar that were likely created by the igneous intrusion that fractured the intersecting aquifers.
A detailed water budget was constructed from continuous Zuni Salt Lake storage, precipitation, and evaporation data to estimate groundwater inflow to the lake. The water balance approach resulted in an estimated 441 ±94 acre-feet per year of groundwater inflow, which composes as much as 77 percent of the total inflows to the lake. However, estimates of salt inflow to the lake based on previous production assessments indicate that the mass of salt entering the lake may be over 1,000 tons per year. Because of the high sodium and chloride concentrations measured in two hypersaline samples collected near the lake, it is likely that the majority of the dissolved solids entering the lake would be from these hypersaline sources. Even if the hypersaline seeps only contributed 1.5 percent (6.6 acre-feet per year) of the annual groundwater flow, the annual salt input would exceed 1,100 tons and account for almost 86 percent of the salt.
The geochemical and isotopic compositions measured in the Zuni Salt Lake and surrounding surface and groundwater samples support the interpretation that hypersaline water is the primary source of salts to the lake. The analyses also show unique aqueous chemistry to each of the area’s aquifers and indicate residence time is the primary cause of the variability.
References Cited
Agisoft, 2023, Agisoft metashape user manual—Professional edition, version 2.0: Agisoft, LLC, 216 p., accessed May 15, 2023, at https://www.agisoft.com/pdf/metashape-pro_2_0_en.pdf.
Akers, J.P., 1964, Geology and ground water in the central part of Apache County, Arizona: U.S. Geological Survey Water-Supply Paper 1771, 107 p., accessed February 6, 2023, at https://pubs.usgs.gov/wsp/1771/report.pdf.
Allen, R.G., Pereira, L.S., Raes, D., and Smith, M., 1998, Determination of ETo, chap. 4 of Crop evapotranspiration—Guidelines for computer crop water requirements: Food and Agriculture Organization of the United Nations Irrigation and Drainage Paper 56, accessed September 16, 2024, at https://www.fao.org/4/X0490E/x0490e00.htm#Contents.
Anderson, M.P., 2005, Heat as a ground water tracer: Groundwater, v. 43, no. 6, p. 951–968, accessed September 18, 2006, at https://doi.org/10.1111/j.1745-6584.2005.00052.x.
Anderson, O.J., 1994, Geology of the Zuni Salt Lake 71/2 minute quadrangle, Catron County, New Mexico: New Mexico Bureau of Mines and Mineral Resources Open-File Report 405, 21 p., accessed April 28, 2020, at https://geoinfo.nmt.edu/publications/openfile/downloads/400-499/405/ofr_405.pdf.
Baldwin, J.A., and Anderholm, S.K., 1992, Hydrogeology and ground-water chemistry of the San Andres-Glorieta aquifer in the Acoma Embayment and Eastern Zuni Uplift, West-Central New Mexico: U.S. Geological Survey Water-Resources Investigations Report 91–4033, 304 p., accessed January 28, 2020, at https://doi.org/10.3133/wri914033.
Baldwin, J.A., and Rankin, D.R., 1995, Hydrogeology of Cibola County, New Mexico: U.S. Geological Survey Water-Resources Investigations Report 94–4178, 102 p., accessed December 17, 2023, at https://doi.org/10.3133/wri944178.
Ballentine, C.J., Burgess, R., and Marty, B., 2002, Tracing fluid origin, transport and interaction in the crust: Reviews in Mineralogy and Geochemistry, v. 47, no. 1, p. 539–614, accessed March 15, 2023, at https://doi.org/10.2138/rmg.2002.47.13.
Bosch, K.E., Brown, J.E., Robertson, A.J., and Ball, G.P., 2025, Aerial imagery, digital elevation model, orthomosaic image, ground control points, and bathymetry surveys to identify sources of water and salts for the Zuni Salt Lake in west-central New Mexico, United States: U.S. Geological Survey data release, https://doi.org/10.5066/P16248E8.
Bradbury, J.P., 1971, Limnology of Zuni Salt Lake, New Mexico: Geological Society of America Bulletin, v. 82, no. 2, p. 379–398, accessed August 17, 2019, at https://doi.org/10.1130/0016-7606(1971)82[379:LOZSLN]2.0.CO;2.
Bredehoeft, J.D., and Papadopulos, I.S., 1965, Rates of vertical groundwater movement estimated from the Earth’s thermal profiles: Water Resources Research, v. 1, no. 2, p. 325–328, accessed January 24, 2017, at https://doi.org/10.1029/WR001i002p00325.
Bureau of Reclamation [Reclamation], 2021, Deployment of the collison floating evaporation pan on Lake Powell, UT-AZ and Cochiti Lake, NM to improve evaporation rate measurement accuracy and precision: Bureau of Reclamation, Science and Technology Program, Research and Development Office, ST-2018-8119-01, 85 p.
Bureau of Reclamation [Reclamation], 2024, Zuni Salt Lake weather monitoring data: Bureau of Reclamation database, accessed June 24, 2024, at https://data.usbr.gov/catalog/4699.
Capo, R.C., Stewart, B.W., and Chadwick, O.A., 1998, Strontium isotopes as tracers of ecosystem processes—Theory and methods: Geoderma, v. 82, nos. 1–3, p. 197–225, accessed April 8, 2024, at https://doi.org/10.1016/S0016-7061(97)00102-X.
Chapelle, F.H., and Knobel, L.L., 1985, Stable carbon isotopes of HCO3 in the Aquia aquifer, Maryland—Evidence for an isotopically heavy source of CO2: Groundwater, v. 23, no. 5, p. 592–599, accessed March 12, 2024, at https://doi.org/10.1111/j.1745-6584.1985.tb01507.x.
Collison, J.W., 2019, The Collison floating evaporation pan—Design, validation, and comparison: Albuquerque, N. Mex., University of New Mexico, Ph.D. dissertation, 114 p., accessed May 20, 2023, at https://core.ac.uk/download/pdf/232896786.pdf.
Craig, H., 1961, Isotopic variations in meteoric waters: Science, v. 133, no. 3465, p. 1702–1703, accessed December 2, 2021, at https://doi.org/10.1126/science.133.3465.1702.
Cunningham, W.L., and Schalk, C.W., comps., 2011, Groundwater technical procedures of the U.S. Geological Survey: U.S. Geological Survey Techniques and Methods book 1, chap. A1, 151 p., accessed September 6, 2019, at https://pubs.usgs.gov/tm/1a1/.
Davis, S.N., Whittemore, D.O., and Fabryka-Martin, J., 1998, Uses of chloride/bromide ratios in studies of potable water: Groundwater, v. 36, no. 2, p. 338–350, accessed March 15, 2022, at https://doi.org/10.1111/j.1745-6584.1998.tb01099.x.
Drakos, P., Lazarus, J., Riesterer, J., Hodgins, M., and Chudnoff, M., 2001, Hydrogeology of Nations Draw area—Analysis of potential impacts on Zuni Salt Lake from proposed Fence Lake Mine groundwater diversions: Zuni Pueblo, prepared by Glorieta Geoscience, Inc., Santa Fe, N. Mex., 67 p., accessed March 17, 2019, at https://www.gza.com/sites/default/files/2024-07/2001_GGI_potential_ZSL_effects_from_mine.pdf.
Drakos, P., and Riesterer, J., 2007, 2005–2006 final report—Summary of technical activities, data collection and analysis for Zuni Salt Lake protection: Zuni Pueblo, prepared by Glorieta Geoscience, Inc., Santa Fe, N. Mex., 28 p., accessed April 18, 2024, at https://www.gza.com/sites/default/files/2024-07/2007_GGI_Summary_of_Data_collection_analysis.pdf.
Drakos, P., Riesterer, J., and Bemis, K., 2013, Recharge sources and characteristics of springs on the Zuni Reservation, New Mexico, in Zeigler, K., Timmons, J.M., Timmons, S., and Semken, S., eds., Geology of the Route 66 region—Flagstaff to Grants—New Mexico, Geological Society 64th Annual Field Conference, 2013, Guidebook: Socorro, N. Mex, New Mexico Geological Society, p. 205–213, accessed January 24, 2019, at https://doi.org/10.56577/FFC-64.205.
Drakos, P., Riesterer, J., and Lazarus, J., 2006, Hydrogeologic analysis of groundwater-surface water interaction in the Zuni Salt Lake/Nations Draw area, west central New Mexico, based on geologic mapping, pumping test analyses, and borehole geophysics—Abstract Book of the 2006 Ground Water Summit: Westerville, Ohio, National Ground Water Association, p. 8.
Eastoe, C., Watts, C., Ploughe, M., and Wright, W., 2012, Future use of tritium in mapping pre‐bomb groundwater volumes: Groundwater, v. 50, no. 1, p. 87–93, accessed March 9, 2023, at https://doi.org/10.1111/j.1745-6584.2011.00806.x.
Engle, M.A., and Rowan, E.L., 2012, Interpretation of Na–Cl–Br systematics in sedimentary basin brines—Comparison of concentration, element ratio, and isometric log-ratio approaches: Mathematical Geosciences, v. 45, no. 1, p. 87–101, accessed March 7, 2019, at https://doi.org/10.1007/s11004-012-9436-z.
Eugster, H.P., and Jones, B.F., 1979, Behavior of major solutes during closed-basin brine evolution: American Journal of Science, v. 279, no. 6, p. 609–631, accessed May 11, 2023, at https://doi.org/10.2475/ajs.279.6.609.
Frus, R.J., Crossey, L.J., Dahm, C.N., Karlstrom, K.E., and Crowley, L., 2020, Influence of desert springs on habitat of endangered Zuni Bluehead Sucker (Catostomus discobolus yarrowi): Environmental & Engineering Geoscience, v. 26, no. 3, p. 313–329, accessed July 6, 2023, at https://doi.org/10.2113/EEG-2330.
Graham, D.W., 2002, Noble gas isotope geochemistry of mid-ocean ridge and ocean island basalts—Characterization of mantle source reservoirs: Reviews in Mineralogy and Geochemistry, v. 47, no. 1, p. 247–317, accessed April 2, 2023, at https://doi.org/10.2138/rmg.2002.47.8.
Han, L.F., Plummer, L.N., and Aggarwal, P., 2012, A graphical method to evaluate predominant geochemical processes occurring in groundwater systems for radiocarbon dating: Chemical Geology, v. 318–319, p. 88–112, accessed November 10, 2017, at https://doi.org/10.1016/j.chemgeo.2012.05.004.
Hargreaves, G.H., and Samani, Z.A., 1985, Reference crop evapotranspiration from temperature: Applied Engineering in Agriculture, v. 1, no. 2, p. 96–99, accessed June 1, 2023, at https://doi.org/10.13031/2013.26773.
Jones, B., and Deocampo, D., 2003, Geochemistry of saline lakes, chap. 13 of Holland, H.D., and Turekian, K.K., eds., Surface and groundwater, weathering and soils, v. 5 of Treatise on geochemistry: Amsterdam, Elsevier Science, p. 437–469, accessed January 8, 2016, at https://doi.org/10.1016/B978-0-08-095975-7.00515-5.
LaDuke, W., 2002, The salt woman and the coal mine—Lighting up Phoenix and Tucson could extinguish a Zuni deity: Sierra Club web page in Internet Archive website, accessed October 23, 2024, at https://web.archive.org/web/20050207202303/http://www.sierraclub.org/sierra/200211/winona.asp. [Appeared in November/December 2002 issue of Sierra Magazine.]
Levitte, D., and Gambill, D.T., 1980, Geothermal potential of west-central New Mexico from geochemical and thermal gradient data: Los Alamos Science Lab Technical Report, 102 p., accessed May 19, 2023, at https://doi.org/10.2172/6731672.
Lucas, L.L., and Unterweger, M.P., 2000, Comprehensive review and critical evaluation of the half-life of tritium: Journal of Research of the National Institute of Standards and Technology, v. 105, no. 4, p. 541–549, accessed September 25, 2013, at https://doi.org/10.6028/jres.105.043.
McLellan, M.W., Biewick, L.R., and Landis, E.R., 1982, Fence Lake Formation (Tertiary), west-central New Mexico: New Mexico Geology, v. 4, no. 4, p. 53–55, accessed May 24, 2024, at https://geoinfo.nmt.edu/publications/periodicals/nmg/4/n4/nmg_v4_n4_p53.pdf.
McLellan, M.W., Haschke, L., Robinson, L., Carter, M.D., and Medlin, A., 1983, Middle Turanian and younger Cretaceous rocks, northern Salt Lake Coal Field, Cibola and Catron Counties, New Mexico, in S.C. Hook, compiler, Contributions to mid-Cretaceous paleontology and stratigraphy of New Mexico-part II: Socorro, New Mexico Bureau of Mines and Mineral Resources Circular 185, p. 41–47, accessed May 24, 2024, at https://geoinfo.nmt.edu/publications/monographs/circulars/185/.
Morikawa, N., Kazahaya, K., Masuda, H., Ohwada, M., Nakama, A., Nagao, K., and Sumino, H., 2008, Relationship between geological structure and helium isotopes in deep ground-water from the Osaka Basin—Application to deep groundwater hydrology: Geochemical Journal, v. 42, no. 1, p. 61–74, accessed June 02, 2023, at https://doi.org/10.2343/geochemj.42.61.
Myers, R.G., 1992, Geohydrology and potential hydrologic effects of surface coal mining of the San Augustine coal area and adjacent areas, Catron and Cibola Counties, New Mexico: U.S. Geological Survey Water-Resources Investigations Report 92–4004, 52 p., accessed August 17, 2019, at https://doi.org/10.3133/wri924004.
National Geodetic Survey, 2015, OPUS—Online Positioning User Service: National Geodetic Survey web page, accessed October 8, 2015, at https://geodesy.noaa.gov/OPUS/.
National Water Quality Monitoring Council, 2021, Water quality portal: Washington, D.C., U.S. Geological Survey and U.S. Environmental Protection Agency database, accessed July 1, 2023, at https://doi.org/10.5066/P9QRKUVJ.
New Mexico Oil Conservation Division [NMOCD], 2023, OCD online imaging: New Mexico Oil Conservation Division web page, accessed September 24, 2023, at https://ocdimage.emnrd.nm.gov/imaging/.
Nychka, D., Furrer, R., Paige, J., and Sain, S., 2021, Package ‘fields’—Tools for spatial data: Comprehensive R Archive Network (CRAN) software release, accessed June 12, 2023, at https://cran.r-project.org/web/packages/fields/fields.pdf.
Onken, J., and Forman, S., 2017, Terminal Pleistocene to early Holocene volcanic eruptions at Zuni Salt Lake, west-central New Mexico, USA: Bulletin of Volcanology, v. 79, article 10, 17 p., accessed July 20, 2023, at https://doi.org/10.1007/s00445-016-1089-1.
Orr, B.R., 1987, Water resources of the Zuni tribal lands, McKinley and Cibola Counties, New Mexico: U.S. Geological Survey Water-Supply Paper 2227, 76 p., accessed May 25, 2020, at https://pubs.usgs.gov/publication/wsp2227.
Oxburgh, E.R., O’Nions, R.K., and Hill, R.I., 1986, Helium isotopes in sedimentary basins: Nature, v. 324, no. 6098, p. 632–635, accessed May 06, 2023, at https://doi.org/10.1038/324632a0.
Phillips, F.M., Mills, S.K., Hendrickx, J.M.H., and Hogan, J.F., 2003, Environmental tracers applied to quantifying causes of salinity in arid-region rivers—Preliminary results from the Rio Grande, southwestern USA, in Alsharhan, A.S., and Wood, W.W., eds., Water resources perspectives—Evaluation, management, and policy: Amsterdam, Elsevier Science, p. 327–334, accessed January 27, 2015, at https://doi.org/10.1016/S0167-5648(03)80029-1.
Pinti, D., Castro, M.C., López-Hernández, A., Hernández-Hernández, M., Richard, L., Hall, C., Shouakar-Stash, O., Flores-Armenta, M., and Rodríguez-Rodríguez, M., 2019, Cerro Prieto Geothermal Field (Baja California, Mexico)—A fossil system? Insights from a noble gas study: Journal of Volcanology and Geothermal Research, v. 371, p. 32–45, accessed March 28, 2024, at https://doi.org/10.1016/j.jvolgeores.2018.12.010.
Plummer, L.N., Bexfield, L.M., Anderholm, S.K., Sanford, W.E., and Busenberg, E., 2012, Geochemical characterization of ground-water flow in the Santa Fe Group aquifer system, middle Rio Grande Basin, New Mexico: U.S. Geological Survey Water-Resources Investigations Report 03–4131, 395 p., accessed June 15, 2014, at https://pubs.usgs.gov/wri/wri034131/.
Plummer, L.N., and Friedman, L.C., 1999, Tracing and dating young ground water: U.S. Geological Survey Fact Sheet 134–99, 4 p., accessed May 14, 2017, at https://pubs.usgs.gov/fs/FS-134-99/.
Rauzi, S.L., 2009, Implications of live oil shows in an eastern Arizona geothermal test (1 Alpine-Federal): Arizona Geological Survey Open-File Report 94–1, 17 p., accessed November 19, 2021, at http://hdl.handle.net/10150/630795.
R Core Team, 2023, R—A language and environment for statistical computing: Vienna, R Foundation for Statistical Computing, accessed July 5, 2023, at https://www.R-project.org.
Read, C.B., and Wanek, A.A., 1967, Excerpts from—Stratigraphy of outcropping Permian rocks in parts of northeastern Arizona and adjacent areas, in Trauger, F.D., ed., Defiance-Zuni-Mt. Taylor Region (Arizona and New Mexico)—New Mexico Geological Society 18th Annual Field Conference, 1967, Guidebook: Socorro, N. Mex., New Mexico Geological Society, p. 122–124, accessed October 12, 2023, at https://doi.org/10.1016/B978-0-12-394626-3.00006-5.
Rich, V.I., and Maier, R.M., 2015, Aquatic environments, chap. 6 of Pepper, I.L., Gerba, C.P., and Gentry, T.J., eds., Environmental microbiology: San Diego, Academic Press, p. 111–138, accessed September 24, 2024, at https://doi.org/10.1016/B978-0-12-394626-3.00006-5.
Risser, D.W., and Lyford, F.P., 1983, Water resources on the pueblo of Laguna, West-Central New Mexico: U.S. Geological Survey Water-Resources Investigations Report 83–4038, 89 p., accessed November 8, 2023, at https://doi.org/10.3133/wri834038.
Smith, D.B., Otlet, R.L., Downing, R.A., Monkhouse, R.A., and Pearson, F.J., 1975, Stable carbon and oxygen isotope ratios of groundwater from the Chalk and Lincolnshire Limestone: Nature, v. 257, no. 5529, p. 783–784, accessed April 23, 2023, at https://doi.org/10.1038/257783a0.
Stannard, D.I., 1988, Use of a hemispherical chamber for measurement of evapotranspiration: U.S. Geological Survey Open-File Report 88–452, 18 p., accessed November 11, 2023, at https://doi.org/10.3133/ofr88452.
Stanton, J.S., Anning, D.W., Brown, C.J., Moore, R.B., McGuire, V.L., Qi, S.L., Harris, A.C., Dennehy, K.F., McMahon, P.B., Degnan, J.R., and Böhlke, J.K., 2017, Brackish groundwater in the United States: U.S. Geological Survey Professional Paper 1833, 185 p., accessed September 24, 2024, at https://doi.org/10.3133/pp1833.
Stone, W.J., Lyford, F.P., Frenzel, P.F., Mizell, N.H., and Padgett, E.T., 1983, Hydrogeology and water resources of San Juan Basin, New Mexico: New Mexico Bureau of Mines and Mineral Resources Hydrologic Report 6, 70 p., accessed January 4, 2023, at https://doi.org/10.58799/HR-6.
Szynkiewicz, A., Talon Newton, B., Timmons, S.S., and Borrok, D.M., 2012, The sources and budget for dissolved sulfate in a fractured carbonate aquifer, southern Sacramento Mountains, New Mexico, USA: Applied Geochemistry, v. 27, no. 8, p. 1451–1462, accessed June 28, 2023, at https://doi.org/10.1016/j.apgeochem.2012.04.011.
Taylor, B.E., Wheeler, M.C., and Nordstrom, D.K., 1984, Stable isotope geochemistry of acid mine drainage—Experimental oxidation of pyrite: Geochimica et Cosmochimica Acta, v. 48, no. 12, p. 2669–2678, accessed June 28, 2023, at https://doi.org/10.1016/0016-7037(84)90315-6.
Truini, M., and Longsworth, S.A., 2003, Hydrogeology of the D aquifer and movement and ages of ground water determined from geochemical and isotopic analyses, Black Mesa area, northeastern Arizona: U.S. Geological Survey Water-Resources Investigations Report 03–4189, 38 p., accessed April 3, 2022, at https://doi.org/10.3133/wri034189.
University of Wisconsin, 2024, National Trends Network: National Atmospheric Deposition Program database, accessed March 12, 2024, at https://nadp.slh.wisc.edu.
U.S. Geological Survey [USGS], [variously dated], National field manual for the collection of water-quality data (version 7): U.S. Geological Survey Techniques and Methods, book 9, chaps. A1–A9. [Also available at https://water.usgs.gov/owq/FieldManual/.]
U.S. Geological Survey [USGS], 2023, USGS water data for the Nation: U.S. Geological Survey National Water Information System database, accessed October 17, 2023, at https://doi.org/10.5066/F7P55KJN.
Western Regional Climate Center [WRCC], 2024, Climate summary for Quemado, New Mexico (297180): Western Regional Climate Center database, accessed February 12, 2024, at https://wrcc.dri.edu/cgi-bin/cliMAIN.pl?nm7180.
Willard, M.E., and Weber, R.H., 1958, Reconnaissance geologic map of Canon Largo thirty-minute quadrangle: Socorro, N. Mex., New Mexico Bureau of Mines and Mineral Resources Geologic Map 6, scale 1:126,720, accessed January 13, 2024, at https://geoinfo.nmt.edu/publications/maps/geologic/gm/downloads/6/GM-6_map.pdf.
Zillmer, R.O., 1973, A feasibility and market study of Zuni Salt Lake, Catron County, New Mexico, in U.S. Congress, Senate Committee on Interior and Insular Affairs, Hearing before the Subcommittee on Indian Affairs *** to purchase and hold certain lands for the Zuni Indian Tribe of New Mexico ***: U.S. Congress, 94th, 2d session, September 10, 1976, p. 75–86, accessed August 8, 2023, at https://www.google.com/books/edition/Zuni_Land_Claims/qqfQAAAAMAAJ?hl=en&gbpv=1&dq=zillmer+a+feasibility+and+market+study+of+zuni+salt+lake&pg=PA75&pr intsec=frontcover.
Conversion Factors
U.S. customary units to International System of Units
Temperature in degrees Celsius (°C) may be converted to degrees Fahrenheit (°F) as follows:
°F = (1.8 × °C) + 32.
Temperature in degrees Fahrenheit (°F) may be converted to degrees Celsius (°C) as follows:
°C = (°F – 32) / 1.8.
Datums
Vertical coordinate information is referenced to the North American Vertical Datum of 1988 (NAVD 88).
Horizontal coordinate information is referenced to the North American Datum of 1983 (NAD 83).
Elevation, as used in this report, refers to distance above the vertical datum.
Supplemental Information
Specific conductance is in microsiemens per centimeter at 25 degrees Celsius (µS/cm at 25 °C).
Concentrations of chemical constituents in water are in milligrams per liter (mg/L).
Abbreviations
AEW
air equilibrated water
BS
base station
CFEP
Collison Floating Evaporation Pan
CV
cross validation
DEM
digital elevation model
DIC
dissolved inorganic carbon
GMWL
Global Meteoric Water Line
ka
kilo-annum
LOOCV
leave-one-out cross validation
NWIS
National Water Information System
RMSE
root mean square error
RPD
relative percent difference
RTK
real-time kinematic
SfM
structure from motion
UAS
uncrewed aerial system
USGS
U.S. Geological Survey
WRCC
Western Regional Climate Center
For more information about this publication, contact
Director, New Mexico Water Science Center
U.S. Geological Survey
6700 Edith Blvd. NE
Albuquerque, NM 87113
For additional information, visit
https://www.usgs.gov/centers/nm-water
Publishing support provided by
Lafayette Publishing Service Center
Disclaimers
Any use of trade, firm, or product names is for descriptive purposes only and does not imply endorsement by the U.S. Government.
Although this information product, for the most part, is in the public domain, it also may contain copyrighted materials as noted in the text. Permission to reproduce copyrighted items must be secured from the copyright owner.
Suggested Citation
Robertson, A.J., Pepin, J.D., Gray, E.L., Collison, J.W., Brown, J., Ritchie, A., and Ball, G., 2025, Sources of water and salts for the Zuni Salt Lake in west-central New Mexico: U.S. Geological Survey Scientific Investigations Report 2025–5057, 40 p., https://doi.org/10.3133/sir20255057.
ISSN: 2328-0328 (online)
Study Area
| Publication type | Report |
|---|---|
| Publication Subtype | USGS Numbered Series |
| Title | Sources of water and salts for the Zuni Salt Lake in west-central New Mexico |
| Series title | Scientific Investigations Report |
| Series number | 2025-5057 |
| DOI | 10.3133/sir20255057 |
| Publication Date | September 17, 2025 |
| Year Published | 2025 |
| Language | English |
| Publisher | U.S. Geological Survey |
| Publisher location | Reston, VA |
| Contributing office(s) | New Mexico Water Science Center |
| Description | Report: viii, 40 p.; Data Release; 2 Datasets |
| Country | United States |
| State | New Mexico |
| Other Geospatial | Zuni Salt Lake |
| Online Only (Y/N) | Y |