

Statistical Streamflow Comparison of Current and Historical 30-Year Periods for Selected Streams in New Jersey
Links
- Document: Report (7.45 MB pdf) , HTML , XML
- Data Releases:
- USGS Data Release - Statistical streamflow comparison of current (1990-2019) and historical (1950-79) 30-year periods for selected streams in New Jersey
- USGS Data Release - Streamflow characteristics and trends at continuous-record and partial-record streamflow-gaging stations in New Jersey, water years 1903-2017
- NGMDB Index Page: National Geologic Map Database Index Page
- Download citation as: RIS | Dublin Core
Acknowledgments
The authors thank Lucas Pick for his contribution to streamgage selection and the initial coding for statistical analyses, and Jon Janowicz for his thoughtful questions and ongoing feedback, which helped shape the discussion in this paper. We also appreciate the continued support and input from the New Jersey Department of Environmental Protection throughout the project. Finally, we thank our reviewers—Tony Gotvald, Liam Kenefic, and Brennon Peterson—for their valuable time and insights. We confirmed that all reviewers are comfortable being acknowledged by name.
Abstract
As the population of New Jersey increases, supplying adequate drinking water to meet demand remains a high priority. To better understand potential streamflow trends over time, the U.S. Geological Survey completed a study comparing low flows at continuous- and partial-record streamgages in New Jersey between a historical period (1950–79) and a current period (1990–2019). Fourteen statistics (one median for each of the twelve monthly minimum 1-day flows, minimum 7-day average streamflow with a 10-year recurrence interval, and median of the daily mean flows for the month of September) were calculated to evaluate how streamflow conditions may differ between the two time periods. Percent change was also calculated to better understand the magnitude of difference between the periods at individual streamgages. A Paired Wilcoxon Signed-Rank Test was implemented to test for a change in distribution between the two time periods for each statistic of interest. Results indicated that the median of the minimum 1-day flows for the months of January, February, June, September, and December and the median of the daily mean flows for the month of September had a statistically significant difference in distribution between the time periods for continuous-record streamgages. None of the statistics had a statistically significant difference in distribution for the partial-record streamgages. The largest percent changes between time periods occurred in the northern part of the state, above the Fall Line. Precipitation, land cover, and water use changes were assessed to contribute to the understanding of these differences between time periods. The median of the minimum 1-day flows for the months of January and December generally increased across the state, whereas the median of the minimum 1-day flows for the months of May and September generally decreased throughout the state.
Introduction
Supplying adequate drinking water to meet demand remains a high priority for the New Jersey Department of Environmental Protection (NJDEP; NJDEP, 2017). To better understand how streamflow conditions may have changed since 1950, two 30-year periods were selected to compute streamflow statistics. To evaluate potential changes in streamflow conditions, statistics were compared between a “historical” period defined as calendar years from 1950 to 1979 and a “current” period defined as calendar years from 1990 to 2019. Thirty continuous-record U.S. Geological Survey (USGS) streamgages and 45 partial-record streamgages were selected for this analysis. Fourteen statistics were selected and computed using the approved daily streamflow records from the selected streamgages for each period. Supplemental datasets for land use, precipitation, and water use were analyzed to identify possible connections between these factors and any differences identified in the computed streamflow statistics. Data from this study are available in the corresponding data release (Sullivan and Williams, 2025).
Purpose and Scope
This study investigates and quantifies considerable changes in low-flow conditions at continuous- and partial-record streamgages in New Jersey between a historical period (1950–79) and a current period (1990–2019). The selected historical period captures landscape alterations that were part of the post-World War II expansion into the suburbs (Federal Highway Administration, 2024), the major drought of the mid-1960s, and is balanced by including the period of streamflow, relative to low flows and drought, of the 1970s (Delaware River Basin Commission, 2024a). The current period was selected to include the most recent approved data that were available at the beginning of the study and to maintain a consistent 30-year period matching the historical period. The study includes streamgages with minimal anthropogenic alterations, as well as those that monitor regulated and impacted streamflow, to better understand changes in streamflow conditions independent of the potential source or influence on those changes. Selected statistics used to investigate change include the median of minimum 1-day flows for each month (monthly 1-day low-flow median), the minimum annual 7-day low flow with a 10-percent annual nonexceedance probability (7Q10), and the median of the daily mean flows for September (September median). Percent change in the selected low-flow statistics between the historical and current periods was calculated and presented statewide as a surrogate for describing general conditions throughout the state. Overarching inter-streamgage comparisons were also made using normalized values derived from the accompanying data release (Sullivan and Williams, 2025). These streamgage locations could be utilized by water resource managers to update water availability determined in earlier studies (Domber and others, 2013). For this reason, potential disturbances to flow—such as changes in withdrawals and discharges, land use and impervious surface, and precipitation—within each streamgage basin have been assembled for comparison to the identified changes in streamflow.
Comparing statistics from the current and historical periods helps water resource managers understand how streamflow conditions have changed over time. This understanding can better inform the development of guidance documents, such as the New Jersey Water Supply Plan (NJDEP, 2017), which has typically relied on statistics based on recent period records. The outcomes of this project can also be used to support NJDEP and other agencies in water supply planning, waste load allocation decisions, and watershed plan evaluations. Additionally, the results provide insight into the influence of anthropogenic factors on streamflow at a regional scale, with the potential to be applied at broader geographic scales.
Related Studies
The New Jersey Water Science Center published various reports that provide statistical assessments of streamflow records from previous years. This report serves as an extension to “Streamflow Characteristics and Trends in New Jersey, Water Years 1903–2017” by McHugh and others (2024). The McHugh and others (2024) streamflow characteristics study computes updated high and low streamflow statistics for 97 continuous-record streamgages and low flows for 719 partial-record streamgages throughout New Jersey. Calculated statistics include maximum, minimum, and means for period-of-record, flow durations, nonexceedance high- and low-flow frequency statistics, base flow, runoff, peak-to-mean flow ratios, and September median (Williams and others, 2024). McHugh and others (2024) found a general increase in high and low flows throughout New Jersey from 1903 to 2017, although this increase is not uniform throughout the state. This 2024 study also highlights the localized effects of water use and the potential of different climate variables.
Before the 2024 streamflow characteristics report, a similar report was published by the USGS in cooperation with the NJDEP for the State of New Jersey examining a period from 1897 to 2003 (Watson and others, 2005). That study provided updated streamflow statistics for scientists and managers to use in allocating surface water withdrawals, investigating total maximum daily loads, and completing other surface water-related research.
The NJDEP published a technical memorandum in 2013 titled “Using the Stream Low Flow Margin Method to Assess Water Availability in New Jersey’s Water-Table-Aquifer Systems” by Domber and others (2013). This technical memorandum detailed the method used by the NJDEP as a screening tool for understanding available water within individual watersheds using streamflow statistics and incorporating withdrawals and discharges. Statistics calculated in this study can be used to estimate the low-flow margin (LFM) method described in the technical memorandum to better understand how the LFM may have varied at continuous-record streamgages between the historical and current periods as defined in this study.
Study Area and Streamgages
New Jersey consists of four physiographic provinces—Valley and Ridge, New England, Piedmont, and Coastal Plain. The northern part of the state includes Valley and Ridge, New England, and Piedmont and is located north of the Fall Line (fig. 1) (NJDEP, 2002). The Fall Line is the geological boundary separating the higher altitudes of the Southwestern Appalachians, Valley and Ridge, Blue Ridge, and Piedmont ecoregions from the low-lying Southeastern Plains, Middle Atlantic Coastal Plain, and Southern Coastal Plain ecoregions (New Jersey Geological Survey, 2003; U.S. Environmental Protection Agency, 2013). The southern part of the state contains the Coastal Plain and is located south of the Fall Line (fig. 1). These provinces have varying geology and topography influencing streamflow (Tetzlaff and others, 2009). More streamgages were selected north of the Fall Line than in the southern part of the state, due to the minimum data requirements selected for this study.
Continuous- and partial-record streamgage basins across New Jersey were evaluated. In this study, continuous-record streamgages are defined as those with a complete 30-year record of daily streamflow available during both the historical and current periods. This study also defines partial-record streamgages as those that have lapses in streamflow measurements, but have at least 10 discrete measurements of flow or less than 20 years of record in each period. These streamgages were supplemented by related index streamgages, detailed in the “Methods” section. This list of candidate streamgages was initially identified during the development of McHugh and others (2024) and Williams and others (2024), and was reduced to 30 continuous-record streamgages and 45 partial-record streamgages (fig. 1; table 1) based on the data availability requirement (Sullivan and Williams, 2025). Continuous-record streamgages where the streamflow can be altered by storage and release operations of a controlled reservoir were designated as “Regulated” in table 1. Continuous-record streamgages where the recorded streamflow could be affected by excess water-supply withdrawals or considerable effluent discharges were designated as “Impacted” in table 1. For this study, the primary reason for the distinction between regulated and impacted streamgages and those with minimal anthropogenic alterations is to identify streamflow that can potentially be altered to artificially increase or decrease the flow that would naturally occur. Streamgages with flow regulated by reservoir operations may have peaks attenuated by the presence and operation of the reservoir and, conversely, have base flows altered to remain above a minimum release level, creating a statistical dataset that may not be representative of natural conditions. Streamgages affected by water supply withdrawals may have low- and base-flow values reduced below natural conditions, which could result in low-flow stream statistics that are altered differently than those regulated by reservoir operations and are also not representative of the natural conditions.. Reservoir owners, or persons having control of the reservoir, in the State of New Jersey are responsible for submitting a flood action plan to NJDEP. The final state-approved plan shall detail among other things a plan to set the water level in the reservoir to ensure the availability of adequate water supply for the area served by the reservoir and protect against flooding (New Jersey Government, 2022; State of New Jersey, 2022). These reservoir operations may alter higher flow conditions based on targeted water levels and the degree of available storage before spilling, except for constant conservation releases that primarily affect available streamflow in the reach downstream of the reservoir during lower flow conditions (NJDEP, 2011; Delaware River Basin Commission, 2024b). Identifying locations with these alterations may help provide a better understanding of why some streamflow statistics may differ at these streamgages when compared to less altered streams.
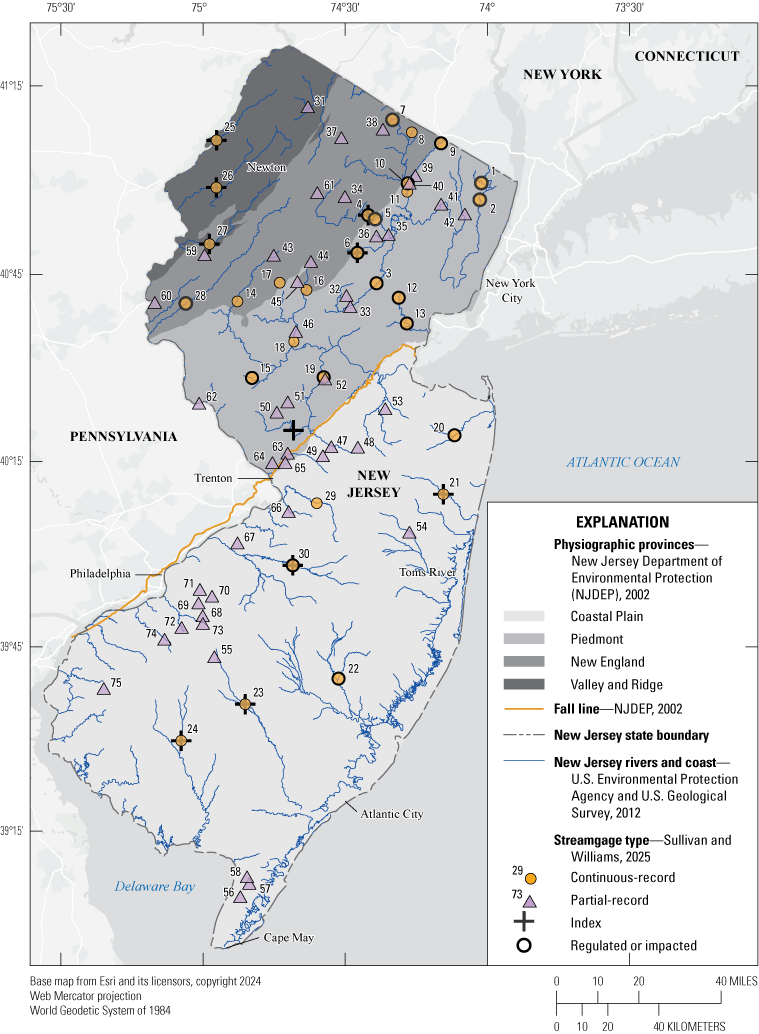
Map showing the 30 continuous-record streamgages and 45 partial-record streamgages used in the study throughout New Jersey, as well as physiographic provinces, major rivers and coast, and the Fall Line.
Table 1
List of New Jersey U.S. Geological Survey (USGS) streamgages used in this study with the streamgage identifier associated with the map in figure 1, streamgage number, streamgage name, and the type of streamgage.
1. List of New Jersey U.S. Geological Survey (USGS) streamgages used in this study with the streamgage identifier associated with the map in figure 1, streamgage number, streamgage name, and the type of streamgage
[Data are from Sullivan and Williams (2025). No designation indicates that the streamgage is neither regulated nor impacted. N.J., New Jersey]
| Streamgage identifier | Streamgage number | Streamgage name |
|---|---|---|
| 1 | 01377500a | Pascack Brook at Westwood, N.J. |
| 2 | 01378500a | Hackensack River at New Milford, N.J. |
| 3 | 01379500b | Passaic River near Chatham, N.J. |
| 4 | 01380450b, c | Rockaway River at Main Street at Boonton, N.J. |
| 5 | 01381000a | Rockaway River below Reservoir at Boonton, N.J. |
| 6 | 01381500b, c | Whippany River at Morristown, N.J. |
| 7 | 01383500a | Wanaque River at Awosting, N.J. |
| 8 | 01384500 | Ringwood Creek near Wanaque, N.J. |
| 9 | 01387500b | Ramapo River near Mahwah, N.J. |
| 10 | 01388000b | Ramapo River at Pompton Lakes, N.J. |
| 11 | 01388500 | Pompton River at Pompton Plains, N.J. |
| 12 | 01394500b | Rahway River near Springfield, N.J. |
| 13 | 01395000b | Rahway River at Rahway, N.J. |
| 14 | 01396500 | South Branch Raritan River near High Bridge, N.J. |
| 15 | 01398000b | Neshanic River at Reaville, N.J. |
| 16 | 01398500 | North Branch Raritan River near Far Hills, N.J. |
| 17 | 01399500 | Lamington (Black) River near Pottersville, N.J. |
| 18 | 01400000 | North Branch Raritan River near Raritan, N.J. |
| 19 | 01402000b | Millstone River at Blackwells Mills, N.J. |
| 20 | 01407500b | Swimming River near Red Bank, N.J. |
| 21 | 01408000c | Manasquan River at Squankum, N.J. |
| 22 | 01410000b | Oswego River at Harrisville, N.J. |
| 23 | 01411000c | Great Egg Harbor River at Folsom, N.J. |
| 24 | 01411500c | Maurice River at Norma, N.J. |
| 25 | 01440000c | Flat Brook near Flatbrookville, N.J. |
| 26 | 01443500c | Paulins Kill at Blairstown, N.J. |
| 27 | 01445500c | Pequest River at Pequest, N.J. |
| 28 | 01457000a | Musconetcong River near Bloomsbury, N.J. |
| 29 | 01464500 | Crosswicks Creek at Extonville, N.J. |
| 30 | 01467000b, c | North Branch Rancocas Creek at Pemberton, N.J. |
| 31 | 01367850 | West Branch Papakating Creek at McCoys Corner, N.J. |
| 32 | 01378900 | Black Brook near Meyersville, N.J. |
| 33 | 01379300 | Passaic River at Stirling, N.J. |
| 34 | 01380050 | Hibernia Brook at outlet of Lake Telemark, N.J. |
| 35 | 01381200 | Rockaway River at Pine Brook, N.J. |
| 36 | 01381700 | Troy Brook at Troy Hills, N.J. |
| 37 | 01382050 | Pequannock River near Stockholm, N.J. |
| 38 | 01382890 | Belcher Creek at West Milford, N.J. |
| 39 | 01387930 | Ramapo River tributary 5 at Oakland, N.J. |
| 40 | 01387980 | Haycock Brook at Pompton Lakes, N.J. |
| 41 | 01389850 | Goffle Brook at Hawthorne, N.J. |
| 42 | 01391485 | Sprout Brook at Rochelle Park, N.J. |
| 43 | 01396220 | Stony Brook at Naughright, N.J. |
| 44 | 01398220 | India Brook near Mendham, N.J. |
| 45 | 01398700 | Peapack Brook at Gladstone, N.J. |
| 46 | 01399830 | North Branch Raritan River at North Branch, N.J. |
| 47 | 01400600 | Millstone River at Locust Corner, N.J. |
| 48 | 01400670 | Cranbury Brook at Old Church, N.J. |
| 49 | 01400750 | Bear Brook near Hickory Corner, N.J. |
| 50 | 01401520 | Beden Brook near Hopewell, N.J. |
| 51 | 01401590 | Rock Brook at Blawenburg, N.J. |
| 52 | 01401900 | Six Mile Run at Blackwells Mills, N.J. |
| 53 | 01405470 | Iresick Brook at East Spotswood, N.J. |
| 54 | 01408300 | Toms River at Whitesville, N.J. |
| 55 | 01410787 | Great Egg Harbor River tributary at Sicklerville, N.J. |
| 56 | 01411408 | Dias Creek near Cape May Court House, N.J. |
| 57 | 01411410 | Bidwell Creek tributary near Cape May Court House, N.J. |
| 58 | 01411418 | Goshen Creek at Goshen, N.J. |
| 59 | 01445490 | Furnace Brook at Oxford, N.J. |
| 60 | 01455100 | Lopatcong Creek at Phillipsburg, N.J. |
| 61 | 01455370 | Weldon Brook at Hurdtown, N.J. |
| 62 | 01460900 | Lockatong Creek near Raven Rock, N.J. |
| 63 | 01463670 | Shipetaukin Creek at Bakersville, N.J. |
| 64 | 01463790 | West Branch Shabakunk Creek near Ewingville, N.J. |
| 65 | 01463860 | Miry Run at Mercerville, N.J. |
| 66 | 01464530 | Blacks Creek at Mansfield Square, N.J. |
| 67 | 01467020 | Mill Creek at Willingboro, N.J. |
| 68 | 01467130 | Cooper River at Kirkwood, N.J. |
| 69 | 01467140 | Cooper River at Lawnside, N.J. |
| 70 | 01467160 | North Branch Cooper River near Marlton, N.J. |
| 71 | 01467180 | North Branch Cooper River at Ellisburg, N.J. |
| 72 | 01467330 | South Branch Big Timber Creek at Blackwood, N.J. |
| 73 | 01467350 | North Branch Big Timber Creek at Laurel Springs, N.J. |
| 74 | 01475020 | Mantua Creek at Sewell, N.J. |
| 75 | 01482510 | Nichomus Run near Woodstown, N.J. |
Denotes continuous-record streamgages that are altered by storage and release operations of a controlled reservoir, designated as “Regulated.”
Denotes continuous-record streamgages that are affected by excess water supply withdrawals or effluent discharges, designated as “Impacted.”
Denotes streamgages utilized as index streamgages for this study.
Methods for Selecting Streamgages and Streamflow Statistics
Although a variety of statistics exist to help describe low-flow conditions, this study narrowed the application and analysis to 14 specific statistics applied to both continuous- and partial-record streamgages. The following sections describe the streamgage selection process and how the statistics were applied at continuous-record streamgages, and the transfer and application process for partial-record streamgages.
Selecting Streamflow Statistics
Fourteen statistics were chosen to evaluate how streamflow conditions may differ between defined historical and current time periods for both continuous- and partial-record streamgages. The first twelve statistics are the monthly 1-day low-flow median, which represents the median of minimum 1-day flows for each month. The second statistic is the September median, which represents the median of the daily mean flows for September. Lastly, the 7Q10 was calculated using the annual minimum 7-day average flow and fitted to a log-Pearson Type III distribution curve to determine the 10-year recurrence interval (Riggs, 1972). The September median and the 7Q10 statistics are of extra value because the New Jersey Geological and Water Survey Technical Memorandum 13–3 (Domber and others, 2013) uses LFM, defined as the difference between the 7Q10 low flow and the September median flow, to determine water availability in New Jersey. The LFM is defined in Technical Memorandum 13–3 in part using the September median flow because it is typically the lowest of the monthly flows for New Jersey (Domber and others, 2013). The LFM is a defined buffer intended to allow withdrawals while flows are in an established range to reduce the chances of creating unacceptable ecological effects. If a portion of the available flow was withdrawn, it was assumed ecological effects would be minimized.
Computing updated statistics for this group of streamgages for both historical and current periods provides insight into how conditions have potentially changed. Statistics computed at streamgages not identified as “Regulated” or “Impacted” provide information about current flow conditions and how those conditions may have statistically changed over time based primarily on climate variability, land use changes, and the cumulative effects of smaller withdrawal and discharge patterns in both surface water and groundwater. Along streams where the effects of municipal water withdrawals are known, evaluating the changes in updated statistics and reviewing the actual frequency curves can help water managers better understand the in-stream changes occurring. These changes may be a result of water use patterns and possibly a combination of climate and other factors affecting the stream. Thus, the identification of streamgages with known regulation or impacted flows provides data for understanFiguding the alterations. An example of the annual minimum 7-day average flows fitted to log-Pearson Type III distribution curves (7Q10) for the historical and current periods is presented in figure 2. This figure illustrates how changes in flow patterns can be reflected in distinctly different frequency curve shapes and indicates that conditions are different between these analysis periods.
After updated statistics were computed, they were assessed for normality. A nonparametric approach was selected because the two populations of interest are not normally distributed. The statistics were evaluated for change in distribution using a Paired Wilcoxon Signed-Rank Test. The Paired Wilcoxon Signed-Rank Test is a nonparametric statistical test that compares two paired groups (Helsel and others, 2020). The null hypothesis (probability [p-value] greater than 0.05) for this test assumes that the two populations have the same distribution with the same median. If the null hypothesis is rejected, it indicates that there is sufficient evidence to suggest that the medians and (or) distributions between the two populations differ. The annual minimum 7-day average flow and September median for continuous-record streamgages were also evaluated for trends using the Mann-Kendall (MK) Trend Test, separately, for each period. The MK Trend Test assesses the data to determine if there is a statistical monotonic trend upwards or downwards, that is, if the values are consistently increasing or decreasing over time (Helsel and others, 2020).
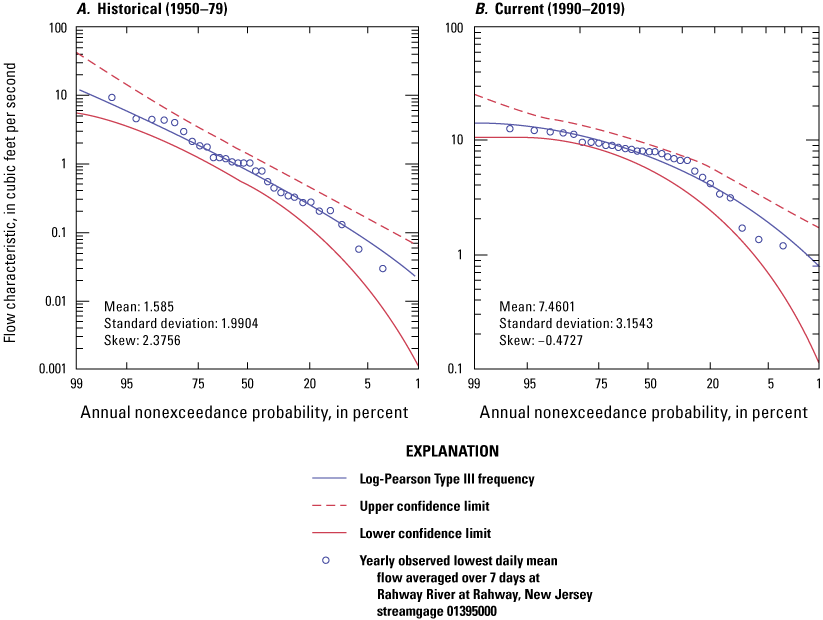
Plots showing historical and current low-flow frequency curve for selected U.S. Geological Survey streamgage 01395000 Rahway River at Rahway, New Jersey.
Continuous-Record Streamgages
Streamgages were required to have a complete streamflow record in each time period to be used in this analysis. A total of 30 continuous-record streamgages operated by the USGS New Jersey Water Science Center fit this criterion (fig. 1). Twenty-three of these streamgages are in the northern half of New Jersey, above the Fall Line, with varying Valley and Ridge, New England, and Piedmont geology (fig. 1). Only seven streamgages are located within the Coastal Plain province in the southern part of the state. This imbalance in selected streamgages was a direct result of applying the selection criteria. The 7Q10 statistical analysis was performed using approved daily streamflow data and the USGS software Surface Water Toolbox (Kiang and others, 2018). The remaining two statistics of interest, the monthly 1-day low-flow median, and the September median, were calculated. Then, the Paired Wilcoxon Signed-Rank Test was used to identify possible changes in the distribution between the two time periods for each of the fourteen statistics of interest. Percent change was calculated to understand the relative difference at each streamgage for each statistic between the historical and current time periods. Lastly, the MK Trend Test was performed on the annual minimum 7-day average flow and September median for each streamgage for both the historical and current periods. All analyses subsequent to the use of Surface Water Toolbox were performed using the R scripting language (R Core Team, 2022, R version 4.1.1).
Partial-Record Streamgages
The study limited the use of partial-record streamgages to those with at least 10 discrete measurements in both the historical and current periods, or 20 years or less of record. A total of 45 streamgages fit this criterion (fig. 1, table 1). Maintenance of Variance Extension, Type 1 (MOVE.1) or censored MOVE.1 regressions were implemented to calculate the fourteen statistics of interest (Hirsch, 1982). Maintenance of Variance Extension, Type 1 regression is widely used in the hydrologic community to extend historical low flows and low-flow statistics from continuous-record streamgaging stations to streamgaging stations that only have access to a partial record of flows. It establishes a correlation between base-flow measurements at partial-record streamgaging stations and daily mean streamflows measured at index streamgages that exhibit similar streamflow characteristics. Censored MOVE.1 regression was employed when there were many zero-valued flows at a partial-record streamgage. This approach was implemented to avoid low bias in estimating partial-record flows. The regressions were executed using the R-script documented in “Implementation of MOVE.1, censored MOVE.1, and piecewise MOVE.1 low-flow regressions with applications at partial-record streamgaging stations in New Jersey” by Colarullo and others (2018). Colarullo and others (2018) document details on the script, including base-flow screening, weighting scheme, and associated methodologies.
The selection of index streamgages in the MOVE.1 program directly affects the estimated flow statistics at partial-record streamgages. Incorporation of regression error and multiple index streamgages is crucial (Colarullo and others, 2018); however, additional factors such as knowledge of local hydrology and index streamgage conditions can also influence the streamgage selection process, extending beyond the criteria of little or no known regulation. Other criteria considered in the index streamgage selection process include (McHugh and others, 2024):
-
● Length of record greater than 25 years
-
● Identified trend for one or fewer annual low-flow time series
-
● Passing the Kolmogorov-Smirnov test and visual test for fit of log-Pearson Type III distribution curve
In order for the MOVE.1 regression to be valid, there must be at least nine measurements used in the regression for each index streamgage, with the average number of measurements used in the weighted regression being at least 9.5. For this study, expert knowledge of partial-record streamgages and index streamgages allowed for detailed verification of the selected index streamgages for the MOVE.1 regression. Based on the aforementioned criteria for selecting index streamgages, the actual number of available streamgages for this study was limited. Ten of the 11 index streamgages are also continuous-record streamgages analyzed in this study (fig. 1, table 1); Stony Brook at Princeton, N.J., (01401000) is not a continuous-record streamgage in this study. Because of a lack of available index streamgages in the unglaciated Piedmont region, the unglaciated New England and the unglaciated Piedmont provinces were combined as one grouping consisting of unglaciated index streamgages (Stanford and others, 1996). This left two more groupings of streamgages for running the MOVE.1 program: the glaciated region and the Coastal Plain (table 2).
The glaciated streamgages are located the furthest north and included the glaciated Valley and Ridge, New England, and Piedmont provinces (fig. 1). The Rockaway River at Main Street at Boonton, N.J., streamgage 01380450 was chosen to represent the glaciated New England province. The Flat Brook near Flatbrookville, N.J., streamgage 01440000 and the Paulins Kill at Blairstown, N.J., streamgage 01443500 represent the glaciated Valley and Ridge province. The Pequest River at Pequest, N.J., streamgage 01445500 represents both the glaciated Valley and Ridge and New England provinces, being located on a divide between these two provinces. Any partial-record streamgages located in the northern glaciated regions of the state were run through MOVE.1 using these index streamgages.
Unglaciated index streamgages incorporated both unglaciated New England and unglaciated Piedmont provinces and are located somewhat centrally in the state or generally south of the most northern glaciated region. The Whippany River at Morristown, N.J., streamgage 01381500 represents the unglaciated New England province. The Stony Brook at Princeton, N.J., streamgage 01401000 represents the unglaciated Piedmont, and the Pequest River at Pequest, N.J., streamgage 01445500 was also used to represent the region between the unglaciated New England and Valley and Ridge provinces. Partial-record streamgages located either centrally or in unglaciated northern regions were run using MOVE.1 through these three index streamgages.
The final grouping of index streamgages is the Coastal Plain, which represent the southern half of the state and both the Inner and Outer Coastal Plain. The Manasquan River at Squankum, N.J., streamgage 01408000, the Great Egg Harbor River at Folsom, N.J., streamgage 01411000, the Maurice River at Norma, N.J., streamgage 01411500, and the North Branch Rancocas Creek at Pemberton N.J., streamgage 01467000 were the index streamgages used to run MOVE.1 for any partial-record streamgages located in these southern regions of the state.
Table 2.
Index streamgages for partial-record analysis.[VR, Valley and Ridge; NE, New England; P, Piedmont; —, no data]
| Glaciated—VR,NE,P | Unglaciated—VR, NE, P | Coastal Plain |
|---|---|---|
| 01380450 | 01381500 | 01408000 |
| 01440000 | 01401000 | 01411000 |
| 01443500 | 01445500 | 01411500 |
| 01445500 | — | 01467000 |
The Paired Wilcoxon Signed-Rank Test was then implemented to test for a change in the distribution between the two time periods. Percent change was calculated to understand the relative difference at each streamgage for each statistic between the historical and current time periods.
Evaluating Environmental Changes Between Study Periods
McHugh and others (2024) used StreamStats (USGS, 2019) to delineate generalized basin boundaries for continuous- and partial-record streamgages across New Jersey. A subset of the streamgages and basins originally selected were used for this study (fig. 3) to assess statistical changes in streamflow and to understand the potential effect of changes in land use, precipitation, and water use on flow conditions throughout New Jersey.
Statewide Land Use Conditions for Historical and Current Periods
Land use was evaluated using a snapshot of each study period. Geographic Information Retrieval and Analysis (GIRAS) 1973 (Mitchell and others, 1977) and National Land Cover Dataset (NLCD) 2016 (Dewitz and U.S. Geological Survey, 2021) datasets were obtained, and categories were generalized to match land use types between the two time periods (fig. 4). Because of the limited availability of historical land-use datasets, each period was assessed using data from a time frame of less than 10 years before the end of the period. Land use resolution in the GIRAS dataset is considerably lower than that of NLCD, documented by some discrepancies such as those shown in Figure 5. Streamgage basin land-use characteristics were summarized using the “Tabulate Area” tool in ArcGIS Pro 3.0 (Environmental Systems Research Institute, Inc., 2022).
Land Use Conditions for Selected Streamgage Basins During Historical and Current Periods
Land use was evaluated in each of the 30 continuous-record and 45 partial-record streamgage basins using snapshots from the historical and current study periods (fig. 3). Land use categories were generalized to Water, Urban, Barren, Forest, Agriculture, Wetlands, and Other due to the low spatial resolution of the GIRAS 1973 dataset (fig. 4). Although NLCD 1992 (USGS, 2000) was not used to understand the defined historical or current periods selected by the study, it was used as an intermediate snapshot to assess confidence in GIRAS. Summaries at multiple streamgages indicated similar percentages between NLCD 1992 and GIRAS, providing additional confidence in the land use changes between the historical and current periods.
A number of considerable land use changes were observed. The Haycock Brook at Pompton Lakes N.J., streamgage 01387980 indicated an increase in Water of nearly 20 percent between 1973 and 2016. The Ringwood Creek near Wanaque N.J., streamgage 01384500 indicated an increase in Forest of nearly 77 percent, the Nichomus Run near Woodstown N.J., streamgage 01482510 increased by 64.2 percent in Agriculture, and the Goshen Creek at Goshen N.J., streamgage 01411418 increased by 40.2 percent in Wetlands. Other considerable changes included a 46 percent increase at the Green Egg Harbor River tributary at Sicklerville N.J., streamgage 01410787 and a 60.7 percent decrease at the Rahway River at Rahway, N.J., streamgage 01395000 in Urban between 1973 and 2016. Figure 5 shows the difference in data resolution for this basin, where the GIRAS dataset excludes the detailed water and forested areas captured by NLCD, causing an artificial “increased” urban area for the earlier period.
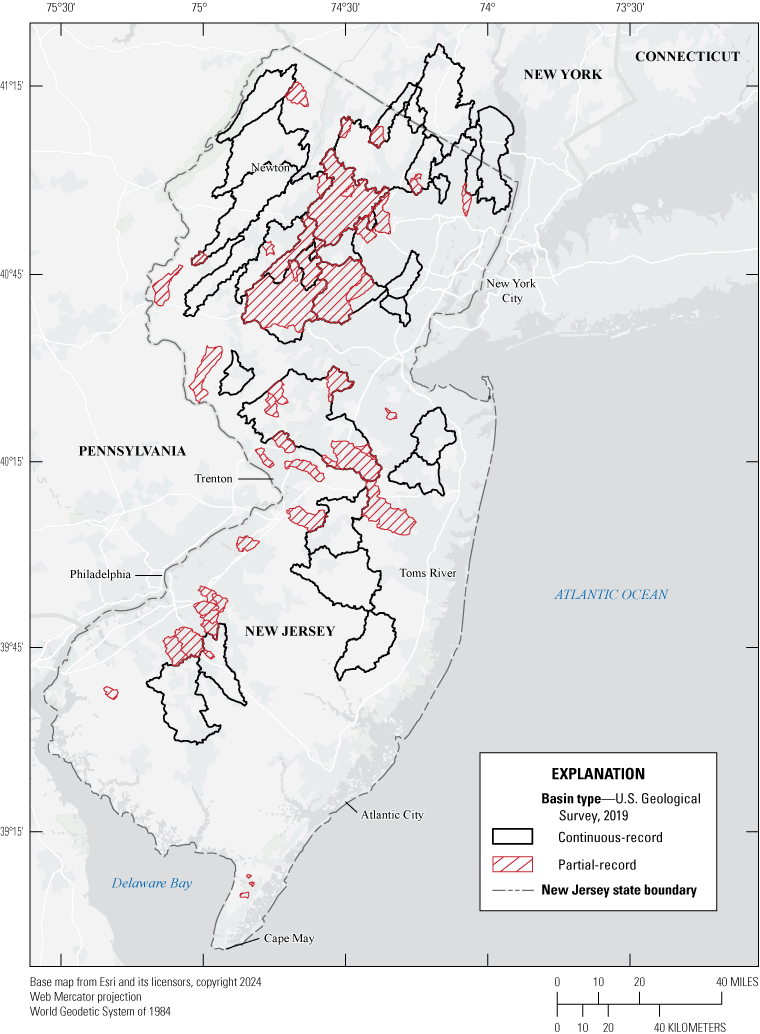
Map showing continuous- and partial-record generalized basins used to summarize land use, precipitation means, and water use data throughout New Jersey.
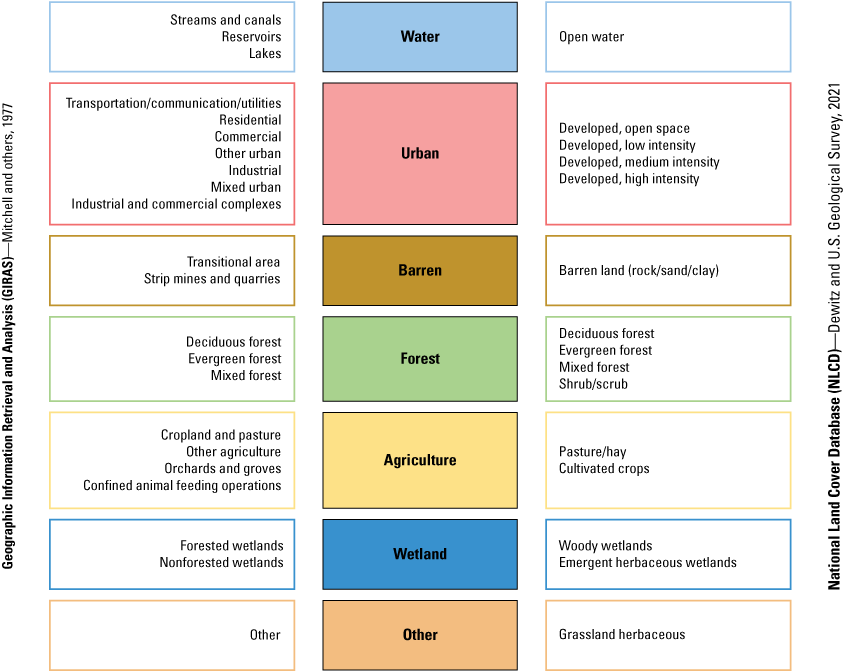
Visual diagram showing Geographic Information Retrieval and Analysis and National Land Cover Dataset categories and how they fit into the generalized categories used for this study.
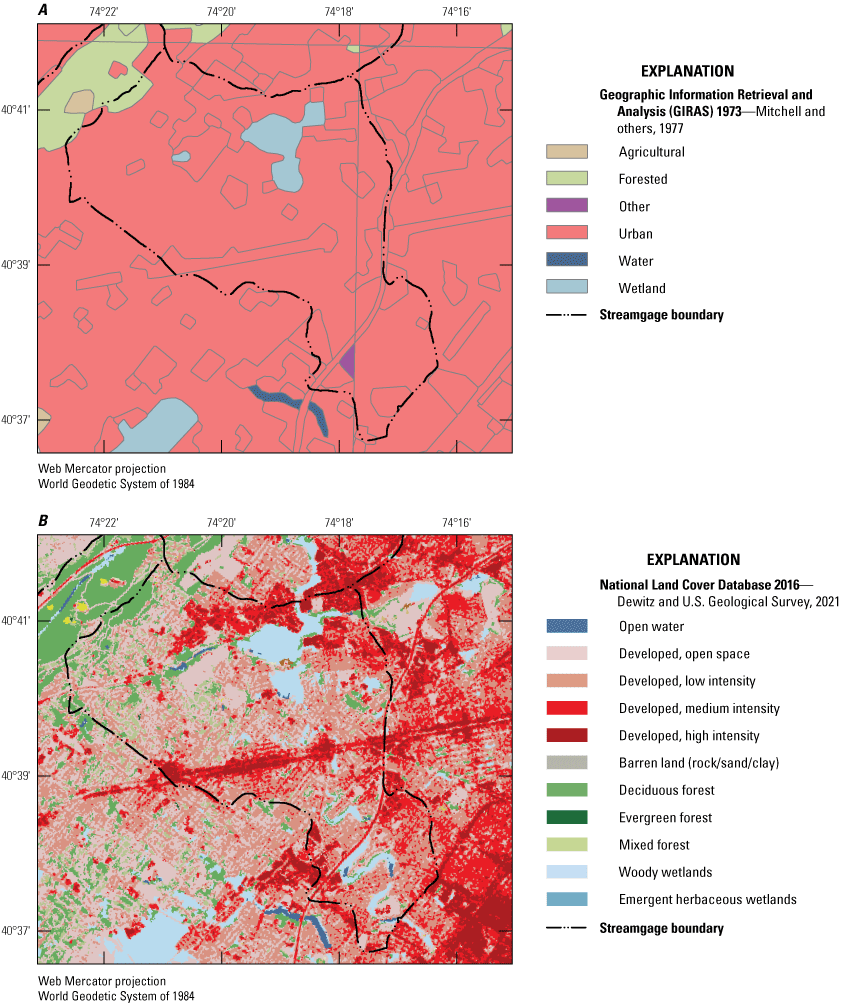
Maps showing streamgage 01395000 land cover datasets A, Geographic Information Retrieval and Analysis 1973, and B, National Land Cover Database 2016. This example shows the limited ability to accurately identify changes in land cover between the historical and current periods.
There are substantial caveats to using these values based on the difference in categorization methods and image resolution. National Land Cover Dataset categories were consolidated to reflect the same organization as the generalized GIRAS categories. In multiple instances, wetland and forest sub-categories were consolidated for the historical period (fig. 4). Based on the inconsistencies between datasets, land use change should be scrutinized. The use of satellite and aerial imagery may be an effective method to supplement this dataset.
Statewide Average Monthly and Annual Precipitation Totals for Current and Historical Periods
Monthly and annual precipitation data were downloaded in raster format at a 4-kilometer resolution from the Parameter-Elevation Regressions on Independent Slopes Model dataset (PRISM Climate Group, 2022) for both the historical and current periods. These 4-kilometer gridded data were clipped to the New Jersey state boundary (U.S. Census Bureau, 2022) and multi-state basin boundaries, and were summarized for each basin using the “Zonal Statistics” tool in ArcGIS Pro 3.0 by Esri (Environmental Systems Research Institute, Inc., 2022).
Average Monthly and Annual Precipitation Totals for Selected Streamgages Basins During Current and Historical Periods
Mean precipitation values from PRISM were calculated monthly and annually for each period, resulting in 26 values for each basin (PRISM Climate Group, 2022): one mean value per month historically and currently (24 values), and one mean value summarizing yearly precipitation for the entirety of the historical and current periods (2 values). The 30-year historical mean annual values ranged from 1,034.3 millimeters (mm) or 40.7 inches (in.) at South Branch Big Timber Creek at Blackwood, N.J., streamgage 01467330 to 1,310.8 mm or 51.6 in. at Belcher Creek at West Milford, N.J., streamgage 01382890. Current period values ranged from 1,123.2 mm or 44.2 in. at Dias Creek near Cape May Court House, N.J., streamgage 01411408 to 1,352.8 mm or 53.3 in. at Belcher Creek at West Milford, N.J., streamgage 01382890. Every basin experienced an increase in mean annual precipitation, with some of the largest increases occurring in central New Jersey (fig. 6).
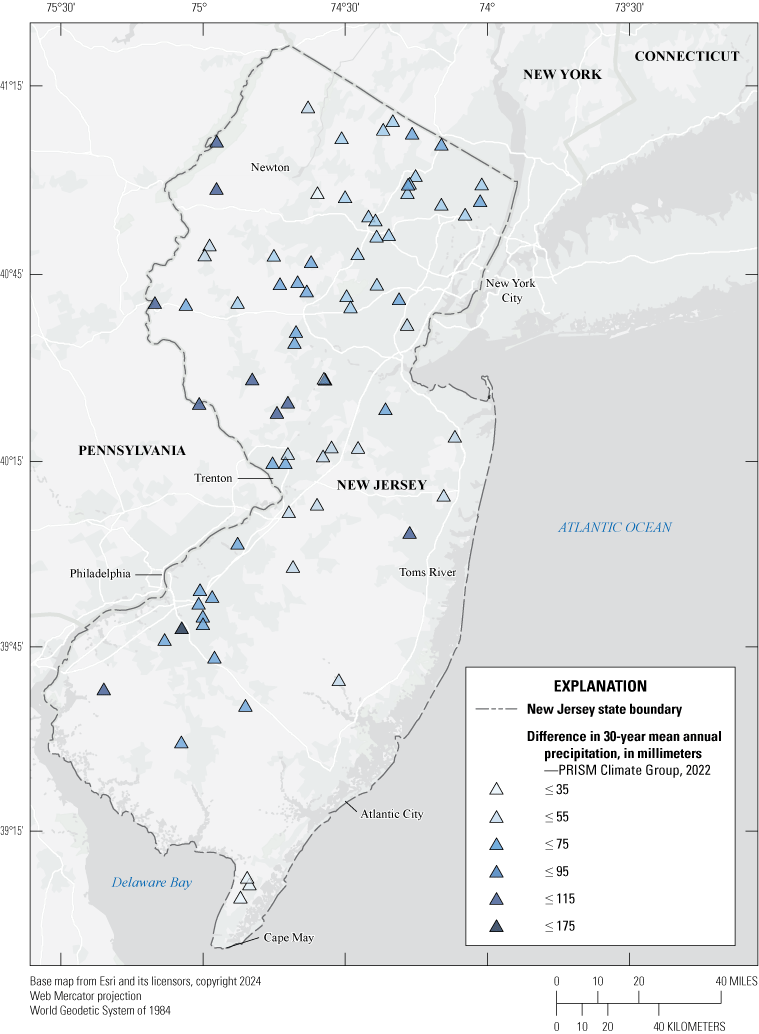
Map showing difference in 30-year mean annual precipitation, in millimeters (PRISM Climate Group, 2022), between historical and current periods across all study basins. Increases ranged from 24.7 mm at Weldon Brook at Hurdtown, New Jersey (N.J.), streamgage 01455370 to 172.9 mm at South Branch Big Timber Creek at Blackwood, N.J., streamgage 01467330.
Of the twelve months, nine months showed an increase in precipitation between the two study periods, whereas February, August, and November showed decreases in precipitation (fig. 7). June and October had the greatest changes, with increases of approximately 24 and 27 percent, respectively. Multiple basins indicated an average increase in both of these months of nearly 30 mm or 1.18 in. between the historical and current periods.
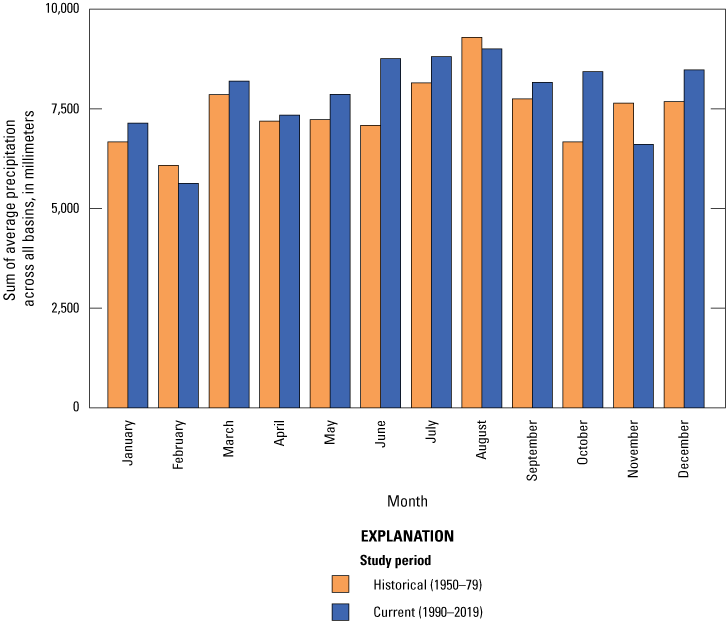
Graph showing the sum of average precipitation, in millimeters (mm), by month across each study period throughout both continuous- and partial-record study basins.
Researchers widely recognize through observation and modeling that a changing climate could likely continue to cause changes in precipitation and extreme weather events (Giri and others, 2020; Georgescu and others, 2021; Rush and others, 2021). These climate variables, coupled with land use change, may affect streamflow characteristics throughout New Jersey through storm-related geomorphic changes, potential drought conditions, variability of water use values, and other changes to topography across the state.
Statewide Water Use Data for Current and Historical Periods
Water use datasets were extracted for both current and historical periods. The current period dataset includes data from 1990 to 2019 taken from the New Jersey Water-Transfer Data System (New Jersey Department of Environmental Protection Division of Water Supply and Geoscience, 2022). The historical period dataset was extracted from an internal USGS database that was compiled as part of the Coastal Plain aquifer project (Zapecza and others, 1987). This dataset was clipped to only include intakes within the continuous- and partial-record basins of interest, and water use data were attached to these basins. Water use per basin was summarized by average volume (millions of gallons) by month and year for each period. Groundwater sites with water use data in both the historical and current periods were extracted to compare water use more directly, and wastewater effluent discharge data were summarized yearly by basin for the current period.
Average Monthly and Annual Water Use Totals for Basins of Selected Streamgages During Current and Historical Periods
Water use data were summarized monthly and annually between the historical and current periods. The historical period water use records included 180 groundwater withdrawal sites within the basins of interest compared to 3,860 groundwater withdrawal and surface water diversion sites in the current period. This overarching comparison includes some caveats. The water use data available before 2003 do not include the same degree of spatial or temporal information as the more recent data. In 1999, the State of New Jersey established the New Jersey Water-Transfer Data System database, which maintains records of groundwater withdrawals, surface water diversions, and wastewater discharges (New Jersey Department of Environmental Protection Division of Water Supply and Geoscience, 2022). In 2003, the New Jersey Environmental Management System was established to provide a more consistent way for tracking water use data at sites with unique identification numbers (New Jersey Department of Environmental Protection, Office of Information Resources Management, Bureau of Geographic Information Systems, 2023).
Additionally, the historical data referenced from Zapecza and others (1987) includes the disclaimer that surface water diversions were not available or included in the dataset and were therefore not included in this analysis. Although some water use data summaries are presented here, these data were included to illustrate the change in magnitude of water withdrawals between periods and not to compute a statistical change in water use volume. When comparing all available New Jersey Water-Transfer Data System data, including both surface water (current period) and groundwater (historical and current periods), water use across the entirety of the study basins increased considerably between the historical and current study periods. As an example of the overall magnitude of increased water use, the July monthly average usage across all basins can be estimated at about 1,383 million gallons during the historical period, which can be compared to 37,405 million gallons in the current period.
However, as previously mentioned, the values presented above are not direct comparisons, as the current period includes both surface water diversions and groundwater well withdrawals, whereas the historical period does not include surface water diversions. Although this substantial difference may be a result of limitations in historical data collection practices, it could also reflect the changes in the types of industries present and an increase in population of more than 1.5 million throughout New Jersey between 1979 and 2019 (U.S. Census Bureau, 2023).
To make a more direct comparison, locations with water use data in both study periods were identified. Of the current period groundwater locations, 73 wells were also documented historically. Only well sites within surficial aquifers (NJDEP, 1998) were incorporated in water use assessments for this study. Basin summaries showed a decrease in mean annual water use at 17 out of 22 basins (fig. 8, table 3). These changes may be attributed to water conservation efforts, efficiencies in technology, and (or) the addition of other water intakes (in other words, new sites) within the basin. Percent change in water use at the selected locations between the study periods ranged from −90.9 percent at Beden Brook near Hopewell, N.J., streamgage 01401520 to 158.5 percent at North Branch Rancocas Creek at Pemberton, N.J., streamgage 01467000.
Trends in the September median values for water use at these 73 wells were analyzed using an MK Trend Test. This test was selected for this study because it is a nonparametric test that does not require the data to be normally distributed and is appropriate for hydrologic data. This test is not subject to influence from outliers or rare events, which can be common in hydrologic data. Additionally, this test assumes that the data are independent, meaning there is no autocorrelation present in the dataset. A trend is considered to be statistically significant when p-value is less than 0.05 (Helsel and others, 2020). No significance was found when the MK Trend Test was applied to individual sites, nor when applied to the sites grouped by basin.
Ultimately, comparing the water use data between the historical and current periods presented in this study proved ineffective in identifying trends over time as a result of the inconsistencies in the two datasets between the historical and current study periods.
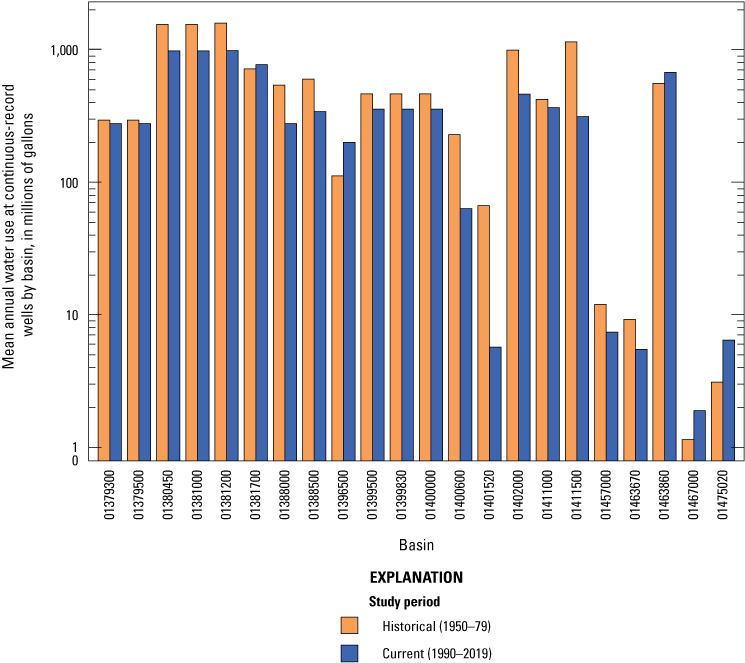
Graph showing historical and current annual mean water use at 73 overlapping well locations summarized by basin, shown in log scale.
Wastewater data were assessed annually by basin during the current period to understand potential effects on water use or flow statistics (New Jersey Department of Environmental Protection Division of Water Supply and Geoscience, 2022). Although wastewater data exist for 49 basins, these data are assumed to have limitations due to missing and incomplete records. No wastewater data are available during the historical period to include in a comparison. When comparing basin-wide wastewater effluent values between 1990 and 2019, 12 basins indicated a decrease in effluent discharge, 16 basins had values of zero (reflecting no data in either year), and 21 basins indicated an increase in effluent discharge ranging from approximately 4 to 4,600 million gallons. Of the 22 basins with groundwater water use data for both periods examined in the study, 20 also had wastewater data. Changes in wastewater discharge data between 1990 and 2019 ranged from −100 percent (Great Egg Harbor River at Folsom, N.J., streamgage 01411000, with a difference of −19.22 million gallons) to 9,400 percent (Rockaway River at Pine Brook, N.J., streamgage 01381200, with a difference of 3,700 million gallons) (table 3). However, owing to the assumed limitations with the wastewater data, their use in this work proved to be inconclusive and limited.
Table 3.
Water use and wastewater percent changes in basins where groundwater wells have data for both historical and current periods.[Data are from New Jersey Department of Environmental Protection Division of Water Supply and Geoscience (2022). CFZ refers to a change from zero, or, if there are snapshots of data throughout the study periods, a zero value in both 1990 and 2019. NA, not applicable]
| Streamgage associated with water use basin | Percent change of average annual water use (Historical (1950–79) to Current (1990–2019)) | Percent change of average annual water use (1990 to 2019) | Percent change of wastewater (1990 to 2019) |
|---|---|---|---|
| 01379300 | –5.92 | CFZ | 76.10 |
| 01379500 | –5.92 | NA | 35.67 |
| 01380450 | –36.13 | NA | 30.39 |
| 01381000 | –36.13 | NA | 30.39 |
| 01381200 | –36.93 | 35.87 | 9,406.55 |
| 01381700 | 7.43 | –8.91 | CFZ |
| 01388000 | –47.69 | NA | 106.67 |
| 01388500 | –42.06 | –34.74 | 212.02 |
| 01396500 | 75.36 | 213.41 | 34.89 |
| 01399500 | –22.62 | NA | 69.89 |
| 01399830 | –22.62 | CFZ | 62.43 |
| 01400000 | –22.62 | NA | 62.43 |
| 01400600 | –71.16 | –100 | 39.19 |
| 01401520 | –90.95 | NA | NA |
| 01402000 | –52.29 | –60.62 | 202.91 |
| 01411000 | –12.79 | 4,014.37 | –100 |
| 01411500 | –71.53 | 1,259.53 | CFZ |
| 01457000 | –37.92 | –100 | 142.11 |
| 01463670 | –40.68 | NA | NA |
| 01463860 | 20.40 | –34.21 | CFZ |
| 01467000 | 158.54 | –100 | CFZ |
| 01475020 | 114.30 | CFZ | CFZ |
Statistical Analysis of Flow Conditions
The statistics of interest were evaluated for changes in distribution using a Paired Wilcoxon Signed-Rank Test for both continuous- and partial-record streamgages. The percent change for each statistic was also calculated for each streamgage to determine the magnitude of change between the historical and current periods. Lastly, a MK Trend Test was performed on the annual minimum 7-day average flow and September median for continuous- and partial-record streamgages to test for a monotonic upward or downward trend.
Continuous-Record Streamgages
The 14 statistics of interest selected for this study, monthly 1-day low flow median, September median flow, and 7Q10, were assessed using the Paired Wilcoxon Signed-Rank Test to determine if there was a statistical difference in the data distribution between the historical and current time periods at continuous-record streamgages. Results of this test showed that the January, February, June, September, and December 1-day monthly low-flow medians and the September median had a statistically significant difference in distribution between the two time periods using a significance level of 0.05 (table 4). The September median results showed a decrease in the actual median flow and a considerable change in the reduced range of flow in the current period (fig. 9). The median value for all streamgages was reduced from 46 to 34 cubic feet per second (ft3/s), but the maximum range of September medians was reduced from 127 to 100.8 ft3/s (fig. 9). Figure 9 includes the overall results for the 7Q10 statistic, and also shows that the median and maximum magnitude of the 7Q10 flow decreased between study periods, although the result was not statistically significant. Although the overall comparison of 7Q10 statistics between study periods does not indicate significant changes, the statistics computed at many of the selected streamgages did exhibit considerable changes. These changes are discussed later in this section.
Several of the 1-day monthly low-flow medians were also identified as exhibiting a statistically significant change from the historical to the current period. The overall change for the monthly statistics does not indicate a simple and clear pattern across all months. The medians for January, February, April, November, and December increased slightly, whereas the remaining months showed either no change (March) or a decrease in the median value for the current period (table 4). Also, the changes in January, February, and December were statistically significant as increased flow, whereas the June and September 1-day medians were statistically significant as decreasing flows. Figure 10 shows the boxplots for the 1-day monthly low-flow medians, color-coded by month.
Table 4.
Continuous-record streamgage statistics, the medians of all streamgages for each time period, and the probability (p-value) associated with the Paired Wilcoxon Signed-Rank Test.[ft3/s, cubic feet per second; p-value, probability; 7Q10, annual 7-day low flow with a 10-percent annual nonexceedance probability]
| Statistic | Median, in ft3/s (1950–1979) |
Median, in ft3/s (1990–2019) |
p-value |
|---|---|---|---|
| January 1-day low-flow median | 56 | 66.5 | 0.00695 |
| February 1-day low-flow median | 68 | 73 | 0.0283 |
| March 1-day low-flow median | 87.5 | 87.5 | 0.522 |
| April 1-day low-flow median | 80 | 84 | 0.736 |
| May 1-day low-flow median | 56.5 | 50.5 | 0.0601 |
| June 1-day low-flow median | 37 | 36.5 | 0.0152 |
| July 1-day low-flow median | 26 | 23 | 0.191 |
| August 1-day low-flow median | 24 | 23 | 0.305 |
| September 1-day low-flow median | 26.5 | 20.5 | 0.0201 |
| October 1-day low-flow median | 33.5 | 23.5 | 0.284 |
| November 1-day low-flow median | 43.5 | 44.5 | 0.428 |
| December 1-day low-flow median | 50.5 | 58.5 | 0.00725 |
| September median | 41 | 33 | 0.0249 |
| 7Q10 | 14 | 11.5 | 0.438 |
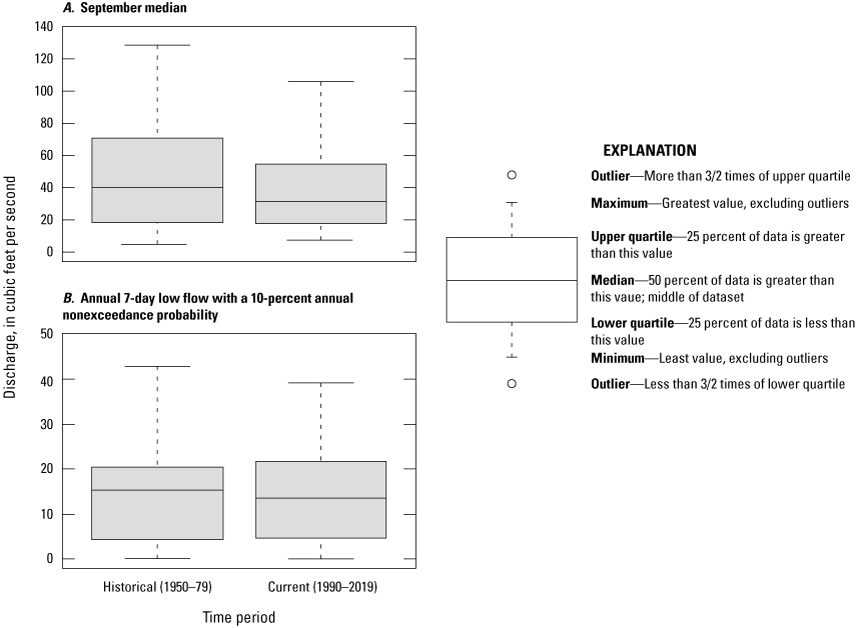
Boxplots showing the September median and annual 7-day low flow with a 10-percent annual nonexceedance probability (7Q10) statistics in ft3/s for both historical and current 30-year period results at continuous-record streamgages.
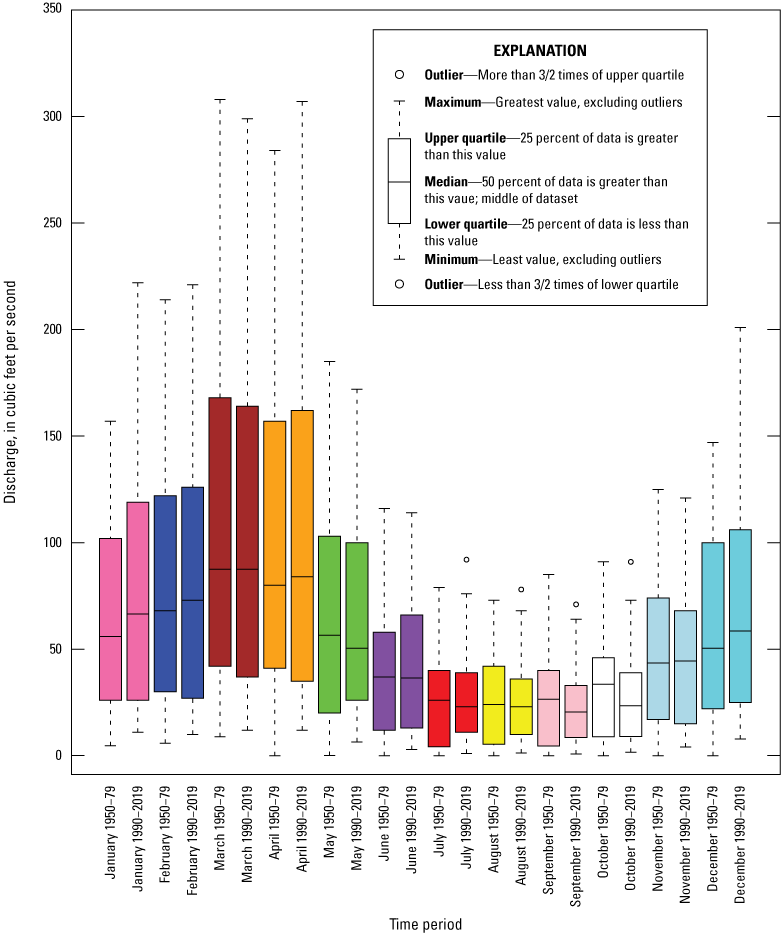
Boxplot showing monthly 1-day low flows in ft3/s for historical and current 30-year periods at continuous-record streamgages.
Percent change between the two time periods of interest was also assessed for each of the 30 continuous-record streamgages. A streamgage was identified as having a considerable change if it was greater than 100 percent in the positive direction or 20 percent in the negative direction. Seven streamgages were classified as having a considerable percent change in the positive direction and 10 streamgages indicated a considerable percent change in the negative direction (fig. 11). Nearly all streamgages with a substantial increase in flow value were north of the Fall Line (fig. 11). Several streamgages were identified as monitoring streamflows affected by reservoir operations, or impacted by water use withdrawals and (or) permitted discharge effluent. Human alteration activities like withdrawals from shallow groundwater can affect base-flow conditions while effluent discharges immediately upstream of a streamgage increase the flow passing the streamgage both of which will result in statistics that differ from those computed from unaltered flow conditions (Charles and Nicholson, 2012; Dudley and others, 2020). These statistics are useful for understanding the current period conditions at the streamgages, but the change in flow conditions between periods may not be representative of natural or climate-influenced changes. Many of the streamgages that indicated considerable percent change in the positive (increasing) direction were noted as regulated or impacted.
The MK Trend Test was performed on annual minimum 7-day average flow and September median for each continuous-record streamgage for the historical and current periods to test for monotonic upward or downward trends (table 5). Ten streamgages had a significant p-value for at least one of the time periods for annual minimum 7-day average flow and (or) September median. Every streamgage had a positive trend except for Swimming River near Red Bank N.J., streamgage 01407500 for the historical period for both statistics of interest. Computed low flows at the Swimming River near Red Bank N.J. streamgage are considered unreliable because of a combination of complex conditions related to spillway sensitivity, discharge measurement conditions, leakage, bypass flows, and diversions, which may increase the range of uncertainty and add “noise” to the final record. The Kendall’s Tau correlation coefficient measures the monotony of the slope. It can vary between -1 and 1, where it is negative when the trend is decreasing and positive if the trend is increasing (Helsel and others, 2020).
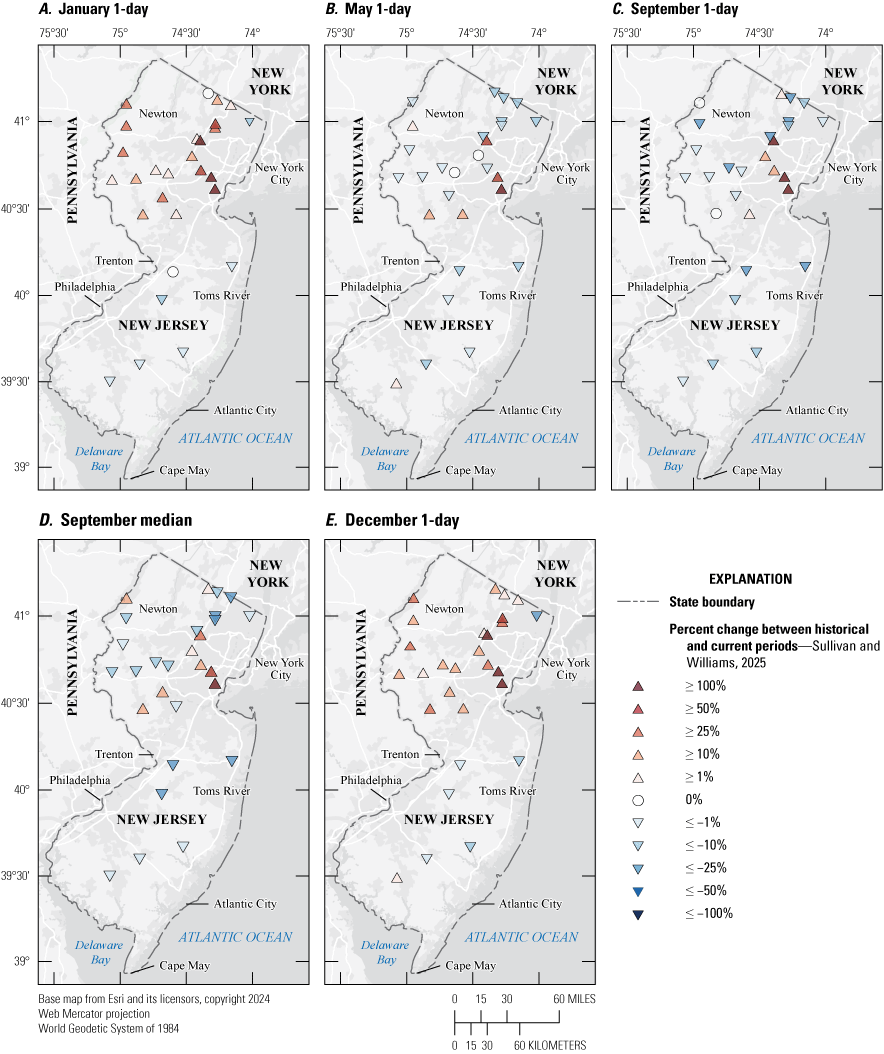
Map showing continuous-record streamgages across New Jersey with statistically significant differences shown by percent change between historical and current periods by arrows pointing up or down.
Table 5.
Statistically significant Mann-Kendall Trend Test results for monotonic upward or downward trends for the historical period and current 30-year periods for annual 7-day low flow with a 10-percent annual nonexceedance probability (7Q10) and September median.[7Q10, annual 7-day low flow with a 10-percent annual nonexceedance probability; p-value, probability; NA, not available]
| Historical period | Current period | |||||||
|---|---|---|---|---|---|---|---|---|
| Streamgage number | 7Q10 p-value | Kendall’s Tau for 7Q10 | September median p-value | Kendall’s Tau for September median | 7Q10 p-value | Kendall’s Tau for 7Q10 | September median p-value | Kendall’s Tau for September median |
| 01377500 | 0.000236 | 0.477 | 0.00457 | 0.377 | NA | NA | NA | NA |
| 01378500 | NA | NA | NA | NA | 0.000253 | 0.475 | 0.00862 | 0.348 |
| 01379500 | 0.00215 | 0.398 | NA | NA | NA | NA | NA | NA |
| 01381000 | 0.00053 | 0.451 | 0.019 | 0.313 | NA | NA | NA | NA |
| 01395000 | NA | NA | NA | NA | 0.0295 | 0.283 | NA | NA |
| 01400000 | NA | NA | NA | NA | NA | NA | 0.00391 | 0.389 |
| 01407500 | 0.0185 | -0.315 | 0.0322 | -0.286 | 7.35x10⁻⁶ | 0.604 | 0.00852 | 0.350 |
| 01408000 | 0.0185 | 0.306 | 0.0219 | 0.306 | NA | NA | NA | NA |
Table 6 lists the 22 continuous-record streamgages with at least one variable with a considerable positive or negative percent change and the computed change in selected statistics. Examining a subset of the streamgages that are generally unregulated and unimpacted, including several streamgages where regulation is mostly present only during higher flow conditions, reveals a change pattern in 7Q10 discharge values as consistently decreasing. Most changes ranged from about –39 percent to 10 percent between the study periods. Decreasing changes were also noted for many of the other statistics computed at these streamgages. Table 6 includes a column that identifies streamgages where known regulation or impacted streamflow conditions exist, helping users better understand the statistics.
Table 6.
Percent change at continuous-record streamgages between the historical and current 30-year periods for the monthly 1-day low-flow medians, the September median flow, and the 7Q10 in cubic feet per second (ft3/s).[CFZ refers to a change from zero, or, if there are snapshots of data throughout the study periods, a zero value in both 1990 and 2019. N.J., New Jersey; 7Q10, annual 7-day low flow with a 10-percent annual nonexceedance probability; R, Regulated; I, Impacted; NA, not available]
| Streamgage number and name | January 1-day | February 1-day | March 1-day | April 1-day | May 1-day | June 1-day | July 1-day | August 1-day | September 1-day | October 1-day | November 1-day | December 1-day | September median | 7Q10 | Regulated (R) or Impacted (I) |
|---|---|---|---|---|---|---|---|---|---|---|---|---|---|---|---|
| 01377500 Passaic Brook at Westwood, N.J. |
−16.1 | 1−20.6 | 1−31.0 | 1−29.3 | 1−21.2 | −4.2 | −8.3 | −5.0 | −8.7 | −8.7 | −14.3 | 1−33.3 | −9.4 | 18.3 | R, I |
| 01378500 Hackensack River at New Milford, N.J. |
23.6 | 1−37.5 | 1−29.4 | CFZ | 111,900.0 | CFZ | CFZ | CFZ | CFZ | CFZ | CFZ | CFZ | CFZ | CFZ | R |
| 01379500 Passaic River near Chatham, N.J. |
52.4 | 20.0 | 19.6 | 7.4 | −2.0 | 50.0 | 57.1 | 84.6 | 25.0 | 60.0 | 7.9 | 30.8 | 21.4 | 1202.3 | I |
| 01380450 Rockaway River at Main Street at Boonton, N.J. |
8.2 | 14.0 | 0.5 | −6.1 | −17.4 | 11.9 | −5.0 | −8.8 | 1−29.7 | 1−24.5 | 1−20.9 | 9.8 | 1−23.9 | 1−26.7 | I |
| 01381000 Rockaway River below Reservoir at Boonton, N.J. |
1175.0 | 1603.3 | −8.4 | 1141.9 | 1100.0 | 1344.4 | 1900.0 | 816.71 | 1450.0 | 1614.3 | 1243.8 | 1281.8 | 33.3 | 13,850.0 | R |
| 01383500 Wanaque River at Awosting, N.J. |
0.0 | 8.3 | 5.7 | −6.3 | 1−20.0 | 19.4 | 16.7 | 2.1 | 8.7 | 30.2 | 68.4 | 22.7 | 4.7 | 54.5 | R, I |
| 01384500 Ringwood Creek near Wanaque, N.J. |
11.8 | 18.8 | 0.0 | −8.7 | −18.8 | 24.6 | 44.0 | −11.8 | −37.5 | −12.9 | 1−22.1 | 7.1 | −13.5 | 0.0 | NA |
| 01387500 Ramapo River near Mahwah, N.J. |
5.9 | 1.6 | −6.5 | −3.2 | 1−22.3 | −8.0 | −4.0 | 10.0 | 1−20.0 | 1−48.8 | 1−32.1 | 2.8 | 1−38.5 | 1−30.8 | I |
| 01388000 Ramapo River at Pompton Lakes, N.J. |
51.7 | 5.1 | 9.1 | 1.0 | 1−22.6 | −6.3 | −11.1 | 10.7 | 1−33.3 | 1−25.0 | −1.7 | 70.7 | 1−34.3 | 1−36.0 | I |
| 01388500 Pompton River at Pompton Plains, N.J. |
41.4 | 3.3 | −2.9 | 8.1 | −7.0 | −1.7 | −2.6 | −2.9 | 1−24.7 | −19.8 | 3.4 | 36.7 | 1−26.0 | −9.3 | I |
| 01394500 Rahway River near Springfield, N.J.* |
1155.3 | 1124.1 | 68.5 | 78.6 | 57.1 | 1147.5 | 1170.0 | 1196.0 | 1192.0 | 1174.1 | 1162.5 | 1127.9 | 98.0 | 1380.0 | I |
| 01395000 Rahway River at Rahway, N.J.* |
1201.9 | 1114.3 | 90.9 | 1118.2 | 1157.6 | 1490.9 | 1950.0 | 1800.0 | 1775.0 | 1937.5 | 1700.0 | 1191.7 | 1128.1 | 12,700.0 | I |
| 01398000 Neshanic River at Reaville, N.J.* |
20.0 | 18.2 | 5.9 | 0.0 | 14.0 | 63.2 | 10.0 | −7.1 | 0.0 | 6.7 | 11.9 | 38.9 | 25.0 | 1−100.0 | I |
| 01398500 North Branch Raritan River near Far Hills, N.J.* |
8.3 | −3.3 | 2.6 | −4.9 | 0.0 | 6.3 | 25.0 | 13.6 | −8.9 | 1.1 | −11.8 | 19.0 | −12.5 | 1214.3 | R, I |
| 01399500 Lamington (Black) River near Pottersville, N.J. |
3.1 | 18.2 | −6.0 | 4.2 | −2.8 | 19.0 | 15.4 | 0.0 | 1−33.3 | 1−27.8 | −4.5 | 15.4 | 1−21.7 | −10.6 | NA |
| 01402000 Millstone River at Blackwells Mills, N.J. |
7.8 | 7.0 | −3.9 | −2.6 | 11.7 | 50.0 | 40.0 | 26.1 | 1.9 | 11.9 | 32.4 | 23.3 | −2.3 | 1126.7 | I |
| 01407500 Swimming River near Red Bank, N.J. |
1−31.4 | −30.8 | −23.9 | −14.6 | 1−31.6 | 1−75.8 | 1−20.0 | 1−72.2 | 1−77.1 | 1−85.8 | 1−81.4 | 1−57.1 | 1−84.3 | CFZ | NA |
| 01408000 Manasquan River at Squankum, N.J. |
−6.1 | 1−20.3 | −17.9 | −8.1 | −11.4 | −18.2 | −18.5 | 1−21.4 | 1−28.6 | −17.9 | −16.2 | −16.7 | 1−25.0 | 1−22.2 | NA |
| 01410000 Oswego River at Harrisville, N.J. |
−5.8 | −9.9 | −9.2 | −7.4 | −2.0 | −19.6 | 1−20.0 | −8.1 | −10.8 | −10.0 | −8.0 | −10.2 | −8.0 | 5.0 | NA |
| 01443500 Paulins Kill at Blairstown, N.J. |
35.4 | 11.6 | 7.7 | 0.0 | 3.0 | 23.2 | −7.7 | −5.7 | 1−26.5 | −5.1 | 30.0 | 24.7 | −10.3 | 0.0 | 2I |
| 01464500 Crosswicks Creek at Extonville, N.J.* |
0.0 | −9.4 | −7.1 | −9.0 | −17.7 | −18.6 | 1−28.9 | 1−35.7 | 1−35.0 | 1−26.1 | −8.3 | −5.7 | 1−25.5 | 1−39.1 | NA |
| 01467000 North Branch Rancocas Creek at Pemberton, N.J. |
−15.0 | −13.1 | −1.9 | −6.5 | −9.7 | −8.3 | −15.6 | −18.2 | −17.5 | 1−22.7 | 2.2 | −8.7 | 1−25.3 | −13.9 | NA |
Denotes considerable percent change (greater than 100 percent or less than −20 percent).
Denotes additional assessment based on percent change presented in the individual case study section later in the report.
Additionally, two of the statistics computed in this study can be used to estimate the at-site LFM for the continuous-record streamgages. Although this would not be a direct comparison to the methods applied in the NJDEP Technical Memorandum 2013–3 (Domber and others, 2013), it might provide some insight into how low-flow water availability may vary between study periods. A thorough analysis and updated computation of the LFM at selected streamgages was not done as part of this study. However, a simple review of the computed statistics indicates that 10 of the 13 nonregulated, unimpacted continuous-record streamgages exhibited a decreasing change and nine of the 12 continuous-record impacted streamgages also exhibited a decreasing change. The average decreasing change for the 10 nonregulated, unimpacted streamgages was around 22 percent, whereas the average decreasing change for the nine impacted streamgages was around 32 percent.
Five streamgages with considerable percent changes among the 14 computed statistics between study periods were selected and assessed in further detail based on changes in the landscape, precipitation, and water use. These details are discussed in the “Case Studies of Changes at Continuous- and Partial-Record Streamgages” section of this report.
Partial-Record Streamgages
The Paired Wilcoxon Signed-Rank Test was performed for the September median, 7Q10, and monthly 1-day low-flow medians at partial-record streamgages. None of these calculations resulted in a statistically significant difference in the data distribution between the historical and current time periods (fig. 12). As indicated earlier in this report, a MOVE.1 regression, or censored regression, was used to estimate statistics at the partial-record streamgages by correlating discrete discharge measurements with computed daily streamflow at index streamgages. One potential limitation of this approach is the availability of a long-term continuous-record streamgage with data in both periods and similar basin characteristics as the partial-record gages. Although statistically significant changes were not identified for the grouped comparison of study periods at partial-record streamgages, there was a small decrease in discharge for all low-flow statistics except for the 1-day October and December medians and 7Q10 statistics (table 7). The 1-day June median statistic and the overall 7Q10 each indicated an overall increase of 0.05 ft3/s. However, similar to the pattern observed for continuous-record streamgages, the statistics computed for the individual partial-record streamgages varied between periods. The change in 1-day monthly low-flow medians ranged from −100 to 600 percent between the historical and current periods. Changes in discharge between historical and current 7Q10 ranged from −100 to 300 percent. Increases in 7Q10 discharge values were identified at 16 streamgages, whereas 14 streamgages indicated a decrease; all other streamgages had no change or a change from zero. There were also seven partial-record streamgages that had no change in 7Q10 discharge between the historical and current periods. Lastly, there were 10 streamgages that had a change from zero, meaning the results of the 7Q10 statistic during the historical period was 0 ft3/s and changed to a value greater than 0 ft3/s in the current period. The change in September median ranged from −67.7 percent to 450 percent. Twenty-one partial-record streamgages exhibited an increase in the September median, whereas 17 streamgages indicated a decrease. There were also five streamgages that did not have a change between the two time periods, and there were two streamgages that had a change from zero. The partial-record streamgages that had a considerable percent change between the historical and current periods in the negative and positive direction are listed in table 8.
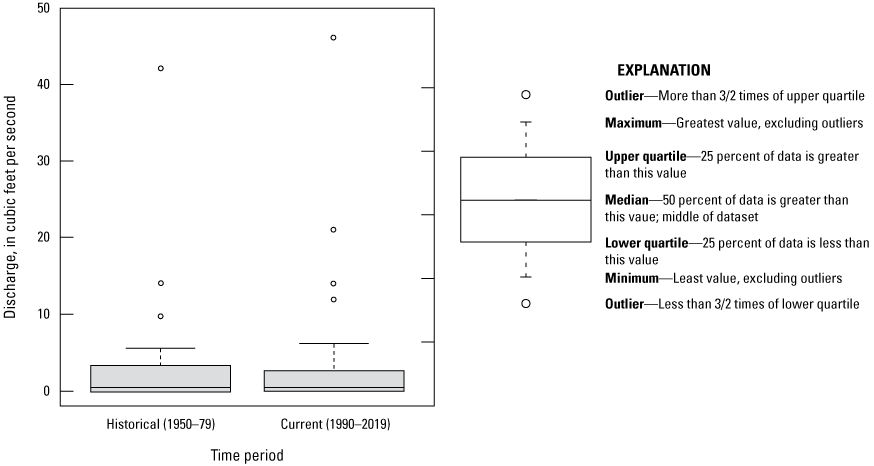
Boxplot showing historical and current 30-year period results at partial-record streamgages for annual 7-day low flow with a 10-percent annual nonexceedance probability (7Q10).
Table 7.
Partial-record streamgage statistics, the medians for each time period, and the probability (p-value) associated with the Paired Wilcoxon Signed-Rank Test.[ft3/s, cubic feet per second; p-value, probability; 7Q10, annual 7-day low flow with a 10-percent annual nonexceedance probability]
| Statistic | Median, in ft3/s (Historical (1950–79)) | Median, in ft3/s (Current (1990 –2019)) | p-value |
|---|---|---|---|
| January 1-day low-flow median | 3.80 | 3.35 | 0.595 |
| February 1-day low-flow median | 4.10 | 4.05 | 0.810 |
| March 1-day low-flow median | 7.65 | 6.50 | 1.00 |
| April 1-day low-flow median | 7.50 | 6.35 | 0.786 |
| May 1-day low-flow median | 4.30 | 4.25 | 0.424 |
| June 1-day low-flow median | 2.15 | 2.20 | 0.809 |
| July 1-day low-flow median | 1.50 | 1.45 | 0.922 |
| August 1-day low-flow median | 1.35 | 1.30 | 0.960 |
| September 1-day low-flow median | 1.30 | 1.25 | 0.873 |
| October 1-day low-flow median | 1.40 | 1.40 | 0.964 |
| November 1-day low-flow median | 2.25 | 2.10 | 0.791 |
| December 1-day low-flow median | 3.40 | 2.90 | 0.677 |
| September median | 2.15 | 2.00 | 0.861 |
| 7Q10 | 0.45 | 0.50 | 0.749 |
Table 8.
Percent change at partial-record streamgages with considerable percent change between the historical and current 30-year periods for at least one computed statistic, where months refer to monthly 1-day low-flow medians.[CFZ, refers to a change from zero, or, if there are snapshots of data throughout the study periods, a zero value in both 1990 and 2019.]
| Streamgage number and name | January | February | March | April | May | June | July | August | September | October | November | December | September median | 7Q10 |
|---|---|---|---|---|---|---|---|---|---|---|---|---|---|---|
| *01378900 Black Brook near Meyersville, N.J. | 1266.7 | 1290.0 | 76.8 | 83.3 | 1200.0 | 1600.0 | 1600.0 | 1400.0 | 1300.0 | 1300.0 | 1300.0 | 1350.0 | 1450.0 | CFZ |
| 01380050 Hibernia Brook at outlet of Lake Telemark, N.J. | 9.1 | −7.1 | −26.5 | 1−27.3 | 0.0 | 50.0 | 50.0 | 1200.0 | 1200.0 | 1100.0 | 60.0 | 20.0 | 50.0 | CFZ |
| 01381200 Rockaway River at Pine Brook, N.J. | −15.8 | 1−22.0 | 1−40.0 | 1−40.0 | 1−23.3 | 7.7 | 30.0 | 38.9 | 38.9 | 30.0 | 3.6 | −13.9 | 12.0 | 1114.3 |
| 01381700 Troy Brook at Troy Hills, N.J. | 1−54.7 | 1−52.2 | 1−32.5 | 1−35.0 | 1−49.5 | 1−67.2 | 1−75.0 | 1−75.5 | 1−75.5 | 1−71.9 | 1−61.4 | 1−55.4 | 1−65.2 | 1−85.3 |
| 01382050 Pequannock River near Stockholm, N.J. | 33.3 | 18.8 | 4.2 | 4.3 | 23.5 | 25.0 | 0.0 | 1100.0 | 1100.0 | 50.0 | 40.0 | 27.3 | 25.0 | CFZ |
| 01382890 Belcher Creek at West Millford, N.J. | 0.0 | 4.2 | 8.7 | 11.5 | 6.0 | −8.0 | −11.8 | −13.3 | 1−20.0 | −17.6 | −13.8 | −2.4 | −16.7 | −16.7 |
| 01389850 Goffle Brook at Hawthorne, N.J. | 1−36.8 | 1−33.3 | −4.4 | −4.5 | 1−25.6 | 1−47.8 | 1−58.8 | 1−60.0 | 1−60.0 | 1−58.8 | 1−48.0 | 1−38.2 | 1−52.2 | 1−85.7 |
| 01391485 Spout Brook at Rochelle Park, N.J. | 1−22.7 | 1−22.1 | −16.3 | −17.5 | 1−21.7 | 1−28.6 | 1−32.0 | 1−33.3 | 1−31.9 | 1−28.6 | 1−25.9 | 1−23.1 | 1−27.3 | 1−38.9 |
| 01398360 Burnett Brook near Chester, N.J. | −10.7 | −6.2 | 0.0 | 0.0 | −5.6 | −13.3 | −14.7 | −18.8 | 1−20.0 | −19.4 | −17.5 | −9.8 | −14.3 | 1−25.0 |
| 01398700 Peapack Brook at Gladstone, N.J. | 25.9 | 14.3 | 0.0 | 0.0 | 13.2 | 35.0 | 50.0 | 58.3 | 63.6 | 72.7 | 50.0 | 29.2 | 38.9 | 1100.0 |
| 01400670 Cranbury Brook at Old Church, N.J. | 44.4 | 50.0 | 60.0 | 53.8 | 33.3 | 1−33.3 | 0.0 | 0.0 | 0.0 | 0.0 | 0.0 | 40.0 | 0.0 | −100.0 |
| 01400750 Bear Brook near Hickory Corner, N.J. | 16.7 | 66.7 | 125.0 | 90.0 | 33.3 | 0.0 | 0.0 | 0.0 | 0.0 | 0.0 | 0.0 | 0.0 | 1100.0 | CFZ |
| 01401520 Beden Brook near Hopewell, N.J. | 1−33.3 | 1−35.0 | 1−48.1 | 1−47.1 | 1−40.0 | 1−22.2 | 1−20.0 | 1−20.01 | 1−25.0 | 1−40.0 | 1−28.6 | 1−38.5 | 1−25.0 | 0.0 |
| 01401590 Rock Brook at Blawenburg, N.J. | 1−27.3 | 1−31.3 | 1−65.8 | 1−64.9 | 1−43.5 | 0.0 | 50.0 | 0.0 | 0.0 | 0.0 | 0.0 | −12.5 | 0.0 | CFZ |
| *01401900 Six Mile Run at Blackwells Mills, N.J. | 87.2 | 76.0 | 25.0 | 36.4 | 63.3 | 1111.5 | 1143.8 | 1157.1 | 1161.5 | 1140.0 | 1118.2 | 91.2 | 1117.4 | 1275.0 |
| 01405470 Iresick Brook at East Spotswood, N.J. | −16.7 | 13.3 | 26.3 | 18.8 | 16.7 | 50.0 | 0.0 | 1100.0 | 1100.0 | 0.0 | 33.3 | 20.0 | 33.3 | CFZ |
| *01410787 Great Egg Harbor River tributary at Sicklerville, N.J. | 1−37.5 | 1−33.3 | 1−20.0 | 1−22.2 | 1−40.0 | 1−50.0 | 1−50.0 | 1−50.0 | 1−50.0 | 1−50.0 | 1−33.3 | 1−40.0 | 1−33.3 | 1−100.0 |
| 01411408 Dias Creek near Cape May Court House, N.J. | 16.7 | 37.5 | 60.0 | 44.4 | 66.7 | 1100.0 | 0.0 | CFZ | 0.0 | 0.0 | 1200.0 | 33.3 | 100.01 | CFZ |
| 01411410 Bidwell Creek Tributary near Cape May Court House, N.J. | 0.0 | 50.0 | 0.0 | 0.0 | 0.0 | CFZ | CFZ | CFZ | CFZ | CFZ | CFZ | 0.0 | CFZ | CFZ |
| 01411418 Goshen Creek at Goshen, N.J. | 0.0 | 50.0 | 33.3 | 50.0 | 0.0 | CFZ | CFZ | CFZ | CFZ | CFZ | CFZ | 0.0 | CFZ | CFZ |
| *01460900 Lockatong Creek near Raven Rock, N.J. | 1235.3 | 1141.4 | 69.8 | 62.4 | 84.8 | 1200.0 | 1220.0 | 1200.0 | 1233.3 | 1266.7 | 1250.0 | 1238.5 | 1112.5 | 1200.0 |
| *01463670 Shipetaukin Creek at Bakersville, N.J. | 1−71.4 | 1−71.2 | 1−75.8 | 1−75.8 | 1−72.9 | 1−67.6 | 1−63.6 | 1−66.7 | 1−70.0 | 1−66.7 | 1−70.0 | 1−69.8 | 1−67.7 | 1−57.1 |
| 01463790 Shabakunk Creek near Ewingville, N.J. | 1−22.2 | 1−23.8 | 1−40.5 | 1−40.5 | 1−29.2 | −14.3 | −10.0 | 0.0 | 0.0 | 0.0 | −8.3 | −18.8 | −8.3 | 25.0 |
| 01463830 Miry Run at Robbinsville, N.J. | 1−22.2 | −18.2 | 1−44.0 | 1−41.7 | 1−38.5 | −16.7 | 1−25.0 | 1−25.0 | 1−33.3 | 1−50.0 | 1−40.0 | 1−25.0 | 1−40.0 | 0.0 |
| 01463860 Miry Run at Mercerville, N.J. | 1−28.6 | 1−26.9 | 1−43.1 | 1−43.8 | 1−32.8 | −15.4 | −6.3 | −13.3 | −14.3 | −13.3 | 1−21.7 | 1−25.0 | −16.7 | 25.0 |
| 01467020 Mill Creek at Willingboro, N.J. | 34.8 | 39.3 | 41.2 | 35.5 | 43.8 | 62.5 | 1100.0 | 66.7 | 66.7 | 83.3 | 70.0 | 46.7 | 60.0 | 1150.0 |
| 01467130 Cooper River at Kirkwood, N.J. | 1−22.0 | −11.1 | −3.4 | −7.1 | 1−24.4 | 1−29.6 | 1−39.1 | 1−34.8 | 1−34.8 | 1−40.0 | 1−25.8 | 1−25.6 | 1−29.0 | 1−41.7 |
| 01467140 Cooper River at Lawnside, N.J. | 1−36.7 | 1−33.3 | 1−31.3 | 1−31.3 | 1−37.7 | 1−38.9 | 1−41.2 | 1−40.7 | 1−41.2 | 1−40.4 | 1−35.0 | 1−35.0 | 1−40.9 | 1−45.5 |
| 01482510 Nichomus Run near Woodstown, N.J. | 1−25.0 | −14.3 | −17.6 | −13.3 | 0.0 | 25.0 | 33.3 | 33.3 | 33.3 | 33.3 | 20.0 | −12.5 | 0.0 | 1100.0 |
Denotes additional assessment based on percent change presented in the individual case study section later in the report.
Denotes considerable percent change (greater than or equal to 100 percent or less than −20 percent).
None of the data distributions of the statistics of interest had statistically significant changes at partial-record streamgages. However, five streamgages with considerable differences were selected and assessed in further detail based on changes in the landscape, precipitation, and water use. These details are discussed as case studies at the “Case Studies of Changes at Continuous- and Partial-Record Streamgages” in the following section of this report.
Case Studies of Changes at Continuous- and Partial-Record Streamgages
Five streamgages for both continuous- and partial-record streamgages were selected based on considerable percent change values for any of the calculated statistics. These streamgages were evaluated further to better understand how landscape, environmental, and possible management changes may have affected the flow regime. Supplemental streamgage information is based on observational data and water-year summaries from the National Water Information System water-year summaries for each streamgage (U.S. Geological Survey, 2022a).
Continuous-Record Streamgages
The five continuous-record streamgages that were selected for further evaluation were Rahway River at Rahway, N.J., streamgage 01395000, Rahway River near Springfield, N.J., streamgage 01394500, Neshanic River at Reaville, N.J., streamgage 01398000, North Branch Raritan River near Far Hills, N.J., streamgage 01398500, and Crosswicks Creek at Extonville, N.J., streamgage 01464500. Continuous water use data are not available within these basins, thus water use is not included as a consideration of changes in hydrologic conditions. U.S. Geological Survey water-year summaries provide additional information like the streamgage location, period of record, historical extremes, record accuracy, nearby regulation, and other comments relevant to streamgage operation.
-
Rahway River at Rahway, N.J., streamgage 01395000—Piedmont.—This streamgage had the highest percent increase in the computed statistics except for the monthly 1-day low-flow median for February among impacted but unregulated streamgages. The flow for most of the computed statistics was lower at this streamgage in the historical period than in the current period. Historical monthly 1-day medians were generally greater than 10 ft3/s and as low as 0.8 ft3/s in the fall. However, for the current period, 1-day monthly low-flow medians were as high as 23.6 ft3/s in April and as low as 7 ft3/s in September. When assessing normalized low-flow values at this basin, increases were generally greater when compared to values at other study basins. The mean annual precipitation between the historical and current periods increased by nearly 80 mm. The change in streamflow may be a reflection of increased annual precipitation and (or) the deactivation of groundwater pumping, which would increase streamflow at this streamgage. Short Hills Water Company and Elizabethtown Water Company, now New Jersey American Water Company, diverted water from this basin by well field pumping until the late 1980s to supply water to the communities of Orange and South Orange, N.J.. Gate operations in Cranford Township have been known to cause unusual peaks and troughs before and after high water events, but this should have minimal effect on low-flow statistics (U.S. Geological Survey, 2022b).
-
Rahway River near Springfield, N.J., streamgage 01394500—Piedmont.—This streamgage has the second highest percent increase in most of the computed flow statistics for streamgages in the impacted and unregulated category. Historically, 1-day low-flow medians were generally greater than 10 ft3/s, and current period medians were generally greater than 15 ft3/s. When assessing all monthly changes, normalized increases in low flows were greater in this basin compared to most others within the study. These changes could be attributed to some of the same diversions and deactivation of groundwater pumping documented in this report for the Rahway River at Rahway, N.J., streamgage 01395000 (U.S. Geological Survey, 2022b). There is also occasional regulation by gates at several small ponds upstream on the West Branch Rahway River (U.S. Geological Survey, 2022c). Precipitation in this basin increased by nearly 75 mm per year, and land use changes reflect a minor increase in forest cover (16 to 17 percent) and a slight decrease in urban cover (82 to 80 percent) (Sullivan and Williams, 2025).
-
Neshanic River at Reaville, N.J., streamgage 01398000—Piedmont.—This streamgage was selected for further investigation because although the mean annual precipitation increased by nearly 100 mm, the 7Q10 decreased from 0.17 ft3/s (historical period) to 0 ft3/s (current period), but was a relatively small decrease (0.01 cubic feet per second per square mile [([ft3/s]/mi2)]) when normalized and compared to other assessed basins. This decrease in discharge may be a result of increased irrigation pumping in the mid to late 2000s, causing very low to zero flows (U.S. Geological Survey, 2022d). Another possible cause of this change may be the increase in urban area from 6 percent to 36 percent and a decrease in agricultural cover from 81 percent to 25 percent (Sullivan and Williams, 2025).
-
North Branch Raritan River near Far Hills, N.J., streamgage 01398500—Piedmont.—This streamgage had a considerable percent increase for the 7Q10 (214.3 percent), with low flows increasing from 1.4 ft3/s in the historical period to 4.4 ft3/s in the current period. The normalized difference (0.11 [ft3/s]/mi2) is also the third largest 7Q10 value across all basins. This change could be a result of flow being occasionally regulated by the operation of a waste gate that was added to the right side of the dam in the late 1990s to draw down the lake before major storms or for maintenance of the dam. Also, the crest of the dam was rebuilt in 2001 (U.S. Geological Survey, 2022e). Mean annual precipitation in this basin increased by more than 60 mm, and there was a minor decrease in forested and agricultural land use, offset by an increase in percent wetland from 0 to 5 percent (Sullivan and Williams, 2025).
-
Crosswicks Creek at Extonville, N.J., streamgage 01464500—Coastal Plain.— This streamgage example exhibited a negative percent change for many of the calculated statistics, despite a mean annual precipitation increase of nearly 100 mm. The 7Q10 had a considerable negative percent change (–39.1 percent), decreasing from 23 ft3/s in the historical period to 14 ft3/s in the current period, and a normalized difference of −0.11 [ft3/s]/mi2, the fourth greatest normalized decrease across all basins for 7Q10. The cause of the decrease in low-flow statistics is unclear; additional research may help to determine if increased development or combined changes to land use and effluent discharges over time may have contributed to this decrease. The classification of wetlands increased from 0 percent (historical period) to 17 percent (current period) within the basin (Sullivan and Williams, 2025).
Partial-Record Streamgages
The five partial-record streamgages that were selected for further evaluation based on their percent change between the historical and current periods were Black Brook near Meyersville, N.J., streamgage 01378900, Six Mile Run at Blackwells Mills, streamgage 01401900, Great Egg Harbor River tributary at Sicklerville, N.J., streamgage 01410787, Lockatong Creek near Raven Rock, N.J., streamgage 01460900, and Shipetaukin Creek at Bakersville, N.J., streamgage 01463670. Similar to the continuous-record streamgages mentioned above, no continuous water data are available in these basins; therefore, water use is not considered in the case studies for changes in low-flow statistics. Where available, U.S. Geological Survey water-year summaries were utilized for these streamgages to provide additional context about the surrounding landscape, geomorphology, and water management activities nearby. The MOVE.1 R code also contains output that measures the variability in measured flows about the MOVE.1 regression line not caused by systematic error or bias called the standard error of prediction (Colarullo and others, 2018). This value can assist in determining how well the MOVE.1 regression model performed.
-
Black Brook near Meyersville, N.J., streamgage 01378900—Piedmont.—This streamgage was selected because it documented a considerable percent change for all statistics of interest. For example, the June 1-day low-flow median was 0.2 ft3/s in the historical period and increased to 1.4 ft3/s in the current period, resulting in a 600 percent change. Also, the 7Q10 for the historical period was 0 ft3/s and increased to 0.1 ft3/s in the current period. When compared to other basins within the study, the normalized increases observed in March and April are some of the largest of all values. This streamgage is located in the Great Swamp National Wildlife Refuge, downstream of a reservoir called Osborn Pond. The water-year summaries for nearby continuous-record streamgages mention diversions from Osborn Pond by the Commonwealth Water Company, Bernards Division, were discontinued in April 1979, and the installation dismantled (U.S. Geological Survey, 2022f). This change could result in the increased statistics presented. Land use in this basin indicated a decrease in urban space from 31 to 16 percent and an increase in agriculture from 7 to 39 percent. Mean annual precipitation increased between the historical and current periods by nearly 50 mm, which may also contribute to the increased flow statistics (Sullivan and Williams, 2025).
-
Six Mile Run at Blackwells Mills, N.J., streamgage 01401900—Piedmont.—This streamgage had a considerable percent change for many of the statistics of interest. The largest percent change (275 percent) was for the 7Q10, increasing from 0.4 ft3/s in the historical period to 1.5 ft3/s in the current period. Like several other case studies, normalized differences did not reflect considerable increases when compared to the rest of the basins. The streamgage is located at a culvert on Canal Road that is directly upstream from the Delaware and Raritan Canal and 0.2 miles south of Blackwells Mills. Mean annual precipitation in this basin increased by almost 100 mm. Forest land use decreased from 80 to 62 percent, and both urban and wetland land use classifications increased from 0 to 8 percent.
-
Great Egg Harbor River tributary at Sicklerville, N.J., streamgage 01410787—Coastal Plain.—This streamgage had a negative low-flow percent change of greater than –20 percent for all statistics of interest. The 7Q10 had a percent change of –100 percent, meaning it decreased from 0.1 to 0 ft3/s between the historical and current periods. Because of the low value of the discharge, normalized values did not reflect considerable changes when compared to other basins. This streamgage is located 0.9 miles upstream from the intersection with the Great Egg Harbor River, 3.3 miles northeast of Williamstown. Land use change in this basin was substantial, with an increase in urban land from 0 to 46 percent, a decrease in forested land from 59 to 13 percent, and an increase in wetlands from 0 to 15 percent (Sullivan and Williams, 2025). Censored regression was performed on this streamgage owing to multiple measurements of zero flow. It had a standard error of prediction of 95.49 percent for the historical period and 98.68 percent for the current period. This may indicate a poor MOVE.1 regression model.
-
Lockatong Creek near Raven Rock, N.J., streamgage 01460900—Piedmont.—This is one example of a streamgage in which a majority (nine) of the statistics had a percent change of greater than 100 percent. Mean annual precipitation increased by more than 110 mm within the basin, which may be a contributing factor to the changes in flow. The October 1-day low-flow median had the highest percent change of 266.7 percent, increasing from 0.3 to 1.1 ft3/s. However, when compared with other basins, these normalized changes are not the largest increases within the overarching study. The streamgage is located at a bridge on State Route 29, 300 feet upstream from the intersection with the Delaware River and 1.1 miles east of Raven Rock (U.S. Geological Survey, 2011). This basin is heavily agricultural and forested, with an increase in forest land use from 17 to 33 percent, and a decrease in agricultural land use from 82 to 53 percent between the historical and current periods (Sullivan and Williams, 2025). Censored regression was performed on this streamgage owing to multiple measurements of zero flow. It had a standard error of prediction of 467.4 percent for the historical period and 216.2 percent for the current period. This may indicate a poor MOVE.1 regression model.
-
Shipetaukin Creek at Bakersville, streamgage 01463670—Piedmont.—This streamgage had considerable negative percent changes for the statistics assessed, particularly in the winter and spring months. The greatest percent changes were for the March and April 1-day low-flow medians, each with a –75.8 percent change. These changes are also reflected as the largest decreases when normalized at −1.01 (ft3/s)/mi2 for both March and April. This streamgage is in Bakersville, New Jersey at a bridge on Bakers Basin Road that was rebuilt in 2018. At this location, Shipetaukin Creek flows parallel to the Delaware and Raritan Canal, which is about 250 feet away. Though not included in this study, the nearest continuous-record streamgage is Assunpink Creek near Clarksville (01463620), which is 2 miles upstream from Shipetaukin Creek. The water-year summary for this continuous-record streamgage mentions some regulations from ponds upstream and diversions for irrigation upstream (U.S. Geological Survey, 2022g). The mean annual precipitation in this basin increased more than 85 mm between the two time periods. Several changes in land use occurred, including an increase in urban area (17 to 30 percent), a decrease in agricultural area (55 to 36 percent), and an increase in wetlands (6 to 20 percent) (Sullivan and Williams, 2025).
Summary and Conclusion
In this study, differences in low flow were compared between 30-year historical and current periods. The Paired Wilcoxon Signed-Rank Test results indicated that continuous-record streamgages had a statistically significant change in distribution between the two time periods for the January, February, June, September, and December 1-day monthly low-flow medians, and the September monthly median. The largest changes, both positive and negative, were observed above the Fall Line. Increases in streamflow were larger and more prevalent in January, February, and December compared to June and September. These seasonal differences could be attributed to increased precipitation in December and January, possibly contributing to snowmelt occurrence in February. However, despite increases in precipitation in June and September, other factors may have contributed to the decrease in flow values such as increased water use (the third and fifth highest water use by month out of the monthly summaries within the current period, respectively) or potential changes in management actions. A majority of southern New Jersey continuous-record streamgages exhibited decreases in most evaluated statistics. This is highlighted in normalized average changes, which were negative across all statistics within the Coastal Plain province, including the September median (−0.136 cubic feet per second per square mile ([ft3/s]/mi2) which was the greatest change across all provinces. However, similar to what was found in McHugh and others (2024), changes were not uniform across the state. A multitude of considerable percent changes were documented in the Piedmont, including some changes related to relatively small discharge values. When evaluating normalized differences, the largest average change for the annual 7-day low flow with a 10-percent annual nonexceedance probability (7Q10) among the four physiographic provinces occurred in the Piedmont with a difference of 0.045 (ft3/s)/mi2. Among all provinces, the Valley and Ridge had the largest average normalized change for the January and February 1-day low-flow median, with a difference of 0.291 and 0.176 (ft3/s)/mi2, respectively. Many continuous-record streamgages experienced changes in upstream water management or infrastructure. Some negative changes may be attributed to land use changes, resulting in the diversion of water for uses such as irrigation.
Partial-record streamgages indicated no statistically significant differences in data distribution, but there were some considerable percent changes between the time periods. Some of these variabilities may have been caused by local geomorphic and land use changes including urbanization and agriculture. Other changes may be owing to differences in available data in each period, which can influence the skill of the regressions.
Environmental variables explored in this study included land use, water use, and precipitation changes. Land use datasets had to be generalized to compare the historical and current period snapshots, but flow statistics at individual streamgages may be reflective of local landscape changes, especially in areas that experienced increases in irrigation. Some considerable changes were identified, but no clear correlation was found between basin-wide land use categories and changes in streamflow. Although there was no statistical significance to changes in water use or precipitation, mean increases in both characteristics were found across the state. Water use assessments may be more accurate in studies from 2003 and beyond based on the change in the New Jersey water use database. Additional research may clarify how an increase in precipitation affects the relationship between flow statistics and potential changes in climate. Even basins that indicated a decrease in flow statistics had an increase in precipitation between the two time periods.
Results from this report can be used to better understand the changing status of low streamflows across the state, and what that may mean for drinking water resources.
References Cited
Charles, E.G., and Nicholson, R.S., 2012, Simulation of groundwater flow and hydrologic effects of groundwater withdrawals from the Kirkwood-Cohansey aquifer system in the Pinelands of southern New Jersey: U.S. Geological Survey Scientific Investigations Report 2012–5122, 219 p., accessed July 14, 2025, at https://doi.org/10.3133/sir20125122.
Colarullo, S.J., Sullivan, S.L., and McHugh, A.R., 2018, Implementation of MOVE.1, censored MOVE.1, and piecewise MOVE.1 low-flow regressions with applications at partial-record streamgaging stations in New Jersey: U.S. Geological Survey Open-File Report 2018–1089, 20 p., accessed May 4, 2023, at https://pubs.er.usgs.gov/publication/ofr20181089.
Delaware River Basin Commission, 2024a, An overview of drought in the Delaware River Basin: Delaware River Basin Commission, [21 p.], accessed October 17, 2024, at https://www.nj.gov/drbc/library/documents/drought/DRBdrought-overview_feb2019.pdf.
Delaware River Basin Commission, 2024b, Flexible flow management program—Performance report June 1, 2023–May 31, 2024: Trenton, N.J., Delaware River Basin Commission, prepared by Delaware River Basin Commission staff, [33 p.], accessed July 14, 2025, at https://nj.gov/drbc/library/documents/FFMP/FFMP_PerfRpt_june2023_may2024.pdf.
Dewitz, J., and U.S. Geological Survey, 2021, National Land Cover Database (NLCD) 2019 products (ver. 2.0, June 2021): U.S. Geological Survey data release, https://doi.org/10.5066/P9KZCM54.
Domber, S., Snook, I., and Hoffman, J.L., 2013, Using the stream low flow margin method to assess water availability in New Jersey’s water-table-aquifer systems: New Jersey Geological and Water Survey Technical Memorandum 13–3, 70 p., accessed November 4, 2022, at https://www.state.nj.us/dep/njgs/pricelst/tmemo/tm13-3.pdf.
Dudley, R.W., Hirsch, R.M., Archfield, S.A., Blum, A.G., and Renard, B., 2020, Low streamflow trends at human-impacted and reference basins in the United States: Journal of Hydrology, v. 580, 124254, accessed July 30, 2025, at 10.1016/j.jhydrol.2019.124254.
Environmental Systems Research Institute, Inc., [Esri], 2022, ArcGIS Pro version 3.0, Redlands, California.
Federal Highway Administration, 2024, Post-1945 highway bridge engineering: Federal Highway Administration web page, accessed October 17, 2024, at https://www.environment.fhwa.dot.gov/env_topics/historic_pres/post1945_engineering/postwar.aspx.
Georgescu, M., Broadbent, A.M., Wang, M., Krayenhoff, E.S., and Moustaoui, M., 2021, Precipitation response to climate change and urban development over the continental United States: Environmental Research Letters, v. 16, no. 4, article 044001, 16 p., accessed April 14, 2022, at https://doi.org/10.1088/1748-9326/abd8ac.
Giri, S., Lathrop, R.G., and Obropta, C.C., 2020, Climate change vulnerability assessment and adaptation strategies through best management practices: Journal of Hydrology, v. 580, 124311, accessed April 14, 2022, at 10.1016/j.jhydrol.2019.124311.
Helsel, D.R., Hirsch, R.M., Ryberg, K.R., Archfield, S.A., and Gilroy, E.J., 2020, Statistical methods in water resources: U.S. Geological Survey Techniques and Methods, book 4, chap. A3, 458 p., accessed March 23, 2022, at https://doi.org/10.3133/tm4A3. [Supersedes USGS Techniques of Water-Resources Investigations, book 4, chap. A3, version 1.1.]
Hirsch, R.M., 1982, A comparison of four streamflow regression techniques: Water Resources Research, v. 18, no. 4, p. 1081–1088, accessed December 2, 2022, at 10.1029/WR018i004p01081.
Kiang, J.E., Flynn, K.M., Zhai, T., Hummel, P., and Granato, G.E., 2018, SWToolbox—A surface-water tool-box for statistical analysis of streamflow time series: U.S. Geological Survey Techniques and Methods, book 4, chap. A11, 34 p., accessed November 21, 2022, at https://pubs.er.usgs.gov/publication/tm4A11.
McHugh, A.R., Suro, T.P., Sullivan, S.L., and Williams, B.M., 2024, Streamflow characteristics and trends in New Jersey, water years 1903–2017: U.S. Geological Survey Scientific Investigations Report 2024–5099, 59 p., accessed December 13, 2024, at https://doi.org/10.3133/sir20245099.
Mitchell, W.B., Guptill, S.C., Anderson, K.E., Fegeas, R.G., and Hallam, C.A., 1977, GIRAS; a geographic information retrieval and analysis system for handling land use and land cover data: U.S. Geological Survey Professional Paper, v. 1059, accessed March 22, 2023, at 10.3133/pp1059.
NJDEP, 1998, Surficial Aquifers of New Jersey, Series DGS98-5, Edition 20050810: New Jersey Department of Environmental Protection, accessed January 8, 2025, at https://gisdata-njdep.opendata.arcgis.com/datasets/njdep:surficial-aquifers-in-new-jersey/about.
NJDEP, 2002, Physiographic Provinces of New Jersey, accessed April 14, 2022, at https://gisdata-njdep.opendata.arcgis.com/datasets/20377d0dc1fe41f1ab2d9d0897844441_20/about.
NJDEP, 2011, Guidance Manual: Estimating the Safe Yield of Surface Water Supply Reservoir Systems, accessed July 14, 2025, at https://www.nj.gov/dep/watersupply/pdf/safe-yield-manual.pdf.
NJDEP, 2017, New Jersey Water Supply Plan 2017–2022: New Jersey Department of Environmental Protection web page, 93 p., 8 app., accessed November 4, 2022, at https://www.nj.gov/dep/watersupply/wsp.html.
New Jersey Department of Environmental Protection Division of Water Supply and Geoscience, 2022, New Jersey water transfer model withdrawal, use, and return data summaries (updated October 27, 2022): New Jersey Geological Survey Digital Geodata Series DGS10-3, accessed November 4, 2022, at https://dep.nj.gov/njgws/digital-data/dgs-10-3/.
New Jersey Department of Environmental Protection, Office of Information Resources Management, Bureau of Geographic Information Systems, 2023, New Jersey Environmental Management System (NJEMS) Sites (Envr_NJEMS_site): New Jersey Department of Environmental Protection, accessed January 16, 2023, at https://www.nj.gov/dep/gis/digidownload/metadata/html/Envr_NJEMS_site.html.
New Jersey Geological Survey, 2003, Physiographic provinces of New Jersey: New Jersey Geological Survey Information Circular, accessed November 4, 2022, at https://dep.nj.gov/wp-content/uploads/bfbm/provinces.pdf.
New Jersey Government, 2022, Municipal plan for flood control facilities, section 58–16A–68 of Waters and water supply: New Jersey Revised Statutes, title 58, accessed January 16, 2023, at https://law.justia.com/codes/new-jersey/2022/title-58/section-58-16a-68/.
PRISM Climate Group, 2022, PRISM climate data: Oregon State University, accessed November 4, 2022, at https://prism.oregonstate.edu.
R Core Team, 2022. R—A language and environment for statistical computing: R Foundation for Statistical Computing, Vienna, Austria, accessed November 21, 2022, at https://www.R-project.org/.
Riggs, H.C., 1972, Low-flow investigations: U.S. Geological Survey Techniques of Water-Resources Investigations, book 4, chap. B1, accessed April 14, 2022, at https://pubs.usgs.gov/twri/twri4b1/pdf/twri_4-B1_a.pdf.
Rush, W.D., Kiehl, J.T., Shields, C.A. and Zachos, J.C., 2021, Increased frequency of extreme precipitation events in the North Atlantic during the PETM—Observations and theory: Palaeogeography, Palaeoclimatology, Palaeoecology, v. 568, no. 2, article 110289, 8 p., accessed March 4, 2024, at https://doi.org/10.1016/j.palaeo.2021.110289.
Stanford, S.D., Witte, R.W., and Harper, D.P., Digital compilation by Scott, M.C. and Herman, G.C., 1996, Glacial Sediments of New Jersey: N.J. Geological Survey Digital Geodata Series DGS 96-1, 1:100,000 scale, accessed February 4, 2025, at https://www.nj.gov/dep/njgs/geodata/dgs96-1.htm.
State of New Jersey, 2022, S.B. 790, 220th Legislature: Senate Bill No. 790, accessed January 6, 2023, at https://pub.njleg.gov/bills/2022/S1000/790_I1.HTM.
Sullivan, S.L., and Williams, B.M., 2025, Statistical Streamflow Comparison of Current (1990-2019) and Historic (1950-1979) 30-Year Periods for Selected Streams in New Jersey: U.S. Geological Survey data release, https://doi.org/10.5066/P1WZKPJX.
Tetzlaff, D., Seibert, J., McGuire, K.J., Laudon, H., Burns, D.A., Dunn, S.M., and Soulsby, C., 2009, How does landscape structure influence catchment transit time across different geomorphic provinces?: Hydrological Processes, v. 23, no. 6, p. 945–953, accessed March 4, 2024, at https://doi.org/10.1002/hyp.7240.
U.S. Census Bureau, 2022, TIGER/Line Shapefiles, 2021, accessed February 2, 2022, at https://www2.census.gov/geo/tiger/TIGER2021/STATE/.
U.S. Census Bureau, 2023, Population Estimates: U.S. Department of Commerce, accessed April 16, 2023, at https://data.census.gov/.
U.S. Environmental Protection Agency and U.S. Geological Survey, 2012, National Hydrography Dataset Plus- NHDPlus Version 2.1, accessed February 2, 2022 from https://www.epa.gov/waterdata/nhdplus-mid-atlantic-data-vector-processing-unit-02.
U.S. Environmental Protection Agency, 2013, Level III and IV ecoregions of the continental United States: Corvallis, Oregon, U.S. EPA, National Health and Environmental Effects Research Laboratory, map scale 1:3,000,000, accessed April 16, 2023, at https://www.epa.gov/eco-research/level-iii-and-iv-ecoregions-continental-united-states.
U.S. Geological Survey, 2000, National Land Cover Database (NLCD) 1992 Land Cover Conterminous United States: U.S. Geological Survey data release, https://doi.org/10.5066/P92G34R9.
U.S. Geological Survey, 2006, U.S. Geological Survey Water-Data Report 2006: 01443500 PAULINS KILL AT BLAIRSTOWN, NJ, accessed February 12, 2025, at https://wdr.water.usgs.gov/wy2006/pdfs/01443500.2006.pdf?1739392633920.
U.S. Geological Survey, 2011, USGS 01460900 Lockatong Creek near Raven Rock NJ, in USGS water-resources data for the United States, accessed February 12, 2022, at https://wdr.water.usgs.gov/allsearch.php. [Site information directly accessible at https://wdr.water.usgs.gov/wy2011/pdfs/01460900.2011.pdf.]
U.S. Geological Survey, 2019, StreamStats: U.S. Geological Survey database, accessed September 10, 2022, at https://streamstats.usgs.gov/ss/.
U.S. Geological Survey, 2022a, USGS water data for the Nation: U.S. Geological Survey National Water Information System database, accessed February 12, 2022, at http://doi.org/10.5066/F7P55KJN.
U.S. Geological Survey, 2022b, USGS 01395000 Rahway River at Rahway NJ, in USGS water data for the Nation: U.S. Geological Survey National Water Information System database, accessed February 12, 2022, at https://doi.org/10.5066/F7P55KJN. [Site information directly accessible at https://waterdata.usgs.gov/monitoring-location/01395000/.]
U.S. Geological Survey, 2022c, USGS 01394500 Rahway River near Springfield NJ, in USGS water data for the Nation: U.S. Geological Survey National Water Information System database, accessed February 12, 2022, at https://doi.org/10.5066/F7P55KJN. [Site information directly accessible at https://waterdata.usgs.gov/monitoring-location/01394500/.]
U.S. Geological Survey, 2022d, USGS 01398000 Neshanic River at Reaville NJ, in USGS water data for the Nation: U.S. Geological Survey National Water Information System database, accessed February 12, 2022, at https://doi.org/10.5066/F7P55KJN. [Site information directly accessible at https://waterdata.usgs.gov/monitoring-location/01398000/.]
U.S. Geological Survey, 2022e, USGS 01398500 North Branch Raritan River near Far Hills NJ, in USGS water data for the Nation: U.S. Geological Survey National Water Information System database, accessed February 12, 2022, at https://doi.org/10.5066/F7P55KJN. [Site information directly accessible at https://waterdata.usgs.gov/monitoring-location/01398500/.]
U.S. Geological Survey, 2022f, USGS 01379000 Passaic River near Millington NJ, in USGS water data for the Nation: U.S. Geological Survey National Water Information System database, accessed February 12, 2022, at https://doi.org/10.5066/F7P55KJN. [Site information directly accessible at https://waterdata.usgs.gov/monitoring-location/01379000/.]
U.S. Geological Survey, 2022g, USGS 01463620 Assunpink Creek near Clarksville NJ, in USGS water data for the Nation: U.S. Geological Survey National Water Information System database, accessed February 12, 2022, at https://doi.org/10.5066/F7P55KJN. [Site information directly accessible at https://waterdata.usgs.gov/monitoring-location/01463620/.]
Watson, K.M., Reiser, R.G., Nieswand, S.P., and Schopp, R.D., 2005, Streamflow characteristics and trends in New Jersey, water years 1897–2003: U.S. Geological Survey Scientific Investigations Report 2005–5105, 131 p., accessed November 4, 2022, at https://doi.org/10.3133/sir20055105.
Williams, B.M., McHugh, A.R., Sullivan, S.L., and Hopple, J.A., 2024, Streamflow characteristics and trends at continuous-record and partial-record streamflow-gaging stations in New Jersey, water years 1903-2017: U.S. Geological Survey data release, https://doi.org/10.5066/P9IGMJGU.
Zapecza, O.S., Voronin, L.M., and Martin, M., 1987, Ground-water-withdrawal and water-level data used to simulate regional flow in the major coastal plain aquifers of New Jersey: U.S. Geological Survey Water-Resources Investigations Report 87–4038, 120 p. [Also available at https://pubs.usgs.gov/wri/1987/4038/report.pdf.]
Conversion Factors
U.S. customary units to International System of Units
| Multiply | By | To obtain |
|---|---|---|
| inch (in.) | 2.54 | centimeter (cm) |
| inch (in.) | 25.4 | millimeter (mm) |
| foot (ft) | 0.3048 | meter (m) |
| mile (mi) | 1.609 | kilometer (km) |
| mile, nautical (nmi) | 1.852 | kilometer (km) |
| cubic foot per second (ft3/s) | 0.02832 | cubic meter per second (m3/s) |
| cubic foot per second per square mile ([ft3/s]/mi2) | 0.01093 | cubic meter per second per square kilometer ([m3/s]/km2) |
| inch per year (in/yr) | 25.4 | millimeter per year (mm/yr) |
International System of Units to U.S. customary units
| Multiply | By | To obtain |
|---|---|---|
| centimeter (cm) | 0.3937 | inch (in.) |
| millimeter (mm) | 0.03937 | inch (in.) |
| meter (m) | 3.281 | foot (ft) |
| kilometer (km) | 0.6214 | mile (mi) |
| kilometer (km) | 0.5400 | mile, nautical (nmi) |
| cubic meter per second (m3/s) | 35.31 | cubic foot per second (ft3/s) |
| cubic meter per second per square kilometer ([m3/s]/km2) | 91.49 | cubic foot per second per square mile ([ft3/s]/mi2) |
| millimeter per year (mm/yr) | 0.03937 | inch per year (in/yr) |
Temperature in degrees Celsius (°C) may be converted to degrees Fahrenheit (°F) as follows:
°F = (1.8 × °C) + 32.
Temperature in degrees Fahrenheit (°F) may be converted to degrees Celsius (°C) as follows:
°C = (°F – 32) / 1.8.
Datums
Vertical coordinate information is referenced to the North American Vertical Datum of 1988 (NAVD 88).
Horizontal coordinate information is referenced to the North American Datum of 1983 (NAD 83).
Altitude, as used in this report, refers to distance above the vertical datum.
Supplemental Information
Concentrations of chemical constituents in water are in either milligrams per liter (mg/L) or micrograms per liter (µg/L).
A water year is the 12-month period from October 1 through September 30 of the following year and is designated by the calendar year in which it ends.
Abbreviations
7Q10
annual 7-day low flow with a 10-percent annual nonexceedance probability
GIRAS
Geographic Information and Retrieval Analysis
LFM
low-flow margin
MOVE.1
Maintenance of Variance Extension, Type 1
MK
Mann-Kendall trend test
NJDEP
New Jersey Department of Environmental Protection
NLCD
National Land Cover Dataset
For more information about this report, contact:
Director, New Jersey Water Science Center
U.S. Geological Survey
3450 Princeton Pike, Suite 110
Lawrenceville, NJ 08648
or visit our website at
https://www.usgs.gov/centers/new-jersey-water-science-center
Publishing support provided by the Baltimore Publishing Service Center.
Disclaimers
Any use of trade, firm, or product names is for descriptive purposes only and does not imply endorsement by the U.S. Government.
Although this information product, for the most part, is in the public domain, it also may contain copyrighted materials as noted in the text. Permission to reproduce copyrighted items must be secured from the copyright owner.
Suggested Citation
Williams, B.M., Sullivan, S.L., Suro, T.P., Collenburg, J.V., McHugh, A.R., and Shourds, J.L., 2025, Statistical streamflow comparison of current and historical 30-year periods for selected streams in New Jersey: U.S. Geological Survey Scientific Investigations Report 2025–5061, 40 p., https://doi.org/10.3133/sir20255061.
ISSN: 2328-0328 (online)
Study Area
| Publication type | Report |
|---|---|
| Publication Subtype | USGS Numbered Series |
| Title | Statistical streamflow comparison of current and historical 30-year periods for selected streams in New Jersey |
| Series title | Scientific Investigations Report |
| Series number | 2025-5061 |
| DOI | 10.3133/sir20255061 |
| Publication Date | November 18, 2025 |
| Year Published | 2025 |
| Language | English |
| Publisher | U.S. Geological Survey |
| Publisher location | Reston, VA |
| Contributing office(s) | New Jersey Water Science Center |
| Description | Report, ix, 40 p.; 2 Data Releases |
| Country | United States |
| State | New Jersey |
| Online Only (Y/N) | Y |