

An Evaluation of the Effects of Different Deicing Salt Application Rates on Three Watersheds in Essex County, New York
Links
- Document: Report (6.66 MB pdf) , HTML , XML
- Data Releases:
- USGS data release - Chloride regression model and mass balance for different deicing salt application rates on three watersheds in Essex County, New York
- USGS data release - Frequency domain electromagnetic induction (FDEM) geophysical data collected near Lake Placid, NY
- NGMDB Index Page: National Geologic Map Database Index Page
- Download citation as: RIS | Dublin Core
Acknowledgments
We thank Joe Thompson, Kristina Crowley, and Carl Kochersberger of the New York State Department of Transportation for coordination of the pilot demonstration including monitoring-well installation and surveying.
The support of the following individuals during field-data collection is greatly appreciated: Alton Anderson, of the U.S. Geological Survey, and Adam Baldwin and Isabella Lucia, formerly of the U.S. Geological Survey.
Abstract
The U.S. Geological Survey, in cooperation with the New York State Department of Transportation, evaluated the effects of different deicing salt application rates on surface water, groundwater, and highway runoff quality near State highways in northern New York. Three reaches of State highways were tested with different deicing treatments between October 2019 and November 2022: a salt-sand mixture (Treatment A), a salt mixture applied at a lower rate (Treatment B), and a control mixture consistent with typical deicing salt amounts and application rates. Data on pavement conditions and the quality of surface water, highway runoff, and groundwater were collected. Surface electromagnetic data were also collected. Surface-water and groundwater quality downgradient from the State highways were compared with water quality at upgradient locations. The percentage of snow or ice coverage was used to evaluate the effectiveness of the salt applications.
This report provides an overview of the transport of deicing salt. The Treatment B watershed had deicing mixture applied more frequently than other highway reaches, which caused it to have the highest annual total chloride application. Despite differences in chloride application, flow-weighted mean chloride concentrations in highway runoff were comparable across treatments. Chloride concentrations were elevated in surface water and groundwater downgradient from highways relative to chloride concentrations upgradient from highways. A chloride mass balance, calculated for one treatment watershed, indicated that groundwater affected by legacy deicing practices may be contributing additional chloride to surface water. Spatial patterns from electromagnetic surveys show a shallow saline plume alongside the highway in that area.
Differences in winter severity and pavement-surface conditions drove deicing salt applications in the treatment areas. This study found that several factors affect chloride loads in the watersheds, including variable winter conditions, adaptive snow and ice management, legacy management practices, and area-specific aquifer and groundwater conditions.
Introduction
The use of road deicing chemicals became widespread in New York in the 1950s and has risen substantially since then (Kostick, 1993; Bolen, 2021). Deicing chemicals are primarily composed of sodium chloride and less commonly calcium chloride, magnesium chloride, or potassium chloride. Deicing may be achieved with mixtures of deicing salts and an abrasive material, such as sand, or with deicing salts alone. Although deicing salts effectively increase travel safety during winter months, the use of deicing salts on paved surfaces has led to undesirable environmental impacts. For example, deicing salts may increase the corrosivity of surface water and groundwater (Stets and others, 2017; Pieper and others, 2018), create conditions that are toxic to sensitive species (Corsi and others, 2010; Harless and others, 2011; Brady and others, 2022), and mobilize metals from soils that could cause an exposure that is harmful to human health (McNaboe and others, 2017; Wilhelm and others, 2019).
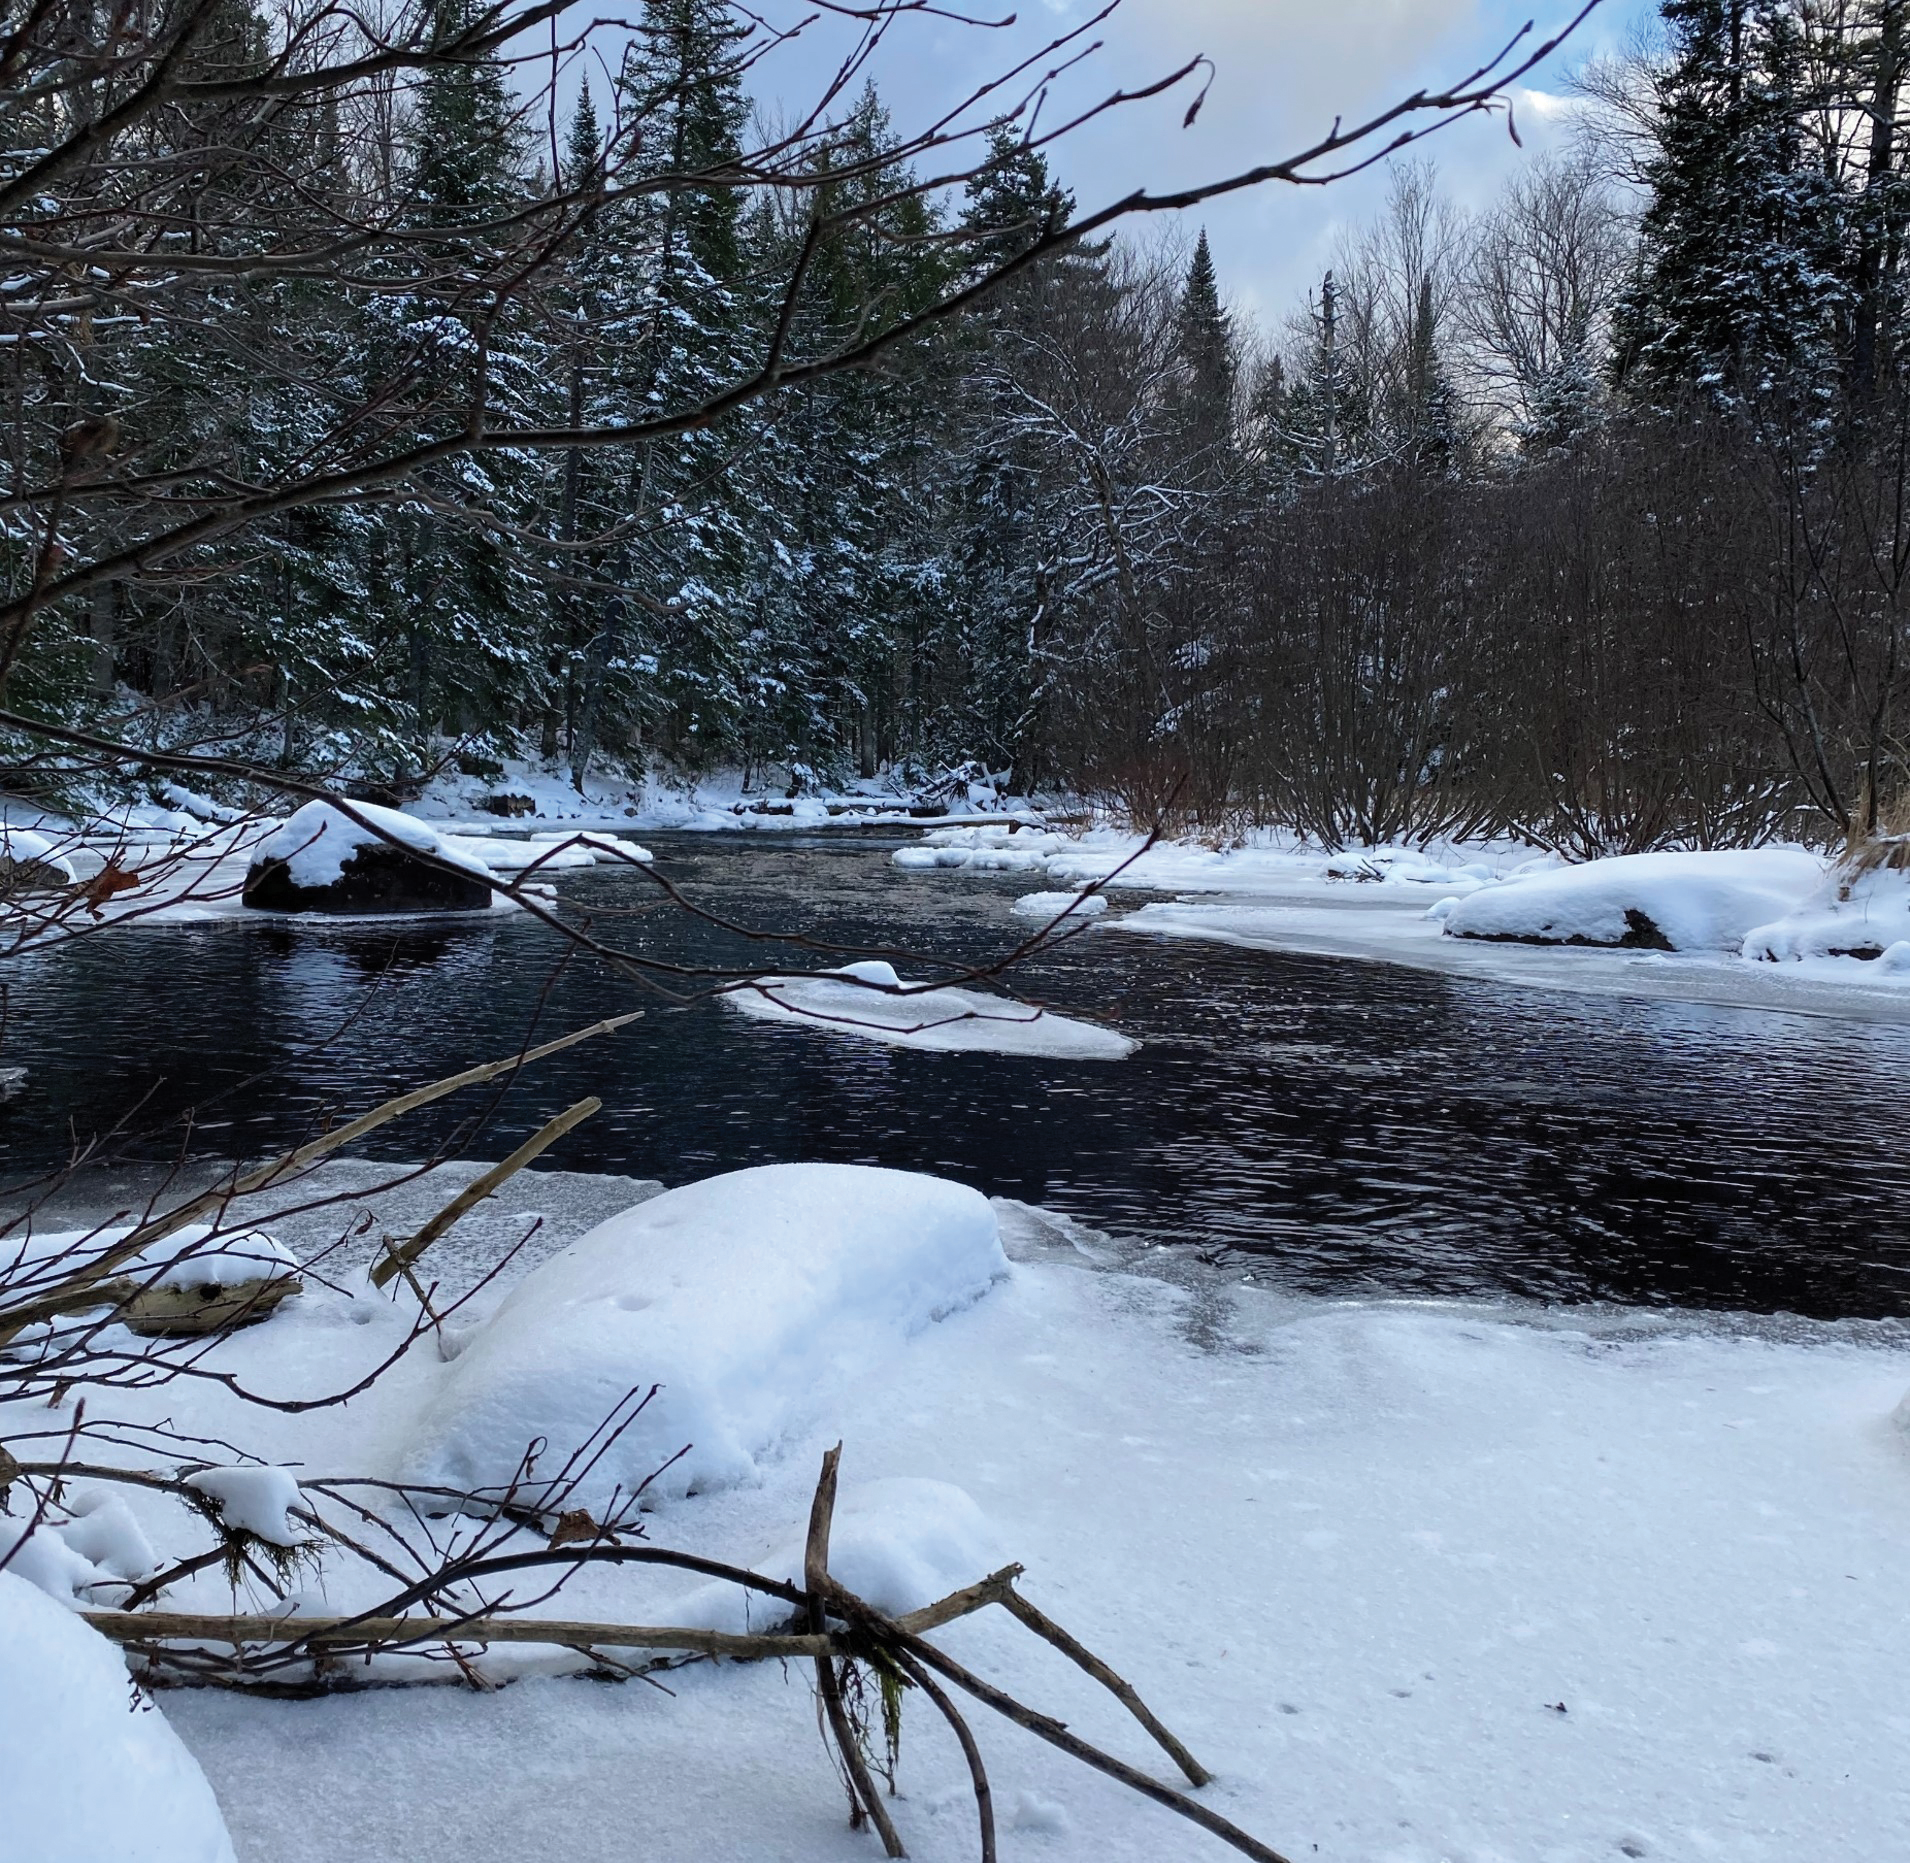
The Chubb River in Essex County, New York. Photograph by Natasha Scavotto, U.S. Geological Survey.
New York is the top consumer of rock salt in the United States (Bolen, 2021). In northern New York, as much as 50,000 tons of deicer may be purchased annually for road application in Essex County alone (New York State Office of General Services, 2023). Salinization of surface waters has been recognized for decades in Essex County and other areas in the Adirondack Park of New York. Demers and Sage (1990) documented increased chloride concentrations in surface waters downstream from State highways relative to upstream surface waters in the central Adirondack Mountains in the 1980s. Sodium chloride concentrations have increased nearly 30-fold since 1940 in Lake George, an increase attributed primarily to deicing salt use in the watershed (Swinton and others, 2014; Sutherland and others, 2018). Chloride concentrations in lakes throughout the Adirondack Park are positively correlated with paved road density (Kelting and others, 2012). A reduction in spring mixing in Mirror Lake was attributed to road salt runoff near Lake Placid, N.Y. (Wiltse and others, 2019). In response to the pronounced environmental impacts from road salt application throughout the Adirondack Park, New York enacted the “Randy Preston road salt reduction act” in 2020 (New York State Legislature, 2020). The act established the Adirondack Road Salt Reduction Task Force to conduct a comprehensive review of road salt contamination and best management practices within the Adirondack Park, and to make recommendations to reduce road salt use and associated environmental and public health impacts (New York State Department of Environmental Conservation and New York State Department of Transportation, 2023).
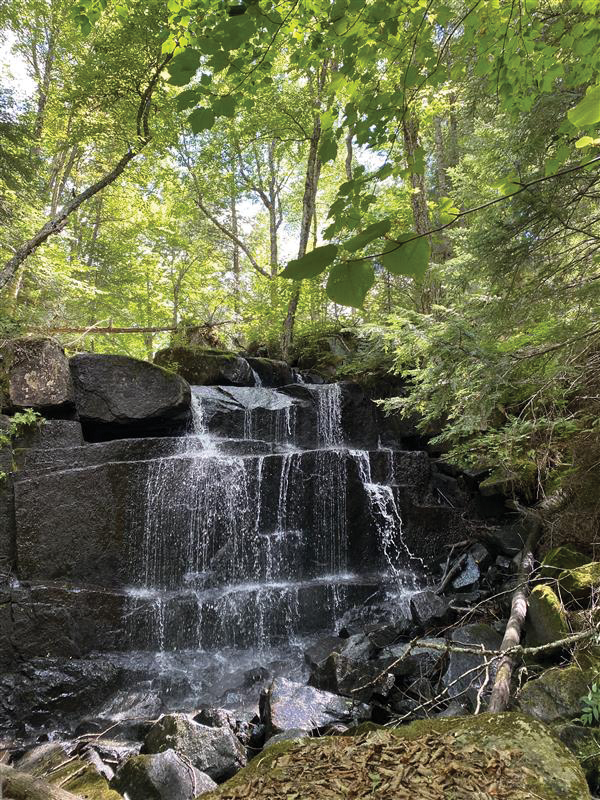
A waterfall at the Treatment A upstream surface water station in Essex County, New York. Photograph by Natasha Scavotto, U.S. Geological Survey.
Purpose and Scope
To explore the potential to reduce deicing salt impacts to water resources in New York, the New York State Department of Transportation (NYSDOT) evaluated different treatments for roadway deicing in the Adirondack Park from 2019 to 2022. The U.S. Geological Survey (USGS), in cooperation with the NYSDOT, investigated the effects of the different treatments on the quality of highway runoff, surface water, and groundwater in Essex County, N.Y. Three reaches of New York State Route 73 and New York State Route 86 were used in the study: two experimental treatment areas (Treatment A and Treatment B) and a control treatment area. Three watersheds that cross the highway reaches were included in the study area (fig. 1).
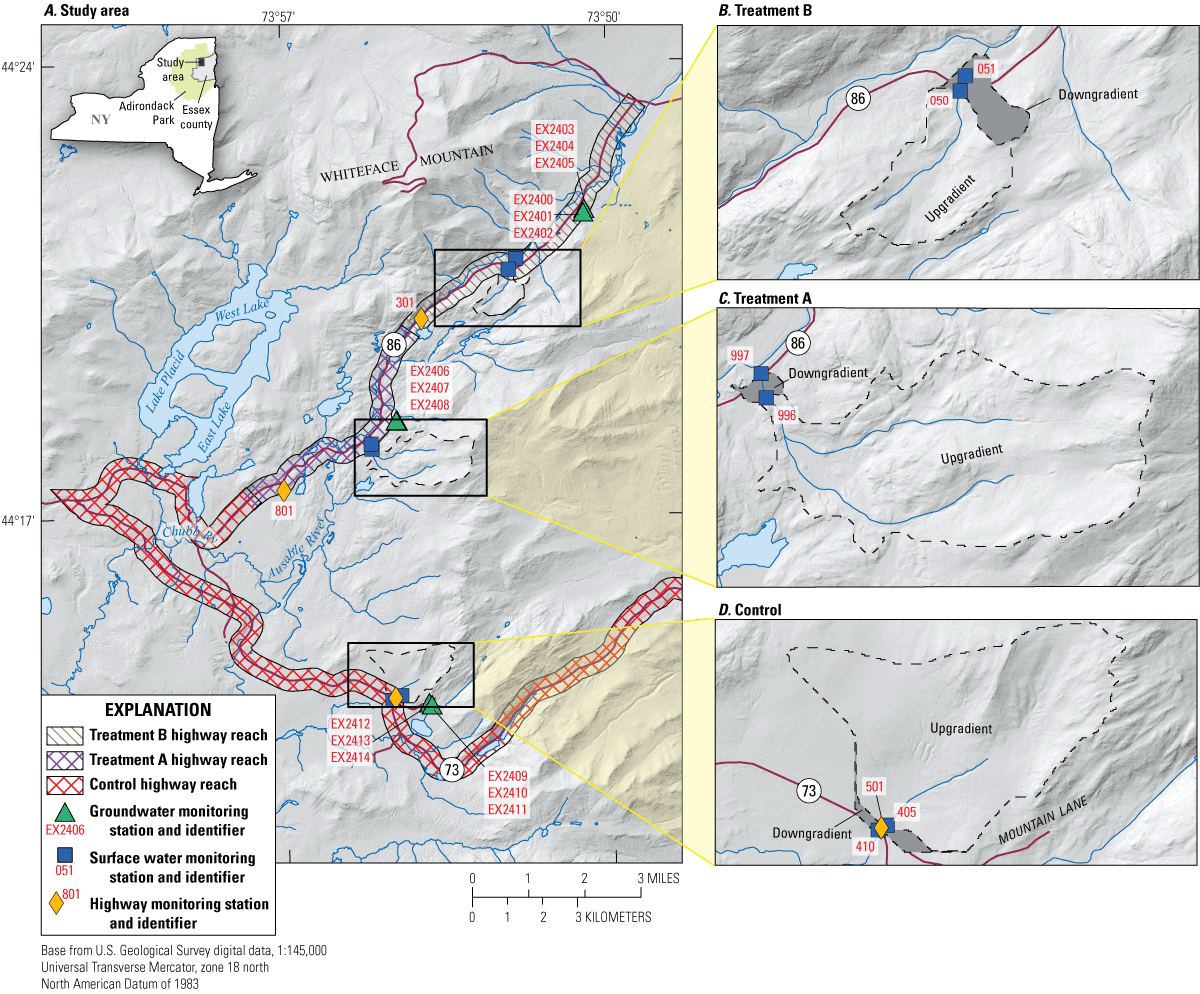
A, map showing locations of treatment watersheds and treated sections of New York State Routes 73 and 86 in Essex County, New York, and inset maps showing surface water sites for the B, Treatment B highway reach, C, Treatment A highway reach, and D, control highway reach. Surface water and highway monitoring stations are designated by the last three digits of their identification numbers (tables 1 and 2). Refer to table 3 for groundwater monitoring station information. Data from U.S. Geological Survey (2023).
The purpose of this report was to compare the effectiveness of different deicing salt application rates to highway pavement conditions and highway runoff quality and to determine if reductions in deicing salt application rates resulted in reduced chloride loading to surface water and groundwater within the Adirondack Park. The findings presented in this report may be used to evaluate the effectiveness of alternatives to traditional snow and ice management practices (that is, abrasives or lower salt application rates) on the reduction of chloride loading to surface water and groundwater. Results of this study show that chloride transport is dynamic, and chloride transport depends on many interacting factors like hydrology, geology, weather conditions, and snow and ice management practices. The results could be used by resource managers to plan snow and ice management strategies within the Adirondack Park in New York and in other snowy regions in North America.
Description of Study Area
The study area encompasses three sections of highway in Essex County. The study area is within the Adirondack Park, which is a wilderness area and National Historic Landmark protecting the Adirondack Mountains in northern New York (Bradford, 1963). Two selected highway sections were on New York State Route 86, near Lake Placid and Whiteface Mountain, N.Y., and the third was on New York State Route 73 east of Lake Placid, N.Y. (fig. 1). The watersheds around these highway sections are headwater tributaries to the West Branch Ausable River, which is a primary tributary to the Ausable River and the Lake Champlain watersheds (Lake Champlain is outside of the study area and is not shown on any figure). The Ausable River and Lake Champlain are both recreational and ecological resources in the Adirondack Park (fig. 1).
In this study, the three watersheds that cross the State highways were divided into subwatersheds upstream from and downstream from the highway intersection points. The drainage area of the downgradient area for each study watershed ranges from 0.51 to 1.32 square miles. The control watershed, in addition to crossing Route 73, also contains a total of 782 feet (ft) of town roads. The other lane miles across all watersheds (table 1) are under the jurisdiction of the NYSDOT. A lane mile is a unit of measurement that defines the road surface area and is determined by multiplying the centerline length of a roadway, in miles, by the number of lanes. Routes 86 and 73 are the only east-west highways in “the High Peaks” area of the Adirondack Park (an area comprising 46 summits in the central part of the park). These routes facilitate transport from various villages or hamlets to popular tourist destinations, such as Lake Placid and Whiteface Mountain.
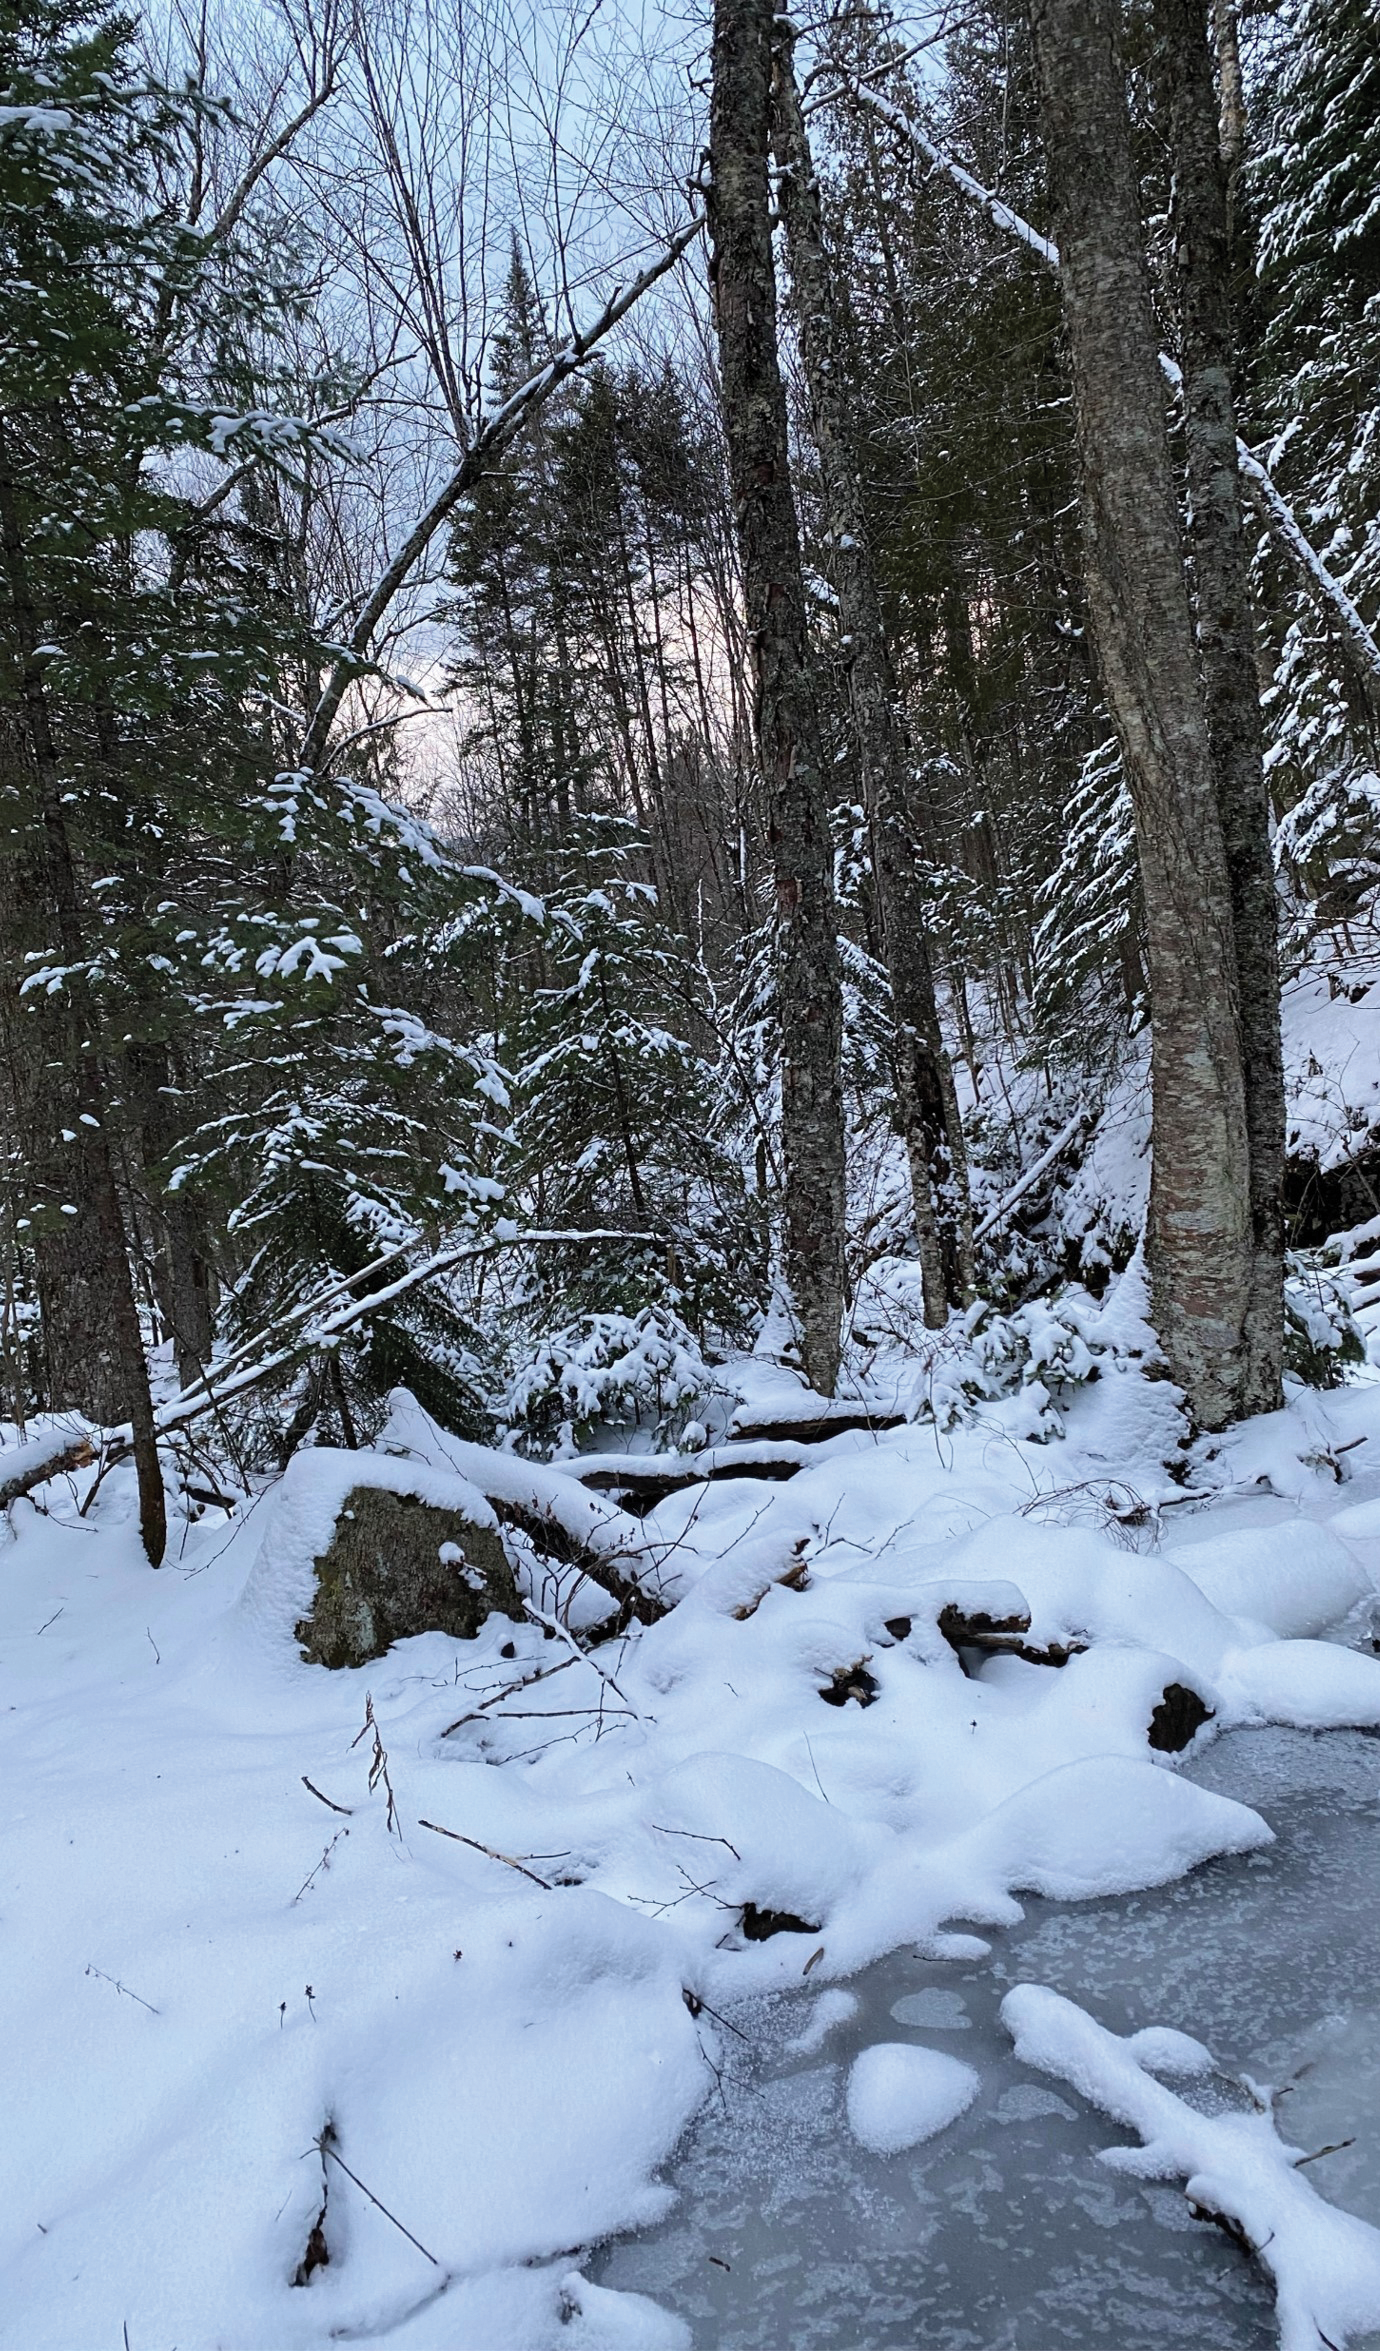
A snow-covered landscape at the Treatment A upstream surface water station in Essex County, New York. Photograph by Natasha Scavotto, U.S. Geological Survey.
Table 1.
Surface water quality monitoring stations upstream and downstream from New York State Routes 73 and 86, Essex County, New York.[Drainage area, stream length, and percent impervious surface area derived from U.S. Geological Survey (2019). Site information from U.S. Geological Survey (2023). Road lengths from New York State Office of Information Technology Services (2023). USGS, U.S. Geological Survey; mi2, square mile; ft, foot; NY, New York]
Land use in the study area is primarily forested (94 to 98 percent), and less than 2 percent of the total area of the watersheds is classified as developed lands with low impervious surface cover (impervious surface area was typically less than 0.15 percent of total drainage areas; USGS, 2019). In 2020, Essex County had a population density of 20.8 persons per square mile and a total population of 37,381 (U.S. Census Bureau, 2022). Residents of Essex County rely on surface water and groundwater for drinking water. Mean annual precipitation and snow totals between 1980 and 2022 were 42.35 inches (in) and 105.4 in, respectively, and the average winter air temperature ranged from 8.98 to 29.63 degrees Fahrenheit for years with near-complete records (more than 95 percent of observations recorded) at the National Oceanic and Atmospheric Administration observation station USC00304555 at Lake Placid, N.Y. (National Oceanic and Atmospheric Administration, 2024).
Bedrock underlying Essex County is largely classified as metaplutonic, specifically Proterozoic anorthosite (Isachsen and others, 2000). Anorthosite rock contains little chloride (Seifert and others, 2010); thus, chemical weathering of the local bedrock is unlikely to contribute substantial chloride to groundwater. Glacial till and other sediment overlie bedrock on the mountain ridges and slopes, whereas glaciofluvial, glaciodeltaic, glaciolacustrine, alluvial, and wetland deposits overlie bedrock in the valleys.
Methods
Experimental Design
Highway runoff, surface water, and groundwater were investigated in three areas with different experimental deicing treatments along sections of Route 86 and Route 73 in the Adirondack Park (fig. 1). The watersheds were divided into upgradient and downgradient subwatersheds, relative to the intersection of Route 86 or Route 73 and the selected stream. Upgradient subwatersheds were monitored to understand background conditions and were presumed to be minimally affected by deicing practices because those areas have little to no impervious surface cover. The downgradient subwatersheds were monitored to quantify potential impacts from ongoing winter snow and ice management practices on water quality. One watershed was identified as a control, and winter deicing was done in the typical way without altering the application rate or the deicing mix composition. Two watersheds were subjected to different treatments than the control and identified as “Treatment A” and “Treatment B,” explained as follows.
The control treatment by the NYSDOT on Route 73 consisted of a typical application of deicing salt (George T. Laundrie, professional engineer, NYSDOT, written commun., 2021). The deicing salt was sodium chloride that also contained a prewetting agent, coloring agent, and a corrosion inhibitor; this was used on all three treatment areas. Deicing salt application rates in the control section ranged from 90 to 360 pounds (lb) per lane mile. Treatment A reduced the salt concentration of the deicing mixture. Sand was added to the deicing salt, creating a variable abrasive-deicing mixture. Treatment B reduced the application rate of the typical deicing salt.
Individual application rates were determined relative to temperature, weather, and pavement conditions in accordance with the NYSDOT snow and ice guidelines (NYSDOT, 2006). Application rate and frequency on highways were adjusted as needed to maintain safe driving conditions (George T. Laundrie, professional engineer, NYSDOT, written commun., 2021). In the Treatment A highway reach, an approximate 50:50 sand-salt mixture was applied at 250 lb per lane mile during the 2019 to 2020 winter period, and a 90:10 sand-salt mixture was applied at 750 lb per lane mile during the 2020 to 2021 and 2021 to 2022 winter periods. Application rates on the Treatment B highway reach were about 10 percent lower than those on the control highway, although deicing salt was applied more frequently to stretches of the Treatment B highway reach than in the control or Treatment A reaches during winter snow and ice events. A 23- to 24-percent brine solution was occasionally applied to the pavement in the Treatment A and B reaches at a rate of 40 to 50 gallons per lane mile (George T. Laundrie, professional engineer, NYSDOT, written commun., 2021); however, application amounts and rates for brine solutions were not supplied by the NYSDOT for this analysis.
The NYSDOT provided estimates of individual material application rates, materials used, and lane miles treated for each highway reach (Fisher and others, 2025). The Town of North Elba provided annual application rates for the town road within the control watershed. Annual average daily traffic volume estimates were about 4,064 and 4,032 vehicles per day in 2019 for Route 73 and Route 86, respectively (NYSDOT, 2020).
Annual chloride mass balance (sum of total chloride inputs and total chloride export) was determined for the Treatment B watershed. Surface electromagnetic surveys were collected upgradient and downgradient from the Treatment B highway reach along the general inferred direction of subsurface flow at the groundwater monitoring sites. Electromagnetic surveys map the apparent electrical conductivity of the subsurface and can be used to estimate changes in the specific conductance of groundwater. As many as three nested groundwater monitoring wells were upgradient and downgradient from the highway reaches but outside of the upgradient and downgradient surface water subwatersheds. Groundwater monitoring wells were installed at different depths (23 to 38.8 ft below land surface at wells adjacent to the Control highway reach, 15 to 19.5 ft below land surface at wells adjacent to the Treatment A highway reach, and 8.3 to 28.8 ft below land surface at wells adjacent to the Treatment B highway reach). Discrete samples were collected from upgradient and downgradient monitoring wells for water quality analysis. In combination, electromagnetic survey and discrete groundwater monitoring well data show the transport of chloride from deicing salt runoff through the Treatment B watershed (fig. 2).
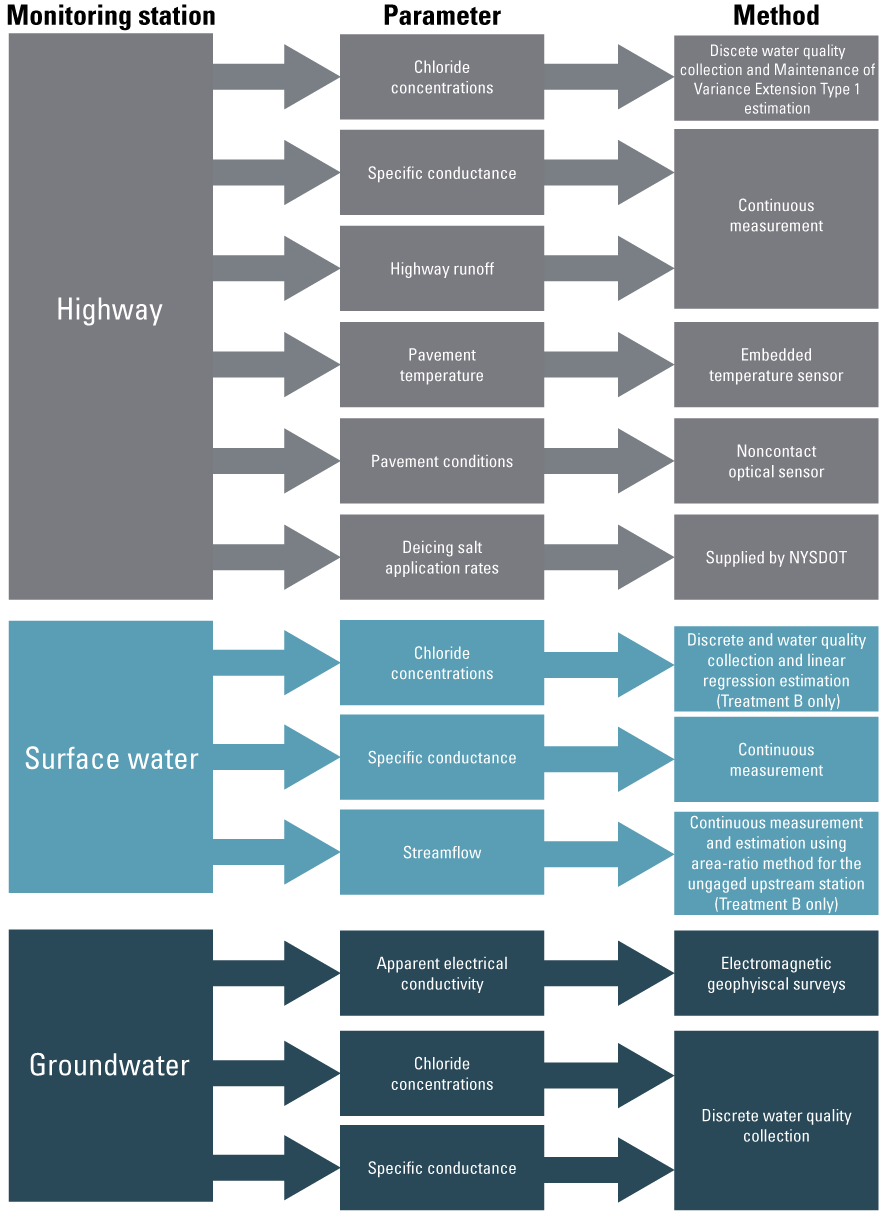
Flowchart showing data collection and processing steps applied to parameters collected for this investigation. Linear regression estimation of chloride concentrations from continuous specific conductance and drainage area-ratio estimation of discharge at the ungaged upstream station were performed only for surface water in the Treatment B watershed. Water-quality data and discharge measurements were collected following U.S. Geological Survey (USGS) procedures (Rantz and others, 1982; Sauer, 2002; USGS, variously dated). Water quality, discharge, and highway condition data are available from USGS (2023). Data from GEM–2 surveys are available from Terry and others (2024). Estimated chloride concentrations for Treatment B surface water station (USGS site number 04273997) are available from Fisher and others (2025).
Data Collection at Highway Monitoring Stations
Design of Highway Monitoring Stations
Highway monitoring stations and paired noncontact and embedded pavement sensors were installed at a single location along each highway reach and operated by the USGS (fig. 1; table 2). Highway monitoring stations included automatic water samplers and sensors for the measurement of highway runoff stage and specific conductance, water and air temperature, snow depth, and precipitation (fig. 3). Noncontact and embedded pavement sensors measured surface pavement temperature and pavement condition (whether the pavement was dry, damp, or wet, or covered in snow, ice, or black ice). Highway condition data are available from the National Water Information System (NWIS; USGS, 2023).
Table 2.
Highway condition and runoff water-quality monitoring stations along New York State Routes 73 and 86, Essex County, New York.[The number of lanes and speed limits were obtained from direct field observations. Site information from U.S. Geological Survey (2023). ft2, square foot; mph, miles per hour; NY, New York]
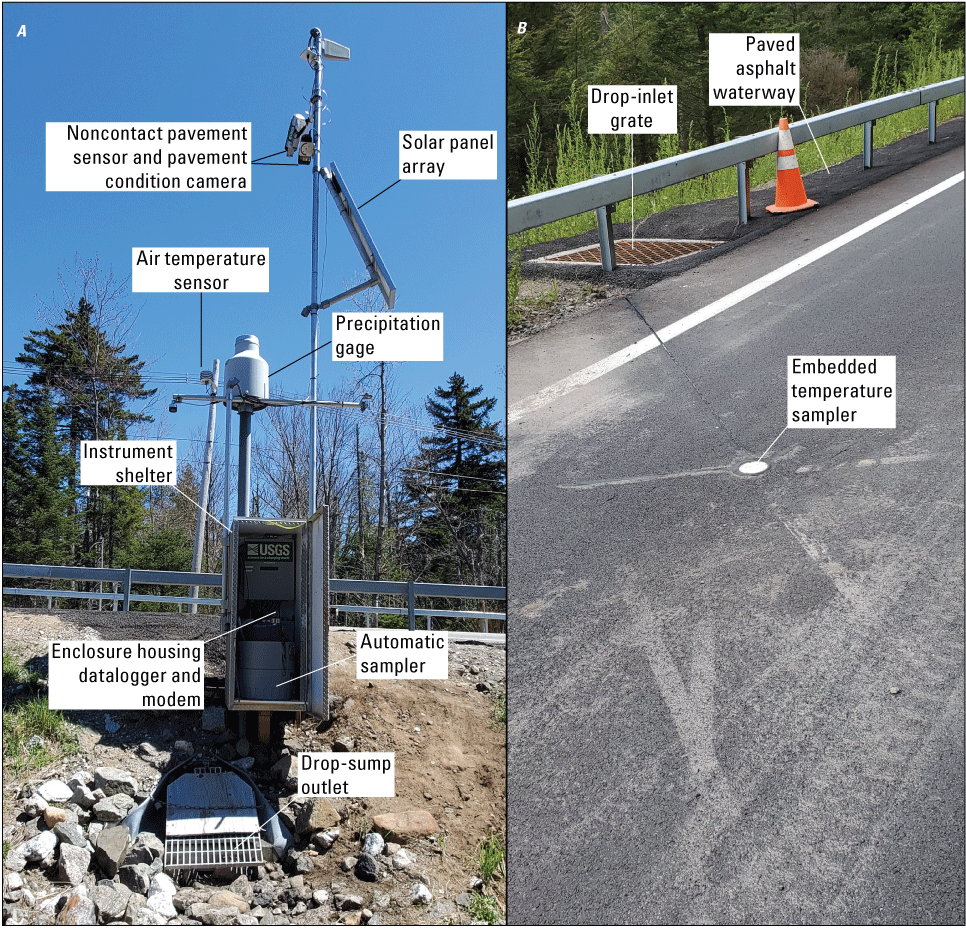
A, photograph showing the highway-monitoring station in the control watershed (U.S. Geological Survey site number 441411073544501), adjacent to New York State Route 73 in Essex County, New York. The monitoring station was used to collect measurements of meteorological and pavement conditions, composite samples of highway runoff, and instantaneous measurements of runoff discharge and specific conductance. B, photograph showing embedded pavement sensor shown in New York State Route 86 in Essex County, New York. Photographs by Kirk Smith, U.S. Geological Survey. Site information is available from U.S. Geological Survey (2023).
Paved asphalt waterways (about 200 ft long on one side of the highway) and drop inlets with 2-ft sumps were installed at each highway monitoring station beginning in November 2019 and completed by December 2020. These waterways diverted highway runoff to the drop inlets where continuous measurements and automatic sample collection occurred. Discharge was measured at a two-stage volumetric weir (rated for about 0.95 cubic feet per second [ft3/s]) installed in the outlet pipe of each drop-inlet sump. Continuous water-level measurements were converted to continuous discharge values by programming the data loggers with the stage-discharge relation for the weirs. Highway runoff discharges were recorded every 10 minutes for discharges less than 0.004 ft3/s. Specific conductance and discharge were recorded at 1-minute intervals for discharges greater than 0.004 ft3/s, which corresponded to the minimum flow needed to submerse the specific conductance sensors. Composite samples of highway runoff were retrieved concurrently with discrete water quality sample collection.
Meteorological data were measured at each monitoring station at a height of about 7 ft above the ground surface. Precipitation data were measured with a 7.9-in diameter electronic weighing-bucket sensor (fig. 3). Meteorological data were measured at 5-minute intervals. Data were retrieved automatically through cellular telemetry.
Noncontact pavement sensors were mounted at an angle of about 40 degrees on masts about 20 ft above ground level. These sensors observed an elliptical field of measurement of about 13 in by 70 in, which primarily captured the lane adjacent to the highway stations. The noncontact sensors used electro-optical technology to monitor the near infrared spectral differences of the roadway surface and could detect the difference between the state of water on the pavement: water, snow, or ice (High Sierra Electronics, 2022). The sensor measured pavement temperature with an infrared thermometer, and air temperature and relative humidity were measured within the device housing. The noncontact pavement sensors were calibrated to dry pavement conditions about every 2 months. Pavement sensor data were measured at 5-minute intervals. Data were retrieved automatically through cellular telemetry.
The embedded pavement sensors (Lufft IRS31Pro–UMB) were installed in August 2020 at about 4 ft from the fog line, or just on the inside of the typical position of the right tire for vehicles traveling on the road (fig. 3). The embedded pavement sensors measured temperature just beneath the pavement surface and at a depth of about 1 ft below the pavement surface. The instrument accuracy was plus or minus 0.5 degrees Celsius (°C; High Sierra Electronics, 2022). High-resolution fixed-image cameras were mounted at highway monitoring stations at about the same height as the noncontact pavement sensors and focused on the general location monitored by the noncontact and embedded pavement sensors. Cameras were operated in accordance with guidelines established by the manufacturer (High Sierra Electronics, 2022).
Pavement-condition data are a semiquantitative measurement, where a “damp” pavement condition means that there is water on the road but an insufficient amount to cause tire spray, a “wet” pavement condition means that the road has sufficient water to cause tire spray, and a “standing-water” condition means that a wake is observed behind the tires of moving vehicles. “Snow,” “ice,” and “black ice” conditions mean that snow, ice, and black ice, respectively, were observed on the road surface. Images were collected with the fixed-image cameras and used in combination with sensor data to validate the accuracy of semiquantitative pavement conditions. Pavement conditions were checked, embedded temperature sensors were inspected, and the pavement surface temperature was tested against a reference meter during routine site visits for water quality sample collection (about monthly).
Highway Runoff Quality Data Collection
On-site monitoring equipment was used to collect near real-time measurements of highway runoff discharge and specific conductance and to collect discrete and flow-weighted composite samples of highway runoff. Specific conductance and water temperature were measured at 1-minute intervals using Eureka Manta2 water-quality multiprobe sondes. Teledyne ISCO portable automatic samplers were configured with polyethylene sample bottles and polyethylene intake lines attached to silicon pump-head tubing and a silicon discharge tube. Prior to the initial installation of the sampling equipment, components were cleaned in accordance with USGS procedures (USGS, variously dated).
Samples of highway runoff were collected as composite and discrete samples during runoff events. Runoff events included rainfall, mixed precipitation, and snowmelt and were defined as a function of discharge where sequential measurements of discharge greater than or equal to 0.005 ft3/s occurred after 6 hours or more of discharge less than 0.005 ft3/s. A discharge of 0.005 ft3/s was the minimum threshold sufficient to collect a sample in the drop-inlet outlet pipe where the autosamplers collected each sample.
Eighteen flow-weighted composite highway runoff samples were collected during rain and mixed precipitation events from May 2019 to September 2022 at each highway monitoring station (table 2). The first aliquot of each composite sample was collected when discharge exceeded the minimum threshold (0.005 ft3/s), and subsequent aliquots were collected at flow-proportional intervals (samples were repeatedly collected immediately following the passage of a fixed volume of runoff). After sampling was initiated and discharge remained below 0.005 ft3/s for 6 hours, composite sample collection was terminated. Composite samples of highway runoff were generally limited to warm periods because freezing conditions inhibited sample collection during winter months.
Discrete and composite samples were collected by the automatic sampler during meteorological winter (December, January, and February) and early spring (March and April) to capture high concentrations of chloride in highway runoff required for specific conductance relations. Sample water was pumped directly from the autosampler bottles with a peristaltic pump, filtered with a 0.45-micrometer filter, and processed following USGS protocols (Wagner and others, 2006; USGS, variously dated). Samples were analyzed for chloride (Fishman and Friedman, 1989) by the USGS National Water Quality Laboratory (NWQL) in Denver, Colorado. Highway runoff water-quality data are available from NWIS (USGS, 2023).
Surface Water Data Collection
Six surface water sites were monitored from November 2019 to August 2022 for specific conductance (table 1) and sampled routinely for chloride. Discrete samples were manually collected about every 2 months and analyzed by the USGS NWQL. Specific conductance and water temperature were measured at 15-minute intervals using Eureka Manta2 water-quality multiprobe sondes. The Eureka Manta2 water-quality multiprobe sondes were installed in the stream channel and deployed from November 2019 through November 2022. Routine sensor maintenance included calibration checks and cleaning to reduce fouling and prevent sensor drift. Water-quality sampling and continuous data collection for surface water were performed by USGS personnel following USGS protocols (Wagner and others, 2006; USGS, variously dated).
Stream stages were recorded at 15-minute intervals using pressure transducers and data loggers at three sites from November 2019 to November 2022. Manual discharge measurements were made at regular intervals and during high-flow conditions. Gage height-discharge relations were developed for each station to determine the discharge at 15-minute intervals from stage measurements (Sauer, 2002). Stream discharge was computed in accordance with standard USGS protocols (Rantz and others, 1982). Water-quality and discharge data are available from NWIS (USGS, 2023).
Groundwater Data Collection
Well Installation
A monitoring well network was installed upgradient and downgradient from each highway reach of Route 86 and Route 73. Monitoring wells were installed by the NYSDOT using rotary drilling methods (table 3). Groundwater wells were cased with polyvinyl chloride (PVC) and screened with PVC at selected depth intervals based on subsurface characteristics including depth to the water table, depth to bedrock, and saturated thickness of subsurface unconsolidated materials (table 3). Wells were completed at the land surface with a flush-mounted cap on concrete or with a 3-ft stick up (steel protective casing). A concrete well pad was constructed at the land surface. The annular space of each monitoring well was backfilled with bentonite, and well screen zones were packed with sand. Wells were developed by surging after completion.
Table 3.
Groundwater quality monitoring sites upgradient and downgradient from New York State Routes 73 and 86, Essex County, New York.[Data from U.S. Geological Survey (2023). USGS, U.S. Geological Survey; ft, foot; NAVD 88, North American Vertical Datum of 1988; bls, below land surface; in, inch]
Groundwater Quality Sampling
Discrete groundwater-quality samples were collected about every 2 months from November 2019 to November 2022. Groundwater samples were collected manually using a plastic submersible pump operated at a constant rate (typically 0.3 to 0.6 gallons per minute) in 2-in diameter monitoring wells or using a peristaltic pump operated at a constant rate (typically 0.3 to 0.6 gallons per minute) in 1-in diameter wells. Samples were collected and processed using USGS protocols (USGS, variously dated). For wells with insufficient water yields for sequential sample collection (EX2409, EX2410, EX2411, EX2412, EX2413, EX2414, EX2406, and EX2407), samples were combined in a clean composite container, homogenized, and aliquoted to analysis bottles using a peristaltic pump. Samples were analyzed for chloride by the USGS NWQL, and specific conductance was recorded when samples were collected. Groundwater-quality data are available on NWIS (USGS, 2023).
Near Surface Geophysical Methods
Surface electromagnetic surveys were used to map spatiotemporal changes in groundwater salinity adjacent to a section of the Treatment B reach (Terry and others, 2024). Results support chloride mass balance for surface-water sites in this watershed. Surface electromagnetic surveys were collected using a Geophex GEM–2 in an approximate 500 square foot grid pattern in areas upgradient and downgradient from the Treatment B highway reach between July 2019 and October 2022. Hand-carried surface electromagnetic surveys can be used to map relative subsurface bulk electrical conductivity variations (as from variable groundwater salinity) down to several ft below land surface (bls). Electrical geophysical methods have been used for similar purposes in other studies; for example, mapping the extent of a high chloride groundwater plume downgradient from Interstate 93 in New Hampshire (Toran and others, 2010) and delineating recharge patterns downgradient from a deicing salt storage facility in Maine (Slater and Sandberg, 2000).
The GEM–2 is a multiband electromagnetic instrument consisting of a Global Positioning System (GPS) receiver and battery powered electronics mounted to a rigid ski in which a transmitter and receiver coil are embedded at a fixed offset (5.45 ft). The transmitter emits an electromagnetic field at multiple frequencies that induces eddy currents in subsurface conductors (such as groundwater with elevated salinity), which are measured by the receiver. The instrument was carried flat (horizontal coplanar) at waist height (about 3.3 ft) at a comfortable walking speed (about 3 miles per hour). GEM–2 quadrature and in-phase data were measured at six frequencies (3930, 8670, 19110, 28950, 42210, and 93090 hertz) in real-time using a Bluetooth connection to a Trimble Nomad or similar Windows mobile device using WinGEM2 software (Geophex Ltd., 2021). Raw binary data were exported to comma separated value format using the EMExport software and converted to apparent electrical conductivity using the Invertor software (Geophex Ltd., 2021). Apparent electrical conductivity represents a volume-averaged electrical conductivity and is not associated with a specific depth. Apparent conductivity data were linearly interpolated to 10 ft by 10 ft grids using the R “interp” function available in the akima package (Akima and Gebhardt, 2022). The spatial distribution of mapped electrical conductivities throughout the survey area were examined and compared across seasonal data collection events at the site. Data associated with GEM–2 surface electromagnetic surveys are available in Terry and others (2024).
Quality Assurance and Quality Control Analysis
Quality control samples were collected to evaluate potential variance in concentrations introduced during sample collection and processing or due to dynamic environmental conditions (Mueller and others, 2015). Sequential replicate samples were collected for discrete chloride concentrations in surface water and groundwater (15 replicate pairs each). Twelve sequential replicates were collected for highway runoff samples (discrete or composite). Twelve field blanks were collected using USGS methods for different sample mediums and inorganic blank water and analyzed for concentrations of chloride in surface water and groundwater (USGS, variously dated). Two field blanks for highway runoff were collected using the methods for highway runoff sample collection and inorganic blank water (USGS, variously dated).
The relative percent difference (RPD) was used to quantify differences in discrete chloride concentrations (Zar, 1999) and was calculated as follows:
whereRPDs associated with surface water chloride concentrations ranged from 0 to 10.34 percent, with a median of 0.68 percent. RPDs for groundwater chloride concentrations ranged from 0.42 to 29.27 percent, with a median of 2.26 percent. The RPDs associated with replicate sample pairs for chloride concentrations in highway runoff ranged from 0 to 10.14, with a median of 0.37 percent. RPDs for all but one of the sample-replicate pairs in this study were below 20 percent, and 83 percent of RPDs in this study were less than or equal to 5 percent. The RPD could not be calculated for replicate pairs in which one or more chloride concentrations were below laboratory reporting limits (n = 1; 0.20 mg/L). Chloride was not detected above laboratory reporting limits (0.20 to 0.25 mg/L) in field blank samples associated with surface water or groundwater methods. Chloride was detected at a maximum concentration of 0.022 mg/L in field blanks associated with highway runoff methods. The concentrations of chloride detected in highway runoff blank samples were only marginally greater than the reporting levels (0.02 mg/L) and remained below the minimum concentrations measured in highway runoff (0.97 mg/L). Sample collection and delivery tubing in the automated samplers was left in place without cleaning between runoff events and may have served as a source of contamination, albeit minimal. The infrequent, low-level detections do not indicate a substantive contamination issue related to equipment used for the collection of highway runoff samples. An evaluation of quality control results ultimately did not indicate that the collection, preparation, or analytical processes used in this study introduced considerable biases to the concentrations of chloride observed in environmental samples. Concentration results for quality control samples are available in NWIS (USGS, 2023).
Data Analysis
Continuous chloride concentrations were estimated in highway runoff using Maintenance of Variance Extension Type 1 (MOVE.1) regression equations. Daily mean chloride concentrations were estimated in surface water in the Treatment B watershed using a linear regression equation, and an annual chloride mass balance for the watershed was determined; however, linear regression equations failed to meet assumptions for control and Treatment A watersheds. Namely, the residual errors were not normally distributed and the relation between chloride and daily mean specific conductance was not linear (Helsel and others, 2020). Summary statistics were calculated for each parameter for all watersheds. Data were analyzed with R Statistical Software (R Core Team, 2022). Statistical comparisons and relations were conducted using the R package “rstatix” (Kassambara, 2023). The Mann-Whitney U (Wilcoxon rank sum) test was used to compare median chloride concentrations across groundwater sites. Spearman’s rank correlation was used to determine relations between chloride concentrations and specific conductance.
Chloride Estimation in Highway Runoff
Continuous specific conductance was used to estimate chloride concentrations in highway runoff using regression equations (Hem, 1985; Spaetzel and Smith, 2022). Regression equations were developed using concurrent measurements of continuous specific conductance and chloride concentration measured in discrete and composite samples of highway runoff. Regression equations were applied to continuous specific conductance data to estimate chloride concentrations at 1-minute intervals for each highway monitoring station. These regression equations were developed with the MOVE.1 technique on the basis of concurrent measurements of log-transformed values of specific conductance and log-transformed concentrations of discrete and composite chloride in highway runoff samples (Helsel and others, 2020). The MOVE.1 technique minimizes errors in the x and y directions and has demonstrated utility when applied to water quality of highway runoff in previous studies (Stonewall and others, 2019; Smith and others, 2023). MOVE.1 generates a unique equation, which can be used to estimate either variable from the other; the estimations reflect the variance of the measured concentrations (Helsel and others, 2020). The MOVE.1 equation (eq. 2) is given as
whereC
is the concentration of the ion of interest, in milligrams per liter;
Spc
is the specific conductance, in microsiemens per centimeter at 25 degrees Celsius;
m
is the slope from the MOVE.1 analysis (table 4);
b
is the intercept from the MOVE.1 analysis (table 4); and
BCF
is the bias correction factor from the MOVE.1 analysis (table 4).
The ionic ratio of highway runoff can vary across ranges of specific conductance spanning several orders of magnitude (Smith and others, 2023). Owing to this variability, two-part regressions were selected to represent the range in specific-conductance values and chloride concentrations of highway runoff (table 4). In the discrete and composite runoff sample data (n = 83), continuous specific conductance ranged from 24 to 73,200 microsiemens per centimeter (μS/cm) at 25 °C, and chloride concentrations ranged from 0.75 to 29,200 milligrams per liter (mg/L). Part 1 equations were applied to estimate chloride concentrations at low specific conductance (less than 150 μS/cm for the control highway reach and less than 290 μS/cm at the Treatment A and B highway reaches). Part 2 equations were applied to estimate chloride concentrations at high specific conductance (greater than or equal to 150 µS/cm at the control highway reach and greater than 290 µS/cm at the Treatment A and B highway reaches).
Table 4.
Data and regression equation coefficients used to estimate continuous chloride concentrations from specific conductance for highway monitoring stations on New York State Routes 73 and 86 in Essex County, New York, and surface water in the Treatment B watershed (U.S. Geological Survey station number 04274051) during water years 2019 to 2022.[Data from U.S. Geological Survey (2023). Maintenance of Variance Extension Type 1 (MOVE.1) regression methods were applied to highway runoff, and linear regression methods were applied to surface water at the downgradient site in the Treatment B watershed (station number 04274051). A water year is defined as the period from October 1 to September 30 and designated by the year in which it ends. µS/cm, microsiemens per centimeter at 25 degrees Celsius; BCF, bias correction factor; R2, coefficient of determination; RMSE, root mean square error; —, no data]
These multisegment regression equations were developed using pooled sample data from all stations (table 4). The relative proportion of individual ion contributions to specific conductance can vary as a function of site characteristics or magnitude of specific conductance (Smith and others, 2023). Thus, two-part regressions were selected to better represent the large range in specific-conductance values and variable ion contributions at these stations. Although regression equations were applied to nonoverlapping ranges of specific conductance (table 4) to produce estimates of chloride concentrations, the ranges of observed data used to develop each segment overlap to produce a continuous function (Granato, 2006). The root mean square error was 15–19 percent for part 1 equations and 1.7 percent for part 2 equations.
Flow-weighted chloride concentrations were calculated to account for the potential effects that differences in highway runoff rates may have on chloride concentrations. Flow-weighted chloride concentrations for highway runoff were calculated for a given date using the following equation:
whereEstimation of Annual Chloride Yields and Mass Balance in Surface Water
An annual chloride mass balance for the Treatment B watershed for water years 2021 and 2022 was estimated. A water year is defined as the period from October 1 to September 30 and designated by the year in which it ends. Total annual inputs for the Treatment B watershed included the sum of chloride from deicing, atmospheric deposition (estimated for the downgradient watershed only), and chloride export from the upstream surface water station, the last of which constitutes background chloride contributions. Contributions of chloride from septic effluent were assumed to be negligible because residential development was low to absent in the watershed. These data were compared annually for the Treatment B watershed and expressed as pounds of chloride. The difference between the sum of inputs and downstream chloride loading represents the estimated mass of chloride stored annually in the Treatment B watershed.
Estimation of Annual Chloride Application to Highways
For each watershed, annual estimates of deicing salt chloride inputs were derived from application rates of deicing materials provided by NYSDOT and the Town of North Elba. The NYSDOT provided application rates and treatment areas for each treatment (Fisher and others, 2025). Annual application rates for town roads in the control watershed were provided by the Town of North Elba (Fisher and others, 2025). Staffing levels and equipment availability affected the ability of NYSDOT to collect records of deicing salt application on select dates. Data on daily application rates for a given highway reach were assumed to be missing if any applications occurred along other treatment reaches in this study during the same date. Inferred missing application data were substituted with the average application rate from 2019 to 2022 for that highway reach (Fisher and others, 2025). About 13, 49, and 3.9 percent of applications were suspected as unrecorded for the control, Treatment A, and Treatment B highway reaches, respectively, during water year 2021. During water year 2022, about 15, 78, and 13 percent of applications were suspected as unrecorded for the control, Treatment A, and Treatment B highway reaches, respectively. The substitution of average application rates introduced additional uncertainty to our analysis and likely resulted in an overestimation or underestimation of annual application rates to Treatment A watersheds. Uncertainty in Treatment A applications was likely variable across water years, as application rates to the Treatment A highway reach changed from water year 2021 to 2022. Application rates were multiplied by the total lane miles for a given highway reach. An assumed 1:1 molar ratio of Na:Cl was used to derive the total mass of chloride applied for deicing purposes in each watershed. The mass of chloride applied by brining was not included in these estimates. Individual application totals were summed to derive annual water year estimates of chloride application to roads in each watershed.
Estimation of Annual Chloride Deposition and Upstream Inputs to the Treatment B Watershed
Annual atmospheric deposition of chloride (in pounds) to the Treatment B watershed was estimated from chloride concentration at the National Atmospheric Deposition Program station at Whiteface Mountain (NY98) in Essex County, N.Y. (https://nadp.slh.wisc.edu/sites/ntn-NY98/; National Atmospheric Deposition Program, 2025).
Chloride contributions from the upstream subwatershed of the Treatment B watershed were estimated using average annual chloride concentrations measured at this station and estimated discharge. The average annual chloride concentration measured at the upstream surface water station was used to approximate chloride contributions from the upstream subwatershed of the Treatment B watershed because chloride concentrations varied little in the upstream subwatershed (standard deviations of chloride concentrations at upstream surface water stations ranged from 0.06 to 0.08 mg/L) and did not have a significant relation with daily mean specific conductance (p > 0.05). Discharge for the ungaged upstream station was estimated by applying an area-ratio technique to the gaged downstream counterpart in the Treatment B watershed (Gianfagna and others, 2015). Instantaneous stream discharge data were aggregated to daily mean discharge and used to estimate daily and annual chloride loads for the upstream surface water station in the Treatment B watershed.
Estimation of Annual Chloride Export from Downstream Reach of the Treatment B Watershed
Annual chloride export from the downstream reach of the Treatment B watershed was estimated from daily mean chloride concentrations and daily mean discharge. Daily mean chloride concentrations in surface water in the Treatment B watershed were estimated using linear regression, with daily mean specific conductance as the predictor variable (Hem, 1985). A site-specific regression model was developed for the downstream site in the Treatment B watershed (table 4). One result was identified as an outlier and excluded from regression analysis. The outlier was identified with the Bonferroni outlier test using the “outlierTest” function in R (Fox and Weisberg, 2019). The regression equation met the assumptions of linear regression. The coefficient of determination (R2) and root mean square error (RMSE) of the regression equation and estimated chloride concentrations were 0.95 and 1.6, respectively (table 4). Daily mean chloride concentrations for the downstream Treatment B station were estimated using the regression equation between daily mean specific conductance and chloride concentrations. Chloride export from the downstream reach of the Treatment B watershed was estimated by aggregating instantaneous stream discharge data to daily mean discharge and multiplying this value by daily mean chloride concentrations that were derived using linear regression. Input data and detailed regression results for the estimation of chloride in surface water in the Treatment B watershed are available in Fisher and others (2025).
Chloride in Highway Runoff Relative to Winter Snow and Ice Management
Meteorological data and pavement conditions collected at highway monitoring stations were compared with deicing-salt application and chloride concentrations in highway runoff. Results were evaluated for data from November through March of water years 2021 and 2022 because deicing salt was applied infrequently outside of these months. The winter of a water year is defined as the period when deicing salt was applied, typically from November 1 to March 31, but applications did occur infrequently in April and October. Chloride application and concentration for a given treatment were evaluated in the context of winter severity (for example, the percentage of snow and ice pavement conditions observed by noncontact pavement sensors and pavement temperature measured by the embedded pavement sensors).
Interannual Variations in Winter Conditions, Deicing Salt Applications, and Highway Runoff Quality
Winter 2022 weather and pavement conditions were more severe than 2021 conditions, with more total snowfall (fig. 4C), more observations as snow and ice (fig. 5J–L), and lower air (fig. 4A) and pavement temperatures (fig. 5G–I). However, differences in winter pavement conditions across treatments were less pronounced (fig. 6). Total precipitation was higher during winter 2022 than winter 2021 and was characterized by more frequent, higher intensity snowfall events (fig. 4B–C), larger ranges in daily air temperature (fig. 4A), and more frequent runoff events (fig. 5A). The number of days with surface pavement temperatures at or below freezing was higher during winter 2022 than winter 2021 at all highway monitoring stations (fig. 6). More pavement conditions were observed as snow or ice during winter 2021 than 2022 at the control station. Daily ranges in pavement temperature were higher during winter 2022 and high-volume runoff events also occurred more often during 2022 (fig. 5). Pavement condition observations were not recorded consistently at the Treatment A and B stations for winter 2021. Snowfall totals in 2021 and 2022 (131.9 and 153.2 inches, respectively) were notably higher than the average annual snowfall total (105.4 inches; National Oceanic and Atmospheric Administration, 2024).
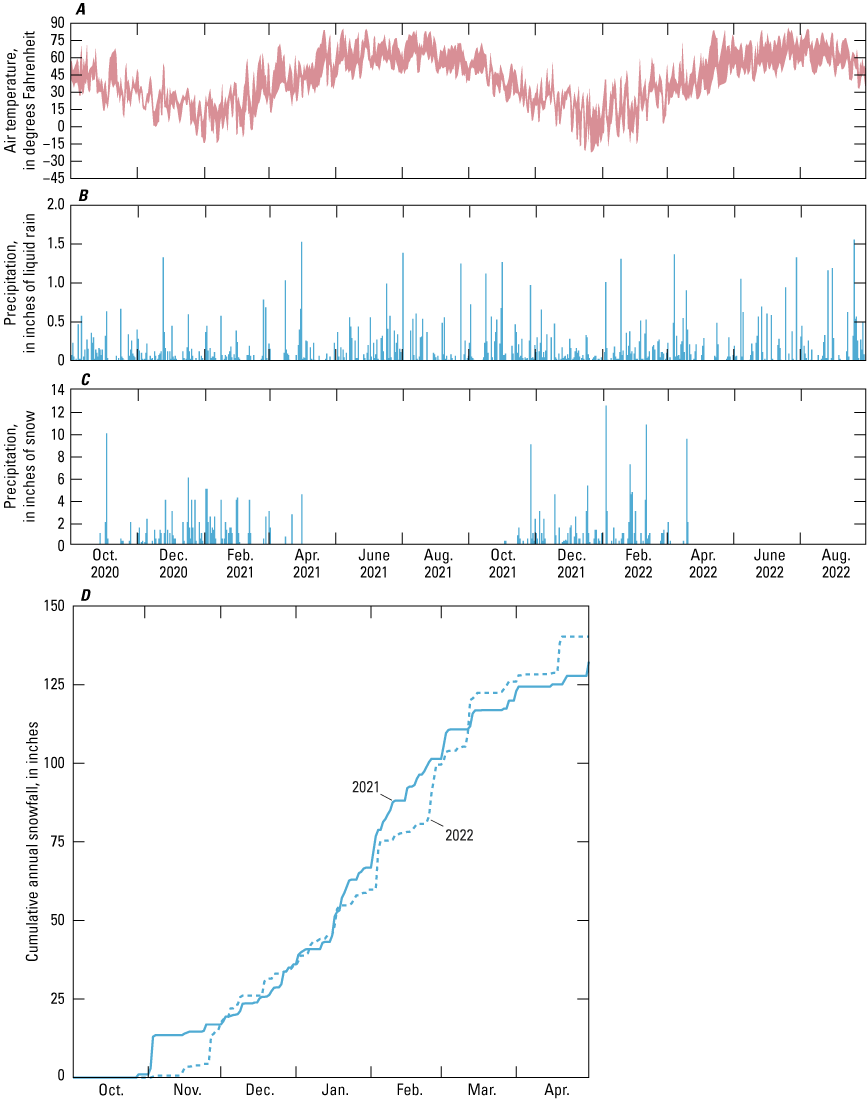
Graphs showing meteorological data from National Oceanic and Atmospheric Administration (2024) station USC00304555 at Lake Placid, New York, during water years 2021 and 2022 (October 1, 2020, to September 30, 2022), presented as A, range of daily air temperature, in degrees Fahrenheit, B, daily rainfall, in inches, C, daily snowfall, in inches, and D, cumulative annual snowfall, in inches.
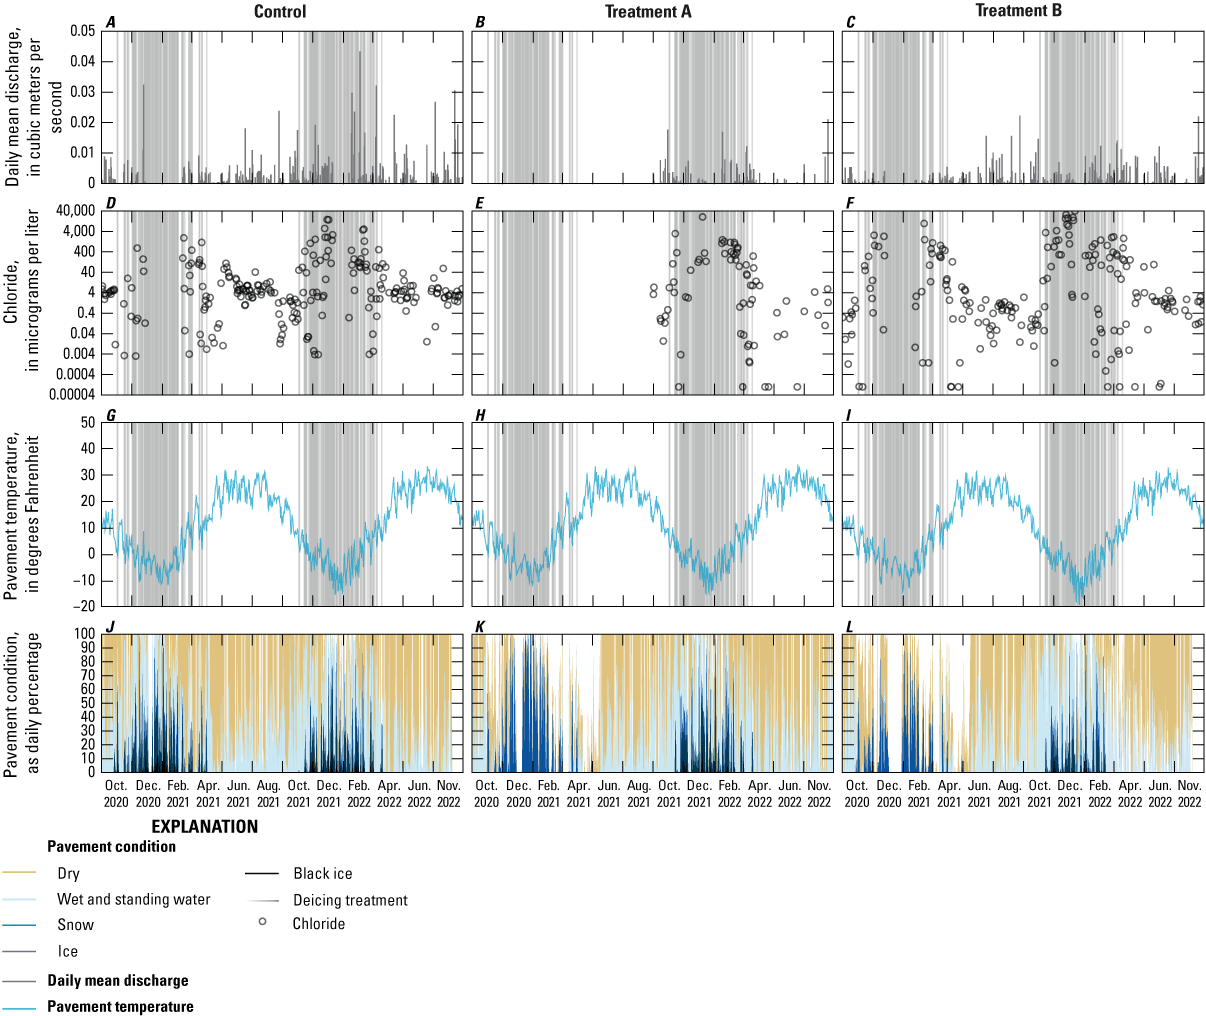
Graphs showing time series of data collected at highway monitoring stations and chloride application to highway reaches: A, B, C, daily mean discharge of highway runoff; D, E, F, flow-weighted daily mean chloride concentrations in highway runoff; G, H, I, pavement temperature at embedded pavement sensors; and J, K, L, pavement conditions, shown as percentage of total daily observations. Pavement condition observations were not recorded consistently at the Treatment A and B stations during winter of water year 2021 (November 1, 2020, to March 31, 2021). Highway data (chloride concentrations in highway runoff, highway runoff discharge rates, embedded pavement temperature, and pavement conditions) from U.S. Geological Survey (2023). Estimated chloride applications from Fisher and others (2025).
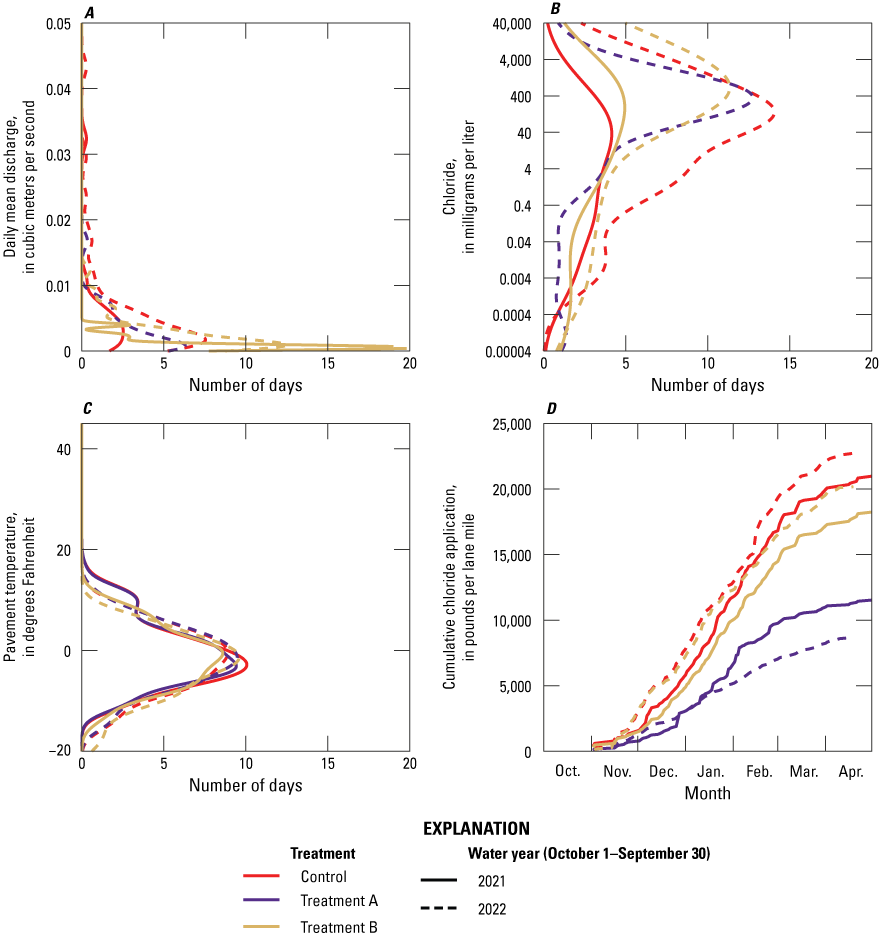
Graphs showing frequency plots of A, daily mean discharge rates of highway runoff, B, flow-weighted daily mean chloride concentrations in highway runoff, C, average daily temperature of road surface measured by embedded pavement sensors, and D, estimated cumulative chloride applied for deicing by New York State Department of Transportation (NYSDOT) at three treatment reaches (control, Treatment A, and Treatment B) during winter of water years 2021 and 2022 (November 1, 2020, to March 31, 2021, and November 1, 2021, to March 31, 2022), months during which the NYSDOT most frequently applied deicing materials to State highways in a given watershed. Data availability of deicing salt application affected Treatment A and B sites. Pavement condition observations were not recorded consistently at the Treatment A and B stations for winter of water year 2021. A lane mile is a unit of measurement used to quantify the total length of a roadway, determined by multiplying the centerline length of a roadway, in miles, by the number of lanes. Highway data (chloride concentrations in highway runoff, highway runoff discharge rates, embedded pavement temperature, and pavement conditions) from U.S. Geological Survey (2023). Estimated chloride applications from Fisher and others (2025).
Chloride applied for deicing mirrored winter severity except when affected by management practices, such as increased applications to improve conditions in particularly icy areas of the roadway or during adverse conditions. Fewer observations as snow or ice were recorded at the Control station during the winter of 2022 than in 2021 (fig. 5). More deicing salt was applied to the control and Treatment B reaches in the 2022 winter season (fig. 6). Less chloride was applied for deicing in the Treatment A watershed during winter 2022, because the ratio of salt to sand was reduced during winter 2021 (a 50:50 sand-salt mixture at a rate of about 250 lb per lane mile was used through December 2020, and a 90:10 sand-salt mixture at a rate of 750 lb per lane mile was used through 2022). Higher flow-weighted chloride concentrations were observed in highway runoff during winter 2022 than winter 2021 (fig. 6B; table 5) when more salt was applied to Treatment B and the control highway reaches (fig. 6D). Highway runoff rates and water quality were not collected with consistent frequency in the Treatment A reach during 2021. Chloride concentrations in highway runoff peaked during winter months when runoff events occurred after deicing salt application and declined in subsequent months from meteorological spring (March, April, and May) through early fall (September and October; fig. 5). Although winter 2022 for the control reach was characterized by higher total snowfall rates (fig. 4C), higher total deicing salt application, and lower pavement temperatures (fig. 6), sporadic snowmelt and subsequent runoff events also occurred more often (fig. 5).
Table 5.
Descriptive statistics of flow-weighted chloride concentrations in runoff collected at highway monitoring sites along New York State Routes 73 and 86 during water years 2021 and 2022, Essex County, New York.[Data from U.S. Geological Survey (2023). A water year is defined as the period from October 1 to September 30 and designated by the year in which it ends. USGS, U.S. Geological Survey; mg/L, milligrams per liter; —, no data]
Chloride Concentrations in Highway Runoff and Road Surface Conditions Under Different Deicing Salt Application Scenarios
Comparisons of pavement surface conditions for different deicing salt application scenarios were limited to data collected during winter 2022, because gaps in coverage during winter 2021 at the Treatment A and B stations hindered comparisons across treatments (fig. 5). The total percentage of pavement conditions as snow or ice during the winter 2022 season was lower at the Treatment B station (10.4 percent) than at the control or Treatment A stations (14.2 and 14.8 percent, respectively). Although nearly three times less chloride was estimated as applied to the Treatment A highway reach in 2022 (fig. 6; table 6), the percentage of pavement conditions as snow or ice at this station was only about 4 percent greater than that of the Treatment B station and within 1 percent of the control station during winter 2022.
Table 6.
Chloride application to treated reaches of New York State Routes 73 and 86 during water years 2021 and 2022, Essex County, New York.[Data from Fisher and others (2025). A water year is defined as the period from October 1 to September 30 and designated by the year in which it ends. lb, pound; town, Town of North Elba; NYSDOT, New York State Department of Transportation; NA, not applicable]
Total chloride applied as deicing salt was also different across treatments. Total chloride application by weight was greatest in the Treatment B highway reach, despite an approximately 10 percent lower application rate than the control reach. This may have occurred because deicing salt was applied more frequently during winter snow and ice events on highways in the Treatment B section than other sections (Fisher and others, 2025) and the total lane mileage was greater in this highway reach than in other reaches (table 1). Furthermore, the application rates may have been increased on steep grades, winding roadways, or in problem areas where snow or shading affected highway conditions (Joseph B. Thompson, NYSDOT, written comm. 2023) because pavement surface temperatures tended to be lower in the Treatment B section than in other treatment sites (fig. 6). Chloride applied for deicing was lowest in the Treatment A watershed, consistent with the application of a mixture of abrasives and deicing salts in this watershed (fig. 6).
More deicing materials were applied to all highway reaches in winter 2022, and higher annual flow-weighted chloride concentrations were observed in highway runoff in the control and Treatment B watersheds. Highway runoff water quality data were not available for the Treatment A station for part of winter 2021, because the paved asphalt waterway to the drop inlet was not sealed at this location until December 20, 2020, and highway runoff was minimal from December 20, 2020, until March 26, 2021. Thus, comparisons of highway runoff quality at the Treatment A highway monitoring station with highway runoff quality at other stations were not possible for winter 2021 data. Despite lower total chloride application at the Treatment A highway reach in 2022, median winter flow-weighted chloride concentrations in highway runoff were not substantially lower than concentrations for other treatments in 2022 (p > 0.05; fig. 5B). This can be attributed to high chloride concentrations that coincided with a greater number of runoff events at the Treatment A station compared with the Treatment B and control stations because no other sources of chloride were likely to contribute to the watersheds.
Flow-weighted chloride concentrations in highway runoff spanned several orders of magnitude across all treatment reaches (table 6), routinely exceeding the criterion established for the protection of aquatic habitats. The U.S. Environmental Protection Agency recommends a chronic criterion for aquatic life of a 4-day average chloride concentration of 230 mg/L, not to be exceeded more than once every 3 years (U.S. Environmental Protection Agency, 1988). The recommended acute criterion concentration for chloride is 860 mg/L, corresponding to a 1-hour average concentration with a recurrence interval of less than once every 3 years (U.S. Environmental Protection Agency, 1988). Although the highway runoff collected in this study may not directly constitute aquatic habitat for sensitive organisms for which the criteria were developed, the frequency and magnitude of exceedances of the criterion in this controlled experiment hold relevance to planning, management, and highway design considerations aimed at minimizing the deleterious effects of deicing to aquatic organisms.
Median flow-weighted chloride concentrations in highway runoff in this study (0.991 to 6.585 mg/L; table 5) were lower than median chloride concentrations of highway runoff collected at 11 highway-monitoring stations in Massachusetts from 2005 to 2007 (10 to 70 mg/L; Smith and Granato, 2010). Traffic volumes for highways in Massachusetts were generally higher than those in the Adirondack Park, and chloride concentrations in highway runoff increased with increasing traffic volume (Smith and Granato, 2010). Chloride concentrations in highway runoff were higher and more variable during periods of frequent deicing salt application, declined over time after seasonal applications ended, and did not return to baseline levels for several months in highway runoff in the control and Treatment B reaches (fig. 5). Higher and more variable specific conductance in urban streams receiving direct road runoff has been associated with temporal proximity to salt applications (Lakoba and others, 2020).
Discerning the effects of salt application on pavement conditions and highway runoff across treatment stations can be challenging because of the temporal and spatial variability of meteorological factors, highway orientation and slope, traffic conditions, and uncertain interactions among these and other variables.
Chloride in Surface Water and Groundwater
Chloride Storage and Transport at the Watershed Scale
Chloride concentrations in surface water varied by season: higher concentrations of chloride were observed during summer months than in winter months, coincident with low flow conditions. Chloride concentrations were higher in surface water in subwatersheds downgradient from Route 73 and Route 86 than in upgradient subwatersheds. Average annual chloride concentrations in downgradient surface water were higher at the Treatment B site than at downgradient sites in the control or Treatment A watersheds (table 7). Differences in hydrogeology across watersheds may affect the residence time of chloride in these systems. Furthermore, the downgradient surface water station in the Treatment B watershed was a greater distance from the road than either the control or Treatment A downgradient stations (table 2), and monitoring at this station may have captured seasonal groundwater discharge of deicing-salt affected groundwater, whereas baseflow chemistry at downgradient surface water sites within several hundred feet of State highways is likely to be dominated by groundwater sourced from upgradient areas with lower chloride concentrations. Maximum chloride concentrations at downgradient surface water stations (table 7) were lower than those in surface waters downgradient from Interstate 95 in Connecticut (160 mg/L; Brown and others, 2011), because land use, traffic volumes, and deicing salt application rates were higher in the Connecticut study.
Table 7.
Descriptive statistics of chloride concentrations in surface water at monitoring sites upgradient and downgradient from New York State Routes 73 and 86, Essex County, New York.[Data from U.S. Geological Survey (2023). USGS, U.S. Geological Survey; mg/L, milligrams per liter]
The annual mass of chloride imported and exported from the Treatment B watershed was estimated to show potential differences in chloride inputs and storage across water years. Chloride inputs included deicing salt application, atmospheric deposition, and background chloride contributions from upstream surface water sources.
Deicing salt application was the primary source of chloride annually, regardless of treatment. Deicing salt application is frequently identified as the primary source of salinity in watersheds in New York (Heisig, 2000; Kelly and others, 2007; Shaw and others, 2012; Gutchess and others, 2016). An annual chloride mass balance for the Treatment B watershed estimated that chloride from upstream surface waters constituted less than 2 percent of the annual chloride export from the watershed and that deicing salt application constituted 97 percent of the total chloride inputs to the downstream watershed (fig. 7). Kelly and others (2007) estimated that about 91 percent of the sodium chloride inputs to a rural stream in southeastern New York were from deicing application. Deicing salt application accounted for an estimated 67 to 99 percent of total chloride inputs to two Connecticut watersheds (Brown and others, 2011). More chloride was applied as deicing salt in winter 2022 (fig. 6), and surface water exported a higher mass of chloride in water year 2022 (fig. 7). More chloride was exported by surface water in the Treatment B watershed than annual estimates of chloride inputs during water years 2021 and 2022. The higher export of chloride in the Treatment B watershed indicates that additional sources of chloride are influencing surface water other than those accounted for as inputs in this mass balance exercise, such as the discharge of groundwater that has been affected by legacy deicing salt applications in previous years (Kelly and others, 2007; Rossi and others, 2022). Chloride mass balance for watersheds impacted by deicing practices in New York and Connecticut have resulted in net storage of chloride annually, but these watersheds received higher annual chloride inputs from deicing and were larger than the Treatment B watershed (Brown and others, 2011; Gutchess and others, 2016). Higher application rates in previous years may have resulted in chloride storage in the Treatment B watershed, which would account for the additional chloride exported during study years (fig. 7). Residence time estimates for chloride in other New York watersheds range from 20 to 70 years, although these watersheds received higher annual applications of chloride from deicing and sewage inputs than the Treatment B watershed (Shaw and others, 2012; Gutchess and others, 2016).
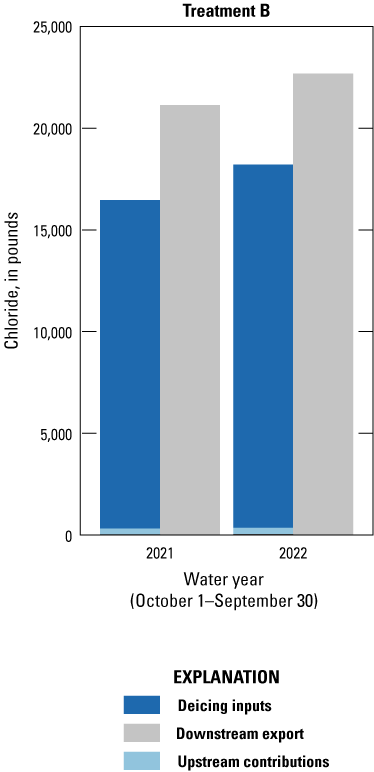
Graph showing annual estimates of chloride inputs and export from the Treatment B watershed for water years 2021 and 2022 (October 1, 2020, to September 30, 2022). Data from Fisher and others (2025).
Chloride and Seasonal Saltwater Plumes in Groundwater
Chloride concentrations in groundwater varied seasonally and were consistently higher in monitoring wells downgradient from Routes 73 and 86 than those in upgradient wells (p < 0.005). Median chloride concentrations in downgradient monitoring wells were higher at the control site than at either treatment site (table 8). Higher chloride concentrations have been observed in wells downgradient of highways in New York (Kelly and others, 2018) and in proximity to roads in neighboring States (Harte and Trowbridge, 2010; Cassanelli and Robbins, 2013; Rhodes and Horton, 2015; Levitt and Larsen, 2020) and have been attributed to runoff from deicing material applications. The lack of alternate sources of salinity and low chloride concentrations in upgradient groundwater indicate that downgradient groundwater quality in each of the Treatment areas is affected by deicing practices (table 8).
Table 8.
Chloride concentrations in groundwater at monitoring sites upgradient and downgradient from New York State Routes 73 and 86, Essex County, New York.[Data from U.S. Geological Survey (2023). USGS, U.S. Geological Survey; ft, foot; bls, below land surface; mg/L, milligrams per liter; <, less than]
Surface electromagnetic surveys conducted at the Treatment B groundwater site adjacent to Route 86 in June and October 2022 indicated higher apparent electrical conductivity downgradient from Route 86 than upgradient from the highway (fig. 8). In June 2022, electrical conductivity was highest across a narrow band oriented parallel to Route 86. In October 2022, electrical conductivity was highest primarily downgradient from Route 86, with dilution along plume margins. These patterns suggest that in June, high-salinity groundwater was constrained to the near-pavement region of the surveyed area, whereas in October, groundwater flow driven by spring and summer recharge led to the lateral transport and dispersal of a seasonal high-conductivity plume downgradient from Route 86. Temporal variability in downgradient groundwater chloride concentrations in the Treatment B area mirrored that of electrical conductivity downgradient from Route 86, with lower chloride occurring during meteorological fall 2022 compared to summer.
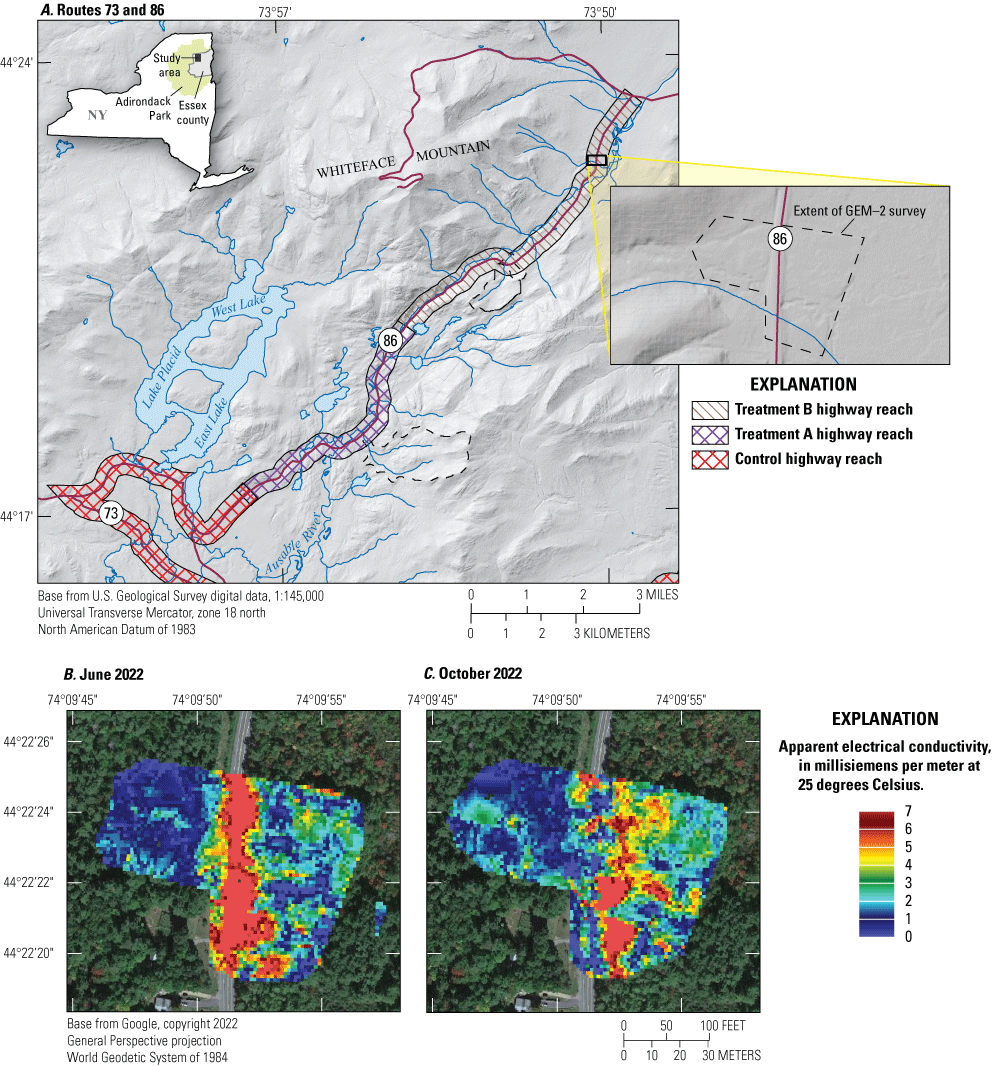
A, map showing location of electromagnetic geophysical survey, and maps showing distribution of apparent electrical conductivity from surface electromagnetic surveys conducted in B, June and C, October 2022 in the Treatment B watershed. Apparent electrical conductivity data were linearly interpolated within the data collection area. Results shown are differences from the minimum apparent electrical conductivity to highlight zones of increased apparent electrical conductivity. Apparent electrical conductivity serves as an indirect measure of the total concentration of dissolved chloride originating from winter deicing in the subsurface of the Treatment B watershed. Data from Terry and others (2024).
Effects of Different Deicing Salt Application Rates in Essex County, New York
Results generated by highway monitoring stations, when coupled with water-quality data of adjacent surface water and groundwater stations, show fundamental differences in winter weather patterns, subsequent deicing practices, and watershed characteristics. These factors govern the transport of seasonal deicing salt application at the watershed scale. An evaluation of the control highway in 2021 and 2022, revealed that higher total deicing salt application along the control highway in 2022 was accompanied by higher chloride concentrations in highway runoff and a lesser proportion of winter pavement conditions observed as snow or ice, relative to 2021 monitoring. Although less salt was applied to the Treatment A highway in 2022 compared to the control and Treatment B highway reaches, a substantially higher proportion of pavement conditions as snow or ice was not observed when compared to other treatments, and chloride concentrations in highway runoff were not markedly lower than for other treatments. At this reach, lower salt application rates neither translated to more adverse pavement conditions nor resulted in a reduction in chloride concentrations of highway runoff.
Several factors contributed to uncertainty associated with these findings. Gaps in observations of highway pavement conditions at Treatment A and B stations during winter 2021 inhibited direct comparisons across these treatments for two consecutive water years. Equipment malfunctions and remote site conditions prohibited these measurements, which ultimately affected our ability to compare winter 2021 conditions with 2022 conditions for these two treatments. Our comparisons between treatments were also limited to winter 2022 conditions for this reason. Data availability and salt application rates affected interpretations of the effects of reduced chloride application on road conditions. Deicing material applications were not consistently recorded for Treatment A highway reaches. Although we substituted the average application rate to estimate annual chloride applications (fig. 6), we likely underestimated daily application totals on dates where multiple applications were performed. Brine application to highway reaches may have reduced winter pavement conditions, but without accurate application data for this treatment, this could not be quantified. Consistent monitoring and treatment across stations are critical for more comprehensive interpretations of the effects of reduced deicing salt application rates on chloride concentrations in highway runoff, surface water, and groundwater. In addition, monitoring during a baseline period to establish relations among stations, similar to methods used in paired-watershed study designs, could reduce uncertainty associated with the variable hydrogeology in these watersheds. Long-term studies could help further reduce uncertainties because groundwater chloride contributions to stream discharge may bias analyses towards effects from previous deicing salt applications, potentially at higher rates. This is because of the tendency for chloride to persist in shallow groundwater beyond seasonal application (Bester and others, 2006; Snodgrass and others, 2017).
Differences in winter severity and pavement surface conditions appear to drive seasonal deicing salt applications, regardless of whether deicing salts are applied at reduced rates or as a mixture of abrasives, but higher median chloride concentrations were observed in surface waters and groundwater receiving greater annual deicing salt inputs (figs. 4–6). Chloride concentrations were often higher in surface water and groundwater downgradient from Route 73 and Route 86 than in upgradient surface water and groundwater. Mapping of subsurface electrical conductivity revealed lateral migration of a shallow saline plume originating from the near-pavement area of Route 86. The transport of deicing salt-laden runoff at the watershed scale can vary depending on site-specific watershed characteristics relative to the total mass of chloride applied annually and during preceding winter seasons (Jin and others, 2011; Robinson and Hasenmueller, 2017; Gutchess and others, 2016; Kelly and others, 2018).
Summary
The U.S. Geological Survey, in cooperation with the New York State Department of Transportation, investigated the potential effects of reduced deicing salt application rates on highway pavement conditions and chloride loading to surface water and groundwater in Essex County, New York. Three areas affected by different deicing treatments along sections of Route 86 and Route 73 in northern New York were evaluated. Winter deicing was conducted in accordance with prior methods in the control watershed. Two watersheds were subjected to different treatments (Treatment A and Treatment B). Highways in the Treatment A watershed were treated with a 50:50 ratio of sand and deicing salt through December 2020 and a 90:10 ratio mixture of sand and deicing salt through 2022. Deicing salt was applied at about 10 percent lower individual application rates to highways in the Treatment B watershed. However, deicing salt was applied more frequently to roads in the Treatment B section than to the control or Treatment A sections. Surface water samples were collected upgradient from the highway station, and groundwater samples were collected downgradient from the highway stations. Chloride concentrations were measured in the highway runoff, surface water, and groundwater samples collected for the three watersheds. Data used to characterize highway runoff quality, meteorological conditions, and pavement conditions were generated at highway monitoring stations in each of the three reaches.
Meteorological data and pavement conditions collected at highway monitoring stations were compared with chloride applied as deicing salt and concentrations in highway runoff. Chloride application and concentrations were evaluated relative to the percentage of observations as snow and ice for each treatment. Higher precipitation totals occurred during winter 2022 (November 1, 2021, to March 31, 2022) compared with those in winter 2021 (November 1, 2020, to March 31, 2021), and the number of days with surface pavement temperatures at or below freezing was also higher in winter 2022 than in winter 2021. More chloride was applied for deicing during 2022, and snowfall totals were higher. The percentage of pavement conditions as snow or ice for winter 2022 was lower at the Treatment B station than at the control or Treatment A stations, and more chloride was applied to highways in this reach than in other treatment areas. The percentage of pavement conditions as snow or ice at the Treatment A station was within 1 to 4 percent of the control and Treatment B stations, even though nearly three times less chloride was applied to the Treatment A highway. Higher annual flow-weighted chloride concentrations were observed in highway runoff in 2022, when more deicing salt was applied. Although less deicing salt was applied to the Treatment A highway reach, average winter flow-weighted chloride concentrations in highway runoff were not substantially lower than those for other treatments in 2022.
The annual mass of chloride imported and exported from the Treatment B watershed was estimated to show potential differences in chloride inputs and storage across water years. Chloride inputs included deicing salt application, atmospheric deposition, and background chloride from upstream surface water sources. Deicing salt was the primary source of chloride, and chloride from upstream waters and atmospheric deposition constituted a minimal proportion of total inputs. More chloride was exported in surface water in water year 2022 (October 1, 2021, through September 30, 2022), when more chloride was applied for deicing. In water years 2021 and 2022, more chloride was exported by surface water in the Treatment B watershed than annual estimates of chloride inputs, indicating that discharge of groundwater that has been affected by deicing salt application may act as an additional source of chloride to surface waters in the Treatment B watershed.
Chloride concentrations in surface water were higher at downstream stations than at stations upstream from State highways. Chloride concentrations in groundwater varied seasonally and were higher in wells downgradient from State highways than in upgradient wells. Median chloride concentrations in downgradient monitoring wells were highest at the control site.
Surface electromagnetic surveys were used to map spatiotemporal changes in groundwater salinity adjacent to a section to the Treatment B highway reach. Higher apparent electrical conductivity downgradient from Route 86 than upgradient from the highway was observed, as was the lateral transport and dispersal of a seasonal high-conductivity plume downgradient from Route 86, likely driven by groundwater flow.
The findings of this investigation could be used to evaluate the effectiveness of alternatives to traditional snow and ice management practices (that is, abrasives or lower salt application rates) on the reduction of chloride loading to surface water and groundwater. Results of this study show that chloride transport is dynamic and depends on many interacting factors like hydrology, geology, weather conditions, and snow and ice management practices. The results could be used by resource managers to plan snow and ice management strategies within the Adirondack Park in New York and in other snowy regions in North America.
References Cited
Akima, H., and Gebhardt, A., 2022, akima—Interpolation of irregularly and regularly spaced data (ver. 0.6–3.4): R Foundation for Statistical Computing software release, accessed July 2023 at https://CRAN.R-project.org/package=akima.
Bester, M.L., Frind, E.O., Molson, J.W., and Rudolph, D.L., 2006, Numerical investigation of road salt impact on an urban wellfield: Ground Water, v. 44, no. 2, p. 165–175, accessed November 19, 2024, at https://doi.org/10.1111/j.1745-6584.2005.00126.x.
Bolen, W.P., 2021, Salt [advance release], in Metals and minerals: U.S. Geological Survey Minerals Yearbook 2017, v. I, p. 63.1–63.21, accessed January 2, 2025, at https://d9-wret.s3.us-west-2.amazonaws.com/assets/palladium/production/atoms/files/myb1-2017-salt.pdf.
Bradford, S.S., 1963, Adirondack Forest Preserve: National Survey of Historic Sites and Buildings Form 10–317, accessed June 25, 2025, at https://npgallery.nps.gov/NRHP/.
Brady, S.P., Goedert, D., Frymus, L.E., Zamora-Camacho, F.J., Smith, P.C., Zeiss, C.J., Comas, M., Abbott, T.A., Basu, S.P., DeAndressi, J.C., Forgione, M.E., Maloney, M.J., Priester, J.L., Senturk, F., Szeligowski, R., Tucker, A.S., Zhang, M., and Calsbeek, R., 2022, Salted roads lead to oedema and reduced locomotor function in amphibian populations: Freshwater Biology, v. 67, no. 7, p. 1150–1161, accessed December 14, 2023, at https://doi.org/10.1111/fwb.13907.
Brown, C.J., Mullaney, J.R., Morrison, J., and Mondazzi, R., 2011, Preliminary assessment of chloride concentrations, loads, and yields in selected watersheds along the Interstate 95 corridor, southeastern Connecticut, 2008–09: U.S. Geological Survey Open-File Report 2011–1018, 41 p., accessed June 25, 2025, at https://doi.org/10.3133/ofr20111018.
Cassanelli, J.P. and Robbins, G.A., 2013, Effects of road salt on Connecticut’s groundwater—A statewide centennial perspective: Journal of Environmental Quality, v. 42, no. 3, p. 737–748, accessed June 25, 2025, at https://doi.org/10.2134/jeq2012.0319.
Corsi, S.R., Graczyk, D.G., Geis, S.W.Booth, N.L., and Richards, K.D., 2010, A fresh look at road salt—Aquatic toxicity and water-quality impacts on local, regional, and national scales: Environmental Science & Technology, v. 44, no. 19, p. 7376–7382, accessed May 23, 2025, at https://doi.org/10.1021/es101333u.
Demers, C.L., and Sage, R.W., Jr., 1990, Effects of road deicing salt on four Adirondack lakes: Water, Air, and Soil Pollution, v. 49, p. 369–373, accessed December 14, 2023, at https://doi.org/10.1007/BF00507076.
Fisher, B.N., Gutchess, K.M., Scavotto, N.A., and Smith, K.P., 2025, Chloride regression model and mass balance for different deicing salt application rates on three watersheds in Essex County, New York: U.S. Geological Survey data release, https://doi.org/10.5066/P13CJ3D9.
Fishman, M.J., and Friedman, L.C., eds., 1989, Methods for determination of inorganic substances in water and fluvial sediments (3d ed.): U.S. Geological Survey Techniques of Water-Resources Investigations, book 5, chap. A1, 545 p., accessed December 14, 2023, at https://doi.org/10.3133/twri05A1.
Fox, J., and Weisberg, S., 2019, An R companion to applied regression (3d ed.): Thousand Oaks, Calif., Sage, 608 p., accessed November 19, 2024, at https://us.sagepub.com/en-us/nam/an-r-companion-to-applied-regression/book246125.
Geophex Ltd., 2021, Hand-held Gem–2 ski: Geophex Ltd. web page, accessed October 20, 2023, at https://geophex.com/hand-held-gem-2-ski/.
Gianfagna, C.C., Johnson, C. E., Chandler, D. G., and Hofmann, C., 2015, Watershed area ratio accurately predicts daily streamflow in nested catchments in the Catskills, New York: Journal of Hydrology—Regional Studies, vol. 4, part B, p. 583–594, accessed December 14, 2023, at https://doi.org/10.1016/j.ejrh.2015.09.002.
Granato, G.E., 2006, Kendall-Theil Robust Line (KTRLine—version 1.0)—A visual basic program for calculating and graphing robust nonparametric estimates of linear regression coefficients between two continuous variables: U.S. Geological Survey Techniques and Methods, book 4, chap. A7, 31 p, 1 CD–ROM. [Also available at https://doi.org/10.3133/tm4A7.]
Gutchess, K., Jin, L., Lautz, L., Shaw, S.B., Zhou, X., and Lu, Z., 2016, Chloride sources in urban and rural headwater catchments, central New York: Science of the Total Environment, v. 565, p. 462–472, accessed November 19, 2024, at http://doi.org/10.1016/j.scitotenv.2016.04.181.
Harless, M.L., Huckins, C.J., Grant, J.B., and Pypker, T.G., 2011, Effects of six chemical deicers on larval wood frogs (Rana sylvatica): Environmental Toxicology and Chemistry, v. 30, no. 7, p. 1637–1641, accessed December 14, 2023, at https://doi.org/10.1002/etc.544.
Harte, P.T. and Trowbridge, P.R., 2010, Mapping of road-salt-contaminated groundwater discharge and estimation of chloride load to a small stream in southern New Hampshire, USA: Hydrological Processes, v. 24, no. 17, p. 2349–2368, accessed June 25, 2025, at https://doi.org/10.1002/hyp.7645.
Heisig, P.M., 2000, Effects of residential and agricultural land uses on the chemical quality of baseflow of small streams in the Croton watershed, southeastern New York: U.S. Geological Survey Water-Resources Investigations Report 99–4173, 16 p., accessed June 25, 2025, at https://doi.org/10.3133/wri994173.
Helsel, D.R., Hirsch, R.M., Ryberg, K.R., Archfield, S.A., and Gilroy, E.J., 2020, Statistical methods in water resources: U.S. Geological Survey Techniques and Methods, book 4, chap. A3, 458 p., accessed December 14, 2023, at https://doi.org/10.3133/tm4A3. [Supersedes U.S. Geological Survey Techniques of Water-Resources Investigations, book 4, chap. A3, ver. 1.1.]
High Sierra Electronics, 2022, Instruction manual—IceSight Model 5433–3X: Grass Valley, Calif., High Sierra Electronics, 28 p., accessed December 13, 2023, at https://hsierra.com/download/manual-5433-3x-icesight/?wpdmdl=15023&refresh=66e83d495e7fe1726496073.
Jin, L., Whitehead, P., Siegel, D.I., and Findlay, S., 2011, Salting our landscape—An integrated catchment model using readily accessible data to assess emerging road salt contamination to streams: Environmental Pollution, v. 159, no. 5, p. 1257–1265, accessed November 19, 2024, at https://doi.org/10.1016/j.envpol.2011.01.029.
Kassambara, A., 2023, rstatix—Pipe-friendly framework for basic statistical tests (ver. 0.7.2): R Foundation for Statistical Computing software release, at https://CRAN.R-project.org/package=rstatix.
Kelly, V.R., Cunningham, M.A., Curri, N., Findlay, S.E., and Carroll, S.M., 2018, The distribution of road salt in private drinking water wells in a southeastern New York suburban township: Journal of Environmental Quality, v. 47, no. 3, p. 445–451, accessed November 19, 2024, at https://doi.org/10.2134/jeq2017.03.0124.
Kelly, V.R., Lovett, G.M., Weathers, K.C., Findlay, S.E.G., Strayer, D.L., Burns, D.J., and Likens, G.E., 2007, Long-term sodium chloride retention in a rural watershed—Legacy effects of road salt on streamwater concentration: Environmental Science & Technology, v. 42, no. 2, p. 410–415, accessed November 19, 2024, at https://doi.org/10.1021/es071391l.
Kelting, D.L., Laxson, C.L., and Yerger, E.C., 2012, Regional analysis of the effect of paved roads on sodium and chloride in lakes: Water Research, v. 46, no. 8, p. 2749–2758, accessed December 14, 2023, at https://doi.org/10.1016/j.watres.2012.02.032.
Lakoba, V., Wind, L., DeVilbiss, S., Lofton, M., Bretz, K., Weinheimer, A., Moore, C., Baciocco, C., Hotchkiss, E., and Hession, W.C., 2020, Salt dilution and flushing dynamics of an impaired agricultural-urban stream: Environmental Science and Technology Water, v. 1, no. 2, 407–416, accessed June 25, 2025, at https://doi.org/10.1021/acsestwater.0c00160.
Levitt, J.P., and Larsen, S.L., 2020, Groundwater chloride concentrations in domestic wells and proximity to roadways in Vermont, 2011–2018: U.S. Geological Survey Open-File Report 2019–1148, 12 p., accessed June 25, 2025, at https://doi.org/10.3133/ofr20191148.
McNaboe, L.A., Robbins, G.A., and Dietz, M.E., 2017, Mobilization of radium and radon by deicing salt contamination of groundwater: Water, Air, and Soil Pollution, v. 228, article 94, 9 p., accessed December 14, 2023, at https://doi.org/10.1007/s11270-016-3227-y.
Mueller, D.K., Schertz, T.L., Martin, J.D., and Sandstrom, M.W., 2015, Design, analysis, and interpretation of field quality-control data for water-sampling projects: U.S. Geological Survey Techniques and Methods, book 4, chap. C4, 54 p. [Also available at https://doi.org/10.3133/tm4C4.]
National Atmospheric Deposition Program, 2025, Site NTN NY 98 [Annual atmospheric deposition of chloride in pounds for water year 2022]: National Atmospheric Deposition Program database, accessed July 2023 at https://nadp.slh.wisc.edu/sites/ntn-NY98/.
National Oceanic and Atmospheric Administration, 2024, Daily summaries station details [Lake Placid 2 S, NY US; USC00304555]: National Oceanic and Atmospheric Administration dataset, accessed January 3, 2025, at https://www.ncdc.noaa.gov/cdo-web/datasets/GHCND/stations/GHCND:USC00304555/detail.
New York State Department of Environmental Conservation and New York State Department of Transportation, 2023, Adirondack road salt reduction task force assessment and recommendations: Albany, N.Y., New York State Department of Environmental Conservation and New York State Department of Transportation, 30 p., accessed December 14, 2023, at https://extapps.dec.ny.gov/docs/administration_pdf/adirondackroadsaltreport.pdf.
New York State Department of Transportation [NYSDOT], 2006, Snow and ice control, chap. 5 of Highway maintenance guidelines (revised January 2012): Albany, N.Y., New York State Department of Transportation, [variously paged; 80 p.]., accessed December 14, 2023, at https://www.dot.ny.gov/divisions/operating/oom/transportation-maintenance/repository/NYS_SI_Manual_Apr2006_RevJan2012.pdf.
New York State Department of Transportation [NYSDOT], 2020, 2019 traffic volume report—State roads: Albany, N.Y., New York State Department of Transportation, 358 p., accessed December 14, 2023, at https://www.dot.ny.gov/divisions/engineering/technical-services/hds-respository/NYSDOT_2019TrafficVolumeReport-Routes.pdf.
New York State Legislature, 2020, An act to establish the Adirondack road salt reduction task force, pilot plan and test program; and providing for the repeal of such provision upon expiration thereof: New York State Legislature Assembly Bill A8767A, 3 p., accessed January 3, 2025, at https://legislation.nysenate.gov/pdf/bills/2019/A8767A.
New York State Office of General Services, 2023, Contract award notification—Group 01800—Road salt, treated salt, & emergency standby road salt (statewide): Albany, N.Y., New York State Office of General Services Award 23315, 31 p. [Also available at https://ogs.ny.gov/award-23315.]
New York State Office of Information Technology Services, 2023, NYS streets: New York State Geographic Information Systems (GIS) Clearinghouse dataset, accessed December 14, 2023, at https://data.gis.ny.gov/maps/7d5dff6bcf664e6f83abee9968fc7916/about.
Pieper, K.J., Tang, M., Jones, C.N., Weiss, S., Greene, A., Mohsin, H., Parks, J., and Edwards, M.A., 2018, Impact of road salt on drinking water quality and infrastructure corrosion in private wells: Environmental Science & Technology, v. 52, no. 24, p. 14078–14087, accessed December 14, 2023, at https://doi.org/10.1021/acs.est.8b04709.
Rantz, S.E., and others, 1982, Measurement of stage and discharge, v. 1 of Measurement and computation of streamflow: U.S. Geological Survey Water-Supply Paper 2175, p. 1–284, accessed December 14, 2023, at https://doi.org/10.3133/wsp2175.
R Core Team, 2022, R—A language and environment for statistical computing, version 4.2.2 (Innocent and Trusting): R Foundation for Statistical Computing software release, accessed June 25, 2025, at https://www.R-project.org/ and https://cran.r-project.org/src/base/R-4/.
Rhodes, A.L. and Horton, N.J., 2015, Establishing baseline water quality for household wells within the Marcellus Shale gas region, Susquehanna County, Pennsylvania, U.S.A.: Applied Geochemistry, v. 60, p. 14–28, accessed June 25, 2025, at https://doi.org/10.1016/j.apgeochem.2015.03.004.
Robinson, H.K., and Hasenmueller, E.A., 2017, Transport of road salt contamination in karst aquifers and soils over multiple timescales: Science of the Total Environment, v. 603–604, p. 94–108, accessed November 19, 2024, at https://doi.org/10.1016/j.scitotenv.2017.05.244.
Rossi, M.L., Kremer, P., Cravotta, C.A., Scheirer, K.E., and Goldsmith, S.T., 2022, Long-term impacts of impervious surface cover change and roadway deicing agent application on chloride concentrations in exurban and suburban watersheds: Science of the Total Environment, v. 851, part 2, article 157933, 13 p., accessed November 19, 2024, at https://doi.org/10.1016/j.scitotenv.2022.157933.
Sauer, V.B., 2002, Standards for the analysis and processing of surface-water data and information using electronic methods: U.S. Geological Survey Water-Resources Investigations Report 01–4044, 91 p. [Also available at https://doi.org/10.3133/wri20014044.]
Seifert, K.E., Dymek, R.F., Whitney, P.R., and Haskin, L.A., 2010, Geochemistry of massif anorthosite and associated rocks, Adirondack Mountains, New York: Geosphere, v. 6, no. 6, p. 855–899, accessed December 14, 2023, at https://doi.org/10.1130/GES00550.1.
Shaw, S.B., Marjerison, R.D., Bouldin, D.R., Parlange, J., and Walter, M.T., 2012, Simple model of changes in stream chloride levels attributable to road salt applications: Journal of Environmental Engineering, v.138, no. 1, p. 112–118, accessed June 25, 2025, at https://doi.org/10.1061/(ASCE)EE.1943-7870.0000458.
Slater, L. D., and Sandberg, S.K., 2000, Resistivity and induced polarization monitoring of salt transport under natural hydraulic gradients: Geophysics, v. 65, no. 2, p. 408–420, accessed June 25, 2025, at https://doi.org/10.1190/1.1444735.
Smith, K.P., and Granato, G.E., 2010, Quality of stormwater runoff discharged from Massachusetts highways, 2005–07: U.S. Geological Survey Scientific Investigations Report 2009–5269, 198 p., accessed June 25, 2025, at https://doi.org/10.3133/sir20095269/.
Smith, K.P., Spaetzel, A.B., and Woodford, P.A., 2023, Highway-runoff quality from segments of open-graded friction coarse and dense-graded hot-mix asphalt pavement on Interstate 95, Massachusetts, 2018–21: U.S. Geological Survey Scientific Investigations Report 2023–5127, 59 p., accessed November 19, 2024, at https://doi.org/10.3133/sir20235127.
Snodgrass, J.W., Moore, J., Lev, S.M., Casey, R.E., Ownby, D.R., Flora, R.F., and Izzo, G., 2017, Influence of modern stormwater management practices on transport of road salt to surface waters: Environmental Science & Technology, v. 51, no. 8, p. 4165–4172, accessed November 19, 2024, at https://doi.org/10.1021/acs.est.6b03107.
Spaetzel, A.B., and Smith, K.P., 2022, Water-quality conditions and constituent loads, water years 2013–19, and water-quality trends, water years 1983–2019, in the Scituate Reservoir drainage area, Rhode Island: U.S. Geological Survey Scientific Investigations Report 2022–5043, 102 p., accessed November 19, 2024, at https://doi.org/10.3133/sir20225043.
Stets, E.G., Lee, C.J., Lytle, D.A., and Schock, M.R., 2017, Increasing chloride in rivers of the conterminous U.S. and linkages to potential corrosivity and lead action level exceedances in drinking water: Science of the Total Environment, v. 613–614, p. 1498–1509, accessed December 14, 2023, at https://doi.org/10.1016/j.scitotenv.2017.07.119.
Stonewall, A.J., Granato, G.E., and Glover-Cutter, K.M., 2019, Assessing potential effects of highway and urban runoff on receiving streams in total maximum daily load watersheds in Oregon using the Stochastic Empirical Loading and Dilution Model: U.S. Geological Survey Scientific Investigations Report 2019–5053, 116 p., accessed December 14, 2023, at https://doi.org/10.3133/sir20195053.
Sutherland, J.W., Norton, S.A., Short, J.W., and Navitsky, C., 2018, Modeling salinization and recovery of road salt-impacted lakes in temperate regions based on long-term monitoring of Lake George, New York (USA) and its drainage basin: Science of the Total Environment, v. 637–638, p. 282–294, accessed December 14, 2023, at https://doi.org/10.1016/j.scitotenv.2018.04.341.
Swinton, M.W., Eichler, L.W., and Boylen, C.W., 2014, Road salt application differentially threatens water resources in Lake George, New York: Lake and Reservoir Management, v. 31, no. 1, p. 20–30, accessed December 14, 2023, at https://doi.org/10.1080/10402381.2014.983583.
Terry, N., Anderson, A., Woda, J., Baldwin, A., Lucia, I., and Williams, J., 2024, Frequency domain electromagnetic induction (FDEM) geophysical data collected near Lake Placid, NY: U.S. Geological Survey data release, accessed November 19, 2024, at https://doi.org/10.5066/P9QES2KJ.
Toran, L., Johnson, M., Nyquist, J., and Rosenberry, D., 2010, Delineating a road-salt plume in lakebed sediments using electrical resistivity, piezometers, and seepage meters at Mirror Lake, New Hampshire, USA: Geophysics, v. 75, no. 4, p. WA75–WA83, accessed June 25, 2025, at https://doi.org/10.1190/1.3467505.
U.S. Census Bureau, 2022, QuickFacts, Essex County, New York [Population estimates, July 1, 2022, (V2022)]: U.S. Census Bureau database, accessed July 2023 at https://www.census.gov/quickfacts/essexcountynewyork.
U.S. Environmental Protection Agency, 1988, Ambient water quality criteria for chloride—1988: U.S. Environmental Protection Agency EPA 440/5–88–001, 46 p., accessed June 25, 2025, at https://nepis.epa.gov/Exe/ZyPURL.cgi?Dockey=00001N4Q.txt.
U.S. Geological Survey [USGS], 2019, StreamStats: U.S. Geological Survey database, accessed on December 29, 2023 at https://streamstats.usgs.gov/ss/.
U.S. Geological Survey [USGS], 2023, USGS water data for the Nation: U.S. Geological Survey National Water Information System database, accessed December, 2023, at https://doi.org/10.5066/F7P55KJN.
U.S. Geological Survey [USGS], [variously dated], National field manual for the collection of water-quality data, section A of Handbooks for water-resources investigations: U.S. Geological Survey Techniques of Water-Resources Investigations, book 9, 10 chap. (A0–A8, A10), accessed October 20, 2022, at https://pubs.water.usgs.gov/twri9A.
Wagner, R.J., Boulger, R.W., Jr., Oblinger, C.J., and Smith, B.A., 2006, Guidelines and standard procedures for continuous water-quality monitors—Station operation, record computation, and data reporting: U.S. Geological Survey Techniques and Methods, book 1, chap. D3, [variously paged; 51 p., 8 attachments], accessed December 14, 2023, at https://pubs.water.usgs.gov/tm1d3.
Wilhelm, J.F., Bain, D.J., Green, M.B., Bush, K.F., and McDowell, W.H., 2019, Trace metals in northern New England streams—Evaluating the role of road salt across broad spatial scales with synoptic snapshots: PLoS One, v. 14, no. 2, article e0212011, 20 p., accessed December 14, 2023, at https://doi.org/10.1371/journal.pone.0212011.
Wiltse, B., Yerger, E.C., and Laxson, C.L., 2019, A reduction in spring mixing due to road salt runoff entering Mirror Lake (Lake Placid, NY): Lake and Reservoir Management, v. 36, no. 2, p. 109–121, accessed December 14, 2023, at https://doi.org/10.1080/10402381.2019.1675826.
Conversion Factors
U.S. customary units to International System of Units
Temperature in degrees Fahrenheit (°F) may be converted to degrees Celsius (°C) as follows:
°C = (°F – 32) / 1.8.
Temperature in degrees Celsius (°C) may be converted to degrees Fahrenheit (°F) as follows:
°F = (1.8 × °C) + 32.
Datums
Vertical coordinate information is reference to the North American Vertical Datum of 1988 (NAVD 88).
Horizontal coordinate information is referenced to the North American Datum of 1983 (NAD 83) and World Geodetic System of 1984.
Supplemental Information
Specific conductance is given in microsiemens per centimeter at 25 degrees Celsius (µS/cm at 25 °C).
Electrical conductivity is given in millisiemens per meter (mS/m).
Concentrations of chemical constituents in water are given in milligrams per liter (mg/L).
A water year is defined as the period from October 1 to September 30 and designated by the year in which it ends.
A lane mile is defined as a unit of measurement used to quantify the total length of a roadway, determined by multiplying the centerline length of a roadway, in miles, by the number of lanes.
Abbreviations
MOVE.1
Maintenance of Variance Extension Type 1
NWIS
National Water Information System
NWQL
National Water Quality Laboratory
NYSDOT
New York State Department of Transportation
PVC
polyvinyl chloride
R2
coefficient of determination
RMSE
root mean square error
RPD
relative percent difference
USGS
U.S. Geological Survey
For more information, contact:
Director, New York Water Science Center
U.S. Geological Survey
425 Jordan Road
Troy, NY 1280–8349
or visit our website at
https://www.usgs.gov/centers/new-york-water-science-center
Publishing support provided by the Pembroke and Tacoma Publishing Service Centers
Disclaimers
Any use of trade, firm, or product names is for descriptive purposes only and does not imply endorsement by the U.S. Government.
Although this information product, for the most part, is in the public domain, it also may contain copyrighted materials as noted in the text. Permission to reproduce copyrighted items must be secured from the copyright owner.
Suggested Citation
Gutchess, K., Scavotto, N., Dondero, A., Woda, J., Terry, N., Smith, K., and Williams, J., 2025, An evaluation of the effects of different deicing salt application rates on three watersheds in Essex County, New York: U.S. Geological Survey Scientific Investigations Report 2025–5062, 31 p., https://doi.org/10.3133/sir20255062.
ISSN: 2328-0328 (online)
Study Area
| Publication type | Report |
|---|---|
| Publication Subtype | USGS Numbered Series |
| Title | An evaluation of the effects of different deicing salt application rates on three watersheds in Essex County, New York |
| Series title | Scientific Investigations Report |
| Series number | 2025-5062 |
| DOI | 10.3133/sir20255062 |
| Publication Date | November 25, 2025 |
| Year Published | 2025 |
| Language | English |
| Publisher | U.S. Geological Survey |
| Publisher location | Reston, VA |
| Contributing office(s) | New York Water Science Center |
| Description | Report: viii, 31 p.; 2 Data Releases |
| Country | United States |
| State | New York |
| County | Essex County |
| Online Only (Y/N) | Y |
| Additional Online Files (Y/N) | N |