

Assessment of Channel Morphology, Hydraulics, and Bedload Transport along the Siletz River, Western Oregon
Links
- Document: Report (28.7 MB pdf) , HTML , XML
- Data Releases:
- USGS data release - Active channel mapping for the Siletz River, Oregon, 1939 to 2016
- USGS data release - Surficial and subsurface grain-size data for the Siletz River, Oregon, 2017–18
- USGS data release - Modeled bedload transport capacity for the Siletz River, Oregon
- USGS data release - Water surface elevation data from the Siletz River, 2017–18
- USGS data release - One- and two-dimensional hydraulic models for the Siletz River, Oregon
- NGMDB Index Page: National Geologic Map Database Index Page (html)
- Download citation as: RIS | Dublin Core
Acknowledgments
Ian Keene and Issac Kentta from the Confederated Tribes of Siletz Indians of Oregon are gratefully acknowledged for their field data contributions to the study. Gabriel Gordon and Brandon Overstreet with the U.S. Geological Survey (USGS) contributed to the successful collection of a new bathymetric survey along the Siletz River, and Gabriel Gordon implemented the bedrock and channel mapping. John Risley (retired USGS) assisted with the peak discharge analyses, and Adam Stonewall and Jacob Flinn (USGS) provided thoughtful insights that improved the hydraulic modeling and specific gage analyses, respectively. Heather Bervid and Rose Wallick (USGS) contributed expertise that shaped the overall study approach and manuscript.
Significant Findings
Chinook salmon (Oncorhynchus tshawytscha) and Pacific lamprey (Entosphenus tridentatus) are native, anadromous fish species in the Siletz River Basin, western Oregon, that face many threats to their survival in freshwater and the ocean. The Confederated Tribes of Siletz Indians of Oregon seek to mitigate freshwater threats to Chinook salmon and Pacific lamprey, where possible, with habitat conservation and restoration efforts. This study was conducted to assist the Confederated Tribes of Siletz Indians of Oregon in documenting and understanding the hydrogeomorphic processes shaping present-day habitat conditions and assessing future habitat implications for Chinook salmon and Pacific lamprey along the main-stem Siletz River. As such, this study focused on understanding geomorphic processes and patterns of channel change, including lateral and vertical adjustments in channel position and changes in bed-material sediment (sands, gravels, and cobbles that mantle the channel bed), which collectively determine overall patterns of channel morphology and fluvial habitats. Objective One was to evaluate lateral changes in channel position, vertical changes in bed elevation, and longitudinal patterns in bed-material particle size along the Siletz River using detailed channel maps developed from aerial photographs collected from 1939 to 2016, long-term records of stage and discharge collected by the U.S. Geological Survey (USGS) near the City of Siletz, and sediment particle size data. Objective Two was to assess hydraulic conditions using one- and two-dimensional hydraulic models and transport capacity of bed-material sediment using bedload transport models and sediment particle size data for a range of discharge conditions. Objective Three was to identify potential burrowing habitat for lamprey larvae (PBH) along the Siletz River network and provide insights in local factors influencing PBH along the main-stem Siletz River. The overall findings are synthesized to describe habitat implications for Chinook salmon and Pacific lamprey under present-day and future conditions.
Results of Objective One, an evaluation of changes in channel position and bed elevations and longitudinal patterns in bed-material particle size along the Siletz River, include the following:
-
• From 1939 to 2016, channel planform and the mapped area of gravel bars did not change considerably along the 97.2-kilometers (km) of Siletz River between Elk Creek and Millport Slough, except for in short sections generally less than 1 km long. This inherent lateral channel stability results from the resistant bedrock and terraces that bound most of the channel and limit lateral changes in channel position. Intermittent sections along the study reach where the active channel widened at channel bends displayed noticeable planform changes and increases in mapped bar area.
-
• From water year (WY; a 12-month period from October 1 through September 30 and named for the year in which it ends) 1906 to 2021, changes in the stage-discharge relation interpreted as rising and lowering channel bed levels were observed at the USGS streamgage 14305500 (Siletz River at Siletz, OR) in response to floods (such as high flows in February 1996 and January 2002 that exceeded 0.1 and 0.667 annual exceedance probabilities [AEP] events, respectively). However, the rating curve representing the stage-discharge relation did not change in response to high-magnitude floods between 2007 and 2021.
-
• Along the approximately 54-km of the Siletz River between Moonshine Park and the Bulls Bag area, surficial particle distributions varied considerably between sampling sites in response to changes in channel width and gradient, sediment inputs from tributaries, and basin geology. Despite this variability, median particle sizes tended to decrease in size in the downstream direction over the 54 km.
Results of Objective Two, an evaluation of hydraulic and bedload transport conditions along the Siletz River, include the following:
-
• The most substantial increases in maximum and mean water velocity and bedload sediment transport capacity occurred at events between the 0.995 and 0.50 AEPs. Events of these magnitudes occur approximately every 1–2 years. Smaller events (0.995 AEP) are generally contained by the banks of the main channel, whereas larger events (0.50 AEP) generally spill over the banks and inundate high-elevation bar and low-elevation floodplain surfaces.
-
• Multiple smaller floods within a WY that exceed the 0.995 and 0.50 AEPs (such as in WY 1996) can transport as much or more bed-material sediment than a single, higher magnitude event (such as the maximum event recorded in WY 2000 with an estimated AEP of around 0.002).
-
• Bedload transport capacity generally exceeds sediment supply (greater than 2 millimeters [mm]) for most of the study area from Wildcat Creek to the City of Siletz as evidenced by substantial in-channel bedrock. Despite overall conditions of limited sediment supply, transport capacity still varies considerably within and between years with discharge magnitude and spatially in relation to local hydraulics imposed by bedrock, channel morphology, and human infrastructure (such as bridges).
Results of Objective Three, an analysis of PBH for lamprey larvae, include the following:
-
• About 28 percent of the Siletz River network meets the mean annual suspended sediment loads and channel slope criteria for PBH. Along the main-stem Siletz River, in-channel bedrock outcrops and high transport capacity are expected to further constrain PBH.
Together, these results suggest that most of the Siletz River between Wildcat Creek and the City of Siletz has had only modest vertical and lateral change between the 1930s and 2010s because of the bedrock in and along the main channel and the river’s relatively high transport capacity relative to bed-material sediment supply. However, localized sections of the Siletz River where the active channel widens, particularly at channel bends, exhibited some change in channel planform and the locations and area of gravel bars. In the future, moderate increases in autumn-winter discharge may not result in substantial changes in coarse gravel bars along the Siletz River but may result in selective transport of finer bed-material sediment (gravel, sands, and silts) that provide spawning habitats for Chinook salmon and Pacific lamprey and burrowing habitats for lamprey larvae. Assuming no substantial changes in bed-material sediment supply, increased bedload transport capacity may cause frequent entrainment of lamprey larvae that are burrowed in coarse sand deposits, suspension and downstream transport of salmon eggs incubating in gravels, and reductions in the areas of spawning gravels for Chinook salmon and Pacific lamprey. Exact implications of current and future discharge conditions for these species along the Siletz River depends on many factors, including sediment supply, local hydraulics, and the timing of flood events relative to fish life stages.
Introduction
Chinook salmon (Oncorhynchus tshawytscha; including fall and spring runs) and Pacific lamprey (Entosphenus tridentatus) are native, anadromous fish species in the Siletz River Basin on the central Oregon coast (fig. 1). Both species spawn in the main-stem Siletz River and tributaries (Stan van de Wetering, Confederated Tribes of Siletz Indians of Oregon, written commun., 2018). Chinook salmon spawn in coarse sediment (such as cobble, particles 64–256 millimeters [mm] in diameter), with body size determining the spawning substrate size and redd area (Riebe and others, 2014). Chinook salmon spawn during August–December in the Siletz River Basin, so redds, and the fertilized eggs within them, must survive changes in discharge and hydraulics caused by rain events in autumn and freshets in early winter (fig. 2A, C). Juvenile Chinook salmon vary in their stream residence times (Healey, 1991; Myers and others, 1998), but most juvenile Chinook salmon out-migrate by mid-summer of their first year (Stan van de Wetering, Confederated Tribes of Siletz Indians of Oregon, written commun., 2018). In contrast, Pacific lamprey spawn in gravel and cobble (4.5–256 mm in diameter) from February through July in the Siletz River Basin, with embryos largely incubating during base flows in July and August (fig. 2B–C; Clemens and others, 2017). Before out-migrating to the ocean, Pacific lamprey have an extended larval life stage where eyeless larvae burrow primarily in fine sand (0.125–0.5 mm in diameter) for about 3–7 years (Dawson and others, 2015) and filter feed primarily on organic detritus (Sutton and Bowen, 1994).
Chinook salmon and Pacific lamprey are anadromous species that encounter many threats to their survival in freshwater and saltwater. Common threats in freshwater include habitat degradation (Myers and others, 1998; Luzier and others, 2011) and passage barriers (Chelgren and Dunham, 2015; Moser and others, 2015). Common threats in saltwater include changes in ocean conditions and food resources (Myers and others, 1998; Murauskas and others, 2013; Clemens and others, 2019). As of 2025, Chinook salmon along the Oregon coast are not listed as threatened or endangered under the Endangered Species Act of 1973 (Public Law 93–205, 87 Stat. 884, as amended; U.S. Congress, 1973). However, a petitioning to list Chinook salmon in Oregon coastal rivers was made in 2022 by the Native Fish Society, Center for Biological Diversity, and Umpqua Watersheds, in response to population declines and potential extirpation of spring-run populations in the nearby Siuslaw, Coos, and Salmon River Basins along the Oregon coast (National Marine Fisheries Service, 2023). Similarly, the abundance of Pacific lamprey has also declined along the Oregon coast; as of 2025, this species is designated as a “Sensitive Species” by the Oregon Department of Fish and Wildlife (2020) and a “Species of Concern” by the U.S. Fish and Wildlife Service (2019).
In coming decades, changes in annual precipitation and discharge patterns and increases in summer water temperatures are anticipated to further threaten the survival of Chinook salmon and Pacific lamprey in the Pacific Northwest (Clemens and others, 2017; Crozier and others, 2019; Wang and others, 2020). Although the hydrology of the Siletz Basin is expected to remain driven by rainfall with no changes in the seasonality of precipitation, modeling suggests future moderate increases in autumn and winter discharge (up to 19 percent) and reduced spring and summer discharge for the Siletz River (for 2041–2070; Leibowitz and others, 2014). Increases in autumn and winter discharge may alter bedload transport in the main channel, potentially affecting spawning habitats for Chinook salmon and Pacific lamprey and burrowing habitats for lamprey larvae. The combination of reductions in summer discharge and warmer climate are expected to increase summer water temperatures in the Siletz River Basin by about 1.0 degrees Celsius (°C), increasing the vulnerability of Chinook and Coho (O. kisutch) salmon to thermal-related stress (for 2070–2099; Lee and others, 2020) and resulting in earlier out-migrations by juveniles to the ocean and postponed upstream migrations by adults to spawning habitats.
Chinook salmon and Pacific lamprey are culturally significant food resources for the Confederated Tribes of Siletz Indians of Oregon and other Tribes in the Pacific Northwest that have relied on these species for subsistence, ceremony, and medicine for generations (Close and others, 2002; Quaempts and others, 2018). The U.S. Geological Survey (USGS), in cooperation with the Confederated Tribes of Siletz Indians of Oregon and with support from the Bureau of Indian Affairs’ Tribal Climate Resilience Program and USGS Cooperative Matching Funds, developed this study to assist the Confederated Tribes of Siletz Indians of Oregon in understanding the physical processes influencing present-day and future channel characteristics along the Siletz River and potential implications for Chinook salmon and Pacific lamprey.
![Map showing the geomorphic reaches (defined by this study), lithologic province (from
O’Connor and others [2014], that was modified from Ma and others [2009]; Franczyk
and others [2020]), stream network, streamgage (U.S. Geological Survey 2021b), head
of tide, and cities in the Siletz River Basin, western Oregon.](https://pubs.usgs.gov/sir/2025/5063/images/sir20255063_fig01.png)
Geomorphic reaches (defined by this study), lithologic provinces (from O’Connor and others [2014], modified from Ma and others [2009]; Franczyk and others [2020]), stream network (U.S. Geological Survey, 2021a), streamgage (U.S. Geological Survey, 2021b), head of tide, and cities in the Siletz River Basin, western Oregon.
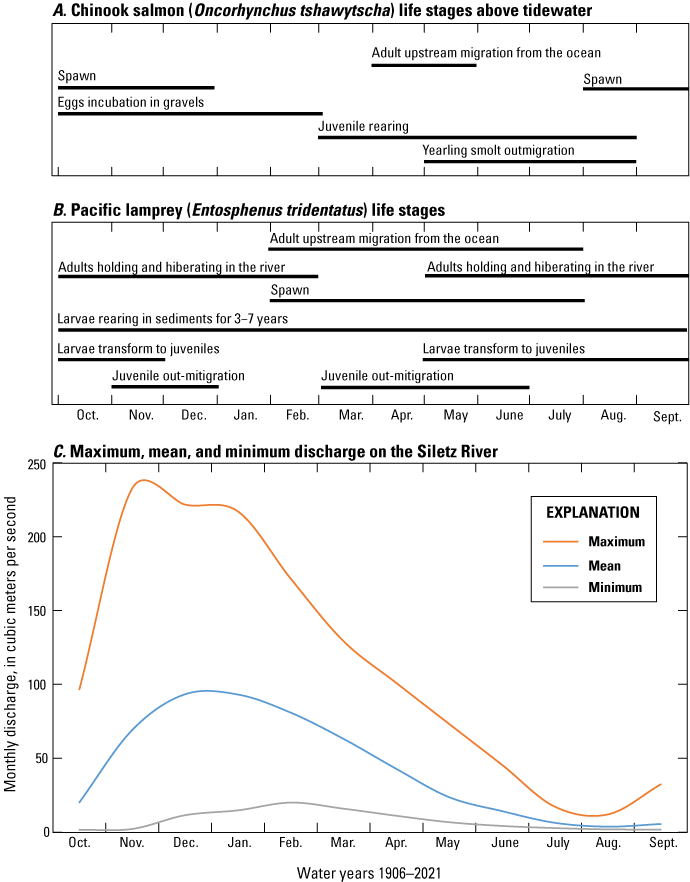
A, Life stages of Chinook salmon (Oncorhynchus tshawytscha) and B, Pacific lamprey (Entosphenus tridentatus) in relation to C, maximum, mean, and minimum monthly discharge for water years 1906–2021 on the Siletz River at Siletz, Oregon (14305500; U.S. Geological Survey, 2021b). The Chinook salmon and Pacific lamprey figures (A and B), originally published in Risley and others (2010), were updated using input from the Confederated Tribes of Siletz Indians of Oregon to represent the life stages of these species in the Siletz River Basin.
Purpose and Scope
This report documents and describes the results of an evaluation of lateral and vertical changes in channel position and longitudinal patterns in bed-material particle sizes, assessment of hydraulics and bedload transport capacity for a range of discharge events, and identification of potential burrowing habitat for lamprey larvae for the Siletz River Basin. This effort focused on characterizing bed-material sediment particles (or sediment particles that make up the bed of river channels) because these are the building blocks of habitat for Chinook salmon and Pacific lamprey. Bed-material sediment particles range from finer sediment (such as clays, silts, and sands) to coarser sediment (such as pebbles, gravels, cobbles, and boulders). The sizes of bed-material sediment particles vary greatly within and between river systems because of many factors, including sediment supply and sediment transport (or the “maximum [sediment] load a river can carry,” Gilbert and Murphy, 1914, p. 35). This effort also focused on understanding bedload transport, which occurs when sands, pebbles, gravels, and cobbles move along the channel bed during high flow events, because bedload transport influences where channels may preferentially transport sediment or deposit sediment suitable for salmon and lamprey spawning habitats and is sensitive to changes in discharge magnitudes.
The report is divided into the following three objectives and associated study components that focus on different reaches or locations along the Siletz River (figs. 1, 3; table 1):
-
• Objective One: Evaluate historical and recent changes in channel morphology and substrate, including channel planform, lateral changes in channel position, vertical changes in bed elevations, and longitudinal patterns in bed-material particle sizes along the Siletz River. Channel morphology and particle size characteristics vary over time and spatially along rivers, demonstrating interactions between hydraulics, bedload sediment transport, and channel morphology with implications for fish habitat. The resulting characterization of channel planform, morphology, and patterns of bed-material particle sizes supports interpretation of the geomorphic processes shaping the Siletz River. These results also provide a geomorphic context for considering the potential for future geomorphic change and inform Objective Two of this study.
-
• Objective Two: Assess hydraulic and bedload sediment transport conditions along the Siletz River for a range of discharge conditions. Findings from these models support an evaluation of inundation, water depths, velocities, and bedload transport from low to high magnitude events and how they might change with future hydrological conditions.
-
• Objective Three: Identify potential burrowing habitat for lamprey larvae (PBH) along the Siletz River and tributaries. This analysis can help inform where watershed-scale patterns of habitat forming processes may support habitat for lamprey larvae and additional local datasets that would help improve habitat identification.
Results from the three objectives are synthesized in the “Summary and Discussion” section and used to develop hypotheses regarding the sensitivity of main-stem spawning habitats for Chinook salmon and Pacific lamprey to current conditions, potential hydrologic changes associated with climate change, and the habitat implications of this study. Where possible, findings are related to those from similar geomorphic studies conducted by the USGS along the Oregon coast (Wallick and others, 2010, 2011; Jones and others, 2011, 2012a–c; O’Connor and others, 2014). The Confederated Tribes of Siletz Indians of Oregon can use this information in their efforts to conserve Chinook salmon and Pacific lamprey and protect and restore aquatic habitats for these species.
![Map showing the particle measurement and pressure transducer locations for this study
(Jones and Keith, 2021; Leahy and others, 2024), modeling reaches for this study (Keith
and Jones, 2025; White and others, 2025) and a previous study by the Bureau of Reclamation
(Foster and Bountry, 2017), bridges, streamgage (U.S. Geological Survey 2021b), river
kilometers (rkm), and lithologic provinces (from O’Connor and others [2014], which
was modified from Ma and others [2009]; Franczyk and others [2020]) for the Siletz
River, western Oregon.](https://pubs.usgs.gov/sir/2025/5063/images/sir20255063_fig03.png)
Particle measurement and pressure transducer locations for this study (Jones and Keith, 2021; Leahy and others, 2024), modeling reaches for this study (Keith and Jones, 2025; White and others, 2025) and a previous study by the Bureau of Reclamation (Foster and Bountry, 2017), bridges, streamgage (U.S. Geological Survey, 2021b), river kilometers, and lithologic provinces (from O’Connor and others [2014], modified from Ma and others [2009]; Franczyk and others [2020]) for the Siletz River, western Oregon.
Table 1.
Study objectives, study components, and associated study reaches or locations along the Siletz River, western Oregon.[See figures 1 and 3 for reaches and locations for the study components. Abbreviations: rkm, river kilometer; OR, Oregon; USGS, U.S. Geological Survey]
| Objective | Study component | Study reach or location along the Siletz River | |
|---|---|---|---|
| 1—Evaluation of changes in geomorphic characteristics and channel position, changes in bed elevation, and longitudinal patterns in bed-material particle sizes | Mapping from 1939 and 2016 photographs (Gordon and others, 2021) | One reach from Elk Creek to the area upstream from Millport Slough (rkm 104.3–7.1) | |
| Mapping from 1994, 2000, and 2009 photographs (Gordon and others, 2021) | Seven, short (0.5–1 rkm) sub-reaches from Wildcat Creek to the City of Siletz (rkm 87.2–68.5) | ||
| Specific gage analysis (using methods from England and others [2018]) | USGS streamgage 14305500 (Siletz River at Siletz, OR; rkm 71.4; U.S. Geological Survey, 2021b) | ||
| Bed-material particle size measurements (Jones and Keith, 2021) | Data at gravel bars and riffles from Wildcat Creek to the City of Siletz (rkm 87.2–68.5) collected by this study; 35 gravel bars collected from the City of Siletz to the Bulls Bag area (rkm 68.4–33.4) by the Confederated Tribes of Siletz Indians of Oregon in 2014 | ||
| 2—Evaluation of hydraulic and bedload transport conditions | One-dimensional model (White and others, 2025) | One reach from Moonshine Park to the City of Siletz (rkm 87–68) | |
| Two-dimensional model (White and others, 2025) | Sub-reach near Twin Bridges (rkm 77–74) | ||
| Bedload transport capacity (Keith and Jones, 2025) | One reach from Moonshine Park to the City of Siletz (rkm 87–68) | ||
| 3—Analysis of potential burrowing habitat for lamprey larvae | Potential burrowing habitat for lamprey larvae analyses (using methods from Jones and others [2020]) | Siletz stream network from the National Hydrography Dataset |
Linear Referencing and Reporting Units
Locations within the study area are referenced to river kilometer (rkm; figs. 1, 3) developed from the National Hydrography Datasets (NHD) 1:24,000 scale flowlines (U.S. Geological Survey, 2021a). Points were distributed along the flowline (which approximately corresponds to channel centerline), and the values increase in the upstream direction from the river mouth. The rkm linear reference system differs from the river mile (RM) linear reference system shown on the recent USGS topographic quadrangle maps for the Siletz River, mainly because the rkm system begins at the Pacific Ocean, whereas the RM system begins approximately 3.4 km upstream. Locations describing the lateral margins and overbank areas are referenced as right and left side of the channel, determined as if looking downstream.
Where possible, the names for the study reaches were assigned based on reach attributes, major tributaries, or nearby towns. Names of locations and the bed-material sampling sites were derived largely from place names on USGS topographic maps, but in some cases were assigned informal names based on nearby places.
Data in this publication are reported in metric units (International System of Units). Discharge data are also provided in English units because English units are more commonly used by partners in the Siletz River Basin. Conversions to English units are provided in the “Conversion Factors” section of this report.
Description of Study Area
Study Basin
The Siletz River Basin, located on the central Oregon coast, drains about 970 square kilometers (km2) before flowing into the Pacific Ocean south of Lincoln City (fig. 1). The headwaters of the Siletz Basin lie in the rugged Oregon Coast Ranges, which are affected by shallow landslides, debris flows, and deeper earthflows and landslides. The overall longitudinal profile of the Siletz River is concave throughout the study area, except for substantial drops near Valsetz Falls at rkm 106.3 and the Siuslaw National Forest bridge near rkm 94 (figs. 1, 4). The Siletz River is affected by tide downstream from Cedar Creek at rkm 39.5 (Oregon Department of State Lands, 2017; fig. 1).
The mountainous portions of the Siletz River Basin are underlain by two distinct bedrock lithologic provinces: Coast Range sedimentary rocks and Coast Range volcanic rocks (following the lithologic provinces categorization by O’Connor and others, 2014). A third lithologic province comprised of unconsolidated Quaternary deposits forms the valley bottoms (fig. 1). Streams in the Coast Range sedimentary rocks province, made up of mostly Tertiary marine sediment, tend to have the highest relative yields of suspended sediment in western Oregon (Wise and O’Connor, 2016; Wise, 2018) and high rates of delivery and rapid disintegration of bed-material sediment particles (cobbles, gravels; O’Connor and others, 2014, 2021). In contrast, streams in the Coast Range volcanic rocks lithologic province, made up of mostly Tertiary volcanic rocks, tend to have more gravel and less transport of suspended sediment (Wise and O’Connor, 2016; Wise, 2018), in part caused by lower rates of clast disintegration and conversion to suspended sediment during transport (O’Connor and others, 2021).
The Siletz River channel is inset within a valley bound by Pleistocene and Holocene terraces. The Pleistocene terraces are approximately 20–60 meters (m; 70–200 feet [ft]) above the current (2021) channel, but discontinuous along the river (Harden, 2013). The dominant terrace flanking the Siletz River is early Holocene (Harden, 2013), rises 12–15 m (40–50 ft) above the current channel, and is continuous along most of the study reach area downstream from rkm 72.8. This terrace is generally broad, planar, and extensively cultivated. Three mid-to-late Holocene terraces 6–11 m (20–35 ft) are above the current channel, with the youngest terrace at least 1,700–1,800 years old (Harden, 2013).
Like other river basins along the Oregon coast, the Siletz River Basin has been shaped by human alterations. Key channel alterations include logging and in-channel log drives from the 1880s through the mid-1900s (Miller, 2010) and more recently large wood removal (Oregon Department of Fish and Wildlife, 1997) and gravel bar modifications by landowners (Stan van de Wetering, Confederated Tribes of Siletz Indians of Oregon, oral commun., 2021). Logging remains a dominant land use, but other uses now include agriculture, residential uses, and urban development (Oregon Department of Fish and Wildlife, 1997). The basin is mostly private lands with public lands limited to the North Fork Siletz River and Rock, Drift, and Schooner Creeks.
Hydrology
The hydrology of the Siletz River Basin is driven by large, regional storms that result in the rapid delivery of rainfall to the river network. This rapid runoff is enhanced by the basin’s steep topography that is dissected by a dense and well-integrated stream network. In summer, warm, dry weather reduces the river to baseflow. The USGS has collected discharge data at the USGS streamgage 14305500 since 1905 (Siletz River at Siletz, OR; U.S. Geological Survey, 2021b). Mean discharge for WY 1906–1911 and 1926–2020 was 42.8 cubic meters per second (m3/s; 1,510 cubic feet per second [ft3/s]; U.S. Geological Survey, 2021b). The 7-day minimum discharge of record was 1.29 m3/s (45.4 ft3/s) on August 31, 2003. The instantaneous peak discharge of record was 1,520 m3/s (53,800 ft3/s) on November 26, 1999 (fig. 5).
Ninety-nine annual peak event records for WY 1906–2016 (no available records for WY 1913–24) tabulated at Siletz River streamgage 14305500 (U.S. Geological Survey, 2021b) enable calculation of annual exceedance probabilities (AEP) for annual peak flows. The AEP is the probability of a specified discharge being equaled or exceeded each year. For example, the discharge of 0.2 AEP event has a 20 percent chance of being equaled or exceeded in a water year. The Siletz River discharge values associated with a range of AEPs, from 0.995 to 0.002, were calculated using the software PeakFQ version 7.2 (Flynn and others, 2006; https://water.usgs.gov/software/PeakFQ/) in accordance with USGS Bulletin 17C protocols (England and others, 2018; table 2). It is uncertain how the 12 years of missing record for WY 1913–24 affect the analysis, but comparison of annual precipitation (PRISM Climate Group, 2018) at the streamgage with the peak-flow record suggested that no extreme high or low annual peak events outside of the long-term record occurred during this period (J. Risley, U.S. Geological Survey, Hydrologist and Surface Water Specialist (retired), written commun., April 2018), hence the missing record likely has little significant effect. Peak discharge values were computed for 15 AEPs (table 2). Of these, the 0.995, 0.5, 0.1, 0.02, 0.01, and 0.002 AEPs were used for the hydraulic and sediment transport modeling done by this study.
Of the 10 annual peak floods exceeding the 0.1 AEP, 7 have occurred since WY 1996 (table 3). The annual peak of record at Siletz River streamgage 14305500 occurred November 26, 1999 (1,520 m3/s; 58,300 ft3/s). The lowest annual peak on record was in WY 2001 at 169 m3/s (5,980 ft3/s, December 22, 2000). A large ungaged flood in 1921, resulting from a large rain event and subsequent log-pond dam break at Valsetz, caused flooding that inundated much of the city of Siletz (U.S. Federal Insurance Administration, 1980) and “destroyed every bridge downstream on the Siletz River” (Bureau of Land Management, 1996, page xciii).
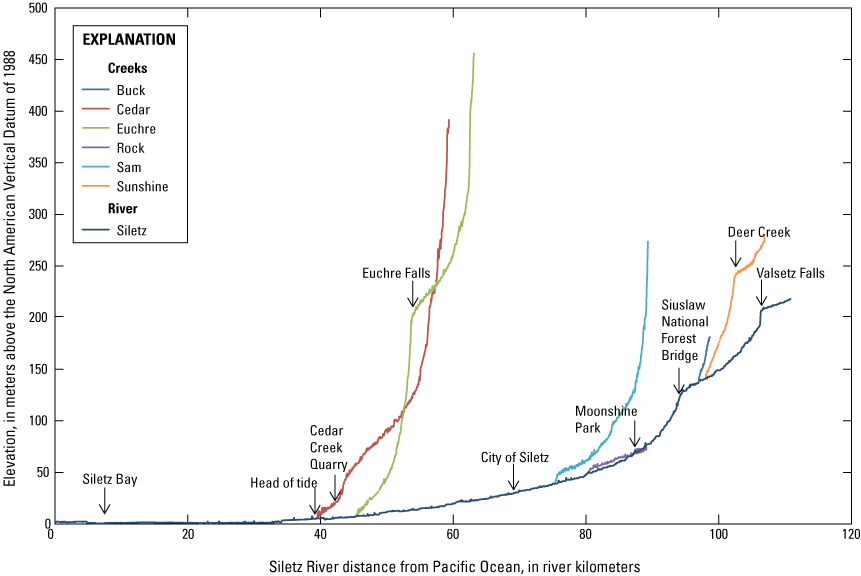
Longitudinal profiles for the Siletz River Basin, western Oregon, downstream from the confluence of the North and South Forks of the Siletz River. Profiles determined using light detection and ranging (lidar) elevations (Watershed Sciences, Inc. 2009a, b109, 2010a, b111, 2012a, b113) along the National Hydrography Dataset streamlines (U.S. Geological Survey, 2021a).
![Annual peak discharge for water years (WY) 1906–2021 measured at the U.S. Geological
Survey streamgage 14305500 (Siletz River at Siletz, OR), western Oregon. Discharge
values associated with annual exceedance probability values (table 2) are from water
year 1906–2016 (excluding water years 1913–24). [m3/s; cubic meter per second; Nov.,
November; Feb., February; Dec., December]](https://pubs.usgs.gov/sir/2025/5063/images/sir20255063_fig05.png)
Annual peak discharge for water years (WY) 1906–2021 measured at the U.S. Geological Survey streamgage 14305500 (Siletz River at Siletz, OR; U.S. Geological Survey, 2021b), western Oregon. Discharge values associated with annual exceedance probability values (table 2) are from water year 1906–2016 (excluding water years 1913–24). [m3/s; cubic meter per second]
Table 2.
Annual exceedance probability values for the U.S. Geological Survey (USGS) streamgage 14305500 (Siletz River near Siletz, OR; U.S. Geological Survey, 2021b) determined for 98 years of record (water years 1906–2016; excluding water years 1913–24) using Bulletin 17C (England and others, 2018).[The 0.995, 0.5, 0.1, 0.02, 0.01, and 0.002 annual exceedance probabilities (AEP) values shown in bold were used for the hydraulic and sediment transport modeling done by this study. The Siletz River discharge values associated with AEPs, ranging from 0.995 to 0.002, were calculated using the software PeakFQ version 7.2 (Flynn and others, 2006; https://water.usgs.gov/software/PeakFQ/) in accordance with U.S. Geological Survey Bulletin 17C protocols (England and others, 2018) for extended moments analysis (EMA) with the Multiple Grubbs-Beck low outlier filter option A regional skew coefficient (−0.070) and skew standard error (0.424) were taken from Mastin and others (2016). The maximum and minimum peak discharge events of the systematic record (1,520 and 169 cubic meters per second respectively) were used for the upper and lower thresholds in the EMA analysis. Abbreviations: OR, Oregon; m3/s, cubic meters per second; ft3/s, cubic feet per second]
Table 3.
The 10 highest annual peak discharge events recorded at U.S. Geological Survey streamgage 14305500 (Siletz River near Siletz, OR; U.S. Geological Survey, 2021b).[Water year: A water year extends from October 1 through September 30. Date: Dates given in MM/DD/YYYY, month/day/year. Abbreviations: OR, Oregon; AEP, annual exceedance probability; m3/s, cubic meters per second; ft3/s, cubic feet per second]
Geomorphology and Geomorphic Reaches
Channel characteristics, such as gradient and active channel width, influence hydraulics, sediment transport, and fish habitat along the Siletz River. For most of the 97.2 km between Elk Creek and Millport Slough (fig. 1), the Siletz River occupies a single-thread, sinuous channel flanked by canyon walls or terraces which limit the floodplain and channel widths. The channel has a “mixed bed” (also referred to as “semi-alluvial,” for example Howard, 1980, 1998; Lisle, 2012; Turowski, 2012), alternating between sections of bedrock and alluvium. Alluvium generally ranges from boulders and cobbles in upper reaches to gravel and sand in lowermost reaches. Although the Siletz River has sinuous segments, many of these sinuous sections are within entrenched meander bends, whose overall planform was likely established prior to uplift of the Oregon Coast Ranges. For this study, the active channel was defined as the area typically inundated during annual high discharge events and encompasses alluvial features formed by frequent bedload transport (Church, 2006). These alluvial features include the low-flow channel, side channels, and vegetated and unvegetated gravel bars. Floodplain areas, which evolve by occasional deposition of fine-grained suspended sediment during floods, generally are narrow and discontinuous along the river.
The study area was delineated into geomorphic reaches based on channel characteristics (including geology, channel gradient, active channel and floodplain width, and the presence of alluvial features) that were assessed using geologic maps, longitudinal profiles of water surface elevations (fig. 4), and aerial photographs taken in 2016. These six geomorphic reaches are summarized below (fig. 1; table 4).
-
• Upper Canyon reach from Elk to Sunshine Creeks (rkm 104.3–97.9). This reach has a water surface gradient of 6 percent and average active channel width of 30 m (table 4). This confined reach is entirely within the Siletz River Volcanics (Smith and Roe, 2015; Franczyk and others, 2020), has little to no floodplain, and is bounded by canyon walls. The channel flows over bedrock and alluvial deposits and has few gravel bars. The overall morphology is cascade to step-pool (Buffington and Montgomery, 2022).
-
• Lower Canyon reach from Sunshine Creek to the area downstream from Wildcat Creek (rkm 97.9–88.6). The reach has a water surface gradient of 8 percent and average active channel width of 40 m (table 4). This reach is dominated by Siletz River Volcanics and intrusions informally named Mary’s Peak Intrusives (Smith and Roe, 2015; Franczyk and others, 2020). This relatively confined reach is the steepest of all the study reaches. Like the Upper Canyon reach, the channel in the Lower Canyon reach intermittently flows over bedrock with few gravel bars. Channel morphology is predominantly cascade to step-pool (Buffington and Montgomery, 2022).
-
• Upper Sandstone reach downstream from Wildcat Creek to Rock Creek (rkm 88.6–80.4). The reach is relatively confined with a water surface gradient of 3 percent and average active channel width of 40 m (table 4). Here, the mixed-bed Siletz River transitions from the volcanic canyons of upper reaches to a lower-gradient section flanked by more erodible geologic units, including Quaternary terraces and older Eocene sedimentary rocks of the Tyee Formation (Smith and Roe, 2015; Franczyk and others, 2020). This reach has short sections (less than 0.3-km long) where the active channel widens up to 100 m. Gravel bars are mainly present at channel bends or tributary confluences. The Upper Sandstone reach is a single-thread channel dominated by bedrock and pool-riffle morphology (Buffington and Montgomery, 2022).
-
• Sam Creek reach from Rock Creek to the City of Siletz (rkm 80.4–68.8). The reach has a water surface gradient of 2 percent and average active channel width of 50 m (table 4). The mixed-bed channel is relatively confined, single thread, and bound by Quaternary terraces and sedimentary rocks of the Tyee Formation with bedrock intermittently exposed in and along the channel. Gravel bars are present where the active channel widens. The Lower Sandstone reach is dominated by bedrock and pool-riffle morphology (Buffington and Montgomery, 2022).
-
• Mill Creek reach from the City of Siletz to the head of tide at Cedar Creek (rkm 68.8–39.5). This reach has a water surface gradient of 1 percent and average active channel width of 40 m (table 4). The general flow direction of the Mill Creek reach turns northward through Pleistocene and Holocene terrace deposits (Harden, 2013) and Eocene sedimentary outcrops of the Tyee and Yamhill Formations (Smith and Roe, 2015; Franczyk and others, 2020). The reach has gravel bars at channel bends and flanking the channel and some in-channel bedrock features. Alluvial cover is more continuous in this reach compared to the upstream reaches. The single-thread channel in the Mill Creek reach ends at the head of tide and is dominated by bedrock and pool-riffle morphology (Buffington and Montgomery, 2022).
-
• Tidal reach from the head of tide at Cedar Creek to Millport Slough (rkm 39.5–7.1). This reach is affected by tide and has a water surface gradient of 1 percent and average active channel width of 60 m (table 4). The channel bed in this reach is mostly covered with alluvium and has a few gravel bars and minimal in-channel bedrock (one mapped bedrock feature at rkm 29). The Tidal reach is a single thread channel with dune-ripple morphology (Buffington and Montgomery, 2022). Downstream from the Tidal reach, the Siletz River enters Siletz Bay where the channel corridor widens with tidal flats before the river enters the Pacific Ocean south of Lincoln City.
Table 4.
Geomorphic reaches for river kilometers 104.3–7.1 along the Siletz River, western Oregon.[Rkm: Determined from National Hydrologic Dataset (U.S. Geological Survey, 2021a). Gradient (%): Determined from light detection and ranging (lidar) water surface elevations (Watershed Sciences, Inc., 2009a, b109, 2010a, b111, 2012a, b113). Average active channel width: Determined from 2016 active channel mapping (Gordon and others, 2021). Abbreviations: rkm, river kilometers; %, percent; m, meters]
| Geomorphic reach |
Short description |
Rkm | Gradient (meters per meter) |
Gradient (%) |
Average active channel width (m) |
Dominant channel morphology |
Bed type |
Description |
|---|---|---|---|---|---|---|---|---|
| Upper Canyon | Elk Creek to Sunshine Creek | 104.3–97.9 | 0.06 | 6 | 30 | Cascade to step-pool | Mixed bed | The channel flows over bedrock and alluvial deposits and has few gravel bars. This confined reach has little to no floodplain and is entirely within the Siletz River Volcanics. |
| Lower Canyon | Sunshine Creek to the upstream end of Moonshine Park | 97.9–88.6 | 0.08 | 8 | 40 | Cascade to step-pool | Mixed bed | In this confined reach, the channel flows over bedrock and alluvial deposits, and gravel bars increase downstream from Sunshine Creek. This is the steepest reach, with water surface elevations dropping substantially, starting at rkm 94. This reach is dominated by Siletz River Volcanics and Mary’s Peak Intrusives (Smith and Roe, 2015; Franczyk and others, 2020) and has some mapped Quaternary terraces. |
| Upper Sandstone | Moonshine Park to Rock Creek near Logsden | 88.6–80.4 | 0.03 | 3 | 40 | Bedrock and pool-riffle | Mixed bed | This relatively confined reach has short sections where the active channel widens and gravel bars are present at channel bends and tributary confluences. The channel flows over bedrock and alluvial deposits. In this and downstream geomorphic reaches, the Siletz River is bound by alluvial and terrace deposits and flows through Tyee Formation sedimentary rocks. |
| Sam Creek | Rock Creek near Logsden to the City of Siletz | 80.4–68.8 | 0.02 | 2 | 50 | Bedrock and pool-riffle | Mixed bed | The channel is relatively confined for most of the reach with bedrock intermittently visible in and along the channel. Where the active channel widens, large gravel bars are present. |
| Mill Creek | City of Siletz to the head of tide at Cedar Creek | 68.8–39.5 | 0.01 | 1 | 40 | Bedrock and pool-riffle | Alluvial to mixed bed | The reach has intermittent gravel bars at channel bends and flanking the channel and mapped bedrock. |
| Tidal | Head of tide at Cedar Creek to Millport Slough | 39.5–7.1 | 0.01 | 1 | 60 | Dune-ripple | Alluvial | This reach is affected by tide and has few gravels. Channel width increases toward the mouth of the Siletz River. Bedrock mapped at rkm 29 in 1939 by this study and documented in Gordon and others (2021). |
Previous Hydrogeomorphic Studies
This study was guided by previous hydrogeomorphic studies in the Siletz River Basin. These include assessments of future discharge and water temperatures by Leibowitz and others (2014) and Lee and others (2020), hydraulic modeling by the Bureau of Reclamation (Reclamation), and two geomorphology studies by Reclamation. Reclamation completed three models for the Siletz River between rkm 67–7 (labeled as “Reclamation model reach” on fig. 3) to inform habitat restoration: (1) a one-dimensional (1D) unsteady flow model from the City of Siletz to Strome County Park (rkm 68–29.5), (2) a 1D steady flow model from Strome County Park to downstream from Millport Slough (rkm 29.5–4.5), and (3) a two-dimensional (2D) steady flow model from downstream from Cedar Creek to Strome County Park (rkm 39.2–29.5, or the Bulls Bag area; fig. 3; Foster and Bountry, 2017). Reclamation also assessed changes in gravel bars from the 1930s to 2012 (Derouin, 2015) and mapped terraces (Harden, 2013) on three sections of the Siletz River from the City of Siletz to approximately Roots Creek (rkm 68.5–27.8; fig. 3). Overall, Derouin (2015) found relatively minor changes in the size and location of most bars along this section of the Siletz River from the 1930s to 2012. Also, the location of the Siletz River channel was laterally stable in this section, except for short sections with lateral migration associated with landslides or the combination of bank erosion and point bar deposition along meander bends (Harden, 2013).
Lateral and Vertical Channel Conditions and Longitudinal Bed-Material Particle Patterns
Objective One had three components: (1) an assessment of broad-scale changes in channel characteristics along the Siletz River from Elk Creek to Millport Slough (rkm 104.3–7.1) using channel maps derived from aerial photographs collected from 1939 to 2016, (2) specific-gage analyses to examine vertical changes in bed elevations at Siletz River streamgage 14305500 (rkm 71.4), and (3) an evaluation of the relations between transport capacity and bed-material sediment supply for the 18.8-km long study reach of the Siletz River from Palmer Creek to the Bulls Bag area (rkm 87.2–33.4) using field observations and particle size measurements made in August 2017 and July 2018 by the USGS and Confederated Tribes of Siletz Indians of Oregon and in 2014 by the Confederated Tribes of Siletz Indians of Oregon (fig. 3; table 1). The resulting characterizations of planform, channel morphology, and the patterns of alluvial deposits are used to interpret basic controls on channel processes and provide the fundamental geomorphic context for understanding past geomorphic changes along the Siletz River corridor, the potential for future changes, and habitat implications for Chinook salmon and Pacific lamprey. The following sections summarize each of the study components and key findings.
Assessment of Changes in Channel Characteristics and Planform, 1939–2016
Mapping Study Reach
Changes in channel characteristics and planform were assessed with repeat geomorphic mapping. This study component focused on a 97.2-km-long reach of the Siletz River from Elk Creek to Millport Slough (rkm 104.3–7.1) for 2 periods (calendar years 1939 and 2016) with additional mapping periods (1994, 2000, and 2009) for 7 smaller sub-reaches between Palmer Creek and the City of Siletz (rkm 87.2–68.5; fig. 3; table 1). The upstream drainage area of Siletz River is 224 km2 at Elk Creek, 298 km2 at Palmer Creek, and 782 km2 at Millport Slough. Tributaries in the study area with drainage areas of more than 30 km2 include Sunshine (31 km2), Mill (34 km2), Rock (111 km2), Sam (39 km2), Euchre (35 km2), and Cedar (35 km2) Creeks (U.S. Geological Survey, 2019).
Mapping Methods
Landforms greater than 250 m2 in area within the active channel were mapped at a scale of 1:2,500 in a geographic information system (GIS; ArcGIS™ 10). The active channel is defined as the area typically inundated during annual high discharge events and includes the low-flow main channel, secondary water features (for example, ponds and alcoves), bedrock, and gravel bars (both vegetated and unvegetated). Channel maps were repeatedly verified to ensure consistent delineation of features among years and throughout the study area following the protocol of Wallick and others (2011). These maps (Gordon and others, 2021) provide an inventory of the landforms and channel features from which to assess spatial and temporal changes in the location and areal coverage of landforms, such as gravel bars.
Geomorphic maps for the Siletz River from Elk Creek to Millport Slough (rkm 104.3–7.1; fig. 3; table 1) were developed using aerial photographs from 1939 and 2016. Scanned copies of the black and white photographs collected in 1939 were acquired from the University of Oregon Map and Aerial Photography Library. These photographs were geo-referenced using the U.S. Department of Agriculture’s National Agriculture Imagery Program one-meter resolution digital orthophotographs acquired in 2016 for the study area. The rectified and mosaicked photographs from 1939 are published by Gordon and others (2021). The 2016 orthophotographs are available from the National Agriculture Imagery Program (2016).
Geomorphic maps were also made using orthophotographs collected in 1994, 2000, and 2009 (National Agriculture Imagery Program, 1994, 2000, 2009; National Agriculture Imagery Program, 2009) for seven mapping sub-reaches (about 0.5–1.0-km-long) between Palmer Creek and the City of Siletz (rkm 87.2–68.5; fig. 3; table 1). Sub-reaches were numbered 1–7 increasing upstream. Sub-reaches were selected based on where the Siletz River channel moved laterally between 1939 and 2016. Sub-reaches, except for the sub-reach near rkm 85, encompass gravel bars where particle measurements were made for this study (fig. 3).
Channel Mapping Uncertainty
Digital channel maps have many sources of uncertainty, including the quality of underlying photographs, errors introduced by geo-referencing and digitizing processes, and differences in discharge conditions at the time of aerial photograph acquisition that influence how much of the channel is underwater when mapping (Gurnell, 1997; Mount and Louis, 2005; Hughes and others, 2006; Walter and Tullos, 2010). The photographs from 1994, 2000, 2009, and 2016 were generally of adequate resolution and free of glare and shadow to facilitate detailed mapping of bars and channel features. Aerial photographs from 1939 had some glare, shadow, or low resolution along the mapping corridor. Uncertainty associated with the geo-referencing process resulted in an average root mean square error of 3.7 m for the overall study area (ranging from 0.35 to 12 m for each photograph; Gordon and others, 2021). A qualitative inspection of the location of static features (for example, bedrock) within the 1939 mosaic relative to those in the 2016 imagery indicate offset is smallest near the channel where most control points were placed (coinciding with active channel mapping) and increases towards the edge of the mosaic.
Water levels at the time of photograph collection may influence bar exposure and wetted channel width, influencing the mapping area of bar and wetted channel features. Overall, discharge was generally lowest during the 2000 photography collection (mean daily discharge of 3.0–3.4 m3/s) and then slightly greater during the 1939 (5.3 m3/s), 2016 (6.7–7.7 m3/s), and 2009 (7.5 m3/s; table 5) photograph collection. Discharge during the 1994 photography was substantially greater (13 m3/s). Discharge differences between the photographs likely have some effects on year-to-year comparisons of mapped features. In particular, the channel maps made from the 1994 photographs likely have greater wetted areas and reduced bar areas compared to channel maps from other years due to the elevated discharge during the collection of the aerial photographs in 1994. The effects of discharge and varying levels of inundation of mapped features for different discharges were not systematically quantified for this study but could be evaluated in future studies using methods described in Wallick and others (2011) or results of the 1D hydraulic model produced by this study. For comparison, the stage difference between the maximum and minimum main discharge (table 5) as determined from the stage-discharge relation (number 16.0) is about 0.28 m (0.92 ft) at the Siletz River streamgage (USGS station 14305500). The combination of water levels and tide in the Tidal reach may have also affected the mapping. Limited tidal records overlap with mapping periods for Siletz Bay, so the effect of tides on mapping was not systematically evaluated. However, the difference between mean lower low water and mean higher high water recorded over a 3-month period in 2017 for USGS station 9435992 (Chinook Bend, Siletz River) was 1.683 m (National Oceanic and Atmospheric Administration, 2023).
Table 5.
Discharge for the aerial and orthophotographs (National Aerial Photography Program, 1994, 2000; National Agriculture Imagery Program, 1994, 2000, 2009, 2016; Gordon and others, 2021) used for repeat bar and channel delineation as determined using U.S. Geological Survey streamgage 14305500 (Siletz River at Siletz, OR; U.S. Geological Survey, 2021b) in the Siletz River study area, western Oregon.[Dates given in MM//DD//YYYY, month/day/year. Abbreviations: --, no data; rkm, river kilometer; m3/s, cubic meter per second]
Mapping Results
Active Channel Characteristics, 2016
The Siletz River flows through six geomorphic reaches with varying channel characteristics (table 4) as the river traverses the steep, confined reaches to the tidally affected, low gradient reach (rkm 104.3–7.1). In 2016, the mapped area of the primary wetted channel generally increased downstream (fig. 6A). Accordingly, the mapped areas of gravel bars and bedrock fluctuated between these reaches (fig. 6B–C). Mapped bar area per rkm was the greatest in the Sam Creek, Upper Sandstone, and Lower Canyon reaches. Mapped bedrock area per rkm was the greatest near rkm 60.0 in the Mill Creek reach and throughout the Upper and Lower Canyon reaches. Mapped secondary water features were few and mostly low elevation portions of bars that were submerged at the time of the aerial photograph collection (fig. 6D). The mapped area of secondary water features did not include some side channels around islands (such as near rkm 95.8, 94.6, 88.8, 88.2, and 74.9) that were mapped as part of the main channel.
Channel characteristics from the detailed 2016 mapping are summarized here by the six geomorphic reaches along the Siletz River:
-
• Upper Canyon reach from Elk to Sunshine Creeks (rkm 104.3–97.9; fig. 7A–B; table 6). From Elk Creek to the area downstream from Holman Creek (rkm 104.3–99.8), the active channel was narrow (10–55 m), had few gravel bars along the inside of channel bends and downstream from Holman Creek, and flowed over and along bedrock outcrops. From rkm 99.8–98.9, the active channel widened, ranging from 20 to 80 m. This stretch contained several large gravel bars (up to 5,360 m2) on the inside of channel bends (such as at rkm 99.7) and flanking the channel, and the only secondary water feature mapped in this reach. From rkm 98.9 to 97.9, the width of the active channel decreased, ranging from 20 to 40 m.
-
• Lower Canyon reach from Sunshine Creek to downstream from Wildcat Creek (rkm 97.9–88.6; fig. 8A–C; table 6). Downstream from Sunshine Creek to rkm 94.6, the active channel widened (ranging from 20 to 80 m). Gravel bars were larger (ranging from about 250 m2 up to 7,800 m2) and more abundant downstream from Sunshine Creek. This section had gravel bars on the inside of channel bends (such as at rkm 96.4) and flanking the channel as well as a mid-channel bar at rkm 96.9. In rkm 94.6–88.6, bedrock outcrops lined the relatively narrow channel (active channel width of 10–75 m), and some gravel bars were present at rkm 89.6 downstream from Wildcat Creek.
-
• Upper Sandstone reach from downstream from Wildcat Creek to Rock Creek (rkm 88.6–80.4; fig. 9A–B; table 6). From rkm 88.6 to 84.2, the width of the active channel widened (ranging from 25 to 100 m). The largest bars in the reach (ranging up to nearly 18,000 m2) were present between Palmer Creek at Moonshine Park (rkm 87.4) and Baker Creek (rkm 84.6). Downstream from Baker Creek, the active channel narrowed (ranging from 10 to 50 m) and had relatively smaller lateral gravel bars (up to about 3,000 m2). Bedrock was mapped intermittently throughout the Upper Sandstone reach.
-
• Sam Creek reach from Rock Creek to the City of Siletz (rkm 80.4–68.8; fig. 10A–C; table 6). The channel was relatively confined for most of the reach with bedrock intermittently visible in and along the channel. The width of the active channel ranged from 35 to 100 m. Gravel bars (ranging up to about 17,500 m2) were on the inside of channel bends, such as between rkm 80.4–79.8 downstream from the Rock Creek, rkm 76.0–75.5 near Twin Bridges downstream from Scott Creek, rkm 73.6–72.7 at Klamath Grade bar downstream from Sam and Bentilla Creeks, and rkm 70.0–69.7 at Windchime bar.
-
• Mill Creek reach from the City of Siletz to the head of tide at Cedar Creek (rkm 68.8–39.5; fig. 11A–D; table 6). Active channel widths in the Mill Creek reach ranged from 10 to 70 m. The reach had intermittent gravel bars at channel bends and flanking the channel between rkm 68.9–45.1 and 42.7–39.5. Bars were generally less than 7,350 m2 and relatively smaller than those mapped in the upstream reaches. Bars were generally located immediately downstream from tributary confluences, such as near Mill Creek (rkm 67.1), Thompson Creek (rkm 55.3), Euchre Creek (rkm 45.4), and Hough Creek (rkm 42.6). Bedrock was intermittently mapped along this reach.
-
• Tidal reach from the head of tide at Cedar Creek to Millport Slough (rkm 39.5–7.1; fig. 12 A–G; table 6). Active channel widths in the Tidal reach ranged from 20 to 120 m. This reach had fewer gravel bars mapped in 2016 than the upstream reaches. Gravel bars were primarily located in the upper portion of the reach near the Bulls Bag area between Jaybird Creek (rkm 39.5) and rkm 33.6. Mapped gravel bars did not exceed areas of more than about 5,740 m2. No bedrock was visible in this reach in the 2016 photographs.
The relative abundance of in-channel gravel along reaches of varying lengths on the Siletz River and other gravel-bed rivers of western Oregon can be compared by normalizing mapped reach-aggregated gravel bar area by reach length to determine unit bar area (total area of bars per meter of channel length [square meters per meter m2/m]). In 2016, unit bar area along the Siletz River ranged from 3.2 to 9.0 m2/m in the geomorphic reaches upstream from the head of tide and was 1.5 m2/m in the Tidal reach (table 6). These unit bar values for the Siletz River were similar to values for other rivers along the northwestern Oregon coast, such as the Kilchis, Trask, and Tillamook Rivers, that also drain Coast Range sedimentary and volcanic rocks (table 7; O’Connor and others, 2014). However, Siletz River unit bar areas were considerably less than some reaches of rivers along the southwestern Oregon coast that drain the gravel-rich Klamath Mountains, such as the Chetco, Applegate, Illinois, and Rogue Rivers where the maximum unit bar areas are 7.0–10.2 times the maximum unit bar area of the Siletz River.
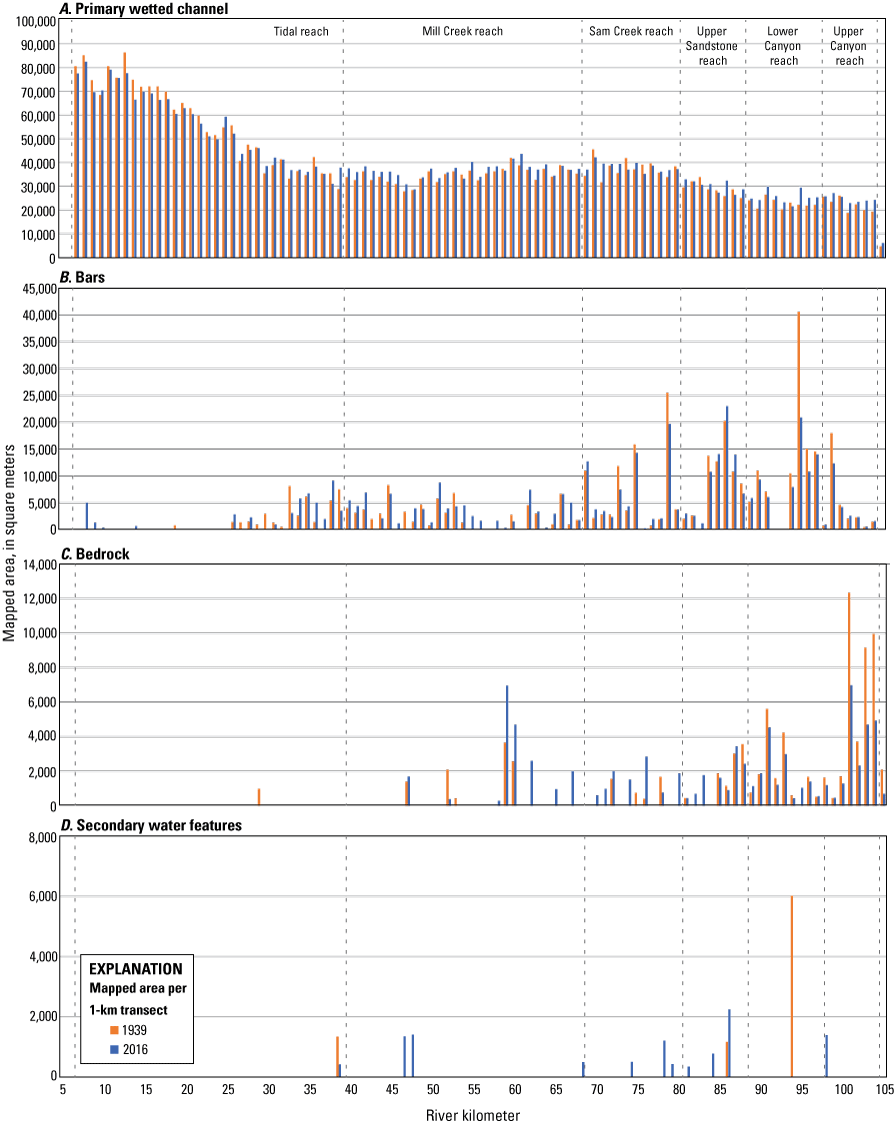
A, Primary wetted channel; B, mapped bars; C, bedrock; and D, secondary water features as delineated by Gordon and others (2021) from aerial and orthophotographs taken in 1939 and 2016 for river kilometers 104.3–7.1 along the Siletz River, western Oregon. Refer to Gordon and others (2021) for the 1939 photographs and National Agriculture Imagery Program (2016) for the 2016 photographs. [km, kilometers]
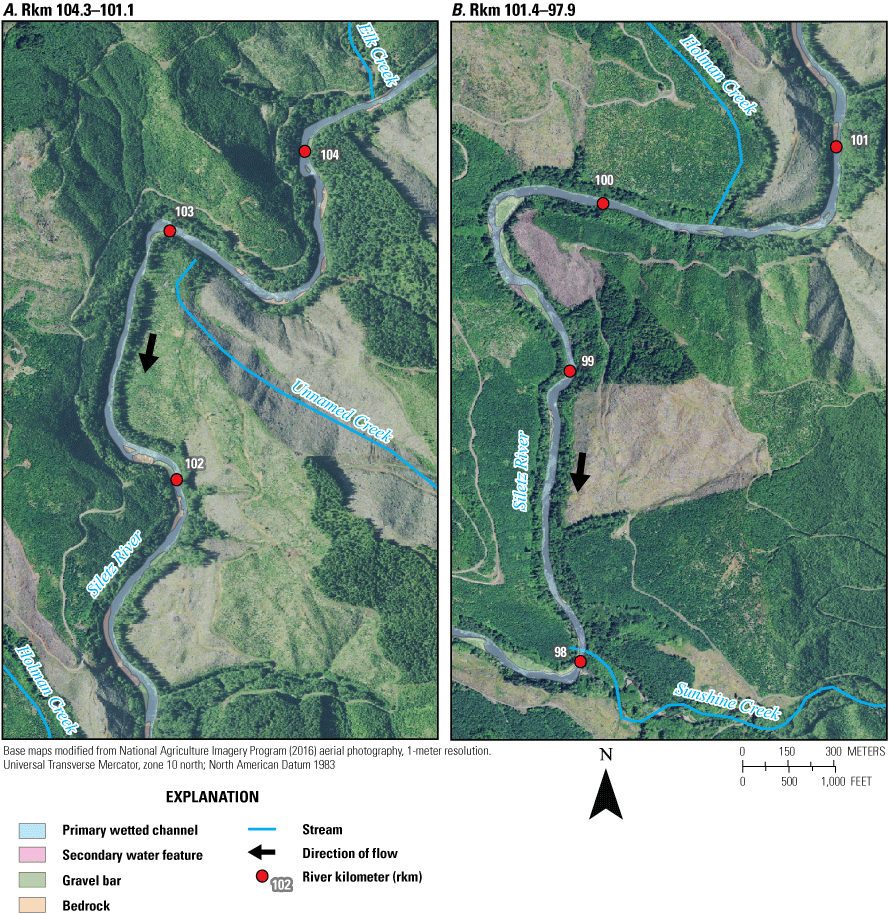
Mapped bar and channel features as delineated by Gordon and others (2021) from orthophotographs taken in 2016 (National Agriculture Imagery Program, 2016) for river kilometers A, 104.3–101.1 and B, 101.4–97.9 in the Upper Canyon reach of the Siletz River, western Oregon.
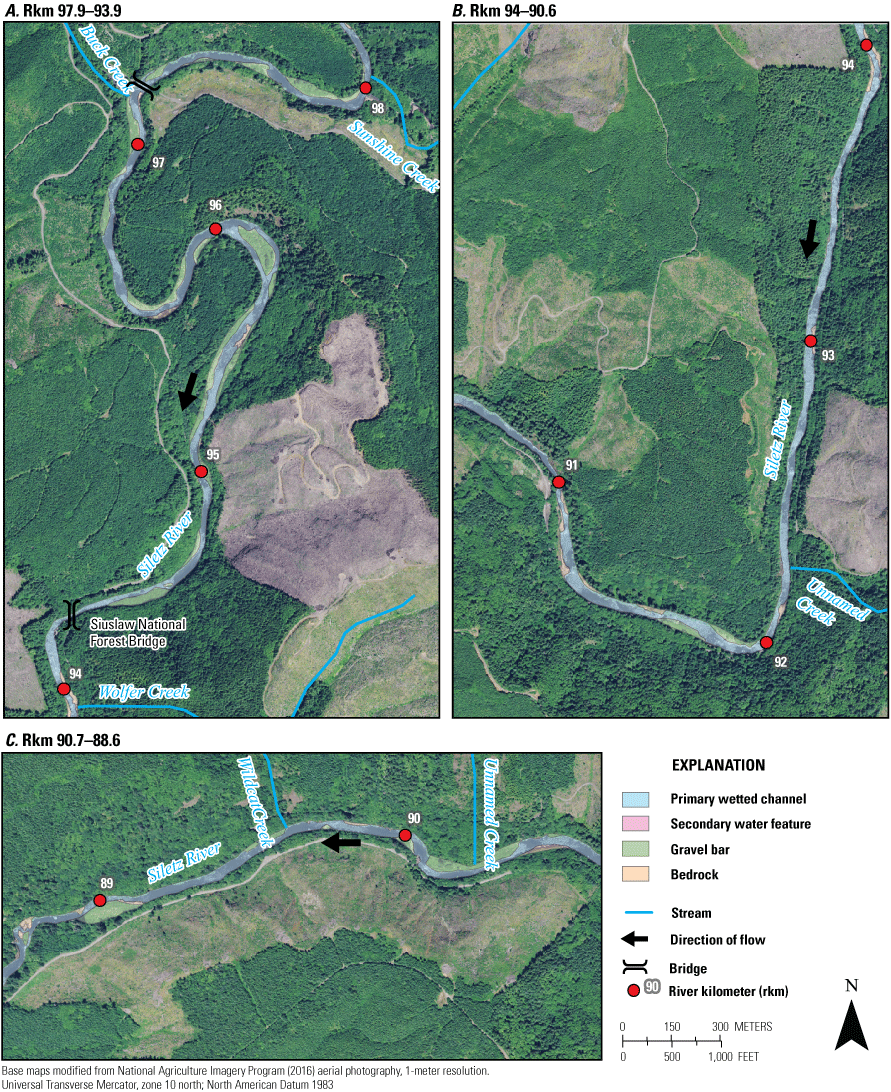
Mapped bar and channel features as delineated by Gordon and others (2021) from orthophotographs taken in 2016 (National Agriculture Imagery Program, 2016) for river kilometers A, 97.9–93.9; B, 94–90.6; and C, 90.7–88.6 in the Lower Canyon reach of the Siletz River, western Oregon.
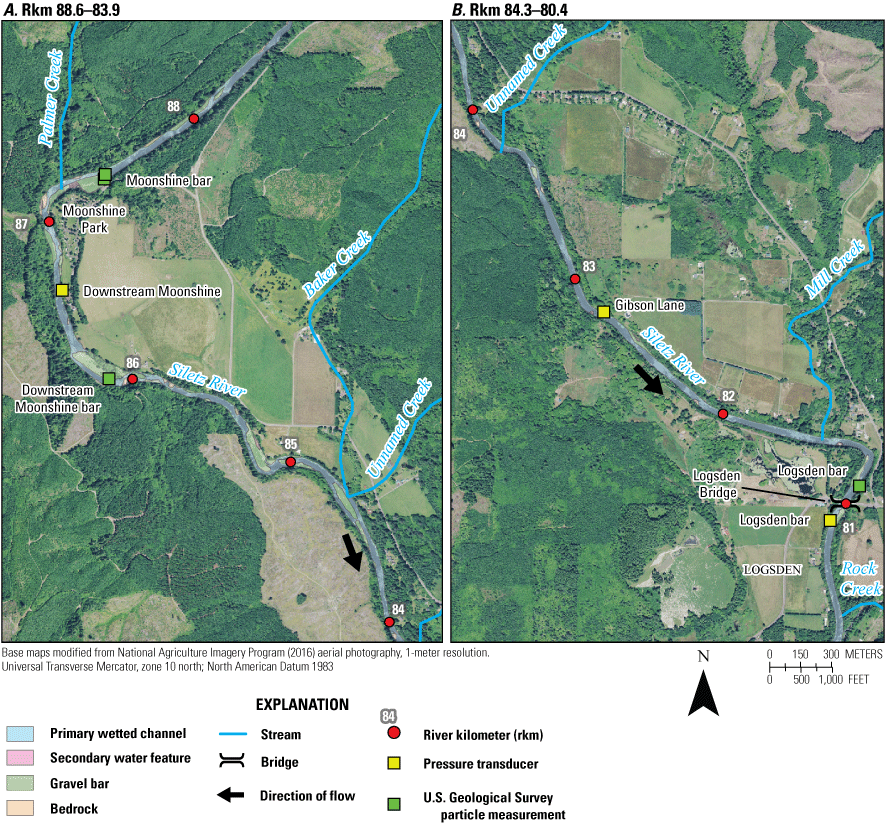
Mapped bar and channel features as delineated by Gordon and others (2021) from orthophotographs taken in 2016 (National Agriculture Imagery Program, 2016), pressure transducer locations (Leahy and others, 2024), and particle measurement locations (Jones and Keith, 2021) for river kilometers A, 88.6–83.9 and B, 84.3–80.4 in the Upper Sandstone reach of the Siletz River, western Oregon.
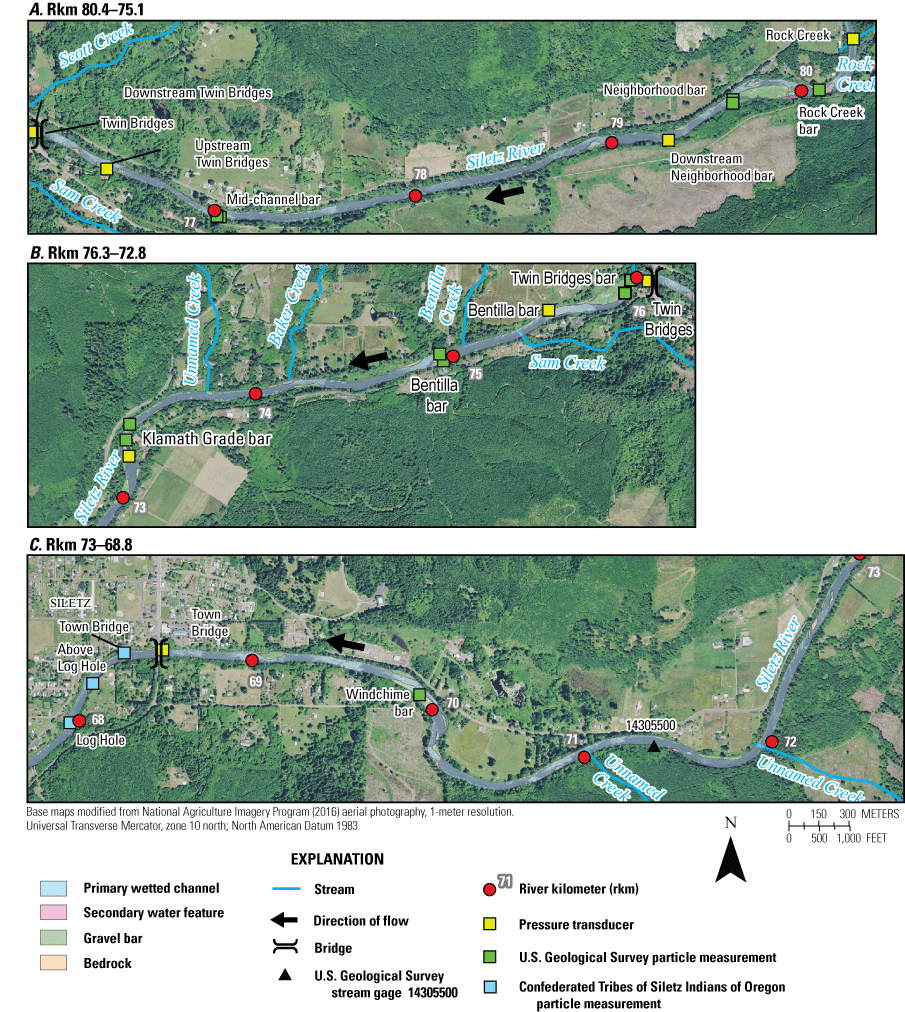
Mapped bar and channel features as delineated by Gordon and others (2021) from orthophotographs taken in 2016 (National Agriculture Imagery Program, 2016), pressure transducer locations (Leahy and others, 2024), and particle measurement locations (Jones and Keith, 2021; refer to the “Analyses of Bed-Material Particle Sizes” section for more information on the measurements by the Confederated Tribes of Siletz Indians of Oregon) for river kilometers A, 80.4–75.1; B, 76.3–72.8; and C, 73–68.8 in the Sam Creek reach of the Siletz River, western Oregon.
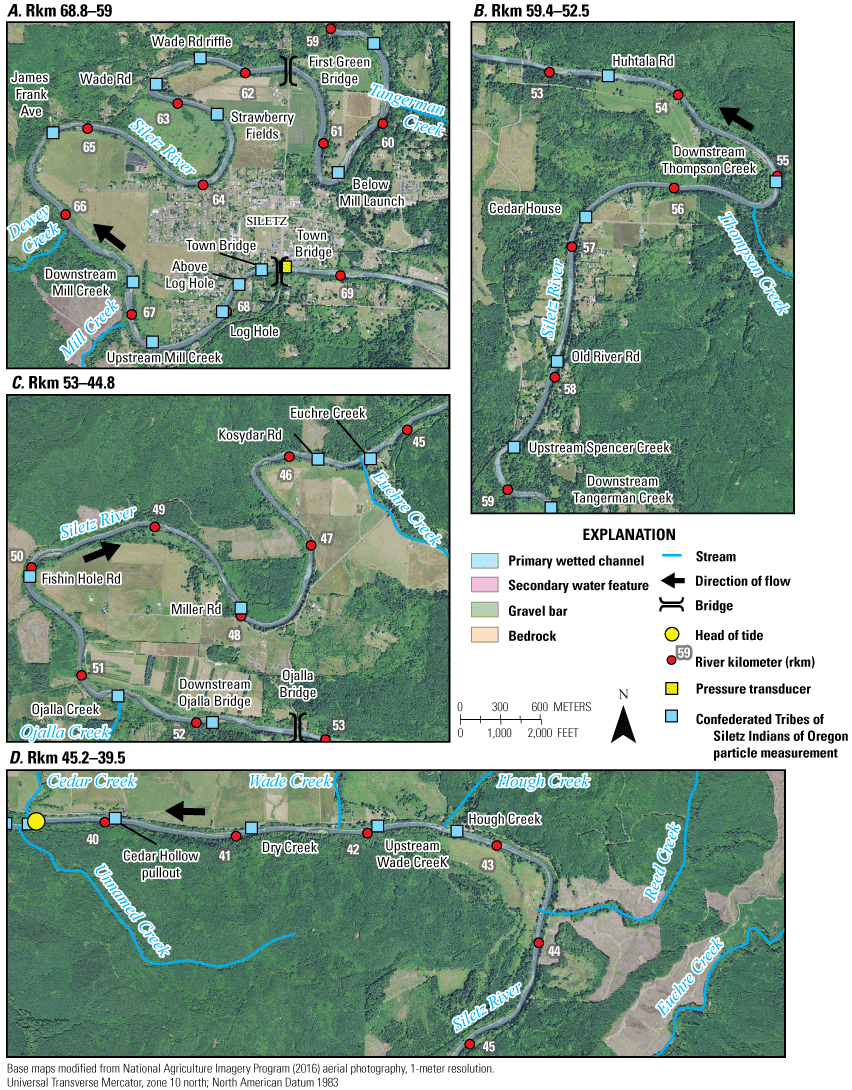
Mapped bar and channel features as delineated by Gordon and others (2021) from orthophotographs taken in 2016 (National Agriculture Imagery Program, 2016), particle measurements by the Confederated Tribes of Siletz Indians of Oregon (refer to the “Analyses of Bed-Material Particle Sizes” section), and pressure transducer locations (Leahy and others, 2024) for river kilometers A, 68.8–59; B, 59.4–52.5; C, 53–44.8; and D, 45.2–39.5 in the Mill Creek reach of the Siletz River, western Oregon. [Ave, avenue; Rd, road]
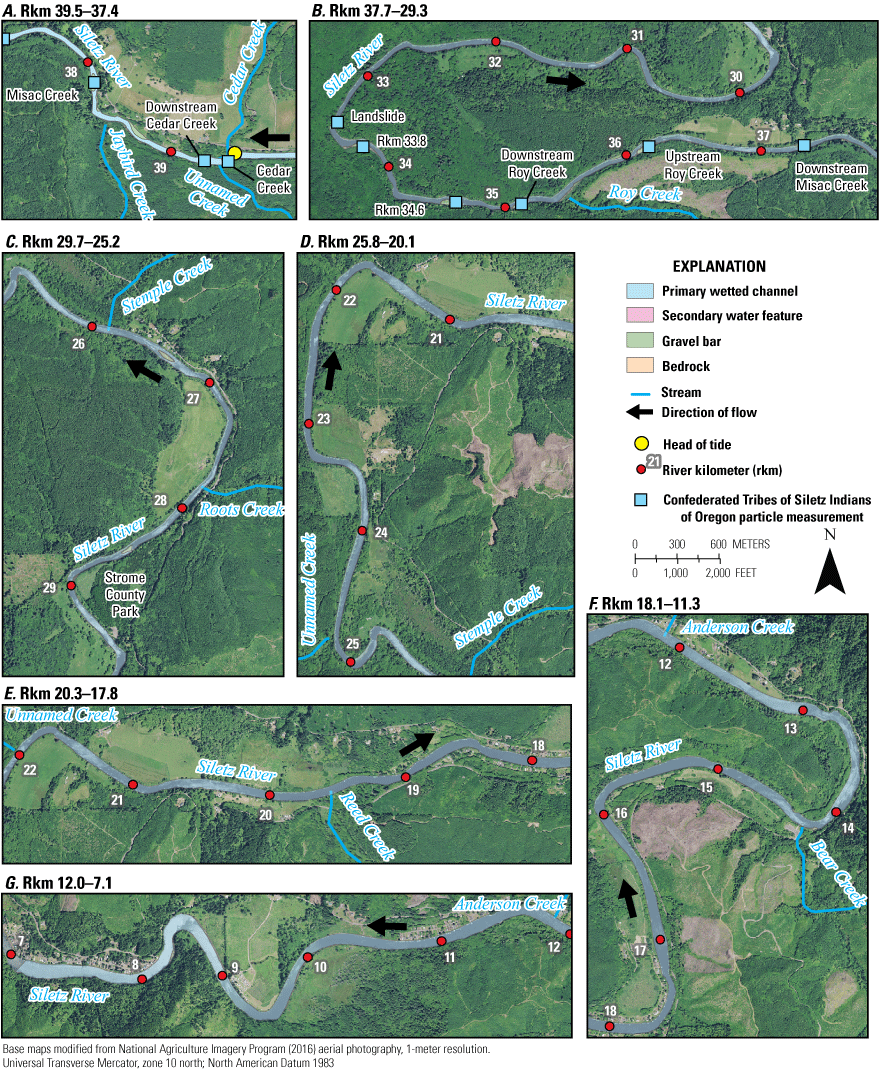
Mapped bar and channel features as delineated by Gordon and others (2021) from orthophotographs taken in 2016 (National Agriculture Imagery Program, 2016) and particle measurements by the Confederated Tribes of Siletz Indians of Oregon (refer to the “Analyses of Bed-Material Particle Sizes” section) for river kilometers A, 39.5–37.4; B, 37.7–29.3; C, 29.7–25.2; D, 25.8–20.1; E, 20.3–17.8; F, 18.1–11.3; and G, 12.0–7.1 in the Tidal reach of the Siletz River, western Oregon.
Table 6.
Summary of mapped bar characteristics as delineated by Gordon and others (2021) from orthophotographs taken in 2016 (National Agriculture Imagery Program, 2016) for river kilometers 104.3–7.1 along the Siletz River, western Oregon.[Number of bars: Gravel bars spanning reach bounds were split and are counted separately in this table. The total number of gravel bars mapped for 2016 along the Siletz River is 173 (see tables 7 and 8). Mean mapped bar area calculated by dividing Total mapped bar area by Number of bars. Abbreviations: rkm, river kilometer; m2, square meters; m, meters; m2/m, square meters per meter]
Table 7.
Unit bar area mapped for predominantly fluvial (non-tidal) reaches from this study and prior studies along Oregon coastal rivers.[Rivers are presented from north to south along the Oregon coast. Unit bar area: Area of bar in square meters per channel length in meters and is determined using the National Hydrography Dataset centerline for the Siletz, Umpqua, and Chetco Rivers whereas other studies used centerlines digitized from orthophotographs. Abbreviation: km2: square kilometers]
| River | Basin area (km2) |
Unit bar area for predominantly fluvial reaches |
Year of orthophotographs used for mapping bar area |
Source |
|---|---|---|---|---|
| Nehalem River | 2,207 | 18.3 | 2009 | Jones and others (2012c) |
| Miami River | 94 | 8.1 and 27.9 | 2009 | Jones and others (2012c) |
| Kilchis River | 169 | 9.2 | 2009 | Jones and others (2012c) |
| Wilson River | 500 | 12.6 and 18.6 | 2009 | Jones and others (2012c) |
| Trask River | 451 | 9.7 | 2009 | Jones and others (2012c) |
| Tillamook River | 156 | 7.1 | 2009 | Jones and others (2012c) |
| Siletz River | 970 | 3.4 to 9.0 | 2016 | This report |
| Umpqua River | 12,103 | 5.0 to 17.6 | 2005 | Wallick and others (2011) |
| Coquille River | 2,745 | 0.4 to 12.6 | 2009 | Jones and others (2012b) |
| Rogue River | 13,390 | 10.6 to 63.1 | 2009 | Jones and others (2012a) |
| Applegate River | 1,994 | 4.3 and 71.5 | 2009 | Jones and others (2012a) |
| Illinois River | 2,564 | 91.8 | 2009 | Jones and others (2012a) |
| Hunter Creek | 44 | 19.1 and 19.7 | 2009 | Jones and others (2011) |
| Chetco River | 914 | 9.3 to 77.5 | 2005 | Wallick and others (2010) |
Changes in Channel Planform and Features, 1939–2016
Between 1939 and 2016, the Siletz River from Elk Creek to Millport Slough (rkm 104.3–7.1) was primarily laterally stable in terms of planform and bar locations. Overall, the total mapped bar area, including vegetated and unvegetated bars, was similar in both 1939 and 2016 (less than 2 percent change and within mapping uncertainty; table 8). However, the number of mapped bars increased by 25 percent while the average size of mapped bars decreased by 21 percent (fig. 6B; table 9). The mapped area of secondary water features was greater in 2016 (10,500 m2) than in 1939 (8,500 m2), though it is possible that those differences were related to higher discharge depicted in the 2016 aerial photographs relative to 1939 (table 5). However, the loss of a large side channel (6,000 m2) near rkm 95.0 between 1939 and 2016 was the result of planform change; here, the Siletz River had a side channel flowing around a partially unvegetated island bar in 1939, but the river was concentrated into a single channel along the right bank in the 2016 aerial photographs.
Some of the largest net increases in mapped gravel bar area detected between 1939 and 2016 were at rkm 8.0, 30.0, 34.0–38.0, 51.0, 85.0–87.0 (fig. 6B) where bar growth or the deposition of new bars occurred in locally wide areas of the active channel. Long, thin bars mapped along the channel margins between rkm 10.0–8.0 in 2016 but not 1939 likely are evident because of tide differences between those photographs (fig13A–C). Near the south side of the Bulls Bag area and upper portion of the Tidal reach (rkm 38.0–34.0), mapped bar area increased as channel shifted laterally between rkm 36.4–34.5 (fig. 13D–F) and 39.0–38.0 (fig. 13G–I). At rkm 51.0, near the confluence of Ojalla Creek, the channel shifted laterally, and mapped bar area increased as the number of bars decreased (fig. 13J–L). Locations of historical channel migration documented by Derouin (2015; specifically, between 1939 and 2002 at rkm 51.0, between 1958, 1988, and 2012 for rkm 39.0–38.0, and between 1958 and 2012 for rkm 36.4–34.5) coincide with the lateral and planform found in this study. Results for rkm 87.0–85.0 are summarized in the following section for sub-reach 1 at Moonshine Park and sub-reach 2 upstream from Baker Creek.
Some of the largest reductions in mapped bars were at rkm 99.0, 96.0, 95.0, 79.0, 39.0, and 33.0 (fig. 6B). At rkm 99.0, long gravel bars flanked the Siletz River in 1939, but these bars became smaller and were partially submerged in 2016 (fig. 14A–C). At rkm 96.0, vegetation establishment appeared to reduce bar area mapped based on the 2016 photographs (fig. 14D–E). At rkm 95.0 and 39.0, the reduction in mapped gravel bar area is associated with vegetation establishment and the channel splitting around mid-channel bars in 2016 (figs. 14D–F, 15A–C). At rkm 33.0, bar area declined as the channel moved north slightly (fig. 15D–F). This shift in channel position was caused by the toe of a landslide on the left riverbank that pushes the channel toward the inside of the meander bend along the right riverbank (Harden, 2013).
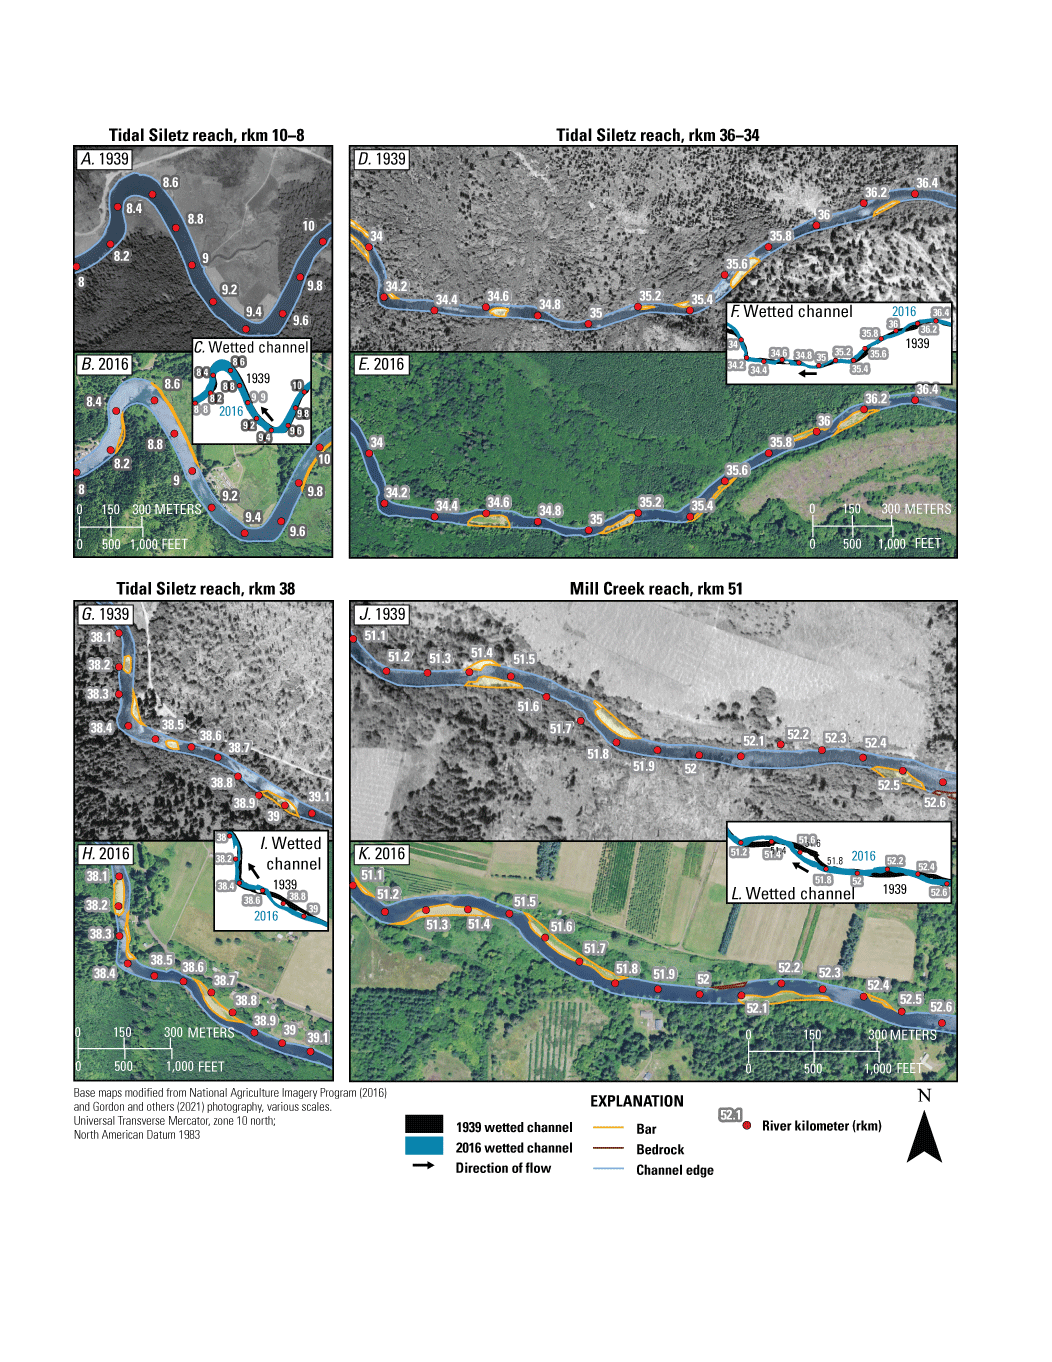
Examples of repeat bar and channel mapping (including bars, bedrock, channel edges, and wetted channel area; Gordon and others, 2021) in locations where bar area increased from 1939 to 2016 near river kilometers, A–C, 10.0–8.0; D–F, 36.0–34.0; G–I, 38.0; and J–L, 51.0 along the Siletz River, western Oregon. Photographs from 1939 are used with permission from University of Oregon, taken July 22, 1939.
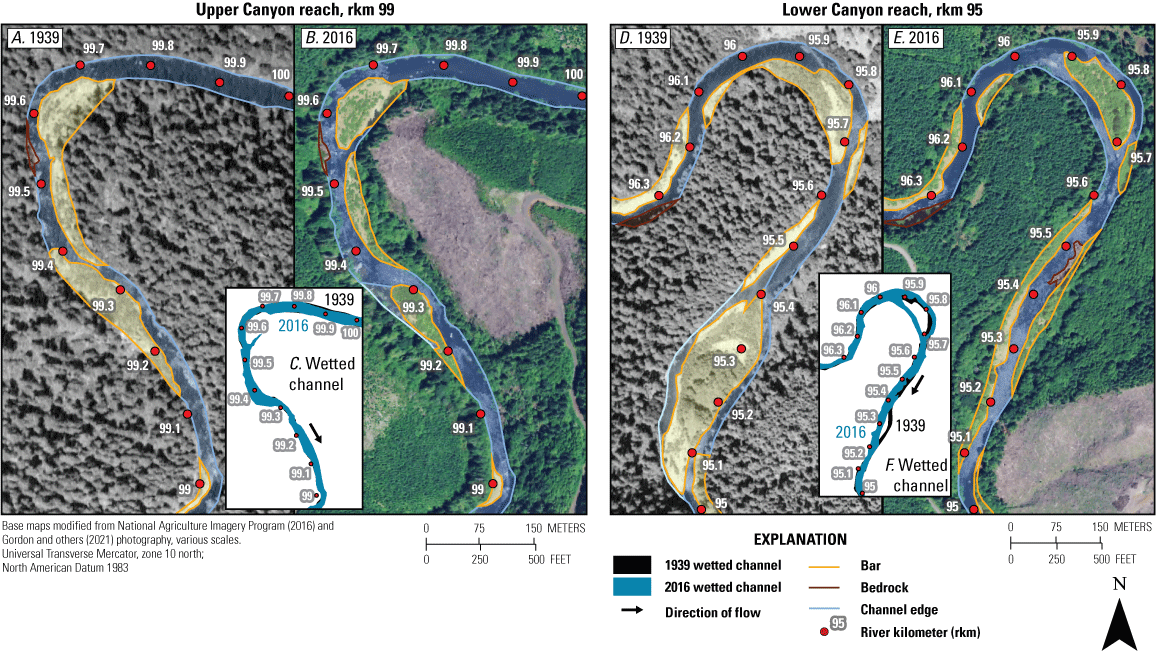
Examples of repeat bar and channel mapping (including bars, bedrock, channel edges, and wetted channel area; Gordon and others, 2021) in locations where the bar area decreased from 1939 to 2016 near river kilometers A–C, 99 and D–F, 95 along the Siletz River, western Oregon. Photographs from 1939 are used with permission from University of Oregon, taken July 22, 1939.
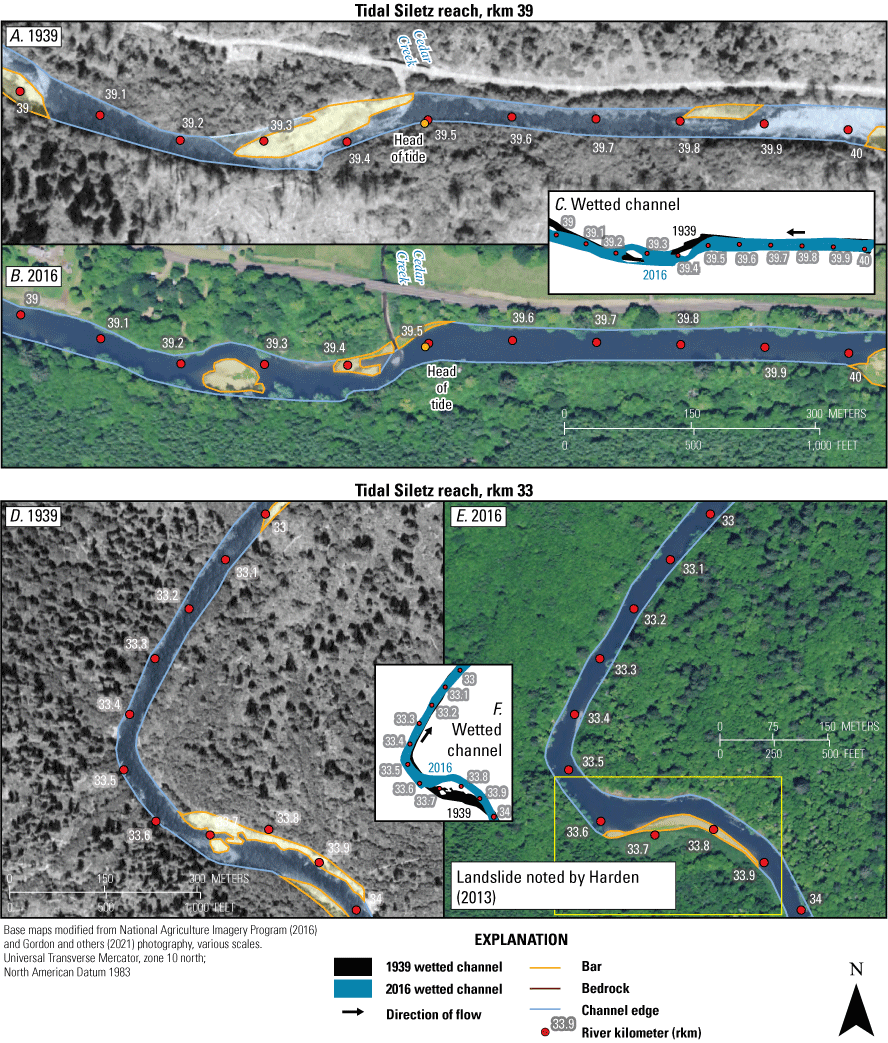
Examples of repeat bar and channel mapping (including bars, bedrock, channel edges, and wetted channel area; Gordon and others, 2021) in locations where bars area decreased from 1939 to 2016 near river kilometers (rkm) A–C, 39 and D–F, 33 along the Siletz River, western Oregon. Landslide noted by Harden (2013). The 1939 photographs are from Gordon and others (2021) and 2016 photographs are from the National Agriculture Imagery Program (2016).
Table 8.
Total bar area as mapped by Gordon and others (2021) from photographs taken in 1939, 1994, 2000, 2009, and 2016 (National Aerial Photography Program, 1994, 2000; National Agriculture Imagery Program, 1994, 2000, 2009, 2016; Gordon and others, 2021) for seven mapping sub-reaches along the Siletz River, western Oregon.[Average bar area: Average bar area calculated by dividing the total bar area for each subreach by the number of mapped bars. Abbreviations: m, meter; m2, square meters; --, no data; %, percent]
Table 9.
Number of bars and mean bar area as mapped by Gordon and others (2021) from photographs taken in 1939, 1994, 2000, 2009, and 2016 (National Aerial Photography Program, 1994, 2000; National Agriculture Imagery Program, 1994, 2000, 2009, 2016; Gordon and others, 2021) for seven mapping sub-reaches along the Siletz River, western Oregon.[Refer to figure 3 for the location of sub-reaches. Mean bar area: Average bar area calculated by dividing the total bar area for each subreach by the number of mapped bars. Abbreviations: m, meter; m2, square meters; --, no data; %, percent]
Changes in Channel Planform and Features for the Short Repeat Mapping Sub-Reaches, 1939–2016
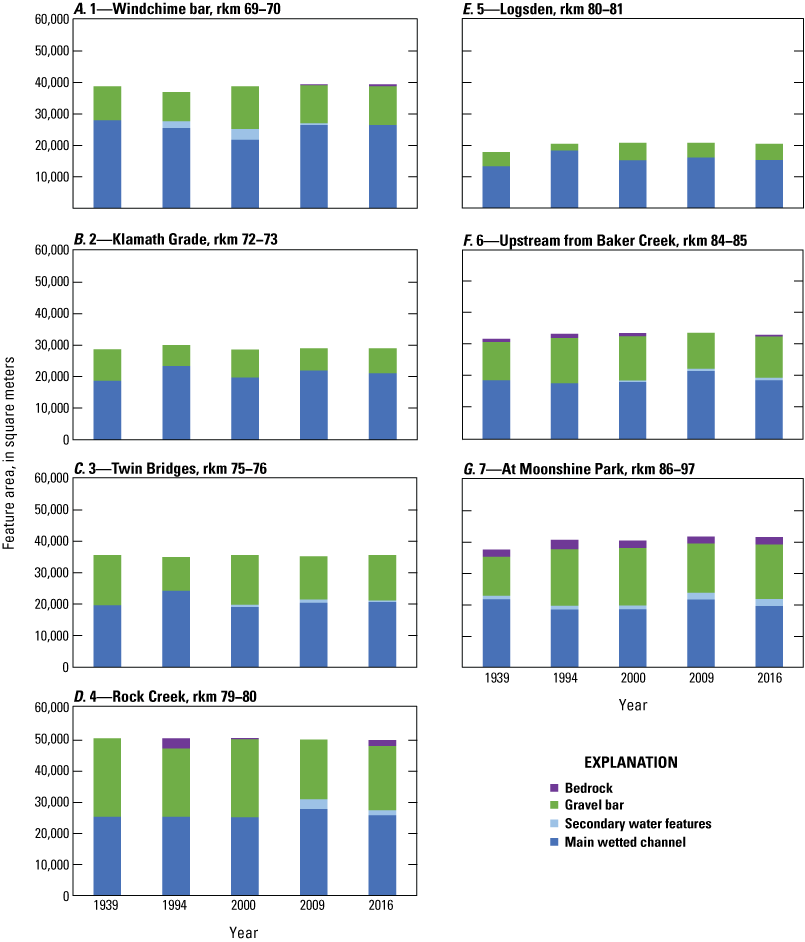
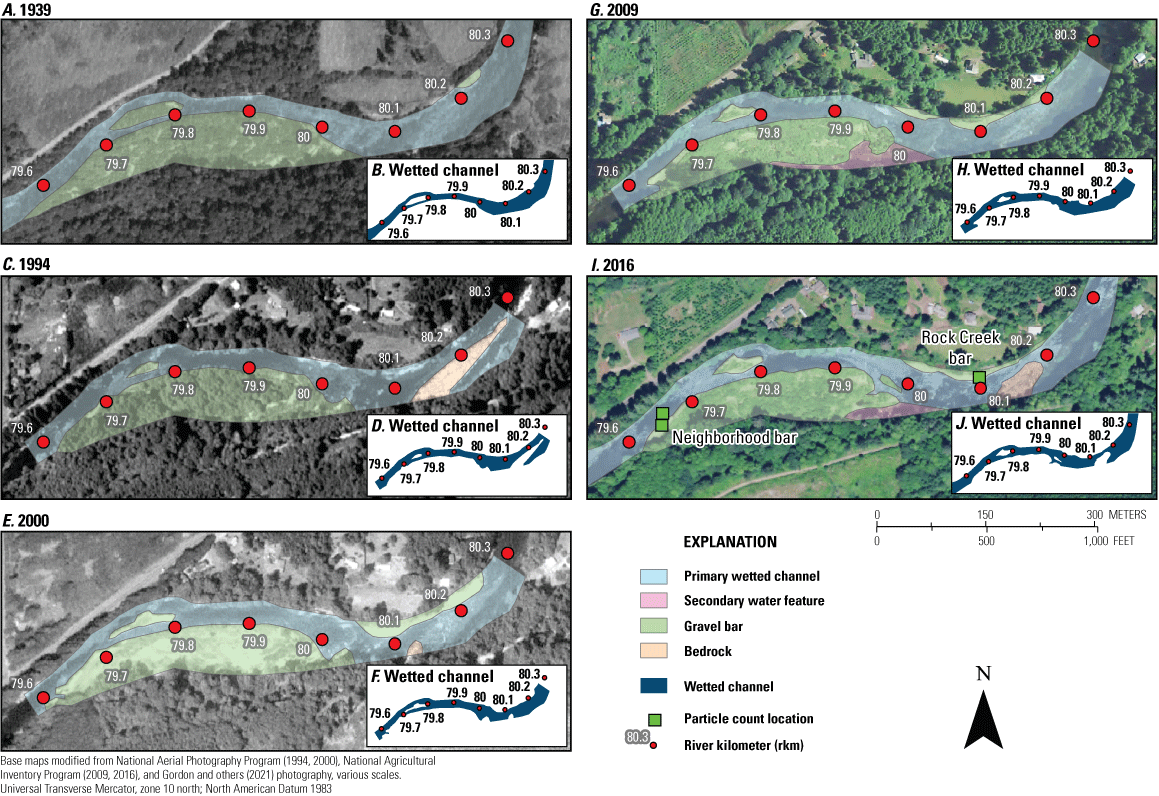
Although the overall channel location and area of mapped bars remained similar in 1939 and 2016, distinct patterns of geomorphic change were more apparent when evaluating repeat mapping data within the short (0.5–1.0-km long) sub-reaches where channel characteristics were evaluated for multiple periods (fig. 16A–G; tables 8-9). Total mapped bar area decreased between 1939 and 2016 in sub-reaches 4 (at Rock Creek; net reduction of 18 percent), 3 (at Twin Bridges; net reduction of 10 percent), and 2 (at Klamath Grade; net reduction of 21 percent), with bars increasing in number and decreasing in average size. Total mapped bar area increased in sub-reaches 7 (at Moonshine Park; net increase of 40 percent), 6 (upstream from Baker Creek; net increase of 8 percent), and 1 (at Windchime bar; net increase of 15 percent), with bars increasing in number and decreasing in average size. Sub-reach 5 (at Logsden) had a 15 percent increase in total bar area.
Modest changes in the locations of the channels and bars were found over the 77-year mapping period for seven mapping sub-reaches (figs. 17A–J–23A–J). Channel planform adjustments were noted in relation to sediment deposition and bar growth in sub-reaches 7, 6, and 1. In sub-reach 7 (at Moonshine Park), the channel split around an island at rkm 87.4 in 1939, but then the channel on the left bank was mostly filled in with sediment by 1994, leaving a secondary channel along the left bank (fig. 17A–J). Downstream in sub-reach 6 (at Baker Creek), one bar changed from a single bar on the right bend near rkm 85 to two smaller bars—one still on the river bend and a mid-channel bar (first evident in the 2000 aerial photographs; fig. 18A–J). Sub-reaches 5 (at Logsden; fig. 19A–J), 4 (at Rock Creek; fig. 20A–J), 3 (at Twin Bridges; fig. 21A–J), and 2 (at Klamath Grade; fig. 22A–J) changed little over the mapping period. Sub-reach 1 at Windchime bar had the most substantial planform and bar change of all the mapping sub-reaches; here the thalweg shifted position several times from 1939 from 2016 (fig. 23A–J).
The repeat mapping also is helpful for identifying when vegetation (primarily woody shrubs such as willow or cottonwood) is scoured and stripped from gravel bars by high flows or when vegetation colonizes or expands on gravel bars during periods of lower peak discharge. All sub-reaches displayed evidence of scour (such as flood-swept surfaces and vegetation removal) along most bar surfaces in 2000 (figs. 17A–J–23A–J). Large swaths of woody shrubs appeared to be scoured from bar surfaces in sub-reaches 7 at Moonshine Park, 4 at Rock Creek, and 3 at Twin Bridges between the collection of the 1994 and 2000 aerial photographs (figs. 17 A–J, 20A–J–21A–J). This scour was likely associated with the largest event of record on November 26, 1999 (1,520 m3/s, 53,800 ft3/s, AEP of about 0.002). Scour appeared more limited to gravel bar margins in 2009 and 2016.
Changes in mapped bar and channel features from 1939, 1994, 2000, 2009, and 2016 (Gordon and others, 2021) for A, sub-reach 1, rkm 69–70; B, sub-reach 2, rkm 72–73; C, sub-reach 3, rkm 75–76; D, sub-reach 4, rkm 79–80; E, sub-reach 5, rkm 80–81; F, sub-reach 6, rkm 84–85; and G, sub-reach 7, rkm 86–87 along the Siletz River, western Oregon. Mapping was done based on aerial and orthophotographs from 1939 (Gordon and others, 2021), 1994, 2000 (National Aerial Photography Program, 1994, 2000), and 2009 and 2016 (National Agriculture Imagery Program, 2009, 201664). [rkm, river kilometers]
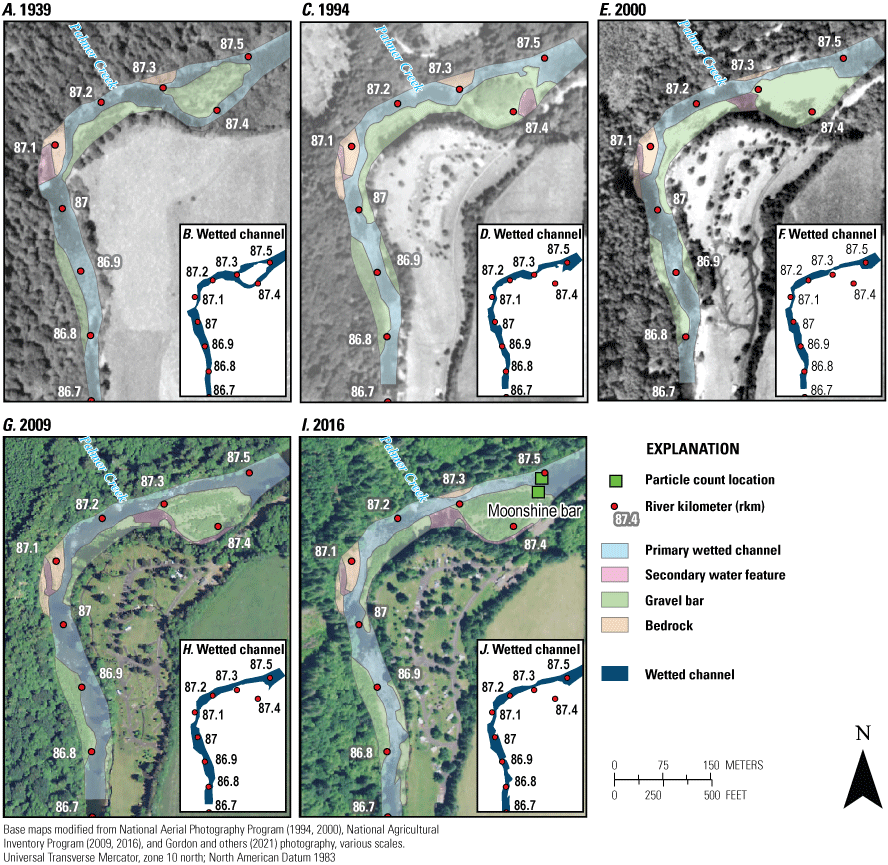
Changes in mapped bar and channel features (Gordon and others, 2021) from A–B, 1939; C–D, 1994; E–F, 2000; G–H, 2009; and I–J, 2016 for sub-reach 7 at Moonshine Park (river kilometers 86–87) along the Siletz River, western Oregon. Photographs from 1939 are used with permission from University of Oregon, taken July 22, 1939. Particle count locations are from Jones and Keith (2021).
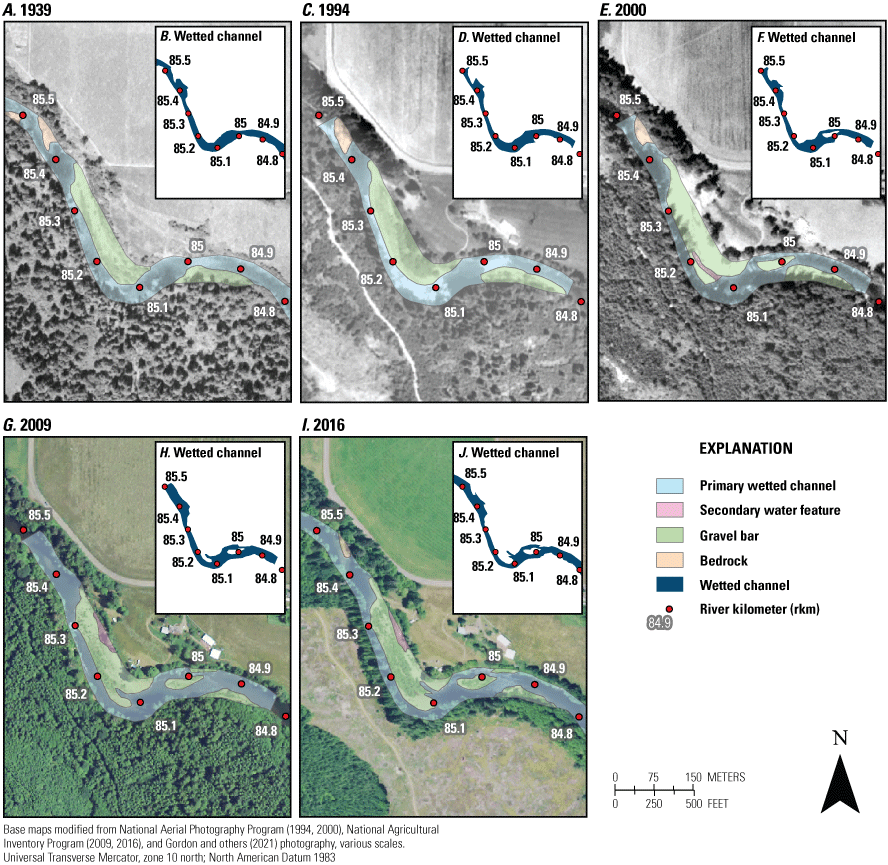
Changes in mapped bar and channel features (Gordon and others, 2021) from A–B, 1939; C–D, 1994; E–F, 2000; G–H, 2009; and I–J,2016 for sub-reach 6 upstream from Baker Creek (river kilometers 84–85) along the Siletz River, western Oregon. Photographs from 1939 are used with permission from University of Oregon, taken July 22, 1939.
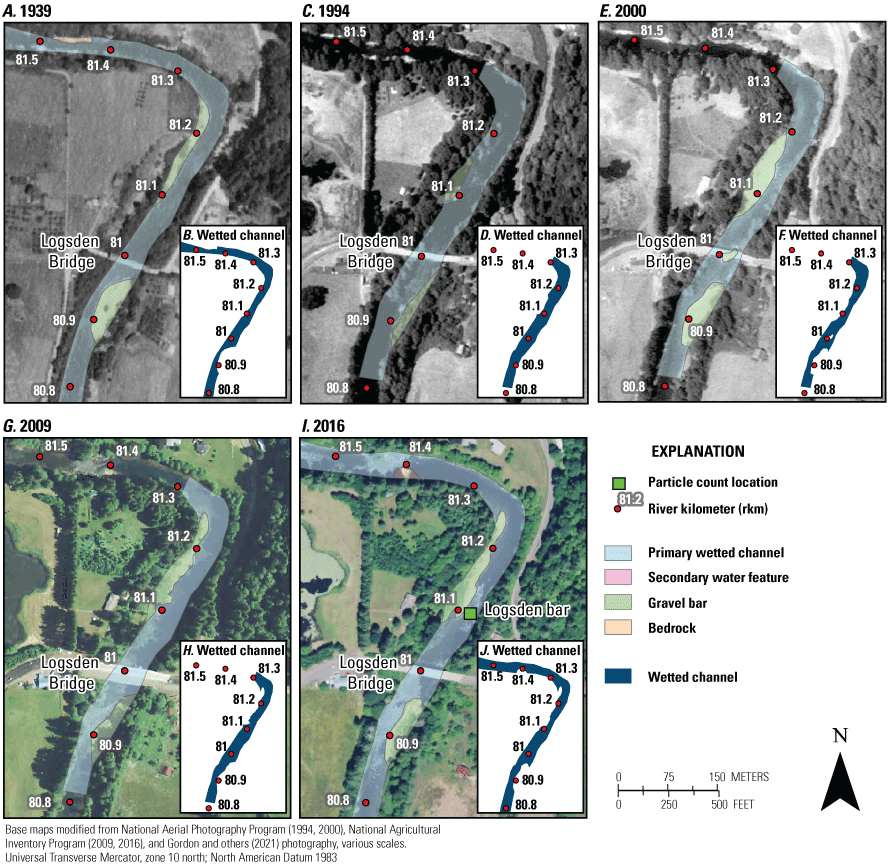
Mapped changes in bar and channel features (Gordon and others, 2021) from A–B, 1939; C–D, 1994; E–F, 2000; G–H, 2009; and I–J, 2016 for sub-reach 5 upstream at Logsden Bridge (river kilometers 80–81) along the Siletz River, western Oregon. Photographs from 1939 are used with permission from University of Oregon, taken July 22, 1939.
Mapped changes in bar and channel features (Gordon and others, 2021) from A–B, 1939; C–D, 1994; E–F, 2000; G–H, 2009; and I–J, 2016 for sub-reach 4 at Rock Creek (river kilometers 79–80) along the Siletz River, western Oregon. Photographs from 1939 are used with permission from University of Oregon, taken July 22, 1939. Particle count locations are from Jones and Keith (2021).
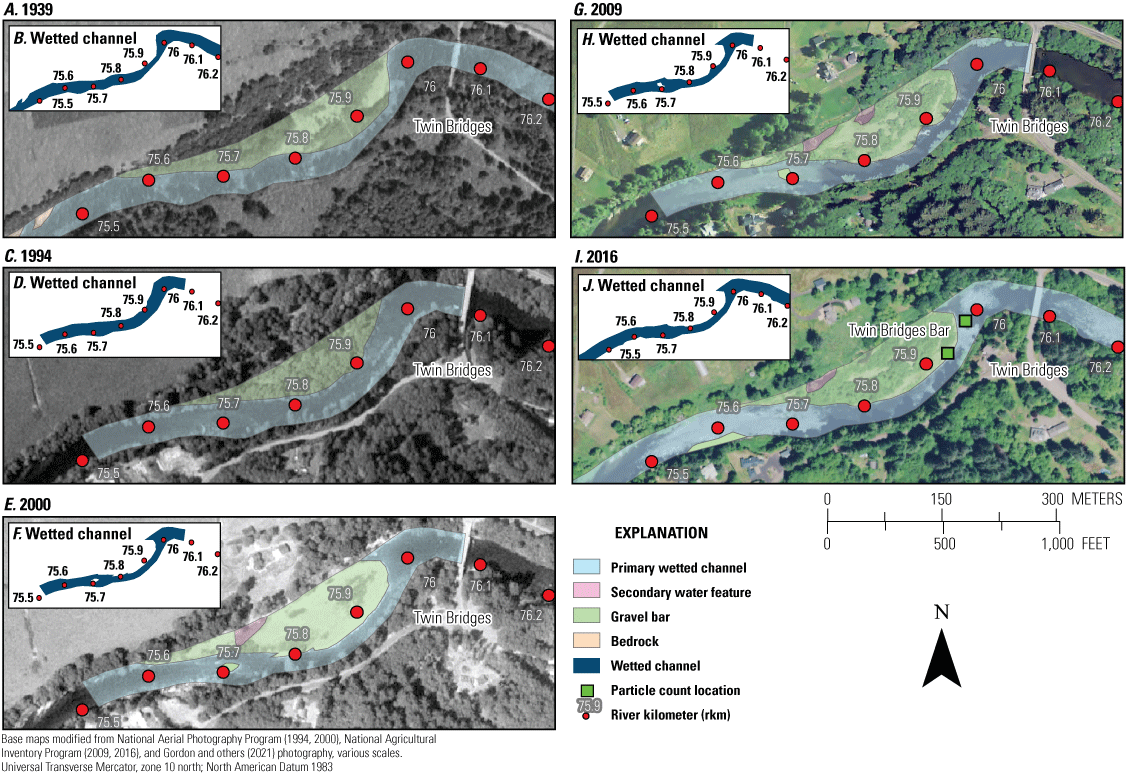
Changes in mapped bar and channel features (Gordon and others, 2021) from A–B, 1939; C–D, 1994; E–F, 2000; G–H, 2009; and I–J, 2016 for sub-reach 3 at Twin Bridges (river kilometers 75–76) along the Siletz River, western Oregon. Photographs from 1939 are used with permission from University of Oregon, taken July 22, 1939. Particle count locations are from Jones and Keith (2021).
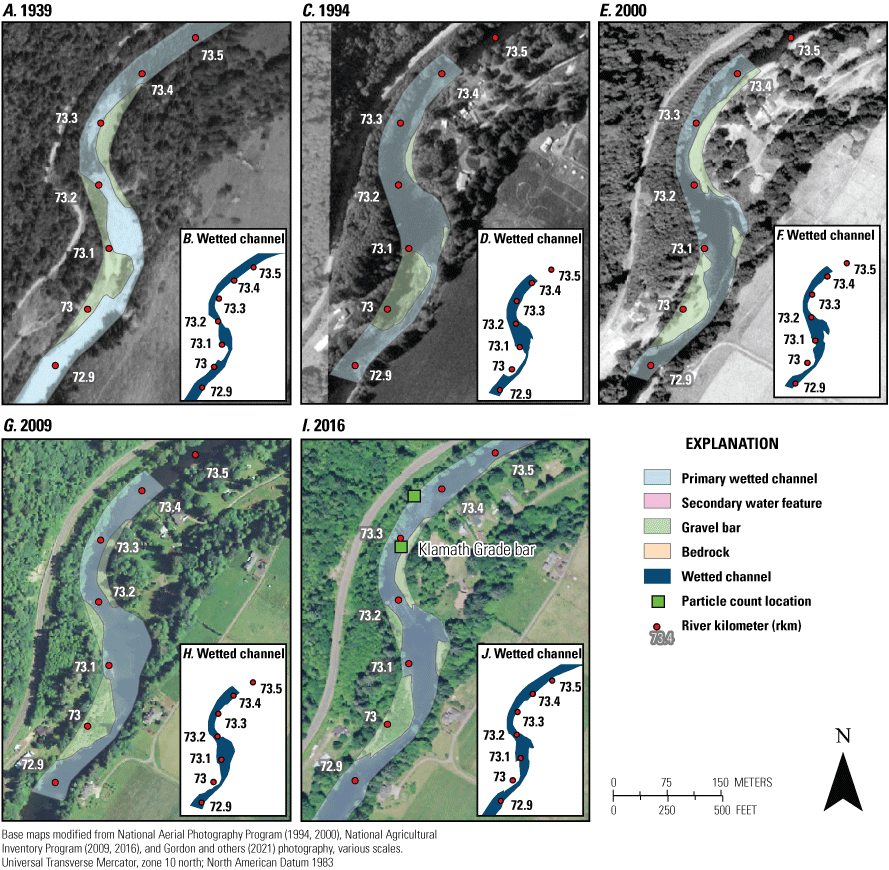
Changes in mapped bar and channel features (Gordon and others, 2021) from A–B, 1939; C–D, 1994; E–F, 2000; G–H, 2009; and I–J, 2016 for sub-reach 2 at Klamath Grade bar (river kilometers 72–73) along the Siletz River, western Oregon. Photographs from 1939 are used with permission from University of Oregon, taken July 22, 1939. Particle count locations are from Jones and Keith (2021).
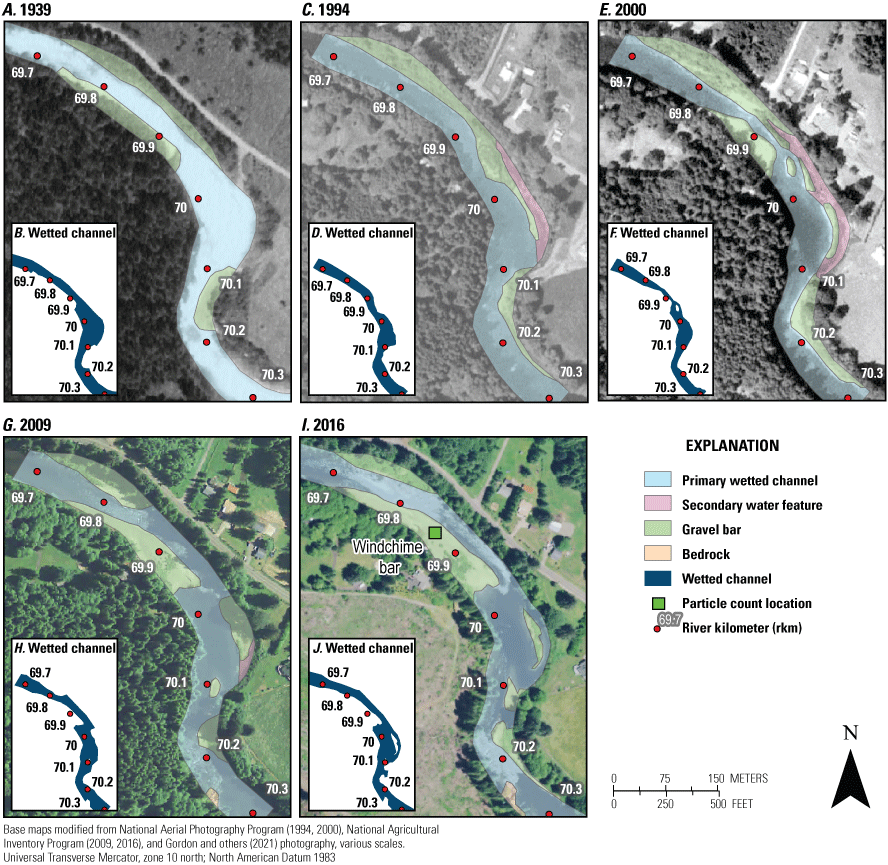
Changes in mapped bar and channel features (Gordon and others, 2021) from A–B, 1939; C–D, 1994; E–F, 2000; G–H, 2009; and I–J, 2016 for sub-reach 1 at Windchime bar (river kilometers 69–70.3) along the Siletz River, western Oregon. Photographs from 1939 are used with permission from University of Oregon, taken July 22, 1939. Particle count locations are from Jones and Keith (2021).
Channel Planform and Lateral Stability Discussion
The Siletz River from Elk Creek to Millport Slough primarily flows through confined reaches bound by Coast Range volcanic and sedimentary rocks and Quaternary terraces (Harden, 2013; Smith and Roe, 2015; Franczyk and others, 2020) with some unconfined segments present in the Tidal reach (fig. 1). In many places, the bed and banks of the Siletz River are dominated by bedrock, which is indicative of transport capacity exceeding sediment supply. Gravel bars tend to occur along meander bends (where hydraulics allow for sediment deposition), relatively unconfined and slightly wider channel locations, and at or near tributaries. Bedrock was largely mapped in the relatively steeper and narrow sections upstream from the City of Siletz (rkm 68.5; fig. 16A–G). From 1939 to 2016, the Siletz River occupied a predominantly single-thread, laterally stable planform, except for short sections that displayed modest planimetric changes. Examples of areas with local geomorphic changes include the sub-reach 1 at Windchime bar (rkm 69–70; fig. 23A–J), rkm 51.0 (fig. 13J–L), and rkm 38.0–34.0 (fig. 13G–I). Based on these findings, the Siletz River has limited locations where the channel can adjust laterally in response to changes in discharge and inputs of coarse sediment. The overall confined nature of the Siletz River results in stable bar locations that are fixed by valley geometry (meaning the channel and bars do not migrate across the valley or downstream as they would for a fully alluvial channel). The geomorphic characteristics of the Siletz River also highlight the coupled interactions between valley-scale controls (such as geology and river gradient) and inputs of water and coarse sediment that ultimately influence the distribution of habitats for Chinook salmon and Pacific lamprey.
Assessment of Bed Elevation Changes with a Specific-Gage Analysis
Vertical changes in channel bed-elevations signifying aggradation or incision can be evaluated at streamgages by evaluating the relation between stage and discharge over time using a specific gage analysis (Blench, 1969; Klingeman, 1973, Juracek and Fitzpatrick, 2009; Pfeiffer and others, 2019; Cashman and others, 2021). Stage–discharge relations (rating curves; for example, refer to Rantz and others, 1982) at gaged sites are developed from field measurements of stage and discharge. That relation is then used to convert frequent measurements of stage (for example, 15-minutes to hourly data) into discharge values. That relation can change over time as hydraulics or channel geometry change. Stage changes that are associated with channel geometry changes within the low-flow channel can indicate vertical adjustments from degradation or aggradation (although other factors such as changes in channel gradient, downstream conditions, or substrate can also influence that relation). Low discharges are more sensitive to changes in bed elevation than high discharges (Wallick and others, 2013) and evaluating discharges that are focused within the low-flow channel reduces the influences of bank geometry or vegetation on the stage-discharge relation (Pfeiffer and others, 2019). Whereas the other analyses of Objective One focused on evaluating channel planform and lateral changes in channel position, this analysis focused on evaluating vertical bed-elevation changes at long-term USGS streamgage 14305500 (Siletz River at Siletz, Oregon; rkm 71.4; U.S. Geological Survey, 2021b; fig. 1).
Specific-Gage Analysis Methods
Two approaches were used to evaluate long-term patterns and relatively episodic adjustments in local channel bed variability at USGS streamgage 14305500 (Siletz River at Siletz Oregon; U.S. Geological Survey, 2021b; fig. 1):
-
1. Comparison of stage at specific discharges across multiple rating curves over the period of record (Klingeman, 1973; Wallick and others, 2013). This approach was used for evaluating the historical patterns of vertical stability. Seven relatively low discharges (2.3–159 m3/s [81–5,615 ft3/s,]) with daily mean discharge exceedance values ranging from 95 to 5 percent, respectively (table 10; U.S. Geological Survey, 2021c) were selected to compare stage over time.
-
2. Comparison of the most recent rating curve to all recorded field discharge measurements over the period of record (for example, Pfeiffer and others, 2019; Cashman and others, 2021). This approach was used for identifying episodic channel bed adjustments that result from temporary sediment deposition, scour related to floods, or other changes to discharge or sediment inputs (such as upstream bank failure or debris flows) and can deviate substantially from established stage-discharge rating curves. The dataRetrieval package (Hirsch and De Cicco, 2015) was utilized within the R statistical environment (version 4.0.4; R Core Team, 2021) to obtain and compare field measurements collected since February 1979 directly from the National Water Information System (NWIS; U.S. Geological Survey, 2021b). The 5 percent exceedance discharge value (159 m3/s [5,620 ft3/s]; table 10) was used as a maximum threshold for field measurements to compare to the current rating (rating 21.0). Field measurements collected prior to February 28, 1979, are not included in the NWIS database (U.S. Geological Survey, 2021b) and thus were not evaluated against the current rating.
Table 10.
Percentile discharge for the U.S. Geological Survey streamgage 14305500 (Siletz River near Siletz, OR; U.S. Geological Survey, 2021b).[Percentile discharge for the U.S. Geological Survey streamgage 14305500 (Siletz River near Siletz, OR) determined for 100 years of record (water years 1906–2018) from Water Watch (U.S. Geological Survey, 2021c) using data from U.S. Geological Survey (2021b). Abbreviations: OR, Oregon; m3/s, cubic meters per second; ft3/s, cubic feet per second]
Specific-Gage Analysis Uncertainty
The estimates of changes in channel bed elevation using specific-gage analyses have multiple sources of uncertainty. Uncertainty and error related to discharge measurements (Turnipseed and Sauer, 2010) and stage measurements (Sauer and Turnipseed, 2010) at streamgages may stem from the method or equipment used to make the measurements, changes in methods or equipment over time, and changes in site conditions. However, the USGS Office of Surface Water sets accuracy standards for these field measurements; the standard for stage measurements, for example, is plus or minus (±) 0.01 ft (0.003 m, or 0.2 percent of effective stage; Sauer and Turnipseed, 2010). Additionally, the stage-discharge rating curve is used to interpolate discharges between measurements. Moreover, the creation of new ratings curves is subject to the hydrographer’s judgement; some hydrographers may create new ratings more readily than others. As such, ratings might not be changed for years and inaccurately represent stability at a site, whereas ratings that might be changed frequently could imply more instability than is warranted. This source of uncertainty primarily pertains to method 1 used in the specific gage analysis. Another source of uncertainty that primarily pertains to method 2 of the specific gage analysis is that periods of backwater effects from beaver dams, large wood, or human activities may cause a field measurement to deviate from a rating. Uncertainty relating to specific-gage analyses was not evaluated for this study. Findings presented here are one line of evidence in understanding historical and recent bed-elevation changes on the Siletz River near USGS streamgage 14305500. However, streamgage locations are commonly chosen based on stability, and results from the specific gage analyses may not be representative for the whole river within the study area. The general interpretations of channel bed elevation that follow are likely representative of real patterns in the channel bed elevation given the long period of record and multiple measurements evaluated.
Specific-Gage Analysis Results
Comparison of Stage at Specific Discharges across Multiple Rating Curves
USGS streamgage 14305500 on the Siletz River has been at its current location (rkm 71.4) and 31.19 m (102.32) ft above the National Geodetic Vertical Datum of 1929 since October 1938. Prior to that time, the station was installed at different locations and different datums within 4.0 km of the current location. These locations had similar stream characteristics. As early hydrographers described the site, “The bed is of coarse gravel and sand, free from vegetation and shifting. One channel at all stages.” (R.W. Davenport, U.S. Geological Survey, written commun., April 19, 1912). From 1905 to 1912, a non-recording gage shows a relatively stable stage-discharge relation except for a short period during 1910 where low discharges were affected by backwater from a dam built to collect lamprey (fig. 24; circle A). The streamgage was at three different locations between January 1924 and September 1938 and had a maximum change in stage of 0.09 m at the 5 percent exceedance probability (fig. 24; circle B).
Since USGS streamgage 14305500 was moved to its current location and datum in September 1938, the relation between stage and discharge has varied with specific discharge and time (fig. 24; circle B). Between October 1938 and October 1941, the rating was relatively stable. In October 1941, increases in the rating ranged between 0.01 m at the lowest discharges to 0.22 m at slightly greater discharges. Between October 1941 and January 1970, net decreases in stage were observed for all discharges, though stage appeared to decline more at the highest discharges evaluated (0.48 m at 159 m3/s) compared to lower discharges (0.07 m at 2.3 and 2.9 m3/s). From January 1970 to February 1996, minor stage changes were observed for all analyzed discharges with net changes ranging from 0.0 to 0.03 m. In February 1996, stages increased by 0.06 m at 152 m3/s to 0.13 m at 2.3 m3/s (fig. 24; circle C); this sharp increase in stage (and likely local channel aggradation) was probably caused by channel changes associated with the fifth largest peak discharge event on record that occurred on February 7, 1996. In January 2002, stage decreased by 0.07–0.12 m (back to levels similar to what was observed before February 1996) for the 75 and 95 exceedance discharges (fig. 24; circle D), whereas more gradual decreases in stage occurred through March 2007 for the 5, 25, and 50 exceedance discharges with net changes ranging from 0.07 to 0.08 m (fig. 24; circle E). From March 2007 to April 2021, stage has been relatively stable through the current rating (21.0 as of April 12, 2021).
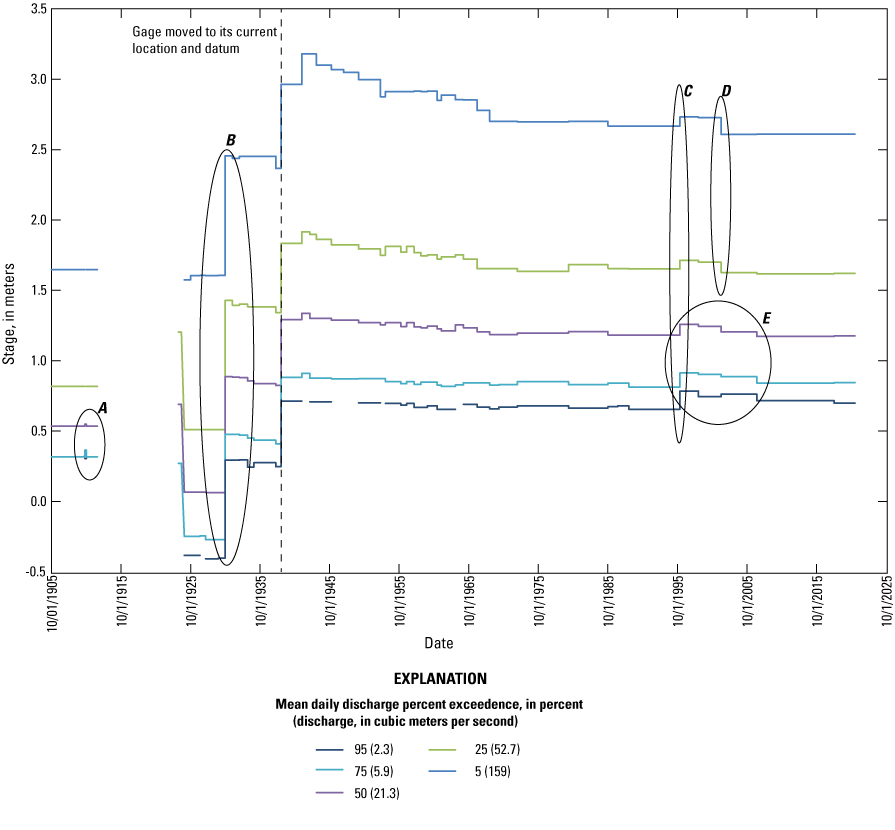
Stage by five specific daily discharge exceedance percentiles for the U.S. Geological Survey streamgage 14305500 (Siletz River at Siletz, OR; U.S. Geological Survey, 2021b). Stage changes in the five circles labeled A–E are described in the text. Any observed changes prior to 1938 may be caused by changes in location and datum. [Dates given in MM/DD/YYYY, month/day/year]
Comparison of Stage Field Measurements to a Recent Rating Curve
More than 200 field measurements of stage (n=236) have been recorded at discharges less than 152 m3/s since 1979 (fig. 25). Residuals between field measurements and stages predicted from the current rating curve (21.0) range from −0.15 to 0.14 m, where negative values indicate stages lower than current rating prediction and positive values indicate stages higher than the current rating predication. Removing seven outliers classified as “poor” quality measurements during field visits (not shown in fig. 25) shifts the minimum residual to −0.05 m and has a median difference from rating curve 21.0 of 0.02 m (absolute differential values). From 1979 to 1996, most measurements fall within ±0.08 m (about the size of a cobble) of the current rating. Following the peak flow event on February 7, 1996 (fig. 5), stage residuals are as much as 0.11 m greater than predicted from the current rating. From 1996 to about 2007, stage residuals declined. From 2007 to 2019, stage residuals approached zero, indicating bed stability. This finding aligns with the recent bed stability indicated by the comparison of the multiple stage-discharge rating curves over time (fig. 24). Some measurements made in 2020 were affected by debris and backwater (J. Flinn, U.S. Geological Survey, written commun., April 21, 2020), likely accounting for deviations from the current rating of as great as 0.13 m.
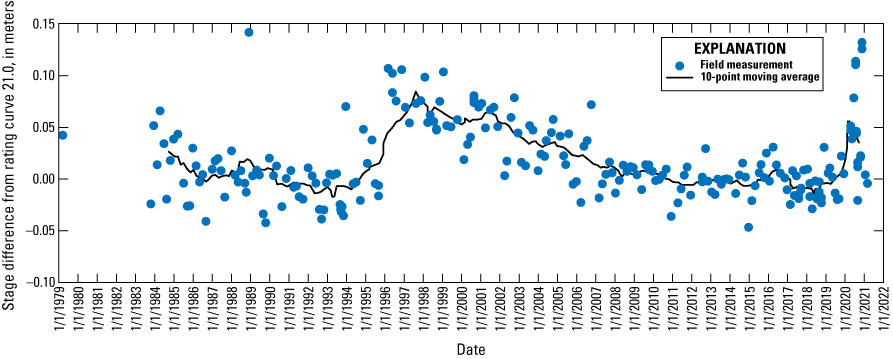
Residual specific-gage analysis for the U.S. Geological Survey streamgage 14305500 (Siletz River at Siletz, OR; U.S. Geological Survey, 2021b). [Dates given in MM/DD/YYYY, month/day/year]
Specific-Gage Analysis Discussion
The relation between stage and discharge at USGS streamgage 14305500 on the Siletz River has varied over time. The relatively small increases in stage associated with October 1941 possibly resulted from incorporation of more discharge measurements. The prominent changes in 1996 and 2002 were likely caused by floods. A sharp increase in stage (and likely local channel aggradation) in February 1996 is probably attributable to the February 7, 1996, peak flood of 982 m3/s (34,700 ft3/s; exceeding 0.1 AEP), which is the fifth largest annual peak discharge event on record (figs. 5, 24–25). This event also caused aggradation at USGS streamgages on the Wilson (U.S. Geological Survey streamgage 14301500; Wilson River near Tillamook, Oregon; Jones and others, 2012c) and Chetco Rivers (U.S. Geological Survey streamgage 14400000; Chetco River near Brookings, Oregon; Wallick and others, 2010). The January 2002 shift in the stage-discharge relation (and potential lowering of local bed elevations) follows moderate floods in WY 2022 (the largest of which was 515 m3/s [18,200 ft3/s] on January 8, 2002), but the updated rating could also indicate some adjustments related to earlier peak flood events that had occurred since the previous rating update in October of 1998.
However, other changes in the stage-discharge rating curve do not appear to coincide with individual floods, even though several large floods occurred during the period of record. For example, the stage-discharge relation was relatively stable between 1970 and 1996 (figs. 24–25). During this time, the maximum annual peak flood was 900 m3/s (31,800 ft3/s) on January 11, 1972, followed by 750 m3/s (26,500 ft3/s) on December 25, 1980. Additionally, the stage-discharge relation was relatively stable from March 2007 to April 2021 despite several large peak flow events, including the third and eighth largest events on record (1,070 m3/s [37,700 ft3/s] on January 19, 2012, and 912 m3/s [32,200 ft3/s] on December 7, 2015). The lack of response in the stage-discharge relation to floods between 2007 and 2021 may be attributable to differences in flood duration and local deposition dynamics (as hypothesized for the Wilson River streamgage [14301500; Wilson River near Tillamook, Oregon] by Jones and others, 2012c), shape of the hydrograph, event timing, or available sediment supply. More recent deviations between the stage-discharge rating curve and field measurements in 2020 are likely attributed to large wood accumulations in the channel creating backwater conditions (J. Flinn, U.S. Geological Survey, written commun., April 21, 2020) and are not indicative of aggradation.
Analysis of Bed-Material Particle Sizes
A robust description of bed-material sediment (the sediment along the channel bed) of the Siletz River is central to understanding overall patterns of sediment transport and availability of aquatic habitats for different species and life stages (Kondolf and Wolman, 1993; Riebe and others, 2014). The morphology and substrates of gravel- and mixed-bed rivers (such as the Siletz River) are indicative of sediment transport conditions produced by sediment supply and transport capacity (Church, 2002, 2006; Lisle, 2012). Sediment supply and the distribution of sediment sizes influence the amount of bedload transport in a river (Parker, 1990a; Wilcock and Crowe, 2003; Wilcock and others, 2009; Wainwright and others, 2015). Particle size distributions can be used to inform locations of potentially suitable spawning habitat for Chinook salmon and Pacific lamprey or potential burrowing habitat for lamprey larvae (Montgomery and others, 1999; Jones and others, 2020).
This study used surficial and subsurface particle size measurements to characterize the longitudinal variation in bed-material textures for sites along the Siletz River from Palmer Creek to the Bulls Bag area (rkm 87.2–33.4) and inform bedload transport analyses (Objective Two). Additionally, armoring ratios (the ration of median bed-surface particle size to median subsurface particle size) were calculated for sites along the Siletz River from Moonshine Park to the City of Siletz (rkm 87.2–68.5; fig. 3; table 1) and compared with past USGS studies (Wallick and others, 2010, 2011; Jones and others, 2011; 2012a–c).
Bed-Material Particle Size Methods
The USGS and the Confederated Tribes of Siletz Indians of Oregon collected surficial particle size data at a total of 11 sites along the Siletz River in August 2017 and July 2018 (“surficial bar particle counts”; fig. 3; Jones and Keith, 2021). A single transect was collected at nine different bar sites (eight in 2017 and one in 2018). Additionally, two transects were collected at the Neighborhood bar (rkm 79.7; fig. 20I) in 2017 to assess distributions of coarse and fine sediment deposits where spawning of Chinook salmon and Pacific lamprey, respectively, has been observed by the Confederated Tribes of Siletz Indians of Oregon. At eight of these surficial bar sites, subsurface bulk samples were collected. Near five of the surficial bar sites, in-channel (wetted) particle counts were also collected (“surficial channel particle counts”). Point, lateral, and island bar sites were selected based on bar size (greater than about 800 m2) and accessibility and chosen to maintain consistency with previous bed-material studies in Oregon coastal rivers (Wallick and others, 2010, 2011; Jones and others, 2011, 2012a–c). These sites were likely formed by recent or historical deposition events and have been scoured by ongoing flood events as indicated by the absence or minimal coverage of vegetation. The data collected by this study were supplemented by surficial particle size measurements data collected by the Confederated Tribes of Siletz Indians of Oregon in 2014 at 35 gravel bars between the City of Siletz and the Bulls Bag area (rkm 68.4 and 33.4; fig. 3; Stan van de Wetering, Confederated Tribes of Siletz Indians of Oregon, written commun, August 8, 2017). Slight differences in sampling methods may introduce some error into the data, but data were deemed comparable at the reach scale.
Surficial bar particle counts systematically sampled particles at evenly spaced increments along two transects (Bunte and Abt, 2001) parallel to flow direction of the main channel. Two hundred clasts were measured with a gravel template (Federal Interagency Sediment Project, U.S. SAH–97™ Gravelometer), which standardizes the measurement of sediment clasts greater than 2 mm in diameter. Surficial particle counts collected by the Confederated Tribes of Siletz Indians of Oregon followed a similar protocol using a gravelometer template. Surficial channel particle counts followed a more traditional Wolman (1954) pebble count approach. One hundred randomly selected particles are measured following a zig-zag pattern across the low-flow wetted channel, primarily perpendicular to flow, within a single geomorphic unit (riffle) of about 50-m long. Subsurface samples were taken at the mid-point of the surficial bar particle counts after the surficial gravel was removed from the bar surface over an area about one square meter and to the depth of about the largest particles. Approximately, one cubic meter of substrate material (50.8–71.5 kilograms [kg]) was excavated and sent to the USGS Cascades Volcano Observatory Sediment Laboratory in Vancouver, Washington, for subsurface particle size analyses.
The particle size distribution data, descriptive statistics, and armoring ratios are used to describe the longitudinal variation in bed-material particle sizes along the Siletz River. Descriptive statistics, including the 16th, 50th or median, and 84th percentiles, of the particle count diameters sizes were calculated from the distributions for all surface and subsurface particle data. Armoring ratios, comparing the median particle size of the surficial bar particle counts to the subsurface measurements, were calculated for all sites where subsurface data were available. The armoring ratio is typically close to 1 (meaning surface and subsurface particles are of similar sizes) for locations where sediment supply exceeds transport capacity, and approaches or exceeds 2 for locations where transport capacity exceeds sediment supply (Bunte and Abt, 2001).
Particle Size Measurements Uncertainty
Surficial particle count uncertainty can source from operator sampling bias, sampling location, and collection technique (for example, Wohl and others, 1996; Bunte and Abt, 2001; Olsen and others, 2005; Daniels and McCusker, 2010). For example, one sampling transect on a gravel bar is not representative of sediment particle distributions across the entire bar surface. We did not systematically evaluate uncertainty relating to particle counts for this study.
Bed-Material Particle Size Results
Upstream from the City of Siletz (rkm 68.5) in the Upper Sandstone and Sam Creek reaches (rkm 88.6–68.8), the median diameter (D50) of surficial particles at the 11 sites on bar surfaces ranged from 18 to 144 mm (table 11). Reported D16 and D84 values range from 3 to 48 and 41 to 242 mm, respectively. Although particle sizes were highly variable between sampling locations, surficial particle distributions generally fell into two categories: bars with finer textures (typical D50 less than 22 mm) and bars with coarser textures (D50 greater than about 50 mm; figs. 26–27A–J). The coarsest bar textures (D50 ranging from 52 to 144 mm) were sampled at the Logsden, Twin Bridges, Rock Creek, Neighborhood (coarser transect), Mid-channel, Bentilla Island, and Klamath Grade bars. The finest bar textures (D50 ranging from 18 to 21 mm) were sampled at the Upper Moonshine, Neighborhood (finer transect), Downstream Moonshine, and Windchime bars. Compared to the finer bars, the coarser bars had a wider range of D50 and D84 values and fewer smaller particles (less than about 24 mm).
Downstream from the City of Siletz in the Mill Creek and Tidal reaches (rkm 68.8–7.1), surficial D50 values at 35 bars sampled by the Confederated Tribes of Siletz Indians of Oregon ranged from 17 to 74 mm (fig. 28). Reported D16 and D84 values range from 7 to 38 and 31 to 118 mm, respectively. Overall, the 2014 measurements made downstream from the City of Siletz were slightly finer than the 2017 counts made upstream from the City of Siletz.
Longitudinal assessment of particle size data from Moonshine Park to the Bulls Bag area (measurements made from rkm 87.5–33.4) show that overall particle distributions tended to be coarsest in the upstream reaches and finer downstream. Median and D84 values tended to be greater in the Upper Sandstone and Sam Creek reaches and then generally decline downstream in the Mill Creek and Tidal reaches (fig. 28; tables 10–11). Each geomorphic reach also had local areas of with relatively high D50 and D84 values, commonly coinciding with tributary confluences and bedrock outcrops. In the Upper Sandstone reach, particle sizes generally increased in the downstream direction from the Logsden bar (rkm 81.1). In the Sam Creek reach, particle sizes generally increased in the downstream direction at the Rock Creek (rkm 80.1), Twin Bridges (rkm 75.9), and Klamath Grade (rkm 73.3) bars downstream from Rock, Scott, and Sam Creeks, respectively. In the Mill Creek reach, particle sizes were relatively high downstream from Thompson and Euchre Creeks at rkm 55.1 and 45.4. In the Tidal reach, particle sizes were relatively high at Cedar Creek bar (rkm 39.4). Locally high D50 and D84 values were also observed in steep sections with bedrock outcrops, such as at Below Mill Launch bar (rkm 60.5), and sections where the active channel is relatively confined, such as Old River Road bar (rkm 57.8). At the most-downstream particle count (rkm 33.4) made on a bar downslope of the landslide pushing the Siletz River northward, D50 and D80 increased again.
Measurements at the seven sites upstream from the City of Siletz where subsurface bed-material samples were collected revealed subsurface textures that were similar to or finer than bar surfaces. The median size of subsurface samples ranged from 17 mm at Downstream Moonshine bar (rkm 86.1) to 76 mm at Logsden bar (rkm 81.1; fig. 27A–J; table 11). At three sites (Upper Moonshine, Downstream Moonshine, and Windchime bars), the particle size distributions of subsurface and surface samples were very similar, and armoring ratios varied from 1.0 to 1.1, indicating that sediment supply for these particle sizes is approximately balanced by transport capacity (table 11). However, at the four other sites where surface and subsurface samples were collected (Logsden, Rock Creek, Mid-channel, and Twin Bridges bars), subsurface particle size distributions were substantially finer than samples of bar surfaces, having armoring ratios approaching or exceeding 2, which may indicate excess transport capacity relative to the supply of sediment sizes on the bar surface. The most heavily armored bars (armoring ratios of 4.8 to 5.1) were observed at Rock Creek and Twin Bridges bars (respectively).
Surficial particle sizes sampled at five sites within the low-flow wetted channel generally showed similar distributions as surficial particle size measurements made on adjacent bar surfaces except for at the Twin Bridges bar (fig. 27A–J). The median diameter of surficial particle counts in the wetted channel at those five sites ranged from 27 mm at Upper Moonshine bar to 67 mm at Mid-channel bar (table 11). In-channel D50 values were slightly greater than bar surface D50 values at the Upper Moonshine and Mid-channel bars (difference of 6–14 mm) and slightly less than bar surface D50 values at the Bentilla Island and Klamath Grade bars (difference of 10–31 mm). The exception was Twin Bridges (rkm 75.9) where the D50 value in the wetted channel was substantially finer than the adjacent bar surface measurement (difference of 71 mm).
For the measurements made for this study in the Upper Sandstone and Sam Creek reaches, the percent sand (percent of particles with a diameter less than 2 mm) for all surficial particle counts on gravel bars and in the wetted channel was typically less than 4 percent but exceeded 10 percent in measurements made at Downstream Moonshine bar (figs. 26–27A–J; table 11). Sand content was considerably greater in the subsurface samples, ranging from 12 percent at Downstream Moonshine bar to 31 percent at Windchime bar.

Particle size distributions of particles counts for sampling sites along the Siletz River, western Oregon. Surficial bar particle size distributions were determined by measuring 200 clasts and generally fell into relatively finer (dotted lines) or coarser (solid lines) distributions. Particle distributions fell into groups of finer bars (Upper Moonshine, Downstream Moonshine, Neighbor finer transect, and Windchime bars) and coarser bars (Logsden, Rock Creek, Neighborhood coarser transect, Mid-channel, Twin Bridges, Bentilla, and Klamath Grade bars) (Jones and Keith, 2021).
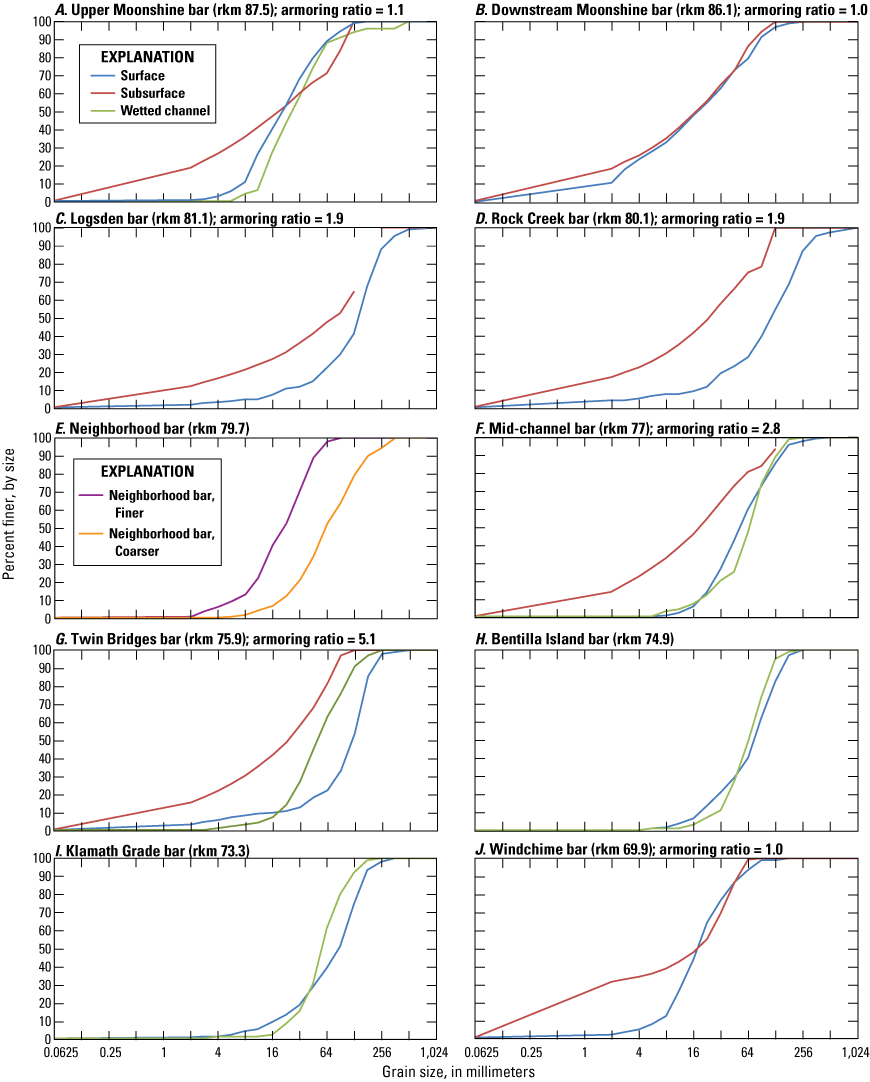
Size distributions of surficial bar particles counts from Jones and Keith (2021) for A, Upper Moonshine; B, Downstream Moonshine; C, Logsden; D, Rock Creek; E, Neighborhood; F, Mid-channel; G, Twin Bridges; H, Bentilla; I, Klamath Grade; and J, Windchime bars along the Siletz River, western Oregon. [rkm, river kilometer]
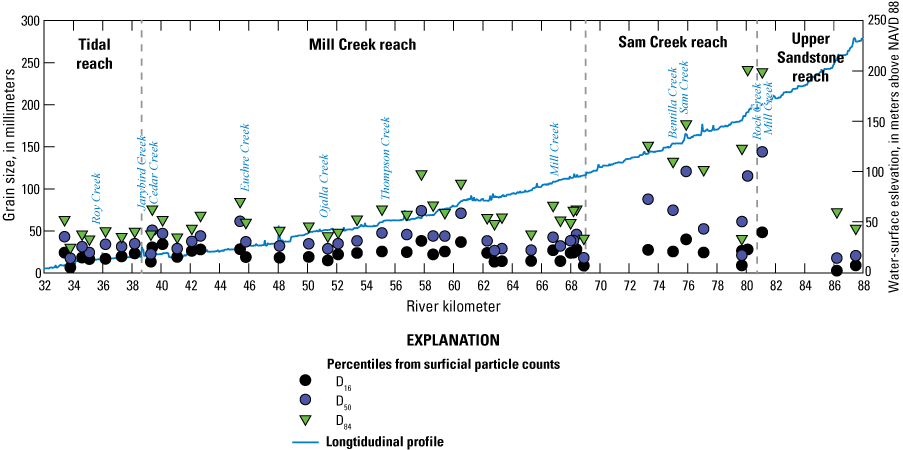
D16, D50, and D84 particle measurements and water-surface profile from light detection and ranging (lidar) data (Watershed Sciences, Inc., 2009a, b109, 2010a, b111, 2012a, b113) along the Siletz River, western Oregon. Measurements upstream from river kilometer 68.4 were collected for this study in 2017–18 (Jones and Keith, 2021). Measurements downstream from river kilometer 68.4 were collected by the Confederated Tribes of Siletz Indians of Oregon in 2014 (table 12). [NAVD 88, National American Vertical Datum of 1988]
Table 11.
Bed-material data from the Siletz River study area, western Oregon.[Data are presented in Jones and Keith (2021). Bar names for the sites sampled in 2014, 2017, and 2018 were assigned based on nearby tributaries or locations within the channel. Local names from the Confederated Tribes of Siletz Indians of Oregon were used where needed. Abbreviations: --, no data; km, kilometer; m, meter; mm, millimeter; D16, 16th percentile diameter in mm; D50, median diameter in mm; D84, 84th percentile diameter in mm; %, percent]
Table 12.
Bed-material data collected by the Confederated Tribes of Siletz Indians of Oregon along the Siletz River, western Oregon, 2014.[Site names were assigned based on nearby tributaries, roads, or locations within the channel. Local names from the Confederated Tribes of Siletz Indians of Oregon were used where needed. Abbreviations: rkm, river kilometer; km, kilometer; m, meter; D16, 16th percentile diameter in mm; D50, median diameter in mm; D84, 84th percentile diameter in mm; D16, 16th percentile diameter in mm; D50, median diameter in mm; D84, 84th percentile diameter in mm]
Bed-Material Particle Size Discussion
The surficial particle distributions on sampled gravel bars between Moonshine Park and the Bulls Bag area (rkm 87.2–33.4) were highly variable but generally display an overall pattern of downstream fining as the river approaches its mouth at the Pacific Ocean. This pattern of downstream fining is likely caused by a combination of selective transport (whereby the ability of rivers to transport large particles decreases downstream with diminishing gradient) and attrition (whereby sediment particles lose mass through prolonged fluvial transport [for example, Parker, 1991; Lisle, 1995]). Despite this overall trend of downstream fining, the bars along the Siletz River have highly variable local bed-material textures, with finer textured bars (D50 ranging from 18 to 21 mm) and coarser bars that were generally well-armored and mantled in larger cobbles (D50 ranging from 52 to 144 mm; fig. 28; tables 10–11). Similar variation in bed texture has been documented for other mixed-bed and alluvial rivers in western Oregon, such as the Umpqua and Wilson Rivers (Wallick and others, 2011; Jones and others, 2012c).
Although causal linkages between particle size and hydrogeomorphic factors influencing bar textures were not systematically evaluated, bed-material textures along the Siletz River appear to demonstrate local influences, such as channel morphology (channel width and gradient) and sediment inputs from tributaries, and basin-scale geology. Bars tended to be coarser above the City of Siletz because of the steeper channel gradient (fig. 4) and narrower channel in these reaches (fig. 6A), which increase transport capacity. This section of the Siletz River is also likely coarse because the main-stem channel and tributaries drain the Coast Range volcanic rocks lithologic province (fig. 1). This province is associated with sediment that is more resistant to breakage during fluvial transport and greater bed-material yield compared to the Coast Range sedimentary rocks lithologic province (O’Connor and others, 2014). Some increases in particle sizes between Euchre and Cedar Creeks (rkm 45.4–39.5) are caused by sediment contributions from tributaries entering the Siletz River along the right side of the channel that are also draining the Coast Range volcanic rocks lithologic province.
The coarser bars upstream from the City of Siletz (figs. 26, 28) also tend to be highly armored (table 11). Such conditions indicate that transport capacity may exceed sediment supply at these locations. The highly armored bars sampled on the Siletz River had some of the greatest armoring ratios calculated for Oregon coastal rivers (table 13) and were comparable to bars sampled along the Umpqua River, where transport capacity substantially exceeds sediment supply (Wallick and others, 2011). Bars with finer particle distributions, such as Upper Moonshine and Downstream Moonshine bars, were less armored, indicating sediment supply exceeds transport capacity at these locations. The results emphasize that factors, such as local hydraulics and channel morphology, allow for the deposition of finer sized particles in the active channel at select locations along this high energy river that typically has sufficient transport capacity to entrain available bed-material sediment (as evidenced by extensive in-channel bedrock). Additionally, the coarsely armored bars and in-channel bedrock suggest that systematic and substantial bed-level lowering (or incision) is likely to be minimal along much of the Siletz River upstream from the City of Siletz.
As would be expected for this semi-alluvial river with numerous armored gravel bars, many of the bars sampled between Moonshine Park and the City of Siletz did not have large percentages of sand (figs. 26–27A–J; table 11). Sand is supplied to the Siletz River, as evident by the greater percentages of sand in the subsurface particle distributions and observations of fine-grained deposition in overbank areas. However, the transport capacity of the Siletz River is generally sufficient to transport sand and finer particles downstream.
Table 13.
Armoring ratios from this study of the Siletz River and prior bed-material studies in Oregon coastal rivers.[River/creek: River or creeks along the Oregon Coast are listed from north to south. Armoring ratio(s): Armoring ratios presented as a range of values if more than one armoring ratio was calculated.]
| River | Armoring ratio(s) |
Number of measurement sites |
Source |
|---|---|---|---|
| Nehalem River | 2.4 | 1 | Jones and others (2012c) |
| Miami River | 1.6 | 1 | Jones and others (2012c) |
| Kilchis River | 2.8 | 1 | Jones and others (2012c) |
| Wilson River | 2.9 | 1 | Jones and others (2012c) |
| Trask River | 5.5 | 1 | Jones and others (2012c) |
| Siletz River | 1.0–5.1 | 7 | This study |
| Umpqua River | 0.99–4.73 | 30 | Wallick and others (2011) |
| South Fork Coquille River | 3.5 | 1 | Jones and others (2012b) |
| Rogue River | 1.2–3.4 | 7 | Jones and others (2012a) |
| Applegate River | 1.2 | 1 | Jones and others (2012a) |
| Hunter Creek | 0.97–1.5 | 2 | Jones and others (2011) |
| Chetco River | 1.38–2.09 | 3 | Wallick and others (2010) |
Hydraulic and Bedload Transport Conditions
Building on the assessment of lateral and vertical channel conditions and longitudinal patterns in bed-material particle distributions (Objective One), Objective Two of this study was to evaluate hydraulic and bedload transport conditions along the Siletz River for a range of discharge conditions to assess the character of the Siletz River and habitat implications with climate change. Objective Two involved three components:
-
• Develop a 1D steady-state hydraulic model along the Siletz River from Moonshine Park to the City of Siletz (rkm 87.2–68.5; fig. 3; table 1; White and others, 2025). Results from the 1D hydraulic model provide insights into longitudinal changes in hydraulic parameters along the study reach and provide output for the transport capacity assessment. This reach is used by used by Chinook salmon and Pacific lamprey for spawning.
-
• Develop a 2D unsteady hydraulic model along the Siletz River near Twin Bridges (rkm 77.0–74.0; White and others, 2025). The 2D model results provide higher-resolution (average cell size of 29 m2) depth and velocity data and are useful for detailed fish habitat analyses throughout an area used by Chinook salmon and Pacific lamprey for spawning.
-
• Assess bedload transport capacity at a range of discharge magnitudes along the Siletz River from Moonshine Park to the City of Siletz (rkm 87.2–68.5) using input data from the 1D hydraulic model (Keith and Jones, 2025). Understanding bedload transport capacity is useful for determining where the channel may preferentially deposit or transport sediment suitable for spawning by salmon and lamprey.
Development of the One-Dimensional Hydraulic Model
A 1D hydraulic model (White and others, 2025) was developed to simulate hydraulic conditions along 19 km of the Siletz River from Moonshine Park to downstream from the Town Bridge on Oregon State Highway 229 (OR 229) near the City of Siletz, Oregon (rkm 87.2–68.5; figs. 3, 29A–B; table 1). Within this model domain, the Siletz River is predominantly single thread, confined by canyon walls, and has reach-scale gradient of 0.02–0.03 m/m as it flows through the Upper Sandstone and Sam Creek reaches (table 4). The 1D hydraulic model was developed using the U.S. Army Corps of Engineer (USACE) Hydraulic Engineering Center River Analysis System (HEC-RAS; version 5.0.7; U.S. Army Corps of Engineers, 2016). The HEC-RAS 1D steady flow model uses the step-backwater method for estimating water-surface elevations corresponding to specified discharges. The method is based on the 1D energy equation to determine energy-balanced water-surface profiles for flows that are steady (in time), gradually varied, and for channel gradients less than about 0.1 m/m.
![Map of the reaches encompassing the one- and two-dimensional (1D and 2D) hydraulic
models developed by this study for 19 kilometers of the Siletz River in the Sam Creek
(A) and Upper Sandstone (B) reaches from Moonshine Park to downstream near the City
of Siletz, Oregon (river kilometers [rkm] 87.2–68.5. The Sam Creek reach includes
the U.S. Geological Survey streamgage (U.S. Geological Survey, 2021b).](https://pubs.usgs.gov/sir/2025/5063/images/sir20255063_fig29a.png)
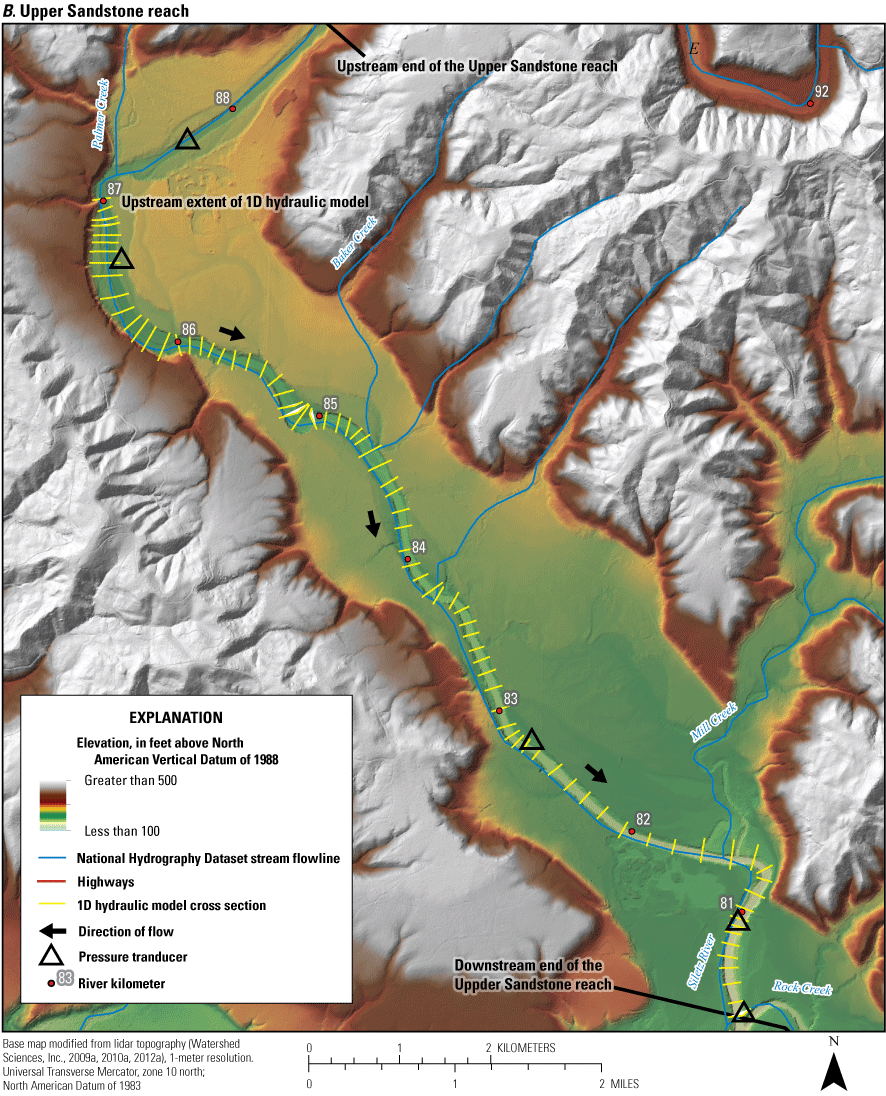
Reaches encompassing the one- and two-dimensional hydraulic models developed by this study (White and others, 2025) and pressure transducer locations (Leahy and others, 2024) for 19 kilometers of the Siletz River in the A, Sam Creek and B, Upper Sandstone reaches from Moonshine Park to downstream near the City of Siletz, Oregon (river kilometers 87.2–68.5). [1D, one-dimensional; 2D, two-dimensional]
One-Dimensional Hydraulic Model Methods and Inputs
HEC-RAS 1D models require topographic and bathymetric data to define the river and floodplain geometry, hydrologic inputs for boundary conditions, and assignment of hydraulic parameters that govern the calculation of energy losses and channel routing. Model results were calibrated from water pressure transducers that measured water depth between 2017 and 2018 (Leahy and others, 2024) and validated by comparing model results of stage to the rating curve of USGS streamgage 14305500.
Topographic Inputs
Hydraulic modeling relies on accurate representation of channel bathymetry and floodplain topography. Digital elevation models (DEM) were developed to underpin the 1D and 2D hydraulic models of this study. Existing light detection and ranging (lidar) data collected in 2009 and 2011–12 (Watershed Sciences, Inc., 2009a, b109, 2010a, b111, 2012a, b113) were used to characterize the floodplain topography. Topographic and bathymetric surveys completed for this study were used to characterize the near channel topography and channel bathymetry, respectively.
Bathymetric and topographic surveys were collected over several efforts between August 2017 and June 2019. Surveys were primarily made from inflatable catarafts and kayaks, using a RTK GPS (Trimble R8) connected to Seafloor Systems SonarMite single beam sonar, though some areas were surveyed by wading. The RTK received corrections primarily from temporary base stations placed at permanent or temporary benchmarks, but some data immediately upstream from the City of Siletz used corrections from the Oregon Realtime Global Navigation Satellite System (GNSS) network. Boats typically traveled down the center of the channel, aiming for the deepest portion. Depth and associated northing, easting, and elevation data were programmed to be collected every second. Cross sections were collected every 50–150 m, with the exact spacing dictated by channel complexity and other factors. In the pre-determined 2D model reach, cross sections were collected at greater frequency—roughly every 20 meters, and several parallel longitudinal profiles were collected. Additional topography data were collected at the large gravel bar and side channel just downstream from Twin Bridges (rkm 76.1). RTK base data were post-processed using National Oceanic and Atmospheric Administration’s Online Positioning User Service (National Oceanic and Atmospheric Administration, 2019), with the resulting corrections applied to field collected data. Surveys were opened and closed at the beginning and end of each day by surveying temporary benchmarks to check for drift. Between processed base station coordinates and instrument supplied precision estimates, uncertainties associated with the measurements were generally less than 0.1 m horizontally and vertically.
Once final corrections were applied, field measurements were converted to shapefiles to be integrated with lidar within a GIS framework. The area inundated during lidar collection was identified using lidar intensity and highest hits data (Watershed Sciences, Inc., 2009a, b109, 2010a, b111, 2012a, b113). This area was then removed from the bare earth DEM, so that the in-channel data collected in field surveys could be inserted. Field data were interpolated with lidar data using a Triangular Irregular Network (TIN). This TIN was edited with breaklines to remove spurious interpolations and then converted to a DEM using a nearest neighbor interpolation, yielding a seamless surface for use in 1D and 2D hydraulic models.
The goal of this DEM encompassing floodplain topography and channel bathymetry was to streamline the process of building geometry inputs for the 1D HEC-RAS model. This DEM is most accurate where cross-sectional field measurements were taken. Channel data between these cross sections were interpolated as described above and are subject to high but unquantified uncertainty. Despite this uncertainty, the DEM can be used to visualize and analyze 1D results. Because the DEM is a continuous terrain dataset, hydraulic model results can effectively be “draped” over the DEM to provide a spatially continuous basis for evaluating simulated water depths and velocities.
Geometry Data
Once the terrestrial and bathymetric data were merged in the DEM, HEC-RAS software was used to delineate the river centerline and the flow paths through the left and right overbank areas. Riverbank lines that delineate the main channel from overbank areas were digitized using lidar data (Watershed Sciences, Inc., 2009a, b109, 2010a, b111, 2012a, b113). Cross-section geometry was derived by digitizing cross-sections perpendicular to the flow direction at intervals between 20 and 244 m (70 and 800 ft) depending on channel complexity. Complex channel segments, such as steep segments or river bends, have closer spaced cross sections than straight or gradually sloping river segments. Most cross sections have a spacing of 60–122 m (200–400 ft), which is roughly equivalent to 1–2 channel widths. The model has 180 cross sections, including two interpolated cross sections at rkm 71.70 and 71.65 that were added to the model to resolve an artificially elevated channel bottom that resulted from local errors in the underlying bathymetric data at this location. Likewise, the channel geometry for the four most downstream cross sections (rkm 68.70–68.45) was imported from survey data collected by Reclamation in 2013 (Foster and Bountry, 2017) to replace erroneous bathymetry in this 0.35 km section of river.
Hydraulic calculations in HEC-RAS 1D models are performed only at cross sections. However, these 1D results can be interpolated with the underlying DEM to create quasi-2D results. While this interpolation can be useful for broad characterization of inundation patterns and hydraulic characteristics between cross sections, results at locations between cross sections are subject to considerable uncertainty and are best considered as rough estimates because hydraulic calculations have not been completed in these areas (U.S. Army Corps of Engineers, 2016).
Hydraulic Parameters
Energy losses are represented in a 1D hydraulic model through Manning’s n values, contraction and expansion losses, and physical in-water structures, such as bridges. Manning’s n values characterize friction losses, or the combined influences of surface roughness, vegetation, roughness in channel morphology, channel alignment, and obstructions. Estimated n values for overbank and channel areas were based on landcover observed in the field and on aerial photographs. In-channel n values ranged from 0.030 to 0.045, while overbank n values ranged from 0.055 to 0.10.
Contraction and expansion coefficients characterize energy losses between two cross-sections due to changes in channel geometry. For this study, the contraction and expansion coefficients for channel cross-sections away from bridges were set to 0.1 and 0.3 respectively. Three bridges are present along the model reach, but design information was only available for one, Town Bridge, a Parker through truss bridge on OR 229 immediately south of the City of Siletz (rkm 68.5, fig. 29A; Oregon State Highway Commission, 1995). Therefore, only the Town Bridge was included in the hydraulic model. The contraction and expansion coefficients for the cross section immediately upstream and downstream from Town Bridge were 0.2 and 0.4, respectively, to account for the energy loss resulting from increased contraction of flow upstream from the bridge and increased flow expansion downstream from the bridge. The two bridges not included in the model (Logsden Bridge at rkm 81 and Twin Bridges at rkm76) are not thought to substantially influence channel hydraulics at the flows simulated in this study because their decks are not inundated at the highest modeled discharge, and their piers are relatively small and well-spaced.
Discharge Scenarios and Boundary Conditions
The 1D model of the Siletz River was run as a series of mixed-regime flow simulations for eight distinct steady-state discharge scenarios to characterize hydraulics at elevated discharge when geomorphic change is anticipated. The flow scenarios were selected to span the range of elevated discharge events observed during the period of record and potential future major floods and were described using AEPs calculated from the long-term discharge record at USGS streamgage 14305500 (table 14). Flow scenarios were determined by calculating the peak flows for six AEPs (0.995, 0.5, 0.1, 0.02, 0.01, 0.002) and by reducing the discharge associated with the 0.995 AEP to two lower flows (25 and 50 percent of the discharge of the 0.995 AEP). These flow estimates are valid for the reach surrounding USGS streamgage 14305500.
Boundary conditions at key tributary confluences along the Siletz River upstream and downstream from the station were determined from flow estimates provided in the NHDPlus V2 hydrologic dataset (McKay and others, 2012). Each flow scenario value was scaled according to the estimated mean annual flow (from the gage-adjusted Enhanced Unit Runoff Method; McKay and others, 2012) at 13 ungaged locations and the upstream boundary of the model (table 14). Figure 30 shows the location of the tributaries, the longitudinal profile of the modeled reach (derived from the minimum channel elevation at each cross section), and the location of bedrock exposed in the channel. The downstream boundary condition was established using a normal depth for a slope of 0.0006 m/m, calculated using the average bed-gradient between the downstream cross sections of the river. A sensitivity analysis was run to evaluate the sensitivity of results to changes in the normal depth, which revealed only minor changes when increasing or decreasing the normal depth by 10 percent.
Table 14.
Discharge values for 6 annual exceedance probabilities (AEPs) and 2 lower discharge scenarios at 14 locations (13 ungaged, 1 gaged) in the one-dimensional hydraulic model reach on the Siletz River, Oregon.[Modeled AEPs are in cubic meters per second (m3/s). Abbreviations: rkm, river kilometer; AEP, annual exceedance probability; %, percent; NA, not applicable]
River station 19532 location coincides with the river segment at U.S. Geological Survey streamgage 14305500 (Siletz River at Siletz, OR; U.S. Geological Survey, 2021b).
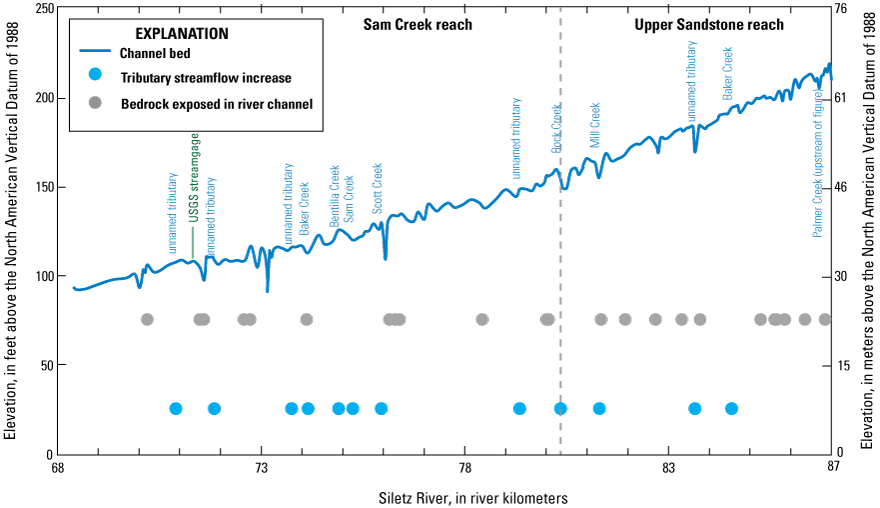
Longitudinal profile of the one-dimensional hydraulic model reach of the Siletz River (river km 68–87; White and others, 2025). Channel elevation was derived from the thalweg of each cross section in the model. Also shown are the locations of 12 tributaries that contribute discharge to the main channel, bedrock exposures on the channel bed (Gordon and others, 2021), and U.S. Geological Survey streamgage 14305500 (Siletz River at Siletz, OR; U.S. Geological Survey, 2021b). Tributary and bedrock locations are not associated with an elevation, and are displayed here to show their longitudinal distributions. [OR, Oregon; USGS, U.S. Geological Survey]
Model Calibration and Verification
The 1D model was calibrated by comparing simulated water surface elevations (WSEs) with measured WSE obtained from 10 pressure transducers (PTs) located along the model reach (figs. 3, 9A–B–10A–C; Leahy and others, 2024). PTs were installed in vented PVC tubing, which was bolted to the downstream end of large features that were unlikely to move at high flow, such as bedrock, bridge piers, or large boulders. The PTs were installed in autumn 2017 and retrieved in summer of 2018, collecting continuous water level measurements at 30-minute increments over this period. Most PTs were placed in the low-flow channel, and thus collected water level and temperature data at a wide range of flow conditions throughout their deployment; however, three PTs (Bentilla, Downstream Neighborhood, and Downstream Moonshine bars) were installed after the 0.50 AEP event in 2017 and were dewatered at lower flows during summer 2018. This missing data from summer of 2018 affect model calibration at the 25 percent of the 0.995 AEP at Bentilla and Downstream Neighborhood bars and at the 0.50 AEP at all 3 PT locations. Due to this lack of data, results at these flows and locations are subject to higher uncertainty. To convert the pressure readings of the PTs to relative water level, or stage, atmospheric pressure was collected near the middle of the reach. Atmospheric pressure was then subtracted from PT pressure measurements, and the resulting value was then converted to stage using equations provided by PT manufacturers (Onset Computer Corporation, 2022). To convert the relative water level values for each PT to WSE values that could be compared with model results for model calibration, the elevation of each PT was surveyed at time of deployment and retrieval using an RTK GPS and added to the water level values collected by PTs (complete description of the PT data are provided in the metadata for this publication; Leahy and others, 2024).
Water surface elevations for four discharge scenarios, all equal or less than the magnitude of the 0.50 AEP, were used for model calibration. During model calibration, several model parameters, such as the Manning’s n value, ineffective flow areas, and cross section placement were systematically inspected and adjusted to improve model performance. Manning’s n values were adjusted based on reasonable roughness values that minimized model error (observed WSE minus model WSE). Final roughness values ranged from 0.03 to 0.045 for the low-flow channel and 0.037 to 0.1 for vegetated bars, islands, and overbank areas. In the channel, roughness values closer to 0.03 were assigned to reaches of exposed bedrock, gravel, and (or) simple channel geometries whereas higher roughness values (closer to 0.045) were assigned to cobble and (or) boulder reaches or reaches with complex channel geometry. For the overbank areas and gravel bars, lower roughness values (typically ranging from 0.037 to 0.06) were assigned to sparsely vegetated bars, and cultivated overbank areas, whereas densely vegetated islands and bars and heavily wooded overbank areas were assigned roughness values ranging from 0.07 to 0.1. Ineffective flow areas were added to locations in the cross sections that were inundated by water, but likely did not convey flow, such as disconnected side channels and at mouths of tributaries. Cross section length and spacing were also inspected and adjusted to ensure each cross section fully contained the water at the highest simulated discharges and the convergence ratio was typically not less than 0.7 or greater than 1.4.
At all reference locations and for the calibration flows, model error was less than 0.6 m (2 ft), and in most cases, less than 0.3 m (1 ft; fig. 31). Individual calibration locations had varying level of bias and trends. For example, model error at the Moonshine bar location increases with higher discharges, and modeled WSE is consistently higher than measured WSE. However, there are no clear trends or bias in the calibration results reach-wide. Of the 10 calibration locations, 3 showed modeled WSE exceeding measured WSE at all flows, while 2 showed modeled WSE beneath measured WSE at all flows. The other eight locations showed a mix of over/under estimating WSE, depending on discharge. There also doesn’t appear to be consistent bias at a given magnitude discharge. Overall, the final model is a reasonable correspondence to measured water-surface stages across the range of modeled discharges and reasonable and consistent values of energy-loss parameters specified in the model.

Model error, the difference between observed and modeled water-surface elevations (WSE). Observed WSEs were recorded by pressure transducers (Leahy and others, 2024) and modeled WSEs are the result of the one-dimensional hydraulic model for four calibration flows (White and others, 2025).
Following calibration of the 1D model, model results were compared to WSE observations not used as part of the calibration process. Unlike the calibration WSE dataset that relied on data from PT measurements, the validation WSE dataset was created by taking the most recent stage-discharge rating curve for the USGS streamgage 14305500 (rating 21.0) and adding the gage datum (elevation) to the relative stage values. Hence, while the calibration dataset represented discharges from autumn 2017—summer 2018 and did not include flows over the 0.5 AEP, the validation dataset included WSEs for larger magnitude floods. Validation results indicated that the model was within 0.6 m (2 ft) of the 0.01 and 0.002 AEPs, lending confidence to the model results for large flows, at least near the location of the USGS streamgage 14305500 (fig. 32).
![Graph comparing the difference between observed and modeled water-surface elevations
with discharge for U.S. Geological Survey streamgage 14305500 (Siletz River at Siletz,
OR; U.S. Geological Survey, 2021b; Leahy and others, 2024; White and others, 2025).
The difference in water-surface elevation between the observed stage at the gage and
the model is less than 0.65 meters (2.1 feet) for all flows up to the 0.002 annual
exceedance probability value. [OR, Oregon]](https://pubs.usgs.gov/sir/2025/5063/images/sir20255063_fig32.png)
Difference between observed and modeled water-surface elevations with discharge for U.S. Geological Survey streamgage 14305500 (Siletz River at Siletz, OR; U.S. Geological Survey, 2021b; Leahy and others, 2024; White and others, 2025). The difference in water-surface elevation between the observed stage at the gage and the model is less than 0.65 meters (2.1 feet) for all flows up to the 0.002 annual exceedance probability value. [OR, Oregon]
One-Dimensional Hydraulic Model Limitations
Because the 1D model was not calibrated to flows greater than the 0.50 AEP, results are most reliable for flows less than or equal to the 0.50 AEP for most the modeling domain except near USGS streamgage 14305500 where the model was validated to much higher flows using the stage-discharge rating curve. However, at these uncalibrated higher flows, the model underestimates energy losses, resulting in higher WSE model results than represented in the rating curve. This could be due to many factors, the most likely of which is that actual hydraulic roughness at these elevated discharges is greater than what is parameterized in the model. The model is used to compute hydraulic information (such as water depth, velocity, and energy slope) at each cross section and interpolated between cross sections based on the bounding cross sections and the terrain model. 1D models assume that all flow is uniformly directed downstream and are typically best suited for single thread reaches where channel planform is relatively simple (for example, few gravel bars) and where changes in channel or overbank geometry (such as channel widening) occur gradually. Hence, the Siletz River 1D model was mainly applied to single thread, confined reaches, but results from local areas with more complex channel morphology may be less accurate.
One-Dimensional Hydraulic Model Results
Following calibration and validation, the final 1D Siletz River model was used to simulate hydraulic conditions for eight discharge magnitudes (table 14), and results were analyzed to evaluate patterns that relate to local and river-scale hydraulic controls and variation with discharge. Longitudinal profiles of model output for discharge, top width of the active channel, hydraulic radius, energy slope, and velocity are shown in figure 33A–F. The largest step increase in discharge across all flows occurred at rkm 80.3 (fig. 33A) because of the confluence of the Siletz River with Rock Creek, the largest tributary sub-basin in the modeling reach (11 km2; 43 mi2) that is heavily forested (fig. 3; U.S. Geological Survey, 2019). The top wetted width of the active channel (henceforth, ‘top width’) ranged from a minimum of about 25 m (82 ft) at the lowest flow near rkm 72 to a maximum of about 105 m (344 ft) at high flows near rkm 80 (fig. 33B). At most modeled flows, the top width varied from about 30 and 60 m (98 and 196 ft). Local bars and floodplains were largely inundated by flows exceeding the 0.995 AEP, thus top width changed very little as flows increased. Depths varied from less than 1 m (0.3 ft) at low flows to over 15 m (49 ft) at the highest modeled discharges (fig. 33C).
Results from the 1D steady flow model show that velocities (fig. 33D) ranged from less than 0.3 m/s (1 ft/s) to about 3.7 m/s (12 ft/s) for discharges at or below the 0.995 AEP (211 m3/s [7,452 ft3/s] at USGS streamgage 14305500) but increased to a maximum velocity of about 4.9 m/s (16 ft/s) for the 0.002 AEP (1,428 m3/s [50,423 ft3/s]; table 15). Once the flow in the river approached the 0.50 AEP, the maximum velocity increased very little (less than about 0.6 m/s [2 ft/s]) for flows up to and including the 0.002 AEP. The change in maximum velocity of the flows up to the 0.50 AEP was about 1.5 m/s (5 ft/s). In general, stream velocities were the highest overall in the upstream-most 2 kms of the model where the Siletz River exits a steep and narrow bedrock canyon upstream from the modeled reach. Considering all cross-sections in the 1D model, mean channel velocity for the 25 percent of the 0.995 AEP was 1.18 m/s (3.88 ft/s) and increased to 1.86 m/s (6.10 ft/s) at the 0.995 AEP (table 14). The mean channel velocity of the 0.50 AEP was 2.82 m/s (9.25 ft/s) and only increases to 3.56 m/s (11.67 ft/s) at the 0.002 AEP.
The hydraulic radius, a metric used to describe the shape of the channel, varied from about 0.5 m (1.6 ft) near rkm 80 at the lowest flow to almost 10 m (33 ft) near rkm 73 at the 0.002 AEP (fig. 33E). Reaches with lower hydraulic radii had more water in contact with the channel bed and were subject to more frictional forces than reaches with higher hydraulic radii. In general, reaches with higher hydraulic radii tended to have higher flow velocities. Although hydraulic radius varied considerably along the modeled reach, hydraulic radius generally increased from upstream to downstream for flows greater than or equal to the 0.50 AEP. The energy slopes for flows below the 0.50 AEP tended to be much higher (maximum of 0.023 near rkm 80) than flows at or above the 0.50 AEP at many locations along the modeled reach (fig. 33F). With few exceptions upstream from rkm 80, flows greater than or equal to the 0.50 AEP had energy slopes less than about 0.005. Generally, the highest energy slopes were upstream from about rkm 80 in the modeled reach. The channel in the reach upstream from rkm 80 is steeper than the downstream reach and includes bedrock knickpoints in the channel which locally steepen the energy slope at low flows. These bedrock knickpoints tended to get inundated at higher flows (greater than about 481 m3/s [17,000 ft3/s]), lowering the local energy slope.
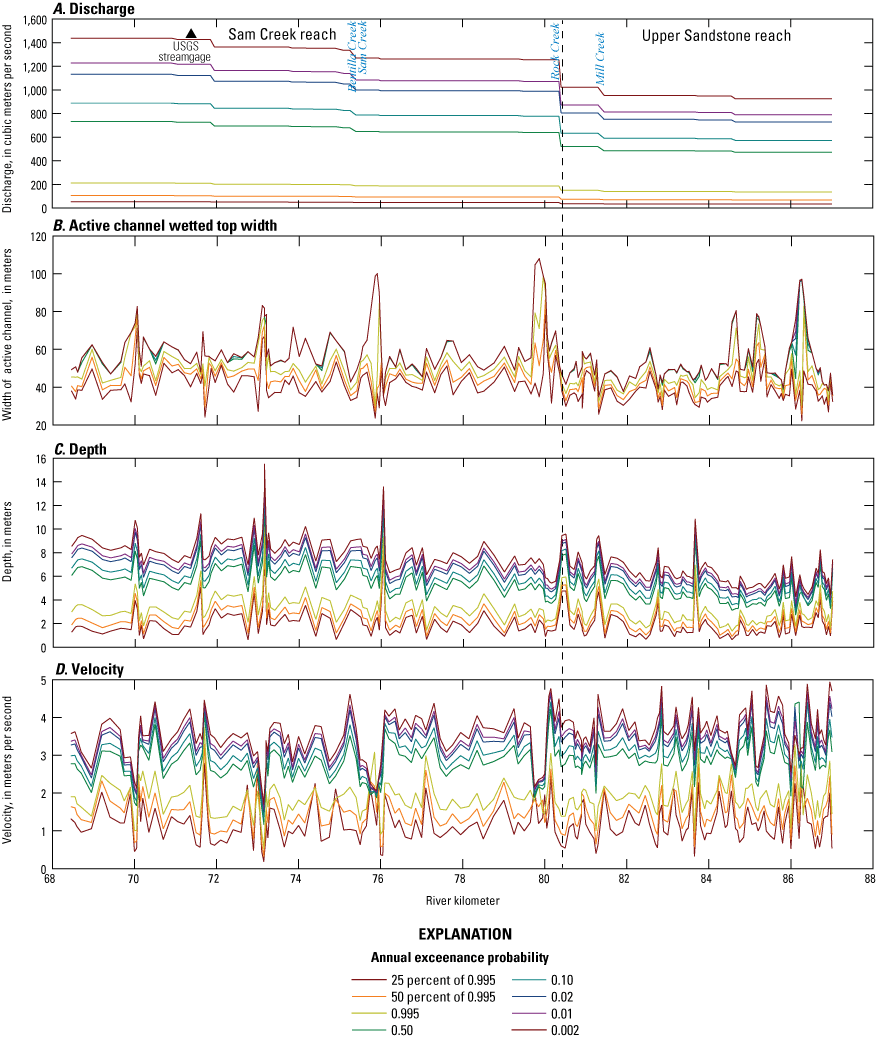
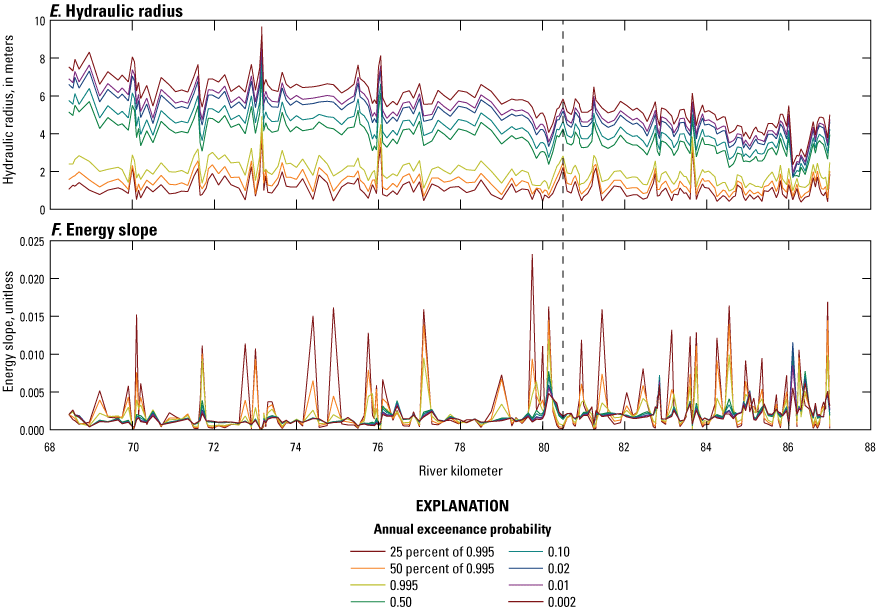
Longitudinal plots showing results from the one-dimensional hydraulic model of the Siletz River, Oregon (river kilometers 87.2–68.5; White and others [2025]) including A, discharge; B, active channel wetted top width; C, depth; D, velocity; E, hydraulic radius; and F, energy slope for the eight modeled discharge scenarios. The discharges for each annual exceedance probability are increasing downstream as specified in table 14.
Table 15.
Mean, maximum, and minimum channel velocity for the eight flow scenarios used in the one-dimensional hydraulic model for the Siletz River, Oregon (White and others, 2025).[Abbreviations: AEP, annual exceedance probability; RI, recurrence interval; m/s, meters per second; ft/s, feet per second; NA, not applicable]
One-Dimensional Hydraulic Model Discussion
The Siletz River 1D model provides a basis for evaluating hydraulic conditions for different discharge magnitudes along the 19-km model reach of the Siletz River between Moonshine Park and the City of Siletz. The results can help characterize this reach of the Siletz River that has spawning habitats used by Chinook salmon and Pacific lamprey and understand expected hydraulic conditions now and in the future. Results show that there is a notable change in hydraulic character between the 0.995 and 0.5 AEPs, but smaller changes between the 0.5 and 0.002 AEPs (figs. 33A–F; 35A–F). For example, there is a notable increase in wetted width at flows greater than the 0.995 AEP, but very small increases in wetted width at higher AEPs (figs. 34B, 35A), suggesting that the Siletz River has inundated local bars and floodplains at the 0.5 AEP, but widens little at flows greater than the 0.5 AEP. This is also shown in figure 34A–F, where all but one gravel bar is inundated at flows between 0.995 and 0.5 AEPs. While wetted width stays similar at discharges above 0.5 AEP, depth and channel velocity continue to increase between the 0.5 and 0.002 AEPs (figs. 35B-C). This again suggests that most of the available floodplains have been inundated at 0.5 AEP, resulting in swifter, deeper water.

Inundation and depth at the 0.995 and 0.50 annual exceedance probability (AEP) discharges for select sites within the one-dimensional model reach along the Siletz River, Oregon (river kilometers 86.5–85.0 [A–B], 79.85 [C–D], and 75.85 [E–F] from White and others [2025]). Pressure transducer locations are from Leahy and others (2024).

Results for A, top width B, channel velocity and C, depth for the eight discharges scenarios (including six annual exceedance probability discharges and two lower discharges) for the one-dimensional hydraulic model reach on the Siletz River, Oregon (White and others, 2025). The flow scenarios are defined in table 14. Model kilometer (km) is the reference location for the one-dimensional modeling reach.
Development of the Two-Dimensional Hydraulic Model
A 2D model (White and others, 2025) was developed for a 3 km reach of Siletz River (rkm 77 to 74), encompassing the Twin Bridges sub-reach of the detailed channel mapping and Twin Bridges and Bentilla bars sampled for grain size (fig. 29A). The 2D hydraulic model was developed using the USACE HEC-RAS (version 5.0.7; U.S. Army Corps of Engineers, 2016). The primary goal of this modeling was to produce higher resolution characterizations of hydraulics in this high priority area for salmon spawning.
A secondary goal was to gain a greater understanding of the capabilities and limitations of 1D and 2D models for future studies along the Siletz River. In many applications, a 1D model can produce results as reliable as a 2D model with much less computational time and fewer inputs. A key difference is that 1D models calculate cross-sectionally averaged hydraulic parameters, whereas 2D models calculate laterally and longitudinally explicit values of depth, velocity, and WSE, which can be used for more detailed analysis. These detailed outputs are produced by 2D models because these models solve depth-averaged hydraulic equations of flow throughout a computational mesh at a user defined resolution. Depending on the characteristics of the river and the question at hand, 2D models can be a more appropriate choice for modeling. For example, 2D models may be more appropriate where river flow and velocity occur in multiple directions and WSEs, gradients, and flow direction vary across the valley bottom, such as in reaches with wide overbank areas, sharp channel bends, or gravel bars and side channels.
Two-Dimensional Hydraulic Model Methods
The 2aD model used the same terrain model and WSE calibration dataset used in the 1D model development, whereby model terrain was developed utilizing a blend of lidar and boat-based bathymetry and the WSEs were measured using PTs. Bathymetry surveys in this reach were conducted specifically for 2D modeling, requiring a higher point density compared to 1D modeled reaches (refer to the “Topographic Inputs” sub-section under the “One-Dimensional Hydraulic Model Methods and Inputs” section).
Two-Dimensional Computational Mesh
Whereas the 1D model performs hydraulic computations at a series of defined cross-sections, the 2D model utilizes a computational mesh that encompasses the model domain. The HEC-RAS 2D modeling capability uses an Implicit Finite Volume algorithm (U.S. Army Corps of Engineers, 2016). This allows for the use of a structured or unstructured mesh with computations occurring at each cell boundary, which may range from three to eight cells (U.S. Army Corps of Engineers, 2016).
A mesh with a computational point spacing of 6.1 m (20 ft) was generated for a flow area that included the active channel, floodplain, and upland areas (fig. 36). Breaklines were added within the 2D flow area to represent significant barriers to flow, such as roads and natural embankments. Because smaller cell sizes are typically required to define substantial changes in geometry and rapid changes in flow dynamics, point spacing along the breaklines was reduced to between 1.5 m and 3 m (5 and 10 ft). Where the water surface gradient was flat or gradually changing, such as in the active channel and most floodplain areas along this reach, larger grid cell sizes were appropriate. The mesh had a total of 61,086 cells. The average cell size was about 29 m2 (309 ft2).
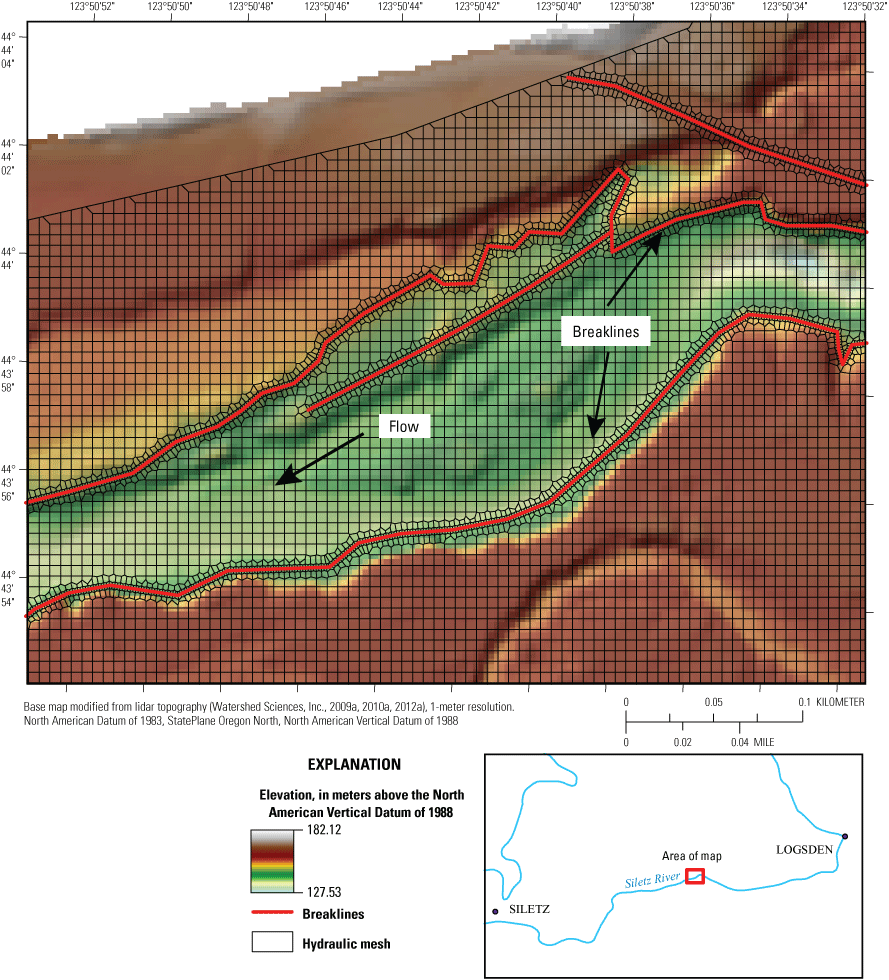
Example of the two-dimensional (2D) mesh and breaklines for the 2D hydraulic model (White and others, 2025) along the Siletz River, Oregon. [%, percent]
Two-Dimensional Model Parameters
Manning’s n values for the active channel were based on the channel mapping by Gordon and others (2021) and described above for the 1D model. Most of the active channel in this reach was composed of gravel and cobbles and was assigned a roughness value of 0.035. Localized areas of exposed bedrock were assigned roughness values of 0.02. Bare bars, vegetated gravel bars, and side channels were assigned roughness values of 0.035, 0.065, and 0.045, respectively. Two overbank areas of grassy lawn were assigned roughness values of 0.032–0.037. All other overbank areas were assigning roughness values of 0.072. Manning’s n values for the 2D model are shown in table 16.
To keep the Courant number less than or equal to 1, a time step of 2 seconds was used for all flow hydrographs. This ensures that water does not pass through a computational cell at a rate faster than the timestep. Hydrograph simulations were run for a duration of 99 hours to ensure model stability. The energy slope for distributing flow along the boundary condition line is 0.0006 m/m, which was developed by calculating channel slope at the boundary line using the DEM.
Model Calibration
The same WSE and associated discharge data used to calibrate the 1D model were used to calibrate the 2D model. Two simulation flow hydrographs were used to calibrate the model. The first hydrograph included the 25 and 50 percent of the 0.995 AEPs and the 0.995 AEP and the second hydrograph included the 0.50 AEP. Each of the two simulations were ramped up to each of the AEPs used for the calibration and held steady for 5–7 hours to ensure the model was stable before ramping up to the next calibration flow. For the 0.50 AEP run, the model slowly ramped up to the calibration flow, held steady for 5 hours, then decreased. The 2D model domain included the location of three pressure transducers described in Modeling and Calibration section for the 1D model. Therefore, measured WSEs could be compared to modeled WSEs for the four calibration flows. Time steps, Manning’s n values, breaklines, and cell size were adjusted based on the model output. The difference between the measured WSE and the modeled WSE at the three pressure transducer locations for the four calibration flows ranged from −0.01 to 0.61 m (−0.04–2.01 ft) with a mean error of 0.15 m (0.51 ft) and a standard deviation of 0.27 m (0.88 ft). In general, the least amount of error was at low flows, and the 0.50 AEP had about 0.6 m (2 ft) of error (fig. 37). Model error can be attributed to several factors, including errors in the underlying topography and errors in measuring the WSE from the pressure transducers. Uncertainty is also associated with the discharge boundary condition for the model, which uses estimated steady flows, while the calibration data from the pressure transducers measured WSE during an actual flow event. The final model parameters represent what we determined to be a reasonable correspondence to measured water-surface stages across the range of modeled discharges and reasonable and consistent values of energy-loss parameters specified in the model. Potential application of model results should consider if this level of uncertainty is acceptable for the intended application of the results.
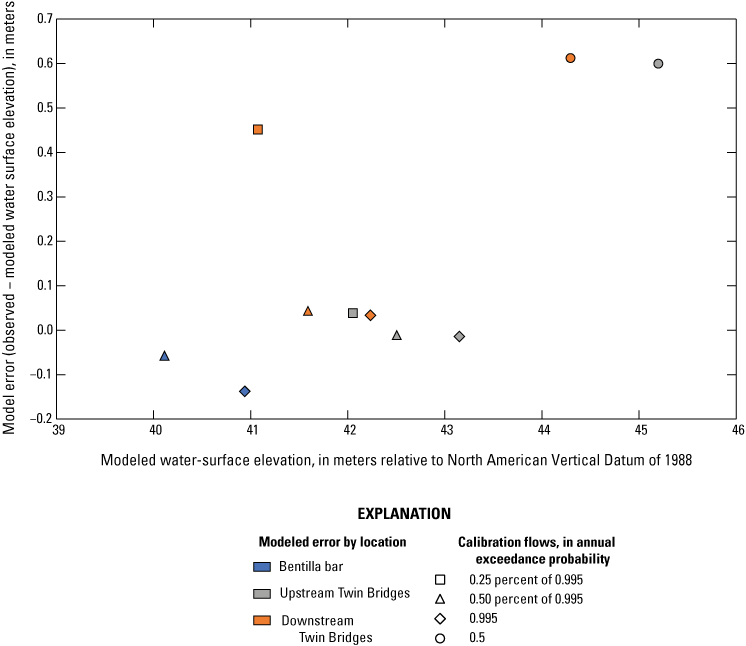
Difference between the water surface elevations (WSE) measured by pressure transducers (Leahy and others, 2024) and two-dimensional modeled WSE for four calibration flows (White and others, 2025).
Two-Dimensional Model Limitations
Hydraulic models, like all models, make assumptions and simplifications to simulate physical conditions, which can introduce uncertainty or errors into simulations. Perhaps the most notable uncertainty in the 2D hydraulic model is that discharge conditions were modeled as steady-state flows, whereby each discharge was modeled for 99 simulation hours. However, storm events on the Siletz often result in hydrographs that rise and fall rapidly, potentially resulting in different hydraulic conditions at the time of peak (simulated) flow. Additionally, hydraulic calculations are performed at the cell level, and therefore features smaller than the cell are not explicitly accounted for in the results. For example, if a computational cell is 5×5 m, the hydraulic effects of a 1×1 m boulder within that grid cell would not be explicitly accounted for in the results. HEC-RAS 5.0.7 leverages sub-grid bathymetry, thus enabling the ability to capture some features (at higher resolutions than computational cells, but many smaller features are not captured. This is important when considering applications of model results, such as evaluating aquatic habitat suitability, where aquatic organisms may be relying on hydraulic conditions at scales smaller than those modeled. Additionally, the 2D model was calibrated with in situ PTs, as described above, which recorded WSE at discharges up to the 0.5 AEP. Thus, model results at higher discharges are uncalibrated and thus have higher, but unquantified, uncertainty. Finally, hydraulic models are sensitive to the underlying bathymetric data. Thus, errors and uncertainties in the DEM can propagate into model results. In this study, the DEM was created by combining single-beam sonar data collected along long profiles and cross-sections throughout the study reach with lidar data (refer to “Topographic Inputs”). This DEM represents a simplified surface of the channel and floodplain, and thus smaller features, such as boulders, are not represented in the DEM.
Two-Dimensional Hydraulic Model Results
The highest velocities in the 2D model reach were in four locations: (1) between rkm 76.85 and 76.10, (2) between rkm 79.95 and 75.75 where the main channel flows around Twin Bridges bar, (3) between rkm 75.40 and 75.10, and (4) downstream from rkm 74.75. Considering the whole 2D model reach and all the modeled flows, the maximum simulated water velocity values were about 3.0 m/s (9.8 ft/s) for the 25 percent of the 0.995 AEP, 4.0 m/s (13.0 ft/s) for the 50 percent of the 0.995 AEP, 4.7 m/s (15.3 ft/s) for the 0.995 AEP, and about 5.5 m/s (18.0 ft/s) for the 0.50 AEP. These local maximums occur in the main channel as water flows around Twin Bridges bar for flows at or less than the 0.995 AEP. For the 0.50 AEP, maximum velocities occur near rkm 76.25 just upstream from Twin Bridges. Flow depths approach 11 m (36 ft) at Twin Bridges, the deepest location in the model reach, at the 0.50 AEP.
Two-Dimensional Hydraulic Model Discussion
The 2D hydraulic model was developed to produce high-resolution hydraulic results in a high priority area for salmon spawning within the 1D reach and demonstrate the utility of 1D and 2D models for future studies along the Siletz River. Comparisons of the hydraulic model output from the 1D and 2D models reveal fundamental differences in the underlying computational framework for each model, especially in areas of complex channel morphology, such as where the channel has large gravel bars near Twin Bridges (figs. 38A–H). For this comparison, we examined the results from the 1D model at the cross sections as well as the interpolated data between cross sections. In the 1D model, hydraulic outputs (such as velocity, depth, and WSE) are computed at each cross section then interpolated based on the topography and water conveyance between cross sections. In the 2D model, hydraulic parameters are computed for each grid cell in the computational mesh. The underlying bathymetry and topography dataset (DEM) is the same in both the 1D and 2D models; the 1D model discretizes this terrain into cross-sections as well as for the interpolation results between cross sections, while the 2D model discretizes this terrain into cells. Therefore, the similarity of model results is not surprising.
At all simulated flows less than or equal to the 0.50 AEP, the magnitude and spatial distribution of velocities as computed by the 1D and 2D models for in-channel and overbank areas were similar (figs. 38A–H–39A–B). For discharges less than or equal to the 0.50 AEP, the maximum simulated velocity was higher in the 2D model (about 5.5 m/s or 18 ft/s) compared to the 1D model (3.7 m/s or 12.1 ft/s) along the same reach. The location of the velocity maximums occurred in the same general area (upstream from Twin Bridges starting at about rkm 76.1 and along the outside of the slight bend in the river near rkm 74.15) in both models (as shown in figure 38 at the 0.995 and 0.50 AEPs). Overall, the velocity of both models in this reach is about ±1 m/s (3 ft/s) of each other, except for the outside bend around Twin Bridges bar at the 0.50 AEPs and small areas in a few other locations. The 1D and 2D models produce similar velocity patterns at the 0.995 AEP, with the largest difference in velocity occurring near the Twin Bridges bar.
The general similarities between the 1D and 2D models in this reach are not surprising, given that the channel is a single-thread and laterally confined and both models utilize the same model terrain. Although the model differences are modest, interpolated 1D results throughout the rest of the model domain do not necessarily produce similar results as a detailed 2D model. The considerably coarser terrain data in the rest of the 1D model extent are not suitable for 2D modeling purposes, and simulated hydraulics in the segment of rkm 77–74 may not be representative of hydraulic conditions elsewhere in the 1D domain.
Hydraulic models are used to inform a range of management and restoration design questions. The benefits and limitations of 1D and 2D models generally depend on the questions asked with them. For example, where the Siletz River is typically a single channel and the direction of flow is largely downstream (for example, minimal lateral flow over banks), 1D models can provide accurate results to questions, such as inundation extent, water depth and velocity, and bed shear stress. However, 1D models are typically inadequate to answer questions that rely on hydraulic properties at scales finer than river cross sections or questions pertaining to more complex hydraulics, such as eddies and backwaters. In such instances, 2D models are advantageous because they calculate hydraulics at a user-defined resolution, and flow is simulated in both x- and y-directions. Such 2D models can be used to evaluate fish habitat or detailed flow around in-water structures, such as bridges or engineered log jams. Further, although 1D model results can be interpolated between cross-sections to achieve pseudo-2D results, these areas have much higher uncertainty than the same areas calculated in the 2D model. Thus, 2D models may be more appropriate if higher confidence is required at sub-cross-section scales.
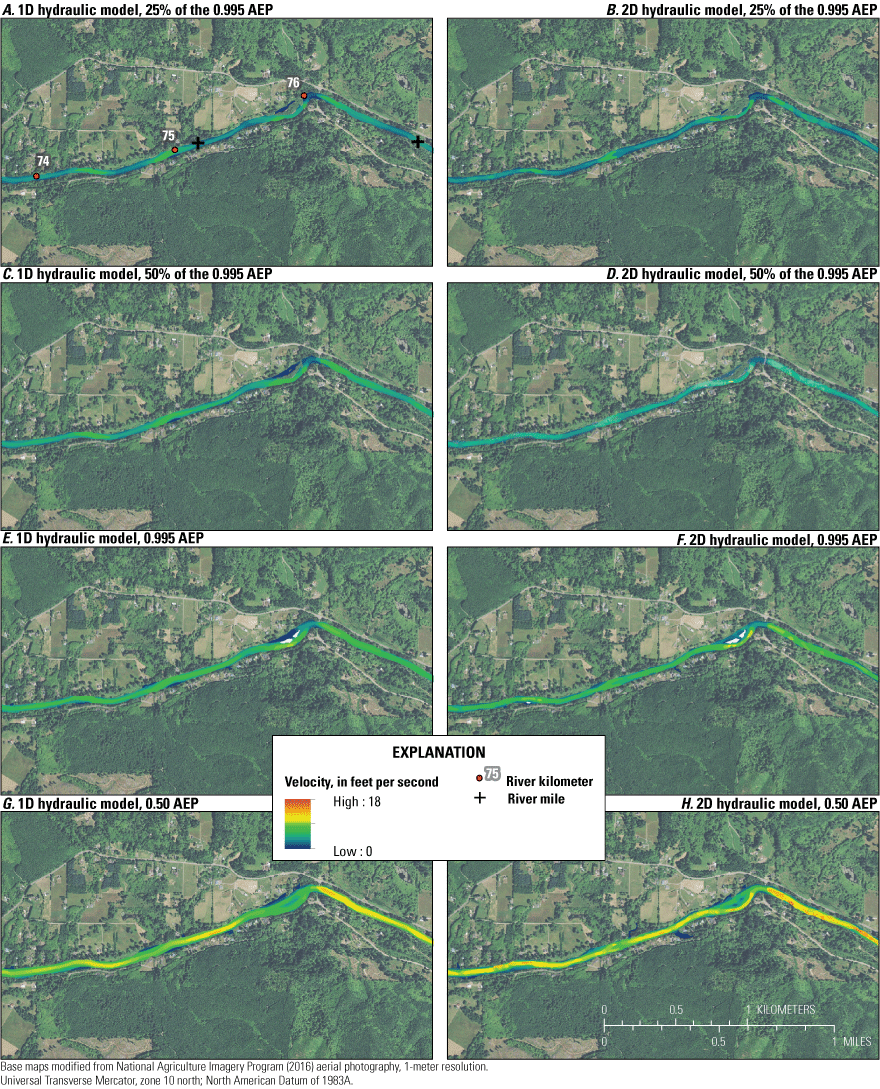
Velocity results near Twin Bridges for A, 1D-model, 25% of the 0.995 AEP; B, 2D-model, 25% of the 0.995 AEP; C, 1D-model, 50% of the 0.995 AEP; D, 2D-model, 50% of the 0.995 AEP; E, 1D-model, 0.995 AEP; F, 2D-model, 0.995 AEP; G, 1D-model, 0.50 AEP; and H, 2D-model, 0.50 AEP used for model calibration. [White and others, 2025; 1D, one-dimensional; 2D, two-dimensional; %, percent; AEP, annual exceedance probability]
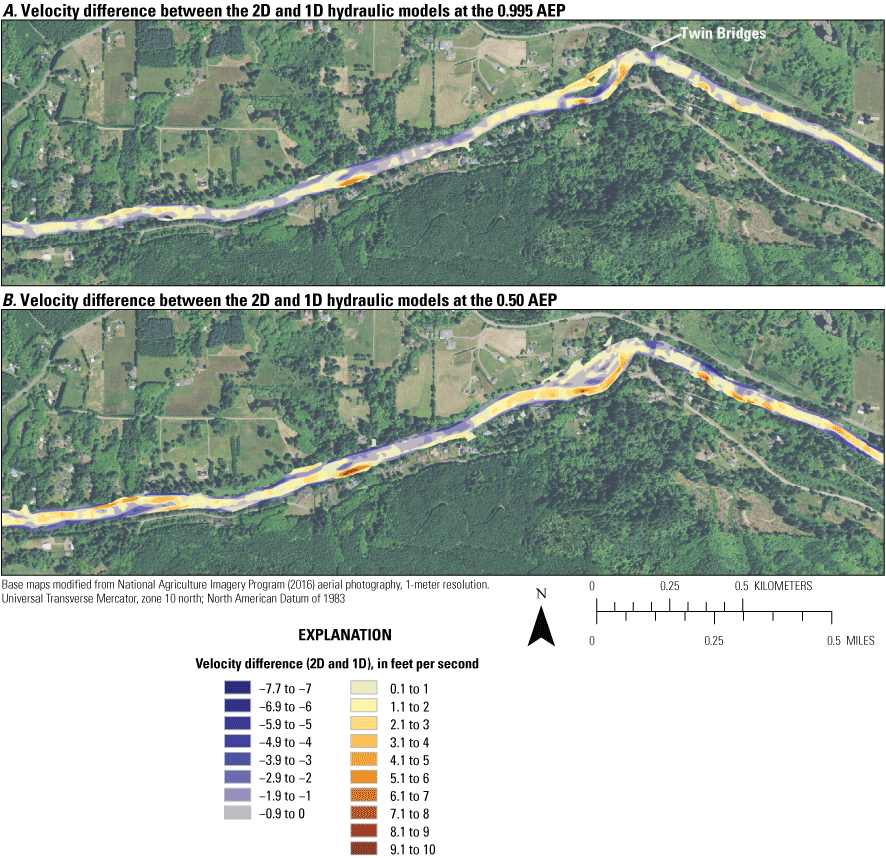
Two-dimensional (2D) model results of velocity minus one-dimensional (1D) results for the same reach along the Siletz River near Twin Bridges for the A, 0.995 and B, 0.50 annual exceedance probability values (White and others, 2025). Positive values indicate velocity in the 2D model is greater than the 1D model. Negative values indicate the velocity in the 1D model is greater than the 2D model. Flow is from right to left. [AEP, annual exceedance probability]
Estimation of Bedload Transport Capacity
Understanding bedload transport conditions along the Siletz River can be used to determine where the channel may preferentially transport sediment or deposit sediment suitable for salmon and lamprey spawning habitats. Bedload transport capacities were calculated along the Siletz River between Moonshine Park and the City of Siletz (coinciding with the 1D hydraulic model made for this study; rkm 87.2–68.5; fig. 29A–B) using empirical bedload sediment transport equations to evaluate the longitudinal patterns in transport capacity. Stream segments where transport capacity rapidly decreases have a greater potential for sediment deposition, whereas segments with higher transport capacities have greater potential for entrainment and transport of bed-material sediment. Bedload transport capacities were estimated using a range of hydraulic outputs from the 1D model to evaluate transport capacity and sediment deposition patterns associated with discharge.
Empirical transport equations provide an estimate of bedload transport rates under idealized conditions of sediment supply (Gomez and Church, 1989), but unlimited bed-material sediment supply rarely occurs in natural river settings, and transport capacities often overestimate actual bedload transport rates. Even if actual bedload transport is a function of discharge, channel geometry, and bed-material particle sizes and not limited by bed-material supply, bedload transport is highly variable in time and space due to local conditions leading to substantial uncertainties (Wilcock and others, 2009). The equations used to estimate bedload transport rates are also very sensitive to small changes in inputs representing sediment and hydraulic conditions. Based on findings from analyses to meet Objective One (an evaluation of changes in channel position and bed elevations and longitudinal patterns in bed-material particle size along the Siletz River), it is likely that the mixed gravel and bedrock channel conditions along the Siletz River study area are indicative of limited supply and that estimated transport capacities will exceed actual transport. Actual transport into and through the study reach is impacted by local topographic and bed-texture complexity, which are not captured by this evaluation based on outputs from the 1D hydraulic model at cross sections. However, the transport capacities presented in this study provide an estimate of the relative spatial trends and capability of the Siletz River to transport bedload that can be used to inform restoration and management activities within the study area.
Bedload Transport Methods
Selected-Sediment Transport Equations
Bedload transport capacity along the Siletz River was evaluated with three bedload transport equations: (1) Parker (1990a, b), (2) Wilcock and Crowe (2003), and (3) Recking (2013). These models calculate bedload transport capacities utilizing information describing channel geometry, hydraulic and discharge parameters, and particle size distributions. The Parker (1990a, b) and Wilcock and Crowe (2003) equations use a distribution of surficial particle size to estimate size-specific transport rates and include “hiding” functions that capture the effects of small particles being protected among larger particles. A key difference between these two equations is that the Parker (1990a, b) equation truncates input particle size distributions to sizes less than 2 mm, under the assumption that sand predominantly travels in suspension, whereas the Wilcock and Crowe (2003) equation uses the full surface bed-material particle size distribution and critical shear stress decreases as the sand fraction increases. The Recking (2013) equation estimates reach-scale mean transport rates, calculating a dimensionless shear stress as a function of the 84th percentile particle size statistic, asserting that coarser material plays a dominant role in modulating bed shear stress, bed mobility, and armoring of supply of finer particles. These equations were selected because they have produced reasonable results for other Pacific Northwest gravel-bed rivers (Wallick and others, 2010, 2011; Anderson and others, 2017).
Implementation of Bedload Transport Equations and Inputs
Bedload transport capacities were calculated using the particle size data collected by the USGS and Confederated Tribes of Siletz Indians of Oregon in 2017–18 and hydraulic results from the 1D HEC-RAS model (fig. 33A–F; White and others, 2025) for the each of the sediment transport equations (Keith and Jones, 2025). Calculations using the Parker (1990a, b), Wilcock and Crowe (2003), and Recking (2013) equations were completed using scripts developed in the R statistical programming language (R Core Team, 2021) to compute bedload transport capacity at each cross-section location within the 1D hydraulic model created for this study, similar to approaches by Anderson and others (2017).
Particle Size
Surficial particle size data used in the Parker (1990a, b), Wilcock and Crowe (2003), and Recking (2013) bedload transport equations are from particle counts made along the Siletz River in 2017–18 (figs. 26–27A–J; tables 10–11; Jones and Keith, 2021). Co-location of particle counts with cross-sections in the HEC-RAS model were limited, requiring assignment of particle size distributions to some cross sections. Because the surficial bar-based bed-material particle counts showed considerable variability in particle sizes (D50 ranged from 18 to 144 mm; figs. 26–27A–F; tables 9–10), two particle size distributions were used as the sediment inputs for estimating bedload transport:
-
• Reach composited sediment input—All surficial particle-count distributions from the three gravel bar measurements within the Upper Sandstone reach (rkm 88.6–80.4) were composited and applied to cross sections upstream from the reach boundary at Rock Creek (rkm 80.4; fig. 40). Similarly, all surficial particle-count distributions from the eight gravel bar measurements within the Sam Creek reach (rkm 80.4–68.8) were composited and applied to cross sections downstream from Rock Creek. The absence of a clear longitudinal trend in particle size distributions indicates that composited particle size distributions should be approximately valid for assessing reach-scale patterns of bedload transport even when applied to cross sections several kilometers away from the measurement location.
-
• Fine and coarse composited sediment input—Surficial particle-count distributions from the 11 gravel bar measurements in the Sam Creek and Upper Sandstone reaches classified as either “fine” or “coarse” distributions (fig. 26) were composited according to their classification and applied to all 1D model cross-sections. By separately simulating bedload transport using the fine and coarse composited sediment inputs, the sensitivity of particle size on modeled transport capacity could be systematically evaluated (fig. 40). Modeling transport capacity for fine and coarse bars also helps identify the frequency with which some gravel bars may be mobilized under different discharge magnitudes.
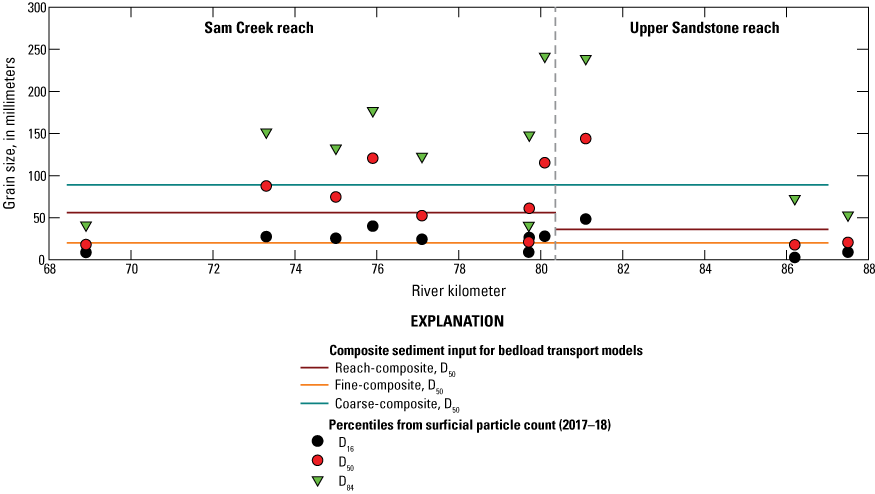
Reach, fine, and coarse composited D50 values compared against particle statistics for surficial bar particle size distributions collected along the Siletz River, western Oregon. Particle data are from Jones and Keith (2021). The lines indicating the composite sediment inputs for the bedload transport models encompass the modeling domain.
Hydraulic Parameters from One-Dimensional Hydraulic Modeling
Hydraulic parameter outputs from the 1D simulations for the eight distinct steady discharges (fig. 33A–F; table 14; White and others, 2025) were used as input to the bedload transport equations. Hydraulic parameters included hydraulic radius and energy slope (fig. 33E–F).
Development of Bedload Transport Rating Curves and Application to Specific Water Years
To support the study goal of evaluating bedload sediment transport dynamics over a broad range of discharge conditions and future climate, rating curves relating bedload transport capacity to discharge were developed for each cross-section. Interpolated transport capacity rates between calculated rates were applied to hydrographs, which allowed the calculation of integrated bedload transport capacity over multiple water years. Altogether, 9 bedload transport rating curves were developed for each of the 180 cross-sections in the 19-km model reach, using 3 transport equations (Parker, 1990a, b; Wilcock and Crowe, 2003; and Recking, 2013) and three particle size scenarios (reach-, fine-, and coarse-composited).
The bedload transport rating curves at each cross-section were applied to a suite of water year types to evaluate temporal and annual fluctuations in bedload transport caused by different hydrological conditions. The four water years used in the bedload transport simulations were WYs 1996, 2000, 2010, and 2018. WYs 1996 and 2000 represent relatively high magnitude discharge years, whereas WYs 2010 and 2018 represent relatively low magnitude discharge years. For each WY, we calculated the number of days discharge was exceeded the 0.995 and 0.5 AEPs for comparison.
-
• WY 2000 had some of the highest flows modeled in this study and includes the peak discharge event on record (1,523 m3/s [53,800 ft3/s] on November 26, 1999), which is estimated to about the 0.002 AEP. Flows exceeded the 0.995 and 0.5 AEPs for 10.3 and 1.3 days, respectively.
-
• WY 1996 also had numerous high flow events, but the peak event did not exceed the 0.02 AEP (as occurred in WY 2000). Flows in this year exceeded the 0.995 and 0.5 AEPs for 18.6 and 3.1 days, respectively, or more days than in WY 2000.
-
• WY 2010 was a relatively low-magnitude discharge year; no peak flow events exceeded the 0.5 AEP, and discharge only exceeded a 0.995 AEP for about 0.7 days throughout the year.
-
• WY 2018 was also a relatively low-magnitude discharge year and was modeled because it spanned the period in which pressure transducers were deployed from autumn 2017 to summer 2018 and captured all the moderate and high flows (and sediment transport events) during the water year. Peak discharge in WY 2018 was 736 m3/s (26,000 ft3/s), just lower than about a 0.2 AEP (table 2).
Recognizing that computed bedload transport is highly variable both spatially (even between adjacent cross-sections with similar morphology) and temporally (indicating even modest differences in discharge and associated hydraulics), bedload transport for each water year was summarized by taking the median bedload transport for all cross sections within each reach (Upper Sandstone and Sam Creek).
Bedload Transport Uncertainty and Limitations
Calculations of bedload transport are sensitive to the selected equation and input data (including particle size, channel gradient, depth, and discharge; Wilcock and others, 2009). Using multiple equations to calculate bedload transport results provides ranges of estimates that can be used to assess uncertainty. These equations have been applied to other gravel-bed rivers (Wilcock and others, 2009; Wallick and others, 2010; Anderson and others, 2017) with varying degrees of success. Particle size measurement error can include multiple sources (discussed in the “Uncertainty in Particle Size Measurements” section); modeling multiple reach averaged distributions (reach-average, fine, and coarse) likely encompasses the uncertainty resulting from measurements. Validation of the hydraulic model steady discharge simulations (discussed in the “Model Calibration and Verification” section for the 1D model) indicates that the model results are within 0.6 m (2 ft) of the 0.01 and 0.002 AEPs. In the absence of measurements of bedload transport to address uncertainty and identify the most appropriate equations and grain size distributions for the Siletz River, multiple equations and inputs (including various composited particle size distributions and steady discharge simulations) can be used to bracket a range of plausible transport capacities and identify longitudinal or discharge-based trends in transport capacity.
Bedload Transport Results
Calculated transport capacity rates are highly variable along the Siletz River between rkm 87.2 and 68.5. Calculated rates vary with bedload transport equation used, discharge magnitude, and input parameters (particle size and hydraulic model outputs; fig. 41A–C). Eight steady discharge simulations (table 14) were selected to span the range of historical discharge records and were carried through all transport capacity analyses. Results presented here focus on the 0.995, 0.50, 0.02, and 0.01 AEPs (fig. 41A–C), recalling that (1) AEP is the probability of the largest flood of the year being equal to or greater than a given value for any given year and (2) discharge increases as the AEP decreases.

Calculated bedload transport capacity rates (Keith and Jones, 2025) for a range of moderate to high discharges for three transport equations (A, Parker, 1990a, b; B, Wilcock and Crowe, 2003; C, Recking, 2013) along the Siletz River, western Oregon, using particle count data composited by study reaches. The areas highlighted in gray are described in more detail in the text.
Modeled Bedload Transport Capacity Patterns Related to Selected Equation, Discharge, and Particle Size
Comparison of calculated transport capacity rates indicates similarities and differences in the way that each equation calculates bedload transport capacity. In general, the Parker (1990a, b) and Wilcock and Crowe (2003) equations produced similar magnitude peaks in transport capacity at higher flows, though the Wilcock and Crowe (2003) relation tended to predict greater transport for low discharges (fig. 41A–C). The greater rates for Wilcock and Crowe (2003) at low discharges are likely due to the equation’s incorporation of sand (particles smaller than 2 mm). The Recking (2013) equation typically produced smaller magnitude transport capacity rates where all three equations produced the greatest rates, but similar magnitude rates where all three equations produced very low rates. In the absence of actual bedload measurements, evaluation of which, if any, bedload transport equation best represents sediment transport along the Siletz River could not be done. On sediment-rich rivers in the Pacific Northwest, where bedload was measured and multiple transport equations were used to model bedload transport capacity (for example, the Chetco River [Wallick and others, 2010] or the North Fork Stillaguamish River [Anderson and others, 2017]), some equations tended to outperform others but varied by location. Findings for the Chetco and North Fork Stillaguamish Rivers may or may not be applicable for the Siletz River, particularly because of the different geomorphic character of the mixed bed Siletz River compared to more sediment-rich rivers.
Of all 72 simulations representing different equations, particle size, and flow conditions that were applied to 180 cross sections, the 2 greatest calculated transport capacity rates were produced in the Upper Sandstone reach using the Parker (1990a, b) equation and fine-composite sediment input. The maximum calculated transport capacity rate (7,221 kg/s at the 0.002 AEP) was at rkm 82.85 in a relatively narrow (about 50 m) bedrock section (fig. 41A–C). Transport capacity rates are generally low to zero for all transport equations below a 0.995 AEP and less than 1 kg/s for nearly all equations and modeled discharges up to the 0.002 AEP.
For larger AEPs, increasing values of transport capacity rates typically correspond to increases in discharge (fig. 41A–C; table 17). For example, the reach-median transport capacity rates (using reach-composited sediment input data) in the Upper Sandstone reach at the 0.001 AEP is approximately 1.1–1.3 times greater than at the 0.02 AEP and 2.0–4.2 times greater than at the 0.5 AEP. Similarly, in the Sam Creek reach, the reach-median transport capacity rate at the 0.001 AEP is approximate 1.2–1.3 and 2.2–3.0 times the 0.02 and 0.5 AEPs, respectively.
Table 17.
Median transport capacity rates calculated for the Upper Sandstone and Sam Creek reaches along the Siletz River, western Oregon (Keith and Jones, 2025).[Abbreviations: AEP, annual exceedance probability; kg/s, kilograms per second]
| Composited sediment input |
Equation | Calculated median transport capacity rate by AEP, in kg/s | |||||
|---|---|---|---|---|---|---|---|
| 0.995 | 0.5 | 0.1 | 0.02 | 0.001 | 0.002 | ||
| Reach | Parker (1990a, b) | 1.5 | 18 | 33 | 61 | 78 | 110 |
| Wilcock and Crowe (2003) | 10 | 130 | 180 | 260 | 290 | 360 | |
| Recking (2013) | 5.7 | 48 | 65 | 85 | 96 | 120 | |
| Fine | Parker (1990a, b) | 0 | 5.5 | 11 | 21 | 26 | 41 |
| Wilcock and Crowe (2003) | 0.1 | 10 | 19 | 34 | 42 | 60 | |
| Recking (2013) | 0.2 | 11 | 20 | 37 | 44 | 60 | |
| Coarse | Parker (1990a, b) | 19 | 310 | 440 | 630 | 710 | 880 |
| Wilcock and Crowe (2003) | 38 | 290 | 390 | 510 | 570 | 690 | |
| Recking (2013) | 23 | 140 | 190 | 250 | 280 | 340 | |
| Reach | Parker (1990a, b) | 0 | 9 | 12 | 21 | 27 | 39 |
| Wilcock and Crowe (2003) | 0.2 | 18 | 23 | 39 | 49 | 70 | |
| Recking (2013) | 0.8 | 23 | 31 | 44 | 51 | 66 | |
| Fine | Parker (1990a, b) | 0 | 1.2 | 2.3 | 5.9 | 8.3 | 13 |
| Wilcock and Crowe (2003) | 0 | 3.2 | 4.9 | 11 | 15 | 22 | |
| Recking (2013) | 0.1 | 4.8 | 7.5 | 15 | 20 | 29 | |
| Coarse | Parker (1990a, b) | 9 | 180 | 230 | 320 | 380 | 490 |
| Wilcock and Crowe (2003) | 22 | 190 | 240 | 310 | 340 | 430 | |
| Recking (2013) | 15 | 95 | 120 | 150 | 170 | 210 | |
As expected, varying sediment input distributions resulted in considerable variation in calculated transport capacity rates. Calculations using the fine-composite sediment input (representing the texture of fine-grained bars) generally had greater transport capacity rates, sometimes by an order of magnitude or more, relative to the reach-composite sediment input, whereas calculations using the coarse-composite sediment input generally had lower rates (fig. 41A–C; table 17).
Longitudinal Patterns in Modeled Bedload Transport Capacity
Modeling bedload transport capacity at multiple cross sections along the Siletz River is used for describing longitudinal patterns and identifying locations along the river corridor or entire river reaches with relatively high or low bedload transport conditions. Several locations of relatively high and low modeled transport capacity rates (gray areas indicated on fig. 41A–C) are summarized here (using the reach-composite sediment inputs unless otherwise noted). As described above, bedload transport capacity rates have a high degree of uncertainty, and thus multiple equations and inputs were used to bracket a range of plausible transport capacities and identify longitudinal or streamflow-based trends in transport capacity.
Upper Sandstone Reach
The cross section at rkm 86.1 along the Downstream Moonshine bar is one of the few locations along the entire study reach where the transport capacity rate is greater at moderate AEPs than rates at the largest modeled AEP (fig. 41A–C). Peak transport rates (2,494 kg/s for Parker, 1990a, b; 3,136 kg/s for Wilcock and Crowe, 2003; and 1,021 kg/s for Recking, 2013) for the 0.02 AEP is 1.5–1.7 times those calculated for the 0.01 AEP and 2.4–3.7 times those calculated for 0.002 AEP. At this cross section, the hydraulic radius was relatively low and the energy slope is relatively high compared with other cross sections in this reach (fig. 33E–F).
The next cross section downstream at rkm 86.0 (below the Downstream Moonshine bar and upstream from a more confined bedrock segment) produced very low transport across all discharge simulations, equations, and particle size inputs (fig. 41A–C). For example, at the 0.002 AEP, the maximum calculated transports rate (76 kg/s) was produced with Wilcock and Crowe (2003) and fine-composite sediment input. At this site, relatively high modeled hydraulic radii related to the deeper, narrow cross section, and relatively low energy slopes (particularly compared to the upstream cross section) likely contributed to lower overall modeled transport capacity.
Between rkm 84.2–82.7, the Siletz River enters a narrow, bedrock dominated segment where calculated transport rates fluctuated considerably (fig. 41A–C). Anomalously low transport capacity rates were calculated for the cross section at rkm 83.65 upstream from a small island gravel bar (maximum rate of 108 kg/s at 0.002 AEP was produced with Wilcock and Crowe [2003] equation and fine-composite sediment input). These anomalous rates are likely related to increasing hydraulic radii with increasing discharge and relatively small energy slopes. Here, a maximum transport rate of 108 kg/s was calculated for the fine-composite sediment distribution with the Wilcock and Crowe (2003) equation, and 3 kg/s was calculated for coarse-composite sediment distribution with the Recking (2013) equation. Transport capacity rates at rkm 82.85 are the highest calculated along the Siletz River for large floods (0.01 and 0.002 AEPs). This location has a relatively narrow channel that is similar to adjacent cross sections in this bedrock segment of the river, and high transport rates here may relate to relatively high energy slopes modeled with the 1D hydraulic model. A peak in transport capacity rates at rkm 81.25 was likely associated with increased discharge inputs from Mill Creek.
Sam Creek Reach
From the Siletz River confluence with Rock Creek (rkm 80.4) to downstream past the Rock Creek bar (rkm 80.2–80.0), calculated transport capacity rates were generally high likely due to increased tributary discharge (fig. 41A–C). For the cross section at rkm 80.15, all models produce non-zero transport rates, including coarse-composite sediment inputs at 25 percent of the 0.995 AEP. This peak also represented a location where maximum rates were produced at the 0.02 AEP and decreased for the 0.01 and 0.002 AEPs (although the magnitude of transport capacity rates for those three discharge simulations was not that different). The maximum calculated transport capacity at this cross section for the 0.02 AEP was 6,190 kg/s (Parker 1990a, b equations; fine-composite sediment input). High transport capacity rates calculated at this cross section coincided with locations of locally high energy slopes output from the 1D hydraulic model (fig. 33F).
From rkm 80.0 to 76.8, spanning the Neighborhood and Mid-channel bars, calculated transport capacity rates above a 0.5 AEP were relatively low in this dominantly alluvial segment relative to peaks upstream and downstream in bedrock dominated segments (fig. 41A–C).
At rkm 76.45, calculated transport capacities peak at a cross section in a particularly narrow bedrock segment that was further restricted by a bedrock shelf at low discharge (mapped and visible in photographs) between rkm 76.8 and rkm 76.1 at Twin Bridges (fig. 41A–C).
The alluvial segment of the Sam Creek reach that spans the Twin Bridges bar downstream from Twin Bridges (about rkm 76.0–75.5) had relatively low transport capacities relative to other segments within the reach (fig. 41A–C). The modeled transport capacities for the 0.995 AEP at rkm 75.95 near the upstream end of the Twin Bridges bar, exceeded modeled transport capacities for higher discharge simulations (all equations and sediment inputs) and could result from cross-section averaged 1D hydraulic model results related to the shift from channelized flow at the 0.995 AEP to water spreading across the bar at higher discharges.
A low-to-no transport segment in the calculated transport capacities at rkm 73.15–73.1 coincides with some of the largest hydraulic radii values (greater than 9 m at the 0.002 AEP) output from the 1D hydraulic model (figs. 33E, 41A–C). This location also coincides with a large pool downstream from the Klamath Grade bar.
Relatively low transport capacity rates at rkm 70.05–70.0 and 68.95 (54 kg/s and 41 kg/s, respectively, or less for all equations and sediment inputs at 0.002 AEP) are near the up- and downstream ends of an alluvial segment encompassing the Windchime bar (fig. 41A–C). The upstream low point coincided with a deeper, wider location at the upstream end of Windchime bar. The downstream low point was located upstream from the Siletz boat ramp at a slightly wider location relative to the next downstream cross section (wider by about 6–16 m). Both low points were at cross sections with locally high and low modeled hydraulic radii and energy slopes (respectively) from the 1D hydraulic model. A peak in transport capacity rates at rkm 68.5 was collocated with the Town Bridge and likely resulted from the local constriction and hydraulics imposed by the bridge.
Modeled Annual Bedload Transport Capacities for Water Years 1996, 2000, 2010, and 2018
The bedload transport rating curves were used to calculate annual bedload transport capacity (or “annual bedload transport”), which is an estimate of total mass of bedload sediment that may have been carried by the river in a particular water year scenario under conditions of unlimited coarse sediment supply. Annual bedload transport for the entire modeled area for the Upper Sandstone and Sam Creek reaches was evaluated for four water years (WYs 1996, 2000, 2010, and 2018). The annual bedload transport computed by the Parker (1990a, b) equation and reach-composite sediment inputs ranged from <0.001 to 3,140 thousand metric tons (kt) across all cross-sections within the study area and the four water year scenarios (fig. 42A–C). Median annual transport values across all cross sections were considerably lower (15, 12, 1, and 3 kt for WYs 1996, 2000, 2010 and 2018, respectively; table 18).
To better characterize the range of potential annual transport rates, annual transport rates were also computed for: (1) a high-discharge scenario represented by WY 2000 using reach-composite sediment inputs and the three transport equations (fig. 42B), (2) a low-discharge scenario represented by WY 2010 using reach-composite sediment inputs and the three transport equations (fig. 42C), and (3) for both years using the Parker (1990a, b) equation but using either the fine- or coarse-composite sediment inputs (figs. 42B–C). Compared to the Parker (1990a, b) equation, the Wilcock and Crowe (2003) and Recking (2013) equations produced greater reach-median transport capacities. For WY 2000, reach-median transport capacities computed with the Wilcock and Crowe (2003; 43 kt) and Recking (2013; 24 kt) equations were 3.7 and 2.0 times greater (respectively) than those computed with the Parker (1990a, b; 12 kt) equation (fig. 42B; table 18). For WY 2010, reach-median transport capacities computed with the Wilcock and Crowe (2003; 3 kt) and Recking (2013; 5 kt) equations were 4.0 and 5.8 times greater (respectively) than those computed with the Parker (1990a, b; 1 kt) equation (fig. 42C; table 18).
Even greater changes in annual bedload transport values were observed when varying input particle sizes with the Parker (1990a, b) equation. For both WYs, using the fine-composite sediment input increased the reach-median annual transport capacity, whereas using the coarse-composite sediment input decreased reach-median annual transport capacity (figs. 42B–C). Compared to the values computed using the reach-composite sediment input (fig. 42B–C), reach-median annual transport increased from 12 to 166 kt in WY 2000 and 1 to 21 kt in WY 2010 using the fine-composite input (table 18). Reach-median annual transport decreased from 12 to 3 kt in WY 2000 and 1 to negligible transport in WY 2010 using the coarse-composite input (table 18).
Comparing the modeled median annual transport rates for the Upper Sandstone and Sam Creek reaches reveals that the Upper Sandstone reach may have transport capacities that are about 2–4 times greater than those calculated for the Sam Creek reach (table 18). For water years with relatively high discharges (1996 and 2000), median annual transport capacities ranged from about 19–22 kt in the Upper Sandstone reach and 6–7 kt in the Sam Creek reach (table 18). Conversely, in water years with relatively lower flows (2010 and 2018), median annual transport capacities for both reaches ranged from 0 to 4 kt (table 18).
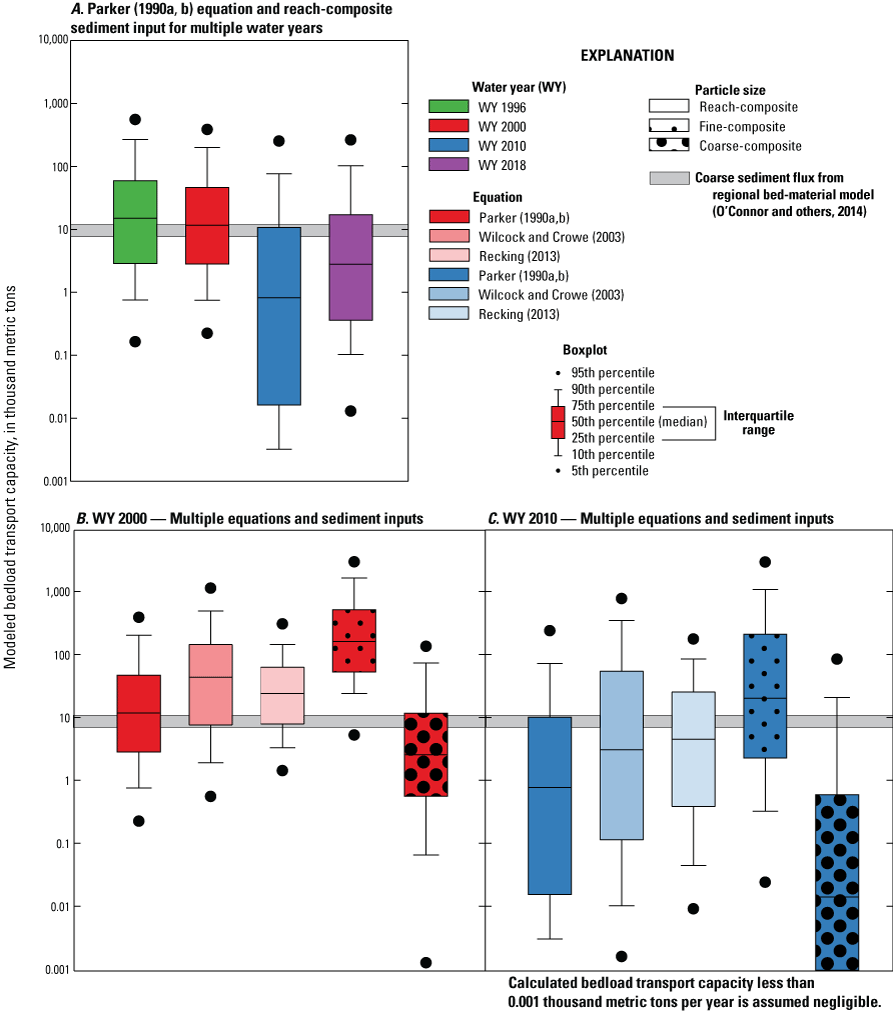
Box and whisker plots showing the range of transport capacities calculated by Keith and Jones (2025) for 180 cross sections along the Siletz River, western Oregon. Plot A, shows results for water years 1996, 2000, 2010, and 2018 using the Parker (1990a, b) equation with reach-composited particle sizes used in the model. Plots B, water year 2000; and C, water year 2010, show results using the Parker (1990a, b), Wilcock and Crowe (2003), and Recking (2013) equations using reach-composited particle size and the Parker (1990a, b) equation using fine- and coarse composited particle sizes used in the model. A range of coarse sediment flux (8–11 thousand metric tons; indicated by the gray bars) from a regional bed-material model (O’Connor and others, 2014) is plotted for comparison.
Table 18.
Median bedload transport capacities for the Upper Sandstone reach (rkm 87.2–80.4) and the Sam Creek reach (rkm 80.4–68.5) calculated by Keith and Jones (2025) with the Parker (1990a, b), Wilcock and Crowe (2003), and Recking (2013) equations and a variety of sediment inputs (reach-, fine-, and coarse-composite sediment inputs) for relatively high- (1996 and 2000) and low- discharges (2010 and 2018) water years along the Siletz River, western Oregon.[Transport capacity is negligible for rates of <0.001. Values in thousands of metric tons. Water year extends from October 1 through September 30 and is named for the year in which the period ends.]
Inspection of discharge hydrographs for the four water year scenarios and their associated patterns of daily and cumulative bedload transport reveal the linkages between the magnitude, duration, and frequency of discharge events capable of transporting bed-material sediment and the cumulative impact of these events when considering total bedload transport each year. The following results focus on reach-median transport capacity computed using the Parker (1990a, b) equations and reach-composite sediment input.
-
• The WY 1996 was a relatively high-discharge year with relatively high modeled median bedload transport capacity (table 18). Multiple events exceeding the 0.995 AEP were recorded at USGS streamgage 1430550 (Siletz River, at Siletz, OR) in WY 1996 and occurred between November and April (fig. 43A). Additionally, discharges exceeded the 0.5 and 0.01 AEPs in November-December and February, respectively. During WY 1996, increases in modeled transport capacity for the Upper Sandstone reach with the reach-composite sediment input and both reaches with fine-composite sediment input begin accumulating during a relatively small discharge event in October, whereas the Sam Creek reach with the reach-composite sediment input and both reaches with coarse-composite sediment input begin accumulating during a peak discharge event exceeding the 0.995 AEP in November. Substantial increases in modeled bedload transport throughout the water year for all reach and sediment input combinations coincide with greater discharge and longer periods at higher discharges.
-
• The WY 2000 was also a relatively high-discharge year with the peak of record in November, which is around the 0.002 AEP (fig. 43B). However, the second greatest discharge event during this water year peaked near the 0.5 AEP in December. Four additional events exceeding the 0.995 AEP occurred in November, January, February, and June. During this water year, modeled bedload transport capacity begins increasing during an early November event and increases notably during the peak of record for all simulations.
-
• Discharge in WY 2010 was relatively low compared with other modeled years; only one event in January exceeded the 0.995 AEP (fig. 43C). Although all reach and sediment input combinations show some increases in modeled bedload transport throughout the year, only the fine-composite sediment inputs and Upper Sandstone reach with the reach-composite simulations ended the water year with modeled median annual bedload transport exceeding 1 kt.
-
• The WY 2018 was also a relatively low-discharge period with the peak event exceeding the 0.5 AEP (October) and a few smaller events exceeding the 0.995 AEP between November and April (fig. 43D). These peaks result in modeled median annual bedload transport that was about twice that for WY 2010.
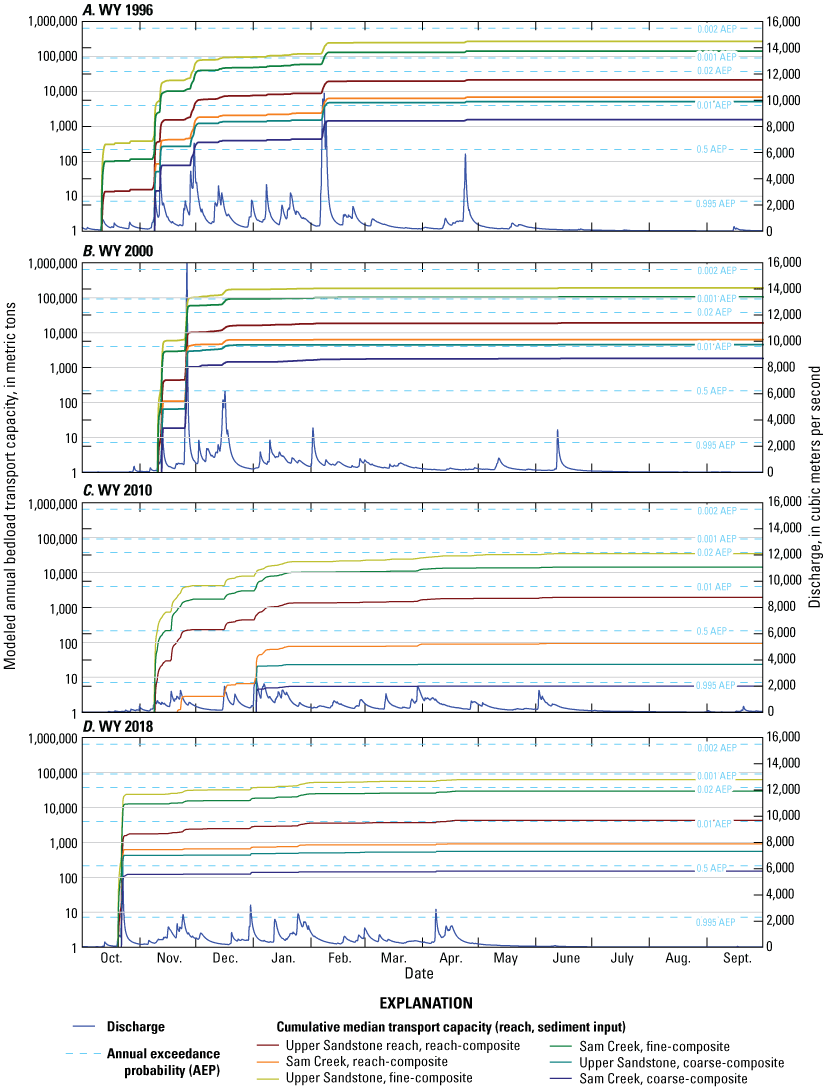
Cumulative modeled median annual bedload calculated by Keith and Jones (2025) with the Parker (1990a, b) equation for relatively high- (A, 1996 and B, 2000) and low-discharge (C, 2010 and D, 2018) water years along the Siletz River, western Oregon. Modeled median annual bedload transport are shown for the Upper Sandstone reach (river kilometer [rkm] 87.2–80.4) and the Sam Creek reach (rkm 80.4–68.5), with a variety of sediment inputs (reach-, fine-, and coarse-composite particle size distributions). [WY, water year]
Bedload Transport Discussion
The Siletz River is a mixed bed river with exposed bedrock and alluvium making up the channel bed. Bedload transport modeling was used to identify locations where the deposition of gravel supplied from upstream sources would most likely occur and evaluate the integrated transport capacity across select high- and low-discharge water years to evaluate the range of coarse sediment that may be transported along the Siletz River between rkm 87.2 and 68.5. Areas of low transport capacity could preferentially deposit sediment that may be important for salmon or lamprey spawning. Understanding the range of likely transport over different water years and discharge events can provide insights as to how future changes in discharge may impact bedload transport. Multiple transport equations, discharge simulations, and input particle sizes were selected to evaluate the range of predicted transport capacities.
In general, these results indicate that bedload transport between Moonshine Park and the City of Siletz is minimal for discharges at or less than the 0.995 AEP (fig. 41A–C). As discharge increases from the 0.995 to 0.5 AEP, transport capacity and sediment transport increase (table 17). Additionally, cobble and smaller particle sizes (less than 64 mm) are likely mobilizing at the 0.5 AEP, whereas coarser particle sizes require larger floods for transport and are mobilizing less frequently. Additionally, single high-magnitude events (as recorded in WY 2000) can transport substantial amounts of bed-material sediment; however, cumulative annual sediment transport can be greater in years with multiple events (as recorded in WY 1996; fig. 43A–B).
Overall longitudinal trends in bedload transport capacity rates showed substantial spatial variability among cross sections. Although relative differences in computed bedload transport capacity between adjacent cross sections (fig. 41A–C) may not be representative of actual bedload transport, some of the local variability aligns with observed channel morphology, hydraulics, and bed-material particle sizes. Sections with locally high transport capacity rates tended to coincide with areas of extensive in-channel bedrock or coarse bars, which both indicate that typical transport capacities are sufficiently great to preclude the deposition of sands to gravel-sized clasts or at locations downstream from tributary inflows that increase discharge in the Siletz River (for example, Miller and Rock Creeks). Conversely, some cross sections with relatively low transport capacity rates occurred near locations where relatively finer particle measurements were measured (for example, Windchime bar), indicating that lower transport capacity in these areas enables smaller gravel particles to deposit.
Uncertainties in the bedload transport capacity estimates are likely large. Although not explicitly quantified for this study, approximate ranges of uncertainty can be inferred from comparing transport capacity model runs. The change in integrated transport capacities for WY 2000 at sequential cross sections provides a generalized estimate of uncertainty and is typically (75 percent of cross-sections) about a factor of five, although locations where very low and high transport values were modeled at adjacent cross sections can have much higher uncertainties. Annual loads would not actually vary much over distances of several hundred meters. As a result, the variability among cross sections provides a rough estimate of the uncertainty due to variation in local hydraulics, and therefore transport capacity, along the study reach. Median loads calculated for the Upper Sandstone and Sam Creek reaches generally should be representative of reach-scale bedload transport conditions compared to using results for a single location.
Modeled median annual bedload transport applied to water years suggest that the magnitude of that transport depends on sediment inputs and whether discharges were relatively low or high. Overall annual bedload transport is relatively low for the reach- and coarse-composite sediment inputs, particularly for low-flow water years (reach-based median transport capacity ranges from 0 to 22 kt; table 18). Modeling the fine-composite sediment input produces greater magnitudes of modeled median annual bedload transport, particularly for high-discharge years (reach-based median transport capacity ranges from 14 to 278 kt). Normalized by total basin area (970 m2), the range of median annual bedload transport ranges from about 14 to 287 tons/km2 for the four modeled water years.
The Siletz River median annual bedload transport values are similar to values for the Chetco River (Wallick and others, 2010) and less than values for the Umpqua River (Wallick and others, 2011). Wallick and others (2010) calculated mean annual transport at seven sites along the Chetco River that ranged from about 8 to 217 kt (WYs 1971–2008; converted from volumes reported in Wallick and others [2010] using a bulk density of 2.1 kg/m3). Normalized by area (914 km2), these values for the Chetco River translate to about 9–237 tons/km2, which is still similar to the Siletz values normalized by basin area. Wallick and others (2011) calculated mean annual transport capacity along the south and main-stem Umpqua Rivers that ranged from 0 to 623 kt for 42 sites (WYs 1951–2008). Normalizing these mean annual transport capacities by basin area (12,103 km2) results in smaller values of 0–51 tons/km2 than for the Siletz River.
Regional bed-material models created for western Oregon (O’Connor and others, 2014), provide an indication of mean annual sediment supply which can be compared with the bedload transport capacities modeled for this study. The model of O’Connor and others (2014) indicates that the long-term, average annual volume of coarse sediment entering the Siletz River within the modeled reaches ranges from about 8 to 11 kt and generally decreases in the downstream direction. Decreasing sediment flux modeled along the Siletz River suggests particle attrition (or sediment particles breaking down into finer sized particles during fluvial transport) and conversion to suspended sediment exceeds the input of coarser bedload sediment gravel supplied by tributaries, which is characteristic of Coast Range sedimentary rocks (O’Connor and others, 2014). Although sediment supply fluctuates annually, we can compare these values to modeled transport capacity for this study during high- and low-discharge years to roughly evaluate relative magnitudes of supply and transport (fig. 42A–C). In a low-discharge water year (such as WY 2010), median annual transport capacity with reach-composited sediment inputs is about 0–2 kt (table 18), which when coupled with mean annual bed-material sediment supply of about 10 kt, would likely result in some deposition. Conversely, a high-discharge water year (such as WY 2000), may produce reach median annual transport capacity of 6–19 kt (with reach-composited sediment inputs; table 18), which when coupled with 10 kt of bed-material sediment supply, would likely transport most incoming sediment downstream.
Potential Burrowing Habitat for Lamprey Larvae
Pacific lamprey occurs in coastal and inland streams from California north to Alaska (Clemens and Wang, 2021). Larvae of Pacific lamprey burrow in fine sand deposits for about 3–7 years prior to transforming into eyed juveniles (Dawson and others, 2015). Fine sand deposits form in and along gravel-bed river channels where transport capacity is too low to carry these particles. Identifying locations along river networks likely to support burrowing habitat for lamprey larvae is relevant for understanding the current and potential distributions of lampreys and supporting lamprey conservation by the Confederated Tribes of Siletz Indians of Oregon and their partners.
Potential Burrowing Habitat Analysis Methods
Unlike the other parts of this study that focused solely on the main-stem Siletz River, potential burrowing habitat (PBH) was assessed at the scale of the Siletz River Basin. Findings from the basin-scale PBH analysis provide insights into reach-scale factors influencing PBH along the main-stem Siletz River from Moonshine Park to the City of Siletz (rkm 87.2–68.5) along with results from other study components. PBH in the Siletz River Basin was identified using methods developed for the Umpqua River Basin on the Oregon coast by Jones and others (2020). They derived PBH criteria by comparing observations of lamprey larvae presence against regional estimates of mean annual suspended sediment loads (Wise and O’Connor, 2016) and channel gradient from 30-m digital elevation models (DEMs; National Hydrography Dataset [NHD] Plus, Version 2, Horizon Systems Corporation, 2013). The PBH criteria (estimated mean annual suspended sediment loads greater than or equal to 730,000 kg/yr and channel gradient less than or equal to 0.025) were applied to the 434 NHD segments making up the Siletz River network to identify PBH.
Potential Burrowing Habitat Analysis Limitations
The PBH assessment has three main sources of uncertainty—the estimates of mean annual suspended sediment loads, channel gradient derived from 30-m DEMs, and limited dataset of lamprey larvae detections (n=63) from the Umpqua River Basin used to develop the PBH criteria; of these three factors, estimates of mean annual suspended sediment loads likely introduce the most uncertainty (Jones and others, 2020). The assumption that larval lamprey distributions are similar in both basins also introduces some unknown level of uncertainty into this analysis. In addition to suspended sediment loads and channel gradient, other physical and biological factors constrain the potential burrowing habitat used by anadromous Pacific lamprey larvae. Examples include passage barriers, reach-scale factors that influence fine sediment deposition, the proximity of adult over-wintering and spawning habitats to lamprey larvae burrowing habitat. Such factors were not considered in this analysis.
Potential Burrowing Habitat Analysis Results and Discussion
The proportion of PBH identified using the criteria for mean annual suspended sediment loads and channel gradient was 28 percent for the Siletz River Basin (fig. 44). Reaches meeting the PBH criteria in the Siletz River Basin included the main channel of the Siletz River, North Fork Siletz River up to Warnicke Creek, and South Fork Siletz River up to McFall Creek and lower sections of Drift, Cedar, and Rock Creeks.
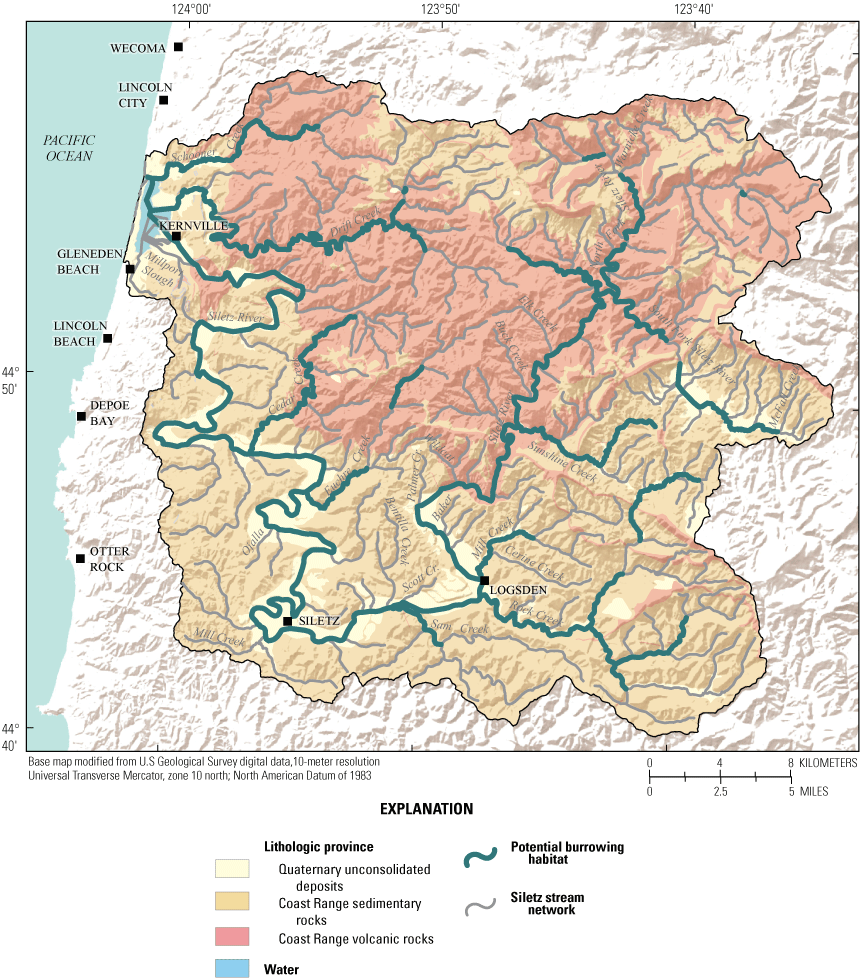
Potential burrowing habitat for lamprey larvae identified along the Siletz River network using methods from Jones and others (2020).
PBH was identified along the Siletz River from the confluence of the North and South Forks Siletz Rivers to its mouth (fig. 44). More PBH was identified along the Siletz River network (28 percent) compared to the Umpqua River network (18 percent) where these criteria were developed (Jones and others, 2020). The higher percentage of the river network with PBH in the Siletz River Basin can be attributed to geology and basin slope. The Siletz River Basin has a greater proportion of Coast Range sedimentary rocks, which generally produces relatively greater amounts of suspended sediment, (Wise and O’Connor, 2016). The Coast Range sedimentary rocks also produce less steep terrain compared to the Umpqua River Basin which contributes to increased retention of sand (and finer) sediment that could support PBH in the Siletz River Basin.
Based on streambed sediment field observation and mapping of bedrock along this mixed bed river, this analysis over-estimates the amount of PBH along the main-stem Siletz River. We expect that PBH occurs relatively intermittently along the Siletz River and is present largely in the sections where the channel widens and flows over alluvium and absent where the channel narrows and flows over bedrock or streambed sediment are too coarse to support larvae burrowing. For example, PBH is expected to be present in the relatively wider channel sections near the Moonshine (fig. 17), Downstream Moonshine, and Windchime bars (fig. 23) that were relatively finer compared to other bars (figs. 26–27). In contrast, PBH is not expected in the narrow, bedrock dominated reaches, such as near the Logsden and Rock Creek bars (figs. 19–20) that are relatively coarser (figs. 26–27). Other site-scale factors (such as large wood, eddies downstream from some gravel bars, and the secondary water features) are expected to also influence the availability of PBH. Further evaluation of the PBH could be supported with higher resolution DEMs, sediment supply modeling, detailed continuous maps of channel substrates and grain size, targeted larval lamprey sampling to confirm the presence of larval lamprey, development of additional habitat suitability criteria, and more detailed exploration of the 1D and 2D hydraulic model outputs (which was outside the scope of this study).
Discussion
Streams within the Siletz River Basin, Oregon, support spawning and rearing habitat for Chinook salmon (Oncorhynchus tshawytscha) and Pacific lamprey (Entosphenus tridentatus). The Confederated Tribes of Siletz Indians of Oregon implement habitat conservation and restoration projects to sustain these culturally significant fish species now and into the future. To support these conservation and restoration efforts, Confederated Tribes of Siletz Indians of Oregon would like to better understand and incorporate the effects of climate change, such as the projected moderate increases in autumn and winter discharge and reduced spring and summer discharge for the Siletz River (for 2041–70; Leibowitz and others, 2014), into future management plans that may affect hydrogeomorphic processes shaping salmon and lamprey habitat in the coming decades. Fully assessing the effects of climate change on salmon and lamprey habitats in the Siletz River is not currently possible due to the limited understanding of changes in discharge and sediment generation processes that may occur in the future. Therefore, this study was developed to characterize historical and present-day processes and conditions of the Siletz River, thereby forming the necessary foundation that can be coupled with future monitoring (appendix 1) to explore and document changes resulting from future hydro-climatic conditions. This study (1) draws upon multiple independent field-based, remote mapping, and modeling analyses to describe the hydrogeomorphic processes shaping channel morphology, bed-material sediment, hydraulics, and coarse sediment transport along the 97.2-kilometer (km) long study reach of the Siletz River from Elk Creek to Millport Slough and (2) evaluates potential burrowing habitat (PBH) across the entire basin (fig. 1; table 4). Five key findings from this study are outlined below.
-
1. The Siletz River from Elk Creek to Millport Slough (river kilometer [rkm] 104.3–7.1) is a semi-alluvial river. Bedrock outcrops in and along the Siletz River (figs. 6C, 41A–C) were found where bedload transport capacity increases, resulting in sediment transport and limited PBH for lamprey larvae. Gravel bars largely occur at meander bends, slightly wider channel locations, or downstream from tributary confluences where bedload transport declines and hydraulic conditions support some sediment deposition within the active channel. Of the six geomorphic reaches (table 4), the steep Upper (rkm 104.3–97.9) and Lower Canyon (rkm 97.9–88.6) reaches had the largest area of mapped bedrock (fig. 6C). The Lower Canyon reach had the second largest unit bar area (table 6), with bars flanking the channel primarily downstream from Sunshine Creek. Downstream, as the gradient declined and the active channel widened slightly, gravel bars occurred intermittently but more frequently in the Upper Sandstone, Sam Creek, Mill Creek reaches and in the upstream portion of the Tidal reach (fig. 6B; table 6). Gravel bar texture tended to be relatively coarse upstream from the City of Siletz in the Upper Sandstone and Sam Creek reaches (fig. 28), coinciding with steeper gradient channels in the Coast Range volcanic rocks lithologic province. Downstream from the City of Siletz, particle distributions were relatively finer in the Mill Creek reach (fig. 28) as channel gradient declined and the contributing basin area is mostly within the Coast Range sedimentary rocks lithologic province.
-
2. The semi-alluvial morphology of the Siletz River study reach has contributed to limited lateral and vertical changes since the 1930s. Channel confinement by alluvial and terrace deposits and bedrock outcrops have limited lateral migration along much of the 97.2-km long study reach between 1936 and 2016 (fig. 6C). Additionally, bedrock along the channel bed has limited vertical channel adjustments historically and today throughout the study reach, and will limit the potential for widespread channel incision in the future. Specific gage analyses showed that the channel bed near the City of Siletz has undergone only modest vertical adjustments since 1938 (figs. 24–25). Splash dams and log drives along the Siletz River occurred prior to this study's analysis period (Miller, 2010) and associated effects (such as increasing the frequency and magnitude of peak floods; Phelps, 2011) on channel form and legacy effects were not considered for this study. With its inherently stable and confined planform and numerous in-channel bedrock outcrops, the Siletz River is expected to have less pronounced changes in response to large discharge events and sediment inputs compared to fully alluvial gravel-bed rivers on the Oregon coast, such as the Chetco River (Wallick and others, 2010), sections of the Rogue River and tributaries (Jones and others, 2012a), and Hunter Creek (Jones and others, 2011).
-
3. Terrace and alluvial deposits confine events up to the 0.002 annual exceedance probability (AEP). The Siletz River is confined by terrace and more recent alluvial deposits and has an average active channel width ranging from 30 to 60 m (table 4) within the one-dimensional (1D) hydraulic modeling reach. Hydraulic modeling results along the Upper Sandstone and Sam Creek reaches show that gravel bars and the limited flanking floodplain areas are mostly inundated at discharges greater than the 0.5 AEP and that there is little lateral expansion of inundation with increasing discharge up to the 0.002 AEP due to confinement by channel-flanking terraces (fig. 34B). Given its confined nature, the Siletz River tends to get deeper (fig. 34C) and faster between 0.5 and 0.002 AEPs (fig. 34D).
-
4. Bedload transport capacity on the Siletz River likely exceeds the available supply of coarse sediment (sands, gravels, cobbles) that enter the river from upstream reaches and tributaries and local bank and bed sources. Multiple independent analyses in this study show that the transport capacity likely exceeds sediment supply. The relatively high abundance of bedrock within the Siletz River channel (fig. 6C) and coarse, armored gravel bars (figs. 27–28A–J; table 11) suggest that the transport capacity of bed-material is relatively high compared to the supply of coarse sediment. Estimated long-term average annual flux to the Siletz bed-material modeling reaches from regional models is about 8–11 kt (O’Connor and others, 2014). Estimates of annual bedload transport capacity for relatively high- and low-discharge water years suggest the Siletz River may be able to transport that amount of sediment in wetter years (such as WY 1996 and 2000) but support some deposition in lower discharge years (such as WY 2010 and 2018; fig. 43A–D; table 18). Despite interannual variability in bedload transport capacity, conditions of excess transport capacity relative to bed-material sediment supply likely help maintain the semi-alluvial character of the Siletz River.
Together, the historical lateral and vertical stability of the Siletz River and sediment transport conditions suggest that likelihood of substantial changes in the vertical or lateral channel position is low, especially in areas underlain or flanked by bedrock. However, sections where the Siletz River flows over alluvium could be more sensitive to future lateral and vertical channel adjustments. Most of the Siletz River corridor is expected to remain relatively stable in terms of its channel position and bed elevations over time, barring extreme changes in inputs of water and sediment. Major changes in channel planform and lateral channel position (such as channel avulsions) are not expected for most of the Siletz River in the reaches evaluated for this study. Short sections (less than 1 km) at channel bends where the width of the active channel increases, such as Moonshine Park (fig. 17A–J), Baker Creek (fig. 18A–J), and Windchime bar (fig. 23A–J), had noticeable planimetric change and increases in mapped bar area from 1939 to 2016. In these sections, smaller and frequent events (such as the 0.995–0.5 AEPs) are expected to rework the channel bed and finer gravel bars, whereas larger and less frequent events (such as the 0.002 AEP) are expected to rework the coarse and armored gravel bars and reset vegetation patterns (as evident in the comparison of the 1994 and 2000 aerial photographs that bracket an event that peaked around the 0.002 AEP on November 26, 1999; figs. 17A–J, 20A–J–21A–J).
In the future, the location of the wetted channel and size, location, and shape of gravel bars in sections where the Siletz River flows over alluvium may continue to adjust to changes in discharge and sediment inputs. If transport capacity increased substantially relative to bed-material supply in the future, responses may include more exposed-in-channel bedrock, areal reductions in gravel bars, or coarsening of bed sediment. Conversely, if transport capacity decreased substantially relative to bed-material supply, the channel may respond with increases in alluvial cover and increases in gravel bar area. Sediment transport changes in response to discharge changes will likely depend on many factors, including reach-scale characteristics, event characteristics (including frequency, magnitude, and duration), and sediment supply.
Geology, hydraulics, and bed-material sediment inputs establish the physical template for spawning and rearing habitats used by Chinook salmon and Pacific lamprey along the Siletz River. In coming decades, projected moderate increases in autumn-winter discharge, reduced spring and summer discharge, and elevated summer water temperatures may threaten the survival of Chinook salmon and Pacific lamprey (Leibowitz and others, 2014; Clemens and others, 2017; Crozier and others, 2019). Based on the findings of this study, moderate increases in autumn and winter discharge are not expected to translate to substantial reworking of coarse, armored bars along the Siletz River (such as Logsden, Rock Creek, and Twin Bridges bars; fig. 27A–J) because these landforms require large events to be mobilized. However, moderate discharge increases may induce selective transport of finer sediment. If sediment supply does not increase as transport capacity increases, increases in discharge could decrease stored gravel along finer, more dynamic gravel bars and result in bed coarsening. These types of changes may result in reductions in the area and size of gravels suitable for spawning and redd construction by Chinook salmon and Pacific lamprey and lead to redd superimposition and reduced spawning success. Moderate increases in discharge during the autumn and winter may also result in more frequent resuspension of sand and small gravels that support lamprey larvae burrowing habitat and some Chinook salmon redds with incubating eggs.
Projected moderate increases in discharge during autumn and winter may also reduce low velocity areas used as rearing habitat by juvenile Chinook salmon and other fish species. Along the main-stem Willamette River, reaches with large gravel bars and low-lying floodplains support more rearing habitat for Chinook salmon and steelhead at both low and high flows compared with reaches that lack gravel bars (White and others, 2022). Although not assessed by this study, the confined nature of the Siletz River, its deeper and faster channel between the 0.5 and 0.002 AEPs (fig. 34C–D), and paucity of low-lying floodplain likely limit the amount of salmonid rearing habitat along the main-stem Siletz River. Habitat suitability criteria developed for the Willamette Basin (White and others, 2022) may be refined using habitat observations for juvenile Chinook salmon rearing in the main-stem Siletz River and then applied to the hydraulic results to quantify the amount of suitable rearing habitat for juvenile salmon for a range of discharge conditions.
This study provides insights into the geomorphic, hydraulic, and bedload sediment transport factors shaping the Siletz River corridor. Results could be used coupled with existing estimates of discharge and water temperatures (Leibowitz and others, 2014; Lee and others, 2020) and social constraints to develop a comprehensive and spatially explicit framework for decision-making aimed at improving habitats for Chinook salmon and Pacific lamprey and identifying climate adaptations. In particular, the hydraulic modeling results of this study could be explored further to identify rearing habitat for Chinook salmon, as was done in the Willamette River Basin (White and others, 2022), to provide a baseline for monitoring future changes in substrate particle size (appendix 1), or as a means of identifying reaches where specific habitat restoration interventions may be most effective for the purpose of enhancing habitat. For example, if the Confederated Tribes of Siletz Indians of Oregon aims to increase the retention of spawning or burrowing substrates or increase the range of water velocities and depths with large wood installations, then such actions are expected to result in the greatest change in sections with reduced transport capacity (such as where the active channel widens). Other important considerations for the conservation of Chinook salmon and Pacific lamprey include understanding and mitigating elevated water temperature and reduced discharge in summer (Lee and others, 2020), spatial landscape processes that drive resource selection (Falke and others, 2013; Jacobs and others, 2021), and changes in habitat requirements with life stage (Wainwright and Weitkamp, 2013; Clark and others, 2014).
Summary and Conclusions
Future climate-related changes in discharge and sediment transport capacity along the Siletz River have implications for the conservation of Chinook salmon (Oncorhynchus tshawytscha) and Pacific lamprey (Entosphenus tridentatus) and habitat restoration efforts by the Confederated Tribes of Siletz Indians of Oregon. The results and key findings of this study emphasize that the Siletz River between Moonshine Park and the City of Siletz is primarily laterally and vertically stable because of the bedrock underlying and flanking much of the river corridor. Over the last century, relatively wider sections of the channel that flow on alluvium and contain gravel bars have been the most dynamic portions of this river. These sections are most likely to be susceptible to future changes in discharge and sediment inputs; however, the magnitudes of these changes are expected to be modest.
Bedload transport capacity likely exceeds supply along the Siletz River between Moonshine Park and the City of Siletz, as indicated by comparisons of bedload transport capacity modeling with estimate coarse sediment supply and by the bedrock outcrops and coarse gravel bars along the river. Potential burrowing habitat for lamprey larvae is predicted for 28 percent of the stream modeled in the Siletz River Basin and coincides primarily with the main-stem Siletz River and major tributaries. However, actual burrowing habitat locations are likely to be localized between Moonshine Park and the City of Siletz and be especially restricted where the channel flows through narrow, bedrock segments. Together, the results of this study provide a baseline for documenting and assessing future changes and can be used in conjunction with existing estimates of discharge and water temperatures for the Siletz River to inform development of a comprehensive and spatially explicit framework that could be used to guide decision-making for sustaining these culturally important fish species.
References Cited
Bunte, K., and Abt, S.R., 2001, Sampling surface and subsurface particle-size distributions in wadeable gravel- and cobble-bed streams for analyses in sediment transport, hydraulics, and streambed monitoring: U.S. Department of Agriculture Forest Service, Rocky Mountain Research Station, General Technical Report RMRS-GTR-74, 428 p.
Clemens, B.J., Beamish, R.J., Coates, K.C., Docker, M.F., Dunham, J.B., Gray, A.E., Hess, J.E., Jolley, J.C., Lampman, R.T., McIlraith, B.J., Moser, M.L., Murauskas, J.G., Noakes, D.L.G., Schaller, H.A., Schreck, C.B., Starcevich, S.J., Strief, B., van de Wetering, S.J., Wade, J., Weitkamp, L.A., and Wyss, L.A., 2017, Conservation challenges and research needs for Pacific lamprey in the Columbia River Basin: Fisheries, v. 42, no. 5, p. 268–280.
Crozier, L.G., McClure, M.M., Beechie, T., Bograd, S.J., Boughton, D.A., Carr, M., Cooney, T.D., Dunham, J.B., Greene, C.M., Haltuch, M.A., Hazen, E.L., Holzer, D.M., Huff, D.D., Johnson, R.C., Jordan, C.E., Kaplan, I.C., Lindley, S.T., Mantua, N.J., Moyle, P.B., Myers, J.M., Nelson, M.W., Spence, B.C., Weitkamp, L.A., Williams, T.H., and Willis-Norton, E., 2019, Climate vulnerability assessment for Pacific salmon and steelhead in the California Current Large Marine Ecosystem: PLoS One, v. 14, no. 7, 49 p.
Gordon, G.W., Jones, K.J., and Keith, M.K., 2021, Active channel mapping for the Siletz River, Oregon, 1939 to 2016: U.S. Geological Survey data release, accessed on May 22, 2022, at https://doi.org/10.5066/P9AWWRA0.
Hirsch, R.M., and De Cicco, L.A., 2015, User guide to Exploration and Graphics for RivEr Trends (EGRET) and dataRetrieval—R packages for hydrologic data (ver. 2.0, February 2015): U.S. Geological Survey Techniques and Methods, book 4, chap. A10, 93 p., accessed September 2, 2021, at https://doi.org/10.3133/tm4A10.
Horizon Systems Corporation, 2013, NHDPlusV2Data: Horizon Systems Corporation database, accessed August 2, 2021, https://www.horizonsystems.com/nhdplus/.
Howard, A.D., 1998, Long profile development of bedrock channels: Interaction of weathering, mass wasting, bed erosion, and sediment transport, in Tinkler, J., and Wohl, E.E., eds., Rivers over rock—Fluvial processes in bedrock channels: American Geophysical Union Geophysical Monograph, v. 107, p. 297–319.
Jones, K.L., and Keith, M.K., 2021, Surficial and subsurface grain-size data for the Siletz River, Oregon, 2017–18: U.S. Geological Survey data release, accessed May 17, 2022, at https://doi.org/10.5066/P96ZXPP.
Keith, M. K., and Jones, K.L., 2025, Modeled bedload transport capacity for the Siletz River, Oregon: U.S. Geological Survey data release, accessed on 1/X/2025, at https://doi.org/0.5066/P9TIADK3.
Leahy, E.K., White, J.S., and Jones, K.L., 2024, Water surface elevation data from the Siletz River, 2017-18: U.S. Geological Survey data release, accessed December 23, 2024, at https://doi.org/10.5066/P1N35MQN.
Lee, S., Fullerton, A.H., Sun, N., and Torgersen, C.E., 2020, Projecting spatiotemporally explicit effects of climate change on stream temperature—A model comparison and implications for coldwater fishes: Journal of Hydrology, v. 588, accessed May 21, 2022, at https://doi.org/10.1016/j.jhydrol.2020.125066.
Ma, L., Madin, I.P., Olson, K.V., Watzig, R.J., Wells, R.E., Niem, A.R., and Priest, G.R. (compilers), 2009, Oregon geologic data compilation [OGDC], release 5 (statewide), digital data: Oregon Department of Geology and Mineral Industries website, accessed August 21, 2012, at http://www.oregongeology.com/sub/ogdc/.
McKay, L., Bondelid, T., Dewald, T., Johnston, J., Moore, R., and Rea, A., 2012, NHDPlus version 2—User guide: Prepared for the U.S. Environmental Protection Agency by Horizon Systems Corporation and U.S. Geological Survey, accessed April 2021, at http://www.horizon-systems.com/NHDPlus/index.php.
Myers, J.M., Kope, R.G., Bryant, G.J., Teel, D., Lierheimer, L.J., Wainwright, T.C., Grant, W.S., Waknitz, F.W., Neely, K., Lindley, S.T., and Waples, R.S., 1998, Status review of Chinook salmon from Washington, Idaho, Oregon, and California. U.S. Department of Commerce, National Oceanic and Atmospheric Administration Technical Memo NMFS-NWFSC-35, 476 p.
National Aerial Photography Program, 1994, National Aerial Photography Program 1994 aerial photography: U.S. Geological Survey, digital data, accessed February 5, 2018, at https://earthexplorer.usgs.gov/.
National Aerial Photography Program, 2000, National Aerial Photography Program 2000 aerial photography: U.S. Geological Survey, digital data, accessed February 5, 2018, at https://earthexplorer.usgs.gov/.
National Agriculture Imagery Program, 2009, National Agriculture Imagery Program 2009 aerial photography: U.S. Department of Agriculture, Natural Resources Conservation Service, digital data, accessed February 5, 2018, at https://datagateway.nrcs.usda.gov/.
National Agriculture Imagery Program, 2016, National Agriculture Imagery Program 2016 aerial photography: U.S. Department of Agriculture, Natural Resources Conservation Service, digital data, accessed February 5, 2018, at https://datagateway.nrcs.usda.gov/.
National Marine Fisheries Service, 2023, Endangered and threatened wildlife—90-Day finding on a petition to list Oregon coast and southern Oregon and Northern California Coastal Chinook Salmon as threatened or endangered under the Endangered Species Act: Federal Register, v. 88, no. 7, p. 1548–1555.
National Oceanic and Atmospheric Administration, 2019, OPUS: Online Positioning User Service: National Oceanic and Atmospheric Administration, National Geodetic Survey, accessed July 28, 2025, at https://geodesy.noaa.gov/OPUS/.
National Oceanic and Atmospheric Administration, 2023, Tide station page for Chinook Bend, Siletz River, Oregon Station ID 9435992: National Oceanic and Atmospheric Administration, National Ocean Service website, accessed August 2, 2023, at https://tidesandcurrents.noaa.gov/stationhome.html?id=9435992.
O’Connor, J.E., Mangano, J.F., Anderson, S.W., Wallick, J.R., Jones, K.L., and Keith, M.K., 2014, Geologic and physiographic controls on bed-material yield, transport, and channel morphology for alluvial and bedrock rivers, western Oregon: Geological Society of America Bulletin, v. 126, no. 3–4, p. 377–397.
Onset Computer Corporation, 2022, Barometric compensation method—Tech note: Onset Computer Corporation website, accessed June 24, 2022, at https://www.onsetcomp.com/support/tech-note/barometric-compensation-method/.
Oregon Department of Fish and Wildlife, 1997, Siletz River Basin fish management plan, 127 p., accessed on December 23, 2024, at https://nrimp.dfw.state.or.us/nrimp/information/docs/fishreports/Siletz%20River%20Basin%20November%201997.pdf.
Oregon Department of State Lands, 2017, Heads of tide dataset: Oregon Spatial Data Library, accessed October 21, 2020, at https://spatialdata.oregonexplorer.info/geoportal/details;id=3226ac62fb29455cb2ed3e65e073ddcc.
PRISM Climate Group, 2018, PRISM Climate data: PRISM Climate Group, Northwest Alliance for Computational Science and Engineering, based at Oregon State University, Corvallis, Oregon, web server, accessed April 2018, at http://www.prism.oregonstate.edu/historical/.
R Core Team, 2021, R—A language and environment for statistical computing: Vienna, Austria, R Foundation for Statistical Computing, https://www.R-project.org/.
Smith, R.L., and Roe, W.P., 2015, OGDC-6 Oregon geologic data compilation, release 6: Oregon Department of Geology and Mineral Industries, digital geodatabase, accessed January 3, 2025 available at https://pubs.oregon.gov/dogami/dds/p-OGDC-6.htm.
U.S. Army Corps of Engineers, 2016, HEC-RAS River Analysis System hydraulic reference manual (version 5.0): Davis, California, U.S. Army Corp of Engineers, accessed August 15, 2022, at https://www.hec.usace.army.mil/software/hec-ras/documentation/HEC-RAS%205.0%20Reference%20Manual.pdf.
U.S. Congress, 1973, Endangered Species Act of 1973—Public Law 93-205: U.S. Congress, p. 884–903, accessed January 15, 2025, at https://www.congress.gov/bill/93rd-congress/senate-bill/1983.
U.S. Fish and Wildlife Service, 2019, Pacific lamprey Entosphenus tridentatus assessment: Portland, Oregon, U.S. Fish and Wildlife Service, accessed April 15, 2022, at https://www.pacificlamprey.org/wp-content/uploads/2022/02/Pacific-Lamprey-Entosphenus-tridentatus-Assessment-%E2%80%93-2018-Revision.pdf.
U.S. Geological Survey, 2021a, National hydrography dataset: U.S. Geological Survey, accessed February 26, 2021, at https://www.usgs.gov/core-science-systems/ngp/national-hydrography.
U.S. Geological Survey, 2021b, USGS water data for the Nation: National Water Information System database, accessed February 26, 2021, at https://doi.org/10.5066/F7P55KJN.
U.S. Geological Survey, 2021c, WaterWatch: U.S. Geological Survey web interface, https://waterwatch.usgs.gov/, accessed at various times.
U.S. Geological Survey, 2019, The StreamStats program, online accessed on February 23, 2022, at https://streamstats.usgs.gov/ss/.
Watershed Sciences, Inc., 2009a, Lidar remote sensing data collections, Department of Geology and Mineral Industries, Oregon North Coast: Prepared by Watershed Sciences, Portland, Oregon for the Department of Geology and Mineral Industries, digital data accessed August 30, 2021, at https://gis.dogami.oregon.gov/maps/lidarviewer/.
Watershed Sciences, Inc., 2009b, Lidar remote sensing data collections, Department of Geology and Mineral Industries, Oregon North Coast: Prepared by WSI, Portland, Oregon for the Department of Geology and Mineral Industries, 38 p. report, accessed August 30, 2021, at https://www.oregongeology.org/pubs/ldq/reports/North_Coast_Lidar_Report_2009.pdf.
Watershed Sciences, Inc., 2010a, Lidar remote sensing data collections, Department of Geology and Mineral Industries, Yambo study area: Prepared by WSI, Portland, Oregon for the Department of Geology and Mineral Industries, digital data accessed August 30, 2021, at https://gis.dogami.oregon.gov/maps/lidarviewer/.
Watershed Sciences, Inc., 2010b, Lidar remote sensing data collections, Department of Geology and Mineral Industries, Yambo study area: Prepared by WSI, Portland, Oregon for the Department of Geology and Mineral Industries, 31 p., accessed August 30, 2021, at https://www.oregongeology.org/pubs/ldq/reports/Yamhill-Hebo_Lidar_Report_2010.pdf.
Watershed Sciences, Inc., 2012a, Lidar remote sensing data collections, Department of Geology and Mineral Industries, Central Coast study area: Prepared by WSI, Portland, Oregon for the Department of Geology and Mineral Industries, digital data accessed August 30, 2021 at https://gis.dogami.oregon.gov/maps/lidarviewer/.
Watershed Sciences, Inc., 2012b, Lidar remote sensing data collections, Department of Geology and Mineral Industries, Central Coast study area: Prepared by WSI, Portland, Oregon for the Department of Geology and Mineral Industries, 36 p. report, accessed August 30, 2021 at https://www.oregongeology.org/pubs/ldq/reports/OLC_Central_Coast_Final_Report_2012.pdf
White, J.S., Peterson, J.T., Stratton Garvin, L.E., Kock, T.J., and Wallick, J.R., 2022, Assessment of habitat availability for juvenile Chinook salmon (Oncorhynchus tshawytscha) and steelhead (O. mykiss) in the Willamette River, Oregon: U.S. Geological Survey Scientific Investigations Report 2022–5034, 44 p.
White, J.S., Harden, T.M., Jones, K.L., and Keith, M.K., 2025, One- and two-dimensional hydraulic models for the Siletz River, Oregon: U.S. Geological Survey data release, accessed 01/XX/2025, at https://doi.org/10.5066/P1489NN8.
Appendix 1. Outstanding Communication and Science Challenges and Possible Approaches to Address Them
Communication of Findings to Support River Management and Restoration
Hydrogeomorphic research in larger rivers along the Oregon coast are reported in multiple, technical publications, including this report and others by Wallick and others (2010, 2011), Jones and others (2011, 2012a–c)127, and O’Connor and others (2014). Understanding the differences in the physical processes shaping these rivers and their aquatic habitats and the associated implications for specific fish species and life stages remains a challenge because doing so would require reviewing multiple publications, drawing conclusions about the physical processes shaping each river, comparing differences in physical processes among the rivers, and then relating the physical processes creating habitat with biological information on fish habitat needs. This challenge could be addressed by completing a synthesis of the existing hydrogeomorphic research and linking it with data and insights on fish habitat needs. Linking hydrogeomorphic processes and fish habitat needs would provide a scientific framework for considering geomorphic responsiveness to changes in discharge and sediment loads and implications of other factors (such water temperature and non-native species distributions) for fish species in rivers draining the Oregon coast. Such an information synthesis could be provided in written formats, online interactive tools, or in direct interaction with stakeholders in a structured decision-making setting to allow them to co-create decision models with existing information (such as Benjamin and others, 2019).
Evaluation of Historical Discharge Patterns and Relation with Geomorphic and Bed Elevation Changes
Understanding future changes in discharge patterns and potential implications for fish habitat depends in part on understanding historical discharge changes and associated effects on the Siletz River. To date, however, a comprehensive assessment of historical discharge patterns does not exist for the Siletz River or others along the Oregon coast. To overcome this challenge, the long-term streamflow records for U.S. Geological Survey (USGS) streamgage 14305500 on the Siletz River (U.S. Geological Survey, 2021) could be analyzed to determine if and how the duration, magnitude, and frequency of events ranging from baseflows to major floods have changed over the last century. This type of detailed analysis for the Siletz River could be compared against the specific gage analysis results to investigate why localized aggradation and bed lowering at USGS streamgage 14305500 occurred following moderate to large floods between water year (WY) 1996 and 2002 (figs. 24–25); however, no detectable changes have occurred since 2007, despite the occurrence of several moderate to large floods between 2002 and 2020 (fig. 5). Such analyses for the Siletz River would be the most robust if paired with a regional assessment of changes from long-term streamgages on other rivers along the Oregon coast. An in-depth, regional analysis of potential changes discharge metrics could be combined with the results of a regional specific-gage analyses and channel mapping to determine if the occurrence or lack of bed elevation changes (such as aggradation or incision) at streamgages associated with floods is localized or widespread throughout the region. Such information at a regional scale could be used to gain insights about regional patterns in discharge and geomorphic change over the last century.
Analyses of the Relation between Hydraulics and Fish Habitat
Understanding the direct effects of the magnitude, duration, and frequency of flood events on fish habitat is a key component for planning habitat conservation and restoration actions along the Siletz River. This study found notable increases in maximum and mean water velocity and transport capacity occurred between the 0.995 and 0.50 annual exceedance probabilities (AEPs; figs. 33D and 41A–C). These types of events occur relatively frequently (approximately every 1–2 years; table 2) and likely bracket events that transition from being contained with the active channel to those that connect with larger gravel bars and floodplain on the Siletz River. When multiple events exceeding these AEPs occur in a water year (such as in WY 1996; fig. 43A), the cumulative sediment transported by these events can be comparable or greater than single, higher magnitude events (such as in WY 2000; fig. 43B). Although this study developed these insights, making direct connections between hydraulics, sediment transport, and fish habitat was not feasible and outside the scope of this project. Future investigations could focus on understanding the frequency and duration of different AEP events and their associated effects on Chinook salmon and lamprey habitat (such as whether such events mobilize fine sediment deposits used by lamprey larvae for burrowing or mobilize coarse sediment deposits where eggs of Chinook salmon are incubating).
Analyses of the Relation between Discharge and Vegetation Patterns
In this study, we were unable to investigate vegetation responses to flood events on the Siletz River, which is a critical component to understanding hydraulics at a range of discharges and the creation of riparian and high-flow habitats along the river corridor. In the channel mapping, all sub-reaches had signs of scour along most bar surfaces in the 2000 aerial photographs but more limited scour along the channel margins in the 2009 and 2016 aerial photographs (figs. 17–23). The mapping datasets produced by this study could be used as a foundation for assessing changes in vegetation cover classes and density over time. If combined with grain-size data, differences in vegetation patterns documented by the vegetation mapping could be related to differences in underlying substrates. This information could be used to help describe the relation between vegetation, discharge, and particle size and their influence on establishment of vegetation species of interest (such as willows [Salix sp.]).
Refinement of Bedload Transport Modeling
The bedload transport capacity modeling done in this study provides an over-simplification of transport capacity conditions along the Siletz River and relies on simplified inputs of discharge, particle size, and channel geometry. Additionally, these analyses do not consider many relevant factors, such as actual sediment supply, the duration or frequency of consecutive high-flow events, alternating sections of alluvium and bedrock along the Siletz River, potential bed adjustments from aggradation or incision that change local conditions, and cyclical vegetation removal and regrowth related to floods. Further investigations of sediment and sediment transport along the Siletz River could provide a better understanding of sediment transport conditions and some validation of bedload transport models. Examples of additional sediment investigations include: (1) validating bedload transport capacity models with measurements of bedload transport, (2) determining the initiation of motion of gravels and minimum threshold discharge from surrogate techniques, (3) modeling specific peak events to better understand the magnitude of sediment the river could move under specific discharge simulations, (4) determining effective streamflow (Andrews, 1980) to better understand the discharge magnitude that transports sediment, (5) measuring and evaluating particle sizes from additional or repeat sites where gravel bar surfaces are likely mobilized regularly to refine assessments of the relation between transport and sediment supply and longitudinal trends in bed material sediment, (6) hydrodynamic-modeling of sediment dynamics that build upon new or existing two-dimensional (2D) hydraulic models, and (7) assessment of suspended sediment loads to understand the total load transported by the Siletz River and supplied to the Siletz Bay.
Monitoring and Analyses to Support Future Assessments of Geomorphic Change
In the future, channels and aquatic habitats may change along the Siletz River in response to climate change. A key challenge to being able to document and assess future changes is having ongoing consistent data collection of strategic parameters at targeted locations. Some examples of targeted, continued monitoring that builds upon datasets and results of this study include repeated measurements of particle sizes in spawning habitats to assess bed texture changes over time, assessments of streambed scour or bed mobility in relation to the depth of incubating Chinook salmon embryos (Gendaszek and others, 2020) or the depth of burrowing Pacific lamprey larvae, and periodic mapping of channel and vegetation patterns after large floods in sections where the Siletz River flows over alluvium.
One effective strategy for assessing bed elevation change over time would be leveraging the longitudinal profiles of the Siletz River. The USGS surveyed the Siletz River in 1925 from the head of tide to the confluence with the South Fork Siletz River (U.S. Geological Survey, 1926). These historical plan and profile datasets could be compared with bathymetry acquired for this study between Moonshine Park and the City of Siletz. Such a comparison could be used to identify other locations where vertical bed elevations may have changed over time. The new bathymetry data collected between Moonshine Park and the City of Siletz during this study provides a baseline for assessing future changes in bed elevations (White and others, 2025). Repeat bathymetric profile surveys following larger magnitude floods could show whether the channel is vertically responding. Additionally, in-depth profile analyses could be used to identify in-channel morphology and habitat features (such as pools and riffles) that are not captured with aerial photograph mapping.
Assessment of Habitat Conditions for Chinook Salmon and Pacific Lamprey
The one-dimensional (1D) and 2D hydraulic modeling (White and others, 2025) done for this study provides a baseline for understanding longitudinal and lateral changes in hydraulic parameters along sub-reaches of the Siletz River. A challenge remains in connecting these hydraulic results with fish habitat needs to inform conservation and restoration work by the Confederated Tribes of Siletz Indians of Oregon. Insights from of the hydraulic models developed here could be more closely integrated with information on patterns of habitat use and selection by fish species and life stage or more detailed assessments of behavior, growth, movement, survival, or other responses. For example, results of 1D hydraulic model could be combined with fish distribution data to identify specific locations and discharge magnitudes when channels overtop banks and connect with floodplain at key sites along the river corridor. This could be useful to identify availability of seasonal habitats that fish may use as high-flow refuge. Additionally, the 2D model may be combined with habitat suitability criteria to identify habitat for different life stages of Chinook salmon, as done in the Willamette Basin (White and others, 2022). Such information linking hydraulics with fish habitat needs could be used by the Confederated Tribes of Siletz Indians of Oregon and others to prioritize locations for habitat protection and enhancement.
Future studies to more directly integrate ecological processes linked to Chinook salmon and Pacific lamprey with physical models of watershed processes and main-stem river responses (such as in-stream hydraulics, floodplain connectivity, sediment transport, and water temperature) could provide stronger foundations for more effective design and implementation of measures to improve the main-stem Siletz River, with insights that can be transferred to other larger coastal rivers. For example, the Siletz River is expected to have less habitats with thermal conditions suitable for coldwater fish species (such as Chinook salmon) in the future (Lee and others, 2020). Integrating the hydrogeomorphic template of the Siletz River with existing water temperature work (such as Fullerton and others [2018] and Lee and others [2020]) could improve understanding of how water quality and physical habitat characteristics together determine habitat suitability for Chinook salmon and Pacific lamprey and then be used to identify realistic restoration strategies for different locations along the river network to support different life stages of these species.
References Cited
Fullerton, A.H., Torgersen, C.E., Lawler, J.J., Steel, E.A., Ebersole, J.L., and Lee, S.Y., 2018, Longitudinal thermal heterogeneity in rivers and refugia for coldwater species—Effects of scale and climate change: Aquatic Sciences, v. 80, no. 1, 15 p., https://doi.org/10.1007/s00027-017-0557-9.
Gendaszek, A.S., Ablow, E., and Marks, D., 2020, Streambed scour of salmon (Oncorhynchus spp.) and steelhead (Oncorhynchus mykiss) redds in the South Fork Tolt River, King County, Washington: U.S. Geological Survey Scientific Investigations Report 2020–5044, 20 p., https://doi.org/10.3133/sir20205044.
Lee, S., Fullerton, A.H., Sun, N., and Torgersen, C.E., 2020, Projecting spatiotemporally explicit effects of climate change on stream temperature—A model comparison and implications for coldwater fishes: Journal of Hydrology, v. 588, https://doi.org/10.1016/j.jhydrol.2020.125066.
O’Connor, J.E., Mangano, J.F., Anderson, S.W., Wallick, J.R., Jones, K.L., and Keith, M.K., 2014, Geologic and physiographic controls on bed-material yield, transport, and channel morphology for alluvial and bedrock rivers, western Oregon: Geological Society of America Bulletin, v. 126, no. 3–4, p. 377–397.
U.S. Geological Survey, 2021, USGS water data for the Nation: U.S. Geological Survey National Water Information System database, accessed February 26, 2021, at https://doi.org/10.5066/F7P55KJN.
White, J.S., Peterson, J.T., Stratton Garvin, L.E., Kock, T.J., and Wallick, J.R., 2022, Assessment of habitat availability for juvenile Chinook salmon (Oncorhynchus tshawytscha) and steelhead (O. mykiss) in the Willamette River, Oregon: U.S. Geological Survey Scientific Investigations Report 2022–5034, 44 p., https://doi.org/10.3133/sir20225034.
White, J.S., Harden, T.M., Jones, K.L., and Keith, M.K., 2025, One- and two-dimensional hydraulic models for the Siletz River, Oregon: U.S. Geological Survey data release, accessed 01/XX/2025, at https://doi.org/10.5066/P1489NN8.
Conversion Factors
International System of Units to U.S. customary units
Datums
Vertical coordinate information is referenced to the North American Vertical Datum of 1988 (NAVD 88).
Horizontal coordinate information is referenced to the North American Datum of 1983 (NAD 83).
Elevation, as used in this report, refers to distance above the vertical datum.
Abbreviations
1D
one-dimensional
2D
two-dimensional
AEP
annual exceedance probability
DEM
digital elevation model
GIS
geographic information system
HEC-RAS
Hydraulic Engineering Center River Analysis System
NHD
National Hydrography Dataset
PBH
potential burrowing habitat for lamprey larvae
PT
pressure transducer
Reclamation
Bureau of Reclamation
rkm
river kilometer
USGS
U.S. Geological Survey
WSE
water surface elevation
WY
water year
For information about the research in this report, contact
Director, Oregon Water Science Center
U.S. Geological Survey
601 SW 2nd Avenue, Suite 1950
Portland, OR 97204
https://www.usgs.gov/centers/or-water
Manuscript approved on June 26, 2025
Publishing support provided by the U.S. Geological Survey
Science Publishing Network, Tacoma Publishing Service Center
Illustration and layout by Luis Menoyo
Disclaimers
Any use of trade, firm, or product names is for descriptive purposes only and does not imply endorsement by the U.S. Government.
Although this information product, for the most part, is in the public domain, it also may contain copyrighted materials as noted in the text. Permission to reproduce copyrighted items must be secured from the copyright owner.
Suggested Citation
Jones, K.L., Keith, M.K., Harden, T.M., White, J.S., van de Wetering, S., and Dunham, J.B., 2025, Assessment of channel morphology, hydraulics, and bedload transport along the Siletz River, western Oregon: U.S. Geological Survey Scientific Investigations Report 2025–5063, 95 p., https://doi.org/10.3133/sir20255063.
ISSN: 2328-0328 (online)
Study Area
| Publication type | Report |
|---|---|
| Publication Subtype | USGS Numbered Series |
| Title | Assessment of channel morphology, hydraulics, and bedload transport along the Siletz River, western Oregon |
| Series title | Scientific Investigations Report |
| Series number | 2025-5063 |
| DOI | 10.3133/sir20255063 |
| Publication Date | September 22, 2025 |
| Year Published | 2025 |
| Language | English |
| Publisher | U.S. Geological Survey |
| Publisher location | Reston, VA |
| Contributing office(s) | Oregon Water Science Center |
| Description | Report: xii, 95 p.; 5 Data Releases |
| Country | United States |
| State | Oregon |
| Other Geospatial | Siletz River basin |
| Online Only (Y/N) | Y |