

Analysis of Summer Water Temperatures of the Lower Virgin River Near Mesquite, Nevada, 2019–21
Links
- Document: Report (7.2 MB pdf) , HTML , XML
- Download citation as: RIS | Dublin Core
Acknowledgments
Thanks to Kevin Guadalupe and Amos Rehm of the Nevada Department of Wildlife and Skyler Hedden of the Arizona Game and Fish Department for their expertise on native fish habitat.
Data collection was assisted by Nora Nelson, Jose Castillo Garcia, Venus Cruz, Ruby Hurtado, and Olivia Mathiesen. This report benefited from reviews by Gwendolyn Davies, Christopher Morris, and Gregg Paulson.
Abstract
The lower Virgin River is a sandy, shallow reach of the Virgin River that flows from northern Arizona to Lake Mead in Nevada. The Virgin River hosts several native fish species, including two endangered fish, woundfin (Plagopterus argentissimu) and Virgin River chub (Gila seminuda). All native fish species in the lower Virgin River have experienced reductions in population sizes in the last several decades. Reduced stream flow (especially during summer low-flow conditions) often results in increased water temperatures, which can increase mortality, reduce breeding, limit population connectivity, and favor non-native fish species. This study investigated summer water temperatures and flow in the lower Virgin River near Mesquite, Nev., between Littlefield, Ariz., and Bunkerville, Nev., to evaluate how hydrologic conditions could be affecting native fish species. The 3-year monitoring project involved collection of continuous temperature and discrete discharge measurements at 15 sites from 2019 to 2021 during the summer months from June to September. Results indicate that the lower Virgin River is often greater than 5 degrees Celsius (°C) above the established critical thermal maximum of 31 °C, that the cooling effect of the Littlefield springs dissipates quickly downstream, and that water temperature is affected primarily by atmospheric conditions. Discharge and water temperature are poorly related at normal stable flow conditions.
Introduction
The lower Virgin River is a sandy, shallow reach of the Virgin River that flows from northern Arizona to Lake Mead, Nevada (fig. 1). The Virgin River hosts several native fish species, including two federally endangered fishes, woundfin (Plagopterus argentissimus) and Virgin River chub (Gila seminuda). Native fishes in the Virgin River have seen substantial reductions in population sizes in the last several decades (U.S. Fish and Wildlife Service, 2023). Reductions in native fish populations across the arid southwestern United States have been attributed to agricultural, municipal, and industrial water use, which often result in reduced streamflow, among other issues (Deacon and others, 1987). Aside from physical loss of habitat, reduced streamflow (especially during summer low-flow conditions) often results in higher water temperatures, which can increase mortality, reduce breeding, limit population connectivity, and favor non-native species (Rinne and Minckley, 1991; Mantua and others, 2010).
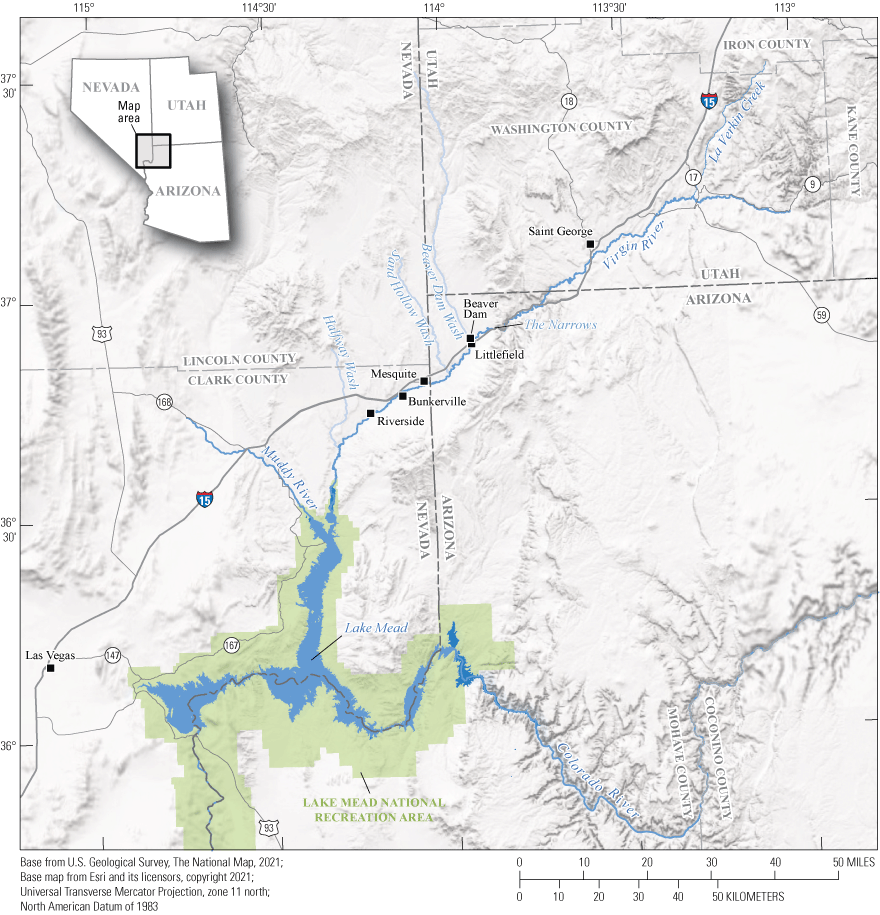
Overview of the lower Virgin River in Utah, Arizona, and Nevada.
The Virgin River has variable flows and large daily and seasonal fluctuations in water temperature (Deacon and others, 1987). During the summer, base flow in the lower Virgin River through the Narrows decreases substantially and occasionally ceases altogether. The perennial Littlefield springs just above the U.S. Geological Survey (USGS) streamgage at Littlefield, Ariz., restore base flow to the lower river (fig. 2). Downstream from the Littlefield springs, withdrawals at the Mesquite, Bunkerville, and Riverside irrigation diversions reduce discharge in the Virgin River and may contribute to increasing water temperatures.
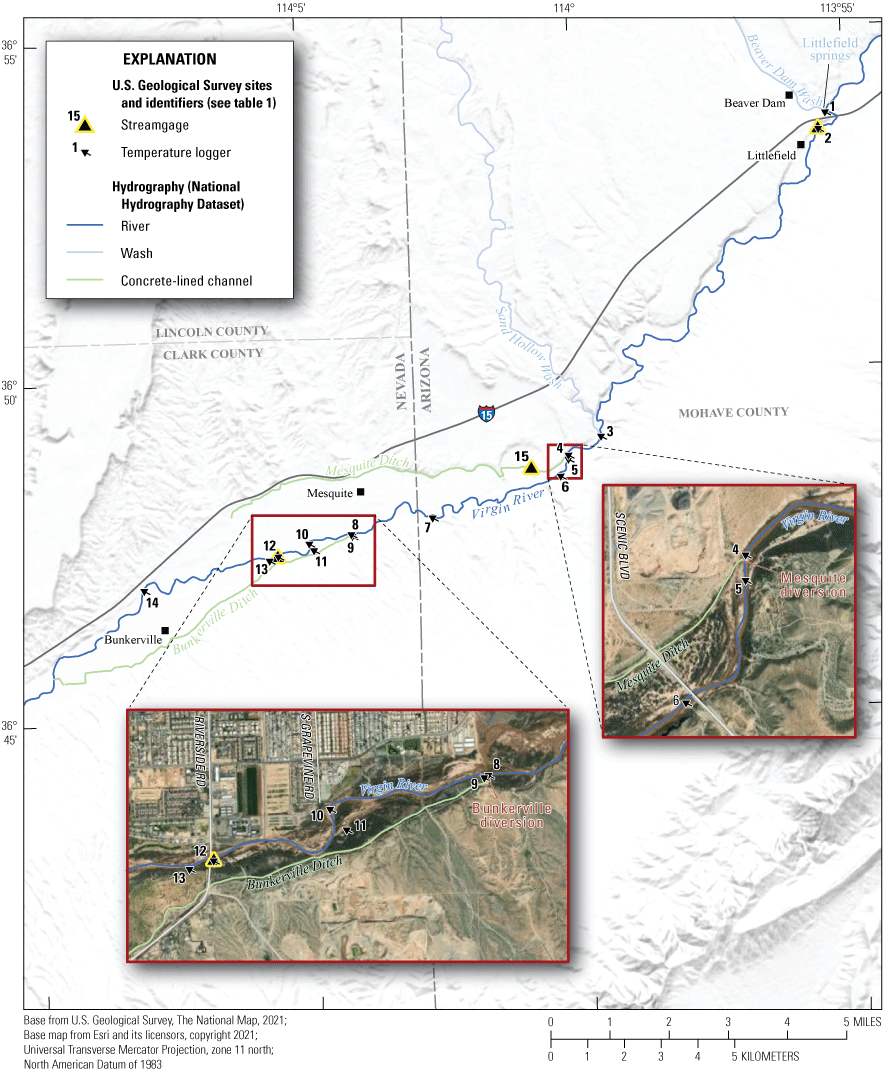
Study reach with logger and streamgages, lower Virgin River, Arizona and Nevada.
The lower Virgin River from the confluence of La Verkin Creek in Utah to Halfway Wash in Nevada is designated critical habitat for the Virgin River chub and woundfin (U.S. Fish and Wildlife Service, 2000). In addition to the woundfin and Virgin River chub, four other native fishes are present in the Virgin River. The Virgin spinedace (Lepidomeda mollispinis mollispinis) has been proposed for listing under the Endangered Species Act multiple times but was declared not warranted from listing in 2021 (Center for Biological Diversity, 2012; U.S. Fish and Wildlife Service, 2021). The three remaining native fish species in the Virgin River are the speckled dace (Rhinichthys osculus), the desert sucker (Pantosteus clarkii), and the flannelmouth sucker (Catostomus latipinnis; Deacon and others, 1987). Deacon and others (1987) observed that when water temperatures are elevated, native Virgin River fishes change their behavior, seek cooler thermal refuges, and start to experience mortality.
Existing native fish populations in the lower Virgin River are small. Several attempts have been made to stock woundfin (U.S. Fish and Wildlife Service, 2008), but few survived the high summer water temperatures and the presence of the non-native red shiner (Cyprinella lutrensis). Although water temperature is affected by ambient meteorological conditions (such as air temperature and solar radiation), stream discharge is often the only factor that can be practically managed to alter water temperature (Gu and others, 1998). Stakeholders consider changing the timing and flow of diversions from the lower Virgin River to be a promising strategy for controlling stream temperature and improving habitat for native fishes. The costs and benefits of diversion changes cannot be evaluated without a quantitative understanding of the effect of flow on water temperature in the lower Virgin River.
The USGS, in cooperation with the Bureau of Land Management and Nevada Department of Wildlife, undertook a 3-year study to monitor water temperatures along the lower Virgin River in Arizona and Nevada. The USGS operated 15 continuous temperature monitoring sites and three continuous streamgages measuring discharge from 2019 to 2021 (fig. 2; table 1).
Table 1.
Logger locations on the Virgin River, tributary washes, and diversion canals, Arizona and Nevada, 2019–2021 (U.S. Geological Survey, 2024).[ID, identification; USGS, U.S. Geological Survey; —, no data]
Purpose and Scope
The purpose of this report is to provide an analysis and summary of summer water temperatures in the lower Virgin River between Littlefield, Ariz., and Bunkerville, Nev. These data characterize the thermal range of the lower Virgin River and can be used to evaluate if temperatures exceed the critical thermal maximum (CTM) for endangered fishes of the Virgin River. Data include continuous water temperature and streamflow from sites along an approximately 20-mile reach of the lower Virgin River from the Beaver Dam Wash confluence in Arizona to 5 miles downstream from the Riverside Road bridge in Mesquite, Nev. Continuous temperature and discrete discharge measurements were collected in the summer months from July to September 2019, June to October 2020, and June to October 2021. Continuous discharge was collected between July 2019 and October 2021. Continuous temperature data were collected from 8 logger sites in 2019, 14 logger sites in 2020, and 8 logger sites in 2021. Discrete discharge data were collected at all logger sites two to three times each summer. Continuous discharge data were collected from three USGS streamgages. These data were analyzed by computing daily statistics and comparing the results to thermal tolerances for the endangered fishes of the Virgin River.
Study Area
The Virgin River flows approximately 163 miles from southwestern Utah, through Arizona, to the confluence of the Muddy River in the Lake Mead National Recreation Area in Nevada, where it becomes a tributary to the Colorado River (fig. 1). The lower Virgin River is generally defined as the river downstream from the fish barrier in the Narrows in Arizona, making the lower portion about 64 miles in length. The study area for this project was chosen based on the primary habitat of the listed fish species in the lower Virgin River. The study area extends from the confluence of Beaver Dam Wash and the Virgin River in an area generally referred to as “Littlefield” to the area downstream from the Bunkerville diversion (fig. 2).
The Virgin River has been used for irrigation by the San Juan Southern Paiute Tribe for centuries. Water management practices, including diversion canals, were first documented in 1854 near modern-day St. George, Utah (Stoffle and others, 2005). Irrigation by settlers in the lower Virgin valley in present-day Nevada and Arizona began immediately upon their arrival in the 1870s (Glancy and Van Denburgh, 1969) and continues to the present day for agricultural and landscaping purposes. The Mesquite diversion dam was first built in 1880 by local settlers and rebuilt several times after floods, most recently in 1955 (Kuta, 2021). The current structure is a low-head dam formed from concrete, I-beams, and large boulders. The Mesquite Irrigation Company operates the diversion structure and associated diversion canals and diverts water for users in and around the city of Mesquite. The Bunkerville diversion is a low-head dam about 5 miles downstream from the Mesquite diversion and is operated for irrigation purposes. The original irrigation diversions were first installed in the 1870s for the community of Bunkerville and were destroyed several times by floods in the following century. The current version of the diversion dam is a concrete broad-crested weir that was built in 2013 after a major flood in 2010 destroyed the older dam. The Bunkerville diversion is operated by the Bunkerville Irrigation Company and primarily diverts water for agricultural uses around the town of Bunkerville. Both diversions operate by diverting a portion of the river water into a gravity-driven diversion canal, and the remainder flows over the dam into the main channel. The portion of the diverted water not used for allocated water rights is returned to the mainstem of the river in downstream return canals. Additional diversions, such as Littlefield and Riverside, were not considered for this study because they divert a smaller proportion of water.
There are three USGS streamgages within the study area (fig. 2). The streamgaging station 09415000 Virgin River at Littlefield, AZ (herein also referred to as “Littlefield gage”) measures the full flow of the river at the upstream edge of the study reach. The streamgaging station 09415060 Mesquite canal near Mesquite, NV (herein also referred to as “Mesquite canal gage”) measures the diversion canal downstream from the Mesquite diversion. The streamgaging station 09415090 Virgin River at Mesquite, NV (herein also referred to as “Mesquite gage”) measured the flow of the mainstem of the river downstream from the Bunkerville diversion. Because of the many canals diverting and returning flow to the mainstem of the channel (fig. 3), there are many locations where the flow of the river is unknown.
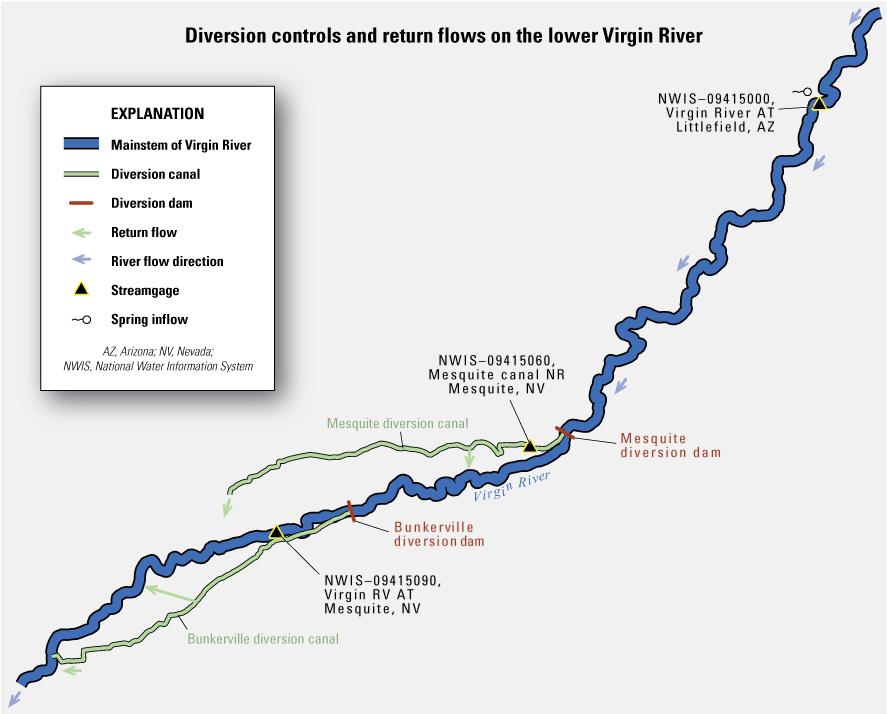
Diversion controls and return flows on the lower Virgin River in Arizona and Nevada.
The upper end of the study reach is defined as the Beaver Dam Wash/Virgin River confluence and USGS streamgage at Littlefield, 0.8 miles downstream. Springs averaging 25 °C in summer months (temperature data from logger 1) and flowing approximately 65 cubic feet per second (ft3/s; Trudeau and others, 1983) enter the channel between Beaver Dam Wash and Littlefield, representing the last substantial input of water in the lower Virgin River (Holmes and others, 1997; Dixon and Katzer, 2002). The springs at Littlefield represent the coldest water temperatures in the river during the summer months. Beaver Dam Wash/Littlefield also corresponds to the most favorable habitat of recorded native fishes in the lower Virgin River (U.S. Fish and Wildlife Service, 2023). Groundwater flow into the lower Virgin River is not considered to be a major input due to geologic controls (Cole and Katzer, 2000; Beck and Wilson, 2006). A small amount of exchange between near-surface groundwater and the river sustains riparian vegetation but is not evaluated in this study.
The U.S. Fish and Wildlife Service (USFWS) generally considers the downstream boundary of geographic range for the Virgin River chub and woundfin to be at Halfway Wash. Two decades of fish counts have shown diminishing fish populations downstream from the Narrows to Halfway Wash (U.S. Fish and Wildlife Service, 2023). The mainstem of the river can go dry in the summer months downstream from the Riverside Road bridge at Riverside, Nev., so the end of the study reach was chosen to be a point that does not go dry in the summer, which ended up being downstream from the Bunkerville diversion and upstream from the Riverside Road bridge at Riverside.
Previous Studies
The USFWS originally listed the woundfin as endangered in 1970 and the Virgin River chub as endangered in 1989 (Deacon and others, 1987; U.S. Fish and Wildlife Service, 2020). Many studies were completed between the late 1970s and 2000 to establish critical habitat along the Virgin River for the endangered fishes and to assess if additional species warranted listing (U.S. Fish and Wildlife Service, 2020).
Deacon and others (1987) established the thermal tolerances of the native fishes of the Virgin River. They allowed the fish to become acclimated to water at three different acclimation temperatures (10, 15, and 25 °C) and then heated the water and recorded the temperature at which the fish changed their behavior (the behavioral thermal maximum, or BTM) and the temperature at which the fish experienced physical limitations and eventual death (the critical thermal maximum, or CTM). For fish acclimated at 25 °C, the CTMs ranged from 36.4 °C for the Virgin River chub (referred to as the “roundtail chub” by Deacon and others [1987]) to 39.5 °C for the woundfin. For fish acclimated at 10 °C, the CTMs ranged from 27.9 °C for the Virgin River chub to 32.3 °C for the desert sucker. The USFWS has used a CTM of 31 °C and a BTM of 28 °C for management decisions in the upper Virgin River (U.S. Fish and Wildlife Service, 2020). Temperatures of 28/31 °C will be presented as BTM/CTM thresholds in this study.
Glancy and Van Denburgh (1969) completed the first major hydrologic study of the lower Virgin River in 1969 as part of a larger reconnaissance series on the hydrographic basins of Nevada. Holmes and others (1997) performed a hydrologic study of Beaver Dam Wash in 1997, which included measurements and estimates of flow at the mouth where it meets the Virgin River. Beck and Wilson (2006) presented the results of a synoptic flow study of the Virgin River between the Narrows and Lake Mead. Similar work was completed in 2012 evaluating the recharge and flow dynamics in the lower Virgin River using geochemical data (Asante, 2012). These studies noted that base flow in the study area originates at the springs near Littlefield and remains constant until it loses flow to municipal and irrigation withdrawals beginning at the Mesquite diversion.
Methods
Temperature and flow data were collected in multiple locations along the study reach during summer months of 2019, 2020, and 2021. Sites were selected within the study reach to represent specific flow or temperature conditions of the river. All continuous temperature data and discharge data for these sites are available publicly at the USGS National Water Information System web interface (https://waterdata.usgs.gov/nwis; U.S. Geological Survey, 2024). Field work and data collection followed USGS guidelines for the collection and analysis of continuous water quality data (Wagner and others, 2006).
Temperature Monitoring
A network of loggers was deployed to collect continuous water-temperature data at fixed sites in the Virgin River main channel and in the Mesquite and Bunkerville diversion canals (table 1). Loggers were operated during the warmest months, June through October, to capture maximum water temperatures for comparison to thermal maximums for the endangered fishes. Loggers recorded water temperature every 15 minutes, and data were downloaded during field visits approximately every 3 weeks.
Sites were chosen based on several factors, including distance from diversion points, relationship to ecological habitats, and suitability for long-term hydrologic measurement. The monitoring approach was dynamic and adaptive to the information learned about the river system in the previous year, so sites varied each year. Along the same 20-mile reach of river, 8 loggers were deployed in 2019, 14 loggers were deployed in 2020, and 8 loggers were deployed in 2021. Of these sites, 6 were measured all 3 years of the study (loggers 2, 3, 7, 8, 10, and 14). One example of the adaptive approach to monitoring was an effort to monitor the diversion canals because of a concern that the diversion canals were habitat to native fishes. To try to capture the temperature differences between the mainstem and diversion canals, sites were placed upstream or downstream from the diversion structures or in the diversion canals themselves.
HOBO TidbiT v2 Temp Loggers (accuracy of ±0.21 °C, resolution from 0° to 50 °C, resolution 0.02 °C at 25 °C) and HOBO TidbiT Mx Temp 5000 (±0.20 °C from 0° to 70 °C, resolution 0.01 °C) loggers were deployed to continuously measure and record water temperatures every 15 minutes (Onset, 2023a, b). Loggers were installed using carabiners, U-bolt hardware, and T-posts. T-posts were pounded into the sandy riverbed in flowing water. T-posts were installed in locations that would be appropriate for a range of flows; they were placed near the thalweg of each reach, situated in water deep enough to maintain depth and flow through low-flow conditions but closer to the banks to avoid debris that would travel down the center of the channel during high-flow conditions. This configuration allowed for low surface area in the event of a flood and allowed for re-adjustment into higher or lower water as the sand shifted in the channel.
Quality control of temperature data included thermistor calibrations, independent field verifications, and water-temperature cross sections at the beginning and end of each field season. The loggers and verification field thermistors underwent a seven-point calibration from 0 to 40 °C against a National Institute of Standards and Technology-calibrated thermistor before and after deployment each season. A VWR Traceable digital thermometer, Model 61220-601 thermistor (Avantor Sciences, Radnor, Pennsylvania; accuracy of ±0.05 °C), was used to verify the field-measured temperatures. At each site, water-temperature cross sections were measured before installation and after removal of the logger to verify that the logger location accurately represented conditions.
Flow Monitoring
Flow was measured along the study reach either by continuous streamgages or through discrete discharge measurements elsewhere. Continuous discharge data were recorded at three USGS streamgages. Flow at the upstream end of the study reach was measured at the Littlefield gage. The Littlefield gage is just below Beaver Dam Wash and the Littlefield springs. The Mesquite canal streamgage provides data for the water withdrawn by the Mesquite diversion structure. The Mesquite gage was installed as part of this study on the Riverside Road bridge in Mesquite, Nev., downstream from the Bunkerville diversion. Discrete discharge measurements were made using a SonTek FlowTracker or FlowTracker2 handheld-ADV (Xylem, Washington, D.C.). Discrete discharge measurements were made at temperature monitoring sites to quantify the flow in subreaches. All flow measurements followed USGS guidelines for discharge measurements at streamgages (Turnipseed and Sauer, 2010).
Calculation of Discharge of Diversion Canals and Return Flows
To better understand the effects of diversions and return flows on flow in the lower Virgin River, discrete measurements were made in the mainstem of the channel. Because of the long study reach, it was not possible to measure discharge along the entire length in one day with the available personnel. Discharge measurement data were collected from June 9 to June 15, 2021, a period of stable stage and no precipitation. Minor diurnal variations in discharge (on the order of 2 ft3/s at Littlefield) occurred during the multi-day field collection and add a small amount of uncertainty to the measured and calculated discharges. Addition and subtraction of known and calculated flows were used to calculate the discharges of diversion canals and return flows. The following list provides more specific information:
-
• The discharge in the Mesquite diversion canal above the return flow was the difference between the discharge measured upstream from the Mesquite diversion dam (logger 4) and the discharge measured below the Mesquite diversion dam (logger 5).
-
• The discharge of the return flow from the Mesquite diversion canal was the difference between the discharge in the diversion canal above the return flow (calculated as described above) and the discharge in the diversion canal below the return flow (logger 15).
-
• The discharge in the Bunkerville diversion canal above the return flow was the difference between the discharge measured upstream from the Bunkerville diversion dam (logger 8) and the discharge measured below the Bunkerville diversion dam (logger 10).
-
• The discharge of the return flow from the Bunkerville diversion canal was the difference between the discharge in the mainstem below the return flow (logger 12) and the discharge in the mainstem above the return flow (logger 10).
Evaluation of Potential Microhabitats
The microhabitat of an individual fish is its location at any point in time, and fish choose their microhabitats based on multiple parameters, including temperature (Baltz and others, 1987). Some potential locations that could hypothetically provide fish with a lower temperature microhabitat are shaded areas, the pools below diversion dams, diversion canals, and the bottom of the water column close to the riverbed.
Shade is known to create microhabitats for fish in a variety of settings (Jones and others, 1999; Naiman and Latterell, 2005; Broadmeadow and others, 2011). To evaluate the effect of shade, one logger (logger 3) was placed along the riverbank in an unshaded area. The second logger (logger 3a) was 200-ft downstream in a permanently shaded area beneath a north-facing cliff.
Pools below diversion dams have been hypothesized to have lower temperatures than the river above the dams, due both to their depth and the slow infiltration of water through the sediment trapped behind the dams. The potential for pools below diversion dams to be used as lower-temperature microhabitats was evaluated by placing loggers both immediately above and in the pools below the Mesquite diversion and the Bunkerville diversion.
The diversion canals have been observed to provide habitat for fish. Desert suckers, a USFWS species of concern (Rinne and Magaña, 2001), have been located in pools in the diversion canals during fish counts. The use of the diversion canals by fish may indicate that they are a favorable microhabitat. Therefore, we tested the possibility that the water temperatures in the diversion canals are cooler than the mainstem. For this study, two sets of paired mainstem/diversion canal sites were monitored in 2020. The first set included the mainstem Virgin River near Grapevine Road (logger 10) and the Bunkerville diversion canal below Grapevine Road (logger 11). The second set included the mainstem Virgin River at the Riverside Road bridge at Mesquite (logger 12) and the Bunkerville diversion canal below the bridge (logger 13).
Results and Discussion
Collected data include water temperatures, continuous discharge, and discrete discharges measured at the sites listed in table 1. The thermal regime was characterized by evaluating the magnitude (daily minimum and maximum temperature), variability (difference between upstream and downstream sites), frequency and duration (how often and for how long temperatures exceed established thresholds), and timing of thermal events. The thresholds used in this study are the BTM of 28 °C and the CTM of 31 °C established by the USFWS for Virgin River fishes.
The data from the study period were also used to characterize potential microhabitats along the lower Virgin River. Because there are many microhabitats within the lower Virgin River, comparisons were made between sites to better understand the spatial distribution and effects on water temperature.
Temperature
Continuous water temperature was collected in 15-minute increments from 15 sites along the lower Virgin River (table 1). From the 15-minute continuous data, daily minimum, mean, and maximum temperatures were computed for each site and are available on the USGS National Water Information System web interface (https://waterdata.usgs.gov/nwis; U.S. Geological Survey, 2024). All 15-minute continuous water-temperature datasets measured on the lower Virgin River for this study show a strong diel variation, which is common for desert rivers in the summer months (fig. 4). Minimum temperatures generally occurred between 4:00 and 6:00 a.m., and maximum temperatures between 1:00 and 3:00 p.m. Figure 4 shows a sample period of 15-minute data from July 19 to August 22, 2019, from three sites: Sand Hollow Wash, Scenic Bridge, and above Bunkerville diversion. Although there are minor differences in the magnitude and timing of peak temperatures, the daily temperature patterns between sites over 5 miles apart were comparable.
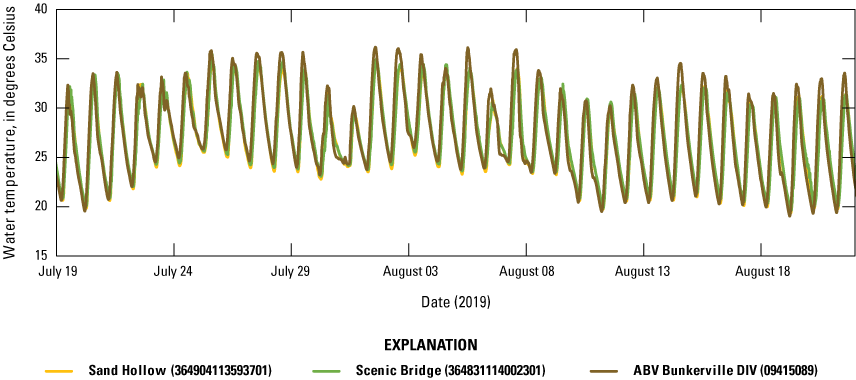
15-minute water temperature collected from three sites on the lower Virgin River in Arizona and Nevada, July–August 2019 (U.S. Geological Survey, 2024).
Average daily minimum, mean, and maximum temperatures for July 2020 were computed for six sites from the most upstream site (Littlefield, logger 2) to the most downstream site (Flattop, logger 14; table 2). Of the six sites included in table 2, the water temperature at logger 2 had the least variability in daily temperature (7.4 °C), likely because of the springs that discharge directly into the channel near the site at a near-constant temperature. The 5 sites downstream from logger 2 (loggers 3, 7, 8, 10, and 14) all had very similar mean daily minimum temperatures, mean temperatures, and mean daily maximum temperatures. For all five sites, the mean daily maximum temperature was greater than the CTM.
Table 2.
Average daily water temperature along the lower Virgin River in Arizona and Nevada in July 2020 (U.S. Geological Survey, 2024).[°C, degrees Celsius]
Summer maximum water temperatures were an important metric for this study because they can be compared to the critical thermal maximums of the fishes. Maximum temperatures were primarily affected by (1) distance downstream from cold spring inflow and (2) low flow. The cold springs (about 25 °C in summer months) around Beaver Dam Wash and Littlefield buffer the maximum temperatures in the summer, but the cooling effects of those springs do not persist as far downstream as Sand Hollow (logger 3). Periods of low flow result in shallow water depths and greater maximum water temperatures. The highest water temperature recorded in this study was 39.3 °C at logger 10 on July 10, 2021 (U.S. Geological Survey, 2024).
A typical longitudinal thermal gradient is presented on figure 5, showing maximum daily temperatures on August 15, 2020, the day in which peak temperatures occurred in the 2020 season. Beaver Dam Wash (a spring-fed creek) reached a maximum temperature of 24 °C. The Virgin River at Littlefield, 0.8 miles downstream from the Beaver Dam confluence, reached a maximum temperature of 30 °C, which is greater than the BTM but less than the CTM. All sites downstream from Beaver Dam Wash and Littlefield were several degrees above the CTM. Beaver Dam Wash and Littlefield are the only sites affected by spring flow.
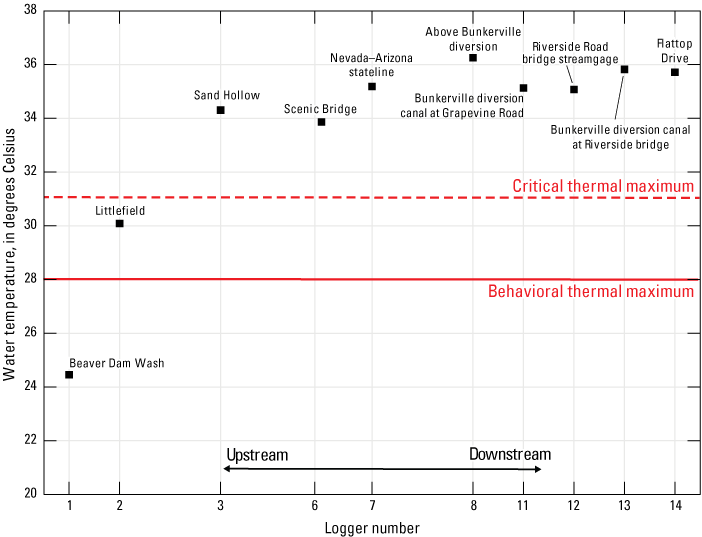
Daily maximum water temperature on August 15, 2020, at different locations along the lower Virgin River, Arizona and Nevada (U.S. Geological Survey, 2024).
The thermal maxima established by the USFWS were exceeded on many days during the study period. Table 3 shows the number of days the CTM was exceeded in August 2019, July and August 2020, and July and August 2021 for mainstem loggers that were deployed for all three years. The temperature at Littlefield exceeded the CTM on 10 days in July 2021 and did not exceed the CTM in any of the other months. Temperatures at the five sites downstream from Littlefield exceeded the CTM from 11 to 28 days in the months shown in table 3.
Table 3.
Number of days for which the maximum daily temperature recorded at six data loggers in the lower Virgin River in Arizona and Nevada exceeded the critical thermal maximum in August 2019, July and August 2020, and July and August 2021.[—, count not reported because more than 5 days of data are unavailable; NV, Nevada; AZ, Arizona; *, 5 days of data were unavailable in July 2021]
In addition to maximum daily temperatures exceeding the CTM, the daily duration of temperatures exceeding the BTM and CTM frequently exceeded 9–12 hours. Figure 6 shows the temperature recorded above the Bunkerville diversion, in which water temperatures were hotter than the BTM for more than 12 hours a day, and hotter than the CTM for almost 9 hours a day. The long duration of high temperatures over the course of the day was observed each year of the study period.
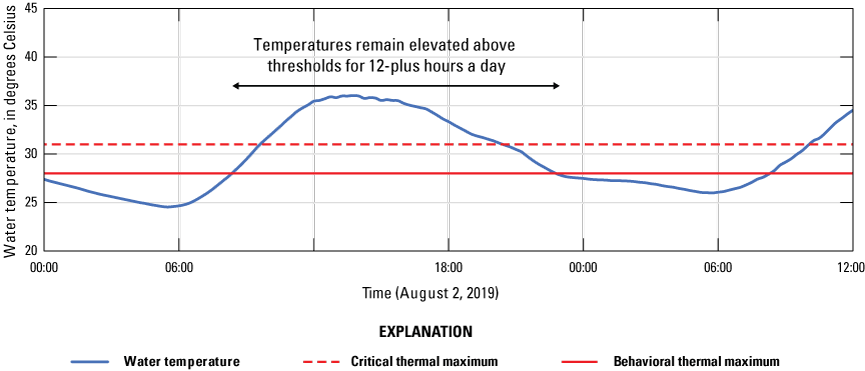
15-minute water temperatures on August 2, 2019, at 09415089 Virgin River above the Bunkerville diversion, Nevada (U.S. Geological Survey, 2024).
The total number of hours above the BTM and CTM in August of 2019, 2020, and 2021 were calculated for three sites, Littlefield (logger 2), Nevada/Arizona state line (logger 7), and Flattop (logger 14). These three sites were chosen because they had complete datasets for the month of August for each year of the study period, and they cover the length of the study area. Total hours above the BTM for the month of August ranged between 100 and 386 hours. Total hours above the CTM for the month of August ranged between 0 and 177 hours (fig. 7). Importantly, Littlefield exceeded the BTM about half as often as the downstream sites, did not exceed the CTM in August of 2020 and 2021, and only exceeded the CTM for 42 hours in 2019.
The upper Virgin River in Utah was monitored continuously for water temperature by the USFWS between 2005 and 2015 (Virgin River upstream from La Verkin Creek; U.S. Fish and Wildlife Service, 2020, p. 69). During this period, the Virgin River upstream from La Verkin Creek averaged less than 50 hours per year exceeding the CTM (greater than [>] 31 °C), with the exception of 2007, in which the CTM was exceeded for 150 hours. In comparison, the two sites on figure 7 downstream from Littlefield exceeded the CTM between 91 and 386 hours in the month of August alone.
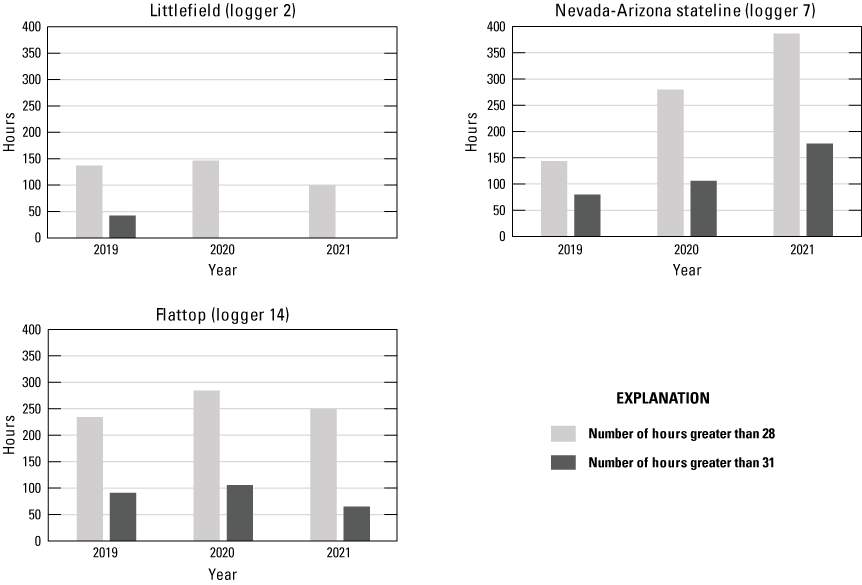
Total number of hours in August that instream temperatures exceeded behavioral thermal maximum (greater than [>] 28 degrees Celsius [°C]) and critical thermal maximum (>31 °C) in the lower Virgin River, Arizona and Nevada, 2019–21 (U.S. Geological Survey, 2024).
Evaluations of Potential Microhabitats
Over the three summers of the study period, an effort was made to evaluate potential microhabitats that fish biologists at USFWS and the Nevada Department of Wildlife suggested might be cooler than the mainstem of the river. At each potential microhabitat site, two loggers were deployed close together to determine if these microhabitats were cooler than the surrounding river reach. These paired comparison experiments are shown in table 4.
Table 4.
Loggers deployed to evaluate potential microhabitats, lower Virgin River, Arizona and Nevada, 2019–21.Sun/Shade
In 2020, two loggers were co-located on the mainstem of the Virgin River at Sand Hollow Wash to determine the effects of shaded microenvironments on the water temperature. Logger 3 was placed in the mainstem along the riverbank in open sun. Logger 3a was 200-ft downstream and was installed by drilling into a north-facing cliff, which put the logger in permanently shaded water. The continuous record for a representative 4-day period between August 27 and August 30, 2020, shows that the shaded and unshaded locations had nearly identical temperatures (fig. 8). The average difference in daily mean temperature between the sunny and shaded sites was 0.2 °C, which is within the accuracy of the instrument. The daily maximum temperatures for the shaded site are about 0.3–0.4 °C hotter than the unshaded site. It is not clear why it is slightly hotter in the shade than in the unshaded area.
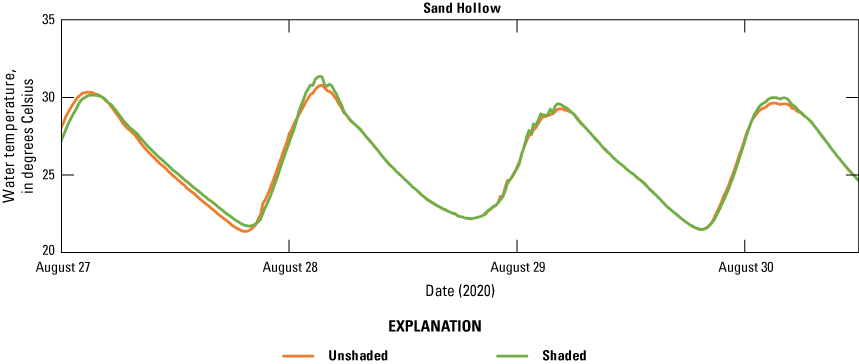
Water-temperature comparison between unshaded and shaded loggers at the Virgin River at Sand Hollow Wash near Littlefield, Arizona (364904113593701), August 27–30, 2020 (U.S. Geological Survey, 2024).
Above and Below Diversion Dam
In the summer of 2021, two loggers were placed upstream and downstream from the Mesquite diversion to determine the effects of the dam on the water temperature. Logger 4 was placed in the main channel upstream from the dam, and logger 5 was placed just downstream from the dam. Figure 9 shows the data from the two loggers between July 5 and July 13, 2021, a period of time when continuous data were available for both loggers. Differences in daily mean temperatures above and below the dam were less than 0.1 °C, within the accuracy of the instrument. However, the site below the dam (logger 5) had maximum temperatures as much as 0.9 °C lower than the upstream site (logger 4). This finding indicates that the impounded sediment may have a slight cooling effect on the water temperature during the hottest part of the day. However, this cooling effect was not sufficient to reduce water temperatures below the CTM.
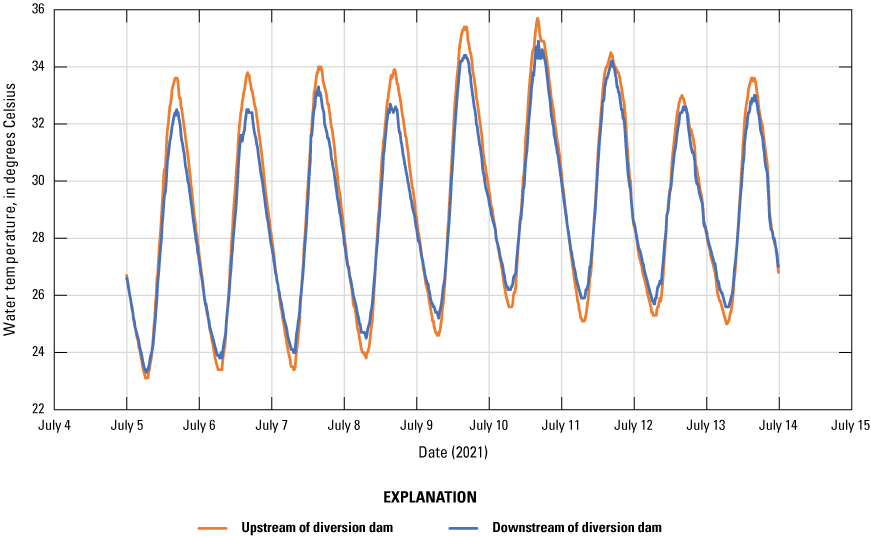
Water-temperature comparison between upstream (09415058) and downstream (364849114001301) from the Virgin River at the Mesquite diversion dam, Mesquite, Nevada, July 5–13, 2021 (U.S. Geological Survey, 2024).
In the summer of 2020, two loggers were co-located around the Bunkerville diversion to determine the effects of the dam on water temperature. One logger (logger 8) was placed in the main channel upstream from the dam, and one logger (logger 9) was placed downstream from the dam in a deep scour pool identified by the biologists as habitat that the native fishes favor. Figure 10 shows an eight-day temperature record from June 19 to June 27, 2020, for logger 8 and logger 9. The two records are nearly identical in temperature, with the average temperature above the dam only 0.2 °C higher than the average temperature below the dam. The data do not show a difference in the minimum temperatures during the June 19 to June 27, 2020, period.
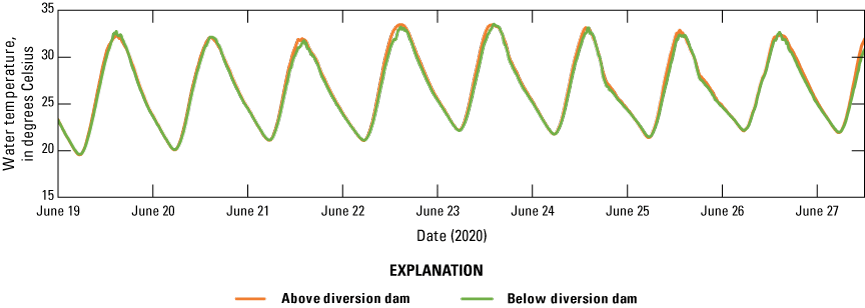
Water-temperature comparison between upstream (09415089) and downstream (094150891) from the Virgin River at the Bunkerville diversion dam, Mesquite, Nevada, June 19–27, 2020 (U.S. Geological Survey, 2024).
Mainstem and Diversion Canals
At the Grapevine Road site, one logger (logger 10) was placed in the mainstem channel, and a second logger (logger 11) was placed in the diversion canal. Periods of data when both sites had flow show that the main channel and the diversion canal were very similar in temperature. Figure 11A shows a 4-day temperature record from July 25 to July 29, 2020, for the Grapevine Road mainstem and diversion canal. The diversion canal measured slightly warmer average temperatures (+0.7 °C) than the mainstem during low stable flow conditions during this 4-day period. Discharge measurements taken at both sites on July 30 show similar discharges, with 8.7 ft3/s measured in the mainstem (logger 10) and 12.2 ft3/s measured in the diversion canal (logger 11). Despite the diversion canal having more flow than the mainstem on this day, the two temperature records are comparable.
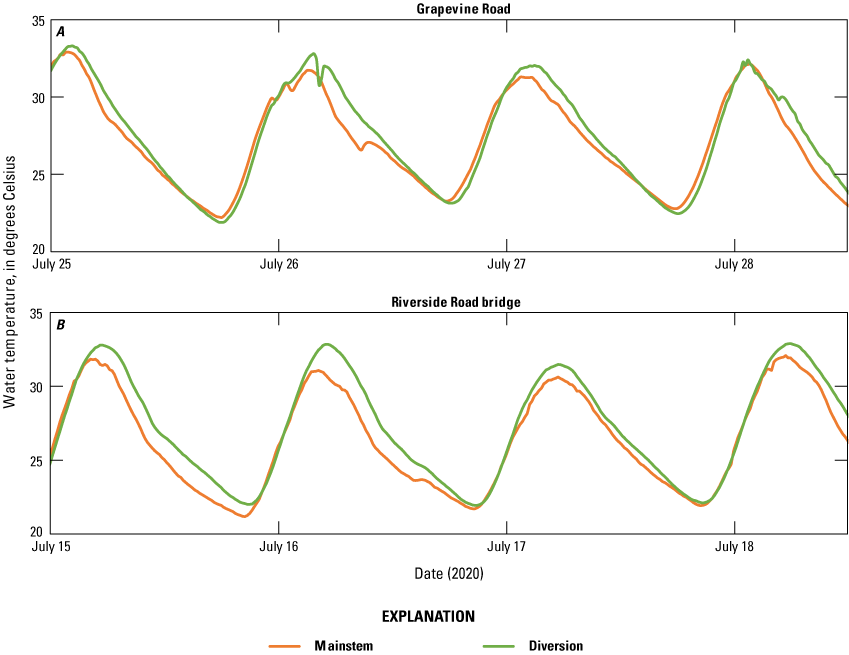
Water-temperature comparison between the mainstem of the Virgin River and the nearby diversion canal in two locations: A, at Grapevine Road (364737114050101); and B, at Riverside Road bridge in Mesquite (09415090), Nevada, July 2020 (U.S. Geological Survey, 2024).
A similar experiment was done at the downstream mainstem and diversion canal sites at the Riverside Road bridge in Mesquite. The mainstem logger (logger 12) was under the bridge, and the diversion canal logger (logger 13) was above the mouth of the diversion canal where flow returns to the river. Figure 11B shows a 4-day temperature record from July 15, 2020, to July 19, 2020, for the Riverside Road bridge in Mesquite mainstem and diversion canal. The diversion canal had slightly warmer average temperatures (+0.8 °C) than the mainstem during the low stable flow conditions during this 4-day period. Low stable flow conditions on these days ranged from 15 to 35 ft3/s, as measured by the Mesquite gage.
These two mainstem/diversion pairs show that the diversion canals are slightly warmer than the mainstem. This finding does not support the hypothesis that the diversion canals are a cooler microhabitat.
Discharge
Streamgage height and discharge were measured year-round at the Littlefield gage, the Mesquite gage, and the Mesquite canal gage. For the remaining temperature sites, discrete discharge measurements were taken during the summer monitoring period. Discrete measurements were made during two common hydrologic conditions: base flow and monsoon floods. Base flow represents normal conditions, or the flow in the river that occurs without the effect of runoff. Monsoon flows are floods that occur in response to precipitation events that occur during the summer monsoon season. Monsoon flows can be the result of local intense rainfall in the study area, or they can be the result of storms that occur in the upper headwaters of the Virgin River in Utah and travel downstream. Figure 12 shows daily mean discharge measured at Littlefield during the study period. In 2019, discharges were elevated in early June due to the above average water year (130-percent above average, USGS 09415000, water years 1930–2021) but were low throughout the summer with zero monsoon flow events. In 2020, one monsoon flow event with a maximum flow of 1,740 ft3/s occurred in August. In 2021, at least eight monsoon flow events occurred, three of which had maximum flows that exceeded 1,000 ft3/s.
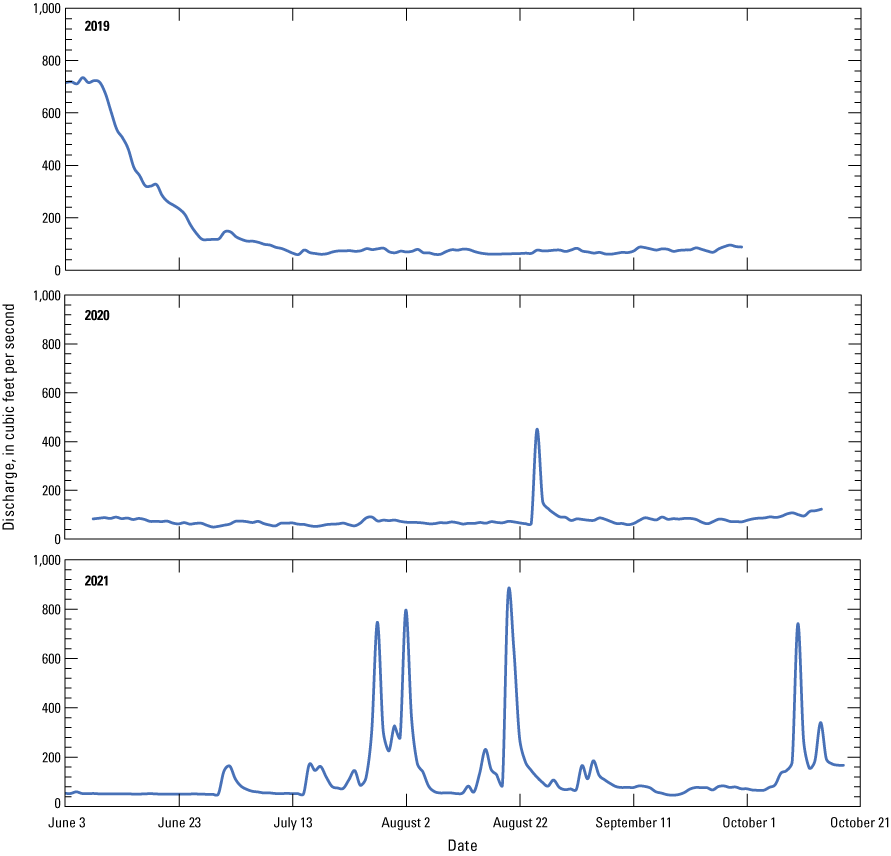
Daily mean discharge recorded at 09415000 Virgin River at Littlefield, Arizona, June through October, 2019–21 (U.S. Geological Survey, 2024).
Figure 13 shows a typical response following a monsoon event on June 30, 2021. Discharge rose from 51 ft3/s to 351 ft3/s in 5 hours and stayed elevated for about 4 days. In response, water temperature decreased below the CTM for 3 days. When 15-minute water temperatures are plotted with 15-minute discharge, the effects of the storms are evident: the added water lowers the temperatures by several degrees (fig. 13). However, as soon as the river returns to its previous state—usually a few days later—the water temperature rises again.
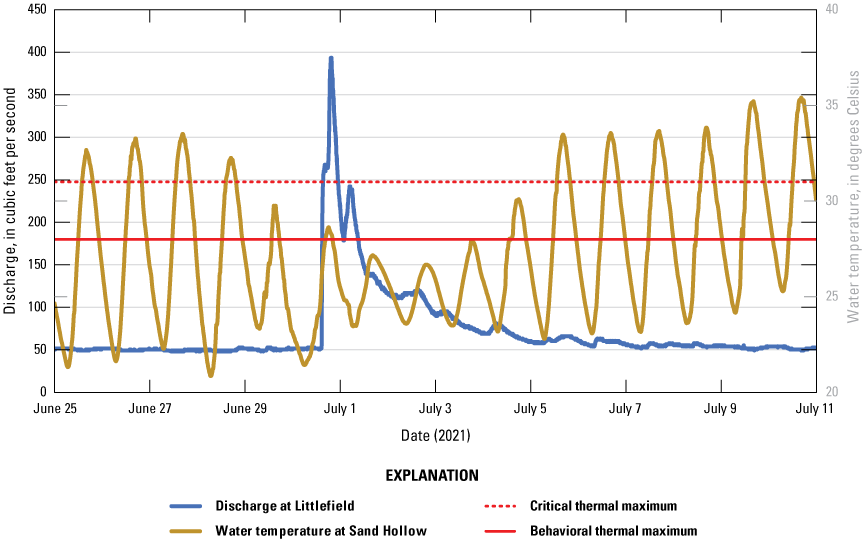
15-minute data showing the effects of a monsoon flood event recorded at 09415000 Virgin River at Littlefield on June 30, 2021, on water temperature recorded at 364904113593701 Virgin River at Sand Hollow Wash near Littlefield, Arizona (U.S. Geological Survey, 2024).
From June 9 to 15, 2021, discharge was measured at five points along the Virgin River (table 5). Flows ranged from 61.1 ft3/s above the Mesquite diversion (logger 4), which was the full unregulated flow of the river, to 1.4 ft3/s immediately below the Bunkerville diversion (logger 10). This extreme low flow occurs for a minimum length of 0.85 miles downstream from the Bunkerville diversion before return flows increase mainstem flows. Figure 14 shows a schematic of the mainstem and diversion discharges during the June 9–15, 2021, period. The good agreement between discharge at logger 4 (61.1 ft3/s) and the sum of the discharges at logger 15 and logger 8 (61.6 ft3/s) indicates that there is little or no flow gained or lost to groundwater in this reach. Below the Bunkerville diversion, approximately 29 times as much water is flowing in the diversion canal as in the mainstem of the river.
Table 5.
Measured discharges on the lower Virgin River, Nevada, June 9–15, 2021 (U.S. Geological Survey, 2024).[All measurements made between June 9 and 15, 2021. Abbreviation: ft3/s, cubic feet per second]
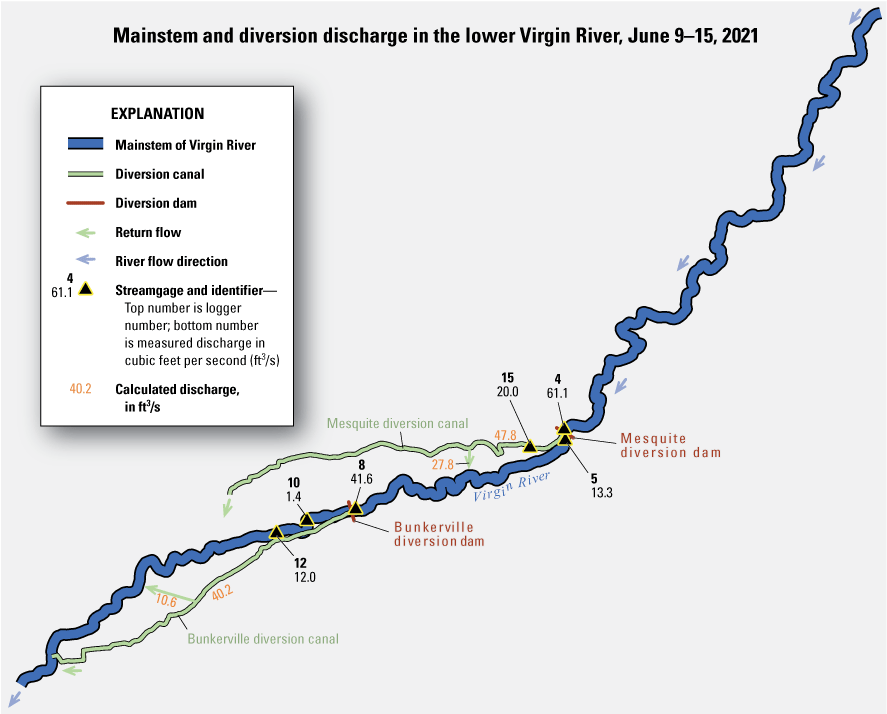
Mainstem and diversion discharge in the lower Virgin River, Nevada, June 9–15, 2021.
Figure 15 depicts the extreme low-flow conditions at the mainstem Virgin River at Grapevine Road on June 15, 2021. On this day, the channel had a maximum water depth of 0.3 feet (ft), discharge was measured at 1.4 ft3/s, and the maximum water temperature was recorded as 38 °C. For comparison, at the closest site upstream above the Bunkerville diversion, maximum water depth was 0.85 ft, discharge was measured at 41.6 ft3/s, and the maximum water temperature was recorded as 34.6 °C.
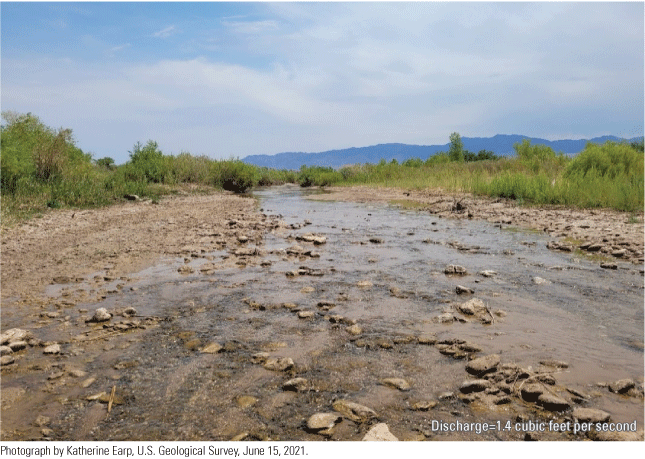
Extreme low-flow conditions observed on June 15, 2021, at site 36473711405101 Virgin River near Grapevine Road, Mesquite, Nevada.
Flow balances were used to understand the patterns of water into and out of the main stem of the lower Virgin River from irrigation diversions. This approach was applied to the study reach between the Littlefield and Bunkerville diversions to help determine the discharge in ungaged sections of the river. Field observations of diversion and return flow canals indicated that there are periods when the main channel reduces to a trickle of water downstream from the diversion dams. Below the Bunkerville diversion dam, a 2.7-mile reach was observed to have extreme low flow before substantial water was returned to the main stem channel via a return-flow canal downstream from the Riverside Road bridge in Mesquite. During one low-flow period from June 9 to 15, 2021, discharge in the Bunkerville diversion canal was calculated as 40.2 ft3/s, and discharge in the mainstem of the Virgin River at Grapevine Road was 1.4 ft3/s (table 5). During this period, the water depth at the Virgin River mainstem at Grapevine Road was less than 0.2 feet deep and water temperature was more than 38 °C. This finding indicates that most of the available water in this reach was in the diversion canals and not the river’s mainstem (fig. 14). During periods of more stable base flow, temperature records in paired comparison studies did not show a major difference between the mainstem and diversion canals (fig. 11), but the discharge record can provide insight as to why the diversion canals provide refuge for native fishes on the lower Virgin River.
Conclusions
Water temperatures in the lower Virgin River regularly exceeded thermal thresholds (the behavioral thermal maximum and the critical thermal maximum) used by the U.S. Fish and Wildlife Service during the study period. The water temperature was coolest in the upstream end of the study reach due to the effects of colder springs at Beaver Dam Wash and Littlefield, but that effect did not extend as far downstream as Sand Hollow. Downstream from the springs, the water temperature exceeded the critical thermal maximum 16–27 days per month in July and August. The highest recorded water temperature was 39.3 degrees Celsius.
An investigation of potential cooler microhabitats in different locations in the river and the diversion canals resulted in the detection of an area below the Mesquite diversion dam with slightly lower daily variations in water temperature than were observed immediately upstream, but temperatures in this microhabitat still exceeded the critical thermal maximum. Water temperature was independent of discharge at base flow conditions but was affected by discharge during extreme low and high flow events. Extreme low-flow events caused by irrigation diversions during low summer base flow resulted in little to no water flowing in reaches of the mainstem river downstream from diversion dams, which drastically increased the temperatures observed in the shallow flow. Elevated monsoon flows temporarily reduced water temperatures, but the effect only persisted for a few days.
References Cited
Asante, J., 2012, Evaluating recharge and dynamics of flow in the lower Virgin River Basin, USA—Interpretation of hydrochemical and stable isotopic data: Las Vegas, University of Nevada, Las Vegas, Ph.D. dissertation, 156 p., accessed April 16, 2025, at https://doi.org/10.34917/4332513.
Baltz, D.M., Vondracek, B., Brown, L.R., and Moyle, P.B., 1987, Influence of temperature on microhabitat choice by fishes in a California stream: Transactions of the American Fisheries Society, v. 116, no. 1, p. 12–20. [Available at https://doi.org/10.1577/1548-8659(1987)116%3C12:IOTOMC%3E2.0.CO;2.]
Beck, D.A., and Wilson, J.W., 2006, Synoptic discharge, water-property, and pH measurements for Muddy River Springs area and Muddy River, Nevada, February 7, 2001: U.S. Geological Survey Scientific Investigations Report 2006–5237, 12 p., accessed April 16, 2025, at https://doi.org/10.3133/sir20065237.
Broadmeadow, S.B., Jones, J.G., Langford, T.E.L., Shaw, P.J., and Nisbet, T.R., 2011, The influence of riparian shade on lowland stream water temperatures in southern England and their viability for brown trout: River Research and Applications, v. 27, no. 2, p. 226–237. [Available at https://doi.org/10.1002/rra.1354.]
Center for Biological Diversity, 2012, Petition to list the Virgin River spinedace lepidomeda mollispinis mollispinis as threatened or endangered under the Endangered Species Act, November 20, 2012: Center for Biological Diversity, Notice of Petition, 40 p., accessed October 3, 2024, at https://www.biologicaldiversity.org/species/fish/Virgin_River_spinedace/pdfs/Virgin_Spinedace_Petition.pdf.
Deacon, J.E., Schumann, P.B., and Stuenkel, E.L., 1987, Thermal tolerances and preferences of fishes of the Virgin River system (Utah, Arizona, Nevada): Great Basin Naturalist, v. 47, no. 4, article 14, p. 538–546. [Available at https://scholarsarchive.byu.edu/cgi/viewcontent.cgi?article=3598&context=gbn.]
Glancy, P.A., and Van Denburgh, A.S., 1969, Water-resources appraisal of the lower Virgin River Valley area, Nevada, Arizona, and Utah: Nevada Department of Water Resources and U.S. Geological Survey, Water Resources—Reconnaissance Series Report 51, 87 p., accessed July 21, 2025, at https://images.water.nv.gov/images/publications/recon%20reports/rpt51-lower_virgin_river_valley.pdf.
Gu, R., Montgomery, S., and Austin, T.A., 1998, Quantifying the effects of stream discharge on summer river temperature: Hydrological Sciences Journal, v. 43, no. 6, p. 885–904. [Available at https://doi.org/10.1080/02626669809492185.]
Holmes, W.F., Pyper, G.E., Gates, J.S., Schaefer, D.H., and Waddell, K.M., 1997, Hydrology and water quality of the Beaver Dam Wash area, Washington County, Utah, Lincoln County, Nevada, and Mohave County, Arizona: U.S. Geological Survey Water-Resources Investigations Report 97–4193, 71 p., accessed on July 25, 2024, at https://doi.org/10.3133/wri974193.
Jones, E.B.D., III, Helfman, G.S., Harper, J.O., and Bolstad, P.V., 1999, Effects of riparian forest removal on fish assemblages in southern Appalachian streams: Conservation Biology, v. 13, no. 6, p. 1454–1465. [Available at https://doi.org/10.1046/j.1523-1739.1999.98172.x.]
Kuta, E., 2021, The old irrigation dam on the Virgin River: Mesquite, Nev., Mesa Valleys Progress website, accessed July 17, 2023, at https://mvprogress.com/2021/04/14/the-old-irrigation-dam-on-the-virgin-river/.
Mantua, N., Tohver, I., and Hamlet, A., 2010, Climate change impacts on streamflow extremes and summertime stream temperature and their possible consequences for freshwater salmon habitat in Washington state: Climatic Change, v. 102, p. 187–223, accessed April 3, 2024, at https://doi.org/10.1007/s10584-010-9845-2.
Naiman, R.J., and Latterell, J.J., 2005, Principles for linking fish habitat to fisheries management and conservation: Journal of Fish Biology, v. 67, issue sB, p. 166–185. [Available at https://doi.org/10.1111/j.0022-1112.2005.00921.x.]
Onset, 2023a, HOBO TidbiT v2 water temperature data logger (UTBI-001) manual: Onset website, accessed September 21, 2023, at https://www.onsetcomp.com/products/data-loggers/utbi-001#specifications.
Onset, 2023b, HOBO TidbiT MX temperature 5000-ft data logger (MX2204) manual: Onset website, accessed September 21, 2023, at https://www.onsetcomp.com/products/data-loggers/mx2204.
Rinne, J.N., and Magaña, H.A., 2001, Fact sheet on the status/trends/threats of the desert sucker (Catostomus clarki)—BISON No. 010500: Forest Service, U.S. Department of Agriculture website, 7 p., accessed December 12, 2023, at https://www.fs.usda.gov/rm/boise/AWAE/projects/fish_cattle/Desert%20sucker.pdf.
Rinne, J.N., and Minckley, W.L., 1991, Native fishes of arid lands—A dwindling resource of the desert southwest—General Technical Report RM-GTR-206: Fort Collins, Colo., U.S. Department of Agriculture, Forest Service, Rocky Mountain Forest and Range Experiment Station, 45 p. [Available at https://research.fs.usda.gov/treesearch/41168.]
Stoffle, R.W., Van Vlack, K., Caroll, A.K., Chmara-Huff, F., and Martinez, A., 2005, Yanawant—Paiute places and landscapes in the Arizona Strip—Volume one of the Arizona Strip landscapes and place name study: St. George, Utah, Published for the Bureau of Land Management, Arizona Strip Field Office, 274 p., accessed July 17, 2023, at http://npshistory.com/publications/para/yanawant-1.pdf.
Trudeau, D.A., Hess, J.W., and Jacobson, R.L., 1983, Hydrogeology of the Littlefield Springs, Arizona: Groundwater, v. 21, no. 3, p. 325–333. [Available at https://doi.org/10.1111/j.1745-6584.1983.tb00732.x.]
Turnipseed, D.P., and Sauer, V.B., 2010, Discharge measurements at gaging stations: U.S. Geological Survey Techniques and Methods, book 3, chap. A8, 87 p., accessed June 12, 2023, at https://doi.org/10.3133/tm3A8.
U.S. Fish and Wildlife Service, 2000, Endangered and threatened wildlife and plants—Designation of critical habitat for the Woundfin and Virgin River Chub: Federal Register, v. 65, no. 17, p. 4140–4155, accessed July 22, 2024, at https://www.federalregister.gov/documents/2000/01/26/00-1746/endangered-and-threatened-wildlife-and-plants-designation-of-critical-habitat-for-the-wou ndfin-and.
U.S. Fish and Wildlife Service, 2008, The Virgin River fishes, 5-year review—Summary and evaluation: West Valley City, Utah, U.S. Fish and Wildlife Service, Utah Field Office, 71 p., accessed September 29, 2023, at https://ecosphere-documents-production-public.s3.amazonaws.com/sams/public_docs/species_nonpublish/1237.pdf.
U.S. Fish and Wildlife Service, 2020, The Virgin River fishes 5 year Review—Summary and Evaluation: West Valley City, Utah, U.S. Fish and Wildlife Service, Utah Field Office, 137 p., accessed July 22, 2024, at https://ecos.fws.gov/docs/five_year_review/doc6414.pdf.
U.S. Fish and Wildlife Service, 2021, Endangered and threatened wildlife and plants—17 species not warranted for listing as endangered or threatened species [proposed rule]: Federal Register, v. 86, no. 184, p. 53255–53261, accessed October 3, 2024, at https://www.federalregister.gov/documents/2021/09/27/2021-20823/endangered-and-threatened-wildlife-and-plants-17-species-not-warranted-for-listing-as- endangered-or.
U.S. Geological Survey, 2024, USGS water data for the Nation: U.S. Geological Survey database, accessed July 29, 2024, at https://doi.org/10.5066/F7P55KJN.
Wagner, R.J., Boulger, R.W., Jr., Oblinger, C.J., and Smith, B.A., 2006, Guidelines and standard procedures for continuous water-quality monitors—Station operation, record computation, and data reporting: U.S. Geological Survey Techniques and Methods, book 1, chap. D3, 51 p. + 8 attachments, accessed April 10, 2024, at https://pubs.usgs.gov/tm/2006/tm1D3/.
Conversion Factors
Supplemental Information
A water year is the 12-month period from October 1 through September 30 of the following year and is designated by the calendar year in which it ends.
For more information concerning the research in this report, contact the
Nevada Water Science Center
U.S. Geological Survey
2730 N. Deer Run Road, Suite 3
Carson City, Nevada 89701
https://www.usgs.gov/centers/nevada-water-science-center
Publishing support provided by the Science Publishing Network,
Sacramento Publishing Service Center
Disclaimers
Any use of trade, firm, or product names is for descriptive purposes only and does not imply endorsement by the U.S. Government.
Although this information product, for the most part, is in the public domain, it also may contain copyrighted materials as noted in the text. Permission to reproduce copyrighted items must be secured from the copyright owner.
Suggested Citation
Earp, K.J., 2025, Analysis of summer water temperatures of the lower Virgin River near Mesquite, Nevada, 2019–21: U.S. Geological Survey Scientific Investigations Report 2025–5065, 23 p., https://doi.org/10.3133/sir20255065.
ISSN: 2328-0328 (online)
Study Area
| Publication type | Report |
|---|---|
| Publication Subtype | USGS Numbered Series |
| Title | Analysis of summer water temperatures of the lower Virgin River near Mesquite, Nevada, 2019–21 |
| Series title | Scientific Investigations Report |
| Series number | 2025-5065 |
| DOI | 10.3133/sir20255065 |
| Publication Date | August 01, 2025 |
| Year Published | 2025 |
| Language | English |
| Publisher | U.S. Geological Survey |
| Publisher location | Reston, VA |
| Contributing office(s) | Nevada Water Science Center |
| Description | viii, 23 p. |
| Country | United States |
| State | Arizona, Nevada |
| City | Mesquite |
| Other Geospatial | lower Virgin River |
| Online Only (Y/N) | Y |