

Simulated Hydrologic Responses to Proposed Wastewater-Return-Flow Scenarios in Falmouth, Massachusetts
Links
- Document: Report (4.75 MB pdf) , HTML , XML
- Data Release: USGS data release - MODFLOW-2005 groundwater flow model used to simulate wastewater-return-flow scenarios in Falmouth, Massachusetts
- Version History: Version History (694 B txt)
- Download citation as: RIS | Dublin Core
Acknowledgments
The authors would like to thank Amy Lowell of the Town of Falmouth and Anastasia Rudenko of GHD for their support and collaboration. The authors also thank Denis LeBlanc and Donald Walter of the U.S. Geological Survey for their substantive technical reviews.
Abstract
The Cape Cod aquifer is the sole source of drinking water for communities on Cape Cod, Massachusetts, including the Town of Falmouth, where the aquifer is currently threatened by contamination from septic-system-derived nitrogen. To address this problem, the Town is proposing to sewer areas of Falmouth, treat the wastewater at the Town’s Main Wastewater Treatment Facility (a nitrogen removing/tertiary treatment facility), and discharge the treated wastewater to an ocean outfall pipe in Nantucket Sound.
The U.S. Geological Survey, in cooperation with the Town of Falmouth, updated a three-dimensional steady-state groundwater flow model to represent current (defined as 2019–23) average hydrologic conditions and to simulate the long-term average freshwater hydrologic response to two wastewater-return flow scenarios. Scenario 1 involves the sewering of all properties south of Route 28 in Falmouth, which approximates the Town’s possible sewer expansion over the next 20–30 years. Scenario 2 involves sewering of all properties in Falmouth to demonstrate the maximum potential effect of sewering on the aquifer.
Overall, the simulated hydrologic response of water-table altitudes and streamflow in both scenarios was relatively small compared to fluctuations from natural recharge. In scenario 1, the water-table altitude decreased by about 0.1 feet south of Route 28, where the conversion to municipal sewers removed wastewater-return flow from onsite septic systems. The water-table altitude decreased by about 0.1–0.2 feet over a larger area in Falmouth under town-wide sewering in scenario 2. The greatest decrease in water-table altitude in both scenarios occurred near the Main Wastewater Treatment Facility, with a decrease of about 1.1 feet in scenario 1 and about 1.3 feet in scenario 2.
Simulated decreases in streamflow also were estimated for six selected streams in Falmouth and Mashpee. In both scenarios, the largest simulated decreases in streamflow were at the Coonamessett River, which is the closest stream to the Main Wastewater Treatment Facility. In scenario 1, the average annual decrease in flow at the Coonamessett River was 0.1 cubic feet per second, a 1.1 percent decrease from current (2019–23) conditions. In scenario 2, streamflow at the Coonamessett River decreased by 0.6 cubic feet per second, a 5.4 percent decrease from current (2019–23) conditions.
Introduction
The Town of Falmouth, Massachusetts, on western Cape Cod (fig. 1) is evaluating strategies to reduce nitrogen loading to groundwater discharge and streams, which contributes to the ecological impairment and eutrophication of coastal embayments and estuaries (Nixon, 1995). Changes to wastewater-return-flow practices, including the installation of an ocean outfall pipe and conversion of additional properties in Falmouth from onsite septic systems to municipal sewers, are being considered as potential nitrogen-management actions. The sole source of drinking water for communities on Cape Cod, including Falmouth, is the Cape Cod aquifer, which consists of six hydraulically separate groundwater flow lenses (Masterson and Walter, 2009). The Sagamore flow lens that underlies Falmouth is the largest and westernmost groundwater flow lens on Cape Cod (Masterson and Walter, 2009).
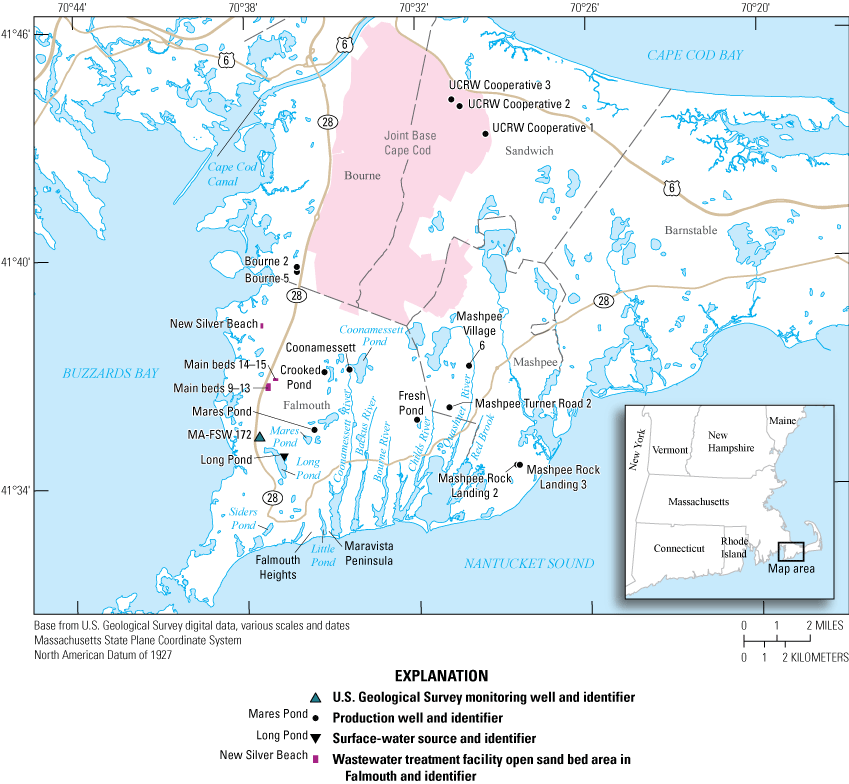
Map showing the study area on western Cape Cod, Massachusetts, including the Town of Falmouth, and the locations of wastewater treatment facilities, water production wells, and a surface water source. [UCRW, Upper Cape Regional Water]
Nitrogen pollution is an issue affecting coastal communities across the United States, including those on Cape Cod (Howarth and others, 2000). Total maximum daily loads (TMDLs) for nitrogen have been developed for more than half of the estuaries on Cape Cod, including those in Falmouth, where excess nitrogen has resulted in degraded water quality and clarity, algal blooms, and marine habitat loss (Massachusetts Estuaries Project, 2024). TMDLs provide science-based goals for reducing nitrogen loads to coastal waters to achieve desired ecological outcomes by identifying the greatest amount of a pollutant that a water body can receive while meeting water quality standards (Birkeland, 2001). Wastewater-return flow from onsite wastewater treatment systems (which, in Falmouth, are mostly conventional septic systems) is enriched in nitrogen and is a major contributor to regional groundwater contamination, contributing to about 80 percent of nitrogen that enters Cape Cod’s watersheds (U.S. Environmental Protection Agency, 1977; Cape Cod Commission, 2015). The Cape Cod aquifer is particularly vulnerable to nitrogen contamination because water quickly infiltrates the sandy soils and flows rapidly through the permeable unconsolidated coarse-grained sediments that compose the aquifer (LeBlanc, 1984; Walter and others, 2004).
The Town of Falmouth currently operates two wastewater treatment facilities that discharge treated wastewater to open sand beds: the Main Wastewater Treatment Facility (WWTF) located in western Falmouth, and the smaller New Silver Beach WWTF that serves a coastal neighborhood in northern Falmouth (fig. 1).
The Main WWTF removes more than 90 percent of nitrogen from wastewater during the treatment process; however, as of 2023, only about 11 percent of developed properties in Falmouth are connected to the municipal sewer system, with the remaining served by septic systems (Geist, 2023). To address the nitrogen loads that exceed the TMDLs, the Town is considering expanding the sewer system, treating the additional wastewater at the Town’s Main WWTF and discharging that treated wastewater to an ocean outfall pipe (Amy Lowell, Town of Falmouth, written commun., 2024). This plan would reroute treated wastewater from its current discharge location at the Main WWTF, which is in the watersheds of West Falmouth Harbor and Buzzards Bay, directly to Nantucket Sound (fig. 1).
The U.S. Geological Survey (USGS), in cooperation with the Town of Falmouth, modeled potential hydrologic responses for two wastewater-return flow scenarios that represent a decrease in wastewater-return flow to the groundwater system that would occur with the installation of an ocean outfall pipe and the connection of additional properties to the municipal sewer system. The goal of this modeling effort was to examine the effect that these proposed actions would have on the hydrologic system, including water-table altitudes and streamflow. An existing USGS three-dimensional, steady-state groundwater flow model (Walter and others, 2019) was updated to current (2019–23) water-supply pumping and wastewater-return-flow conditions and used to simulate average long-term changes in water-table altitude and streamflow in and near Falmouth that could result from the two proposed wastewater-return-flow scenarios.
Purpose and Scope
The purpose of this report is to present simulated changes to the water-table altitude and streamflow in Falmouth, Cape Cod, relative to current (2019–23) average conditions for two wastewater-return flow scenarios requested by the Town of Falmouth. This report describes the groundwater flow model that was used for these simulations and the results of those simulations, as well as discusses the limitations of the modeling analysis. All numerical model input and output files are available in the USGS data release that accompanies this report (Goldstein and McCobb, 2025).
Geographic and Hydrologic Setting
The aquifer system underlying Falmouth is composed of highly permeable unconsolidated glacial sediments, which are about 300 feet (ft) thick in some areas (Fairchild and others, 2013) and is bounded below by relatively impermeable bedrock, above by the water table, and laterally by saltwater (LeBlanc and others, 1986). The sediments underlying Cape Cod were deposited in environments marginal to continental ice sheets during the Wisconsinan glaciation about 18,000 years ago and consist of gravel, sand, silt, and clay deposited in moraines and coalescing deltaic systems (Giese and others, 2015; Larson, 1982). Glacial deltaic sediments generally have a fining-downward sequence with coarse-grained fluvial outwash underlain by finer grained glaciolacustrine sediments (Masterson and others, 1997).
There is a groundwater divide to the northeast of Falmouth from which groundwater flows radially outward from the high point at the divide towards the coast (Masterson and Walter, 2009). Groundwater in Falmouth generally flows in a southerly to southwesterly direction and ultimately discharges to coastal waters as direct-groundwater discharge or streamflow (Savoie, 1995). The water table in Falmouth ranges in altitude from 0 ft above the National Geodetic Vertical Datum of 1929 (NGVD 29; referred to as the sea level in this report) at the coast to about 50 ft above sea level near the town’s northeastern border (Savoie, 1995).
Groundwater and surface water (such as ponds and streams) in the hydrologic system on Cape Cod are hydraulically connected, composing a single freshwater resource (Winter and others, 1998) called the Cape Cod aquifer system. Streams in Falmouth and the bordering Town of Mashpee (listed from west to east) include the Coonamessett River, Backus River, Bourne River, Childs River, Quashnet River, and Red Brook (fig. 1). These streams are baseflow dominated, meaning they receive most of their flow from direct-groundwater discharge across the streambeds (LeBlanc and others, 1986). Numerous freshwater ponds in Falmouth are within glacial kettle hole depressions (formed by retreating glaciers), the largest of which is Coonamessett Pond (Oldale, 2001; Giese and others, 2015; fig. 1). Kettle ponds are flow-through ponds that receive groundwater discharge in upgradient areas and contribute water back to the aquifer in downgradient areas or are drained by streams (Hull and others, 2019). Long Pond, another kettle pond in southwestern Falmouth, is used as a water source by the town.
Recharge at the water table is the sole source of water for the aquifer. Natural recharge from precipitation is augmented in some areas by infiltration of wastewater-return flow from septic systems and at centralized WWTFs. These WWTFs have the potential to locally raise the water table in their vicinities, where water is returned to the aquifer away from the area it was pumped for municipal supply (Masterson and Walter, 2009). The average natural recharge to the Sagamore flow lens from 1995–2000 was about 27 inches per year (Walter and others, 2019). Groundwater discharges directly to coastal waters as submarine discharge and indirectly as streamflow, and is pumped from production wells for public supply. Discharge to coastal waters accounts for about 65 percent of total outflow, and discharge to streams accounts for about 28 percent of total outflow (Walter and Whealan, 2005). About 7 percent of total outflow is withdrawn from public-supply wells (Walter and Whealan, 2005).
The water supply for the Town of Falmouth is withdrawn from Long Pond, four production wells located within Falmouth, and three production wells operated by the Upper Cape Regional Water (UCRW) Cooperative located to the north of Joint Base Cape Cod (fig. 1). From 2019–23, the average withdrawal from Long Pond was 382,170 cubic feet per day (ft3/d), which accounted for about 64 percent of Falmouth’s municipal supply (table 1; fig. 2A). Two-thirds of annual groundwater withdrawals from 1995–2000 occurred between the months of May and September (Walter and Whealan, 2005).
Table 1.
Water-supply withdrawal rates for the 2010 hydrologic condition (Walter and others, 2019), current (2019–23) hydrologic condition, scenario 1, and scenario 2.[WWTF, wastewater treatment facility; UCRW, Upper Cape Regional Water; ft3/d, cubic feet per day]
| Source name | 2010 hydrologic condition (Walter and others, 2019) | Current (2019–23) hydrologic condition | Scenario 1 All properties south of Route 28 in Falmouth connected to municipal sewers, Main WWTF wastewater-return flow removed |
Scenario 2 All properties in Falmouth connected to municipal sewers, Main WWTF wastewater-return flow removed |
|---|---|---|---|---|
| Long Pond | 370,985 | 382,170 | 382,170 | 382,170 |
| Fresh Pond Well | 26,593 | 13,383 | 13,383 | 13,383 |
| Coonamessett Well | 25,714 | 50,462 | 50,462 | 50,462 |
| Mares Pond Well | 0 | 21,970 | 21,970 | 21,970 |
| Crooked Pond Well | 74,458 | 61,816 | 61,816 | 61,816 |
| UCRW Cooperative (3 wells)1 | 61,336 | 68,458 | 68,458 | 68,458 |
| Total pumping | 559,087 | 598,259 | 598,259 | 598,259 |
| Bourne Well 2 | 18,616 | 23,972 | 23,972 | 23,972 |
| Bourne Well 5 | 29,234 | 16,918 | 16,918 | 16,918 |
| Mashpee Rock Landing Well 2 | 25,667 | 37,269 | 37,269 | 37,269 |
| Mashpee Rock Landing Well 3 | 29,626 | 38,566 | 38,566 | 38,566 |
| Mashpee Village Well 6 | 21,872 | 25,182 | 25,182 | 25,182 |
| Mashpee Turner Road Well 2 | 0 | 10,889 | 10,889 | 10,889 |
| UCRW Cooperative (3 wells)3 | 113,519 | 80,380 | 80,380 | 80,380 |
Water purchased by Falmouth from the UCRW Cooperative. Included to account for the total water withdrawals for Falmouth municipal supply.
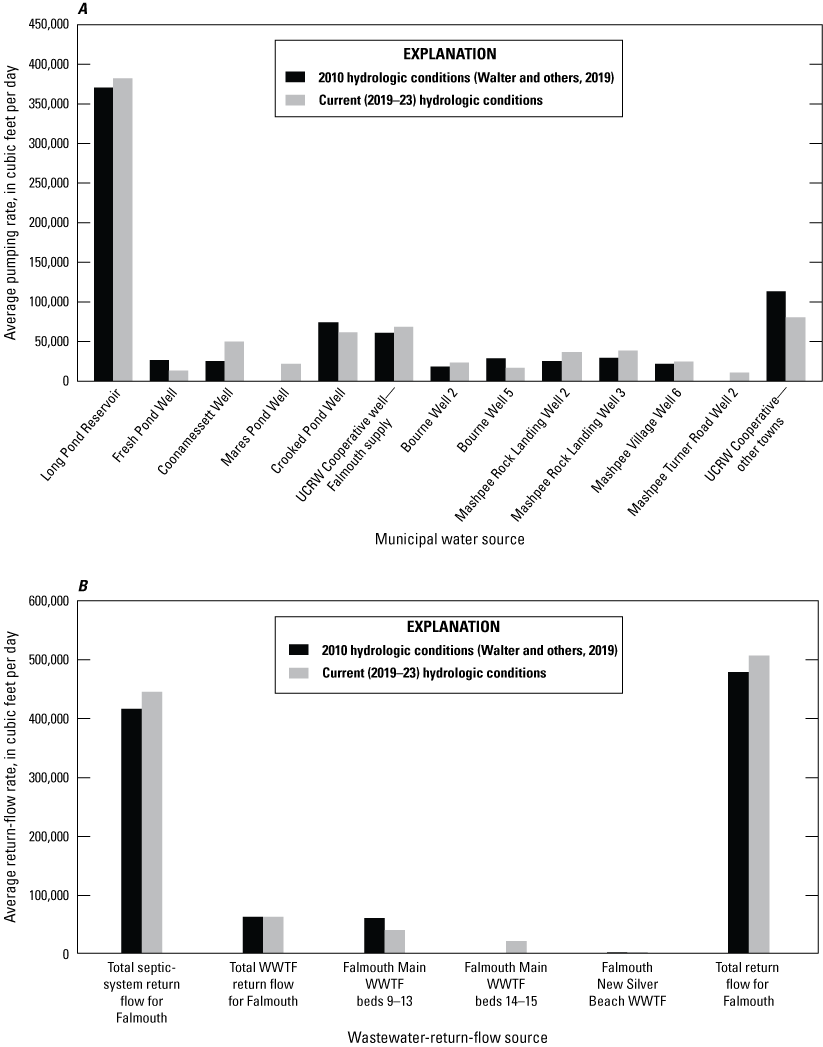
Graphs showing groundwater withdrawal and wastewater-return-flow rates for A, 2010 hydrologic condition (Walter and others, 2019) and B, current (2019–23) hydrologic condition. [WWTF, wastewater treatment facility; UCRW, Upper Cape Regional Water]
At the Main and New Silver Beach WWTFs, treated wastewater recharges the aquifer through open sand beds. The majority of wastewater-return flow at the WWTFs occurs at the Main WWTF, which, from 2019–23, had an annual average return-flow rate of 39,375 ft3/d at beds 9–13 and 20,199 ft3/d at beds 14–15 (table 2; fig. 2B). The New Silver Beach WWTF had an annual average return-flow rate of 2,133 ft3/d from 2019–23 (table 2; fig. 2B). Most wastewater (443,811 ft3/d or 88 percent of the total) recharges the aquifer through individual septic systems (table 2; fig. 2B). Untreated septic system effluent has substantially higher concentrations of nitrogen than treated effluent and is a major source of excess nitrogen in coastal waters (U.S. Environmental Protection Agency, 1977).
Table 2.
Wastewater-return-flow rates for the 2010 hydrologic condition (Walter and others, 2019), current (2019–23) hydrologic condition, scenario 1, and scenario 2.[WWTF, wastewater treatment facility; ft3/d, cubic feet per day; —, not applicable]
| Source | 2010 hydrologic condition (Walter and others, 2019) | Current (2019–23) hydrologic condition | Scenario 1 All properties south of Route 28 in Falmouth connected to municipal sewers, Main WWTF wastewater-return flow removed |
Scenario 2 All properties in Falmouth connected to municipal sewers, Main WWTF wastewater-return flow removed |
|
|---|---|---|---|---|---|
| Septic-system return flow for Falmouth | Average return-flow rate (ft3/d) | 415,066 | 443,811 | 323,042 | 0 |
| Change from 2019–23 conditions (ft3/d) | — | — | −120,769 | −443,811 | |
| Change from 2019–23 conditions (percent) | — | — | −27.2 | −100.0 | |
| WWTF return flow for Falmouth | Total return | 61,668 | 61,707 | 2,133 | 2,133 |
| Falmouth Main WWTF beds 9–13 (ft3/d) | 60,156 | 39,375 | 0 | 0 | |
| Falmouth Main WWTF beds 14–15 (ft3/d) | 0 | 20,199 | 0 | 0 | |
| Falmouth New Silver Beach WWTF (ft3/d) | 1,512 | 2,133 | 2,133 | 2,133 | |
| Total return flow for Falmouth | Average return-flow rate (ft3/d) | 476,734 | 505,518 | 325,175 | 2,133 |
| Change from 2019–23 conditions (ft3/d) | — | — | −180,343 | −503,385 | |
| Change from 2019–23 conditions (percent) | — | — | −35.7 | −99.6 | |
Updates to the Existing Regional Groundwater Flow Model
The USGS MODFLOW-2005 (Harbaugh, 2005) three-dimensional, steady-state groundwater flow model described in Walter and others (2019) was used to simulate hydrologic conditions in 2010 around Joint Base Cape Cod, including heads, streamflows, and advective transport. A steady-state model represents long-term, average conditions with balanced inflows, outflows, and static (or constant) hydrologic conditions (water levels, streamflow, recharge, and discharge). Time-varying hydraulic conditions (including groundwater storage) are not represented or simulated in a steady-state model. Model inputs representing the locations and rates of groundwater pumping and wastewater-return flow in Falmouth were updated for this study to simulate average hydraulic conditions from 2019–23. The updated model representing current (2019–23) conditions was then used to simulate the response of water-table altitudes and streamflow to potential changes in wastewater-return-flow rates in Falmouth. The hydrogeologic framework of the model, including model layers and hydrogeologic properties, remained unchanged and only the stresses to the model were adjusted, so the model was not recalibrated. Details of the calibration process for the existing model can be found in Walter and others (2019).
Existing Groundwater Flow Model
The existing USGS MODFLOW-2005 groundwater flow model simulates steady-state flow in the Sagamore flow lens of the Cape Cod aquifer (Walter and others, 2019). The model is a three-dimensional grid divided into even cells that are 400 ft on each side and consists of 32 layers of varying thickness (Walter and others, 2019). The upper boundary is the simulated position of the water table (Masterson, 2004; Walter and Whealan, 2005; Masterson and others, 2009), the altitude of land surface at streams, or the altitude of the seabed at coastal boundaries. The lower boundary is the bedrock surface or the freshwater-saltwater interface. The position of the interface was derived from a dynamic interface model developed by Walter and others (2016); this model used the Seawater Intrusion (SWI2) package (Bakker and others, 2013), which balances flow and two-solution densities to estimate the freshwater-saltwater interface position beneath the Sagamore and Monomoy flow lenses (Walter and others, 2016). The interface position from that analysis was mapped to the groundwater model grid and is represented as a fixed position in the simulations.
Inflows to the groundwater system in the model include natural recharge from precipitation and recharge from wastewater-return flow from both WWTFs and septic systems. Initial rates of natural recharge from precipitation were estimated using a Soil-Water Balance model and adjusted during calibration, which resulted in spatially variable recharge with a mean of 27.3 inches per year (Walter and others, 2019). Wastewater-return flows from both WWTFs and septic systems are accounted for as separate components of the total simulated recharge in the model. Recharge from onsite septic systems was derived from parcel-scale water-use data (Massachusetts Estuaries Project, 2024) that were mapped to the groundwater-model grid (Walter and others, 2019).
Modeled outflows include specified groundwater withdrawals from production wells, surface water withdrawals from Long Pond, and discharge to coastal waters and streams. Ponds in the model, including Long Pond, are represented as areas with essentially infinite horizontal and vertical hydraulic conductivities of 100,000 and 10,000 feet per day (ft/d), respectively, to allow the pond-water levels to respond uniformly to changes in hydraulic stresses across the pond area (Walter and others, 2019). Streams in the model are represented as head-dependent flux boundaries using the Drain Package in MODFLOW-2005, where flow into a model cell representing a stream reach is proportional to the simulated hydraulic gradient across the streambed. As a result, the model can only simulate discharge from the groundwater system to streams, and not potential inflows from streams to the groundwater system. This simplified approach is appropriate for this model scale and for predominantly gaining streams, such as those that generally occur on Cape Cod.
Current (2019–23) Condition
The model described in Walter and others (2019) was calibrated using average hydrologic data, pumping stresses, and recharge data from 1995–2000; this calibrated model was then used by Walter and others (2019) to simulate hydrologic conditions in 2010 and “future” conditions in 2030. For the analyses in this report, the “current” hydrologic condition was updated using average pumping and recharge stresses from 2019–23 and represents average conditions for that period. Recharge from precipitation, parcel-scale distribution of septic-system wastewater-return flow in Falmouth, and pumping and wastewater-return-flow rates for towns outside of Falmouth (other than production wells located within 2 miles of the Falmouth town border) were not updated from the average 2010 conditions simulated in the model described in Walter and others (2019) as “current,” since the focus of this study was on the Town of Falmouth.
Total annual water withdrawal data for 2019–23 were provided by the Town of Falmouth Water Division for the town’s production wells and surface-water supply source at Long Pond, by water suppliers in the towns of Bourne (Bourne Water District) and Mashpee (Mashpee Water District) for production wells in those towns that are within 2 miles of the Falmouth border, and by the Upper Cape Regional Water (UCRW) Cooperative (table 1; fig. 2A; Goldstein and McCobb, 2025). The UCRW Cooperative provides drinking water to towns on Cape Cod, including Falmouth, to meet shortfalls in supply. The UCRW Cooperative has three production wells located to the north of Joint Base Cape Cod in the Town of Sandwich. The total average 2019–23 withdrawal at production wells used for Falmouth public supply was 598,259 ft3/d, a 7-percent increase over the total average withdrawal in 2010 (table 1; fig. 2A).
Wastewater-return-flow rates for 2019–23 at the Main WWTF and New Silver Beach WWTF in Falmouth were obtained from the Town of Falmouth (table 2; fig. 2B; Goldstein and McCobb, 2025). Overall, the trend of wastewater-return-flow rates at the WWTFs increases over time between 2010 and 2023, but the averages for 2010 and 2019–23 were relatively similar: the average total WWTF return-flow rate for Falmouth was 61,668 ft3/d in 2010 and 61,707 ft3/d in 2019–23 (table 2; fig. 2B). One significant difference between these data from 2010 and 2019–23, however, was the addition of open sand beds 14–15 at the Main WWTF (fig. 3A, 3B), which distributed discharge across beds 9–13 and 14–15.
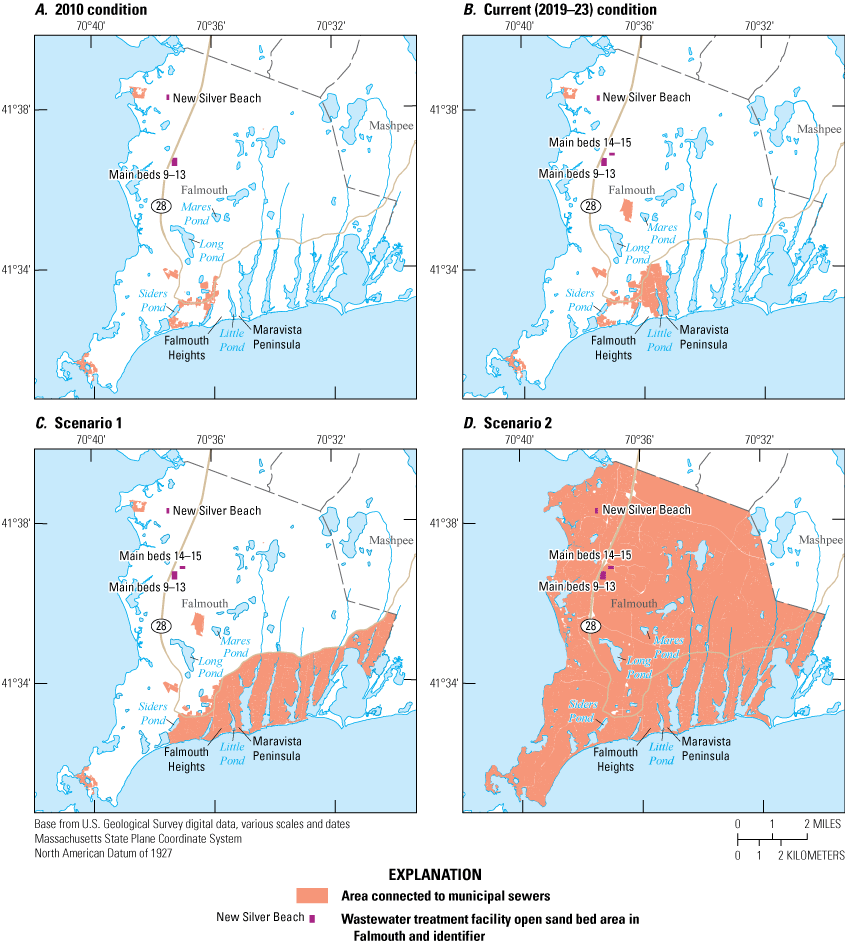
Maps showing areas connected to the municipal sewer system for the A, 2010 condition (Walter and others, 2019), B, current (2019–23) condition, C, scenario 1, with all properties in the water-system service area south of Route 28 in Falmouth connected to municipal sewers and the removal of wastewater-return flow at the Main WWTF, and D, scenario 2, with all properties in Falmouth connected to municipal sewers and removal of wastewater-return flow at the Main WWTF. [WWTF, wastewater treatment facility]
The portion of total wastewater-return flow recharged to the aquifer through individual septic systems was estimated in areas served by the water-supply system using the following steps: (1) the total volume pumped for public supply was reduced by 15 percent to account for consumptive water use (for example, water used for irrigation that is lost to evapotranspiration); (2) the adjusted volume was further decreased by subtracting water discharged at WWTFs; and (3) this final volume of water was distributed over residential areas that were not sewered and relied on septic systems for wastewater management.
The adjusted volume was distributed spatially in proportion to parcel-scale water use based on 2010 water-use rates as discussed in Walter and others (2019). Therefore, return-flow rates were updated based on data from 2019–23, but the relative spatial distribution remained the same as 2010, which is in general agreement with recent (since 2010) development. The model-grid cells where return flow is recharged through septic systems are documented in the model application data release (Goldstein and McCobb, 2025). The volume of wastewater-discharge to septic systems was assumed to equal the volume of withdrawals from wells in areas served by domestic wells and septic systems, thus resulting in no-net hydrologic stress in these areas. Additional descriptions of this approach are included in Walter and others (2016) and Walter and others (2019).
In addition to updating the model to simulate average 2019–23 pumping and wastewater-return-flow rates, the locations of sewered areas, production wells, and open sand beds at the WWTFs in Falmouth were updated. Between the 2010 and 2019–23 periods, the neighborhoods in the areas of Falmouth Heights and the Maravista Peninsula near Little Pond were connected to municipal sewers that discharge at the town’s Main WWTF (fig. 3A, 3B), pumping was initiated at the Mares Pond well (which was inactive in 2010), the location of the intake at Long Pond was changed to its current position (fig. 1; Massachusetts Bureau of Geographic Information, 2024), and open sand beds 14–15 were added to existing open sand beds 9–13 at the Main WWTF (fig. 3A, 3B). Additionally, an error was identified in the model by Walter and others (2019) that placed the intake at Long Pond in layer 2, which represents lower hydraulic conductivities characteristic of aquifer sediments, instead of in layer 1. As part of updating the model for these simulations, the horizontal location of the Long Pond intake was updated by changing the model cell that the intake was assigned to in the Well Package, and the error in the original model was remedied by assigning the intake to layer 1, where higher hydraulic conductivity values are used to represent the pond.
Comparison of 2010 and 2019–23 Simulated Conditions
The difference in the simulated water table between average 2010 hydrologic conditions and average 2019–23 hydrologic conditions is shown as lines of equal change (contours) in simulated water-table altitude (fig. 4). Differences were calculated by subtracting simulated water-table altitudes for 2019–23 conditions from the 2010 conditions; a positive value indicates a decrease in water-table altitude and a negative value indicates an increase.

Map showing the difference in simulated water-table altitude between the 2010 and 2019–23 average hydrologic conditions.
Changes between the 2010 and 2019–23 hydrologic conditions occur where hydrologic stresses in the model have been modified. There was a decrease in the simulated water-table altitude (indicated by contours with a positive value) at or near production wells that had larger withdrawal rates in 2019–23. Conversely, the simulated water-table altitude increased at or near wells with withdrawal rates in 2019–23 lower than rates in 2010 (fig. 4). Between 2010 and 2019–23, the Mares Pond well (which was inactive during the 2010 period) was added as a source for municipal supply in Falmouth, resulting in a simulated decrease in the water-table altitude of about 1.2 ft near the well (fig. 4).
The change in the simulated water table is also a function of the changes in the locations of pumping wells and wastewater-return flow. Two additional open sand beds (14–15) were added after 2010 at the Main WWTF (fig. 3B). Wastewater-return flow, which had a similar long-term average value for 2010 and 2019–23 (table 1; fig. 2A), was distributed across the new (14–15) and existing (9–13) open sand beds. This redistribution of discharge caused a decline in the simulated water table at the existing open sand beds (9–13) and a rise in the simulated water table at the new open sand beds (14–15; fig. 4). Pumping from Long Pond for public water supply is simulated as withdrawal occurring from a single model cell at approximately the intake location for the raw-water pump station. The intake location at Long Pond was moved northward between 2010 and 2019–23. There was an increase (about 0.6 ft) in the simulated water-table altitude near the former location of the intake and a decrease (about 0.9 ft) near the new location (fig. 4).
Wastewater-Return Flow Scenarios and Simulation Approaches
Current (2019–23) hydrologic conditions were simulated using the updated model, as described in the “Updates to the Existing Regional Groundwater Flow Model” section. Changes in the freshwater hydrologic system arising from potential wastewater-management actions were simulated by incorporating modified stresses that represented potential future changes to the wastewater system in Falmouth. Two wastewater-return flow scenarios requested by the Town of Falmouth were simulated using the model.
Scenario 1 represents the sewering of properties in the water-system service area south of Route 28 in the Town of Falmouth and the removal of treated wastewater-return flow at the Main WWTF because of the diversion of treated wastewater to an ocean outfall pipe (fig. 3C). Removal of return flow at the Main WWTF was simulated by removing the additional recharge associated with wastewater-return flow from model cells representing the open sand beds at the Main WWTF. Sewering in scenario 1 was simulated by removing the additional recharge associated with wastewater-return flow from septic systems from model cells representing residential areas south of Route 28 between Siders Pond to the west and the Falmouth/Mashpee town border to the east (fig. 3C), leaving only natural recharge from precipitation at these cells. Septic-system return-flow rates were not rebalanced for the remaining cells with septic systems outside the sewered areas. With the current wastewater-management practices, when treated wastewater is applied to the open sand beds at the Main WWTF, the assumption is made that the volume of water pumped from production wells minus consumptive losses equals the total wastewater-return flow to the aquifer from both WWTF and septic system return flow. However, if treated wastewater is discharged to an ocean outfall pipe, this assumption is no longer valid because wastewater at the Main WWTF is no longer recharging the aquifer at the open sand beds. Therefore, septic-system return-flow rates at properties not connected to municipal sewers in scenario 1 were not rebalanced to equal total withdrawal rates from the aquifer. Groundwater withdrawal from the production wells and surface water withdrawal from Long Pond, wastewater-return flow from septic systems in residential areas that are not south of Route 28 in Falmouth, and wastewater-return flow at the New Silver Beach treatment facility were kept the same as the current (2019–23) simulation.
The changes made in simulated stresses for scenario 1 were further modified in scenario 2 to simulate sewering of all properties in the Town of Falmouth (fig. 3D). Both scenarios 1 and 2 involved elimination of discharge to the open sand beds at the Main WWTF and discharge of treated water instead to an ocean outfall pipe. As in scenario 1, scenario 2 simulated both the removal of wastewater-return flow at the Main WWTF and the town-wide sewering of residential areas by removing the additional component of anthropogenic (human-caused) recharge from the cells representing the open sand beds at the Main WWTF and all properties in Falmouth, which were converted from septic systems to sewers (fig. 3D). Also, as in scenario 1, all other stresses were the same as those in the current (2019–23) simulation.
Simulated Responses to Changes in Wastewater-Return Flow
The updated (2019–23) steady-state groundwater flow model and modifications to anthropogenic stresses representing scenarios 1 and 2 were used to evaluate the potential effects of the two wastewater-management actions on the freshwater-hydrologic system. The hydrologic responses evaluated were changes in water-table altitude and streamflow. These changes are defined as the difference between the current (2019–23) condition and conditions simulated for each scenario (installation of the ocean outfall pipe and sewering properties south of Route 28 in scenario 1, and installation of the ocean outfall pipe and town-wide sewering in Falmouth in scenario 2). The difference was calculated by subtracting the simulated conditions that represented each scenario from the current condition.
Simulated Water-Table Responses to Changes in Wastewater-Return Flow
The simulated regional water-table altitudes were found to be similar for the current (2019–23) condition and for simulated conditions in scenarios 1 and 2 (fig. 5). In scenario 1, the simulated water table decreases in altitude and contours shift upgradient south of Route 28 and near the Main WWTF, where wastewater-return flow was removed (fig. 5A). The regional water table altitude decreases over a larger area in scenario 2, particularly in southern Falmouth where there is more residential development and the hydrologic responses to sewering would be expected to be larger (fig. 5B). The direction and magnitude of regional hydraulic gradients remain similar to the current (2019–23) conditions for both scenarios (fig. 5A, 5B).
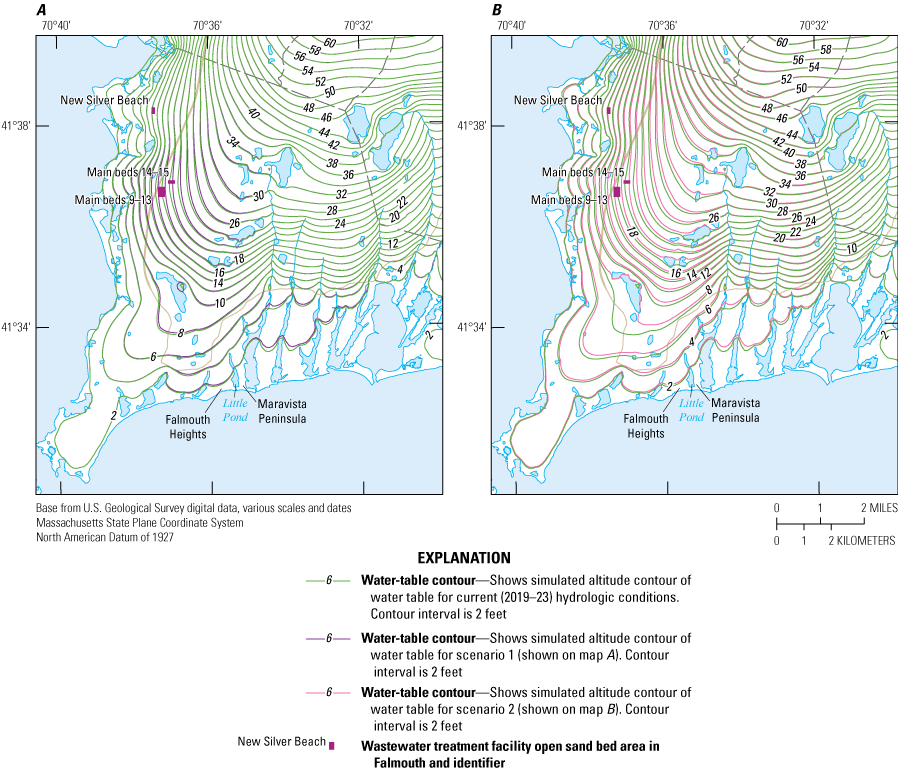
Maps showing simulated water-table altitude contours for A, the current (2019–23) hydrologic condition and scenario 1 (sewering south of Route 28 in Falmouth), and B, the current (2019–23) hydrologic condition and scenario 2 (town-wide sewering in Falmouth).
In scenario 1, all residential properties in the water-system service area south of Route 28 in Falmouth are connected to municipal sewers and wastewater-return flow at the Main WWTF is removed (fig. 3C), as would occur with the installation of an ocean outfall pipe. This scenario simulates the removal of 180,343 ft3/d of wastewater-return flow from properties in the southern part of Falmouth and at the Main WWTF, which was a decrease of 35.7 percent from current (2019–23) wastewater-return flows (table 2). Decreases in the simulated water-table altitude for scenario 1 are observed near the Main WWTF and on the coastal necks south of Route 28, where septic wastewater-return flow was removed following proposed sewering of those areas (fig. 6). The decrease in simulated water-table altitude is largest (about 1.1 feet) near the Main WWTF, because treated wastewater-return flow at the open sand beds at the Main WWTF site (which may have created a locally elevated water table) was removed (fig. 6). Decreases of less than 0.2 ft occur in the areas in the vicinity of the production wells and Long Pond (fig. 6). Decreases of about 0.1 ft occur south of Route 28 (fig. 6) where properties were converted to sewers, including on the coastal necks (fig. 6).
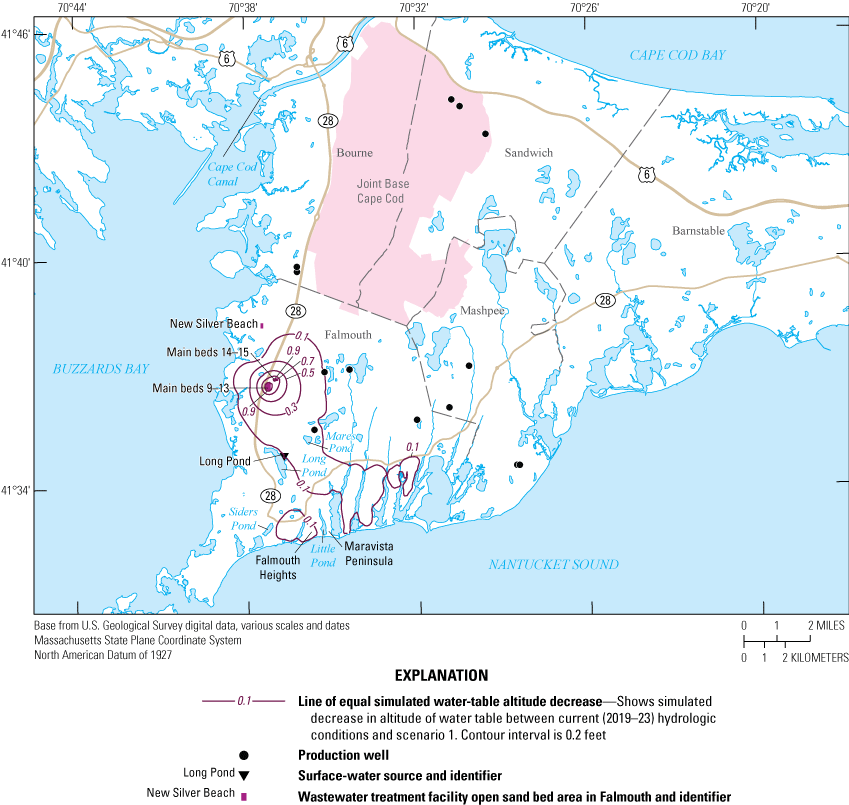
Map showing changes in simulated water-table altitude between the current (2019–23) hydrologic condition and scenario 1 (sewering south of Route 28 in Falmouth). The simulated decrease is greatest near the Main Wastewater Treatment Facility, with a decrease of about 1.1 feet.
Scenario 2 represents the connection of all residential properties in Falmouth to municipal sewers and removal of wastewater-return flow at the Main WWTF with the installation of an ocean outfall pipe (fig. 3D). Decreases in simulated water-table altitudes resulting from removal of septic-return flow are observed over a larger area across Falmouth (fig. 7). In scenario 2, decreases in the water table altitude of about 0.1–0.2 ft occur throughout Falmouth and extend north into the Town of Bourne. The simulated water-table altitude generally decreased between about 0.1–0.2 ft on the coastal necks south of Route 28 and about 0.4–0.5 ft at Long Pond (fig. 7). The largest decrease of about 1.3 ft was near the Main WWTF, and decreases of less than 0.5 ft occurred at production wells in Falmouth. The town-wide connection to municipal sewers and removal of wastewater-return flow at the Main WWTF in scenario 2 represents a removal of 503,385 ft3/d of wastewater-return flow, or a 99.6 percent decrease from current (2019–23) flows (table 2).
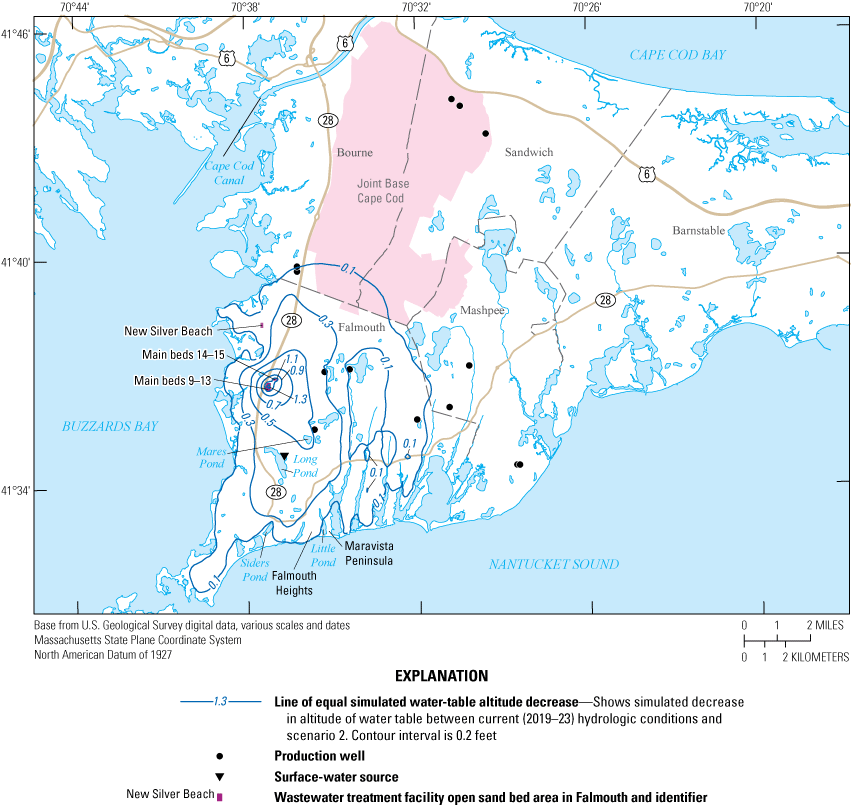
Map showing changes in simulated water-table altitude contours between the current (2019–23) hydrologic condition and scenario 2 (town-wide sewering in Falmouth). The simulated decrease is greatest near the Main Wastewater Treatment Facility, with a decrease of about 1.3 feet.
The simulated hydrologic response of water-table altitudes in both scenarios was relatively small when compared to fluctuations that occur as a result of variations in natural recharge. For example, the average annual range in water-table altitude observed at USGS monitoring well MA-FSW 172 Falmouth, Mass. (413522070373601; fig. 1), from 2019–23 was 1.92 ft (U.S. Geological Survey, 2024), with a minimum annual range of 0.49 ft and a maximum annual range of 5.57 ft. Both the average and maximum annual ranges in water-table altitude at this well are larger than the long-term average change of 1.3 ft simulated near the Main WWTF in scenario 2 (fig. 7), which was the largest change simulated in either scenario. The decrease in total wastewater-return flow (from both the Main WWTF and septic systems) in each scenario is also relatively small when compared to the total flow throughout the system. The total decrease in wastewater-return flow in scenario 2 is 503,385 ft3/d (table 1), which is about 5 percent of the total recharge that occurs over the model area during current (2019–23) conditions. The relatively small changes to long-term average water-table altitudes are associated with the small percentage that the decrease in wastewater-return flow accounts for in total recharge over the study area. It is also possible that the small changes to water-table altitude on the coastal necks, in particular, may be associated with the closeness to coastal boundary, the small absolute hydraulic heads above the baseline of 0–4 ft above sea level, and the relatively thin freshwater lenses present on the coastal necks.
Simulated Streamflow Responses to Changes in Wastewater-Return Flow
Streamflow responses for six selected streams in Falmouth and Mashpee were evaluated using the simulated hydrologic budgets, which calculate inflows and outflows to the groundwater system, for each scenario. Streams on Cape Cod generally are gaining streams that accumulate groundwater discharge downstream (LeBlanc and others, 1986). Discharge to a stream is proportional to the hydraulic gradient between the stream and the water table; therefore, decreases in water-table altitudes are correlated with decreases in streamflows. The Coonamessett River, Backus River, Bourne River, Childs River, Quashnet River, and Red Brook were selected for this study (fig. 1).
Simulated average baseflow, which refers to the component of streamflow from groundwater discharge, decreased from current (2019–23) conditions for both scenarios (table 3; fig. 8). Streamflow decreased in all six simulated streams owing to the removal of wastewater-return flow, and the decreases in water-table altitudes and hydraulic gradients that occurred as a result. The decrease is greater in scenario 2, since a greater volume of septic-system wastewater-return flow was removed when representing town-wide sewering. The decreases in streamflow were greatest at the Coonamessett River (which is closest to the Main WWTF) in both scenarios. The average decrease in streamflow at the Coonamessett River was 0.1 cubic feet per second (ft3/s) in scenario 1 and 0.6 ft3/s in scenario 2, which represent decreases of 1.1 and 5.4 percent, respectively, from current (2019–23) conditions (table 3; fig. 8). The total decrease in streamflow relative to current (2019–23) conditions for scenarios 1 and 2 were 0.3 and 1.4 ft3/s, respectively (table 3; fig. 8). These decreases represent 0.7 and 3.0 percent, respectively, of total streamflow in scenarios 1 and 2. Both scenarios result in a relatively small change in long-term average streamflow, because the decrease in septic-system return flow and treated wastewater flow is a small percentage of the total recharge over the study area.
Table 3.
Average simulated streamflow at six selected streams in Falmouth and Mashpee for current (2019–23) hydrologic conditions, scenario 1, and scenario 2.[WWTF, wastewater treatment facility; ft3/s, cubic feet per second, —, not applicable]
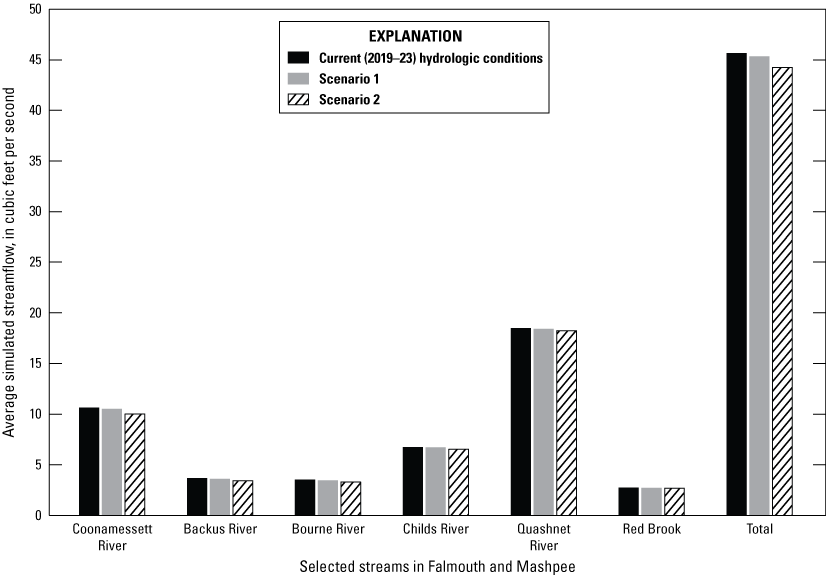
Graph showing simulated streamflow at six selected streams in Falmouth and Mashpee for current (2019–23) hydrologic conditions, scenario 1 (sewering south of Route 28 in Falmouth), and scenario 2 (town-wide sewering in Falmouth).
Limitations of the Study
Numerical models are simplified mathematical representations of complex natural systems. Their use comes with certain limitations and uncertainties, such as errors in their structure, uncertainties in calibration, and challenges in portraying continuous processes using distinct time and space intervals. The hydrogeologic framework representing the groundwater system is based on existing glacial depositional maps developed by Masterson and others (1997) and lithologic borings installed in and around Joint Base Cape Cod. It is assumed that the hydrogeologic framework used for this model is a reasonable one; however, uncertainties such as the nature and extent of glacial moraines may remain. The effects of these unknown variables on model accuracy can be mitigated through calibration of the model to hydrologic conditions observed during the time period that is being simulated. The underlying model used in this analysis employed a highly parameterized calibration approach through pilot points and a multitude of observation types (including water levels, streamflows, hydraulic gradients, plume observations, and groundwater travel times), in which the difference between observed values and simulated equivalents was minimized using a least squares parameter-estimation approach (Walter and others, 2019). This calibration process ensures that (to the best extent possible) the model is appropriate for the hydrologic analyses, despite any inherent uncertainties in the model.
Another limitation is that the model used in these analyses simulated steady-state conditions with constant stresses from 2019–23, and the results represent long-term average water-table elevations and streamflow. Steady-state models do not represent changes in natural hydrologic stresses over time (Harbaugh, 2005), such as recharge from precipitation, groundwater withdrawal, and wastewater-return flow. These stresses vary seasonally and can vary interannually between relatively wet and dry years (Walter and Whealan, 2005), resulting in time-varying water-table altitudes and streamflow. Walter and others (1999) reported that the stage (height of the water-surface level) in Snake Pond, near the groundwater divide to the north of Falmouth, varied by more than 2 feet seasonally and by more than 7 feet between wet and dry years. Streamflow also varies throughout the year and is typically higher in March and lower in September. The observed streamflow at the streamgage on the Quashnet River (011058837) near the stream’s outlet between 2019–23 ranged from a monthly mean of 23 ft3/s in March to 15 ft3/s in September (U.S. Geological Survey, 2024). The simulated steady-state streamflow of 18.44 ft3/s (table 3) for the current (2019–23) condition approximated the mean observed streamflow at the streamgage between 2019–23 of 19.02 ft3/s (U.S. Geological Survey, 2024), but the steady-state model is unable to simulate seasonal variations in streamflow. The steady-state model also cannot be used to estimate potential effects on water-table altitudes or streamflow that might occur during a drought or in response to high water-supply withdrawals that occur during the summer months. Groundwater storage, which is not represented or simulated in a steady-state model, has the potential to buffer the effects that the removal of wastewater-return flow in the scenarios may have on transient changes in water levels and streamflow during times when hydrologic stresses are varying temporally, although the effects of storage would diminish over time given long periods of relatively constant stresses.
These analyses only consider the effects of removal of wastewater-return flow on water table altitudes and streamflow associated with discharge of former septic system and Main Wastewater Treatment Facility return flow to an ocean outfall pipe. The analyses do not consider effects to the marine environment or water quality. The model uses a fixed freshwater-saltwater interface that does not respond to changes in hydrologic stresses. The position of a freshwater-saltwater interface represents a density-driven balance between the fresh and salty parts of coastal aquifer systems and moves in response to changing hydraulic stresses to the freshwater system. However, the freshwater-saltwater interface on western Cape Cod generally is near or seaward of the coast in most areas (LeBlanc and others, 1986), consistent with the generally thin, permeable-aquifer sediments, large land area, high-recharge areas, and freshwater fluxes. It is reasonable to assume the movement is negligible at the regional scale of the analyses because the changes in flux caused by the scenarios are small relative to the total flux to the coast.
Summary
The Cape Cod aquifer is the sole source of drinking water for the Town of Falmouth, Massachusetts and is susceptible to contamination by nitrogen from man-made sources which threaten coastal ecosystems. In Cape Cod, about 80 percent of nitrogen enters watersheds through septic systems. To address the issue of excess nitrogen in Cape Cod watersheds, the town is proposing to sewer densely developed areas of Falmouth located in the watersheds of coastal ponds, treat the wastewater at the Town’s Main Wastewater Treatment Facility (a nitrogen removing/tertiary treatment facility) and discharge the treated wastewater to an outfall pipe in Nantucket Sound. The U.S. Geological Survey, in cooperation with the Town of Falmouth, estimated the potential effects of these wastewater-management actions on water levels and streamflows in and near Falmouth.
A U.S. Geological Survey three-dimensional steady-state groundwater flow model by Walter and others (2019) was updated to current (2019–23) hydrologic conditions and used to simulate the effect of the Town’s proposed wastewater-return flow scenarios on average long-term water-table position and streamflow. The groundwater flow model described in Walter and others (2019) simulates the average hydrologic-stress condition in 2010 and simulates steady-state hydrologic conditions in the Sagamore flow lens of the Cape Cod aquifer. For these analyses, the model was updated to 2019–23 average conditions using the locations and rates of public-supply pumping, wastewater treatment facility return flow, and septic system return flow in Falmouth from 2019–23. Natural recharge from precipitation was not changed as part of these modifications, and pumping and wastewater-return flow for towns other than Falmouth were not changed from 2010 conditions.
The updated model was used to simulate the response of water-table altitudes and streamflow to two wastewater-management scenarios. Scenario 1 simulates the connection of all properties in Falmouth south of Route 28 to municipal sewers and the diversion of wastewater-return flow at the town’s Main Wastewater Treatment Facility to an ocean outfall pipe. Scenario 2 simulates the expansion of municipal sewers to all properties in Falmouth and diversion to an ocean outfall pipe.
Overall, the simulated hydrologic response of water-table altitudes and streamflow in both scenarios was relatively small when compared to fluctuations that occur as a result of variations in natural recharge. This is likely because the decrease in total wastewater-return flow (from both the Main Wastewater Treatment Facility and septic systems) in both scenarios is relatively small when compared to the total flow throughout the system. The total decrease in wastewater-return flow in scenario 2, for example, is 503,385 ft3/d (table 2), which is about 5 percent of the total recharge that occurs over the model area in current (2019–23) conditions.
The simulated regional water-tables were found to be similar for the current (2019–23) condition and for scenarios 1 and 2. Regional hydraulic gradient direction and magnitude remain similar to the current (2019–23) conditions in both scenarios. The greatest simulated decrease in water-table altitude for both scenarios is near the Main Wastewater Treatment Facility, where wastewater-return flow at the facility (which may have created a locally elevated water table) was diverted to an ocean outfall pipe. The simulated decrease in water-table altitude near the Main Wastewater Treatment Facility is about 1.1 ft in scenario 1 and about 1.3 ft in scenario 2. Decreases of about 0.1 ft were simulated on the coastal necks south of Route 28, where septic wastewater-return flow was removed. The water-table altitude decreased by about 0.1–0.2 ft over a larger area in Falmouth under town-wide sewering in scenario 2.
Decreases in simulated streamflow occurred in the six selected streams in Falmouth and Mashpee in both scenarios as a result of the removal of wastewater-return flow, with the greatest decreases occurring in scenario 2. The largest decreases in both scenarios were at the Coonamessett River, which is closest to the Main Wastewater Treatment Facility. The average simulated decrease in streamflow at the Coonamessett River is 0.1 cubic feet per second (ft3/s) in scenario 1—a 1.1 percent decrease compared to current (2019–23) conditions, and 0.6 ft3/s in scenario 2—a 5.4 percent decrease compared to current (2019–23) conditions. The total simulated decrease in streamflow for all streams in scenario 1 is 0.3 ft3/s—a decrease of 0.7 percent compared to current (2019–23) conditions, and 1.4 ft3/s in scenario 2—a decrease of 3.0 percent compared to current (2019–23) conditions.
The simulations do not include time-varying changes in hydrologic stresses. For example, the model does not simulate time-varying water levels and streamflow that may result from seasonal or interannual variations in precipitation, groundwater withdrawal, and wastewater-return flow. A transient numerical model (in which changes to the inflows to and outflows from the groundwater system are represented throughout time) would be required to quantify changes in water-table elevation and streamflow that occur seasonally and interannually resulting from the wastewater-return flow scenarios presented in this report.
References Cited
Bakker, M., Schaars, F., Hughes, J.D., Langevin, C.D., and Dausman, A.M., 2013, Documentation of the seawater intrusion (SWI2) package for MODFLOW: U.S. Geological Survey Techniques and Methods, book 6, chap. A46, 47 p., accessed March 2025, at https://pubs.usgs.gov/tm/6a46/.
Birkeland, S., 2001, EPA's TMDL program: Ecology Law Quarterly, v. 28, no. 2, p. 297–326, accessed May 2025, at https://lawcat.berkeley.edu/record/1117760?ln=en&v=pdf.
Cape Cod Commission, 2015, Cape Cod area wide water quality management plan update: Cape Cod Commission, June 2015, accessed January 2025, at capecodcommission.org/resource-library/file/?url=/dept/commission/team/208/208%20Final/Cape_Cod_Area_Wide_Water_Quality_Management_Plan_Update_June_15 _2015.pdf.
Fairchild, G.M., Lane, J.W., Jr., Voytek, E.B., and LeBlanc, D.R., 2013, Bedrock topography of western Cape Cod, Massachusetts, based on bedrock altitudes from geologic borings and analysis of ambient seismic noise by the horizontal-to-vertical spectral-ratio method: U.S. Geological Survey Scientific Investigations Map 3233, U.S. Geological Survey Scientific Investigations Map 3233, 1 sheet, maps variously scaled, 17 p. pamphlet, 1 CD–ROM, accessed October 2024, at https://doi.org/10.3133/sim3233.
Geist, G., 2023, Behind the scenes at Falmouth’s wastewater treatment facility: The Falmouth [Massachusetts] Enterprise, August 10, 2023, accessed December 2024, at https://www.capenews.net/falmouth/news/behind-the-scenes-at-falmouth-s-wastewater-treatment-facility/article_0e15c889-75c9-5bb7-a5f6-3cdca665f367.html.
Giese, G.S., Williams, S.J., and Adams, M., 2015, Coastal landforms and processes at the Cape Cod National Seashore, Massachusetts—A primer: U.S. Geological Survey Circular 1417, 86 p., accessed July 2025, at https://doi.org/10.3133/cir1417.
Goldstein, K.M.F., and McCobb, T., 2025, MODFLOW-2005 groundwater flow model used to simulate wastewater-return flow scenarios in Falmouth, Massachusetts: U.S. Geological Survey data release, accessed July 2025, at https://doi.org/10.5066/P1O3SSE5.
Harbaugh, A.W., 2005, MODFLOW–2005—The U.S. Geological Survey modular ground-water model—The ground-water flow process: U.S. Geological Survey Techniques and Methods, book 6, chap. A16, [variously paged], accessed April 2024, at https://doi.org/10.3133/tm6A16.
Howarth, R.W., Anderson, D.B., Cloern, J.E., Elfring, C., Hopkinson, C.S., Lapointe, B., Malone, T., Marcus, N., McGlathery, K.J., Sharpley, A.N., and Walker, D., 2000, Nutrient pollution of coastal rivers, bays, and seas: Issues in Ecology, v. 7, p. 1–14, accessed May 2025, at https://www.esa.org/esa/wp-content/uploads/2013/03/issue7.pdf.
Hull, R.B., Briggs, M.A., LeBlanc, D.R., Armstrong, D.A., and McCobb, T.D., 2019, Temperature and seepage data from the nearshore bottom sediments of five groundwater flow-through glacial kettle lakes, western Cape Cod, Massachusetts, 2015–18: U.S. Geological Survey data release, accessed July 2025, at https://doi.org/10.5066/P9QLIFWV.
LeBlanc, D.R., 1984, Sewage plume in a sand and gravel aquifer, U.S. Geological Survey Water-Supply Paper 2218, 28 p., accessed December 2024, at https://pubs.usgs.gov/publication/wsp2218.
LeBlanc, D.R., Guswa, J.H., Frimpter, M.H., and Londquist, C.J., 1986, Ground-water resources of Cape Cod, Massachusetts: U.S. Geological Survey Hydrologic Atlas 692, 4 plates, accessed December 2024, at https://doi.org/10.3133/ha692.
Massachusetts Bureau of Geographic Information, 2024, MassGIS data: Public Water Supplies: Commonwealth of Massachusetts dataset, accessed June 2024, at https://www.mass.gov/info-details/massgis-data-public-water-supplies.
Massachusetts Estuaries Project, 2024, The Massachusetts Estuaries Project and reports: Commonwealth of Massachusetts web page, accessed June 2024, at https://www.mass.gov/guides/the-massachusetts-estuaries-project-and-reports#cape-cod-mep-reports.
Masterson, J.P., 2004, Simulated interaction between freshwater and saltwater and effects of ground-water pumping and sea-level change, Lower Cape Cod aquifer system, Massachusetts: U.S. Geological Survey Scientific Investigations Report 2004–5014, 72 p., accessed February 2025, at https://doi.org/10.3133/sir20045014.
Masterson, J.P., Carlson, C.S., and Walter, D.A., 2009, Hydrogeology and simulation of groundwater flow in the Plymouth-Carver-Kingston-Duxbury aquifer system, southeastern Massachusetts: U.S. Geological Survey Scientific Investigations Report 2009–5063, 110 p., accessed December 2024, at https://doi.org/10.3133/sir20095063.
Masterson, J.P., Stone, B.D., Walter, D.A., and Savoie, J., 1997, Hydrogeologic framework of western Cape Cod, Massachusetts: U.S. Geological Survey Hydrologic Atlas 741, 1 plate, accessed December 2024, at https://doi.org/10.3133/ha741.
Masterson, J.P., and Walter, D.A., 2009, Hydrogeology and groundwater resources of the coastal aquifers of southeastern Massachusetts: U.S. Geological Survey Circular 1338, 16 p., accessed February 2024, at https://doi.org/10.3133/cir1338.
Nixon, S.W., 1995, Coastal marine eutrophication—A definition, social causes, and future concerns: Ophelia, v. 41, no. 1, p. 199–219, accessed May 2025, at https://doi.org/10.1080/00785236.1995.10422044.
Savoie, J.G., 1995, Altitude and configuration of the water table, western Cape Cod, Massachusetts, March 1993: U.S. Geological Survey Open-File Report 94–462, 1 plate, accessed February 2025, at https://doi.org/10.3133/ofr94462.
U.S. Geological Survey, 2024, USGS water data for the Nation: U.S. Geological Survey National Water Information System (NWIS) database, accessed September 2024, at https://doi.org/10.5066/F7P55KJN.
Walter, D.A., Masterson, J.P., and Hess, K.M., 2004, Ground-water recharge areas and traveltimes to pumped wells, ponds, streams, and coastal water bodies, Cape Cod, Massachusetts: U.S. Geological Survey Scientific Investigations Map I–2857, 1 plate, accessed March 2025, at http://pubsdata.usgs.gov/pubs/sim/2004/2857/.
Walter, D.A., Masterson, J.P., and LeBlanc, D.R., 1999, Simulated pond-aquifer interactions under natural and stressed conditions near Snake Pond, Cape Cod, Massachusetts: U.S. Geological Survey Water Resources Investigations Report 99–4174, 42 p., accessed March 2025, at http://pubsdata.usgs.gov/pubs/wri/wri994174/.
Walter, D.A., McCobb, T.D., and Fienen, M.N., 2019, Use of a numerical model to simulate the hydrologic system and transport of contaminants near Joint Base Cape Cod, western Cape Cod, Massachusetts: U.S. Geological Survey Scientific Investigations Report 2018–5139, 98 p., accessed February 2024, at https://doi.org/10.3133/sir20185139.
Walter, D.A., McCobb, T.D., Masterson, J.P., and Fienen, M.N., 2016, Potential effects of sea-level rise on the depth to saturated sediments of the Sagamore and Monomoy flow lenses on Cape Cod, Massachusetts (ver. 1.1, October 18, 2016): U.S. Geological Survey Scientific Investigations Report 2016–5058, 55 p., accessed December 2024, at https://doi.org/10.3133/sir20165058.
Walter, D.A., and Whealan, A.T., 2005, Simulated water sources and effects of pumping on surface and ground water, Sagamore and Monomoy flow lenses, Cape Cod, Massachusetts: U.S. Geological Survey Scientific Investigations Report 2004–5181, 85 p., accessed October 2024, at https://doi.org/10.3133/sir20045181.
Winter, T.C., Harvey, J.W., Franke, O.L., and Alley, W.M., 1998, Ground water and surface water—A single resource: U.S. Geological Survey Circular 1139, 79 p., accessed February 2025, at https://doi.org/10.3133/cir1139.
Conversion Factors
U.S. customary units to International System of Units
Datums
Vertical coordinate information is referenced to the National Geodetic Vertical Datum of 1929 (NGVD 29).
Horizontal coordinate information is referenced to the North American Datum of 1983 (NAD 83).
Altitude, as used in this report, refers to distance above the vertical datum.
For more information about this report, contact:
Director, New England Water Science Center
U.S. Geological Survey
10 Bearfoot Road
Northborough, MA 01532
dc_nweng@usgs.gov
or visit our website at
https://www.usgs.gov/centers/new-england-water
Publishing support provided by the Pembroke, Baltimore, and Lafayette Publishing Service Centers.
Disclaimers
Any use of trade, firm, or product names is for descriptive purposes only and does not imply endorsement by the U.S. Government.
Although this information product, for the most part, is in the public domain, it also may contain copyrighted materials as noted in the text. Permission to reproduce copyrighted items must be secured from the copyright owner.
Suggested Citation
Goldstein, K.M.F., and McCobb, T.D., 2025, Simulated hydrologic responses to proposed wastewater-returnflow scenarios in Falmouth, Massachusetts (ver. 1.1, 2026): U.S. Geological Survey Scientific Investigations Report 2025–5066, 19 p., https://doi.org/10.3133/sir20255066.
ISSN: 2328-0328 (online)
Study Area
| Publication type | Report |
|---|---|
| Publication Subtype | USGS Numbered Series |
| Title | Simulated hydrologic responses to proposed wastewater-returnflow scenarios in Falmouth, Massachusetts |
| Series title | Scientific Investigations Report |
| Series number | 2025-5066 |
| DOI | 10.3133/sir20255066 |
| Edition | Version 1.0: August 8, 2025; Version 1.1: April 1, 2026 |
| Publication Date | August 08, 2025 |
| Year Published | 2025 |
| Language | English |
| Publisher | U.S. Geological Survey |
| Publisher location | Reston, VA |
| Contributing office(s) | New England Water Science Center |
| Description | Report: vii, 19 p.; Data Release |
| Country | United States |
| State | Massachusetts |
| City | Falmouth |
| Online Only (Y/N) | Y |
| Additional Online Files (Y/N) | N |