

Streamflow Extents and Hydraulic Characteristics of Meadow Valley Wash at Stuart Ranch, near Rox, Nevada
Links
- Document: Report (11.6 MB pdf) , HTML , XML
- Data Release: USGS data release - Geospatial data, flood-frequency analysis, and surface-water model archive for streamflow extents and hydraulic characteristics of Meadow Valley Wash at Stuart Ranch, near Rox, Nevada
- Download citation as: RIS | Dublin Core
Abstract
The former Stuart Ranch, now managed by the Bureau of Land Management, is transected by Meadow Valley Wash, where 4,600 feet of perennial stream and adjacent riparian vegetation provide critical habitat for several wildlife and aquatic species protected under the Endangered Species Act. The stream has been altered by prior construction of irrigation diversions, gravel mining, and removal of riparian vegetation, resulting in the loss of instream and riparian vegetation and disconnected floodplains. The stream alteration has also resulted in the loss of native species and increased non-native invasive species and changes in ecological cycles. With the goal of improving habitat extent and quality for native threatened and endangered species, the Bureau of Land Management (BLM) is considering establishing perennial streams through braided side channels by constructing beaver dam analogs, excavating side channel connectors, and grading an irrigation reservoir berm on the floodplain. The U.S. Geological Survey (USGS) provided hydraulic modeling to assist the BLM in evaluating how possible restoration modifications could affect the extent of aquatic, riparian, and other habitat types. Three two-dimensional (2-D) hydraulic models were developed to simulate 2021 conditions (when most of the topographic data were collected), minor restoration modifications (one excavated side channel and a beaver dam analog), and major restoration modifications (three excavated side channels, a beaver dam analog, and an excavated and graded area to remove the irrigation reservoir) to determine streamflow-inundation extents and hydraulic characteristics (depth and velocity) for base flow and various flood (50-, 20-, 10-, 4-, 2-, and 1-percent annual exceedance probability [AEP]) scenarios. An average summer base flow of 0.92 cubic feet per second was estimated based on data from a USGS streamgage in the study area. The 50-, 20-, 10-, 4-, 2-, and 1-percent AEP streamflows were estimated based on a flood-frequency analysis of data from the streamgage. The base flow and AEP floods were combined with surveyed topographic data to create a 2-D unsteady hydraulic model. The hydraulic model was used to simulate the base flow and flood-inundation extents and hydraulic characteristics under 2021 conditions and with two possible restoration modification scenarios. Under 2021 conditions, flow remains in a single channel until the most downstream end of the modeled reach, where flow then expands into slower velocity pools. During floods, streamflow begins to enter the side channels at the 50-percent flood, expands into the east floodplain at 20-percent flood, and flows in the irrigation reservoir at 4-percent flood. Compared to 2021 conditions with no terrain modification, base flow under the possible restoration modifications enters and remains in the side channels, thus increasing the likelihood of expanding riparian habitat. Additionally, during floods under the major restoration modifications, streamflow expands into the modified terrain surrounding the irrigation reservoir at 10-percent AEP, as opposed to 4-percent AEP under 2021 conditions. For all modeled streamflow scenarios, streamflow is deepest in the center of the main and side channels, as well as the downstream pooled areas. Streamflow is fastest in the narrow sections of the channels, especially in the upper 1,220 feet of the modeled reach.
Introduction
Meadow Valley Wash is an intermittent stream in eastern Nevada (Nev.) approximately 110 miles long, flowing south and joining the Muddy River at Glendale, Nev. (fig. 1). The perennial sections of the wash and adjacent riparian areas are biologically diverse, providing habitat for the endangered southwestern willow flycatcher (Empidonax traillii extimus) and the threatened yellow-billed cuckoo (Coccyzus americanus). Also present are BLM sensitive fish species, including the Meadow Valley Wash speckled dace (Rhinichthys osculus subsp.) and the Meadow Valley Wash desert sucker (Pantosteus clarkii; Bureau of Land Management, 2017). Stuart Ranch, a former private ranch was purchased by the BLM in 2007 for the protection, preservation, and restoration of natural and cultural resources along that part of the Meadow Valley Wash (Bureau of Land Management, 2009). The ranch contains approximately 4,600 feet (ft) of perennial sections of the wash and is south of the Lincoln-Clark County line, about 12 miles north of Glendale, Nev. Before 1994, the riparian corridor within Stuart Ranch was altered by numerous agricultural developments, including the construction of an irrigation ditch, holding reservoir, farming, as well as sand and gravel mining (Bureau of Land Management, 2009; fig. 1).
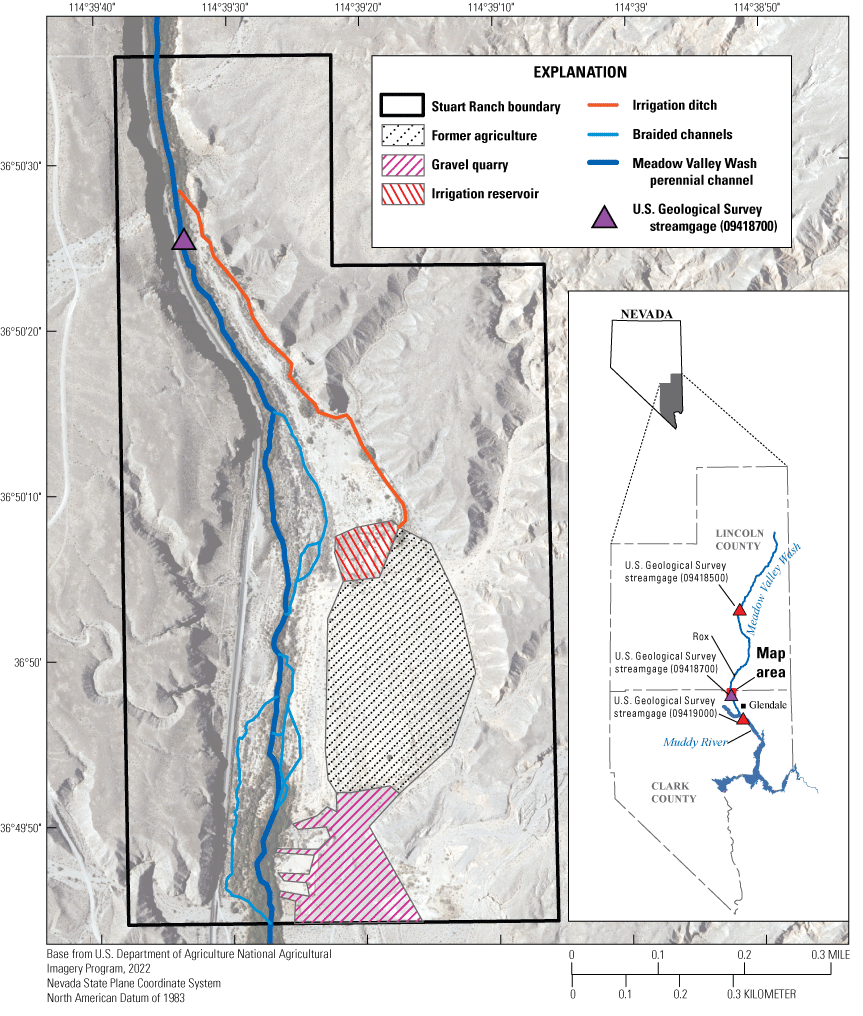
Study area at Stuart Ranch along Meadow Valley Wash, near Rox, Nevada.
In cooperation with the USGS, the BLM is interested in improving and expanding habitat conditions for native species at Stuart Ranch. As part of the restoration effort, the BLM is considering restoration modifications to the terrain, including channel excavation and constructing beaver dam analogs (BDA) to promote the re-establishment of base flow in the braided sections of the study area. Additionally, the BLM is considering removal of an irrigation reservoir for better connectivity between the stream and the floodplain. To evaluate the effects of these possible changes to the landscape, the BLM requires additional information on stream base flow and flood-inundation extents and how these possible changes would affect base flow, flood-inundation extents, as well as depth and velocity (hereafter referred to as “hydraulic characteristics”).
Purpose and Scope
This report describes and documents the development of base flow and flood-inundation extent maps and computation of hydraulic characteristics for Stuart Ranch along Meadow Valley Wash near Rox, Nev. The objective of this study is to evaluate changes in the extent of base flow and flood inundation at Stuart Ranch caused by possible restoration modifications. The base flow and 50-, 20-, 10-, 4-, 2-, and 1-percent annual exceedance probability (AEP) flood streamflows were estimated from a hydrological analysis of the USGS streamgage (09418700) at Meadow Valley Wash near Rox, Nev. The base flow and AEP floods were combined with surveyed topographic data to create a two-dimensional (2-D) unsteady hydraulic model. The hydraulic model was used to simulate the base flow and flood-inundation extents and hydraulic characteristics under 2021 conditions and with two possible restoration modification scenarios.
Description of Study Area
The study area begins near the USGS Meadow Valley Wash near Rox, Nev., streamgage (09418700) and extends approximately 4,200 ft downstream, ending near an abandoned gravel quarry (fig. 1). At the upstream end of the study area (starting from the streamgage and extending approximately 1,200 ft downstream), the wash is confined in a 300-ft-wide canyon where the riparian area occupies approximately half of the canyon bottom with a single perennial stream lined with riparian vegetation of coyote willow (Salix exigua), seepwillow (Baccharis salicifolia), cattails (Typha sp.), and Fremont’s cottonwood (Populus fremontii; fig. 2). The perennial stream is flanked by a low floodplain vegetated with arrowweed (Pluchea sericea), saltbush (Atriplex spp.), tamarisk (Tamarix ramosissima), and mesquite (Prosopis spp.; fig. 3). On the east side of the floodplain is a nearly vertical canyon wall of Miocene ash flow tuff (fig. 3A; Schmidt, 1994). On the west side, an active railroad track and access road embankment occupies a narrow terrace between the channel and the canyon wall (fig. 3B). Approximately 1,200–3,500 ft further downstream from the streamgage, the canyon opens to an approximately 1,500 ft wide valley, and the single stream channel continues downstream, flanked on either side by several braided dry channels crisscrossing a floodplain. In the most downstream section of the reach, about 3,500–4,200 ft downstream from the streamgage, the stream expands to cover nearly the entire floodplain and flows into a cattail marsh at a slower velocity, due to several beaver dams. A higher, sparsely vegetated alluvium floodplain is on the east side of the valley and was formerly farmed (fig. 1). On the west side of the valley, the railroad track and access road embankment and a gravel road continues to the downstream end of the reach.
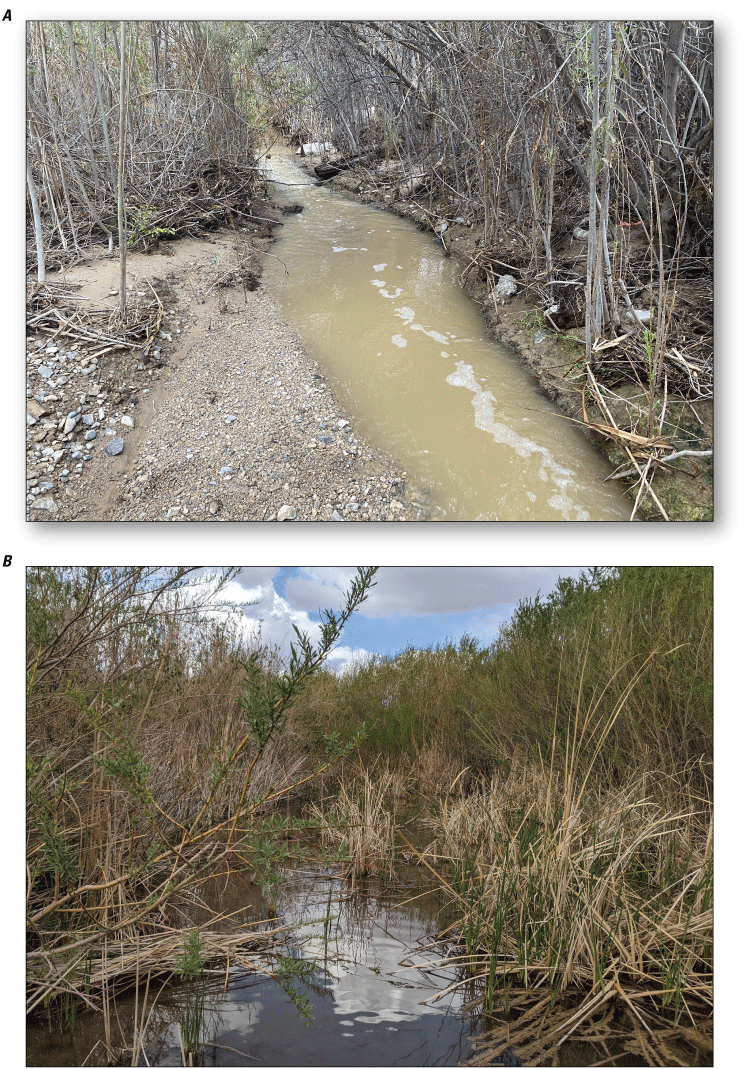
Base flow channel types at multiple channel locations along Meadow Valley Wash at Stuart Ranch, near Rox, Nevada. Photographs looking A, view downstream near the upstream end of study area, dense willows on either side of narrow channel, photograph by Megan Hederman, U.S. Geological Survey, August 12, 2022; and B, view upstream near the downstream end of the study area, cattails in wide slow pool, surrounded by dense willows, photograph by Hampton Childres, U.S. Geological Survey, March 23, 2021.
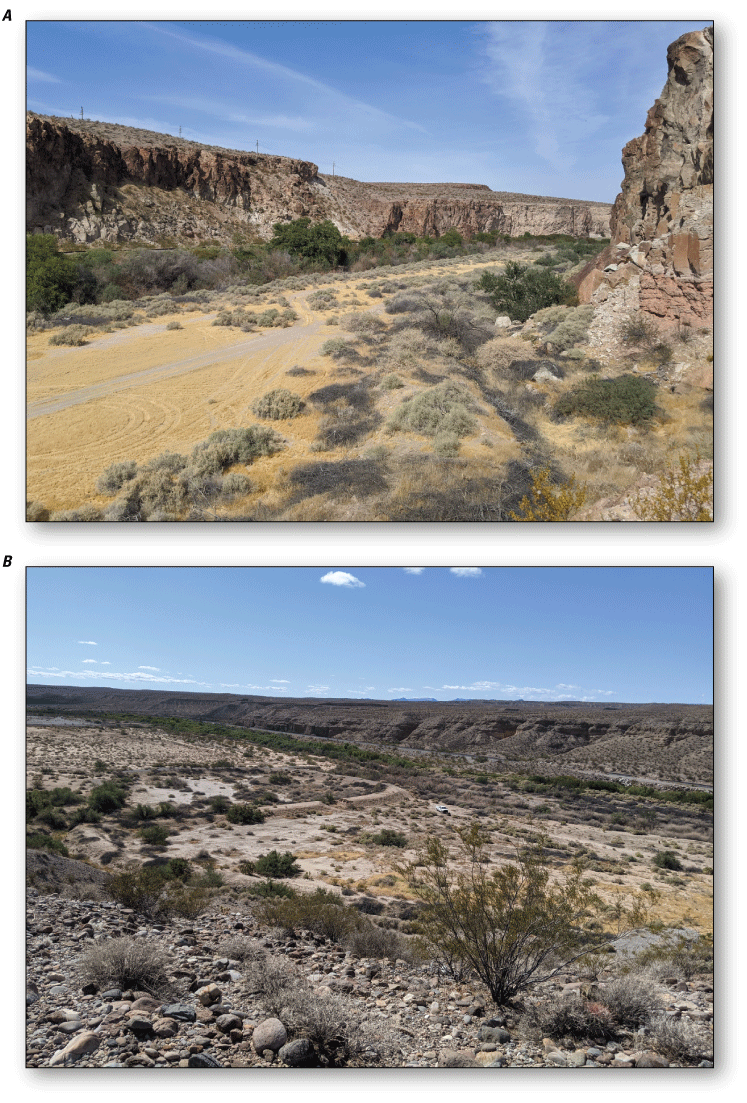
Floodplain along Meadow Valley Wash at Stuart Ranch, near Rox, Nevada. A, view looking upstream toward the northern end of the study area, with the stream riparian corridor in the background and floodplain, photograph by Christopher Morris, U.S. Geological Survey, October 8, 2020; and B, view looking downstream at the southern end of the study area, with the stream along the base of the canyon wall and the irrigation reservoir outlined by a nearly circular berm of earth, photograph by Hampton Childres, U.S. Geological Survey, October 12, 2021.
On the east side of Stuart Ranch, an unused irrigation ditch starts at the upstream end of the study area and ends at a small irrigation reservoir (fig. 1), which were all dry during the site visits carried out for this study. The reservoir was formerly used to irrigate the previously farmed floodplain to the south. South of the floodplain, there is a bare, gravel terrace formed from gravel mining (fig. 1).
Previous Studies
Otis Bay Ecological Consultants (2010) developed a one-dimensional step-backwater Hydrologic Engineering Center’s River Analysis System (HEC-RAS) as part of a larger ecological recovery plan. Several flood AEP scenarios were estimated by fitting 10 years of peak streamflow data from the Meadow Valley near Rox, Nev., streamgage to a log-Pearson Type-III curve. Computed peak discharge ranged from 14 cubic feet per second (ft3/s; 66.6-percent AEP) to 16,750 ft3/s (1-percent AEP). Cross-section properties for the computed AEP floods were computed using the HEC-RAS model. The results indicated that in the narrower canyon section, inundation extents reached the canyon walls by the 2-percent AEP flood, whereas in the wider section, the floodplain was completely inundated by the 4-percent AEP flood, and all but a small part of the high floodplain was inundated by the 1-percent AEP flood.
The main and braided channels are listed in a Federal Emergency Management Agency (FEMA) zone A 1-percent AEP flood area (Federal Emergency Management Agency, 2002). Zone A means that detailed hydraulic analyses have not been done, and no water-surface elevations have been computed.
Simulation of Streamflow Extents and Hydraulic Characteristics
Base flow and flood-inundation extents for the 50-, 20-, 10-, 4-, 2-, and 1-percent AEP floods were simulated under 2021 conditions and two possible restoration modification scenarios using a 2-D unsteady hydraulic model in the HEC-RAS computer program, version 6.5.0 (U.S. Army Corps of Engineers, 2024). Most of the topography data used in this study were collected in 2021; therefore, 2021 conditions represent the present-day conditions. The tasks necessary for the development of flood-inundation maps and hydraulic characteristics of the study area are described below:
-
1. Computation of the minimum base flow of USGS streamgage (09418700), Meadow Valley Wash near Rox, Nev., using the minimum 7-day flow for the water years 2020–23;
-
2. Flood-frequency analysis of the USGS streamgage to estimate the 50-, 20-, 10-, 4-, 2-, and 1-percent AEP floods using data from water years 1988–94, 2002–05, and 2021–23;
-
3. Collection of topographic data for the stream channel and floodplains in the study area;
-
4. Creation of a digital elevation model (DEM) of 2021 conditions;
-
5. Estimation of roughness values for the stream channel and floodplains. Surveyed water-surface elevations, from near base flow, and high-water marks from the March 16, 2023, flood were used to calibrate the roughness values;
-
6. Simulation of base flow and flood-inundation extents for 2021 conditions using a 2-D unsteady hydraulic model in HEC-RAS;
-
7. Editing of topographic data for simulating two possible restoration modification scenarios; and
-
8. Simulation of base flow and flood-inundation extents for possible restoration modifications using a 2-D unsteady hydraulic model in HEC-RAS.
Hydrologic Data and Analysis
Streamflow data have been collected near or in the study area by USGS streamgage (09418700), Meadow Valley Wash near Rox, Nev., from 1987 to 1994, 2001 to 2005, and 2020 to 2025 and are published in the USGS National Water Information System (U.S. Geological Survey, 2024a). Before May 2003, the streamgage was approximately 2 miles upstream and had a different base flow condition because there is a spring between the two locations adding additional streamflow. From May 2003 to September 2005, the streamgage had a different base flow condition as indicated by the fact the site went dry for several months in 2003 and 2004. It is unknown why the site would go dry; it is possibly related to irrigation diversion at a former farm 1 mile upstream or flow remaining completely within the subsurface (the channel bed was about 2 ft higher in elevation in 2003). The largest flood on record measured at the streamgage was in January 2005, which caused substantial geomorphic changes to the stream channel, incising the channel 5–10 ft. Either because this incision caused subsurface flow to become surface flow, or the January 2005 flood resulted in bank storage, the site changed from an intermittent to perennial stream in the study area. Another large flood in December 2010 may have caused additional incision or deposition to the stream channel or bank storage resulting in possible changes in surface flow. Consequently, only baseflow data from the 2020–25 streamgage location was used to calculate baseflow by averaging the lowest continuous 7-day-streamflow periods for water years 2020–23.
Flood-stage streamflow was assumed to be similar between the two streamgage locations because there was less than a 1-percent difference in drainage area (2,380 square miles [mi2] and 2,400 mi2). Because the streamgage record is short (only 14 annual peaks), an attempt was made to statistically augment the record; however, no nearby streamgage had a large enough correlation to warrant the augmentation (Siefken and McCarthy, 2021). Flood-frequency analyses can also be improved by weighting the at-gage results with estimates from regional regression equations (England and others, 2018); however, this method could not be used for this location because the drainage basin area (2,400 mi2) was larger than the maximum area applicable for regional regression equations (Thomas and others, 1997). Therefore, only the streamgage record was used in a flood-frequency analysis, which was completed using PeakFQ version 7.5.1 to determine the 50-, 20-, 10-, 4-, 2-, and 1-percent AEP floods (U.S. Geological Survey, 2022). The annual maximum instantaneous peak streamflows recorded at the streamgage were fitted to a log-Pearson Type III distribution (England and others, 2018). The shape (skew) of the distribution can be affected at very large discharges and is typically improved by also using an average skew from other long-term streamgage records in the same region (England and others, 2018). The skew was weighted between station and regional skew (set at 0 with the variance at 0.31 based on the latest regional skew study [Thomas and others, 1997]). Additionally, the distribution may be affected by low annual peak streamflows that are considered outlier values. Such outliers can have inappropriately large effects on the distribution of much higher discharge values because they are often the result of different hydrologic processes causing smaller and larger floods (England and others, 2018). For these reasons, streamflows less than 50 ft3/s were excluded from the analysis for being potentially influential low flows. The perception threshold for the gaps (1995–2001, 2006–20) was set as the 2005 peak (7,500 ft3/s) because it was the largest peak in the modern-day gaging record (Ryan, 2006) and possibly the largest flood in lower Meadow Valley Wash since October 1946 (U.S. Army Corps of Engineers, 1974).
The flood-frequency analysis was used to estimate peak streamflow, but the unsteady hydraulic model requires a complete flood hydrograph. All floods at the Meadow Valley Wash near Rox, Nev., streamgage with a complete hydrograph were less than the 10-percent AEP streamflow, and only two floods (February 1993 and March 2023) were greater than the 20-percent AEP streamflow. The largest flood of Meadow Valley Wash with a complete flood hydrograph at any streamgage was the December 2010 flood at the upstream (Meadow Valley Wash near Caliente, Nev.—09418500; U.S. Geological Survey, 2024b) and downstream (Muddy River near Glendale, Nev.—09419000; U.S. Geological Survey, 2024c) streamgages. The Meadow Valley Wash near the Rox, Nev., streamgage was not in operation at the time, but based on the two other streamgages, the flood was likely between a 10-percent and 2-percent AEP streamflow event at Stuart Ranch. When only the main peak of all four largest flood hydrographs were compared (February 1993 and March 2023 at Meadow Valley Wash near Rox, Nev.—09418700; Dec 2010 at Meadow Valley Wash near Caliente, Nev.—09418500; Dec 2010 at Muddy River near Glendale, Nev.—09419000), they were generally symmetrical with only minor skew and had only small variations in peak duration (fig. 4). Therefore, the estimated hydrographs were shaped based on a second-order polynomial setting the peak discharge, as estimated from the flood-frequency analysis. This estimation technique likely does a poorer job of estimating flood hydrograph shape lower on the recession; however, because the focus of this study was on the peak itself, it was deemed a reasonable approach.
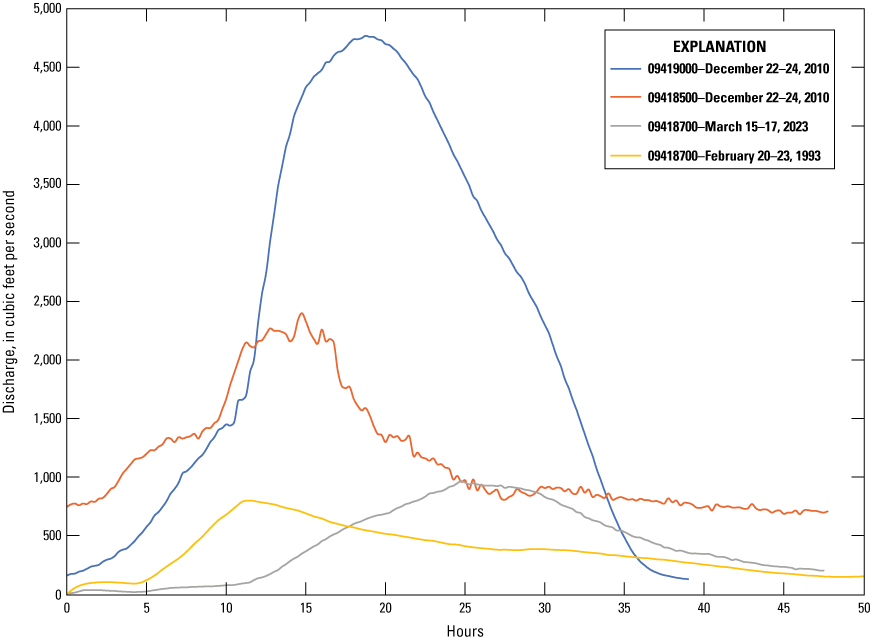
Observed hydrographs for selected floods, U.S. Geological Survey streamgages: (09418500), Meadow Valley Wash near Caliente, Nevada, (09418700) Meadow Valley Wash near Rox, Nevada, and (09419000) Muddy River near Glendale, Nevada. Refer to figure 1 for streamgage locations.
Topographic and High-Water Mark Data
High-resolution lidar data was not available for the study area; therefore, surveying was needed to collect topography data. Global Navigation Satellite System (GNSS), total station (TS), and terrestrial lidar scan (TLS) surveys were used to collect (1) high-resolution topography data to create a DEM of the area, (2) ground control points (GCP) to determine the accuracy of the DEM, and (3) water-surface elevations from near base flow conditions and high-water marks (HWM) of the March 16, 2023, flood for model calibration. Densely vegetated riparian areas were surveyed using either real-time kinematic (RTK)-GNSS or TS surveys. Sparsely vegetated floodplains were surveyed using a TLS or RTK-GNSS. No usable published benchmarks could be located near the survey area, so level 1 and level 2 single-baseline static and level 2 and level 3 single-baseline rapid static surveys were completed with a Leica GS14 GNSS receiver at 17 established reference marks and were used for survey control (Rydlund and Densmore, 2012). Survey data were collected between December 2020 and January 2024, but mostly in 2021.
Single-base RTK-GNSS surveys were completed using Leica GS14 GNSS receivers. Points were collected at 1-second intervals for 3 minutes (180-epochs) at reference marks, 1-second intervals for 30 seconds (30-epochs) at GCPs and HWMs, and 1-second intervals for 5 seconds (5-epochs) at topographic points. For every day of RTK-GNSS surveying, opening, blunder, and closing checks were completed on a reference mark and had vertical error from the static surveys from −0.041 ft to 0.098 ft. Open traverse style TS surveys were completed using a Leica MS60 (Noll and Rydlund, 2020). The TS surveys started and ended on reference marks and had vertical errors from the static surveys from −0.036 to 0.030 ft. A total of 8,921 points were collected by either RTK-GNSS or TS surveys and defined as ground points.
Open traverse style TLS surveys were completed using a Leica MS60. A total of 44 scan setups were used to collect 360-degree scans. Each scan produced a point cloud of X, Y, and Z data that were geo-referenced to the scan origin. More than 3 million points were collected from the TLS surveys. The TLS surveys were started on reference marks. Because of the limited number of instrument setup changes, not all TLS surveys were completed on reference marks, but those that were completed had vertical errors from −0.018 to −0.045 ft. Terrestrial lidar scan point cloud data must be filtered of extraneous data, primarily vegetation, to define ground points. Terrestrial lidar scan points were filtered and thinned using an iterative process in Global Mapper 25.0 (Blue Marble Geographics, 2023). First, minimum elevation TLS points were defined for a 1 square-foot (ft2) grid. These minimum TLS points were then classified as “ground points” and were then filtered using a 3-ft2 3-dimensional grid to remove excess noise that remained on steep slopes and in places experiencing shadowing from vegetation. A total of 27,637 TLS points were defined as ground points.
Topographic data from RTK-GNSS, TS, and TLS surveys defined as ground points were combined to form a 2-ft-resolution DEM using ArcGIS Pro. During preliminary stages of modeling base flow conditions in HEC-RAS, at approximately 1,220 ft downstream from the upstream modeled boundary, flow was only entering the east channel and not the main (west) channel, as represented in 2021 conditions. This finding could be due to (1) sparse survey data in this section of the reach or (2) shifting channel morphology among surveys. Therefore, an additional 67 points were manually added as ground points based on surrounding ground elevations and incorporated into the DEM to provide higher spatial resolution and direct modeled flow solely into the main channel under base flow conditions.
To determine the vertical accuracy of the final DEM, 83 GCPs were surveyed using a separate RTK-GNSS survey. The median elevation of the GCPs was 0.069 ft higher than the DEM, with the largest errors on steep slopes and locations where topographic survey points were sparser. The vertical accuracy (root mean square error) of the DEM, as determined by the GCPs, was 1.043 ft, with a 95-percent confidence interval of 3.043 ft. This amount of error is within the vertical accuracy on medium-flood risk, hilly floodplain maps suggested by the Federal Emergency Management Agency (2022).
Roughness Coefficients
In addition to topography, hydraulic characteristics are controlled by energy losses due to friction with the material and vegetation, as defined by the roughness coefficient (Manning’s n). Depending on the model scenario, 12–16 total roughness coefficients were spatially delineated and assigned by using a combination of field notes and photos during topographic surveys, aerial imagery, and comparison with similar roughness coefficients outlined in Barnes (1967) and Aldridge and Garrett (1973). For the more densely vegetated areas, roughness coefficients were assigned by adjusting for surface irregularities, obstructions, and vegetation using Cowan’s method (Arcement and Schnieder, 1989). For more sparsely vegetated areas, coefficients were assigned based on the values presented in Chow (1959).
Roughness coefficients throughout the reach varied based on the simulated flow conditions. The initial roughness coefficients were used when modeling the calibration low flow (1.77 ft3/s; hereafter referred to as “near base flow”) and high flow (966 ft3/s) models and were adjusted in an iterative process until acceptable calibration was achieved, as detailed in the "Hydraulic Model Calibration" section. The final roughness coefficients defined in these calibrated near base flow and high flow models were used in the base flow and 50-, 20-, 10-, and 4-percent AEP scenarios, respectively. For the 2- and 1-percent AEP scenarios, historic photographs after the January 2005 flood (7,500 ft3/s; TrainWeb, 2005) and 2006 aerial imagery from the National Agriculture Imagery Program (U.S. Geological Survey, 2006) were used as a guide to assign roughness coefficients. Large amounts of vegetation from the modeled reach were removed during this flood; therefore, roughness coefficients were lowered to account for the vegetation reduction with the largest floods.
Roughness coefficients among all modeled scenarios ranged from 0.035 to 0.15. For the main channel, values ranged from 0.05 to 0.15. The lowest coefficients were determined in areas with moderate vegetation and sandy bed material, whereas the highest coefficients were determined in areas with thick mesquite, tamarisk, and cattails, particularly in scenarios with shallow water depths. For the floodplain, values ranged from 0.035 to 0.10. The lowest coefficients were placed in areas with hardpan sandy washes, roads, and minimal vegetation, whereas the highest coefficients were placed in areas with large boulders along steep banks or pockets of mature tamarisk. The large range of roughness coefficients is indicative of the wide variety of bed material and vegetation composition in the study area.
Hydraulic Model Development
A 2-D unsteady hydraulic model was created in HEC-RAS (U.S. Army Corps of Engineers, 2024) to simulate the extent of base flow and flood inundation extents under the 2021 conditions and possible restoration modifications along the Meadow Valley Wash study reach. The final DEM (as described in the “Topographic and High-Water Mark Data” section) was the primary data input for the model. Model cells were variable, with 6 by 6 ft and 10 by 10 ft as the default size for the base flow and AEP flood flows, respectively. At locations of rapidly changing topography, such as ditches, roads, and berms, breaklines and clusters of smaller cell sizes were incorporated to orient cells and provide high-resolution modeling. The upstream model boundary for the base flow and various AEP-flood scenarios was set using the corresponding hydrograph, as described in the “Hydrologic Data and Analysis” section. The downstream model boundary was set to a normal depth slope of 0.005. The water-surface slope from (1) the surveyed water-surface elevations collected near base flow conditions and (2) the HWMs from the March 16, 2023, flood matched the bed slope of 0.005.
The hydrographs used to simulate the different streamflow scenarios (base flow and AEP-flood inundation extents) under 2021 conditions were also used to simulate the streamflow scenarios under the two possible restoration modification scenarios. However, the roughness coefficients varied slightly among the streamflow simulations under 2021 conditions and simulations under the possible restoration modifications because the possible restoration modifications would likely result in an increase of areas with dense riparian vegetation in areas of new base flow channels. An average value of 0.065 was used for these areas. Additionally, the roughness coefficients for the area encompassing the excavated irrigation reservoir modification was adjusted to 0.05 for all streamflow scenarios modeled under the possible restoration conditions to match the roughness of the areas adjacent to the irrigation reservoir.
Hydraulic Model Calibration
Model calibration was done for near baseflow (1.77 ft3/s) and high flow (966 ft3/s) conditions using surveyed water-surface elevations and HWMs, whereas calibration for the AEP streamflow scenarios was not possible. Roughness coefficients were iteratively adjusted to minimize the differences between simulated and surveyed water-surface elevations. Calibrations indicated that the simulated water-surface elevation was sensitive to channel and riparian roughness coefficients, and less sensitive to floodplain roughness coefficients. The largest differences between simulated and surveyed water-surface elevations were near the downstream end of the reach, approximately 2,100–4,200 ft downstream from the streamgage under near base flow (fig. 5A) and high flow (fig. 5B) conditions. This finding is likely due to beaver dams, which potentially affect base flow and shifting channel morphology as a result of floods (affecting high flow). For near base flow calibration, a total of 20 water-surface elevations were surveyed in the study area during an RTK-GNSS survey on November 4, 2021. The mean flow for this date was 1.77 ft3/s. Additionally, simulated velocity was compared to a direct discharge measurement at similar discharge (1.70 ft3/s) made 15 ft downstream from the streamgage on October 20, 2021. The calibrated near base flow model simulated surveyed water-surface elevations by an average of 0.15 ft too high (fig. 5A), indicating that roughness coefficients might be too large, whereas simulated mean velocity was 0.18 feet per second (ft/s) too large, indicating roughness coefficients might be too low. Nonetheless, given the relatively low resolution in topography for this small channel, these results were deemed acceptable.
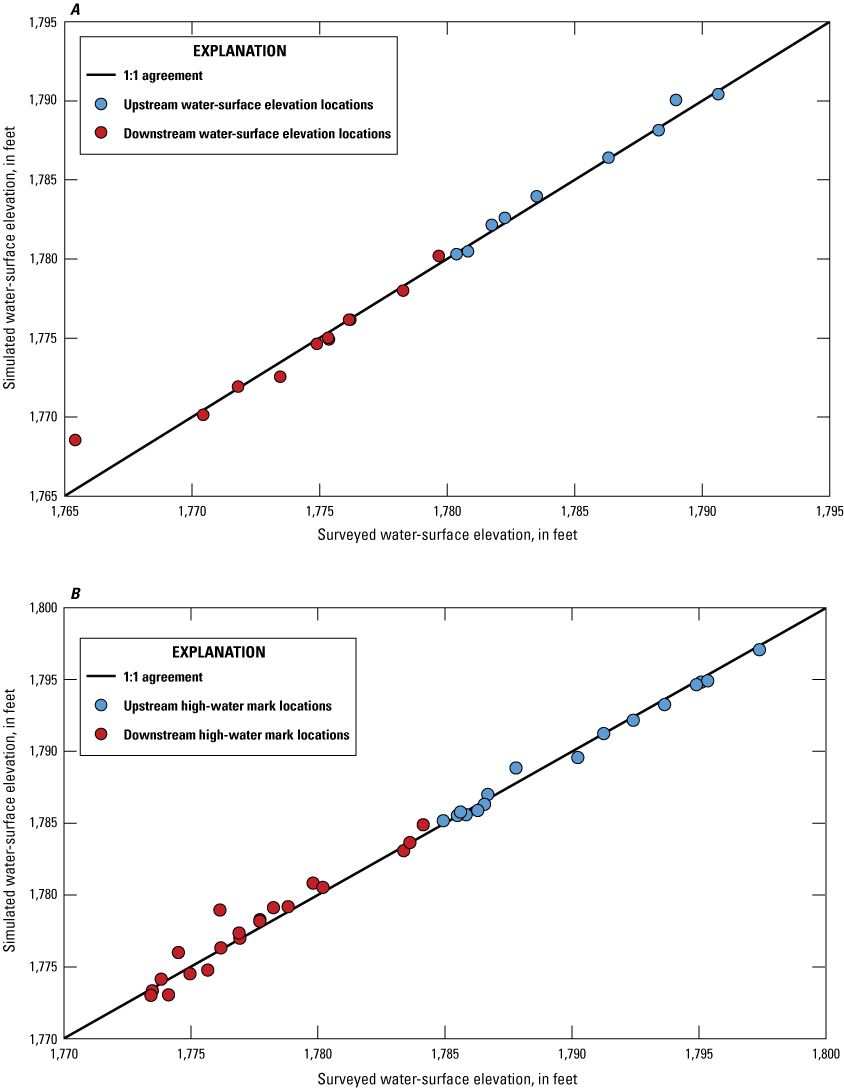
Simulated versus surveyed water-surface elevations for A, November 4, 2021, near base flow (1.77 cubic feet per second); and B, March 16, 2023, flood high-water marks (966 cubic feet per second), Meadow Valley Wash at Stuart Ranch near Rox, Nevada.
For high flow calibration, a total of 36 HWMs rated fair (±0.20 ft) to good (±0.10 ft; Koenig and others, 2016) from the March 16, 2023, flood were surveyed in the study area by RTK-GNSS on April 25, 2023. The computed discharge for this flood was 966 ft3/s. The calibrated high flow model simulated surveyed surface water elevations by an average of 0.14 ft too high (median 0.040 ft too high), with most of the larger error (more than ±0.5 ft) located along the downstream end of the modeled reach; fig. 5B). Increased erosion in the side channels made the 2021 model results less comparable to the HWMs from the March 16, 2023, flood. Therefore, less emphasis was placed on the model calibration in this area. For both the near base flow and high flow calibrations, the differences are skewed, with the larger error (more than ±0.5 ft) accounting for only 20 and 33 percent of the water-surface elevations, respectively.
The 1-, 2-, 4-, and 10-percent AEP floods were above the maximum streamflow in the stage-discharge rating in 2024, so no model calibration using the stage-discharge rating could be performed. Instead, the gage height from the peak of record flood on January 11, 2005 (computed 7,500 ft3/s), was compared with the water-surface elevation for the simulated 2-percent AEP (7,376 ft3/s) at the upstream end of the modeled reach. The simulated 2-percent AEP water-surface elevation was 0.36 ft lower than the measured gage height (peak water-surface elevation) from the 2005 flood at the streamgage; however, this was deemed acceptable given that the 2005 flood was slightly higher in magnitude, and that significant changes to the channel shape and vegetation density have occurred since 2005.
Although the stage-discharge rating does cover the 20- and 50-percent AEP floods, the simulated water-surface elevations near the streamgage are each approximately 1 foot lower than the stage-discharge rating for the streamgage. This discrepancy is likely related to (1) channel changes due to floods affecting the stage-discharge relation at these lower floods and (2) uncertainty in the stage-discharge ratings at the streamgage, which is poor above base flow.
Development of Streamflow Inundation Extent and Hydraulic Characteristics Maps
Streamflow inundation extents, depth, and velocity were simulated using the HEC-RAS model. The inundation extents were exported as shapefile polygons, and additional edits were made in ArcGIS Pro. Fragmented inundation extents which are disconnected or isolated areas within the model output were present for each model run, but particularly at the low- to mid-range discharge scenarios (including base flow, 50-, 20-, and 10-percent AEP flows), and typically in the downstream half of modeled reach, where the inundation extent is more spread out. Fragmented inundation locations were mostly small (<5 ft2), a few hundredths to tenths of ft of water depth, and in most cases, isolated from the main inundation area. All fragmented inundation locations less than 3 ft2 were removed from the model results, and any remaining inundated locations that were detached from the main inundation area were examined and edited on a case-by-case basis to identify surface hydraulic connections using surrounding topography as a guide. If such a connection existed, the detached inundated area was retained and connection of the inundation extents was estimated; otherwise, the isolated inundation area was deleted.
To simulate the multiple possible restoration modifications, several adjustments were made to the 2021 terrain conditions in HEC-RAS. Two different possible restoration conditions were modeled—one with minimal modifications that are referred to as the “minor restoration modifications” and one with large modifications referred to as the “major restoration modifications.” The minor restoration modifications include an excavated area approximately 1,220 ft downstream from the streamgage intended to split flow into a side channel that is east of the main channel, hereafter referred to as side channel 1 (fig. 6A). This excavated area (the side channel 1 connector) is approximately 60 ft long, 7–9 ft wide, and assigned an elevation that is the same as the bottom of the main channel. Additionally, a BDA, represented in the model as an impermeable large woody debris, was placed 100 ft downstream from the end of the excavated area to back up water and ensure some flow remains in the main channel as well (fig. 6A). The BDA was 16 ft wide and 2 ft tall. Three additional BDA near the downstream end of the reach (beginning approximately 2,600 ft downstream from the streamgage) were tested to expand flow into the side channels (side channels 2 and 3) that are apparent in higher flow conditions. However, after multiple attempts, this effort was ineffective, likely because there is not enough base flow to split the channel in these locations. Therefore, these additional BDA modifications were not included in the final minor restoration modifications, and instead, elevation of the terrain was lowered to simulate excavated areas as part of the major restoration modifications.
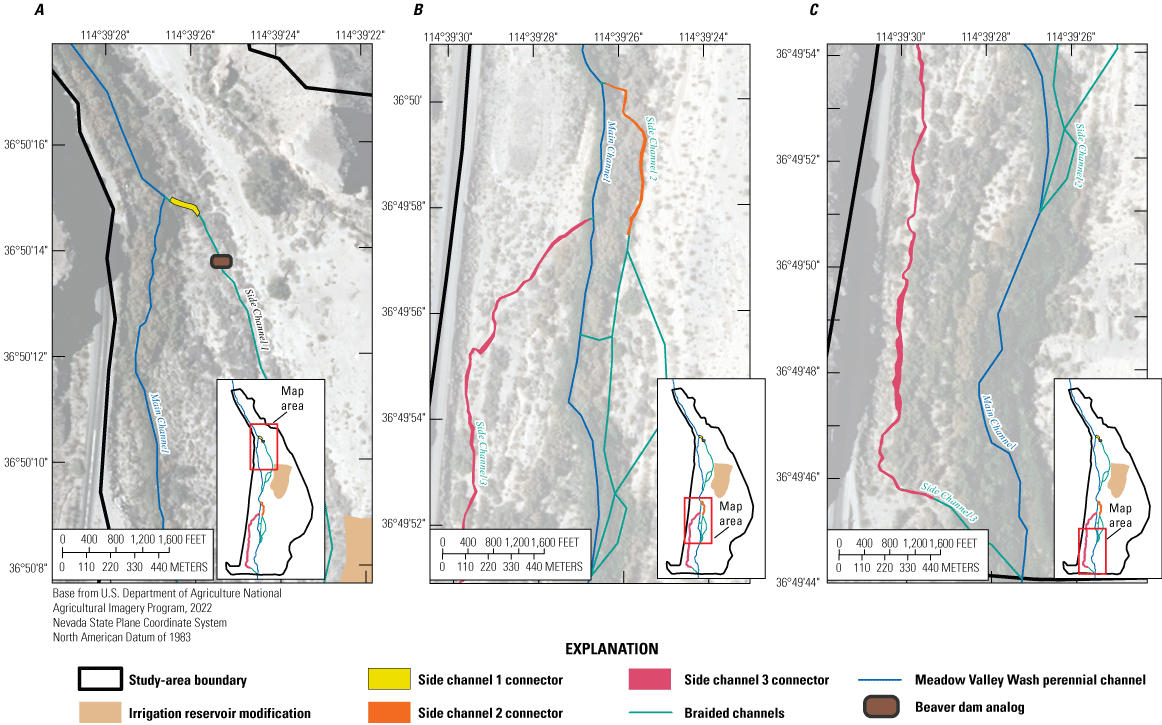
Location of possible minor and major restoration modifications, including A, side channel 1 connector and Beaver Dam Analog; B, side channel 2 and 3 connectors; and C, side channel 3 connectors and excavation of the irrigation reservoir, Meadow Valley Wash at Stuart Ranch, near Rox, Nevada.
In addition to the adjustments included in the minor restoration modifications (BDA and side channel 1 connector), the major restoration modifications include three additional excavated areas—two side channel connectors near the downstream end of the modeled reach, and one excavated and graded area that removes the irrigation reservoir and adjacent berm structure (figs. 6B, 6C). The two side channel connectors are excavated areas to ensure flow from the main channel splits and enters the respective side channels, hereafter referred to as “side channel 2” and “side channel 3.” The excavated area to connect flow into side channel 2, east of the main channel, begins approximately 2,800 ft downstream from the streamgage, measuring approximately 350 ft long, 2–7 ft wide, and assigned an elevation that is slightly lower than the bottom of the main channel. The excavated area to connect flow into side channel 3 begins approximately 3,000 ft downstream from the streamgage, measuring approximately 1,400 ft long, 5–17 ft wide, and assigned an elevation that is slightly lower than the bottom of the main channel and surrounding terrain, with decreasing elevation moving farther downstream. The excavated area surrounding the irrigation reservoir removes the berm structure by excavating and grading the surrounding terrain. The goal is to promote better connectivity between the stream and floodplain, especially at higher flows. This excavated area begins approximately 1,900 ft downstream from the streamgage and is 350 ft east of the main channel (directly adjacent to side channel 1; fig. 6) and is approximately 770 ft long and up to 375 ft wide. This excavated area is assigned with a slightly lower elevation than the terrain that is directly upstream from the modification, with gradually decreasing elevation throughout the excavated area.
Results
Base flow, which was determined by the lowest 7-day streamflow periods for water years 2020–23, was 0.92 ft3/s. The minimum base flow occurred in summer when highest evapotranspiration rates occur (DeMeo and others, 2008). A summary of the flood-frequency analysis, including the AEP and corresponding peak streamflow (ft3/s), are detailed in table 1. The computed 1-percent AEP flood of 13,750 ft3/s was similar to other computed values of 16,750 ft3/s (Otis Bay Ecological Consultants, 2010) and 15,470 ft3/s (Atkins, 2016), although both of those analyses were computed using older flood-frequency methods. More detailed results of the flood-frequency analysis, as well as the survey data, DEM, terrain modifications, 2-D hydraulic model, and model outputs (streamflow inundation extents, depth, velocity), are part of a USGS data release at https://doi.org/10.5066/P96HQ6F7 (Dye and Morris, 2025).
Table 1.
Summary of annual exceedance probability streamflows from U.S. Geological Survey streamgage 09418700 (U.S. Geological Survey, 2024a), Meadow Valley Wash near Rox, Nevada.Model-simulated base flow and flood-inundation extents for the 2021 conditions, and the minor and major restoration modifications are illustrated on figures 7–9. Figure 7 shows simulated inundation extents for base flow and figure 8 shows the 1-percent AEP. The remaining inundation extents (50-, 20-, 10-, 4-, and 2-percent AEP) are shown in figure 9. Additionally, maximum total area of inundation extents of each modeled flow scenario under each terrain condition (2021 conditions, minor and major restoration modifications) are provided in table 2. A geospatial dataset representing the simulated streamflow inundation extents and hydraulic characteristics was released as part of a corresponding USGS data release at https://doi.org/10.5066/P96HQ6F7 (Dye and Morris, 2025).
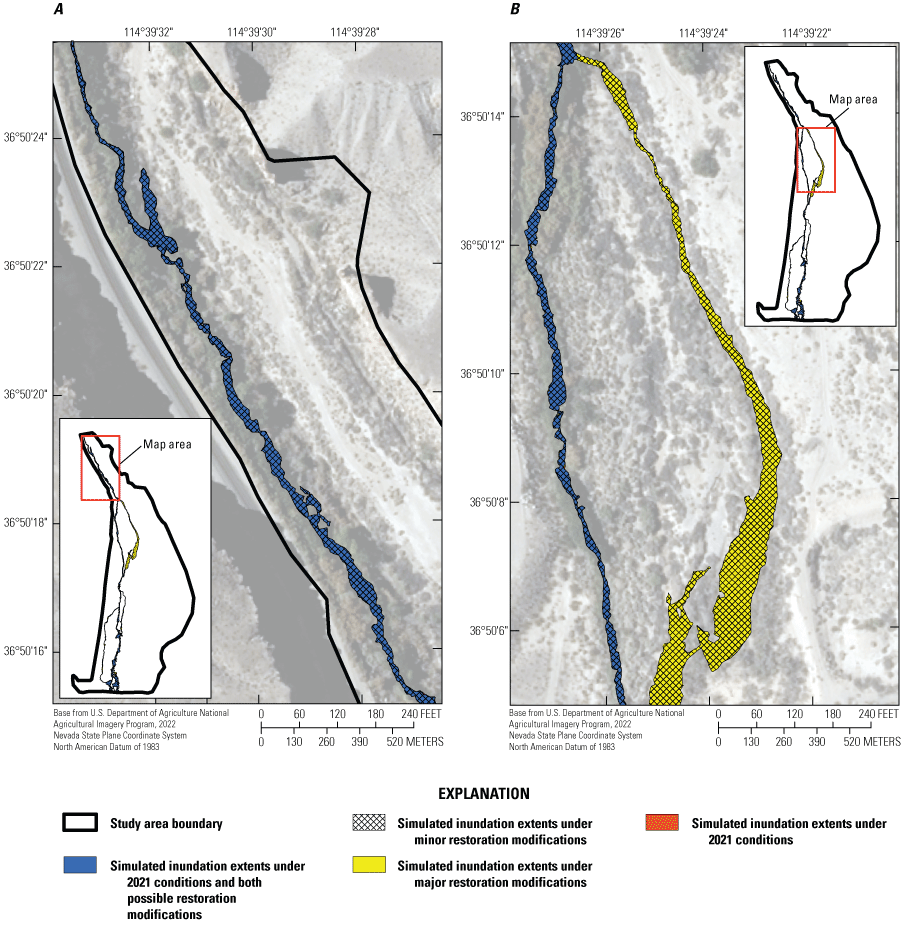
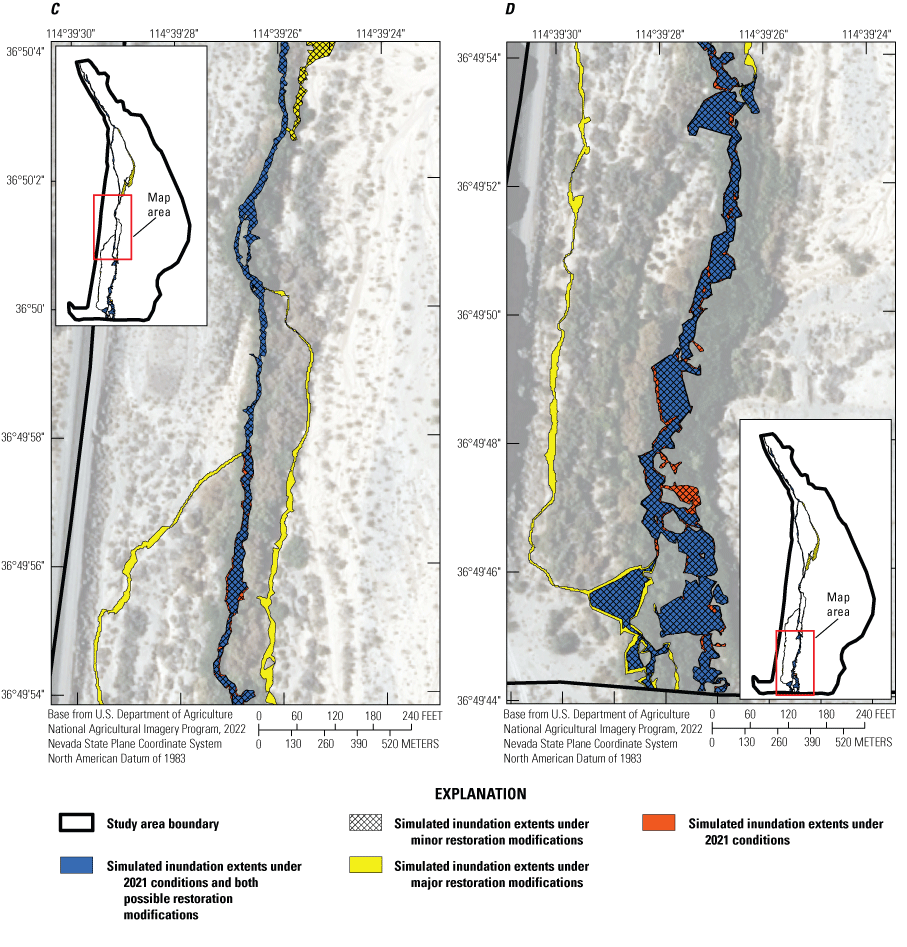
Comparison of simulated inundation extents for base flow under 2021 conditions and possible restoration modifications along the A, upstream; B, upper middle; C, lower middle; and D, downstream extents of Meadow Valley Wash at Stuart Ranch, near Rox, Nevada.
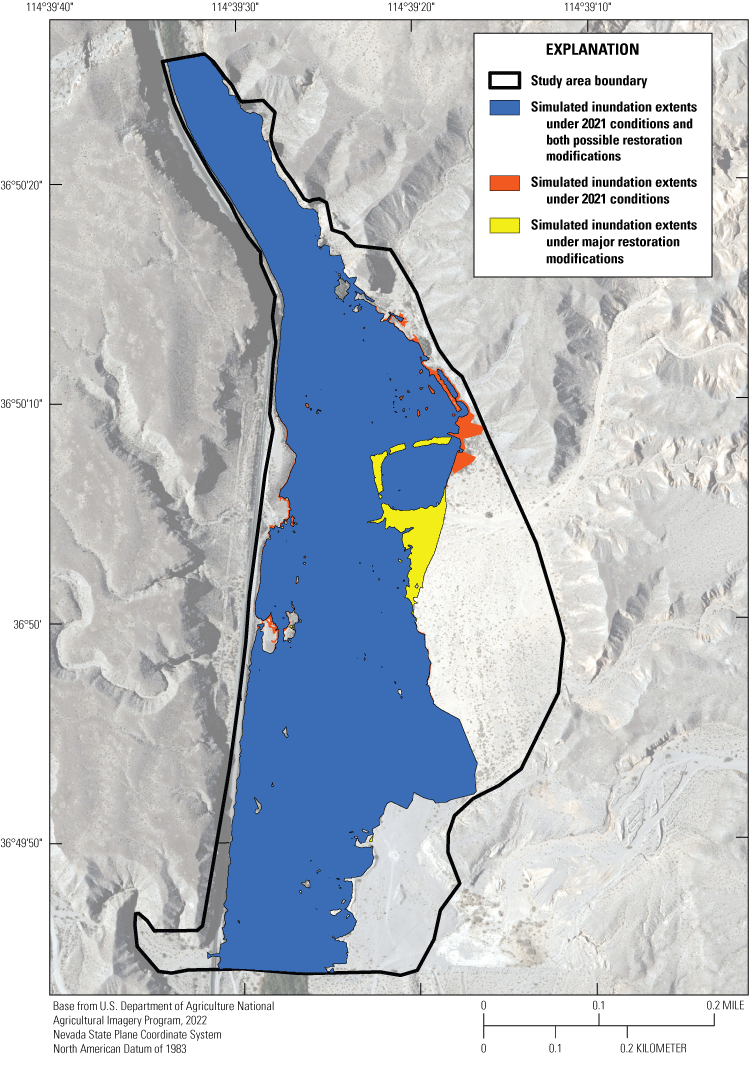
Comparison of simulated inundation extents for the 1-percent annual exceedance probability streamflow under 2021 conditions and possible restoration modifications, Meadow Valley Wash at Stuart Ranch, near Rox, Nevada.
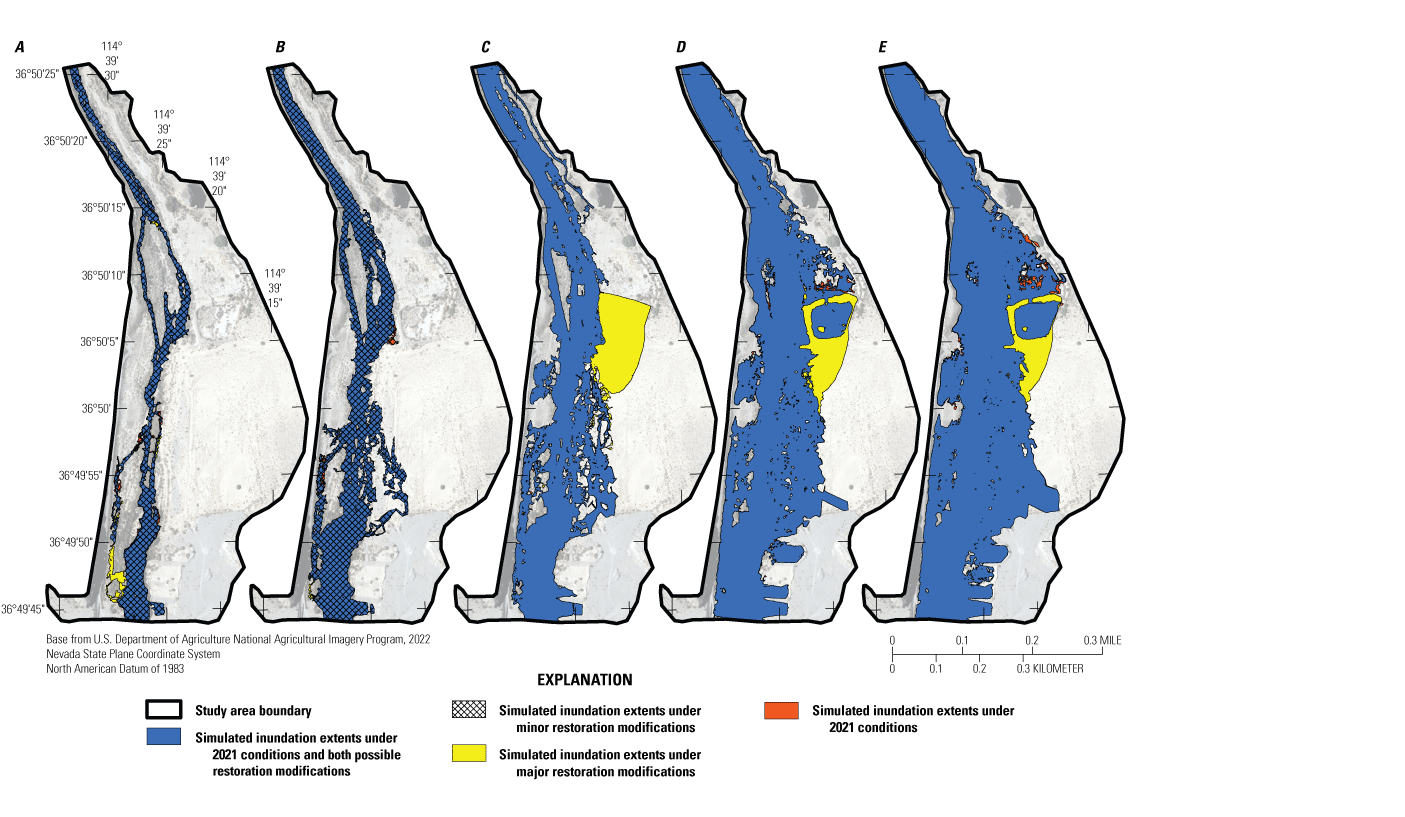
Comparison of simulated inundation extents for the A, 50-percent; B, 20-percent; C, 10-percent; D, 4-percent; and E, 2-percent annual exceedance probability streamflows under 2021 conditions and possible restoration modifications, Meadow Valley Wash at Stuart Ranch, near Rox, Nevada.
Table 2.
Maximum total area (United States survey acres) of each simulated streamflow scenario under 2021 conditions and possible minor and major restoration modifications at Meadow Valley Wash near Rox, Nevada.[AEP, annual exceedance probability]
2021 Conditions
For all streamflow simulations, under 2021 conditions, flow remains confined in the upper 1,220 ft of the modeled reach and spreads out progressively downstream (figs. 7–9). At base flow, streamflow inundation remains in a single main channel (figs. 7A–7D) but begins to enter side channels 1–3 and expand into the east floodplain with increased flood magnitude. Beginning at 50-percent AEP, streamflow begins to enter side channels (fig. 9A). At 20- and 10-percent AEP, streamflow begins to expand into the east floodplain (figs. 9B, 9C). The 4-, 2-, and 1-percent AEP simulations estimate flow to further expand into the floodplain and enter the irrigation reservoir (figs. 8, 9D, 9E). For all simulations, streamflow is at its deepest in the center of the main channel and some pooled areas furthest downstream, and fastest in the narrow sections of the main and side channels.
Possible Restoration Modifications
Under the minor restoration modifications, the largest difference in inundation extent occurs at base flow, in which streamflow begins to enter side channel 1 (fig. 7B). Minimal changes in inundation extent occur at 50-percent AEP (fig. 9A), and there are no changes for the remaining AEP scenarios; therefore, only the results for base flow and 50-percent AEP are provided. Under the major restoration modifications, there are changes in inundation extent for all streamflow scenarios. At base flow, in addition to flow entering side channel 1, flow now also enters side channels 2 and 3 and reconnects with the main channel farther downstream (figs. 7C, 7D). The largest difference in inundation extent occurs at 10-percent AEP, such that the modifications made to the irrigation reservoir berm now allow flow to expand farther east beginning at 10-percent AEP, as opposed to 4-percent AEP under 2021 conditions (fig. 9C). For all streamflow scenarios under both the minor and major restoration modifications, but most notably at base flow and lower AEP floods, the inundation extent, depth, and velocity in the main channel decreases slightly under both minor and major restoration modifications, as compared to 2021 conditions. This finding is expected, given that flow is being split to accommodate more area within the modeled reach.
Discussion
For all streamflow scenarios, with the exception of 20-percent AEP, the inundated extent area increased with possible restoration (table 2). For the 20-percent AEP scenario, the inundated area did not increase between 2021 conditions and the minor restoration modifications, and actually decreased under major restoration modifications (table 2). This finding is due to differences in elevation in a small area near the western edge of the irrigation reservoir between the 2021 terrain and major restoration modifications. For all other modeled scenarios, inundated area increased by as little as 0.21 acres (50-percent AEP) and as much as 5.45 acres (10-percent AEP) between the 2021 conditions and the major restoration modifications (table 2). As mentioned above, under the major restoration modifications, streamflow would begin to expand farther east near the irrigation reservoir at lower magnitude floods (at least 10-percent AEP), rather than at 4-percent AEP, thus providing increased connectivity into the floodplain under additional flood conditions. For the minor restoration modifications, only the base flow and 50-percent AEP scenarios had changes in inundation extent. Therefore, the remaining higher flow scenarios are not modeled under the minor restoration modifications.
For base flow, inundation extent, depth, and velocity varied slightly between 2021 conditions and the minor and major restoration modifications. Under 2021 conditions, flow covered 2 acres total, in which flow remained primarily in the main channel throughout the modeled reach until nearing the most downstream end where flow began to spread out. Mean depth is 0.41 ft, in which the narrow stretches and pooled areas of the main channel were typically deepest. Mean velocity is 0.15 ft/s, in which the narrow stretches and center of the main channel were typically the fastest. In the minor restoration modifications, the excavated area and BDA successfully split flow from the main channel so that water now enters side channel 1 (figs. 6A, 7B). In addition to the modifications made in the minor restoration modifications, the two excavated areas incorporated in the major restoration modification splits water from the main channel and into side channels 2 and 3 farther downstream. The inundated extent increased to 2.84 and 3.03 acres under the minor and major restoration modifications, respectively. There was a minor increase in mean depth to 0.48 ft under both minor and major restoration modifications. The mean velocity decreased to 0.11 and 0.10 ft/s under the minor and major restoration modifications, respectively. Compared to 2021 conditions, both depth and velocity decreased within the main channel in locations where the excavated side channel connector modifications were introduced, and streamflow was split into the side channels. The increases in base flow area under possible restoration could potentially increase the total area of riparian vegetation and expand habitat conditions for native species at Stuart Ranch, especially along the braided sections (side channels) where base flow is re-established.
Uncertainties and Limitations
The flood-frequency analysis, hydraulic model, and simulated flood-inundation extents contain some uncertainties and limitations. The streamgage record is short (14 years) with temporal gaps, and only two of the recorded peaks exceed the 10-percent AEP flow, resulting in a large uncertainty in AEP estimates. The base flow streamflow for the most recent gaged period (2020–23) has been generally consistent, but data from before the January 2005 flood scour found the site could go dry in the summer of certain years, indicating that the amount of base flow surface water is highly dependent on channel morphology. A flood that caused a large amount of sediment fill to be deposited in the reach could again reduce base flow surface water to zero.
The surveyed data used to create the DEM was collected over several years (2020–24), and given the dynamic nature of the channel, there are some changes over time that had to be corrected manually so that the DEM represented 2021 conditions (the year in which most of the topographic data were surveyed). Specifically, 67 manual topographic points with assigned elevations were added at approximately 1,220 ft downstream from the streamgage to prevent flow from entering side channel 1 at base flow and to ensure that flow remained in the main channel. Additionally, the survey points are not uniform across the landscape, such that some areas (for example, sections nearest to the TLS station) have a higher concentration of points, and other areas (for example, some sections of the vegetated riparian zone and east floodplain) have fewer points.
Model calibration was limited to water-surface elevations from near base flow and HWMs from a single flood between a 20- and 10-percent AEP event. Based on the January 2005 flood, large floods remove most vegetation from the channel, drastically reducing the roughness coefficient, but there were no calibration data available for this condition, so roughness coefficients had to be estimated for the largest flows. The roughness coefficients used in the hydraulic model may vary from real-world values, especially for riparian areas with dense and variable vegetation classes where there is limited published data. A lower roughness coefficient would decrease the water-surface elevation, inundation extent and stream depth while increasing stream velocity. A higher roughness value would increase the water-surface elevation, inundation extent, stream depth, and decrease stream velocity.
The lowest flow simulations, particularly flows representing base flow, do not visually connect in some reaches of the modeled area. These occurrences are likely a function of poor topographic resolution and cell size configuration in these areas of the modeled reach. Supplemental cells were added in these locations of disconnected flow to provide more robust computation but did not resolve all occurrences. Therefore, the fragmented flow inundation boundary areas were edited in ArcGIS Pro to best estimate real-world conditions.
Lastly, flow is highly sensitive to specific modification parameters, such as elevation, dimensions, placements used for the dug side channels connections and the BDA, such that very minor changes to the terrain modification will significantly alter the flow path. For example, at base flow, if the BDA incorporated in the minor restoration modification was too tall, all flow would remain in the main channel, and the east channel downstream from the BDA would remain dry. Conversely, if the BDA was too short, flow would not experience enough backwater, and the main channel would go dry. Also, given that the BDA is considered an impermeable structure in the model, additional uncertainties exist, including if it would be able to hold the same amount of water under fluctuating base flow conditions and how well it would remain intact throughout the duration of a flood. Multiple modeling iterations were done until a balance was struck so that flow would properly split into side channel, and remain in the main channel, and then reconnect downstream. The height, depth, elevation, and placement of the terrain modifications when doing actual channel work would likely have to be adaptively managed to strike the correct balance.
Summary and Conclusions
A series of model-simulated base flow and flood-inundation extent and hydraulic characteristics (depth and velocity) datasets were developed for the Bureau of Land Management’s Stuart Ranch Project Area near Rox, Nevada. The Bureau of Land Management has suggested possible excavation, grading, and incorporation of beaver dam analogs to increase streamflow inundation extent throughout the modeled reach. A digital elevation model was created using surveyed topographic data within the study area and was used to develop a two-dimensional hydraulic model. Base flow was computed using the minimum 7-day flow at the U.S. Geological Survey Meadow Valley Wash near Rox, Nevada, streamgage (09418700), whereas the Annual Exceedance Probability (AEP) streamflows were computed using a flood-frequency analysis of the U.S. Geological Survey streamgage.
Base flow and AEP streamflows were used with the hydraulic model to determine inundation extents, as well as corresponding hydraulic characteristics for the study area, under 2021 and two possible restoration conditions. Model simulations indicate that for the 2021 conditions, streamflow is more confined in the upper 1,220 feet (ft) of the modeled reach and begins to spread out farther downstream, especially at higher flows. Additionally, streamflow is deepest in the channel center and in some downstream pooled areas, and flow is fastest in narrow sections of the channel, especially in the most upstream part of the modeled reach. At base flow, streamflow remains in a singular main channel until the most downstream end, in which water spreads out and pools. At the 50-percent AEP, streamflow begins to enter side channels. At 20- and 10-percent AEP, streamflow begins to expand onto the east floodplain. The 4-, 2-, and 1-percent AEP simulations estimate flow to farther expand into the floodplain, as well as flow into the irrigation reservoir.
The minor restoration modifications include one excavated side channel connector and beaver dam analog, which splits flow from the main channel into side channel 1, beginning approximately 1,220 ft downstream from the streamgage. Compared to 2021 conditions, the largest difference was in base flow inundation extent, with minor changes to 50-percent AEP and no changes to the remaining AEP scenarios. In addition to the adjustments made in the minor restoration modifications, the major restoration modifications include two excavated side channel connectors beginning approximately 2,800 ft downstream from the streamgage and grading of the irrigation reservoir and surrounding berm. Compared to 2021 conditions, the largest difference was at 10-percent AEP inundation extent, because flow now enters the graded landscape that replaced the berm. Under base flow conditions, altering the terrain using the minor restoration modifications increases the inundated extent by approximately 1 additional acre. However, if incorporating the major restoration modifications, the inundated extent increases by less than an additional quarter of an acre. In other words, under base flow conditions, there is not a significant increase in inundated extent when incorporating minor versus major restoration modifications. Thus, it is unlikely that major restoration will increase riparian vegetation and habitat for native species under base flow conditions more than minor restoration modifications. Furthermore, the major restoration modifications only indicate a substantial increase in inundated area under large floods (of at least 10-percent AEP in magnitude); otherwise, the results are relatively similar to the minor restoration modifications.
Given the dynamic nature of this modeled reach, the results presented here are an estimate and may vary from real-world conditions. Additionally, the terrain adjustments presented in the possible restoration modifications are highly sensitive to their constructed parameters (placement, dimensions, and elevation). Thus, the modifications constructed in the actual environment may differ slightly from what is presented here.
References Cited
Aldridge, B.N., and Garrett, J.M., 1973, Roughness coefficients for stream channels in Arizona: U.S. Geological Survey Open-File Report 73–3, 87 p., accessed July 2, 2024, at https://doi.org/10.3133/ofr733.
Arcement, G.J., Jr., and Schnieder, V.R., 1989, Guide for selecting Manning’s roughness coefficients for natural channels and flood plains: U.S. Geological Survey Water-Supply Paper 2339, 38 p. [Available at https://doi.org/10.3133/wsp2339.]
Atkins, 2016, 2016 Flood control master plan update Muddy River and tributary washes: Las Vegas, Nev., Clark County Regional Flood Control District, prepared by Atkins, Henderson, Nev., [variously paged; 557 p.], accessed June 4, 2024, at http://gustfront.ccrfcd.org/pdf_arch1/MasterPlans/Muddy%20River%20(Moapa%20Valley)/2016/Muddy%20River%20and%20Tributaries%20Flood%20Control%20Master%2 0Plan%20Update%20-%202016.pdf.
Barnes, H.H., Jr., 1967, Roughness characteristics of natural channels: U.S. Geological Survey Water-Supply Paper 1849, 213 p. [Available at https://doi.org/10.3133/wsp1849.]
Blue Marble Geographics, 2023, Global Mapper (ver. 25.0): Blue Marble Geographics software release, accessed November 1, 2023, at https://www.bluemarblegeo.com/global-mapper-download/.
Bureau of Land Management [BLM], 2009, Temporary closure at Stuart Ranch, Clark County, NV: Federal Register, v. 74, no. 84, p. 20499–20500, accessed December 17, 2021, at https://www.federalregister.gov/d/E9-10128.
Bureau of Land Management [BLM], 2017, BLM Nevada sensitive and status species list: Bureau of Land Management document, accessed November 6, 2020, at https://www.blm.gov/sites/blm.gov/files/policies/2017%20Final%20BLM%20NV%20Sensitive%20and%20Special%20Species%20Status%20List%20.pdf.
DeMeo, G.A., Smith, J.L., Damar, N.A., and Darnell, J., 2008, Quantifying ground-water and surface-water discharge from evapotranspiration processes in 12 hydrographic areas of the Colorado Regional Ground-Water Flow System, Nevada, Utah, and Arizona: U.S. Geological Survey Scientific Investigations Report 2008–5116, 22 p., accessed April 16, 2024, at https://doi.org/10.3133/sir20085116.
Dye, L.A., and Morris, C.M., 2025, Geospatial data, flood-frequency analysis, and surface-water model archive for streamflow extents and hydraulic characteristics of Meadow Valley Wash at Stuart Ranch, near Rox, Nevada: U.S. Geological Survey data release. [Available at https://doi.org/10.5066/P96HQ6F7.]
England, J.F., Jr., Cohn, T.A., Faber, B.A., Stedinger, J.R., Thomas, W.O., Jr., Veilleux, A.G., Kiang, J.E., and Mason, R.R., Jr., 2018, Guidelines for determining flood flow frequency—Bulletin 17C (ver. 1.1, May 2019): U.S. Geological Survey Techniques and Methods, book 4, chap. B5, 148 p. [Available at https://doi.org/10.3133/tm4B5.]
Federal Emergency Management Agency, 2002, Flood insurance rate map [Clark County, Nevada, and incorporated areas, FIRM panel 32003C0275 E]: Federal Emergency Management Agency interactive map database, accessed April 27, 2023, at https://msc.fema.gov/portal/search.
Federal Emergency Management Agency, 2022, Guidance for flood risk analysis and mapping—Elevation guidance: Federal Emergency Management Agency report, 18 p., accessed April 24, 2023, at https://www.fema.gov/sites/default/files/documents/fema_elevation-guidance_112022.pdf.
Koenig, T.A., Bruce, J.L., O’Connor, J.E., McGee, B.D., Holmes, R.R., Jr., Hollins, R., Forbes, B.T., Kohn, M.S., Schellekens, M.F., Martin, Z.W., and Peppler, M.C., 2016, Identifying and preserving high-water mark data: U.S. Geological Survey Techniques and Methods, book 3, chap. A24, 47 p. [Available at https://doi.org/10.3133/tm3A24.]
Noll, M.L., and Rydlund, P.H., 2020, Procedures and best practices for trigonometric leveling in the U.S. Geological Survey: U.S. Geological Survey Techniques and Methods, book 11, chap. D3, 94 p., accessed January 19, 2021, at https://doi.org/10.3133/tm11D3.
Otis Bay Ecological Consultants, 2010, Stuart Ranch—Final report biophysical assessment and ecological recovery plan—Protection, enhancement, and restoration of the Stuart Ranch property in Meadow valley Wash: Bureau of Land Management, Southern Nevada District Office, prepared by Otis Bay Ecological Consultants, 284 p.
Ryan, R., 2006, Flooding in Clark and Lincoln Counties, Nevada, December 2004 and January 2005: U.S. Geological Survey Fact Sheet 2006–3124, 4 p. accessed March 15, 2024 at https://doi.org/10.3133/fs20063124.
Rydlund, P.H., Jr., and Densmore, B.K., 2012, Methods of practice and guidelines for using survey-grade global navigation satellite systems (GNSS) to establish vertical datum in the United States Geological Survey: U.S. Geological Survey Techniques and Methods, book 11, chap. D1, 120 p. with appendixes. [Available at https://doi.org/10.3133/tm11D1.]
Schmidt, D.L., 1994, Preliminary geologic map of the Farrier Quadrangle, Clark and Lincoln Counties, Nevada: U.S. Geological Survey Open-File Report 94–625, 32 p., 1 oversize sheet, accessed December 16, 2021, at https://doi.org/10.3133/ofr94625.
Siefken, S.A., and McCarthy, P.M., 2021, Peak flow frequency R extensions: U.S. Geological Survey software release, accessed December 16, 2021, at https://doi.org/10.5066/P99ETAVR.
Thomas, B.E., Hjalmarson, H.W., and Waltemeyer, S.D., 1997, Methods for estimating magnitude and frequency of floods in the southwestern United States: U.S. Geological Survey Water-Supply Paper 2433, 195 p. [Available at https://doi.org/10.3133/wsp2433.]
TrainWeb, 2005, Meadow Valley washout and derailment January 17, 2005, Farrier, NV to Rox Siding, NV: TrainWeb website, accessed August 21, 2024, at http://www.trainweb.org/brettrw/derail/uprr/mvwashout/maptourA.html.
U.S. Army Corps of Engineers, 2024, HEC-RAS [hydrologic engineering center river analysis system] (ver. 6.5.0): U.S. Army Corps of Engineers software release, accessed February 1, 2024, at https://www.hec.usace.army.mil/software/hec-ras/.
U.S. Geological Survey, 2006, Earth Explorer [full display of N_3611411_NE_11_1_20060603]: U.S. Geological Survey interactive map application, accessed July 10, 2024, at https://earthexplorer.usgs.gov/scene/metadata/full/5e83a340bf820c39/1198046/.
U.S. Geological Survey, 2022, PeakFQ (ver. 7.5.1): U.S. Geological Survey software release, accessed March 4, 2024, at https://water.usgs.gov/software/PeakFQ/.
U.S. Geological Survey, 2024a, USGS 09418700 Meadow Valley Wash NR Rox, Nevada: U.S. Geological Survey National Water Information System (NWIS) database, accessed June 4, 2024, at https://nwis.waterdata.usgs.gov/nv/nwis/peak/?site_no=09418700.
U.S. Geological Survey, 2024b, USGS 09418500 Meadow Valley Wash NR Caliente, Nevada: U.S. Geological Survey National Water Information System, accessed June 4, 2024, at https://nwis.waterdata.usgs.gov/usa/nwis/peak/?site_no=09418500.
U.S. Geological Survey, 2024c, USGS 09419000 Muddy RV NR Glendale, Nevada: U.S. Geological Survey National Water Information System, accessed June 4, 2024, at https://nwis.waterdata.usgs.gov/usa/nwis/peak/?site_no=09419000.
Conversion Factors
U.S. customary units to International System of Units
Datum
Vertical coordinate information is referenced to the North American Vertical Datum of 1988 (NAVD 88).
Horizontal coordinate information is referenced to the North American Datum of 1983 (NAD 83).
Elevation, as used in this report, refers to distance above the vertical datum.
Abbreviations
2-D
two-dimensional
AEP
annual exceedance probability
BDA
beaver dam analog
BLM
Bureau of Land Management
DEM
digital elevation model
GCP
ground control point
GNSS
global navigation satellite system
HEC-RAS
Hydrologic Engineering Center-River Analysis System
HWM
high-water mark
RTK
real-time kinematic
TLS
terrestrial laser scanner
TS
total station
USGS
U.S. Geological Survey
For more information concerning the research in this report, contact the
Nevada Water Science Center
U.S. Geological Survey
2730 N. Deer Run Road, Suite 3
Carson City, Nevada 89701
https://www.usgs.gov/centers/nevada-water-science-center
Publishing support provided by the Science Publishing Network,
Sacramento Publishing Service Center
Disclaimers
Any use of trade, firm, or product names is for descriptive purposes only and does not imply endorsement by the U.S. Government.
Although this information product, for the most part, is in the public domain, it also may contain copyrighted materials as noted in the text. Permission to reproduce copyrighted items must be secured from the copyright owner.
Suggested Citation
Dye, L.A., Morris, C.M., and Childres, H.K., 2025, Streamflow extents and hydraulic characteristics of Meadow Valley Wash at Stuart Ranch, near Rox, Nevada: U.S. Geological Survey Scientific Investigations Report 2025–5069, 24 p., https://doi.org/10.3133/sir20255069.
ISSN: 2328-0328 (online)
Study Area
| Publication type | Report |
|---|---|
| Publication Subtype | USGS Numbered Series |
| Title | Streamflow extents and hydraulic characteristics of Meadow Valley Wash at Stuart Ranch, near Rox, Nevada |
| Series title | Scientific Investigations Report |
| Series number | 2025-5069 |
| DOI | 10.3133/sir20255069 |
| Publication Date | August 27, 2025 |
| Year Published | 2025 |
| Language | English |
| Publisher | U.S. Geological Survey |
| Publisher location | Reston, VA |
| Contributing office(s) | Nevada Water Science Center |
| Description | Report: vi, 24 p.; Data Release |
| Country | United States |
| State | Nevada |
| City | Rox |
| Other Geospatial | Meadow Valley Wash at Stuart Ranch |
| Online Only (Y/N) | Y |