

Effects of Restoration Work on Kootenai River Acipenser Transmontanus (White Sturgeon) Critical Habitat, Kootenai River, Northern Idaho, 2011–22
Links
- Document: Report (7.3 MB pdf) , HTML , XML
- Data Release: USGS data release - Impacts of restoration work on Kootenai River white sturgeon critical habitat, 2011–2022, Kootenai River, Idaho
- Download citation as: RIS | Dublin Core
Acknowledgments
The U.S. Geological Survey would like to acknowledge and thank the Kootenai Tribe of Idaho, for assisting with data collection, data analysis, and support in developing this report. Their work and dedication are foundational to the success of restoration efforts on the Kootenai River. Field data collection and processing efforts were made possible by the dedicated efforts of Peter Elliott, Deena Green, and additional staff at the Upper Columbia Idaho field office of the U.S. Geological Survey. River Design Group, now part of SWCA Environmental Consultants, was instrumental in the construction of the restoration work on the Kootenai River, and correspondence with Matt Daniels at River Design Group informed this report. Finally, the authors would like to thank Ryan Fosness (previous U.S. Geological Survey employee) whose many hours spent collecting and analyzing Kootenai River data informed the conceptual framework and interpretations of this study.
Abstract
Between 2011 and 2018, the Kootenai River Habitat Restoration Project, led by the Kootenai Tribe of Idaho, implemented restoration treatments to enhance the natural recruitment of the critically endangered Acipenser transmontanus (white sturgeon) and other fish native to the Kootenai River. These restoration treatments in the Straight and Braided Reaches of the Kootenai River are intended to increase flow depths and velocities to encourage Kootenai sturgeon to spawn in more suitable areas of the channel and to keep spawning gravels clean of fine sediment. This study assessed the effects of these restoration treatments on channel morphology, flow depths, velocities, pool extent, and suspended sediment entrainment in the study reach. Topographic surfaces representing channel morphology before (2011) and after construction (2020 and 2022) were used to quantify elevation changes and net volumetric change and to investigate changes in flow depths and depth-averaged velocities with two-dimensional hydraulic simulations. Effects of the restoration treatments on suspended sediment entrainment in the study reach were investigated using measurements of suspended sediment concentration collected between 2006 and 2023.
From 2011 to 2020, about 70 percent of the study reach showed detectable elevation change, but indeterminant volumetric change, suggesting redistribution of sediment but no notable change in transport capacity. Hydraulic simulations showed increased flow depths during bankfull conditions and variable change in depth averaged velocity during the receding limb of the spring freshet. Pool area and volume increased by 62 and 72 percent, respectively, and the average distance between pools declined. From 2020 to 2022, hydraulic simulations showed slight decreases in flow depths and pool metrics, suggesting sediment deposition in pools. Measured suspended sediment concentrations showed statistically significant declines upstream and downstream from the study reach, indicating a reduction in sediment entering the reach rather than restoration treatments driving a reduction in fine sediment entrainment. Findings from this work can guide future restoration efforts on the Kootenai River or other similar channels.
Introduction
The Kootenai River (referred to as Kootenay River in Canada) is an expansive trans-boundary river that drains an area of about 45,600 square kilometers in Canada, Montana, and Idaho. From its headwaters at an elevation of 3,600 meters (m) in the mountains of British Columbia, the Kootenai River flows south into Montana then west into Idaho where it turns and flows northward, crossing back into Canada before reaching its confluence with the Columbia River near Castlegar, British Columbia. Downstream from Libby Dam and the impounded Lake Koocanusa, the Kootenai River has several reaches that are defined by distinct channel morphology (fig. 1). First is the Canyon Reach, which is 96.5 kilometers (km) of high gradient, confined channel with a gravel, cobble, and boulder bed. This reach then transitions to the Braided Reach near the mouth of the Moyie River at around river kilometer (rkm) 257. This 12.6-km-long reach is characterized by an unconfined floodplain and a wide and often shallow channel that meanders and sometimes splits into multiple channels around islands. Following the Braided Reach, the 1.6-km-long, single-thread Straight Reach starts near Bonners Ferry, Idaho at rkm 245.9. This straight section of river is confined by tall rip-rap banks, levees, and developed land and serves as the transition zone between the geomorphically distinct Braided and Meander Reaches (fig. 1). The Meander Reach is about 121 km of single-thread, sand-bedded channel that meanders through a very low gradient valley (average water-surface slope of 0.000027 since operation of Libby Dam began in 1973; Barton and others, 2005). The Meander Reach crosses into British Columbia, Canada, and ends at Kootenay Lake. More detailed descriptions of drainage-basin wide characteristics are in previous studies (Barton, 2004; Fosness and Williams, 2009; Fosness, 2013; Wood and others, 2015).
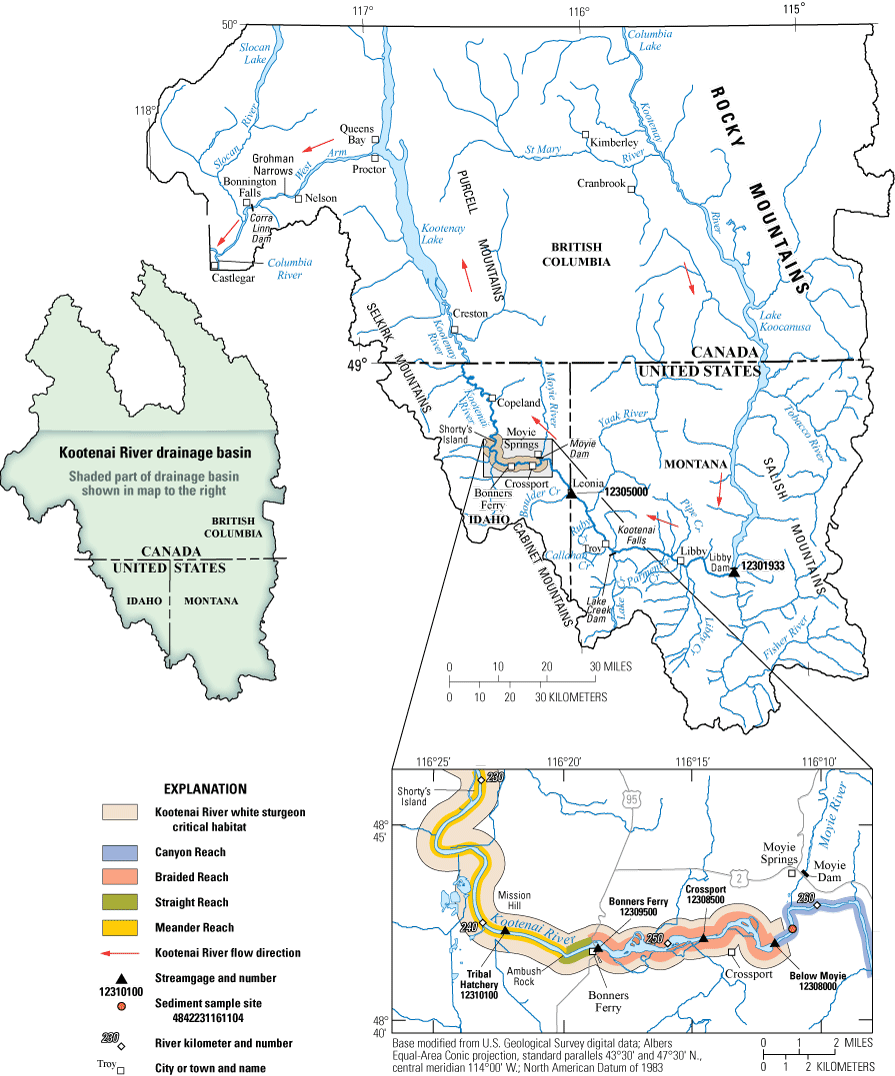
Map showing the study reach and surrounding area in the Kootenai River Basin, northern Idaho.
Between 2011 and 2017, habitat restoration treatments were constructed in the Meander, Straight, and Braided Reaches (fig. 1) as part of the Kootenai River Habitat Restoration Project (KRHRP). The treatments were designed to address a variety of anthropogenic changes in the river that degraded ecosystem function and impeded the success of native species. Lead by the Kootenai Tribe of Idaho (KTOI), a key purpose of the interagency, ecosystem-based restoration project was to restore and maintain habitat to support all life-stages of the Kootenai River Acipenser transmontanus (white sturgeon), Lota lota (burbot), and other native fish. As a collaborator, the U.S. Geological Survey (USGS) collected a variety of data to characterize channel processes, morphology, and sediment transport to inform the planning phases for restoration and to monitor the geomorphic responses during and after construction.
Many of the goals and metrics to measure the success of the KRHRP were focused on Kootenai River white sturgeon (hereafter Kootenai sturgeon). Though no longer harvested because of their critically low numbers, Kootenai sturgeon remain culturally important to the KTOI (Kootenai Tribe of Idaho, 2009). The fish are also a genetically distinct population, isolated since the end of the last glacial advance to a 187 km-long section of the Kootenai River between Kootenai Falls in Montana and Bonnington Falls, which is the outlet of Kootenay Lake in British Columbia and the site of the Corra Linn Dam. Population declines and a lack of natural recruitment of these fish were noted as early as the 1960s (Partridge, 1983; Federal Register, 1994; U.S. Fish and Wildlife Service, 1999), and harvesting ceased in 1984 (Kootenai Tribe of Idaho, 2009). In 1994, the U.S. Fish and Wildlife Service (FWS) listed the Kootenai River white sturgeon as an endangered species under the amended provisions of the Endangered Species Act of 1973 (16 U.S.C. 1531–1544). The U.S. Fish and Wildlife Service designated 29.5 km of the Kootenai River as critical habitat, including the 11.3 km upstream from Bonners Ferry and 18.2 km downstream from Bonners Ferry (U.S. Fish and Wildlife Service, 2008) (fig. 1).
Contributing factors to the lack of wild recruitment of Kootenai sturgeon include a loss of suitable spawning habitat and a lack of habitat complexity (U.S. Fish and Wildlife Service, 2019). Successful spawning and egg incubation requires that adult sturgeon have access to boulder, cobble, and gravel substrate during the spring peak and sufficient flow velocity on the recession limb of the spring hydrograph to keep the substrate clean of finer sand, silt, and clay that can suffocate eggs (Parsley and Kofoot, 2013). During the spring freshet, spawning sturgeon migrate into the section of river designated as critical habitat to stage and spawn. After flow regulation in the watershed, most Kootenai sturgeon were spawning at locations within the Meander Reach section of critical habitat that had sand, silt, and clay substrate, impeding natural recruitment (Paragamian and others, 2001; Kock and others, 2006). The upper parts of the Straight Reach, the Braided Reach, and the Canyon Reach host gravels and cobbles more suitable for spawning, but for unknown reasons, Kootenai sturgeon rarely spawn upstream from Bonners Ferry (Paragamian and others, 2009; U.S. Fish and Wildlife Service, 2019).
Anthropogenic changes in the watershed have driven losses in spawning habitat and declines in habitat complexity. Upstream from the Kootenai sturgeon spawning habitat, Libby Dam began operating in 1972, substantially altering the natural flow regime of the river and reducing the average peak discharge during the spring snowmelt-driven freshet by about half (fig. 2). In 1994, discharges of about 710 m3/s were released to aid in sturgeon recovery but this was well below the pre-regulation bankfull discharge of about 1,840 m3/s (U.S. Fish and Wildlife Service, 1999; Berenbrock, 2005; Kootenai Tribe of Idaho, 2009). Since 2003, the U.S. Army Corps of Engineers has used a variable flow-flood control strategy (VARQ) to manage discharge for sturgeon and flood control (U.S. Army Corps of Engineers, 2008). Flood control management results in higher and more variable winter discharges than the pre-regulation winter discharges (fig. 2). Libby Dam also alters the sediment transport regime downstream, trapping all bedload and most of the fine-grained, suspended load in Lake Koocanusa from the upper 46 percent of the watershed (Barton, 2004). Tributaries such as the Fisher River, Libby Creek, Yaak River, and Boulder Creek now contribute most of the sediment to the Kootenai River downstream from Libby Dam.
Downstream from the Kootenai sturgeon spawning habitat, Kootenay Lake and the very flat gradient of the Meander Reach together result in a backwater effect. The transition from free-flowing river to backwater moves in response to the combined effects of lake stage and discharge but is generally between the lower part of the Straight Reach and upstream as far as rkm 252.2 in the Braided Reach. Kootenay Lake’s water level is controlled by the Grohman narrows (the natural control) and Corra Linn Dam, which began operating in 1931. Excavation in the Grohman Narrows in 1939 and operation of Corra Linn Dam reduced the mean maximum water-surface elevation of Kootenay Lake by about 6 feet compared to natural conditions (Kootenai Tribe of Idaho, 2009). The Kootenai River at the Bonners Ferry, Idaho, streamgage (USGS 12309500) is often subject to backwater effects, and the mean daily water-surface elevations here have been affected by flow regulation (fig. 2). Following regulation at Libby Dam, the mean daily water-surface elevation at the Bonners Ferry streamgage was reduced by more than 4 meters during the spring freshet but was higher than pre-regulation conditions for much of the rest of the year. Implementing VARQ operations at Libby Dam has increased mean daily water-surface elevations at the Bonners Ferry gage during the spring freshet, but water-surface elevations remain higher than pre-regulation conditions for much of the remainder of the year (fig. 2).
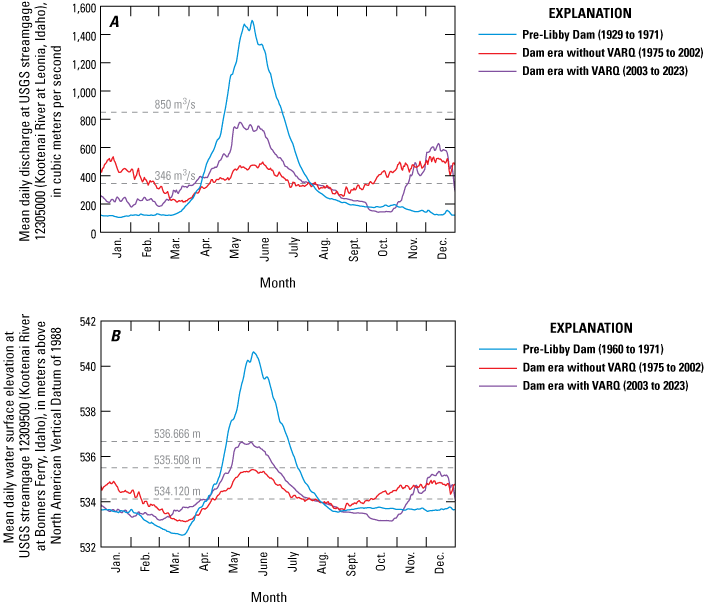
Graphs showing mean daily discharge (A) and mean daily stage (B) on the Kootenai River, northern Idaho. The three periods shown are the pre-Libby dam era, the dam era without variable discharge (VARQ) flow regulation at Libby Dam, and the dam era with VARQ flow regulation at Libby Dam. The horizontal lines show discharges and downstream water-surface elevations used in hydraulic simulations as part of this study. USGS, U.S. Geological Survey; m3/s, cubic meter per second; m, meter.
Land-use practices have also been detrimental to Kootenai sturgeon habitat. Before the construction of Libby Dam levees and dikes were built and side-channels were closed off to protect agriculture and human settlements in the floodplain from the damaging effects of flooding (Boundary County Historical Society, 1987; Redwing Naturalists, 1996; Tetra Tech, Inc., 2004). As a result, the river can no longer access its historical floodplain, and the habitat provided by smaller side-channels of the river has been lost. Land-use practices such as the clearing of vegetation for agriculture and livestock grazing, along with the altered flow regime and invasive species, have contributed to the loss of bank stabilizing native riparian habitat (Kootenai Tribe of Idaho, 2009). The resulting decreased bank stability is thought to contribute to the supply of fine sediment that buries suitable spawning gravels and impedes egg survival in the river.
Previous work suggests that at spawning locations in the Meander Reach, such as Shorty’s Island (fig. 1), the higher pre-regulation peak discharges may have exposed lenses of gravel and cobble more suitable for embryo survival (Barton, 2004; Paragamian and others, 2009; McDonald and others, 2010; Dudunake and others, 2025). Peak discharge during the Libby Dam era rarely provides the flow velocities required to scour finer sediment now covering this native, coarser sediment. There is also evidence of coarser gravels buried by fine sediment in the upper-most part of the Meander Reach and lower parts of the Straight Reach (rkm 241.1 to 245.9) that may have similarly been exposed during higher pre-regulation peak discharges (Barton, 2004). Historically, Kootenai sturgeon may have spawned farther upstream in the Straight, Braided, and even Canyon Reaches, but the shallower flow depths resulting from flow regulation may now impede their migration into and use of these areas. Before regulation, higher peak discharges and a higher water surface elevations in Kootenay Lake would have produced deeper water in the Straight and Braided Reaches, which may have promoted spawning in these upstream reaches (Kootenai Tribe of Idaho, 2009).
Fine sediment may also threaten the successful incubation of Kootenai sturgeon eggs in the Braided Reach. Though the sediment supply has been reduced by Libby Dam, the slower velocities imposed by regulated flows have also reduced the sediment transport capacity of the channel. At the same time, the lack of floodplain connectivity restricts deposition of fine sediment on the floodplain. As a result, sand may be temporarily stored on the channel bed, potentially covering spawning sites and filling deeper areas like pools. Before the restoration efforts of the KRHRP, accelerated bank erosion was estimated to be the source of 15 to 30 percent of the fine bed material (Kootenai Tribe of Idaho, 2009). Bank instability and erosion along the Kootenai River have been promoted by agricultural practices that clear stabilizing vegetation as well as rapid ramping rates and discharge variability from flow regulation that results in cycles of saturation and drying that are thought to destabilize banks (Kootenai Tribe of Idaho, 2009).
In 2009, the KTOI published the Kootenai River Habitat Restoration Project Master Plan (Kootenai Tribe of Idaho, 2009). This document detailed the many factors limiting the successful recruitment of Kootenai sturgeon and other native species and outlined a comprehensive vision and plan for habitat restoration in the area designated as critical habitat. The Kootenai River Habitat Restoration Project Master Plan was guided by extensive data collection and research efforts by KTOI, private consultants, academic researchers, and numerous government agencies including the USGS. USGS contributions to the plan included operation of streamgages to measure discharge and stage, surveys of channel geometry (Barton and others, 2004; Czuba and Barton, 2011), collection of suspended and bedload sediment samples (Fosness and Williams, 2009), characterization of surficial and subsurface bed sediments (Barton, 2004; Fosness and Williams, 2009; Barton and others, 2012), velocity measurements (Lipscomb and others, 1998), assessments of changes to sediment transport and channel morphology after the completion of Libby Dam in 1972 (Barton, 2004), and modeling that aided in understanding hydraulic conditions in the study area, including the effects of the backwater induced by Lake Kootenay (Berenbrock, 2005). Much of these data were used in the USGS created multidimensional hydraulic model, Flow and Sediment Transport with Morphological Evolution of Channels (FaSTMECH), to simulate hydraulic conditions, sediment transport, and potential restoration designs in the study area (Nelson and others, 2003; Barton and others, 2005; Barton and others, 2009; McDonald and others, 2010; Logan and others, 2011; McDonald and others, 2016).
Construction of restoration treatments began in 2011. The extensive work in the Straight and Braided Reaches was designed to encourage Kootenai sturgeon to migrate farther upriver to spawn over more suitable cobble-gravel substrate and to improve the survival of eggs. This work included the construction of restoration treatments intended to increase flow depths during the peak of the spring freshet with the specific goal of attaining flow depths greater than 5 meters in 60 percent of reach area between river miles 152 and 157 (rkm 244.6 to 252.3). Construction also included restoration treatments intended to increase flow velocities during the recession limb of the spring freshet hydrograph to keep gravels clear of fine sediment, with a similar goal of attaining velocities greater than 1 meter per second (m/s) in 60 percent of the reach area between rkm 244.6 and 252.3. These metrics were guided by a biological opinion issued by the U.S. Fish and Wildlife Service discussing the effects of Libby Dam operations on Kootenai sturgeon and Salvelinus confluentus (bull trout) and legally requiring reasonable and prudent alternatives be implemented to improve conditions for natural recruitment (U.S. Fish and Wildlife Service, 2006). As habitat restoration treatments were being constructed, the USGS continued to investigate sediment transport processes and collect bathymetric and velocity data within the Braided, Straight, and Meander Reaches to assist in monitoring channel changes (Fosness, 2013; Wood and others, 2015; Fosness and others, 2019).
Purpose and Scope
This report presents and discusses an analysis of geomorphic change in the Straight and Braided Reaches of the Kootenai River in response to the restoration treatments constructed between 2011 and 2018 as part of the KRHRP, with a focus on suitable habitat for Kootenai sturgeon. Additionally, the scope of the analysis is limited to the main channel of the Kootenai River rather than side channels because geomorphic changes in the main channel are likely to be most impactful for Kootenai sturgeon during spawning season. Two-dimensional (2D) hydraulic modeling was used to quantify and compare flow depths and depth-averaged velocities for channel morphology before (2011) and after (2020) the construction of restoration treatments. Continued channel response was investigated with 2D hydraulic simulations of flow depth and velocity using the channel morphology of 2022. For each year of interest (2011, 2020, and 2022), three flow conditions were simulated that characterized different periods of the spring freshet when Kootenai sturgeon migrate upriver and spawn and eggs incubate. Simulated flow depths were also used to quantify changes in available pool habitat that resulted from the construction of restoration treatments. Samples collected for suspended sediment concentrations upstream and downstream from the Braided Reach were used to investigate potential effects of restoration treatments on the entrainment and movement of suspended sediment. Results from this analysis can provide insights into the initial effects of restoration work in the Straight and Braided Reaches. Identifying the successful components of the restoration strategy can guide future work on the Kootenai River or other similar channels.
Study Area
As part of the KRHRP, restoration treatments were constructed in the Meander, Straight, and Braided Reaches. This study focuses on the work within the Straight and Braided Reaches that was constructed to address limiting factors for Kootenai sturgeon recruitment and to improve habitat for other native fish species (fig 1). The 11 km long Braided Reach begins near the mouth of the Moyie River at about rkm 257 where the river transitions from a steep, confined canyon to an unconfined valley. The river becomes wider, often shallower here and is characterized by meanders and sometimes a multithread channel with islands. The transition to unconfined river valley, along with a channel slope that decreases downstream, makes the Braided Reach a depositional zone for the gravels and cobbles that largely compose the channel bed. Channel banks in the Braided Reach primarily consist of finer and more easily eroded sands and silt. Loss of bank vegetation to agricultural practices, cattle grazing, and the altered flow regime contributes to bank instability and erosion. Historical imagery and maps of the Braided Reach show an active channel undergoing lateral migration and occasional channel avulsions (Barton and others, 2005; Kootenai Tribe of Idaho, 2009). A combination of flow regulation and levees confines the river and does not allow it to access and spread out over the floodplain during high flows. During the spring freshet when discharge from the river and the stage of Kootenay Lake are both high, the backwater extent moves upriver into the Braided Reach as far as rkm 252.2. During winter months, the stage of Kootenay Lake is lower than during the spring freshet, but discharge from the river can still be elevated from flood control management releases at Libby Dam. This combination of low lake stage and increased discharge results in a less extensive backwater through the Straight and Braided reaches as well as steeper water surface slope and increased sediment transport capacity.
The 1.6 km long Straight Reach begins near Bonners Ferry at the Highway 95 bridge (fig. 1) where the river gets deeper and narrower and is confined by tall, riprapped banks, levees, and development on both sides of the channel. This reach is the transition zone between the Braided Reach and the Meander Reach where the river enters a low gradient, wide valley. Within the Straight Reach, the surficial substrate of the channel bed transitions rather abruptly from gravel to predominantly sand (Berenbrock, 2005; Berenbrock and Bennett, 2005; Fosness and Williams, 2009). The backwater effect from Kootenay Lake nearly always extends into the Straight Reach.
Details on the types of treatments built and their locations are provided in figure 3 and table 1. In some areas, channel geometry was modified to establish channel dimensions that were more suitable for the lower peak flows of the Libby-Dam era flow regime while providing flow depths and velocities more suitable for Kootenai sturgeon. This included excavation of the channel in some areas and building new, lower-elevation floodplain surfaces in others. Insufficient flow depths and pool spacing were addressed by excavating pools and constructing pool-forming structures along banks that were designed to scour and maintain pools and increase flow velocity. Construction of the new, lower elevation floodplain surfaces helped to address the loss of connection with the historical floodplain while also reducing channel width to promote increased flow depths and velocities. These new floodplain surfaces were constructed as new islands or expansions of existing islands or low-lying areas. Pools and pool-forming structures or new floodplain surfaces were often built with the local material excavated from an adjacent pool. Bank erosion was addressed by regrading banks, installing large woody structures to increase roughness, and revegetating banks to improve bank stability.
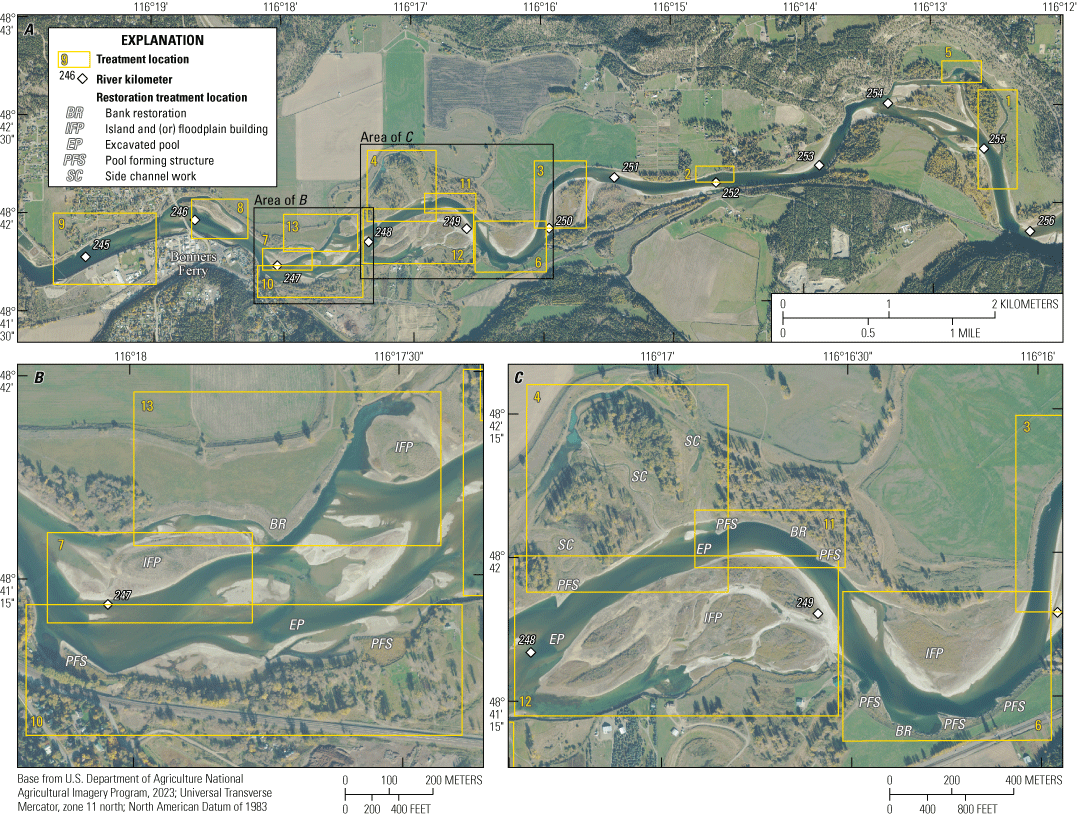
Aerial images showing restoration treatments constructed in the Braided and Straight Reaches of the Kootenai River, northern Idaho, as part of the Kootenai River Habitat Restoration Project, 2011–18. Boxes highlight specific areas of construction, and the numbers within each box correspond to the numbers in table 1 where descriptions of the work done at each location are provided. The aerial image in A shows the full extent of Braided and Straight Reaches. The aerial images in B and C show more detail of selected areas.
Table 1.
Descriptions of restoration treatments constructed in the Braided and Straight Reaches of the Kootenai River, northern Idaho as part of the Kootenai River Habitat Restoration Program, 2011–18.[Treatment numbers correspond to areas highlighted by numbered boxes in figure 3. Approximate river kilometer—approximate location, in river kilometers, where treatments were constructed. River kilometers are also shown on fig. 3.]
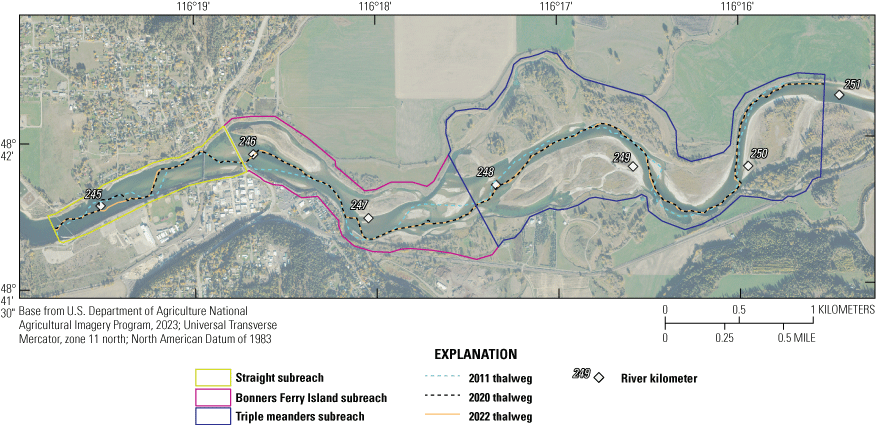
Three subreaches of the river were defined for the purposes of this study and are centered on specific areas of work in the channel (fig. 4). Figure 3 and table 1 provide details about the restoration treatments in each subreach. The triple meanders subreach (rkm 250.9 to 247.7) encompasses the three large meander bends of the Braided Reach and is designated from upstream to downstream as the upper, middle, and lower meanders (fig. 3). The Bonners Ferry Island (BFI) subreach (rkm 247.7 to 245.9) encompasses the area upstream from the Highway 95 bridge where two islands were built. The straight subreach (rkm 245.9 to 244.6) is the most downstream subreach and encompasses the same area as the previously discussed Straight Reach. Together, these three reaches are referred to as the study reach. In the KRHRP Master Plan, restoration goals include increasing flow depths and velocities for river miles 152 to 157 (rkm 244.6 to rkm 252.3), most of which are included within the study reach defined for this study (rkm 244.6 to 250.9).

Aerial image showing locations and extents of subreaches defined for this study, the upstream and downstream extents of the two-dimensional hydraulic model, the locations of monitoring cross-sections, and the U.S. Geological Survey streamgages that provided measured discharge and water-surface elevations that were used to run and calibrate the two-dimensional hydraulic model simulations for the Kootenai River, northern Idaho, 2011–22.
Methods
This study used many different data types, including bathymetric, topographic, hydrologic, hydraulic, and sediment data to complete a geomorphic assessment of restoration treatments for the duration of the study. These data were further processed, integrated, and analyzed to develop an understanding of the effects of restoration treatments on river hydraulics, physical channel characteristics, and sediment transport processes throughout the study reach and under different hydrological conditions.
Topographic Surface Generation
The basis of this geomorphic assessment required the assimilation of various topographic and bathymetric datasets to develop hydraulic models and quantify physical habitat changes during various flow conditions. Topographic surfaces were generated for 2011, 2020, and 2022 that integrated data from bathymetric and light detection and ranging (lidar) surveys. The 2011 topography pre-dated all construction and provided the pre-restoration treatment condition within the study reach. The 2020 topographic surface provided the post-treatment condition within the reach (the final restoration treatment was constructed in 2018) and was the first to include all constructed restoration treatments. The 2022 topographic surface captured continued channel response in the years after construction was completed. The 2011 topographic surface was developed using bathymetric data collected in 2009 (Fosness, 2013; Fosness and others, 2019) and lidar data collected in 2010 (OCM Partners, 2025). The 2020 topographic surface was developed using bathymetric data collected in 2019 (Fosness and others, 2019), aerial lidar collected in 2019 (U.S. Geological Survey, 2019), and topobathymetric data collected in 2017 (Danielson and others, 2021). The 2022 topographic surface included bathymetric data collected in 2021 (Fosness and others, 2019), and the lidar data collected in 2017 (Danielson and others, 2021) that was also used for the 2020 topographic surface. Small areas not covered by bathymetric surveys in 2021 were filled in with bathymetric survey data from 2019. Although flow conditions during surveys did not allow for full coverage bathymetric data collection between 2020 and 2022, surveys between these years targeted areas where features were most recently constructed, such as the features built in 2018 near rkm 248.5 and rkm 247.5 (fig. 3 and table 1). Bathymetric surveys between 2020 and 2022 also targeted areas of the channel where more geomorphic response was expected, such as pools, along pool forming features, and steep banks. Missing elevation data were interpolated using the Topo to Raster tool in ArcGIS Pro that uses a spline technique to generate a hydrologically correct digital elevation model later used for 2D hydraulic modeling (Hutchinson and others, 2011; Esri, 2023). All surfaces used in this study are available in the associated model archive (Kenworthy, 2024).
For visualization purposes only, relative elevation models (REM) were also created using the topographic surfaces. In the REMs, elevations were plotted relative to the water surface simulated for the bankfull-high stage flow conditions (see section, “Two-Dimensional Hydraulic Modeling”). Along river corridors, plotting elevations relative to the height of the river (in this case water-surface elevation) makes it easier to visualize geomorphic features compared with a traditional digital elevation model (DEM).
Elevation and Volumetric Change
Geomorphic change in the study reach after construction of restoration treatments was investigated using the surfaces generated for 2011, 2020, and 2022. The Geomorphic Change Detection (GCD) stand-alone tool was used to compute elevation differences and volumetric changes between the topographic surfaces generated for 2011, 2020, and 2022 and the propagated error associated with the uncertainty of these topographic surfaces (Riverscapes Consortium, 2020). When subtracting one topographic surface from another, GCD provides methods for filtering elevation changes that cannot be distinguished from propagated error and estimating error for computed total volumetric change. Uniform error surfaces were generated for each year because uncertainty was not calculated for each data point in the original datasets. After assessing the quality of the sonar returns and the propagation of sensor, environmental, and other systematic error sources, a uniform uncertainty of 0.10 m was used for the 2011 surface (Huang and others, 2017). Refinement of quality control allowed for a uniform uncertainty of 0.07 m for the 2020 and 2022 topographic surfaces. When differencing surfaces, only elevation changes that exceeded the applied uncertainty values were included in estimates of area with detectable change. Error propagation using the uncertainty values provided uncertainty estimates for volumetric changes.
Using GCD, the pre-treatment topographic surface of 2011 was subtracted from the post-treatment topographic surface of 2020 to assess changes after all habitat restoration treatments were completed. Additionally, the 2020 topographic surface was subtracted from the 2022 topographic surface to assess continued channel adjustment in the years after project completion. Every time topographic surfaces were subtracted, the following were computed: total area with detectable change, the total areas with net scour or deposition, thresholded total volumes of scour and deposition, total net volumes of change, and the propagated error for volumetric estimates.
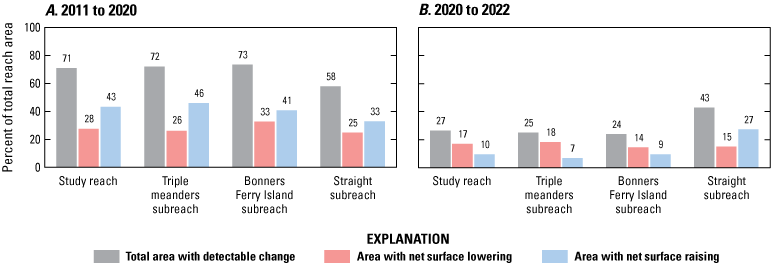
Seventeen monitoring cross-sections established in the Braided Reach provided another view of geomorphic change in the study reach (fig. 4). Cross-sections were surveyed by bathymetric multibeam sonar as much as two times per year from 2009 to 2022 (Fosness and others, 2019). For each cross-section, channel bed elevations were taken at 0.5 m intervals from the 2011, 2020, and 2022 bathymetric surfaces then plotted together for comparison.
Two-Dimensional Hydraulic Modeling
The International River Interface Cooperative Flow and Sediment Transport with Morphological Evolution of Channels (FaSTMECH) 2D hydraulic flow model (Nelson and others, 2003) was used to model hydraulic conditions in the Braided Reach of the Kootenai River. Many previous studies used FaSTMECH to improve understanding of conditions in the Kootenai River (Barton and others, 2005; Barton and others, 2009; McDonald and others, 2010; Logan and others, 2011; McDonald and others, 2016; McDonald and others, 2016; Fosness and others, 2021; Dudunake and others, 2025). The model grid extended about 350 m upstream from USGS gaging station Kootenai River below Moyie River (streamgage 12308000; hereafter Below Moyie) at the upstream boundary to USGS gaging station Kootenai River Tribal Hatchery near Bonners Ferry, Idaho, (streamgage 12310100; hereafter Tribal Hatchery) at the downstream boundary (fig. 4). The model grid had 5-m resolution with 2,629 nodes in the streamwise direction and 561 nodes in the cross-stream direction. The topography layer for each year was derived as described in the section “Topographic Surface Generation.”
Required boundary condition inputs for running simulations in FaSTMECH are the downstream water-surface elevation (in meters) and discharge (in cubic meters per second). The downstream water-surface elevation was provided by measured daily mean stage at the Tribal Hatchery streamgage (U.S. Geological Survey, 2023). Water-surface elevations at the Tribal Hatchery streamgage were obtained by adding the streamgage datum, in the North American Vertical Datum of 1988, to the measured stage. Daily mean discharge was obtained from the Below Moyie streamgage (U.S. Geological Survey, 2023). Tributary inputs to the model reach are minimal downstream from the Kootenai River below Moyie River streamgage, with discharges generally comparable to those measured at the Tribal Hatchery streamgage at the downstream end of the model reach.
Three sets of boundary conditions for three different flow conditions were selected for simulation and were chosen to represent the typical parts of the spring freshet hydrograph when Kootenai sturgeon spawn and embryos incubate (table 2). These three flow conditions were selected from the hydrograph of water year 2020 because this hydrograph best conformed to a typical snowmelt-driven hydrograph which is defined by a relatively rapid increase in discharge at the start of the freshet and then a gradual recession from the peak. The earliest flow condition (bankfull-low stage) was from May 3, 2020, and had a discharge of 848.7 m3/s and a downstream water-surface elevation of 535.5 m. Bankfull discharge in the Braided Reach of the Libby Dam era is about 849.6 m3/s, so the bankfull-low stage conditions approximate a bankfull discharge earlier in the freshet hydrograph when Kootenay Lake is still filling and the backwater within the Braided Reach is less extensive. The next simulated flow condition (bankfull-high stage) was from June 22, 2020, and had a discharge of 846.4 m3/s and a downstream water-surface elevation of 536.7 m. The bankfull-high stage flow conditions approximate conditions closer to the peak of the spring freshet with bankfull discharge but a more extensive backwater in the Braided Reach, driven by a higher water-surface elevation in Kootenay Lake. The last flow condition (recession), from July 21, 2020, had a discharge of 345.8 m3/s and a downstream water-surface elevation of 534.1 m and was selected to approximate typical recession flow conditions after the peak when Kootenai sturgeon eggs would potentially be incubating.
Table 2.
Boundary conditions used for hydraulic simulations of three different flow conditions in the study reach of the Kootenai River, northern Idaho.[Flow conditions were simulated using the topographic surfaces for 2011, 2020, and 2022, resulting in a total of nine unique simulations. Dates given in months-days-years. m3/s, cubic meter per second; m, meter]
The model was primarily calibrated by adjusting the roughness drag coefficient value to minimize the root mean square error between the simulated and measured water-surface elevations within the model grid (Kenworthy, 2024). The model was first calibrated for the selected flow conditions with the 2020 topographic surface because this was most representative of conditions measured in the channel. That is, of the three topographic surfaces, the 2020 surface was the best representation of channel conditions when the three flow conditions selected for simulation were measured in the 2020 water year. A previous application of FaSTMECH on the Kootenai River (Logan and others, 2011) was used to provide initial estimates of roughness drag coefficients that were then adjusted as needed. Measured water-surface elevations used for calibration were from USGS gaging stations Kootenai River at Bonners Ferry, Idaho (streamgage 12309500), Kootenai River at Crossport, Idaho (streamgage 12308500), and the Below Moyie streamgage (fig. 4) (U.S. Geological Survey, 2023).
For 2011 and 2022, the three flow conditions could not be directly calibrated because the exact combination of discharge and downstream water-surface elevation obtained from the 2020 hydrograph was not in the 2011 or 2022 hydrographs. Instead, combinations of discharge and downstream water-surface elevation that were as similar as possible to the 2020 flow conditions were identified within the 2011 and 2022 hydrographs and used to calibrate the models for those years. For example, the bankfull-low stage flow condition selected from 2020 had a discharge of 848.7 m3/s and a downstream water-surface elevation of 535.5 m, but the calibration conditions for 2011 used measured discharge of 849.3 m3/s and a downstream water-surface elevation of 535.4 m. For the 2011 simulations, USGS streamgages providing measured water-surface elevations for model calibration were limited to Kootenai River below Moyie River, Idaho, (streamgage 12308000) and Kootenai River at Bonners Ferry, Idaho (streamgage 12309500) because the gage at Crossport was not yet installed. Additional measured water-surface elevations were available for some dates from as many as nine Hobo pressure transducers deployed throughout the model domain (Kenworthy, 2024). When available, these water-surface elevations were used to broadly assess simulated water-surface elevations, but the root mean square error was not calculated using the Hobo water-surface elevations because data from these transducers were not available for all dates.
After model calibration, each of the three flow conditions were run as a constant discharge using the topographic surfaces for 2011, 2020, and 2022, resulting in a total of nine simulations. The resulting flow depths (water-surface elevation minus bed elevation, in meters), depth-averaged velocities (DAV; magnitude, measured in meters per second), and area associated with each grid node (square meters) were exported. For the bankfull simulations, analysis of model outputs focused on flow depths because restoration goals included increased flow depths during the peak of the spring freshet. For the six bankfull flow simulations, the distributions of simulated flow depths were characterized for comparison by summing the total area in each subreach within 0.1 m depth bins. Two additional metrics used to investigate simulated flow depths were the total area in each subreach with flow depth greater than or equal to 5 m and the median flow depth for a given subreach. The median flow depth, rather than mean, was computed because distributions of depth were typically non-normal and positively skewed.
For the recession simulations, analysis of model outputs focused on DAV because one of the restoration goals was to increase the area with velocities of 1 meter per second (m/s) or greater during the recession limb of the spring freshet. Resulting DAV for the three recession simulations were compared the same way depths were compared for bankfull simulations using distributions of DAV, median values, and total area in each subreach with DAV greater than or equal to 1 m/s. In distributions of total area per DAV bin, bin widths were 0.1 m/s.
Thalweg Analysis
The location of the channel thalweg before (2011) and after (2020 and 2022) construction of restoration treatments was identified and compared. Similarly, outputs from hydraulic model simulations were used to compare pre- and post-construction thalweg flow depths and depth-averaged velocities. Analyzing simulated parameters that are along the thalweg provides a more focused assessment of changes within the main path of flow. Before investigating the simulated flow depths and velocities along the thalweg, the thalweg for each year was identified as objectively as possible. First, a total of 462 cross-sections were created in a geographic information system (GIS) program for the upstream to the downstream extent of the 2D hydraulic model domain. The cross-sections were drawn as perpendicular to the main flow direction as possible and excluded side channels. The elevations of all 462 cross-sections were extracted from the 2011, 2020, and 2022 topographic surfaces. The lowest elevation within each cross-section was identified, and a line connecting the lowest elevation points was used as a first approximation of the thalweg. Unreasonably located points were removed to produce a generally smooth line within the main channel. Simulated flow depth and DAV were extracted along the thalweg on a 5-m interval. Median thalweg depths from the 2011, 2020, and 2022 bankfull simulations then were compared. Similarly, median DAV values from the 2011, 2020, and 2022 recession simulations were compared.
Pool Analysis
A key design feature of the KRHRP is the series of pools that was constructed along the thalweg and the pool forming structures constructed to promote the scour and maintenance of pools. One of the primary functions of the pools is to serve as a “pool ladder” that Kootenai sturgeon can use to more easily access high quality spawning habitat during the spring freshet. The extent of pool habitat before and after construction was quantified by estimating total pool area and volume in 2011, 2020, and 2022 for the bankfull-high stage flow condition, which produced the greatest pool extent of the three flow conditions simulated. The analysis was limited to the BFI and triple meanders subreaches because pools were not built in the straight subreach. Pools were defined as areas with simulated flow depth of at least 5-m within the main channel. The simulated flow depth and associated model node area were used to estimate total pool area and volume for each year. The average distance between pools was determined by simply averaging the measured distance between pools along the thalweg, measuring from pool boundaries.
Suspended Sediment
The potential effects of the construction projects on suspended sediment entrainment within the Braided Reach were investigated by analysis of measured suspended sediment concentrations (SSC) at the Tribal Hatchery and Below Moyie sites. If the construction of restoration treatments such as bank stabilization affected entrainment of suspended sediment in the Braided Reach, that might be evident as a change through time in measured SSC at the Tribal Hatchery site. However, measured SSC at the Below Moyie site was also considered to understand any changes in the incoming sediment supply that could affect SSC measured at the Tribal Hatchery site. Suspended sediment samples collected between May 2006 and January 2023 using equal-width-increment or equal-discharge-increment methods (U.S. Geological Survey, 2006) were obtained from the USGS National Water Information System (U.S. Geological Survey, 2023) and used in this analysis. During this period, 86 samples were collected at the Tribal Hatchery site. There are gaps in the record at this site because no SSC samples were collected during 2008, 2009, much of 2010, and 2018. A total of 111 SSC samples collected at or near the Below Moyie site were included in this analysis; the only gap in the record being in 2018. Of these samples, 70 were collected at the Below Moyie site, and the remaining 41 were collected about 1 km upstream (USGS 4842231161104) before installation of the Below Moyie gaging station. Plots of measured SSC as a function of discharge do not show distinct groups for these two sites, so samples collected at the older site were included (Kenworthy, 2024). The percentage of fine sediment (<0.063 millimeter) was also available for each sample, allowing the percentage of sand (>0.063 millimeter) for each sample to be determined by simply subtracting the percent fines from 100. Trends in the fine and sand fraction of measured SSC were also considered. Continuous estimates of SSC from acoustic surrogate models (Wood and others, 2015) are available at both sites for water years 2011 to 2016 but were not used because the records end before the restoration treatments in Braided Reach were constructed.
To test for temporal trends in measured SSC (total, fine, and sand fractions), multiple linear regression (MLR) models were developed with SSC as a function of the independent variables of time and estimated discharge from tributaries between Libby Dam and the Below Moyie site. Tributary discharge was used rather than Kootenai River discharge because Libby Dam has high sediment trapping efficiency so SSC in the Braided Reach is driven primarily by tributaries between Libby Dam and the Below Moyie site (Fosness and Williams, 2009; Wood and others, 2015). Total estimated tributary discharge was estimated as the difference in discharge measured at USGS gaging station Kootenai River below Libby Dam (streamgage 12301933), and the discharge measured at either the Below Moyie or Tribal Hatchery sites. Lag times of 11 and 12 hours were applied to the Below Moyie and Tribal Hatchery sites, respectively, to account for travel time from the Libby Dam streamgage. At the Tribal Hatchery site, a 2-hour mean discharge value was used rather than the real-time (15-minute increment) discharge value to minimize effects of the noisy record that results from the index-velocity rating techniques used at this site (Levesque and Oberg, 2012). For dates when discharge data were not available at the Below Moyie site, the discharge measured at the time of sample collection was used, if available. If discharge was not measured at the time of sample collection, the discharge at Tribal Hatchery was used. Files summarizing the data used for this analysis of suspended sediment are contained within the hydraulic model archive (Kenworthy, 2024).
Estimated tributary discharge in the MLR models accounted for any trends in time driven by changes in tributary discharge. The resulting MLR models took the form of the following equation:
whereis suspended sediment concentration,
is the intercept,
is the slope coefficient for tributary discharge,
is estimated tributary discharge (m3/s),
is the slope coefficient for time, and
is time (as a serial date).
Model residuals were assessed for homoscedasticity, and regression statistics were used to assess the statistical significance of the model and the estimated trend in time (R Core Team, 2024). If regression statistics indicated the overall model was significant (p-value for the F-test <0.05) and discharge and time were significant explanatory variables (fitted coefficient p-values <0.05), could be converted from log to original units and used to estimate the change in the mean measured SSC for the period analyzed as a percentage (Helsel and others, 2020).
Mann-Kendall trend tests were also used to investigate the suspended sediment records for statistically significant trends in measured SSC through time (R Core Team, 2024). These tests were done with the residuals from a linear regression of log transformed SSC as a function of log transformed tributary discharge (Helsel and others, 2020). Resulting p-values less than 0.05 suggest that the null hypothesis of no trend should be rejected and indicate a statistically significant trend in the residuals, and thus, measured SSC. If a statistically significant trend in SSC was indicated, the Theil-Sen slope estimate was converted from log to original units and used to estimate the overall change in the median measured SSC for the period analyzed as a percentage.
The SSC dataset included values from paired samples collected on the same day at the Below Moyie and Tribal Hatchery sites that could also be used to look for trends in time and investigate how SSC changes through the Braided Reach. Initially, there were 74 paired samples from these sites, but paired samples with more than a 5 percent difference in measured discharge between them were removed from consideration. This left 55 paired samples for analysis. Although doing this does not control for all potential differences between sites, it does remove samples from days when discharge and SSC may have been changing rapidly. Simple linear regressions of log transformed SSC measured at the Tribal Hatchery site as a function of log transformed SSC measured at the Below Moyie site were used to investigate the relation between SSC (total, fine, and sand fractions) measurements at the two sites. In addition, Mann-Kendall trend tests, with continuity correction and Theil-Sen slope estimate (Helsel and others, 2020; R Core Team, 2024), were used on the residuals from the linear models to test for a statistically significant temporal trend in measured values for paired samples.
Results
Results from the analyses of topographic change and the 2D hydraulic model simulations are limited to the study reach and the three subreaches contained within (triple meanders, BFI, and straight). This was done because the study reach is where most of the restoration treatments were constructed and because the study reach (rkm 244.6 to 250.9) corresponds more closely to the section of river that the KRHRP Master Plan was focused on (rkm 244.6 to 252.3) (fig. 4).
Elevation and Volumetric Change
Comparing the REMs from the 2011 and 2020 topographic surfaces (fig. 5), constructed features such as islands and pool-forming structures are notable, as are channel responses such as scour near pool-forming features. The REMs were used for visualization purposes only, and the original topographic surfaces were used to quantify elevation changes in the GCD software. The triple meanders and BFI subreaches were characterized by greater elevation changes than the straight subreach (fig. 5), as observed in the monitoring cross-sections for each subreach (fig. 6). GCD output indicated that about 71 percent of the study reach experienced detectable elevation changes between 2011 and 2020 (fig. 7). Similar percentages of the triple meanders and BFI subreaches experienced detectable changes in this period, whereas 58 percent of the straight subreach had detectable changes. The study reach and all subreaches had more detectable elevation increases than elevation decreases throughout. Elevation decreases of as much as 9.5 m were measured, but decreases of this size were only in three locations within the triple meanders subreach that coincide with restoration treatments (fig. 5). Elevation increases of as much as about 8 m were also measured, but similarly limited to a few locations in the BFI and straight subreaches and coincident with constructed treatments.
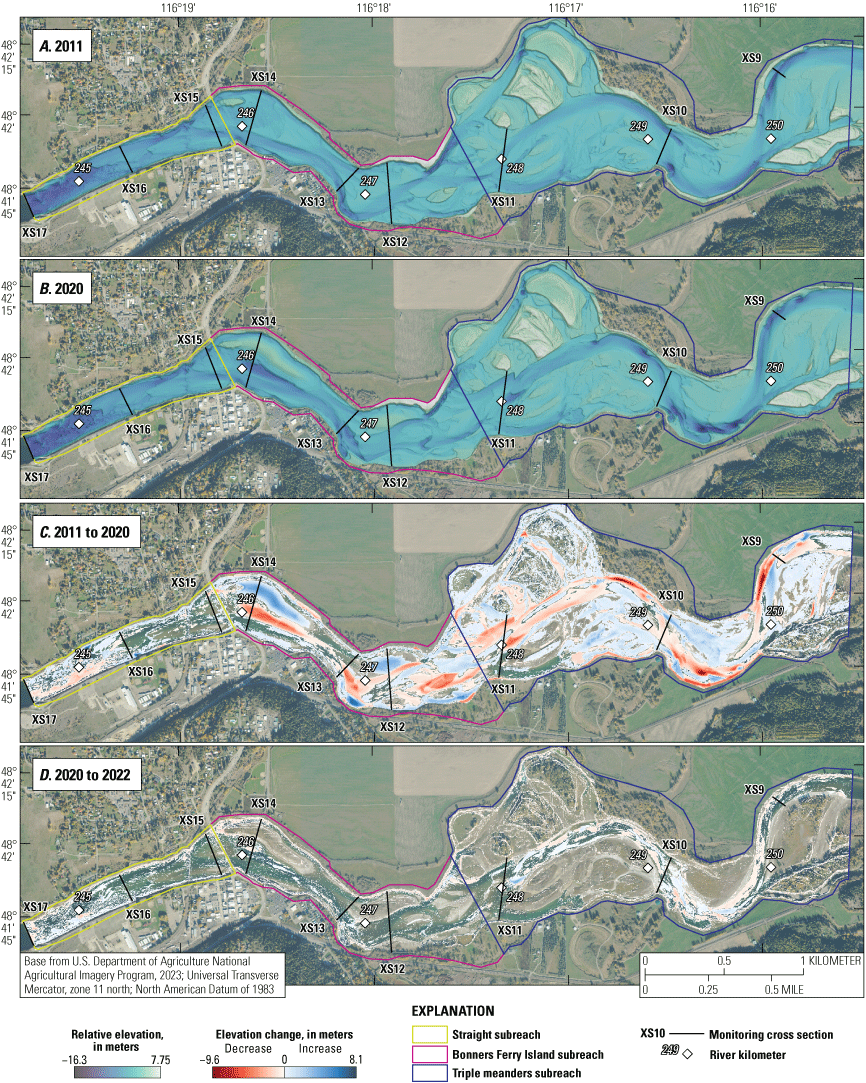
Aerial images showing relative elevation models (REM) for different years (A and B) and net elevation changes during different periods (C and D) in the study reach of the Kootenai River, northern Idaho. Elevations in the REMs (A and B) are plotted relative to the thalweg water surface elevation from the hydraulic simulations of the bankfull-high stage flow conditions. Areas where no elevation change is shown over the aerial imagery had elevation changes below the minimum level of detection.
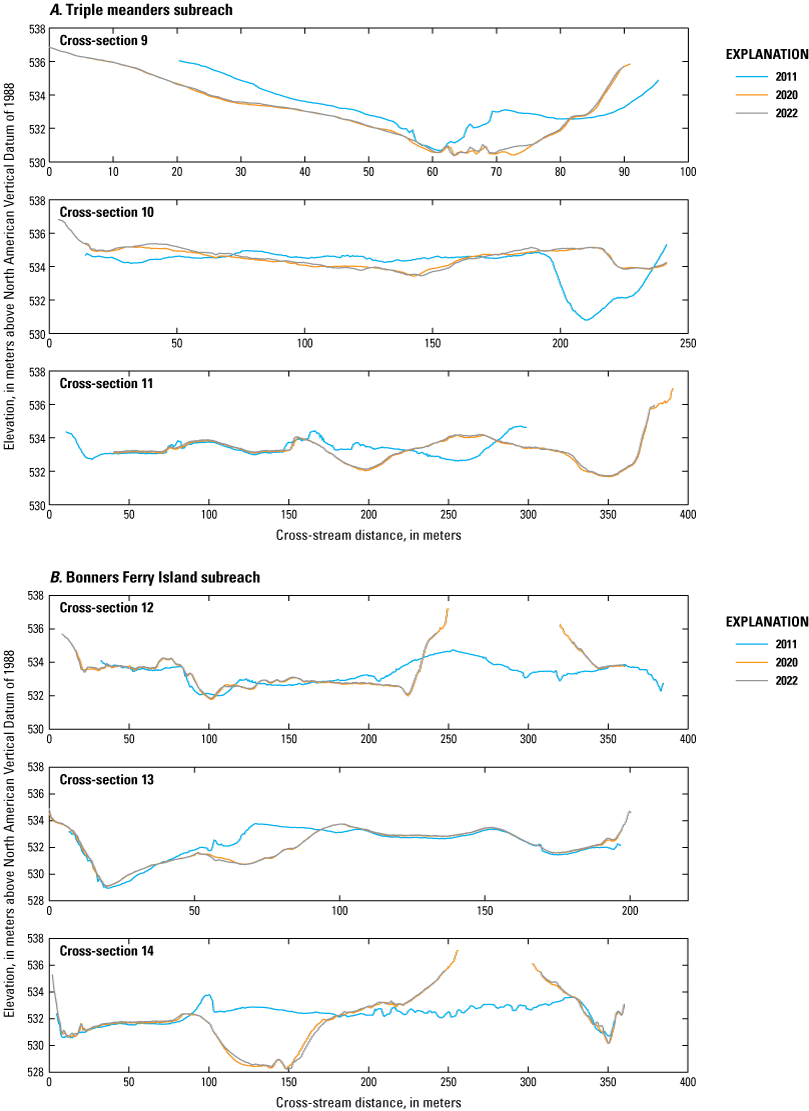
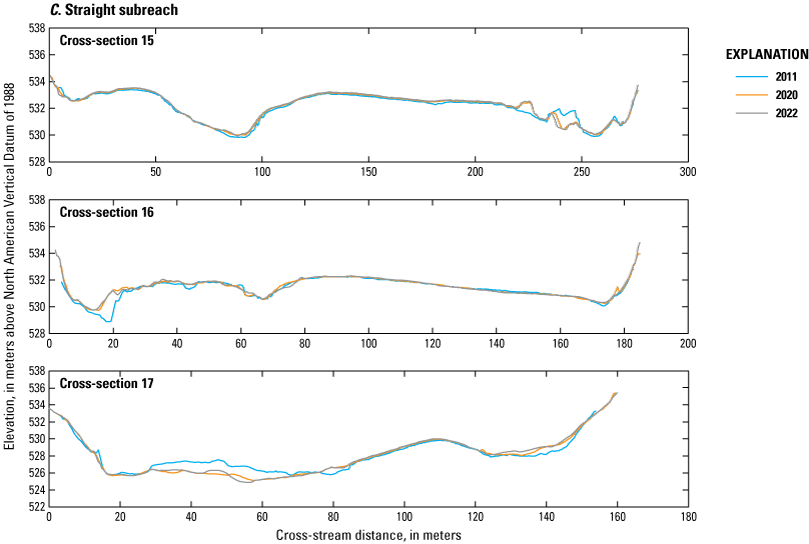
Graphs showing bathymetric surveys from three years of monitoring cross-sections in the triple meanders (A), Bonners Ferry Island (B), and straight (C) subreaches (as defined for this study) on the Kootenai River, northern Idaho. Gaps in cross-sections are areas of the channel that were not submerged and thus not measured at the time of the bathymetric survey. Plots are for illustrating changes at monitoring cross-sections, so the vertical and horizontal distance shown on axes and the vertical exaggeration vary. Bathymetric data is available in Fosness and others (2019).
Graphs showing detectable elevation change (as percentage of reach area) within the study reach and three subreaches of the study reach of the Kootenai River, northern Idaho, from 2011–20 (A) and 2020–22 (B). Restoration treatments were constructed in the study reach from 2011–18.
Results from GCD indicated that less than 30 percent of the study reach, the triple meanders, and BFI subreaches had detectable changes in elevation from 2020 to 2022, with more area of elevation decrease than increase (fig. 7). Most elevation changes in these two subreaches were less than plus or minus 0.5 m. Over 43 percent of the straight subreach had detectable change, with more area of elevation increase than decrease. The largest elevation changes (±3 meters) were within the triple meanders subreach, including 3 to 4 meters of sediment deposition within the pool immediately upstream from cross-section 11 (fig. 5). The map of elevation changes from 2020 to 2022 suggests that small elevation decreases were common along channel banks, with as much as 3–4 m of decline in very localized areas, particularly at the ends of pool forming structures (fig. 5). Cross-sections for all reaches also show minimal elevation change from 2020 to 2022 (fig. 6).
From 2011 to 2020, GCD-derived estimates of volumetric change associated with topographic surface lowering and surface raising were greatest in the triple meanders subreach, followed by the BFI subreach and then much smaller change in the straight subreach (fig. 8). After propagating elevation uncertainty for each topographic surface, net volumetric change for the study reach and all subreaches was indeterminant from 2011 to 2020 (fig. 8). GCD estimates of volumetric change are smaller in all reaches for the 2-year period from 2020 to 2022 compared with the estimates of the years 2011 to 2020. Estimated net volumetric change was indeterminant for the study reach. Within the subreaches, net volumetric change was indeterminant in the straight subreach but negative in the triple meanders and BFI reaches.
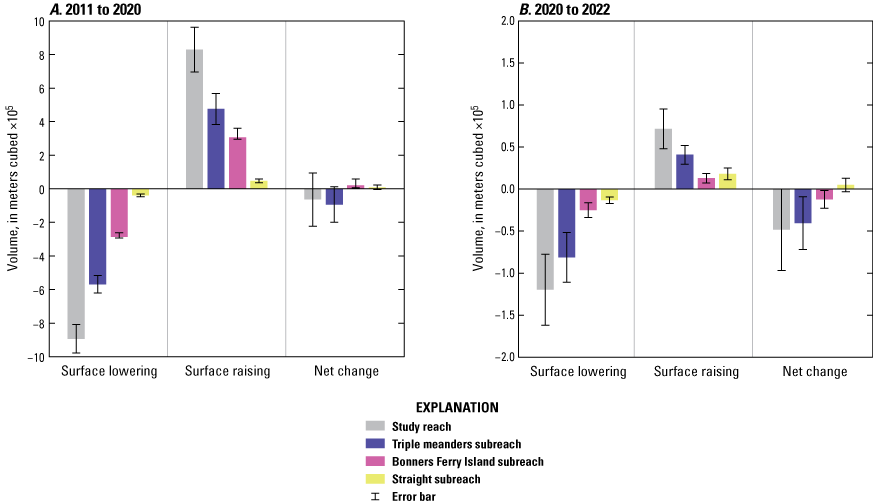
Graphs showing estimates of volumetric change associated with topographic surface lowering and raising and net volumetric change in the study reach and the three subreaches of the study reach, Kootenai River, northern Idaho, from 2011–20 (A) and from 2020–22 (B). Restoration treatments were constructed in the study reach from 2011–18. Error bars that encompass zero indicate indeterminant change.
Simulated Hydraulic Conditions
Flow depth and depth-averaged velocity outputs from the 2D hydraulic simulations were used for further analysis. Simulated depths were analyzed for the bankfull-high stage and bankfull-low stage simulations, and depth-averaged velocities were analyzed for the recession simulations. Like the analysis of topographic changes, results from the 2D-hydraulic simulations are limited to the study reach and the three subreaches contained within (triple meanders, BFI, and straight; fig.4).
Flow Depths
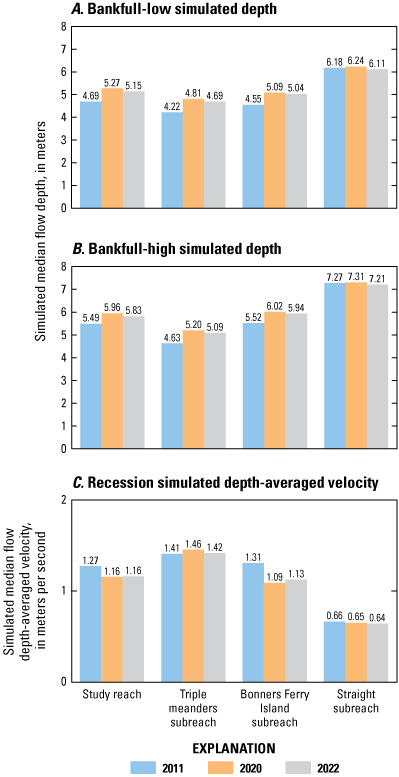
From 2011 to 2020, changes in median simulated flow depths and the percentage of reach area with depths exceeding 5 m were generally small (fig. 9). In the bankfull-low stage simulations, median flow depths in the study reach increased by 0.17 m from 2011 to 2020. In subreaches, median depth increased in the BFI subreach only, with no change in the triple meander subreach and a small decrease in the straight subreach. The proportion of reach area with flow depth greater than 5 m increases with distance downstream for all years (fig. 9). Furthermore, this proportion increased from 2011 to 2020 in the triple-meander and BFI subreaches; however, it remained unchanged in the straight subreach. The overall result in the study reach was an increase from 7.6 to 10.0 percent in the percent of reach area with depth exceeding 5 m. Distributions of simulated depths, shown as total area per 0.1-m depth bin, provide a more detailed view of depth changes (fig. 10). Compared with 2011, the distribution of depths for 2020 showed a considerable increase in area for the shallowest depths (<1 m), a more modest increase in area for deeper depths (>3.5 m), and a considerable reduction in areas with moderate flow depth (about 1 to 3.5 m).
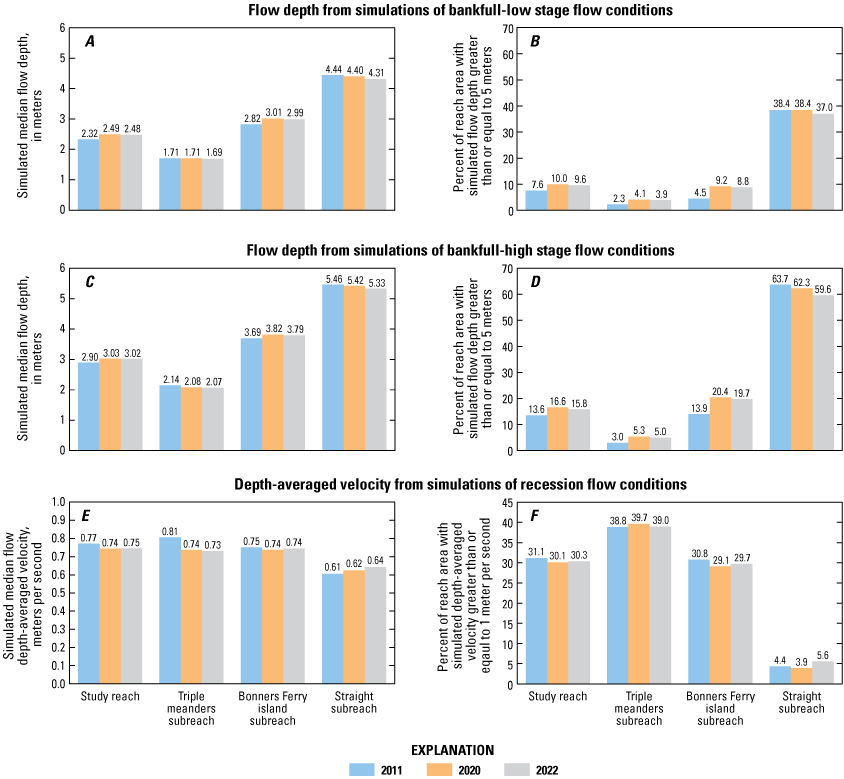
Graphs showing flow depth and depth-averaged velocities (DAV) from hydraulic simulations of three different flow conditions and three channel conditions (2011, 2020, and 2022) in the study reach of the Kootenai River, northern Idaho. Graphs A and C show simulated median flow depths for the bankfull-low stage and bankfull-high stage flow conditions, respectively. Graphs B and D show the percentage of total reach area with simulated depth greater than or equal to 5 meters for the bankfull-low stage and bankfull-high stage flow conditions, respectively. Graphs E and F show the median simulated DAV and the percentage of reach area with DAV greater than 1 meter per second, respectively, for the recession flow condition.
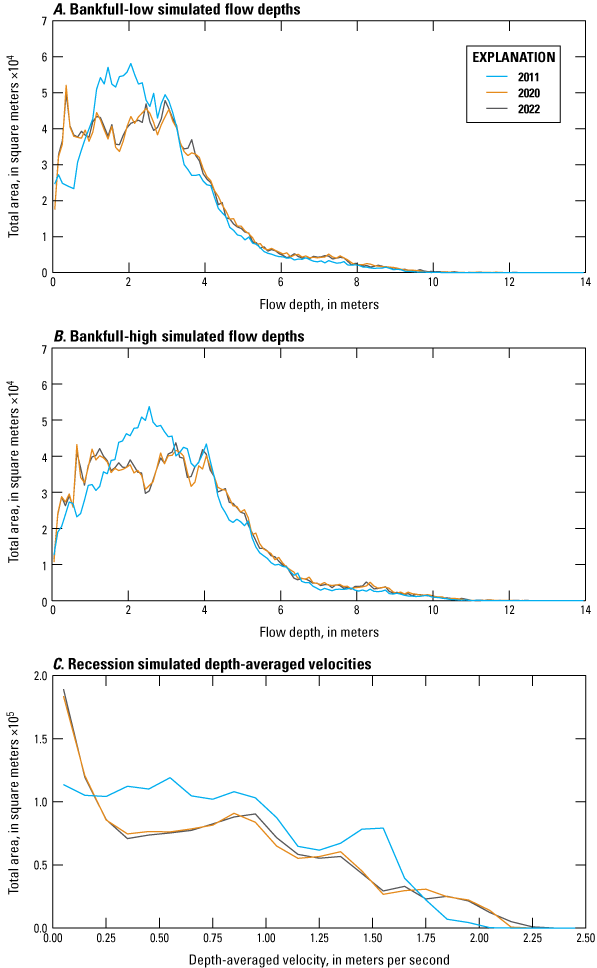
Graphs showing the distributions of flow depths and depth-averaged velocities (DAV) in the study reach of the Kootenai River, northern Idaho, for channel conditions in 2011, 2020, and 2022. Flow depths and DAV are from hydraulic simulations of three different flow conditions: bankfull-low stage (A), bankfull-high stage (B), and recession (C).
In the bankfull-high stage simulations, median flow depths increased from 2011 to 2020 in the BFI subreach only, with declines in the triple meanders and straight subreaches. However, the overall affect in the study reach was an increase of 0.13 m in median flow depth, from 2.9 to 3.03 m. Changes in the proportion of reach area with flow depths greater than or equal to 5 m were like the bankfull-low stage simulation with increases in the triple meanders and BFI subreaches, a decline in the straight subreach, and an overall increase from 13.6 to 16.6 percent in the study reach (fig. 9). Shifts in the distribution of flow depths were also like those for the bankfull-low stage simulations with increased area at the shallowest (<2 m) and deepest areas (>4.5 m), but a decline in mid-range depths (fig. 10). Maps of simulated depths show the spatial distribution of depth changes for the bankfull-high stage flow conditions (fig. 11). More area with deeper flow is apparent in 2020 compared with 2011 in locations like the middle meander of the triple meanders subreach. In addition, parts of the channel are no longer submerged where floodplain surfaces such as islands were constructed and there is an increase in shallow depths around these features.
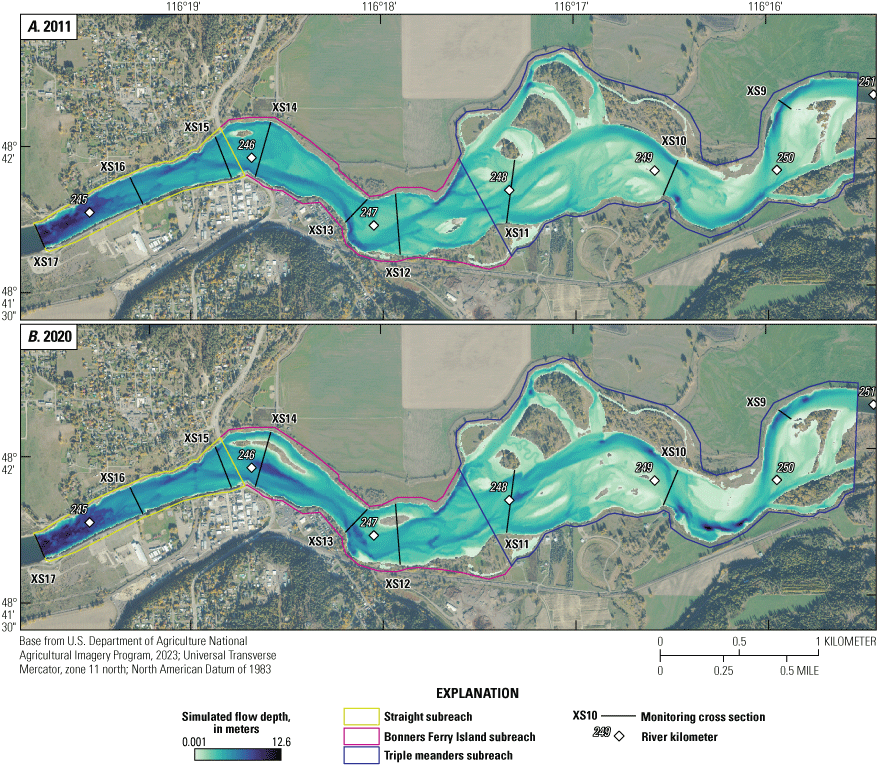
Aerial images showing the simulated flow depths for the bankfull-high stage flow condition using the 2011 (A) and 2020 (B) topographic surfaces of the study reach on the Kootenai River, northern Idaho. Restoration treatments were constructed in the study reach from 2011–18 as part of the Kootenai River Habitat Restoration Program.
From 2020 to 2022, median flow depths declined in the study reach and all three subreaches by 0.02 to 0.09 m, and the proportion of reach area with depths exceeding 5 m declined by 0.4 to 1.4 percent for the bankfull-low stage simulations (fig. 9). Results were similar for the bankfull-high stage flow condition. Total area per flow depth bin shows little change from 2020 to 2022 for both bankfull flow conditions (fig. 10).
Simulated Depth-Averaged Velocity
Restoration treatments caused generally small changes in median DAV for the recession flow conditions (fig. 9). From 2011 to 2020, median DAV declined in the study reach from 0.77 m/s to 0.75 m/s. In the subreaches, the largest change in median DAV was the decrease in the triple meanders subreach and there was little change in the BFI and straight subreaches. For the same period, total area of the study reach with DAV greater than or equal to1 m/s decreased slightly from 31.1 percent to 30.1 percent. Within subreaches, the area with DAV greater than or equal to 1 m/s increased slightly in the triple meanders subreach (from 38.8 to 39.7 percent) but declined in the BFI and straight subreaches.
Distributions of simulated DAV (fig. 10) show that changes in median DAV values for the study reach resulted from increases in area with the lowest (<0.2 m/s) and highest (>1.7 m/s) DAV values. Simultaneously, area with DAV between about 0.2 and 1.7 m/s declined. Maps of DAV from the recession simulations (fig. 12) show notable declines in the BFI subreach from 2011 to 2020. Also notable in the BFI subreach is a less continuous corridor of DAV greater than or equal to 1 m/s compared with 2011. In contrast, DAV increased throughout much of the main channel in the triple meanders subreach. In the straight subreach, there was little change in the spatial distribution of DAV.
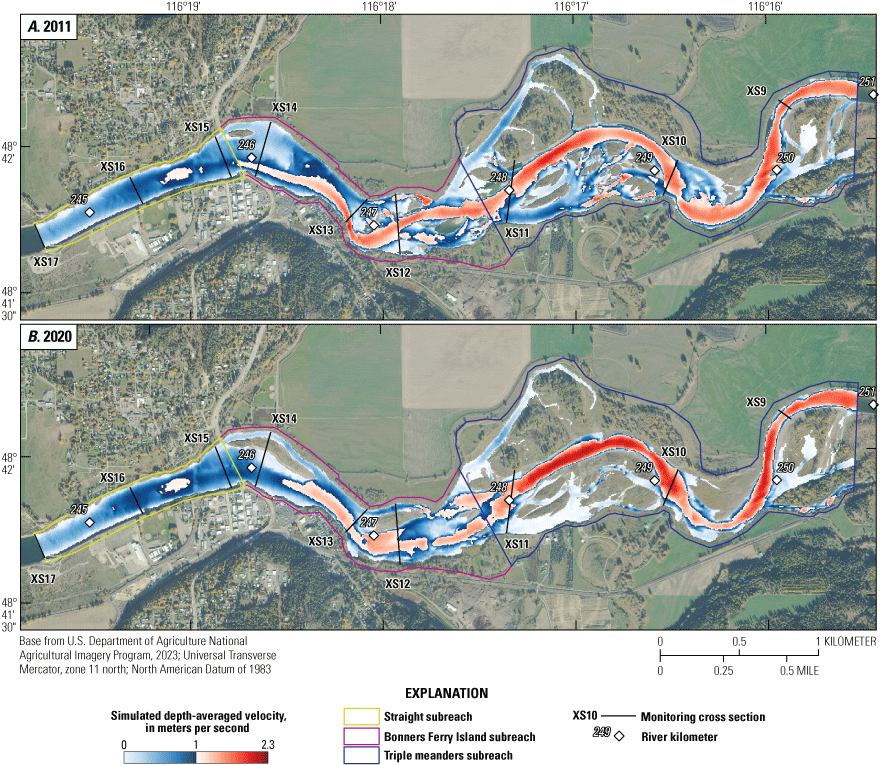
Aerial images showing the simulated depth-averaged velocities for the recession flow condition using the 2011 (A) and 2020 (B) topographic surfaces of the study reach on the Kootenai River, northern Idaho. Restoration treatments were constructed in the study reach from 2011–18 as part of the Kootenai River Habitat Restoration Program.
From 2020 to 2022, DAV changed minimally in all reaches (fig. 9), and the distribution of DAV remained largely the same (fig. 10). Within subreaches, the proportion of reach area with DAV greater than or equal to 1 m/s declined in the triple meanders subreach but increased in the BFI and straight subreaches. The cumulative effect of these changes was a small increase from 30.1 to 30.3 percent of reach area with DAV greater than or equal to 1 m/s in the study reach.
Thalweg
The method used to identify the location of the thalweg performed well for most parts of the study reach, but in two locations, the method performed poorly and defining the thalweg became more subjective. The first location where the method performed poorly was the most upstream part of the BFI reach because this section of channel was characterized by gravel bars and generally shallower depths before and after construction. The method could also only poorly define the thalweg in the downstream end of the straight subreach. Here, the channel morphology transitions from a large gravel wedge to a sand dominated bed with dunes and bedforms of varying size and, after construction, large clusters of boulders.
The construction of restoration treatments caused the thalweg location to shift throughout the study reach (fig. 13). In the triple meanders subreach, the thalweg moved as much as 50 m in the middle and lower meanders along the deep areas where pools were excavated or scoured near pool forming structures. In the upstream part of the BFI subreach, the thalweg shifted from north to south by as much as 130 m. Farther downstream in the BFI subreach, the thalweg moved from the left side of the river towards the channel center. Thalweg location coincided with newly formed pools in the BFI subreach. Thalweg movement in the straight subreach was generally minor, but this was because the thalweg is poorly defined in this reach.
Aerial image showing the locations of the channel thalweg in the study reach of the Kootenai River, northern Idaho, in 2011, 2020, and 2022. The thalweg location shifted in response to restoration treatments constructed from 2011–18 as part of the Kootenai River Habitat Restoration Program.
Compared with the median simulated depth for the entire study reach, the median simulated depth of only the thalweg was greater for the 2011, 2020, and 2022 topographies. This result is expected because the thalweg is generally defined by the deepest parts of the channel. The changes in thalweg median depth after construction of restoration treatments were also larger than those observed for the entire areas of reaches. Bankfull simulations showed increases in thalweg median depth in all reaches from 2011 to 2020 (fig. 14). The thalweg median depth in the study reach increased from 4.69 to 5.27 m in the bankfull-low stage simulation, surpassing the 5 m depth targeted for Kootenai sturgeon in restoration plans. For the bankfull-high stage simulation, thalweg median depth in the study reach increased from 5.49 to 5.96 m. For both bankfull simulations, the increases were greatest in the triple meanders and BFI subreaches and minimal in the straight subreach. The 2 years from 2020 to 2022 resulted in small decreases in thalweg median depths (0.05 to 0.13 meters) for bankfull flow conditions and in all subreaches (fig. 14).
Plots showing median flow depths (A–B) and median depth-averaged velocities (C) for the channel thalweg from hydraulic simulations of three different flow conditions and three channel conditions (2011, 2020, 2022) in the study reach of the Kootenai River, northern Idaho. Restoration treatments were constructed in the study reach from 2011–18 as part of the Kootenai River Habitat Restoration Program.
Thalweg median DAV in the study reach and the triple meander and BFI subreaches exceeded the 1 m/s target velocity before and after construction of restoration treatments (fig. 14). The same was not true in the straight subreach, where thalweg median DAV remained under 1 m/s for all years. After the construction of restoration treatments, thalweg median DAV decreased slightly in the study reach (1.27 to 1.16 m/s). In subreaches, the changes after construction were variable, with small declines in the triple meanders and straight subreaches and a large decline of 1.31 to 1.09 m/s in the BFI subreach. From 2020 to 2022, thalweg median DAV remained unchanged in the study reach, declined slightly in the triple meanders and straight subreaches, and increased slightly in the BFI subreach.
Pools
Figure 15 shows the pools delineated for the 2011 and 2020 bankfull-high stage simulations and shows that the number and extent of pools was greater in 2020 than 2011. Total pool area and volume increased by 63 and 72 percent, respectively, between 2011 and 2020 (table 3). In 2011, the average distance between pools was 343 m, with a maximum distance of about 1,130 m in the lower parts of the triple meanders subreach. In 2020, the average distance between pools was about 170 m, and the maximum distance between pools was about 540 m and still within the lower part of the triple meanders subreach, just as it was in 2011. Pool location did not change from 2020 to 2022, and the average distance between pools remained largely unchanged at 168 m (table 3). However, total pool area and volume decreased slightly by about 5 percent between 2020 and 2022, and the pool excavated in the channel center just upstream from cross-section 11 filled in considerably during this period.
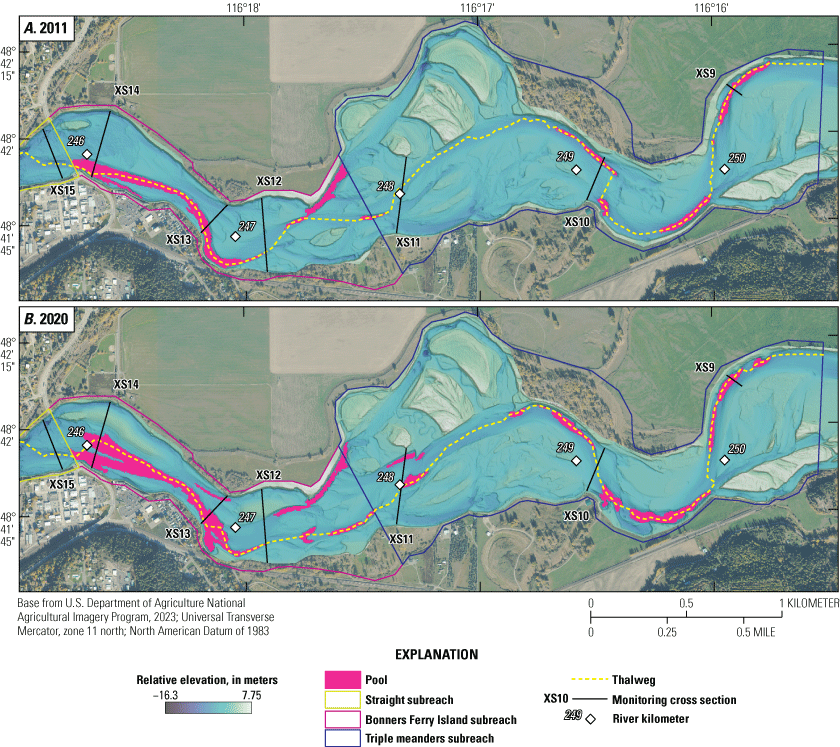
Aerial images showing the extent of pools within the triple meanders and Bonners Ferry Island subreaches (A) before and (B) after the construction of restoration treatments in the study reach of the Kootenai River, northern Idaho. Pools are overlain on the relative elevation models for each year in which elevations are plotted relative to the thalweg water-surface elevation from hydraulic model simulations of the bankfull-high stage flow condition.
Table 3.
Total pool area, total pool volume, and average distance between pools before and after the construction of restoration treatments in the Braided Reach of the Kootenai River, northern Idaho, 2011–22.[Pools were identified using flow depth outputs from two-dimensional hydraulic simulations of the bankfull-high stage flow conditions with topographic surfaces representing channel conditions before (2011) and after (2020 and 2022) the construction of restoration treatments. m2, square meter; m3, cubic meter; m, meter]
Suspended Sediment
At the Below Moyie site, measured SSC values ranged from 1 to 458 milligrams per liter (mg/L), and the fine fraction ranged from 35 to 93 percent of the total measured SSC (fig. 16). Downstream, at the Tribal Hatchery site, measured SSC values ranged from 3 to 335 mg/L, and the fine fraction ranged from 20 to 93 percent of the total measured SSC. At the Moyie and Tribal Hatchery sites, MLR models indicated that log transformed tributary discharge and time were statistically significant explanatory variables of log transformed SSC (table 3). Using the slope coefficient for time, the estimated declines in mean measured SSC from 2006 to 2023 were −62 percent at Below Moyie and −67 percent at Tribal Hatchery (table 4). Mann-Kendall trend tests on the residuals of the MLR models also found statistically significant trends with reductions of −63 percent and −62 percent at the Below Moyie and Tribal Hatchery sites, respectively. For the fine and sand fractions of SSC, MLR models and Mann-Kendall trend tests also suggested statistically significant reductions in measured concentrations at both sites. For the fine fraction, MLR models suggested changes of −54 percent and −65 percent at the Below Moyie and Tribal Hatchery sites, respectively. The Mann-Kendall trend test’s estimates were similar at −53 percent and −61 percent. For the sand fraction, MLR models estimated reductions of −68 percent at Below Moyie and −74 percent at Tribal Hatchery, and the Mann-Kendall trend test estimates were −70 percent and −62 percent.
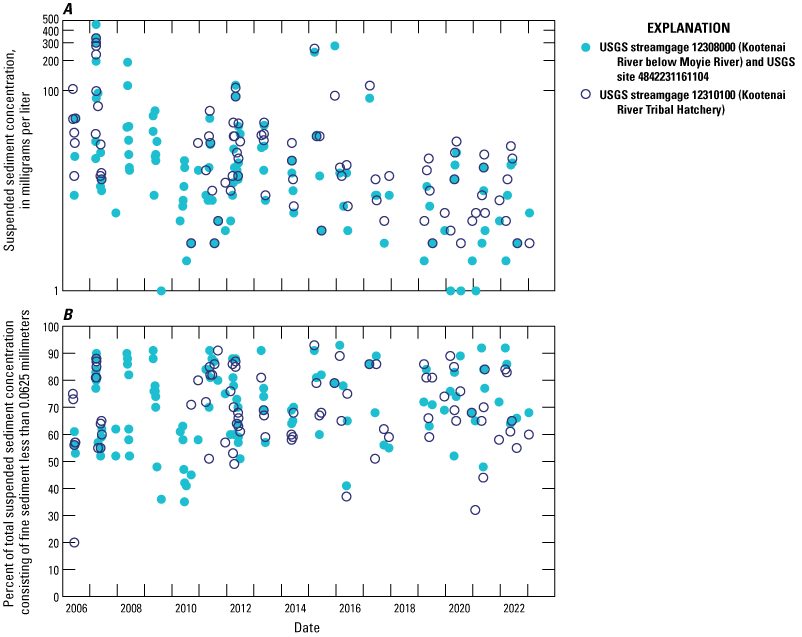
Plots showing measured suspended sediment concentrations (A) and the fine fraction (grain size less than 0.0625 millimeters) of measured suspended sediment concentrations (B) for samples collected at two locations on the Kootenai River, northern Idaho, 2006–23. USGS, U.S. Geological Survey.
Table 4.
Results from trend tests for temporal changes in total, fine, and sand fractions of suspended sediment concentration measured at two locations on the Kootenai River, northern Idaho, 2006–23.[Tribal Hatchery location includes samples collected at U.S. Geological Survey (USGS) streamgage 12310100 (Kootenai River Tribal Hatchery) and Below Moyie location includes samples collected at USGS streamgage 12308000 (Kootenai River below Moyie River) and USGS site 4842231161104. R2, adjusted coefficient of determination; QT, estimated tributary discharge between Libby Dam and study reach; MLR, multiple linear regression; SSC, suspended sediment concentration; <, less than]
Paired samples from the Below Moyie and Tribal Hatchery sites plotted together show that measured SSC tends to be very similar at both sites on a given day. For lower ranges of SSC, the SSC measured at Tribal Hatchery is generally slightly higher than that measured at Below Moyie (fig. 17). At concentrations greater than about 50 mg/L, there appears to be less difference in SSC measured at the two locations for the total and fine fractions. For the sand fraction, measured SSC is generally greater at the Below Moyie site than Tribal Hatchery above about 20 mg/L sand concentration. Simple linear regression suggests that SSC measured at Below Moyie explains 97 percent, 97 percent, and 85 percent of the variability at Tribal Hatchery in total SSC, fine, and sand fractions, respectively. Mann-Kendall trend tests on residuals from these same linear regressions found no statistically significant trends in the difference between paired SSC samples over the analysis period (fig. 17). This was true for total SSC and the fine and sand fractions.
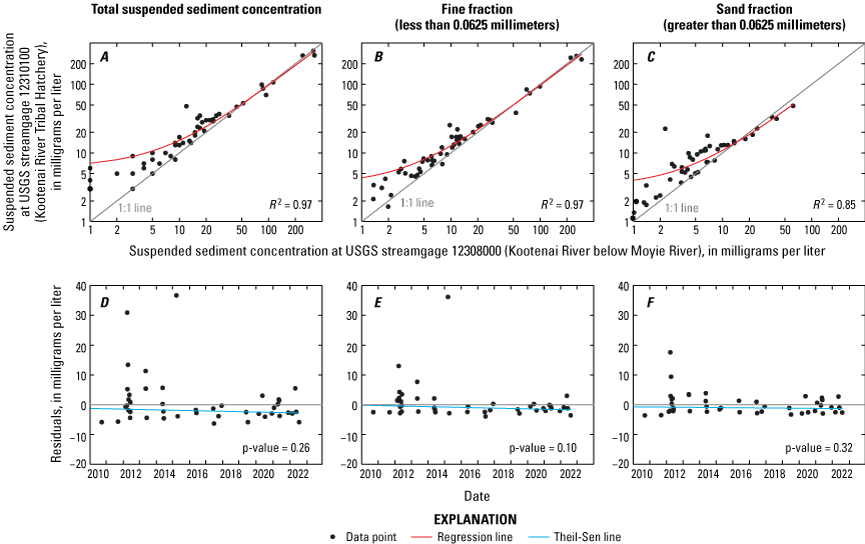
Measured suspended sediment concentrations (SSC) for the total (A), fine (B), and sand (C) fractions of paired samples collected on the same day at two locations on the Kootenai River, northern Idaho from 2006–23. The coefficient of determination (R2) for the linear regressions (red lines) for paired samples are shown on graphs A–C. Graphs D–F show the residuals from the linear regressions in graphs A–C as a function of time. The residuals were used to test for temporal trends in the relation between SSC measured at the two sites using Mann-Kendall trend tests, with continuity correction and Theil-Sen slope estimate (Helsel and others, 2020). P-values from the trend-tests (shown on the graphs) are all greater than 0.05, suggesting no statistically significant temporal trends in measured SSC for paired samples. USGS, U.S. Geological Survey
Discussion
2D hydraulic model simulations provide strong evidence that restoration treatments increased flow depths during bankfull flow conditions, though the increases in area with depths greater than 5 m were generally small. Although median flow depth in the study reach increased after construction of restoration treatments, area with flow depth over 5 m increased by only 3 percent, to a total of 16 percent in the bankfull-high stage simulation. (Because pools were defined as areas with depth greater than 5 m, figure 17 shows the areas of the BFI and triple meanders subreaches that met the 5 m depth target). Though these results represent only one set of flow conditions, they suggest that restoration treatments did not meet the initial goal of 60 percent of channel area deeper than 5 m during the peak of the spring freshet. However, simulated flow depths along the thalweg showed that restoration treatments were more successful at increasing flow depths along the main path of flow, with gains of 0.58 and 0.47 m for the bankfull-low stage and bankfull-high stage simulations, respectively. In addition, thalweg median depths in both bankfull simulations were greater than 5 m after construction.
Much of the increase in thalweg flow depths is attributable to the addition of pools. Evidence shows clear progress towards increasing available pool habitat during the bankfull-high stage flow simulation. After construction, pool area and volume increased, and the average distance between pools went down and formed a “pool ladder” that may help spawning sturgeon migrate upstream to reach suitable spawning habitat. Pool area, volume, and location were generally stable between 2020 and 2022, with only small declines in total area and volume. One exception was the pool upstream from cross-section 11 (fig. 15), which was nearly filled in by sediment in 2022. Another pool excavated in 2016 upstream from cross section 12 (rkm 247.5) was also largely filled in by 2022 despite its proximity to a pool forming structure. The pool near cross-section 12 is in a section of the channel (rkm 247 to 248) that is relatively straight, wide, and shallow compared with other parts of the BFI and triple meanders subreaches. As a result, this section of channel may simply lack the hydraulic conditions required to form and maintain the pool upstream from cross-section 12, despite the addition of a pool forming structure. Loss of pools in the upstream part of the BFI subreach would result in a long gap in the “pool ladder”.
Simulated DAV for the recession flow conditions point to mixed progress towards increasing flow velocities in the study reach. There is some uncertainty in interpreting simulated DAV values because they represent the depth-averaged value at a given model grid node, and not the velocity acting on the channel bed. The FaSTMECH model can be run as a quasi-3D model that provides velocities at specified depth intervals at each grid node. However, these velocity values are based on an assumed logarithmic velocity profile and not uniquely simulated. Nevertheless, DAV values still provide useful information about the general trend in velocities. The KRHRP Master plan specified a goal of increased flow velocities during the recession limb of the spring freshet to prevent the burial and smothering of Kootenai sturgeon eggs by fine sediment (Kootenai Tribe of Idaho, 2009). DAV increased the most within the triple meanders subreach, though this reach already had the largest proportion of area with DAV greater than 1 m/s. Based on simulated DAV values, the triple meanders subreach appears to be best suited for keeping sturgeon eggs clean of fine sediment, but this subreach also has the shallowest flow depths and smallest proportion of reach area with depth greater than 5 m, potentially impeding Kootenai sturgeon access for spawning. Although simulated DAV values indicate a decline in flow velocities in the BFI subreach after construction of restoration treatments, this subreach still had nearly 30 percent of its reach area with DAV greater than 1 m/s and had a considerable increase in flow depths. Despite the small decline in velocities within the reach, the increase in flow depth may encourage Kootenai sturgeon to migrate into and spawn over suitable gravels in the BFI subreach. Additionally, this study simulated only one set of flow conditions for the recession limb of the spring freshet. Other combinations of stage and discharge could possibly produce different results.
Changes in simulated flow depths and velocities between pre- and post-construction channel morphology suggest that restoration treatments have resulted in generally small geomorphic response in the study reach. However, flow conditions since restoration treatments were constructed have possibly lacked the capacity to drive further change in the channel. The highest peak discharge since construction began in 2011 was 1,585 m3/s in 2011, when little of the work had been completed. Future flow conditions may yet produce a larger geomorphic response to the restoration treatments. However, the effect of discharge is confounded by the timing and extent of backwater in the reach, which has also been altered by flow regulation. Daily mean water-surface elevation at the Bonners Ferry streamgage (USGS 12309500) indicates that stage has generally decreased during the spring freshet since flow regulation began at Libby Dam but increased during the rest of the year (fig. 2). Though actual conditions vary year to year, higher stage at the start of the spring freshet may minimize the effect of rising discharge by decreasing water-surface slope and thus reducing shear stress in the reach. Ongoing monitoring of the reach could be useful to determine the conditions that could maintain or enhance restoration features.
A potential direction for future analysis that was beyond the scope of this study is the application of Kootenai sturgeon habitat suitability indices to hydraulic model outputs of flow depth and DAV. Fosness and others (2021) and Dudunake and others (2025) developed depth and velocity habitat suitability indices for Kootenai sturgeon by pairing thousands of Kootenai sturgeon positions (logged with an acoustic telemetry array) with 2D hydraulic simulations to characterize the flow depths and velocities the fish preferred in the Straight Reach during the spawning season. Applying these habitat suitability indices to the output of hydraulic simulations for channel conditions before and after the construction of restoration treatments could further quantify the effects of restoration treatments on habitat availability for Kootenai sturgeon. In addition, this approach could be used to better understand how the availability of suitable Kootenai sturgeon habitat changes in response to discharge and backwater extent in the Braided Reach.
GCD output shows widespread detectable elevation change in the study reach from 2011 to 2020 but indeterminant net volumetric change. This indicates a redistribution of sediment in the study reach in response to the construction of restoration treatments but no notable change in the sediment transport capacity of the reach. Net loss or gain of sediment in the study reach would have provided evidence that restoration treatments drove a notable change in the overall ability of the reach to transport sediment. Construction was not expected to drive net gain or loss of sediment on its own because local material excavated from the channel was used to construct the restoration treatments and no material was moved offsite.
Between 2020 and 2022, the GCD analysis estimated net volumetric loss within the triple meanders and BFI subreaches. The lack of corresponding positive volumetric change in the straight subreach suggests that much of the eroded sediment was silt and sand transported farther downstream as suspended load. The analysis of suspended sediment transport examined longer term trends and did not determine if SSC measured at the Tribal Hatchery site increased from 2020 to 2022. Despite the net negative volumetric changes in two subreaches, decreases in simulated depths, pool area, and volume provided evidence for the deposition of sediment in pools and other deeper areas from 2020 to 2022. Together, net negative volumetric change and deposition in pools suggest that at least in the 2-year period from 2020–22, sediment loss was not from pool scour but instead other areas of the channel. Sediment deposition in pools may also suggest that some of the constructed pool-forming structures may not be promoting continued scour of pools
However, assessing the potential trajectory of continued channel change from the relatively small changes between 2020 and 2022 is difficult, particularly when additional sources of uncertainty in channel bed elevations are considered. First, some part of the measured channel response is likely attributable to transient rather than lasting changes in bed elevations as the channel responds to hydraulic conditions. For example, the migration of gravel sheets (visible in the middle meander of the triple meanders subreach; fig. 5) causes transient perturbations to bed elevations and morphology that may otherwise be rather stable. Similarly, it is difficult to know if the decrease in pool area and volume from 2020 to 2022 is a trend that will continue or is simply the difference in the amount of temporary deposition or scour in pools in response to the hydraulic conditions before the 2020 and 2022 surveys.
The second challenge to understanding the small changes from 2020 to 2022 is the additional uncertainty in the topographic surfaces that were generated but not accounted for in GCD. Specifically, there was frequently a gap in the bathymetric and lidar data along channel banks that resulted from differences in water-surface elevation between surveys or from data collection accessibility. Elevations within this gap were interpolated during topographic surface generation and may have large errors that result in erroneous estimates of elevation change. The detectable elevation changes from 2020 to 2022 do suggest a considerable amount of topographic surface lowering along channel banks. The challenges added by transient elevation changes and topographic surface generation highlight the value of continued monitoring to better understand the ongoing geomorphic response of the Kootenai River to the restoration treatments. Multiple years of data (bathymetric, SSC, or other types relevant to goals) allow practitioners to better detect whether the channel is maintaining a new dynamic equilibrium that self-sustains desired features or if geomorphic response is trending in an undesired direction. Further, ongoing monitoring also allows practitioners to assess the parts of a project that were most and least successful, which may be useful information for further work or projects on other similar channels.
The records of measured SSC at the Below Moyie and Tribal Hatchery sites do not provide strong evidence that restoration work in the Braided Reach has reduced suspended sediment entrainment in this section of the Kootenai River. Instead, after accounting for the effect of tributary discharge on SSC, trend tests estimate similar magnitudes of reductions in the measured total SSC at both sites from 2006 to 2023, indicating a decline in the concentrations of suspended sediment entering the Braided Reach from upstream. Paired SSC provided further support that entrainment rates of suspended sediment have not changed substantially in the Braided Reach. Mann-Kendall trend tests of the residuals from simple linear regression of the paired SSC samples showed no statistically significant temporal trend. These results suggest no change through time in the relation between measured SSC values at the two sites. The estimated reductions in measured concentrations of the fine and sand fractions at the Below Moyie and Tribal Hatchery sites showed a larger difference than total SSC but were still within about 10 percent. Additionally, the Mann-Kendall trend tests for the sand and fine fractions of the paired samples did not indicate a statistically significant change in the relation between measured fine and sand fraction concentrations at the two sites. Taken together, trend tests on measured concentrations and paired samples indicate that at least until early 2023, restoration treatments did not substantially alter entrainment or transport of the fine and sand fractions of suspended sediment in the Braided Reach.
The analysis of measured SSC also indicates that a primary effect on SSC measured at both ends of the Braided Reach is the suspended sediment arriving from upstream. Paired SSC samples often show similar results for the Below Moyie and Tribal Hatchery sites, or generally small increases at Tribal Hatchery. Larger increases in SSC between the two sites would be expected if the Braided Reach was a large contributor to suspended sediment. Previous investigations of SSC in the Braided Reach also suggest incoming suspended sediment is the main driver of measured SSC values throughout the reach (Wood and others, 2015). Using the samples included in this study from 2011 to 2014 as well as point samples collected at the Below Moyie site and samples collected at Kootenai River at Crossport (12308500), Wood and others (2015) also found that although measured SSC generally increased with distance downstream, the difference in SSC results for samples collected on the same or subsequent day was often minimal.
It is beyond the scope of this analysis to determine what changes upstream might be driving the observed reductions in SSC measured in the Braided Reach. However, one possible factor is reduced sediment loading from tributaries because they are the main contributor of sediment to the Kootenai River below Libby Dam. Restoration work completed in tributaries may have reduced suspended sediment delivered to the Kootenai River. One example is removal of a logging road along a section of the Fisher River that was contributing to bank erosion (Kootenai River Network, Inc., 2024b). A second example is a project in Dunn Creek that stabilized a tall, eroding streambank that was a large contributor of sediment to the creek (Kootenai River Network, Inc., 2024a). However, we are unaware of any SSC samples from these tributaries that could demonstrate if these restoration projects reduced delivery of suspended sediment to the Kootenai River.
Although the results in this report do not indicate large changes to suspended sediment entrainment within the Braided Reach, some limitations to the analysis should be considered. The use of samples from reach endpoints does not provide information about more localized but potentially important changes to the movement of fine sediment. For example, bank stabilization and revegetation may have reduced bank erosion where implemented, locally reducing deposition of fine sediment on suitable spawning gravels. Ongoing observations or collection of samples from the channel bed near previously unstable banks would be required to confirm this possibility.
Summary and Conclusions
Between 2011 and 2018, large restoration treatments were constructed in the Braided and Straight Reaches of the Kootenai River as part of the Kootenai River Habitat Restoration Program. Lead by the Kootenai Tribe of Idaho, a key purpose of this interagency, ecosystem-based restoration project was to restore and maintain habitat to support all life stages of Kootenai River Acipenser transmontanus (white sturgeon), Lota lota (burbot), and other native fish. Channel restoration treatments included excavation to alter channel geometry and create pools, construction of pool forming structures along banks, construction of lower elevation floodplain surfaces, installation of large woody debris on banks, and revegetation of banks and floodplains. A central focus of these restoration treatments was to provide conditions that encourage Kootenai sturgeon to migrate into the Braided Reach and spawn over the gravel and cobble substrate that provides suitable habitat for egg survival. As a collaborator on the Kootenai River Habitat Restoration Program, the USGS collected a substantial amount of data and led numerous research efforts.
This report analyzes the geomorphic change in the Braided and Straight Reaches that resulted from the construction of restoration treatments and their resulting effects on flow depths, velocity, and pool availability. Analysis was restricted to a study reach between river kilometers 244.6 to 250.9 where most restoration work was done. The study reach was divided into the triple meanders, Bonners Ferry Island, and straight subreaches. Topographic surfaces from 2011, 2020, and 2022 were used to compare pre- and post-construction channel morphology. Total reach areas with topographic surface lowering and raising and net volumetric change were estimated. Three different flow conditions were simulated with the topographic surfaces, and model outputs were used to assess the effects of restoration treatments. Trend analysis on suspended sediment concentration (SSC) data collected upstream (Below Moyie site) and downstream (Tribal Hatchery site) of the study area was used to make inferences about restoration treatment effects on suspended sediment transport.
Geomorphic change analyses of the topographic surfaces show widespread detectable elevation change, but indeterminant net volumetric change, indicating redistribution of sediment in the study reach. 2D hydraulic model results indicated that within the study reach, restoration treatments increased the areas with flow depths greater than 5 meters from 13.6 to 16.6 percent. This remains well below the initial target of 60 percent of reach area with flow depths exceeding 5 meters. Excavation and natural scour of new pools near constructed pool forming structures were a large source of the increase in flow depths. Total pool area and volume increased by 63 percent and 72 percent, respectively, and the average distance between pools declined from 343 meters in 2011 to 170 meters in 2020. Simulations of the Recession flow condition suggest that velocities in the study reach did not increase but instead decreased. Further, 30.1 percent of the study reach had DAV exceeding 1 meter per second in 2020, which is also below the 60 percent initial target outlined in the Master Plan (Kootenai Tribe of Idaho, 2009). Model output for velocity is depth averaged, so there is some uncertainty regarding the actual velocities acting on the channel bed that would keep suitable spawning gravels clear of silt and sand.
From 2020 to 2022, the channel continued to adjust, but further changes were generally small. Net volumetric change in the study reach was indeterminant, but negative in the triple meanders and BFI subreaches, suggesting net loss of sediment from these two subreaches. In contrast, simulated flow depths during both bankfull flow conditions decreased slightly, as did pool area and volume, suggesting deposition in deeper areas. These seemingly contradictory findings could result from net erosion of sediment in channel areas other than pools and redistribution of sediment into pools. However, longer term monitoring would be required to determine if the changes in flow depths and pool area were simply the result of year-to-year variability or indicative of the direction of channel adjustment.
Multiple linear regression and Mann-Kendall trend tests were used on measured suspended sediment concentrations at the Below Moyie and Tribal Hatchery sites from 2006 to early 2023 to investigate if restoration treatments changed suspended sediment transport in the Braided Reach. Results showed reductions that ranged between about 53 and 76 percent of measured total SSC and the concentrations of the sand and fine fractions. Similar declines in measured SSC at both sites point to a change in the incoming sediment supply rather than a large change in suspended sediment transport in the Braided Reach. Paired samples collected on the same day showed minimal to small increases in measured SSC at the Tribal Hatchery site compared to the Below Moyie site. Mann-Kendall trend tests of these paired samples indicated no statistically significant change in the relation between SSC values measured at the two sites. The results of the Mann-Kendall trend tests also provide evidence that the restoration treatments did not significantly alter suspended sediment transport in the Braided Reach.
Results from this study can provide insights into how the constructed restoration treatments have altered channel morphology and related metrics such as flow depth and velocity in the study reach that affect habitat quality for Kootenai sturgeon and other native fish species. Further, identifying the more or less successful components of the restoration strategy can guide future work on the Kootenai River or on other similar systems. This study also highlights the value of ongoing monitoring to evaluate the success of restoration efforts and inform future work.
References Cited
Barton, G.J., 2004, Characterization of channel substrate and changes in suspended-sediment transport and channel geometry in white sturgeon spawning habitat in the Kootenai River near Bonners Ferry, Idaho, following the closure of Libby Dam: Water-Resources Investigations Report 03–4324, 24 p., accessed March 25, 2024, at https://pubs.usgs.gov/wri/2003/4324/report.pdf.
Barton, G.J., McDonald, R.R., Nelson, J.M., and Dinehart, R.L., 2005, Simulation of flow and sediment mobility using a multidimensional flow model for the White Sturgeon critical-habitat reach, Kootenai River near Bonners Ferry, Idaho: U.S. Geological Survey Scientific Investigations Report 2005-5230, 54 p., accessed March 20, 2024, at https://doi.org/10.3133/sir20055230.
Barton, G.J., McDonald, R.R., and Nelson, J.M., 2009, Simulation of streamflow using a multidimensional flow model for white sturgeon habitat, Kootenai River near Bonners Ferry, Idaho—Supplement to Scientific Investigations Report 2005-5230: U.S. Geological Survey Scientific Investigations Report 2009–5026, accessed January 13, 2023, at https://doi.org/10.3133/sir20095026.
Barton, G.J., Moran, E.H., and Berenbrock, C., 2004, Surveying cross sections of the Kootenai River between Libby Dam, Montana, and Kootenay Lake, British Columbia, Canada: U.S. Geological Survey Open-File Report 2004–1045, 35 p., accessed March 25, 2024, at https://doi.org/10.3133/ofr20041045.
Barton, G.J., Weakland, R.J., Fosness, R.L., Cox, S.E., and Williams, M.L., 2012, Sediment cores and chemistry for the Kootenai River White Sturgeon Habitat Restoration Project, Boundary County, Idaho: U.S. Geological Survey Scientific Investigations Report 2011-5006, 36 p., accessed May 31, 2024, at https://doi.org/ 10.3133/sir20115006.
Berenbrock, C., 2005, Simulation of hydraulic characteristics in the white sturgeon spawning habitat of the Kootenai River near Bonners Ferry, Idaho: U.S. Geological Survey Scientific Investigations Report 2005-5110, 30 p., accessed March 25, 2024, at https://doi.org/10.3133/sir20055110.
Berenbrock, C., and Bennett, J.P., 2005, Simulation of flow and sediment transport in the white sturgeon spawning habitat of the Kootenai River near Bonners Ferry, Idaho: U.S. Geological Survey Scientific Investigations Report 2005-5173, 72 p., accessed March 25, 2024, at https://doi.org/10.3133/sir20055173.
Czuba, C.R., and Barton, G.J., 2011, Updated one-dimensional hydraulic model of the Kootenai River, Idaho—A supplement to Scientific Investigations Report 2005–5110: U.S. Geological Survey Scientific Investigations Report 2011–5128, 36 p., accessed May 31, 2024, at https://pubs.usgs.gov/sir/2011/5128/pdf/sir20115128.pdf
Danielson, J.J., Miller-Corbett, C.D., and Thatcher, C.A., 2021, Pilot topobathymetric terrain model of the Kootenai River near Bonners Ferry, Idaho, 2009–2019: U.S. Geological Survey data release, accessed September 30, 2023, at https://doi.org/10.5066/P9Q3VAY8.
Dudunake, T.J., Kenworthy, M.K., Smith, T.W., Stephenson, S., and Hardy, R.S., 2025, Influence of local river hydraulics on Kootenai River white sturgeon (Acipenser transmontanus) habitat selection during four spawning seasons, 2017–2020: Canadian Journal of Fisheries and Aquatic Sciences, v. 82, p. 1–16, accessed April 9, 2025, at https://doi.org/10.1139/cjfas-2024-0244.
Esri, 2023, Topo to Raster (3D Analyst): Esri web page, accessed April 10, 2024, at https://pro.arcgis.com/en/pro-app/3.1/tool-reference/3d-analyst/topo-to-raster.htm.
Federal Register, 1994, Endangered and threatened wildlife and plants—Determination of endangered status for the Kootenai River population of the white sturgeon: Federal Register, v. 59, no. 171, p. 45,989–46,002, accessed March 25, 2024, https://archives.federalregister.gov/issue_slice/1994/9/6/45988-46003.pdf#page=2.
Fosness, R.L., 2013, Bathymetric surveys of the Kootenai River near Bonners Ferry, Idaho, water year 2011: U.S. Geological Survey Data Series 694, 26 p., accessed April 2, 2024, at https://doi.org/10.3133/ds694.
Fosness, R.L., Dudunake, T.J., Nuckoles, W.P., and Grey, E.I., 2019, Kootenai river habitat restoration project bathymetric surveys near Bonners Ferry, ID (ver 4.0, January 2023): U.S. Geological Survey data release, accessed March 22, 2024, at https://doi.org/10.5066/P9OC5QMH.
Fosness, R.L., Dudunake, T.J., McDonald, R.R., Hardy, R.S., Young, S., Ireland, S., and Hoffman, G.C., 2021, Kootenai River white sturgeon (Acipenser transmontanus) fine-scale habitat selection and preference, Kootenai River near Bonners Ferry, Idaho, 2017: U.S. Geological Survey Scientific Investigations Report 2021–5132, 21 p., accessed December 21, 2022, at https://doi.org/10.3133/sir20215132.
Fosness, R.L., and Williams, M.L., 2009, Sediment characteristics and transport in the Kootenai River white sturgeon critical habitat near Bonners Ferry, Idaho: U.S. Geological Survey Scientific-Investigations Report 2009–5228, 40 p., accessed March 25, 2024, at https://doi.org/10.3133/sir20095228.
Helsel, D.R., Hirsch, R.M., Ryberg, K.R., Archfield, S.A., and Gilroy, E.J., 2020, Statistical methods in water resources: U.S. Geological Survey Techniques and Methods, book 4, chap. A3, 458 p., https://doi.org/10.3133/tm4A3. [Supersedes USGS Techniques of Water-Resources Investigations, book 4, chap. A3, version 1.1.]
Huang, C., Bian, G., Lu, X., Wang, M., Huang, X., and Wang, K., 2017, The analysis of error sources and quality assessment for multibeam sounding products: The International Hydrographic Review, accessed December 21, 2023, at https://journals.lib.unb.ca/index.php/ihr/article/view/26299/1882519052.
Kenworthy, M.K., 2024, Impacts of restoration work on Kootenai River white sturgeon critical habitat, 2011-2022, Kootenai River, Idaho: U.S. Geological Survey data release, accessed October 1, 2024, at https://doi.org/10.5066/P908KXMN.
Kock, T.J., Congleton, J.L., and Anders, P.J., 2006, Effects of sediment cover on survival and development of white sturgeon embryos: North American Journal of Fisheries Management, v. 26, no. 1, p. 134–141, accessed February 9, 2024, at https://doi.org/10.1577/M05-073.1.
Kootenai River Network, Inc., 2024a, Dunn Creek bank stabilization: Kootenai River Network, Inc. website, accessed March 28, 2024, at https://kootenairivernetwork.org/our-work/dunn-creek/.
Kootenai River Network, Inc., 2024b, Fisher River road removal: Kootenai River Network, Inc. website, accessed March 28, 2024, at https://kootenairivernetwork.org/our-work/fisher-river-road-removal/.
Levesque, V.A., and Oberg, K.A., 2012, Computing discharge using the index velocity method: U.S. Geological Survey Techniques and Methods 3–A23, 148 p., accessed March 27, 2024, at https://doi.org/ 10.3133/tm3A23.
Lipscomb, S.W., Berenbrock, C., and Doyle, J.D., 1998, Spatial distribution of stream velocities for the Kootenai River near Bonners Ferry, Idaho, June 1997: U.S. Geological Survey Open File Report 97-830, 174 p., accessed June 20, 2024, at https://pubs.usgs.gov/of/1997/0830/report.pdf.
Logan, B.L., McDonald, R.R., Nelson, J.M., Kinzel, P.J., and Barton, G.J., 2011, Use of multidimensional modeling to evaluate a channel restoration design for the Kootenai River, Idaho: U.S. Geological Survey Scientific Investigations Report 2010–5213, 68 p., accessed March 27, 2024, at https://doi.org/10.3133/sir20105213.
McDonald, R., Nelson, J., Paragamian, V., and Barton, G., 2010, Modeling the effect of flow and sediment transport on white sturgeon spawning habitat in the Kootenai River, Idaho: Journal of Hydraulic Engineering, v. 136, no. 12, p. 1077–1092, accessed May 31, 2023, at https://doi.org/10.1061/(ASCE)HY.1943-7900.0000283.
OCM Partners, 2025, 2010 USACE lidar—Columbia River (OR, WA, ID, MT): National Oceanic and Atmospheric Administration, National Centers for Environmental Information, accessed September 30, 2023, at https://www.fisheries.noaa.gov/inport/item/49920.
Paragamian, V.L., Kruse, G., and Wakkinen, V., 2001, Spawning habitat of Kootenai River white sturgeon, post‐Libby Dam: North American Journal of Fisheries Management, v. 21, no. 1, p. 22–33, accessed May 31, 2024, at https://doi.org/10.1577/1548-8675(2001)021<0022:SHOKRW>2.0.CO;2.
Paragamian, V.L., McDonald, R., Nelson, G.J., and Barton, G., 2009, Kootenai River velocities, depth, and white sturgeon spawning site selection—A mystery unraveled?: Journal of Applied Ichthyology, v. 25, no. 6, p. 640–646, accessed March 25, 2024, https://doi.org/10.1111/j.1439-0426.2009.01364.x.
Parsley, M.J., and Kofoot, E., 2013, Effects of incubation substrates on hatch timing and success of white sturgeon (Acipenser transmontanus) embryos: U.S. Geological Survey Scientific Investigations Report 2013–5180, 16 p., accessed May 31, 2024, at https://doi.org/10.3133/sir20135180.
Partridge, F., 1983, Kootenai River fisheries investigations: Boise, Idaho, Idaho Department of Fish and Game, Job Completion Report, Project F-73-R-5, Subproject IV, Study IV, 94 p., accessed March 25, 2024, at https://collaboration.idfg.idaho.gov/FisheriesTechnicalReports/Forms/AllItems.aspx.
R Core Team, 2024, R: A language and environment for statistical computing: Vienna, Austria, R Foundation for Statistical Computing, accessed January 20, at https://www.R-project.org.
Riverscapes Consortium, 2020, Geomorphic change detection software: Riverscapes Consortium web page, accessed December 20, 2023, at http://gcd.riverscapes.xyz/.
U.S. Army Corps of Engineers, 2008, Upper Columbia alternative flood control and fish operations—Record of decision for Libby Dam flood control and fish operations: Portland, Oreg., U.S. Army Corps of Engineers, Upper Columbia Alternative Flood Control and Fish Operations, 15 p., accessed February 8, 2024, at https://www.usbr.gov/pn/fcrps/hydro/varq/usace-rod-UCEIS-june2008.pdf.
U.S. Fish and Wildlife Service, 1999, Recovery plan for the Kootenai River population of the white sturgeon (Acipenser transmontanus): U.S. Fish and Wildlife Service, 96 p. plus appendixes, accessed February 10, 2024, at http://ecos.fws.gov/docs/recovery_plan/990930b.pdf.
U.S. Fish and Wildlife Service, 2006, Fish and Wildlife Service biological opinion regarding the effects of Libby Dam operations on the Kootenai River white sturgeon, bull trout, and Kootenai sturgeon critical aquatic habitat: Portland, Oreg., document number 1–9–01–F–0279R, 167 p, accessed June 20, 2024, at https://www.salmonrecovery.gov/Files/BiologicalOpinions/2008/Final%20Libby%20Dam%20BiOp%202-18-06lr3.pdf.
U.S. Fish and Wildlife Service, 2008, Endangered and threatened wildlife and plants; critical habitat revised designation for the Kootenai River population of the white sturgeon (Acipenser transmontanus)—Final rule: Federal Register, v. 73, no. 132, p. 39505–39523, accessed June 20, 2024, at https://www.govinfo.gov/content/pkg/FR-2008-07-09/pdf/E8-15134.pdf.
U.S. Fish and Wildlife Service, 2019, Revised recovery plan for the Kootenai River distinct population of the white sturgeon (Acipenser transmontanus): U.S. Fish and Wildlife Service, Portland, Oreg., 35 p. plus appendixes, accessed May 10, 2024, at https://www.fws.gov/node/68817.
U.S. Geological Survey, 2006, Collection of water samples (ver. 2.0): U.S. Geological Survey Techniques of Water-Resources Investigations, book 9, chap. A4, accessed May 3, 2024, at https://doi.org/ https://doi.org/.
U.S. Geological Survey, 2019, 3D elevation program lidar point cloud: U.S. Geological Survey web page, accessed January 10, 2022, at https://apps.nationalmap.gov/downloader/.
U.S. Geological Survey, 2023, USGS water data for the Nation: U.S. Geological Survey National Water Information System database, accessed March 29, 2024, at https://waterdata.usgs.gov/nwis/.
U.S. Geological Survey, 2023, Lidar point cloud—USGS national map 3DEP downloadable data collection: U.S. Geological Survey web page, accessed April 10, 2024, at https://apps.nationalmap.gov/lidar-explorer/#/.
Wood, M.S., Fosness, R.L., and Etheridge, A.B., 2015, Sediment transport and evaluation of sediment surrogate ratings in the Kootenai River near Bonners Ferry, Idaho, water years 2011–14: U.S. Geological Survey Scientific Investigations Report 2015–5169, 48 p., accessed March 25, 2024, at https://doi.org/10.3133/sir20155169.
Conversion Factors
International System of Units to U.S. customary units
Datums
Vertical coordinate information is referenced to the North American Vertical Datum of 1988 (NAVD 88).
Horizontal coordinate information is referenced to the North American Datum of 1983 (NAD 83).
Elevation, as used in this report, refers to distance above the vertical datum.
Supplemental Information
A water year is the 12-month period from October 1 through September 30 of the following year and is designated by the calendar year in which it ends.
Concentrations of chemical constituents in water are in milligrams per liter (mg/L).
Abbreviations
BFI
Bonners Ferry Island
DAV
depth-averaged velocities
DEM
digital elevation model
FaSTMECH
Flow and Sediment Transport with Morphological Evolution of Channels
GCD
Geomorphic Change Detection
KRHRP
Kootenai River Habitat Restoration Project
KTOI
Kootenai Tribe of Idaho
lidar
light detection and ranging
MLR
multiple linear regression models
REM
relative elevation models
rkm
river kilometer
SSC
suspended sediment concentration
USGS
U.S. Geological Survey
VARQ
variable discharge flood control
For more information about this publication, contact
Director, U.S. Geological Survey Idaho Water Science Center
230 Collins Rd.
Boise, ID 83702-4520
For additional information, visit https://www.usgs.gov/centers/idaho-water-science-center
Publishing support provided by the Tacoma and Baltimore Service Centers.
Disclaimers
Any use of trade, firm, or product names is for descriptive purposes only and does not imply endorsement by the U.S. Government.
Although this information product, for the most part, is in the public domain, it also may contain copyrighted materials as noted in the text. Permission to reproduce copyrighted items must be secured from the copyright owner.
Suggested Citation
Kenworthy, M.K., and Dudunake, T.J., 2025, Effects of restoration work on Kootenai River Acipenser transmontanus (white sturgeon) critical habitat, Kootenai River, northern Idaho, 2011–22: U.S. Geological Survey Scientific Investigations Report 2025–5071, 35 p., https://doi.org/10.3133/sir20255071.
ISSN: 2328-0328 (online)
Study Area
| Publication type | Report |
|---|---|
| Publication Subtype | USGS Numbered Series |
| Title | Effects of restoration work on Kootenai River Acipenser transmontanus (white sturgeon) critical habitat, Kootenai River, northern Idaho, 2011–22 |
| Series title | Scientific Investigations Report |
| Series number | 2025-5071 |
| DOI | 10.3133/sir20255071 |
| Publication Date | September 09, 2025 |
| Year Published | 2025 |
| Language | English |
| Publisher | U.S. Geological Survey |
| Publisher location | Reston, VA |
| Contributing office(s) | Idaho Water Science Center |
| Description | Report: viii, 34 p.; Data Release |
| Country | United States |
| State | Idaho |
| Other Geospatial | Kootenai River |
| Online Only (Y/N) | Y |