

Hydrogeologic Characterization of the Cahuilla Valley and Terwilliger Valley Groundwater Basins, Riverside County, California
Links
- Document: Report (15.4 MB pdf) , HTML , XML
- Data Releases:
- USGS data release - Electrical resistivity tomography in the Anza-Terwilliger Valley, Riverside County, California 2018
- USGS data release - Select borehole data for Anza Valley, Anza, CA
- USGS data release - Hydrogeologic data from the Cahuilla Valley and Terwilliger Valley groundwater basins, Riverside County, California, 2022 (ver. 2.0, August 2025)
- NGMDB Index Page: National Geologic Map Database Index Page (html)
- Download citation as: RIS | Dublin Core
Acknowledgments
This study was funded, in part, by a grant from the California Department of Water Resources, for which the Ramona Band of Cahuilla served as the Local Project Sponsor. The authors thank the Ramona Band of Cahuilla for its assistance in developing the scope of work and for administering the grant funds. The authors are indebted to the well and landowners who provided permission to access their property and collect groundwater-level measurements in their wells.
The authors also wish to thank the U.S. Geological Survey current and former field staff, Andrew Morita, Adam Kjos, Greg Smith, Dennis Clark, and Anthony Brown, illustrators Emerson Gusto and Donna Knifong, editor Kelley Calvert, and reviewers for their help in completing this report.
Abstract
The relation between the groundwater and the amount of natural recharge to the Cahuilla Valley and Terwilliger Valley groundwater basins is not well understood. During the 20th century, the reliance on groundwater near Anza, California, used for agricultural, domestic, and municipal reasons has increased, and there is the potential for changes in groundwater availability related to climate change. Several types of existing data were evaluated, and new data were collected for this study, with the goal of characterizing the region’s hydrogeology. The study’s scope included constructing a geologic framework model to show where the groundwater-bearing units are present and their relation to each other, estimating the major components of the groundwater budget, and understanding local short-term and regional long-term groundwater flow and how that has changed since the early 1900s.
Two electrical resistivity tomography surveys were done in the Durasno Valley about 2,150 feet apart to identify the thickness of the alluvium, its horizontal extent, and the depth-to-basement along two profiles perpendicular to Cahuilla Creek. The subsurface sediments were mostly horizontally layered and the transitional boundary between the alluvium and basement was thinner and shallower along the upgradient profile where the depth-to-basement was about 70 feet below land surface; the depth-to-basement at the downgradient profile was more than about 140 feet below land surface. The results from the surveys were used to place four monitoring wells at two sites along the survey profiles. Artesian flow from the deepest well at the downgradient site indicated that the decomposed and competent basement likely contributed some groundwater to the overlying alluvium, laterally, from below, or both.
A digital three-dimensional geologic framework model was constructed using EarthVision software to represent the subsurface geometry of the alluvium, decomposed basement, and competent basement. Maps and cross sections of the modeled thicknesses of the alluvium and decomposed basement, and the modeled elevation of the top of the competent basement, were made to show the subsurface geometry of vertical faults, selected wells, and the groundwater-bearing units.
Because natural recharge is related to the variable cycles of precipitation, estimates are difficult to quantify. Recharge and runoff have extreme interannual variability in the study area; recharge and runoff can be sporadic, and a substantive amount may not occur in some years. Estimates of recharge from a previous study and the regional-scale Basin Characterization Model for California for four different periods ranged from 3,800 acre-feet/year for 1897–1947 to 5,900 acre-feet/year for 1971–2000. Potential recharge from the disposal of domestic septic systems may have been as much as 500 acre-feet in 2020. It was estimated that between about 400 and 2,400 acre-feet/year of groundwater is lost through evapotranspiration by vegetation and evaporation from open water bodies, but the main source of discharge is through pumpage, mainly used for agriculture from the alluvium in the Cahuilla Valley and Terwilliger Valley groundwater basins. The estimated total pumpage for 1991–2021 ranged from about 1,140 acre-feet in 2019 to about 3,450 acre-feet in 1994. When summed, the cumulative amount of estimated pumpage between 1991 and 2021 was about 81,400 acre-feet.
The general direction of groundwater flow is from the northeast along the San Jacinto fault zone at the headwaters of Cahuilla and Hamilton Creeks, to the surface-water outlets at the west and southeast parts of the study area. Groundwater-level data from the 1950s and earlier indicate that there was a natural groundwater divide between the Cahuilla Valley and Terwilliger Valley groundwater basins, but the changing magnitude and extent of the groundwater depressions caused by pumping since about 1950 indicate that the location of the natural groundwater boundary between the Cahuilla Valley and Terwilliger Valley groundwater basins has migrated over time.
Flow from the upper to the lower parts of the Cahuilla Valley groundwater basin roughly follows the course of Cahuilla Creek through the narrow Durasno Valley where an estimated volume of flow in April 2019 was about 10–150 acre-feet/year. Short-term trends in groundwater levels, particularly in wells where groundwater is shallow and in the basement unit, show how some areas respond quickly to recharge and discharge. Wells located further to the east within the Cahuilla Valley groundwater basin in the alluvium show much less of a response to recharge events; areas of sustained pumpage from the alluvium, primarily for agriculture, show long-term declines in groundwater levels and generally do not show the effects of storm events or recent runoff. Groundwater levels in wells that are farthest from where most of the recharge occurs and where pumping has been the greatest, had some of the largest long-term groundwater-level declines at a rate of about 0.8 foot/year between 1971 and 2021.
Introduction
Groundwater is the sole source of water supply for a rural community and two Native American Tribes in the Anza Valley, California. The relation between the groundwater-bearing units of the surrounding Cahuilla Valley and Terwilliger Valley groundwater basins, and the amount of natural recharge to them, are not well understood. During the 20th century, the reliance on groundwater for agricultural, domestic, and municipal uses has often exceeded recharge, and there is the potential for changes in groundwater availability related to climate change. The Anza Valley is within the Cahuilla Valley groundwater basin, and rights to pump groundwater within it is adjudicated in U.S.A. v. Fallbrook Public Utility District, and others (Civil No. 51-CV-1247-GPC-RBB; U.S. District Court Southern District of California, 2021). To support the adjudication and management of water resources in the area, the Ramona Band of Cahuilla and the U.S. Geological Survey (USGS) initiated a cooperative study of the hydrogeologic system encompassing the Cahuilla Valley and Terwilliger Valley groundwater basins and parts of the San Felipe Creek and Santa Margarita River hydrologic subbasins (figs. 1, 2). The study area encompasses the rural community in and around the town of Anza and west of Lake Riverside, the southeastern part of the Ramona Band of Cahuilla Reservation, and the Cahuilla Reservation. Residents occupy widely dispersed dwellings throughout the study area, and the population in 2020 was estimated to be about 6,480 (Esri Data Development, 2023).

Location of study area, including the Santa Margarita River hydrologic subbasins, near Anza, California.

Hydrologic subwatersheds and groundwater basins near Anza, California.
The study area includes the headwaters of the Santa Margarita and San Felipe Creek watersheds, which extend into Riverside, San Diego, and Imperial Counties, California (figs. 1, 2). Two main aquifer units yield groundwater to wells—the alluvium and the underlying competent and decomposed rocks of the basement complex. Previous studies (Moyle, 1976; Woolfenden and Bright, 1988; Landon and others, 2015) identified key gaps in hydrologic data needed to understand the properties of the aquifer system. Improved data coverage and conceptual understanding of the aquifer system presented in this report can be used to monitor the effects of historical and future hydrologic stresses on the Cahuilla Valley and Terwilliger Valley groundwater basins.
Purpose and Scope
The purpose of this long-term, multi-phase study is to characterize the hydrogeology of the Cahuilla Valley and Terwilliger Valley groundwater basins and surrounding groundwater-bearing units, with the ultimate goal of developing a calibrated integrated hydrologic model to help manage the groundwater resources. The purpose of this report is to document (1) the methods and results of field data collection; (2) the geologic framework model developed from well-log reports and regional gravity data; (3) the conceptual understanding of the hydrogeologic system, including sources of recharge and discharge; and (4) the hydrologic stresses and changes in groundwater levels and flow through time. Groundwater and surface-water data have been continuously collected by the USGS since 2017 and the hydrologic framework model was constructed using data from about 580 well logs within the Cahuilla Valley and Terwilliger Valley groundwater basins. Groundwater levels measured in wells from 1916 to 2021 were used to show long-term trends.
Previous Hydrogeologic Studies
Many investigations into various aspects of the regional geohydrology in the Anza area have been completed. The following publications are not a complete set of all available reports that were used as references for their historical significance, data reliability, and availability. In addition to groundwater-level data, these initial studies examined well logs and contained descriptions of climate and the local geology that provided a basis for future studies.
Early documented groundwater levels in the area surrounding the town of Anza, which Waring (1919) referred to as Babtiste Valley, ranged between 5 and 108 feet (ft) below land surface (bls) in 1916. At that time, wells were no deeper than about 160 ft and primarily were used for homesteads and to grow grain for cattle. Early surveys by the California Department of Water Resources (DWR) documented groundwater levels for many wells in the Anza area as early as 1940, but mainly during the 1950s (California Department of Water Resources, 1956). Two flowing wells were observed in the southwestern part of the Cahuilla Valley groundwater basin in 1953 and 1954, indicating that groundwater hydraulic heads were above the land surface (artesian conditions) in the area west of the Cahuilla Reservation (California Department of Water Resources, 1956).
In the late 1940s, farmers began the transition from grain to alfalfa, thus increasing the region’s reliance on groundwater. In fall 1953, the DWR reported 37 active wells producing from less than 25 gallons per minute (gal/min) to as much as 100 gal/min and specific capacities that ranged from 0.2 to 13.7 gallons/minute/foot (gal/min/ft; California Department of Water Resources, 1956).
The DWR compared groundwater-level data from the early 1900s to the mid-1950s in the Anza area and reported that groundwater levels were “slightly, but not appreciably, lower than in 1916” and had declined by about 7 ft (California Department of Water Resources, 1956, p. 73). The documented declines in groundwater levels since the 1950s (California Department of Water Resources, 1956, 1974) initiated more focused studies aimed at aquifer characterization to better quantify the effects of groundwater depletion. Moyle (1976) completed gravity surveys to estimate the thickness of the alluvium, described the general geology of the surface watershed, and collected detailed hydrologic data for the study area. These hydrologic data included summaries of precipitation (1897–1947) with contours of average precipitation between 16 inches (in.) in the lower valley and 30 in. at higher elevations near Thomas Mountain (fig. 2).
Woolfenden and Bright (1988) described two main groundwater-bearing units—the alluvium and the weathered and consolidated rock (decomposed and competent basement). Woolfenden and Bright (1988) presented detailed aquifer descriptions based on well logs, differences in specific capacities between wells completed in the alluvium and basement complex, updated precipitation data for the 1940s to the mid-1980s, and compared consumptive use of groundwater between 1973 and 1986. They provided locations of pumping depressions for 1973 and 1986 and patterns of water-quality differences in the study area for surface water and groundwater.
The geology within the study area was first compiled by Rogers (1965) in a regional geologic map at 1:250,000 scale. Dibblee and Minch (2008) compiled a geologic map of the northern two-thirds of the study area and most of the groundwater basins at 1:62,500 scale (north of latitude 30° 30’ N) and mapped major faults, including the San Jacinto fault zone, which forms the northeastern boundary of the study area. Surrounding the alluvium are mainly plutonic and metasedimentary rocks. Landon and others (2015) provide detailed analysis of aquifer geometry from well logs and gravity data to estimate the thickness of the alluvium. Maps showing changes in groundwater levels for 2004–13 and 2006–13 also are presented. This report used additional well logs to create the geologic framework model and used groundwater-level data through 2021 for hydrographs and to construct groundwater-level contours.
Accessing Data
The groundwater-level and surface-water data presented in this report can be accessed through the USGS National Water Information System Web service (NWISWeb; https://nwis.waterdata.usgs.gov/ca/nwis/nwis; U.S. Geological Survey, 2021). The NWISWeb serves as an interface to a database of site information, including current and historical groundwater, surface-water, and water-quality data collected from locations throughout the United States and elsewhere. Data can be retrieved by state, category, and geographic area and can be selectively refined by specific location or parameter field. NWISWeb can output groundwater-level and water-quality graphs, site maps, and data tables (in Hypertext Markup Language [HTML] and American Standard Code for Information Exchange [ASCII] formats). At the time of this study, there were about 350 sites with groundwater-level measurements from 1916 to 2021 available on NWISWeb for the study area.
Description of Study Area
The study area is about 130 square miles (mi2) and is about 20 miles (mi) southwest of Palm Springs (fig. 1). By the end of the 19th century, a small group of the Cahuilla Band had settled in the lowlands of the basin. Today, the Cahuilla Reservation covers about 18,900 acres of the total 82,560 acres of the study area. The Ramona Band of Cahuilla covers about 1,350 acres, of which 755 acres are within the study area.
The study area was defined using the National Hydrography Dataset (NHD) to delineate the local drainage basin boundary (U.S. Geological Survey, 2022), which included parts of the Santa Margarita and San Felipe Creek subbasins (fig. 1). Three subwatersheds lie within the study area boundary: the Lower Cahuilla Creek, Upper Cahuilla Creek, and Nance Canyon subwatersheds (Nance Canyon is commonly called the “Terwilliger”; fig. 2). The Upper Cahuilla Creek and Lower Cahuilla Creek subwatersheds have a combined area of about 86 mi2 and drain to the southwest along Hamilton and Cahuilla Creeks; these creeks merge about 2 mi southwest of the town of Anza. Cahuilla Creek continues westward-southwestward into the Santa Margarita River, and ultimately, the Pacific Ocean. The Nance Canyon subwatershed has an area of about 43 mi2 and is drained by Coyote Creek to the southeast, and ultimately, into the Salton Sea (figs. 1, 2). Hamilton, Cahuilla, and Coyote Creeks are ephemeral, meaning that they have flows of short duration only in response to heavy local precipitation and from infrequent storms and runoff from the surrounding mountains. The Cahuilla Reservation is in the central part of the study area and extends into parts of all three subwatersheds.
The study area ranges in elevation from about 6,800 ft near Thomas Mountain, north of Anza, to about 2,100 ft at the point where water in Cahuilla Creek exits the study area (fig. 2). The average annual temperature for Anza is 57 degrees Fahrenheit (°F) with minimum temperatures near freezing in the winter months and maximum temperatures in the 90s °F during summer months (Climate-Data, 2023). Average annual precipitation for the period 1981–2010 ranged from 12.31 in. at the town of Anza to 26.18 in. at Idyllwild, about 15 mi north of Thomas Mountain (fig. 1; Western Regional Climate Center, 2020a, 2020b). Snowfall in the Anza area ranges between 10 and 15 in. and generally occurs from early November to late April with a freeze probability of 50 percent or greater between late November and late March (Western Regional Climate Center, 2020a). Precipitation generally occurs in the winter months and from infrequent local thunderstorms in August and September related to monsoon moisture from the south. Storms can vary in intensity from mild to severe; the latter may result in large volumes of precipitation over short periods that cause flash floods and heavy runoff.
Within the study area are two groundwater basins, the Cahuilla Valley and Terwilliger Valley (California Department of Water Resources, 2020). These groundwater basins generally are defined by the boundary of the unconsolidated alluvium deposits and the outcrops of the basement complex that surround and underlie the alluvium deposits. The Cahuilla Valley and Terwilliger Valley groundwater basins are much smaller than the surface-water subwatersheds and cover an area of about 29 mi2 and 13 mi2, respectively. Based on groundwater-level data (Moyle, 1976; Woolfenden and Bright, 1988; Landon and others, 2015; U.S. Geological Survey, 2021), a groundwater divide coincides generally with the surface-water boundary between the Upper Cahuilla Creek and Nance Canyon subwatersheds, but the exact location of this divide can migrate depending on the amount of local recharge and discharge (groundwater pumpage) in that area.
Surface Water
Surface-water flow occurs mostly in response to precipitation and from snowmelt from the San Jacinto Mountains that drains along ephemeral creeks and small washes into Cahuilla and Coyote Creeks. When present, flow in these creeks passes out of the study area to the southwest via Cahuilla Creek and southeast via Coyote Creek (fig. 2). During wet periods, it is common for ponding water to be present and for evaporation to occur along Cahuilla Creek within and just below Durasno Valley in late winter and early spring, possibly extending into summer owing to episodic run-off events.
Historical surface-water discharge measurements in the study area are sparse because of the ephemeral nature of the creeks; therefore, no permanent streamgages have been installed. Despite these challenges, some attempts have been made to estimate surface-water flow when it is present in the study area. Estimates of intermittent discharge in Cahuilla Creek from 1950 to 1954 by the DWR ranged between 0.04 and 1.46 cubic feet per second (ft3/s) and reported a peak flow of about 130 ft3/s in January 1954 (California Department of Water Resources, 1956). Between 1961 and 1973 and in 2019, the USGS measured peak flow along Cahuilla Creek where it crosses State Route 371, west of the town of Anza (U.S. Geological Survey, 2021; fig. 2; table 1); peak flows ranged from 0 to 102 ft3/s.
Table 1.
Peak-flow measurements for 1961–73 and 2019 at U.S. Geological Survey site 11042430 (U.S. Geological Survey, 2021) near Anza, California.[—, no data]
During 2019–20, the USGS installed four crest-stage gages (fig. 2) to estimate peak flows during periodic field visits. Data from the crest-stage gages installed at USGS site 11042430 on Cahuilla Creek and at USGS site 333348116374101 on Hamilton Creek show that these creeks were dry during all visits except one, when flow was estimated by using the indirect methods of Benson and Dalrymple (1967). On February 14, 2019, the estimated discharge into Cahuilla and Hamilton Creeks were 59 ft3/s and 58 ft3/s, respectively. No flow was observed during periodic visits to the other two crest-stage gages west of the Cahuilla Reservation (USGS sites 333129116481401 and 3132116472401). Surface-water discharge records are not available for the many other unnamed ephemeral creeks and washes that converge to form Coyote Creek, which drains out through the southeastern part of Terwilliger Valley (fig. 2).
Land Use
Much of the undeveloped land outside the Cahuilla Valley and Terwilliger Valley groundwater basins is national forest or state park land. Within the groundwater basins, land has primarily been used for individual homesteads and agriculture. Waring (1919) reported that although several wells existed, no attempt had been made to obtain groundwater for uses other than domestic or stock before 1916. Moyle (1976) reported that about 326 acres of irrigated alfalfa pasture existed in 1953 and that there was a total of about 535 acres of irrigated crops in the eastern section of the Cahuilla Valley groundwater basin. Land use in most of the area is undeveloped with some agricultural use, but rural residential development has increased over time. To quantify land-use change in the study area, spatial data from digital land-use maps were compared for intermittent years when available between 1934 and 2016 (fig. 3).
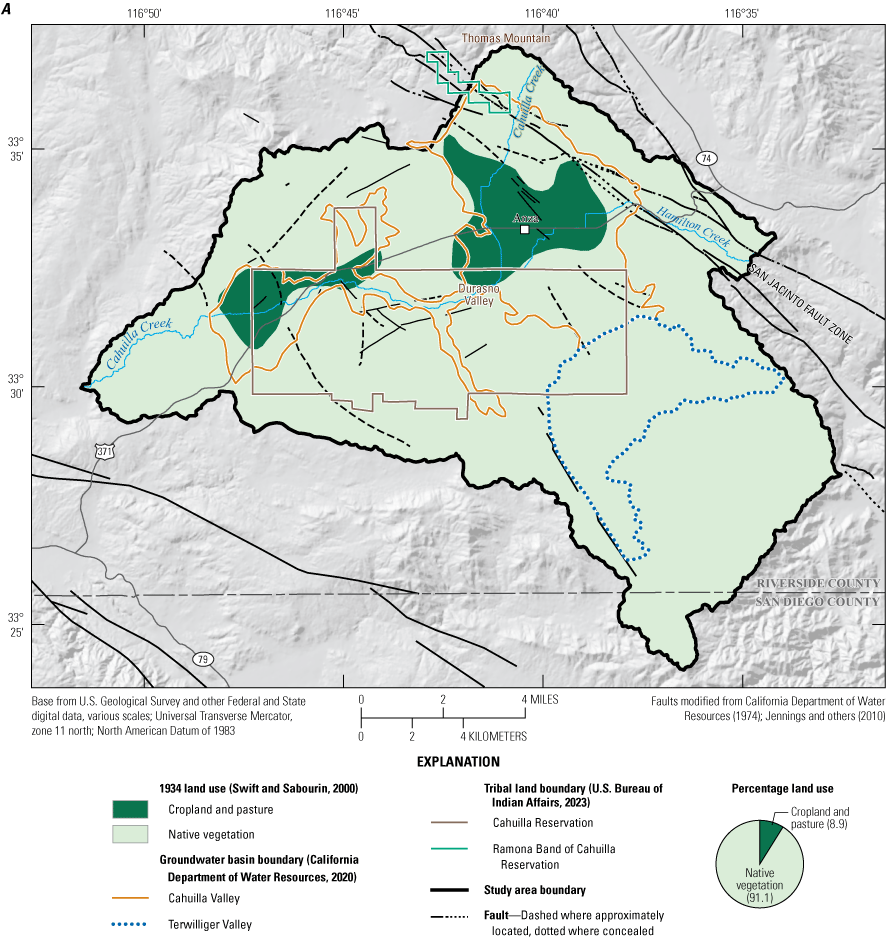
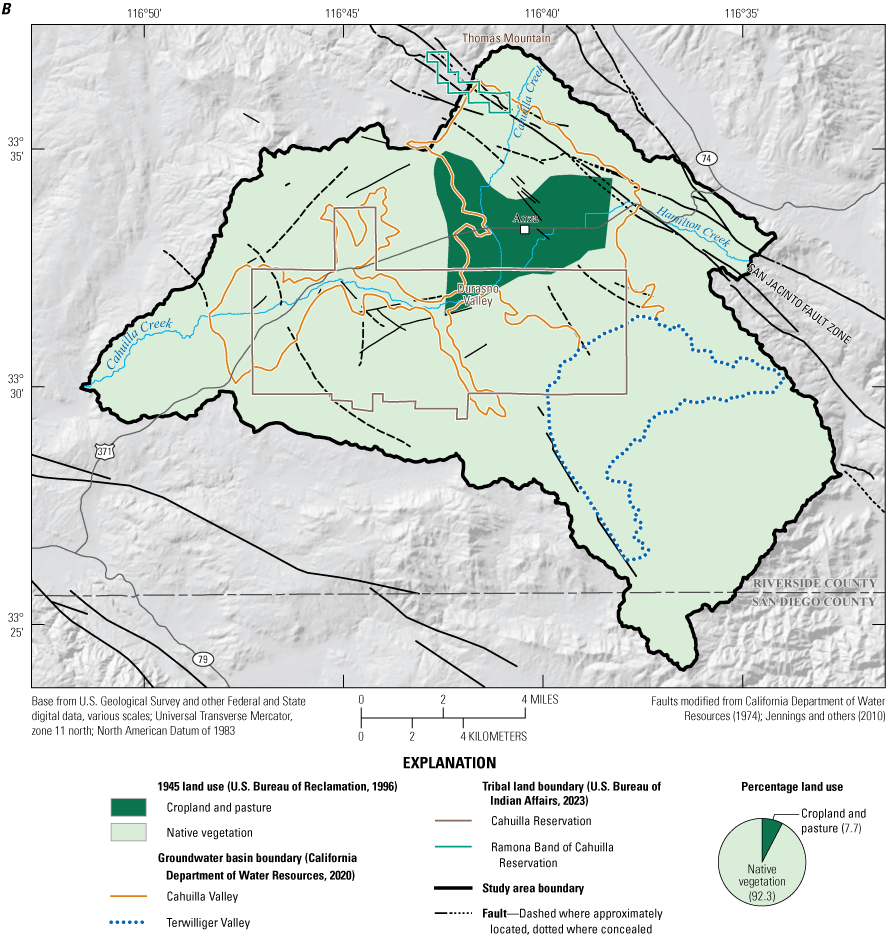
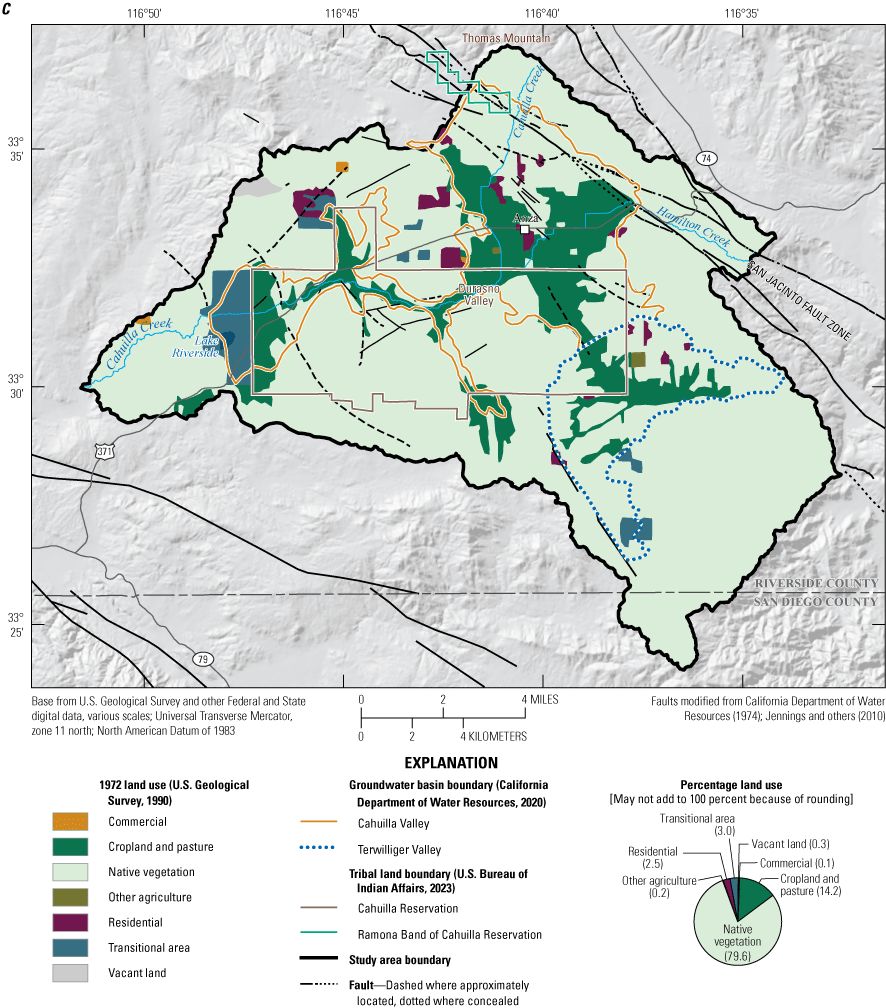
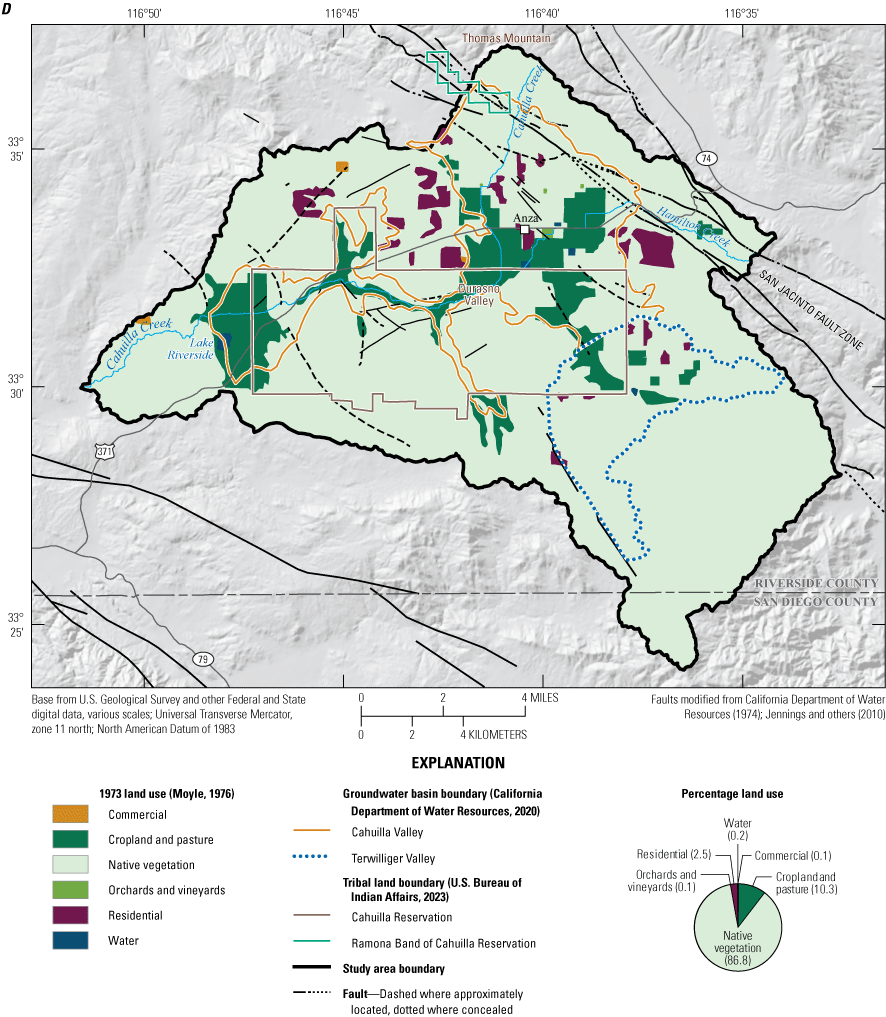

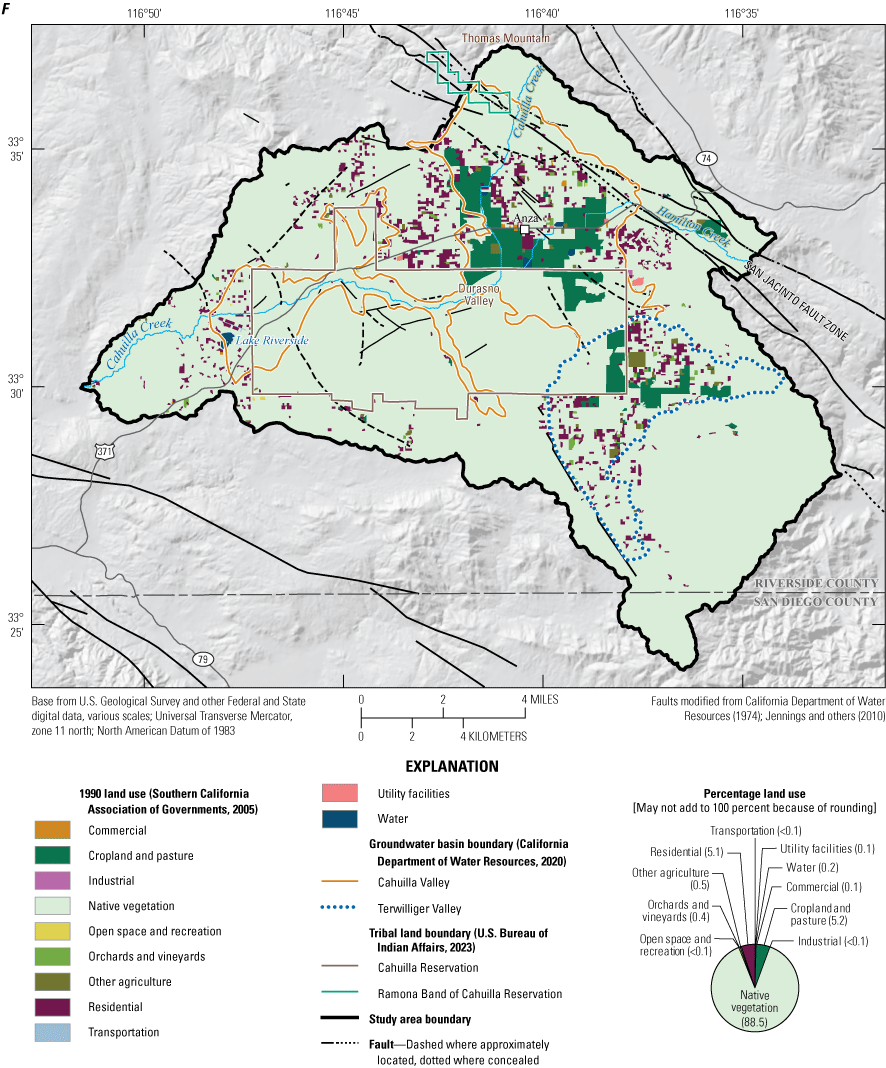
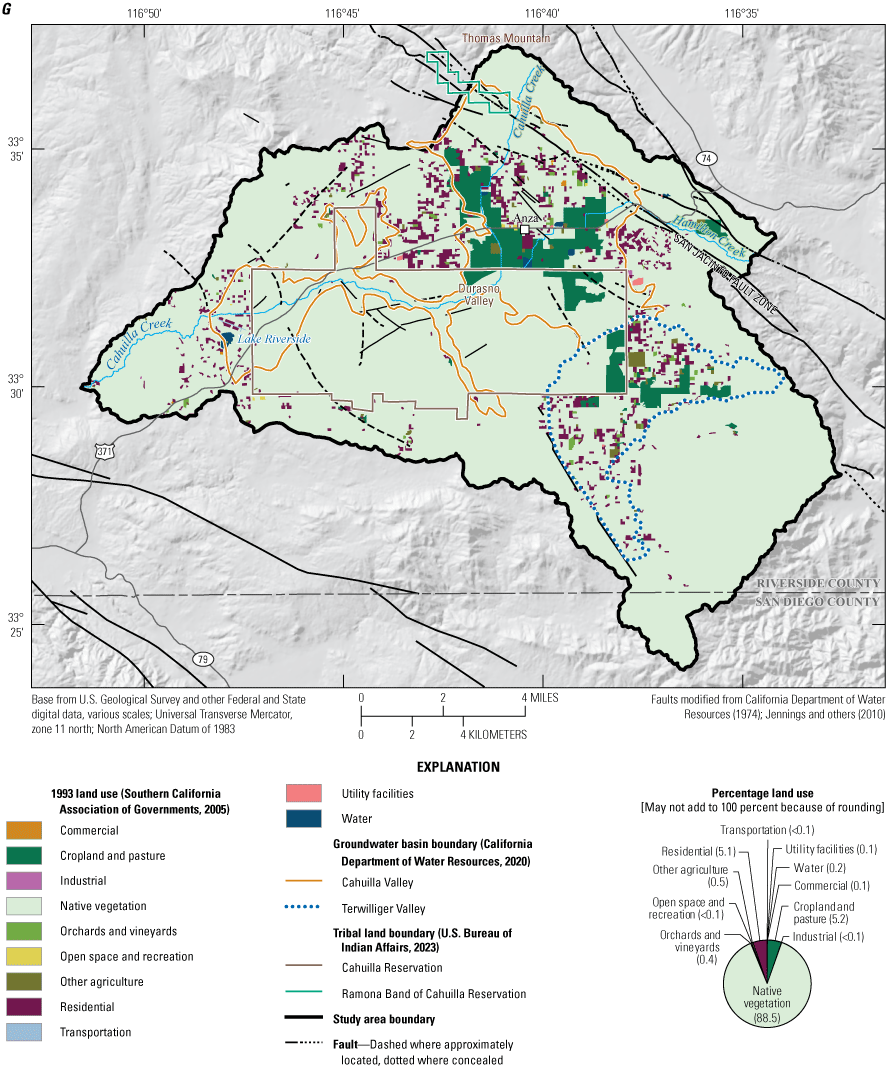
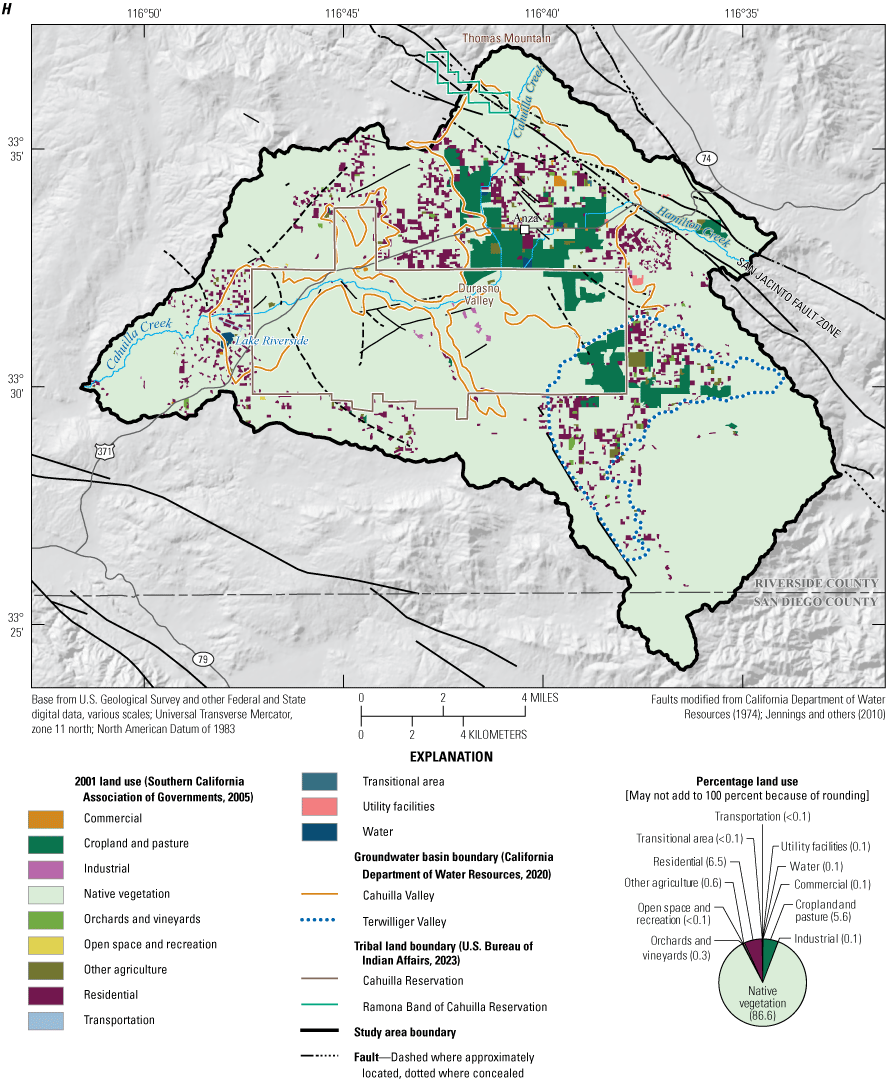

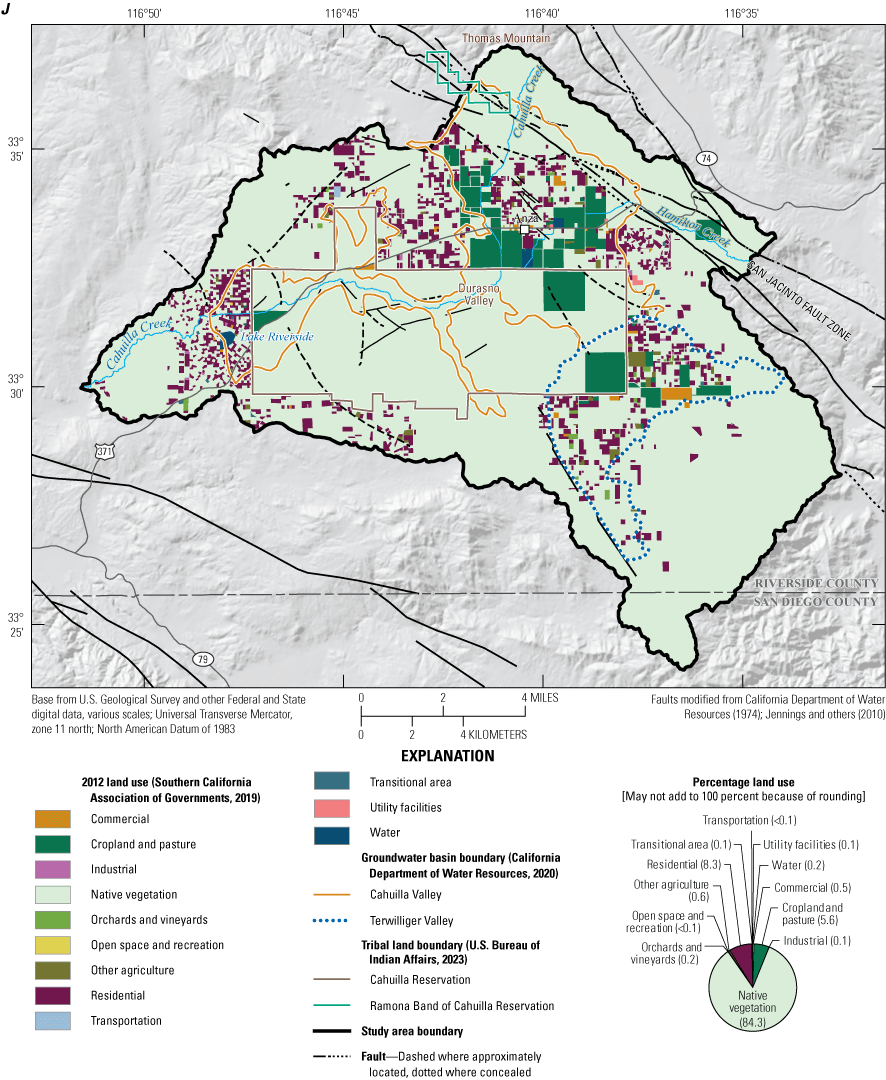
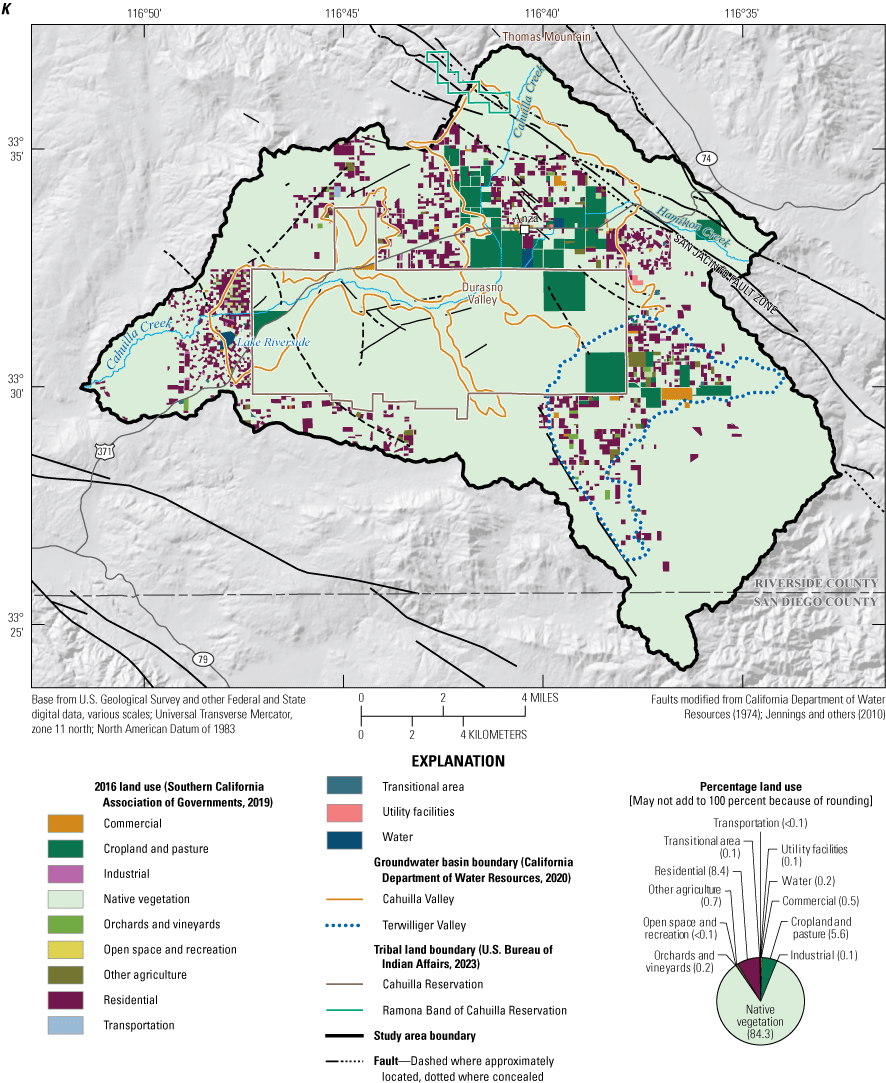
Land use in the Anza area, California, during A, 1934 (Swift and Sabourin, 2000); B, 1945 (U.S. Bureau of Reclamation, 1996); C, 1972 (U.S. Geological Survey, 1990); D, 1973 (Moyle, 1976); E, 1986 (Woolfenden and Bright, 1988); F, 1990; G, 1993; H, 2001; I, 2005 (1990, 1993, 2001, and 2005 [Southern California Association of Governments, 2005]); J, 2012; and K, 2016 (2012 and 2016 [Southern California Association of Governments, 2019]). Note that the percentage of land use depicted on figures may not add up to 100 because of rounding.
Forty land-use classes were initially categorized based on zoning, some of which were field verified in 11 datasets. Land-use classes were grouped to reduce the number to 12 representative classes (fig. 3). Data for the location of residential property do not exist, so it was assumed that residential properties are co-located with cropland. Because other land-use classes (urban, cultivated, and industrial) are loosely delineated and lumped together as a single mixed class, the confidence in the spatial extent of the classes is low.
From 1934 to 1945, most land development occurred in the northeast part of the Cahuilla Valley groundwater basin and along Cahuilla Creek. By 1972, the land-use data showed increased development (fig. 3C). In 1986, native vegetation accounted for about 91 percent of land use, whereas land with cropland and pasture uses decreased since 1973 (fig. 3E). Land-use changes in 1990 were primarily characterized by an increase in residential land use (fig. 3F); residential land accounted for about 5 percent of total land use, and native vegetation had decreased to about 88 percent. Between 1990 and 1993, land-use changes were minimal, possibly due, at least in part, to a brief economic recession between 1990 and 1991 and an extended period of drought from 1987 to 1992 (fig. 3G). The most significant long-term changes between 1934 and 2016 were in native vegetation and residential use; between 1934 and 2016, approximately 6,900 acres of land were converted to residential use, and 5,600 acres of native vegetation were converted to other uses.
Hydrogeology
Geologic, geophysical, and lithologic data were gathered to describe the hydrogeologic framework of the groundwater basins to help stakeholders get a better understanding of the extent and type of geologic sediments that compose and define the groundwater-bearing units. These data also are critical to help stakeholders understand the controls on groundwater movement. The hydrogeology of the study area was investigated by (1) examining previous studies; (2) evaluating surficial geologic mapping; (3) using geophysical methods to estimate the thickness of the alluvium and depth-to-basement in the Durasno Valley; (4) evaluating drillers’ logs that describe subsurface lithology to construct a hydrologic framework model; (5) determining sources of recharge and discharge; and (6) evaluating groundwater levels and flow.
Geologic Setting
The geology of the study area includes Paleozoic and Mesozoic basement complex rocks, unconsolidated to weakly consolidated Neogene to Quaternary sedimentary deposits, and Quaternary surficial sediments (Rogers, 1965; Dibblee and Minch, 2008). The geologic map of Rogers (1965) covers the study area, whereas the more recent and more detailed geologic map of Dibblee and Minch (2008) did not include the southern third of the study area. However, the two maps are in general agreement concerning the spatial distribution of the principal geologic units. These two geologic maps were merged and modified to provide a seamless representation of the study area’s geology (fig. 4). Descriptions of the geologic units on figure 4 and herein are primarily based on the geologic map of Dibblee and Minch (2008).
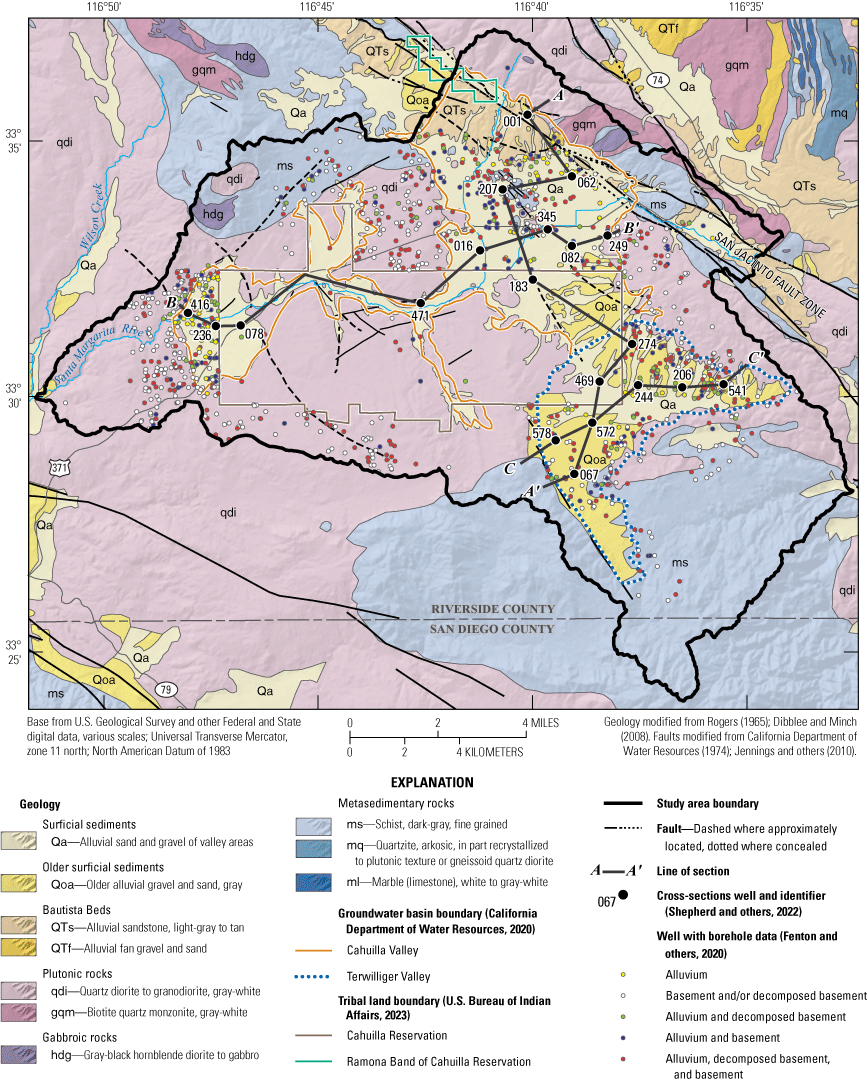
Surface geologic map and location of wells with drillers’ logs used to interpret borehole data near Anza, California. Modified from Rogers (1965) and Dibblee and Minch (2008).
The Neogene to Quaternary sedimentary deposits comprise the nonmarine, semi-lithified Pliocene to Pleistocene Bautista beds (Fraser, 1931; Dibblee and Minch, 2008). These beds, which are also called the Bautista Formation (U.S. Geological Survey and Association of American State Geologists, 2025), have an alluvial sandstone unit and an alluvial-fan gravel and sand unit (fig. 4). The Quaternary surficial sediments consist of weakly indurated Pleistocene (older, surficial sediment) and unconsolidated Holocene (younger, surficial sediment), both of which are comprised of alluvial gravels and sands (Rogers, 1965; Dibblee and Minch, 2008; fig. 4). All these materials comprise the basin-fill sediment of the Cahuilla Valley and Terwilliger Valley groundwater basins. Herein, the materials that comprise the basin-fill sediment are referred to as “alluvium.”
The surficial extents of the groundwater basins roughly coincide with the mapped extent of the alluvium (fig. 4). The alluvium is bounded to the north, west, and south by the rocks of the basement complex, which also underlie the groundwater basins; the alluvium is bounded in the northeast by the San Jacinto fault zone. Coarser-grained alluvial materials are most frequently present at higher elevations near the erosional source rock, and finer-textured materials, including fine sands, silts, and minor clays, are present in the lower elevations. Landon and others (2015) compiled lithologic information from 931 drillers’ logs to determine the areal and vertical extent of the alluvium. The lithologic descriptions of the alluvium were of variable quality, and therefore, it was not possible to reliably determine if the younger surficial sediments were present, or to readily distinguish the contact between the younger surficial sediments and the older surficial sediments, or the Bautista beds (Landon and others, 2015).
The thickness and extent of the alluvium is important to determine because these materials contain most of the groundwater in storage in the basins. Well logs compiled by Moyle (1976) showed that the thickness of the alluvium generally ranges from a few ft to about 550 ft; however, there are many places where well logs do not exist or are not available. To investigate the areal and vertical extent of the alluvium, Moyle (1976) completed a relative-gravity survey and determined that, in most places, the alluvium generally is thin and that the rocks of the basement complex are near, or very near, the surface, with the exception of four areas; these areas were confirmed by the isostatic residual gravity field and subsequent model results reported by Landon and others (2015; fig. 5). Both previous gravity studies indicated that the alluvium has an apparent thickness between 200 and more than 1,000 ft along the northeastern boundary of the Cahuilla Valley groundwater basin along the San Jacinto fault zone, and southwest of the Ramona Band of the Cahuilla Reservation. Two other areas where the alluvium is greater than 500 ft thick are the northeastern part of the Cahuilla Reservation in the Cahuilla Valley groundwater basin and the southeastern part of the Cahuilla Reservation in the Terwilliger Valley groundwater basin.
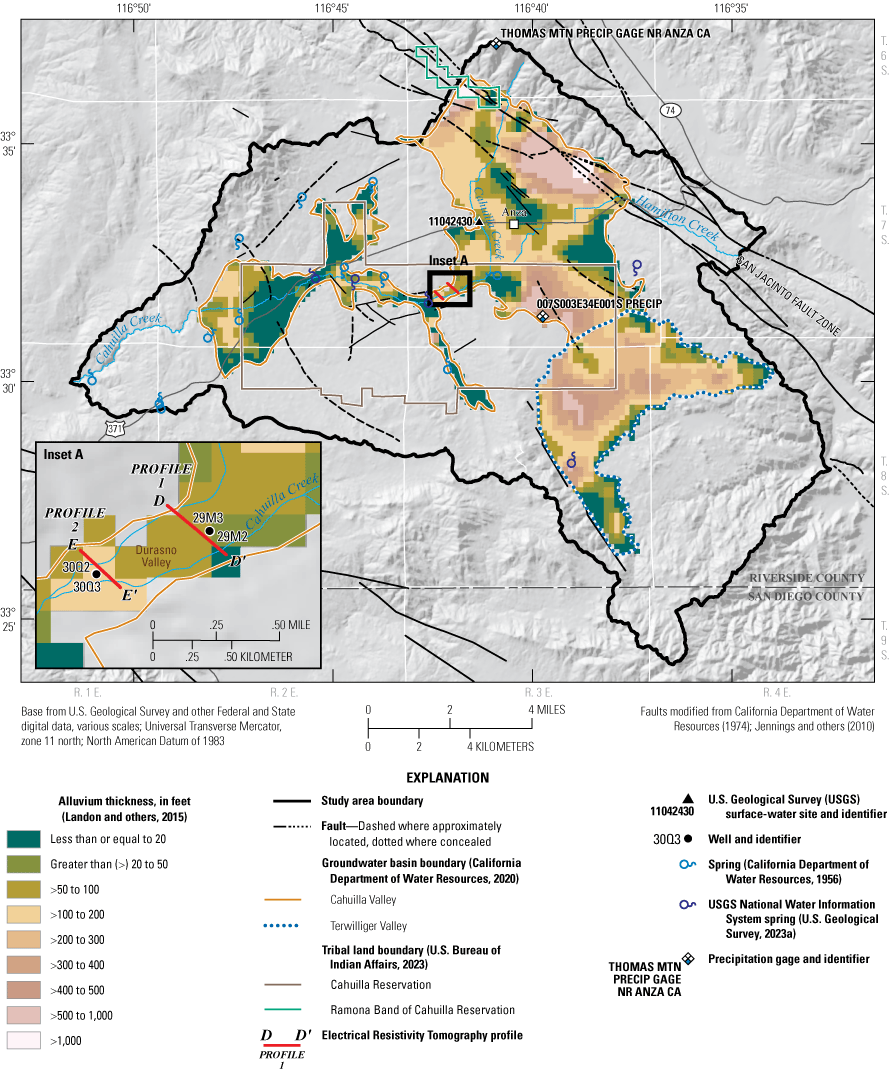
Estimated alluvium thickness near Anza, California. Modified from Landon and others (2015).
The primary rocks of the basement complex are Paleozoic and Mesozoic plutonic, gabbroic, and metasedimentary rocks. The exposed outcrops of the plutonic rocks are mainly gray-white quartz diorite to granodiorite that is massive to slightly gneissic with minor xenoliths (Dibblee and Minch, 2008). Relatively small outcrops of biotite-quartz monzonite, plutonic rocks in the northeast and northwest of the groundwater basins, are often adjacent to similarly small outcrops of gabbroic rocks, which consist of gray-black hornblende diorite to gabbro (Dibblee and Minch, 2008; fig. 4). Metasedimentary rocks are primarily fine-grained, foliated biotite schist that outcrop in the northwestern and southeastern parts of the study. The metasedimentary units can be highly foliated and, where exposed, have a greater degree of diagenesis than the crystalline basement. Small outcrops of quartzite and marble outcrop northeast of the study area.
Basement rocks are described in well-log descriptions (drillers’ logs) and in previous reports as consisting of both a competent (nonweathered) crystalline texture and a highly decomposed (weathered) or fractured texture (Moyle, 1976; Woolfenden and Bright, 1988; Landon and others, 2015; Shepherd and others, 2022). Competent and decomposed basement rock likely underlie the alluvium that comprises the groundwater basins, and it can be difficult to differentiate between the alluvium and decomposed basement rock in the lithologic descriptions in the drillers’ logs.
The decomposed basement includes chemically weathered rock, heavily fractured rock, and faulted rock where mechanical weathering from faulting breaks up the basement and may produce fault gouge. In the field, the exposed chemically weathered basement and the faulted decomposed basement were friable and easily removed from an outcrop by hand or with hand tools. Wells are common in areas mapped as basement rock (fig. 4), indicating considerable reliance on groundwater from the decomposed basement in the study area. The transition from decomposed basement to competent basement can be gradual, obscuring the boundary between them, where present.
The major Quaternary seismic structure in the study area is the San Jacinto fault zone, which forms the northeastern boundary of the Cahuilla Valley groundwater basin (fig. 4; Jennings and others, 2010; U.S. Geological Survey and California Geological Survey, 2019). The San Jacinto fault zone is part of the primary plate-boundary structure in southern California and is one of the most active strands of the San Andreas fault zone (Onderdonk and others, 2018). As mentioned in the previous section, the alluvium is thickest and the depth-to-basement is greatest adjacent to, and southwest of, the San Jacinto fault zone because the geologic units have dropped relative to those on the northeast side of the fault zone, creating a depression that has been filled by alluvium (Landon and others, 2015).
Other unnamed faults of Quaternary and unknown ages mapped by the DWR (California Department of Water Resources, 1974; Jennings and others, 2010; U.S. Geological Survey and California Geological Survey, 2019) are shown on figure 4 as approximately located or concealed. Most faults are southeast-northwest trending, following the strike of the San Jacinto fault zone. Other faults may exist within the study area that have not been mapped or that do not have surface expression, which is possible because of the unusually high seismicity in the area; many swarms of small earthquakes have occurred within the Cahuilla Valley (Sanders and Kanamori, 1984; Earthquake Track, 2024).
Groundwater-Bearing Units
The study area has two main groundwater-bearing units that yield groundwater to wells—the alluvium and the underlying competent and decomposed rocks of the basement complex. Most groundwater pumped from the Cahuilla Valley and Terwilliger Valley groundwater basins is from wells completed in the alluvium within the groundwater basins; however, many more wells have been drilled outside the boundaries of the groundwater basins into the basement complex (fig. 4). Landon and others (2015) noted that about 63 percent of the 931 well logs compiled were drilled into the bedrock/basement complex, which lies outside of the groundwater basins defined by the DWR (California Department of Water Resources, 2020). Lithologic data from other wells that are co-located but completed in the different units indicate that both the basement complex and the alluvium are important sources of groundwater supply, and in some areas, could serve as a connected aquifer system. Landon and others (2015) also found that about 25 percent of the wells compiled penetrated the full thickness of the alluvium and then continued into bedrock and that many wells’ perforations spanned the alluvial deposits and underlying competent and decomposed basement complex. A direct comparison of groundwater-level data between co-located wells completed in both groundwater-bearing units by Landon and others (2015) revealed that there was little variation in groundwater levels between wells completed in the alluvium and basement complex rocks during 1950–2013, indicating that the units are hydraulically connected.
Alluvium
The highest yielding production wells in the study area are drilled into the alluvium. Previous investigators (Moyle, 1976; Woolfenden and Bright, 1988) distinguished the younger Holocene alluvium from the older Pleistocene alluvium and Pliocene to Pleistocene Bautista beds; these units were estimated from gravity data to be more than 1,000 ft thick in some places (Landon and others, 2015). Because the younger alluvium is mainly in the stream channels and above the groundwater table, the younger alluvium, older alluvium, and Bautista beds are considered one “alluvium” unit in this report. On a side note, the Interlocutory Judgment No. 33 (Santa Margarita River Watershed Watermaster, 2024a) describes the “shallow aquifer” to include the younger and older alluvial deposits to a maximum but variable depth of about 100 ft.
Wells completed in the alluvium are generally in the eastern Cahuilla Valley groundwater basin surrounding the town of Anza and in the central part of the Terwilliger Valley groundwater basin (fig. 5) where the alluvium is relatively thick. Because the younger alluvium is unsaturated in most places, most of the groundwater is from thick sequences of saturated older alluvium (Moyle, 1976). The range of specific capacity values for wells in the alluvium was 1.5–11 gal/min/ft at pumping rates ranging from 200 to 1,100 gal/min (Moyle, 1976; Woolfenden and Bright, 1988).
Decomposed and Competent Basement
The basement sourced materials that yield water to wells are moderately to highly decomposed or fractured. Wells open to the basement materials generally have a lower specific capacity and lower production rates than wells open to the alluvium unless the bedrock is highly fractured or decomposed. However, the DWR reported that a large irrigation well drilled in 1954 produced about 1,000 gal/min, and its high yield was notable because it was drilled in “crystalline rocks” (California Department of Water Resources, 1956). Landon and others (2015) reported that fractures of “considerable depth” potentially supply water to many wells completed in bedrock and that the permeable zone of the fractured bedrock extends through the weathered, or decomposed, part of the bedrock and into competent rock. Most of the wells completed in areas mapped as basement material are north of Durasno Valley and west of Anza, but Landon and others (2015) also reported that many wells in the groundwater basins have been drilled into the underlying bedrock where the alluvium is relatively thin. The range of specific capacity values from wells completed in the basement materials was 0.1–2.4 gal/min/ft and reported pumping rates ranged from 5 to 70 gal/min (Moyle, 1976; Woolfenden and Bright, 1988).
Field Data Collection
Groundwater, precipitation, and surface-water data were collected during this study to augment existing data that have been collected from previous studies to help better understand the hydrogeology of the groundwater basins and the hydrologic changes through time. Throughout the study area, surface-water and groundwater data have been collected intermittently by the DWR (California Department of Water Resources, 1956) and by the USGS, in cooperation with the State of California (Waring, 1919), the Bureau of Indian Affairs (Moyle, 1976; Woolfenden and Bright, 1988), the High Country Conservancy and Rancho California Water District (Landon and others, 2015), and the Ramona Band of Cahuilla. These historical data, in conjunction with more recent data collected from the current USGS monitoring program, were used to help define the groundwater-bearing units of the aquifer system, to understand how pumpage has affected groundwater levels through time, to document the basin’s response to episodic recharge events (see the “Natural Recharge” section), and to support potential future work, such as regional hydrologic models.
Geophysical data collected for this study, along with data collected from two shallow monitoring-well sites, enabled an in-depth evaluation of the geometry of the Durasno Valley. The characterization of the subsurface structure at this narrow constriction in the middle of the study area provided an opportunity to examine how surface water and groundwater flow from the northeastern to the southwestern parts of the Cahuilla Valley groundwater basin (fig. 5). The two surface electrical resistivity tomography (ERT) surveys that were completed and the two monitoring sites that were installed in the Durasno Valley in 2018 are described in the “Electrical Resistivity Tomography” and “Monitoring Wells” sections.
Groundwater-Level and Precipitation Data
Groundwater data have been collected for intermittent studies in the area since about the 1950s (California Department of Water Resources, 1956; Moyle, 1976), but more regular monitoring has occurred since fall 2013 (Woolfenden and Bright, 1988; Landon and others, 2015; U.S. Geological Survey, 2021). Since summer 2017, the USGS has collected groundwater data from selected wells throughout the study area as part of an ongoing monitoring network. Discrete and continuous groundwater-level data that were collected during this study from a total of 90 wells are shown in table 2; the number of wells monitored within the network changes each year depending on well accessibility and integrity, data quality, and wells that were added to replace wells no longer suitable for monitoring. In designing the current monitoring network, wells with historical records were given priority for inclusion to assess groundwater-level changes through time. Many wells with historical groundwater data targeted for inclusion could not be accessed, owing to difficulties in accessing the wells, well failure, or other obstructions.
To understand the relation between local recharge and discharge and the effects that these stresses have on groundwater levels, pressure transducers were installed in 18 monitoring wells in the Cahuilla Valley groundwater basin near the town of Anza and within the Durasno Valley (table 2). These transducers collected data at 1-hour intervals and were placed in areas where historical pumpage has been greatest or where rapid responses from recharge events were most likely to occur.
Table 2.
Wells and precipitation sites in the U.S. Geological Survey monitoring network near Anza, California (U.S. Geological Survey, 2021).[State well numbers based on "Well-Numbering System" section at beginning of this report. Abbreviations: NAVD 88, North American Vertical Datum of 1988; NWIS, National Water Information System (U.S. Geological Survey, 2023); USGS, U.S. Geological Survey; —, no data]
Groundwater-level measurements, reported as depth to water in ft bls, were collected by the USGS using calibrated steel or electric tapes in accordance with published USGS technical procedures (Cunningham and Schalk, 2011). All groundwater-level data were quality checked and entered into the USGS National Water Information System (NWIS; see the “Accessing Data” section; U.S. Geological Survey, 2021).
Two precipitation sites were installed by the USGS so that the data collected at a higher elevation could be compared to what is received at the lower elevation of the Anza Valley (fig. 5; table 2). Site 007S003E34E001S PRECIP is a climate response atmospheric site where groundwater-level and precipitation data are measured at 15-minute intervals. Another precipitation gage (THOMAS MTN PRECIP GAGE NR ANZA CA) was installed in 2017 to establish a record of local precipitation near Thomas Mountain where data are collected every 15 minutes. The site at the higher elevation on Thomas Mountain recorded a total cumulative precipitation of more than 48 in. from November 2017 to December 2021 (fig. 6A). Precipitation at the site near the town of Anza (007S003E34E001S PRECIP) recorded a cumulative total precipitation of about 43 in. from September 2017 to December 2021 (fig. 6B), indicating that the higher elevations received about 5 in. more precipitation than the valley over this 39-month period.
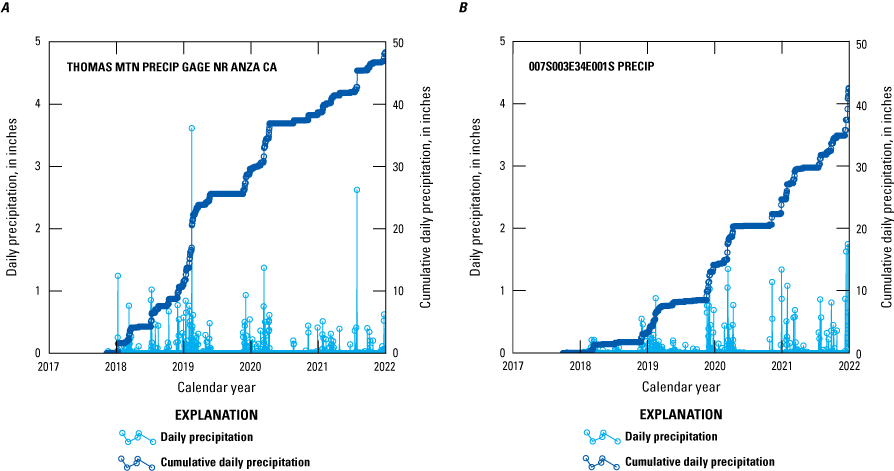
Precipitation data from the A, Thomas Mountain site (USGS 333709116405101) and B, within the Cahuilla Reservation site (USGS 333122116394002) near Anza, California (U.S. Geological Survey, 2021).
Electrical Resistivity Tomography
Previous USGS studies of the Cahuilla Valley and Terwilliger Valley groundwater basins defined the thicknesses and characteristics of the aquifer system and identified the location of wells completed in the groundwater-bearing units (Moyle, 1976; Woolfenden and Bright, 1988; Landon and others, 2015); however, the definition and connection between these units in most parts of the study area are not well understood.
Surface ERT (also known as direct-current resistivity) surveys provide a reliable method to distinguish between differing subsurface lithology types where sufficient contrast exists between the electrical properties of the deposits. These surveys can also provide valuable estimates for the cross-sectional area of the alluvium and estimates of depth-to-basement. Two ERT surveys were done about 2,150 ft apart to identify the thickness of the alluvium, its horizontal extent, and the depth-to-basement along two profiles perpendicular to Cahuilla Creek across a narrow section of Durasno Valley (fig. 5). The results from the ERT profiles were used to place four monitoring wells at two sites along these profiles in this valley and are discussed in the “Monitoring Wells” section; the lithology encountered by drilling the two monitoring sites were used to ground truth the ERT results.
Methods
In August 2018, an 8-channel SuperSting R8 resistivity/induced polarization meter (Advanced Geosciences, Inc., 2011) with a maximum of 56 electrodes was used to collect ERT data along two profiles in the Durasno Valley. In this report, the ERT profiles are numbered in downgradient order from the northeast (profile 1) to the southwest (profile 2), which is opposite of how they are numbered in the documentation by Ely and others (2020).
Along each profile, a linear array of electrodes spaced at regular intervals was placed in the ground, and several different combinations of current and potential electrode pairs were used to take apparent resistivity measurements. Stainless steel stakes, 18-in. long and approximately 0.5-in. diameter, were driven to a depth of approximately 12 in. Stakes were positioned every 23 ft along upgradient profile 1 (D–D′), which totaled about 1,590 ft in length, and every 16.4 ft along downgradient profile 2 (E–E′), which totaled about 1,120 ft in length (figs. 5, 7). The length of profile 2 was less than profile 1 because of the shorter distance to competent bedrock outcrops at each end of the downgradient profile 2.
Information about lateral variability in the subsurface is gained as different combinations of electrode transmitter/receiver pairs are translated across the array while the instrument reads from a command file. In this same manner, information about greater depths can be obtained by increasing the distance between transmitter and receiver electrodes (Minsley and others, 2010).

Inverted resistivity data (Ely and others, 2020) for A, profile 1 (D–D′) and B, profile 2 (E–E′), near Anza, California. Location of section shown on figure 5.
The transmitted currents are automatically controlled by the resistivity meter depending on the change in voltage between electrodes, which is controlled by the resistivity of the subsurface lithologic units. For profile 1, transmitted currents were between 6 milliamps (mA) and 1,080 mA, with an average current of 611 mA and a standard deviation of 213 mA. Transmitted currents for profile 2 were between 37 mA and 1,159 mA, with an average current of 783 mA and a standard deviation of 195 mA. An inverse Schlumberger array was used for its measurement efficiency and good contrast between lateral and vertical resolution (Minsley and others, 2010). Although the spacing of the electrodes differed slightly between the two profiles, these data were collected using the same array type and inverted using the same methods for interpretation, so the results are comparable. Details about the practical aspects of resistivity surveying techniques can be found in various references (Telford and others, 1990; Binley and Kemna, 2005; Day-Lewis and others, 2008; Milsom and Eriksen, 2011).
The resistivity data acquired were processed using the smooth, finite-element inversion method in EarthImager 2D software version 2.4.0, build 617 (Advanced Geosciences, Inc., 2011). The smooth-inversion method finds the smoothest possible model that fits the data to an a priori chi-squared statistic and assumes a Gaussian distribution of data errors. Images of the apparent resistivity data collected are shown in pseudosections, which are a conventional way to present the data but do not represent the true spatial distribution of resistivity values within the earth (Minsley and others, 2010). The pseudosections for the two profiles in Durasno Valley were used as starting models and are documented in Ely and others (2020). Surface topography was incorporated into the inversion to accurately account for electrode geometry and the effect of the irregular earth surface on the distribution of subsurface electric currents. Spatial data for all profiles were collected with the Trimble Geo7x differential global positioning system developed by Trimble, Inc., Sunnyvale, California. The data were corrected using a University NAVSTAR Consortium geodetic correction (UNAVCO Community, 2005). The inversion was allowed to run a maximum of eight iterations with a stop criterion of 5 percent or less root-mean-square error between the measured and modeled resistivity. If stop criteria were not met, the lowest quality data were considered outliers and removed using a percentage data misfit threshold, chosen to minimize data noise while retaining the maximum amount of data. The inversion was then repeated with the noisiest data removed. For a detailed discussion of the resistivity inverse problem, see Oldenburg and Li (1994) and Binley and Kemna (2005).
Results
The interpretation of the two inverted resistivity profiles showed increasing resistivity with depth and mostly horizontally layered lithology (fig. 7). The resistivity of the alluvium was generally between 10 and 75 ohm-meters (ohm-m), represented by the blue and green colors on the profiles. Resistivity of the basement was generally greater than 100 ohm-m and is represented by the orange and red colors on the profiles. The yellow color represents the likely transitional boundary between the alluvium and the decomposed basement. This transitional boundary, which likely represents a zone of decomposed basement, was thinner and shallower along profile 1 (upgradient profile D–D′) than along profile 2 (downgradient profile E–E′); the boundary at profile 2 was deeper and less well defined, indicated by the diffuse colors representing the resistivity values. The depth-to-basement was shallowest in the middle of profile 1, where it was about 70 ft bls, and was greatest in the middle of profile 2, where it was deeper than 140 ft bls. These depth estimates show that the alluvium is shallower and thinner along the upgradient profile where Cahuilla Creek exits the upper part of the Cahuilla Valley groundwater basin and enters Durasno Valley. Based on the approximate area of lower resistivity (represented by the blue and green colors) on the profiles on figure 7, the cross-sectional area of the alluvium is estimated to be about 67,000 square feet (ft2) at profile 1. Only a minimum cross-sectional area of the alluvium of about 62,500 ft2 can be estimated at the downgradient site because the basement unit was not encountered during drilling, and it could not be clearly defined by the ERT data at profile 2.
Monitoring Wells
As part of this study, the USGS installed four shallow monitoring wells along Cahuilla Creek in 2018 (figs. 5, 8) using the auger drilling methods described by Shuter and Teasdale (1989). Two wells were installed at each site to better understand the subsurface structure and the vertical and horizontal groundwater gradients in the eastern part of the Durasno Valley. The placement and depth of the monitoring wells were designed to coincide with the location of the ERT profiles. In this narrowest part of the Cahuilla Valley groundwater basin, where it is only about 1,500 ft wide, the volume of groundwater that flows from the Upper Cahuilla Valley through the Durasno Valley and into the lower part of Cahuilla Valley has not been evaluated previously.
As part of the drilling and construction of the four monitoring wells, downhole geophysical logs were collected to evaluate the subsurface lithology and to verify the ERT results (Ely and others, 2020; U.S. Geological Survey, 2023). Downhole geophysical logs, a generalized summary of the lithology encountered during the drilling, and the well construction information for the four wells are shown on figure 8. Wells 7S/3E-29M2 and -29M3, which are about 10 ft apart, are in the northeastern part of the Durasno Valley near the upgradient ERT profile 1 (figs. 5, 8B). Wells 7S/3E-30Q2 and -30Q3 are about 15 ft apart near ERT profile 2 (fig. 8A), about 2,150 ft downgradient to the southwest. The land-surface elevation at profile 2 is about 40 ft lower than at profile 1.
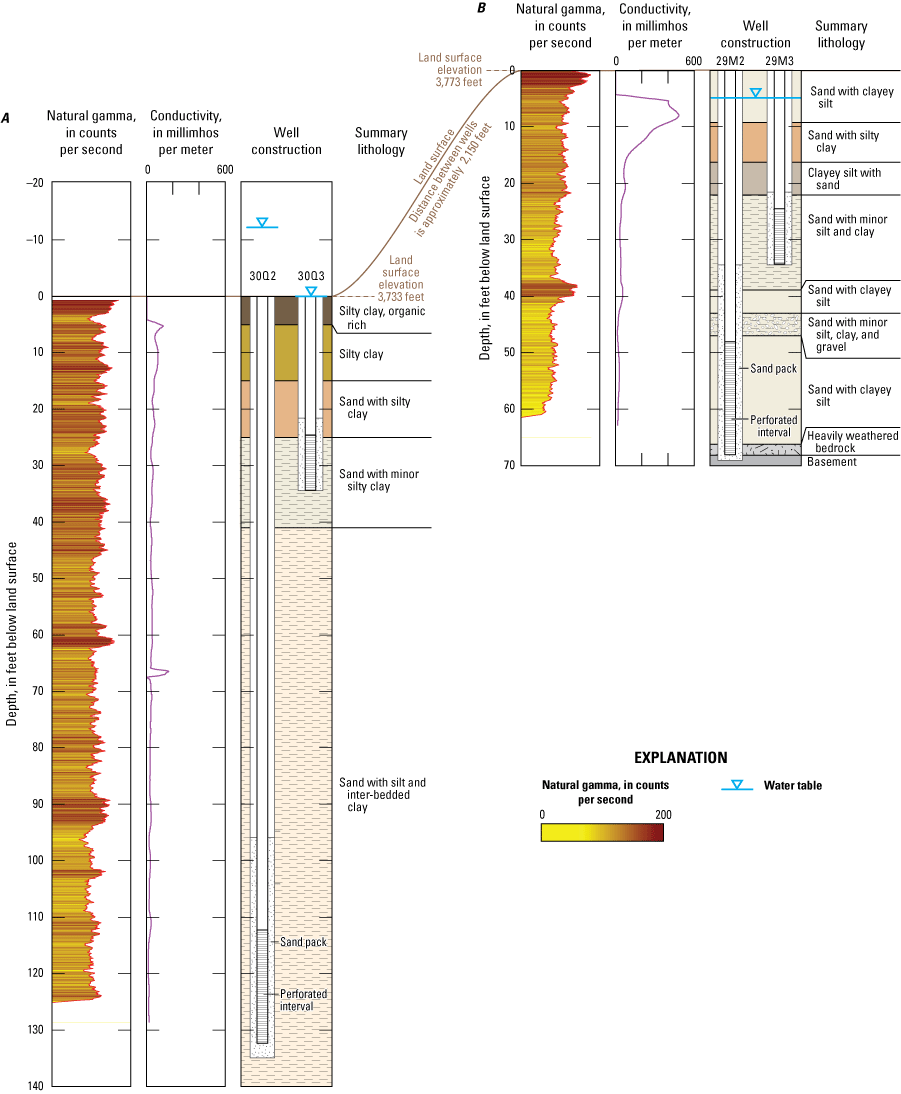
Well construction information, subsurface lithology, geophysical logs, and groundwater-level data from April 2019 at monitoring sites A, 7S/3E-30Q2 and -30Q3; and B, 7S/3E-29M2 and -29M3 near Anza, California (U.S. Geological Survey, 2021, 2023).
The lithology encountered during drilling at these sites was primarily sand and silts with interbedded clays. Determining the exact depths where the alluvium was present was difficult because the auger method can smear the materials when they are brought to the surface for examination. In these situations, the geophysical logs can help determine where predominantly finer-grained sediments—particularly clays—are present. At the upgradient site (wells 7S/3E-29M2 and -29M3; fig. 8B), the geophysical logs indicated that fine-grained sediments were present at about 39 ft bls. Heavily weathered bedrock was encountered at about 68 ft bls, and the auger was not able to penetrate any deeper. Basement (competent or decomposed) was not encountered in the downgradient site (wells 7S/3E-30Q2 and -30Q3; fig. 8A), but the ERT results indicate that the deeper well stopped at a transitional boundary that may have contained some basement rocks of unknown weathering or content, but this could not be definitively determined from the lithology.
Groundwater-level data from April 2019 from the wells at both sites showed that the hydraulic heads in the upgradient wells near profile 1 were about 6 ft bls, but the hydraulic heads were very different at the downgradient wells near profile 2 where artesian (flowing) conditions were initially observed in both wells. At the downgradient site, the initial hydraulic head in the deeper well 7S/3E-30Q2 was about 12 ft above land surface and had a higher hydraulic head than the shallower well 7S/3E-30Q3, where groundwater was only slightly above land surface (fig. 8A). Continued groundwater-level monitoring of these sites indicates that artesian conditions have been present in the deep well 7(S/3E-30Q2) since it was installed and that groundwater flows from the well at about 1 gal/min when the well cap is removed. The movement and character of groundwater flow in this valley is discussed further in the “Groundwater Flow, Levels, and Movement” section.
Geologic Framework Model
A digital three-dimensional geologic framework model (GFM; Shepherd and others, 2022) was constructed to represent the subsurface geometry of the alluvium, decomposed basement, and competent basement within the study area. This digital model provides a fundamental framework for subsequent studies in the basin. This section describes the compilation of well-log data used for subsurface geologic interpretations, the construction of the GFM using well-log data and other subsurface information, and the results from the GFM.
Well Logs
Lithology information from drillers’ log descriptions from about 1,185 well logs (fig. 4; Landon and others, 2015; Fenton and others, 2020) provided information on the subsurface geometry of the alluvium, decomposed basement, and competent basement, and the variability of major lithologic textures within the alluvium. Most well logs were obtained from the DWR Well Completion Report database (California Department of Water Resources, 2022). Some well logs that were not available in the DWR Well Completion Report database were available from hardcopy or digital files of the USGS San Diego Projects office files; these logs were primarily from private water wells drilled more than 50 years ago or on Native American land. Well-test information was also compiled from the well logs where available (Fenton and others, 2020). Summary descriptions of well construction, location (including source and accuracy), regularized lithology information, and well-test data were published by Fenton and others (2020) and Shepherd and others (2022).
Drillers’ log descriptions were of variable quality and had a range of detail in the lithologic information (Landon and others, 2015; Fenton and others, 2020; Shepherd and others, 2022). The logs varied in terms of the quantity and thickness of described subsurface lithologic intervals, the detail of the descriptions, and the terminology used to describe sediment types and textures. Quality assurance analysis of the well logs and lithologic descriptions verified the physical location of each well and evaluated the suitability of the lithologic descriptions for understanding the distribution of different lithology types across the study area. Some well logs were removed from consideration because their reported well locations could not be verified or were inconsistent with nearby wells, and some well logs were removed because they had ambiguous or imprecise lithologic descriptions. A final set of 579 well logs and lithologic descriptions was compiled by Shepherd and others (2022) from existing well-log data (Fenton and others, 2020) for use in developing the GFM and lithologic characterization.
The drillers’ log descriptions were classified into 54 regularized categories using an approach similar to Faunt (2009) and Landon and others (2015). These regularized lithology categories were used to help interpret the depth and thickness of geologic units in the GFM (Shepherd and others, 2022). The regularized lithology classes were further simplified into three generalized texture categories that loosely correspond to grain size: (1) coarse gravel, cobbles, boulders, and crystalline rock types; (2) medium sand, sandstone, and decomposed material; and (3) fine clay, silt, mud, and soil. These three textural groups were used to map the distribution of lithology in the alluvium and to show the vertical and spatial distribution of textures in the alluvium along selected sections (see the “Framework Model Construction” section).
Framework Model Construction
The GFM was constructed from geologic maps (Rogers, 1965; Dibblee and Minch, 2008), well-log lithologic descriptions (Shepherd and others, 2022), estimated productivity of wells (reported as specific capacity data; Shepherd and others, 2022), and gravity-derived depth-to-basement estimates (Landon and others, 2015). Three geologic units were modeled in the GFM: (1) alluvium, (2) decomposed basement, and (3) competent basement. The alluvium unit is primarily within the Cahuilla Valley and Terwilliger Valley groundwater basins (fig. 4). In the GFM, the alluvium unit was assumed to be present everywhere that it was mapped at land surface and was assumed to fill the subsurface volume between the top of the decomposed basement unit and land surface. The decomposed basement unit is comprised of plutonic or metasedimentary rocks (fig. 4) that have been physically or chemically weathered in situ. Although there may be some areas where basement occurs without the presence of overlying decomposed basement, most well-log lithology descriptions (Shepherd and others, 2022) and field observations indicated that decomposed basement was present in most areas across the study area. Therefore, in the GFM, a relatively thin zone of decomposed basement is assumed to overlie basement everywhere that the competent basement unit is present. The competent basement unit is comprised of plutonic or metasedimentary rocks that have not been physically or chemically weathered. Competent basement rocks are mapped in outcrop and are assumed to underlie the alluvium and decomposed basement. In the GFM, the competent basement unit is assumed to be present throughout the study area.
Surface contacts of the geologic units were determined using geologic map information (fig. 4). Subsurface contacts of the three geologic units were determined using well-log lithology descriptions (Shepherd and others, 2022), gravity-derived depth-to-basement estimates (Landon and others, 2015), and estimated well productivity data (Shepherd and others, 2022). Varying quality and detail of well-log lithology descriptions sometimes made subsurface geologic unit interpretations from lithology descriptions difficult to ascertain. Therefore, the gravity-derived depth-to-basement estimates and estimated well productivity data were used as supporting information for interpreting geologic unit contacts for each well log.
Gravity-derived depth-to-basement estimates corresponded to well-log lithology descriptions of either the decomposed or competent basement in different parts of the study area. Estimates of depth-to-basement from the gravity data corresponded to decomposed basement in most well logs in the Cahuilla Valley groundwater basin, but corresponded to the competent basement in the Terwilliger Valley groundwater basin. Estimated productivity of wells, represented by specific capacity values, was used to help distinguish between the three geologic units. Specific capacity is defined as pumping rate divided by drawdown (unit volume per unit time per unit length; Freeze and Cherry, 1979), and is expressed as gal/min/ft. Following Woolfenden and Bright (1988), specific capacity values greater than 2.4 gal/min/ft were assumed to indicate wells perforated in alluvium, and wells with specific capacity values less than or equal to 2.4 gal/min/ft were generally assumed to be perforated in decomposed or competent basement.
The location and type of data used to interpret geologic unit contacts are shown on figure 9. The top of the alluvium unit was interpreted solely from land surface elevation; however, there were wells that encountered the alluvium (fig. 9A), which were used to map the distribution of textures throughout the alluvium with a method described below. Subsurface data for the top of the decomposed basement unit were from well-log lithology data, gravity-derived depth-to-basement estimates, and synthetic control points. Synthetic control points were used to enforce unit geometry and thickness in the absence of appropriate well-log or depth-to-basement data. Subsurface data for the top of the competent basement unit were from well-log lithology data and gravity-derived depth-to-basement estimates.

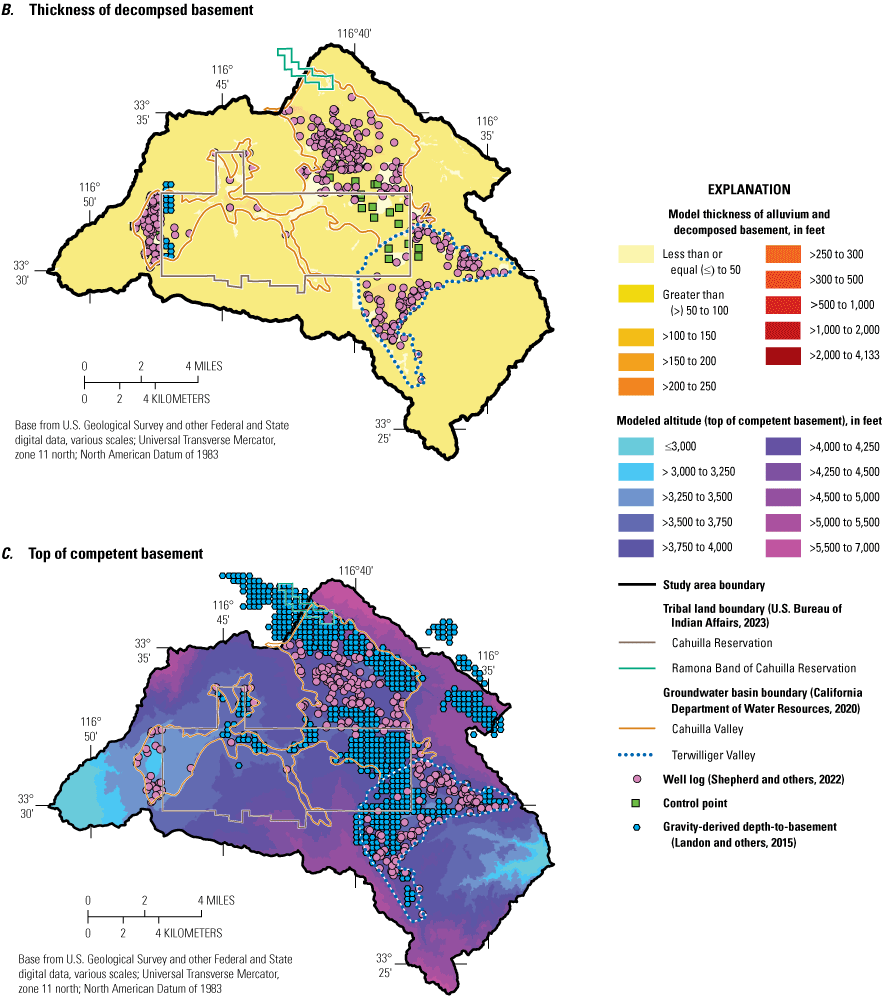
Thickness of A, the alluvium; B, decomposed basement; and C, the elevation of the top of the competent basement from the geologic framework model (Shepherd and others, 2022) near Anza, California.
Interpreted geologic unit contacts were used as input data to construct the GFM. Input data for each geologic unit were initially gridded for EarthVision (version 11.0), a three-dimensional geologic-modeling software package that uses a biharmonic cubic-spline interpolation algorithm to produce minimum-tension (minimum-curvature) grids from x, y, z point data (Dynamic Graphics, Inc., 2021). The input data were interpolated to create a grid for the top surface of each unit. The horizontal discretization of the grids was 160 ft in the x (east-west) and y (north-south) directions.
The initial geologic unit grids were exported from EarthVision to a geographic information system (GIS) software (Esri ArcGIS version 10.7.1) and were manually adjusted to ensure that the units’ top grids were consistent with basic geologic principles and the geologic understanding of the Cahuilla Valley and Terwilliger Valley groundwater basins. The units’ top grids were clipped to land surface using a discretized digital elevation model (DEM) grid based on the National Elevation Dataset 10-meter DEM (U.S. Geological Survey, 2019). A minimum thickness of 10 ft was assigned to the alluvium wherever it was interpreted to be present. This value is typically the smallest interval of reported lithologic data from well logs. A minimum thickness of 20 ft was assigned to the decomposed basement within the Cahuilla Valley and Terwilliger Valley groundwater basins wherever the alluvium was present at land surface; this value was chosen because it was generally the smallest thickness of decomposed basement identified in well logs. In areas where plutonic and metasedimentary rocks were mapped at land surface, and in all areas outside of the Cahuilla Valley and Terwilliger Valley groundwater basins (fig. 4), the decomposed basement thickness was set to 75 ft. This value was the mean thickness of decomposed basement from the well-log data (for reference, the median thickness of decomposed basement was 68.5 ft with a standard deviation of 49.9 ft).
Lithology data (Shepherd and others, 2022) from well logs shown on figure 9A were interpolated within the alluvium to evaluate the spatial and vertical distribution of lithologic texture classes within that unit. Lithologic data from well logs were characterized into three generalized textural groups (coarse, medium, and fine; see the “Well Logs” section) and interpolated across the alluvium using Rockworks three-dimensional geologic-modeling software (version 20; RockWare, 2021). The interpolation used a lateral blending algorithm that extends lithologic data from a given well and randomizes lithologic correlations within the middle one-third space between adjacent wells (RockWare, 2021). The resulting lithologic interpolation is a solid voxel model of the three generalized texture classes within the alluvium. The lithologic interpolation is continuous between wells in areas with many well logs but is absent in areas with few or no well logs (fig. 10).
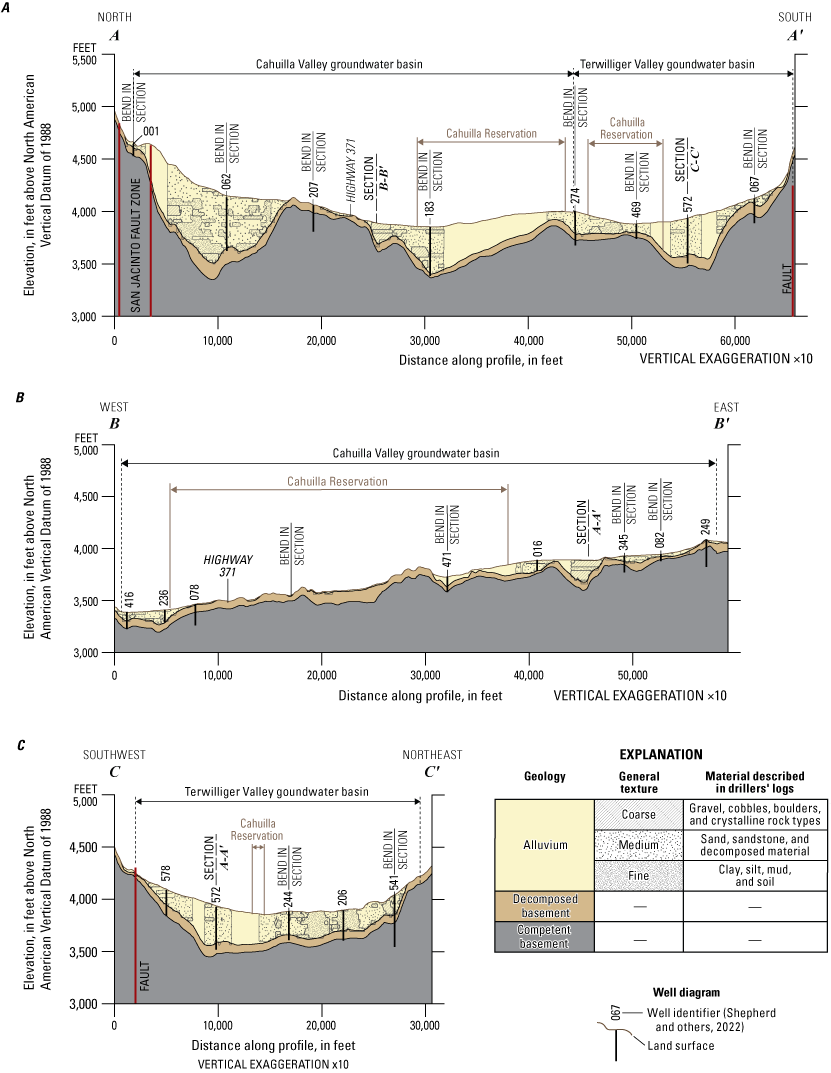
Sections A, north to south through the Cahuilla Valley groundwater basin; B, west to east through the Cahuilla Valley groundwater basin; and C, southwest to northeast through the Terwilliger Valley groundwater basin from the geologic framework model (Shepherd and others, 2022) near Anza, California. Section lines shown in figures 4 and 9A.
Framework Model Results
The GFM provides an improved high-resolution understanding of the hydrogeology in the Cahuilla Valley and Terwilliger Valley groundwater basins. The resulting thickness and extent of the alluvium and decomposed basement, the variability of lithology and grain size within the alluvium, and the structural geometry of the competent basement are discussed in this section. Maps of the modeled thicknesses of the alluvium and decomposed basement and the modeled elevation of the top of the competent basement are shown on figure 9. Sections through the GFM show the geometric relation of the modeled units and vertical faults, along with the depth of selected wells (fig. 10). Additionally, the sections show the interpolated lithologic texture distribution within the alluvium.
The alluvium is present throughout much of the Cahuilla Valley and Terwilliger Valley groundwater basins and overlies the decomposed basement. The average thickness of the alluvium is about 140 ft (fig. 10A); this unit is thickest in the Cahuilla Valley and the central part of the Terwilliger Valley groundwater basins, where it is estimated to exceed 450 ft thick, and in the northeastern part of the Cahuilla Valley groundwater basin along the San Jacinto fault zone, where it is estimated to exceed 4,000 ft thick. Estimates of thick alluvium are in areas with limited borehole data and in areas where the tops of the decomposed basement and competent basement are estimated to be relatively deep.
The decomposed basement unit is present throughout the study area and underlies the alluvium where alluvium is present; it overlies the competent basement unit everywhere. Decomposed basement is modeled to outcrop everywhere at land surface except where it is overlain by alluvium. Within the groundwater basins, the minimum thickness of the decomposed basement is 20 ft, the maximum thickness is about 230 ft, and the average thickness is about 71 ft (fig. 10B).
The competent basement forms the hydraulic base of the study area, underlying the decomposed basement and alluvium (fig. 10C). The elevation of the top of the competent basement follows the general topographic trend of land surface in the study area, whereby the unit is at the highest elevations at the northeastern and southern margins of the study area (elevations greater than 6,700 ft), and at the lowest elevations at the western margin of the study area (elevations less than 3,000 ft). The competent basement forms topographic highs at the boundaries of the Terwilliger Valley and Cahuilla Valley groundwater basins (figs. 9C, 10A). Within the groundwater basins, competent basement forms topographic lows, providing depocenters in which alluvium has accumulated. The most substantial topographic low is in the northern part of the Cahuilla Valley groundwater basin along the southwestern side of the San Jacinto fault zone; there, the top of the competent basement varies more than 6,500 ft between its lowest point in the groundwater basin and its highest point near Thomas Mountain (fig. 10C).
Lithology texture data form the geologic basis for estimating the hydraulic properties that are used in numerical groundwater-flow models (Faunt and others, 2010; Alzraiee and others, 2022). The alluvium is comprised mainly of medium-grained lithologic textures (fig. 10) in most places; the percentage of fine-grained textures is greater in parts of the Terwilliger Valley groundwater basin (figs. 10A, 10C). Coarse-grained textures are present in the alluvium throughout the study area, although typically in small pockets.
Sources of Recharge
The sources of natural recharge within the study area include surface-water infiltration from precipitation and runoff that mostly originates in the surrounding mountains and hills. Hamilton Creek and Cahuilla Creek (fig. 5) and the many small unnamed creeks in the study area are ephemeral; no streams from adjacent surface-water basins drain into the study area. When streamflow is present, surface water drains from the basin to the southwest through Cahuilla Creek and to the southeast through Coyote Creek. In addition, there is potential for recharge from septic effluent from domestic septic systems and irrigation return, which is infiltrated water applied to agricultural fields that is not used by plants or lost through evaporation, and reaches the groundwater table.
Natural Recharge
The primary sources of natural recharge to the study area are from the infiltration of runoff from the surrounding higher elevations of the San Jacinto Mountains to the northeast and from southeast of the Terwilliger Valley. Recharge also occurs, though in lesser quantities, as surface water from precipitation that is not captured and used by plants (evapotranspiration [ET]). When present, this precipitation can infiltrate the ground surface along the many small ephemeral creeks and washes into the alluvium in the valleys or into the fractures and weathered zones of the basement rocks in upland areas. Recharge and runoff do not occur in the same amounts every year; when very wet years occur, most of the water becomes runoff, and a lesser component becomes recharge. Both recharge and runoff are controlled by the variable cycles of wet and dry weather and are temporally variable across the region (Stern and others, 2021). In addition to being temporally variable, recharge and runoff are spatially variable across the region; recharge frequently occurs outside of the groundwater basins and rarely over the groundwater basins’ footprint (Flint and Flint, 2007). Because natural recharge is related to the variable cycles of precipitation, estimates are difficult to quantify without hydrologic models; however, the previous estimate of recharge by Moyle (1976) and those done as part of this study (Stern and others, 2021) are presented in table 3.
Table 3.
Estimates of recharge near Anza, California.| Time period |
Estimated average recharge rate (acre-feet/year) |
Source |
|---|---|---|
| 1897–1947 | 3,800 | Moyle (1976) |
| 1896–2018 | 4,900 | Stern and others (2021)1 |
| 1971–2000 | 5,900 | Stern and others (2021)1 |
| 1981–2010 | 4,400 | Stern and others (2021)1 |
Study area was larger than Moyle (1976).
Moyle (1976) estimated the amount of groundwater recharge based on annual precipitation records for the 50-year period from 1897 to 1947 and assumed that 95 percent of precipitation was used by native vegetation or lost through flood flow in stream channels. The precipitation from that period ranged between 5.21 in. (in 1956) and 22.38 in. (in 1943), and the average annual precipitation ranged from 16 to 30 in. Based on these averages, Moyle estimated that the average annual groundwater recharge was about 3,800 acre-feet/year (acre-ft/year).
In arid basins where surface-water data are lacking, the potential in-place recharge and potential runoff into the groundwater system can be estimated using the regional-scale Basin Characterization Model for California (CA-BCM; Flint and others, 2013). The CA-BCM applies a monthly regional water-balance model to simulate hydrologic responses to climate and estimate basin recharge and runoff. The CA-BCM has been used in other desert basins where surface-water data are sparse or nonexistent (Flint and Martin, 2012; Faunt and others, 2015). For the Anza area, stream-flow data from nearby and similar basins, snowpack and the timing of snowmelt, temperature, types of vegetation, and precipitation in the San Jacinto Mountains were used to estimate the average annual potential runoff and recharge. The area that was locally calibrated and validated by Stern and others (2021) was slightly larger than the footprint from Moyle (1976) and encompassed streams and creeks to characterize the water-budget components, including recharge, runoff, stream flow, actual ET, and climatic water deficit. Although some portion of the estimated runoff becomes recharge, the CA-BCM currently does not route water to the groundwater system, and runoff in the CA-BCM is routed only through stream channels; therefore, the amount of runoff that potentially becomes recharge could not be estimated.
Recharge and runoff have extreme interannual variability in arid regions, including the study area; the occurrence of recharge and runoff can be sporadic, so the long-term average value for recharge is not a reliable estimate for a particular year in this region (Stern and others, 2021). For years when precipitation is less than about 8–12 in., the CA-BCM estimated that recharge was negligible, so it is important to note that the estimates in table 3 represent long-term averages, including years when recharge values were zero. The relation of recharge to precipitation is exponential in arid and semi-arid regions and often requires the exceedance of a precipitation threshold to produce substantial recharge or runoff (Stern and others, 2021). This relation is noted because in drier years, the ratio of recharge to runoff is higher, and recharge per unit area can be equal to, or higher than, runoff in some areas. For this area, the CA-BCM estimates for recharge and runoff were highly variable and highly dependent upon which years were used.
The variability of recharge and runoff is best illustrated when comparing estimates from different periods. For example, during water years 1896–2018, average monthly recharge ranged from 0 to 11,000 acre-ft (a water year is the period from October 1 to September 30 and is designated by the year in which it ends; for example, water year 2021 was from October 1, 2020, to September 30, 2021). During that period, the average recharge was lower than the average runoff and was estimated to be about 4,900 acre-ft/year (Stern and others, 2021; table 3). During 1981–2010, when dry years occurred more frequently than wet years, the average annual runoff remained about the same, but recharge was estimated to be about 4,400 acre-ft/year. For 1971–2000, which included the highest peak flow on record in 1980, the long-term average recharge was estimated to be about 5,900 acre-ft/year. These examples demonstrate that applying one average annual value of recharge and runoff to this region is not a reliable estimate for any specific year because of the extreme interannual climatic and spatial variability.
Anthropogenic Recharge
The town of Anza (fig. 5) and the surrounding community are unincorporated rural areas and therefore rely on private septic disposal systems to dispose of wastewater. The infiltration of water from this source is difficult to quantify, and the volume that reaches the groundwater table likely is small; however, a rough estimate of the potential recharge from private domestic septic systems can be made using an assumed volume of effluent discharged to septic systems and the reported population. Umari and others (1995) used an average septic tank effluent of 70 gallons per day (gal/d) per person to estimate the quantity of septic wastewater that mixed with the underlying groundwater in Victorville, a desert community about 100 mi to the northwest that relies solely on groundwater. Using the 2020 population estimates for the study area of about 6,480 residents (Esri Data Development, 2023), the amount of potential recharge from septic effluent may have been as much as 500 acre-ft.
Irrigation return is groundwater that has been pumped locally to irrigate agricultural fields but is not consumed by the crops and subsequently infiltrates the groundwater system. The amount of water that is lost through plant use and evaporation and does not return to the groundwater table is considered consumptive use. Estimates of recharge based on crop type, crop efficiencies, and irrigation requirements can be made with accurate estimates of pumpage, percentage of irrigated land, reference ET, and crop coefficients. Estimates of irrigation-return volumes are complicated by many factors, including evaporation and potential significant lag times in arid environments, and are best estimated by hydrologic models that account for variable irrigation efficiencies, soil moisture, the thickness of the unsaturated zone, and complicated crop-irrigation practices and rotation. Stamos and others (2001) estimated irrigation-return flow in the upper part of the Mojave Desert that ranged between 29 and 46 percent of pumpage; however, modern farming methods have increased the efficiency of irrigation, resulting in decreased irrigation-return rates over time.
Mechanisms of Discharge
Natural groundwater discharge occurs as ET by vegetation, evaporation from open water bodies, where groundwater is at or near land surface and potentially as underflow where groundwater exits the basins to the west and southeast. Because there is no lithologic or hydrologic boundary separating the Cahuilla Valley and Terwilliger Valley groundwater basins, underflow between them likely occurs, but there are insufficient data to substantiate the direction of underflow at any given time, which is discussed in the “Groundwater Flow, Levels, and Movement” section.
In 1953, groundwater discharge from 12 natural springs was reported (California Department of Water Resources, 1956; fig. 5), but field reconnaissance efforts in 2020 did not observe any evidence of groundwater discharge at the reported sites that were accessible. The main source of groundwater discharge is by pumping (extraction) for agricultural, domestic, and municipal uses.
Evapotranspiration and Evaporation
Evapotranspiration is the process that removes soil water or groundwater from the subsurface through plant transpiration or direct evaporation. To calibrate the CA-BCM model for estimating recharge (see the “Sources of Recharge” section), Stern and others (2021) used estimates of actual ET from remote sensing and water-balance data for January 2000–December 2013 at 1-kilometer resolution. Estimates of actual ET for four native vegetation types from that study varied greatly and ranged from less than 0.5 in., about 10 millimeters, to about 4 in., or 110 millimeters.
Estimates of potential evapotranspiration (PET), which is the amount of water that would be evapotranspired from an unlimited water supply, were used for this study to determine the maximum amount of water lost through plants. Often, PET is derived using the value for crop coefficient (Kc), a unitless number that represents a crop’s maximum potential water use that varies by plant type, phenology, soil moisture, and crop distribution, multiplied by reference ET (Eto). Defined as the amount of water evapotranspired from well-watered grass of a uniform height, Eto varies based on regional climate patterns (Allen and others, 1998). The California Irrigation Management Information System (CIMIS; California Department of Water Resources, 2012) divides California into zones based on long-term monthly average Eto using data from CIMIS weather stations. Based on the CIMIS weather station data, an Eto of 62.5 inches per year (in/year) was used to determine a course estimate of ET in this area.
Estimates of PET rates for this study area for selected years were made by applying Kc values (Allen and others, 1998; Pereira and Alves, 2005; Kjelgren and others, 2016; table 4) to publicly available land-use data for the years 1934 (figs. 3, 11; Swift and Sabourin, 2000), 1945, 1972, 1973 (Moyle, 1976), 1986 (Woolfenden and Bright, 1988), 1990, 1993, 2001, 2005 (Southern California Association of Governments, 2005), 2012, and 2016 (Southern California Association of Governments, 2019). The fourteen different land-use classes and associated Kc values ranged from 0.20 for bare soil to 1.15 for irrigated potatoes and grain. The Kc values for crops represent mid-season single crop classes (Allen and others, 1998; Pereira and Alves, 2013; Kjelgren and others, 2016). Based on the Kc values and the crops present during the selected years shown on figure 3, the maximum PET rates in those years, assuming crops were able to obtain all water required for the entire year, ranged from 24.7 in/year in 1972 to 22.3–21.3 in/year in 2016 (fig. 11). Lower rates in the later years reflected the conversion of native lands to urban developments and agricultural lands.
Table 4.
Land-use designations and associated crop coefficients (Kc) used to calculate evapotranspiration near Anza, California.| Land-use designation |
Crop coefficient (Kc; unitless) |
Source |
|---|---|---|
| Bare soil | 0.2 | Pereira and Alves, 2005 |
| Conifer trees | 1 | Allen and others, 1998 |
| Grain | 1.15 | Allen and others, 1998 |
| Grass | 1 | Allen and others, 1998 |
| Irrigated pasture | 0.95 | Allen and others, 1998 |
| Deep water | 0.65 | Allen and others, 1998 |
| Mixed pasture | 0.8 | Allen and others, 1998 |
| Native vegetation | 0.3 | Kjelgren and others, 2016 |
| Orchard | 0.95 | Allen and others, 1998 |
| Potatoes | 1.15 | Allen and others, 1998 |
| Recreation area | 0.45 | Calculated by combining 50 percent native vegetation, 25 percent grass, 25 percent bare soil. |
| Residential | 0.375 | Calculated by combining 5 percent native vegetation, 25 percent grass, 55 percent bare soil, and 15 percent impervious. |
| Urban/commercial | 0.25 | Calculated by combining 75 percent impervious and 25 percent grass. |
| Shallow water | 1.05 | Allen and others, 1998 |

Estimates of A, irrigated area by crop; and B, potential maximum evapotranspiration using land use, crop coefficients, and reference evapotranspiration for 1934 (Swift and Sabourin, 2000), 1945 (U.S. Bureau of Reclamation, 1996), 1972 (U.S. Geological Survey, 1990), 1973 (Moyle, 1976), 1986 (Woolfenden and Bright, 1988), 1990, 1993, 2001, 2005 (Southern California Association of Governments, 2005), 2012, and 2016 (Southern California Association of Governments, 2019) near Anza, California.
Direct evaporation occurs from the surface of open water and in areas where groundwater is near land surface. Lake Riverside, a man-made reservoir built in 1962 and fed by pumped groundwater, has an area of about 75 acres and is west of the Cahuilla Reservation (fig. 3K). A few much smaller irrigation ponds near the town of Anza, shown as “Water” on figure 3, occasionally are used to temporarily store groundwater when crop demand is greater than the yield of agricultural pumps. Moyle (1976) estimated that the evaporation from these lakes and the reservoir was about 750 acre-ft/year; Woolfenden and Bright (1988) estimated that the evaporation rate was about 740 acre-ft/year in 1973 and about 580 acre-ft/year in 1986. Based on the area of Lake Riverside in 2016, the Kc for “Deep water” (table 4), and the annual evaporation rate of 62.51 in. from CIMIS (California Department of Water Resources, 2012), estimates of the volume of water evaporated from the reservoir was about 390 acre-ft/year.
When considering the potential amount of water evaporated from the irrigation ponds, it is important to note that these ponds do not contain water year-round like a reservoir. Assuming that these ponds, which covered an area of about 58 acres in 2016 (fig. 3K), contain water about one-third of the year and have a Kc of 1.05 (see “Shallow water” in table 4), then an estimate of the amount of water evaporated from them was only about 13 acre-ft/year. The combined potential amount of water evaporated from the open water bodies is estimated to be about 400 acre-ft/year.
Determining the potential rate of groundwater lost through evaporation where the water table is shallow includes factors that are variable and estimates for this differ widely. Moyle (1976) estimated that the rate of evaporation from groundwater at land surface over 315 acres was about 1,670 acre-ft/yr in 1973, but Woolfenden and Bright (1988) estimated a value that was much larger for 1986, about 3,870 acre-ft/yr from 730 acres. These estimates probably assumed that groundwater was near the land surface over a much larger area than was observed over the course of this study; also, it is likely that the groundwater table was shallower in many places in those years. During this study, evidence of shallow groundwater as saturated terrain and marshy conditions was observed mainly in the area of about 485 acres along Cahuilla Creek, east of Durasno Valley. Assuming a Kc value for pasture, the estimated amount of groundwater lost through evaporation was lower and likely about 2,400 acre-ft/yr at most for wet years and much less for drier years.
Groundwater Pumpage
Groundwater has been used as the sole source of water for Native American Tribes, agriculture, and for municipal and domestic supply. Most of the groundwater has been used for agriculture, which likely started near the turn of the 20th century, sometime before 11 irrigation wells were first observed in 1916 by Waring (1919). Pumpage has not been metered, and previous investigators have attempted to estimate the volume of groundwater extracted by pumpage based on land use. In 1953, the DWR inventoried 37 wells (California Department of Water Resources, 1956), and in 1968–69, the DWR compiled information for about 415 unused and active wells, noting that about 535 acres of land were being irrigated (California Department of Water Resources, 1974). Moyle (1976) estimated that, in 1973, 457 acres were being used for irrigated crops and that groundwater was being used at a rate of about 4,200 acre-ft/yr for irrigation, natural pasture, replacement of evaporation from lakes and reservoirs, domestic supply, and livestock. Woolfenden and Bright (1988) reported that, by 1986, there was an increase of about 6,000 acre-ft/yr in consumptive groundwater use since 1973, and the authors estimated that agricultural use increased by 1,820 acre-ft/yr. In comparison, evaporation from natural pasture was estimated to have increased by 2,200 acre-ft/yr and domestic use by 420 acre-ft/yr.
More recent estimates for “substantial water users” were compiled for 1991–2021 from annual reports by the Santa Margarita River Watershed Watermaster (Santa Margarita River Watershed Watermaster, 2024b; referred to hereafter as the Watermaster) and are shown on figure 12. As defined by the Watermaster, substantial water users are water purveyors, Indian reservations, mobile parks, Lake Riverside (fig. 3K), and private landowners who irrigate 8 or more acres or use the equivalent quantity of water. The Watermaster estimated that the total annual pumpage by substantial water users in the Santa Margarita River watershed for 1991–2021 ranged from about 510 acre-ft in 2019 to about 3,080 acre-ft in 1994. Pumpage from about 1,200 “de minimis” users (those who irrigate less than 8 acres or the equivalent amount of water) were not included in the pumpage estimates by the Watermaster (M. Preszler, Santa Margarita River Watershed Watermaster, written commun., 2023).
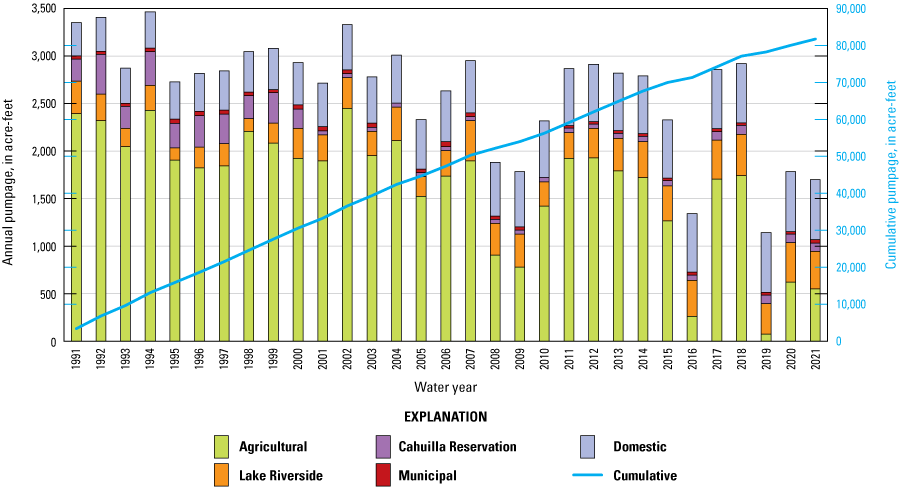
Estimated annual and cumulative pumpage for 1991–2021 near Anza, California, for substantial water users (Santa Margarita River Watershed Watermaster, 2024b) and domestic users.
Pumpage for agriculture was highest between 1991 and 2007—during that time, the average pumpage rate was about 2,030 acre-ft/yr. Pumpage decreased after 2007, and the average agricultural pumpage during 2008–21 was about 1,190 acre-ft/yr (fig. 12). In 2016, 2019, 2020, and 2021, agricultural pumpage was about the same or less than other uses, particularly for Lake Riverside. Although Lake Riverside is considered a substantial water user by the Watermaster, it does not deliver water to customers, and the groundwater pumped for Lake Riverside is used to maintain the water in the lake that is lost through evaporation.
Groundwater used on the Cahuilla Reservation varied between about 40 and 420 acre-ft/yr and was used for grazing of cattle on non-irrigated acreage; it was also used for domestic and commercial uses, which included watering of turf grass, dust control, and for supplying water to a casino (Santa Margarita River Watershed Watermaster, 2024b). The amount of reported pumpage for municipal use was much less than other uses and did not exceed about 50 acre-ft/yr.
Domestic pumpage other than on the Cahuilla Reservation was not reported by the Watermaster, so domestic use was estimated from population estimates and per capita water use within the study area boundary. Population data in the study area from Manson and others (2019) for 1990, 2000, and 2010 was about 3,470, 4,550, and 6,110, respectively, and was about 6,480 in 2020 (Esri Data Development, 2023). The population was estimated during each decade by linearly interpreting between years when population data were reported; population estimates for 2021 were assumed to be the same as 2020. The population estimates, excluding the Cahuilla Reservation, were then multiplied by the 2010 per capita water usage of 87 gal/d per person (Dieter and others, 2018) to estimate domestic water use. Based on these data, domestic pumpage was estimated to range between about 340 and 610 acre-ft/yr between 1991 and 2021.
The estimated total pumpage for 1991–2021 ranged from about 1,140 acre-ft in 2019 to about 3,450 acre-ft in 1994. When summed, the cumulative amount of estimated pumpage between 1991 and 2021 was about 81,400 acre-ft. Although domestic pumpage has been estimated for this report, the amount of pumpage by de minimus users is unknown, and their use may be significant in some years (M. Preszler, Santa Margarita River Watershed Watermaster, written commun., 2023); therefore, the actual annual pumpage volumes were higher than those shown on figure 12.
Groundwater Flow, Levels, and Movement
The general direction of groundwater flow is from the northeast along the San Jacinto fault zone and headwaters of Cahuilla and Hamilton Creeks, to the surface-water outlets at the western and southeastern parts of the study area. From the higher elevations, groundwater generally flows southwestward through the Cahuilla Valley, following the general course of Cahuilla and Hamilton Creeks. Groundwater elevations are highest in the basement rocks near the fault zone, and previous investigators reported groundwater elevations higher than 4,700 ft above mean sea level and depths to groundwater as much as 340 ft bls (fig. 13). The lowest groundwater elevations are to the west where Cahuilla Creek exits the study area at about 3,400 ft. Within the Cahuilla Valley groundwater basin, depth to groundwater is greatest southwest of the San Jacinto fault zone and is generally near or above land surface in the middle and southwestern parts of the basin.
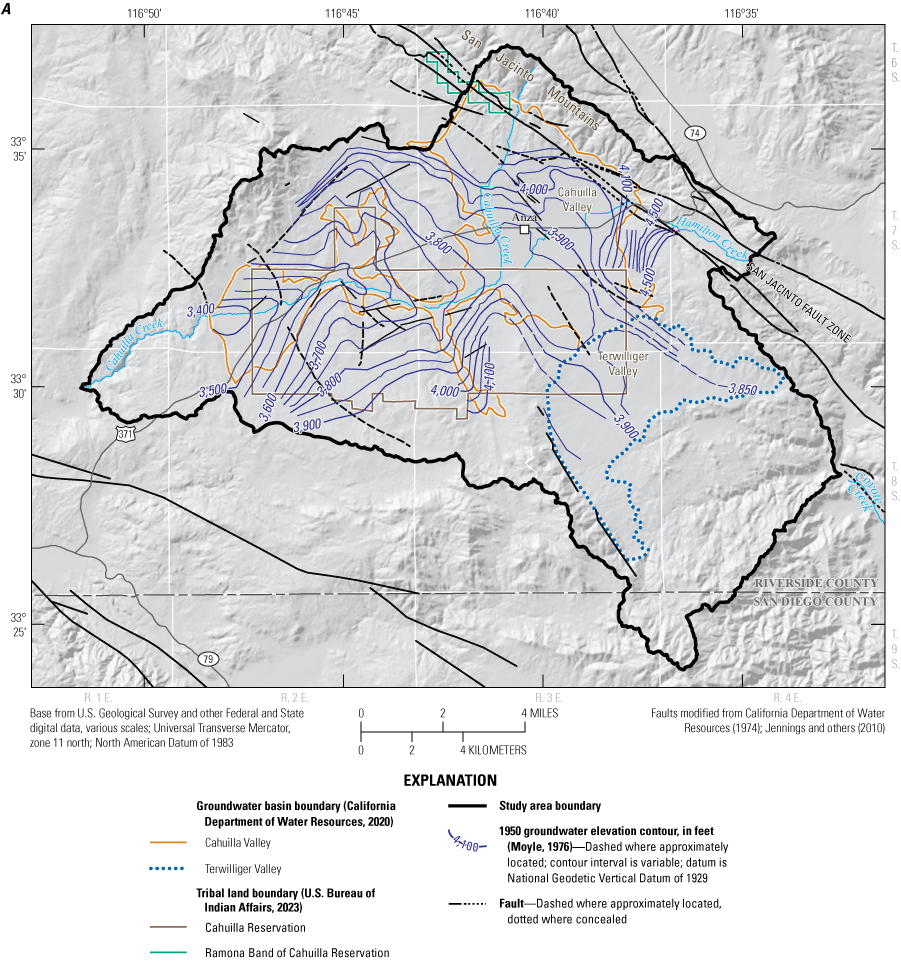
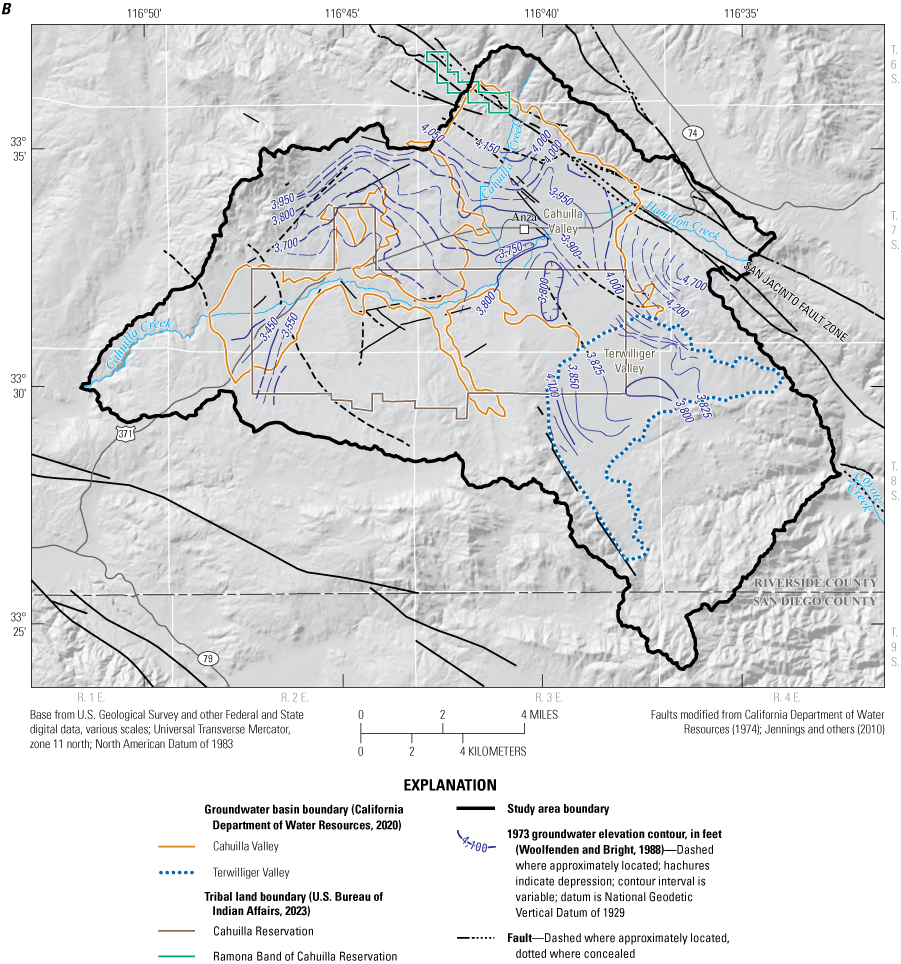
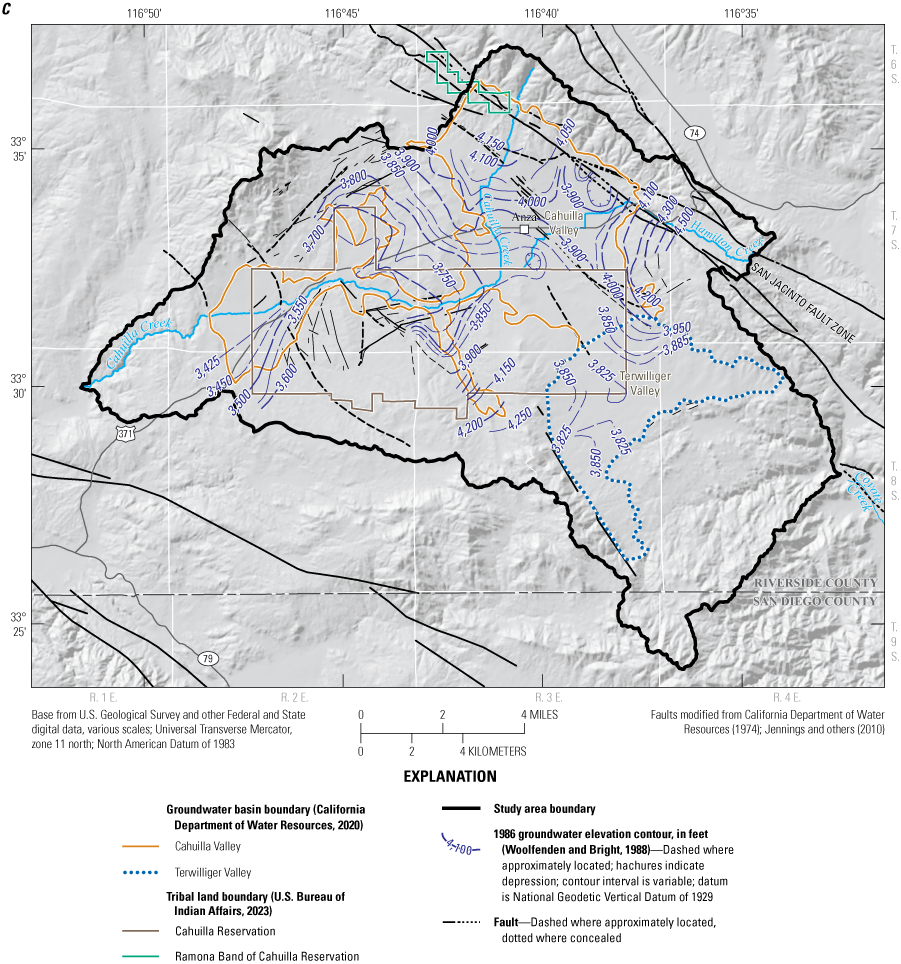
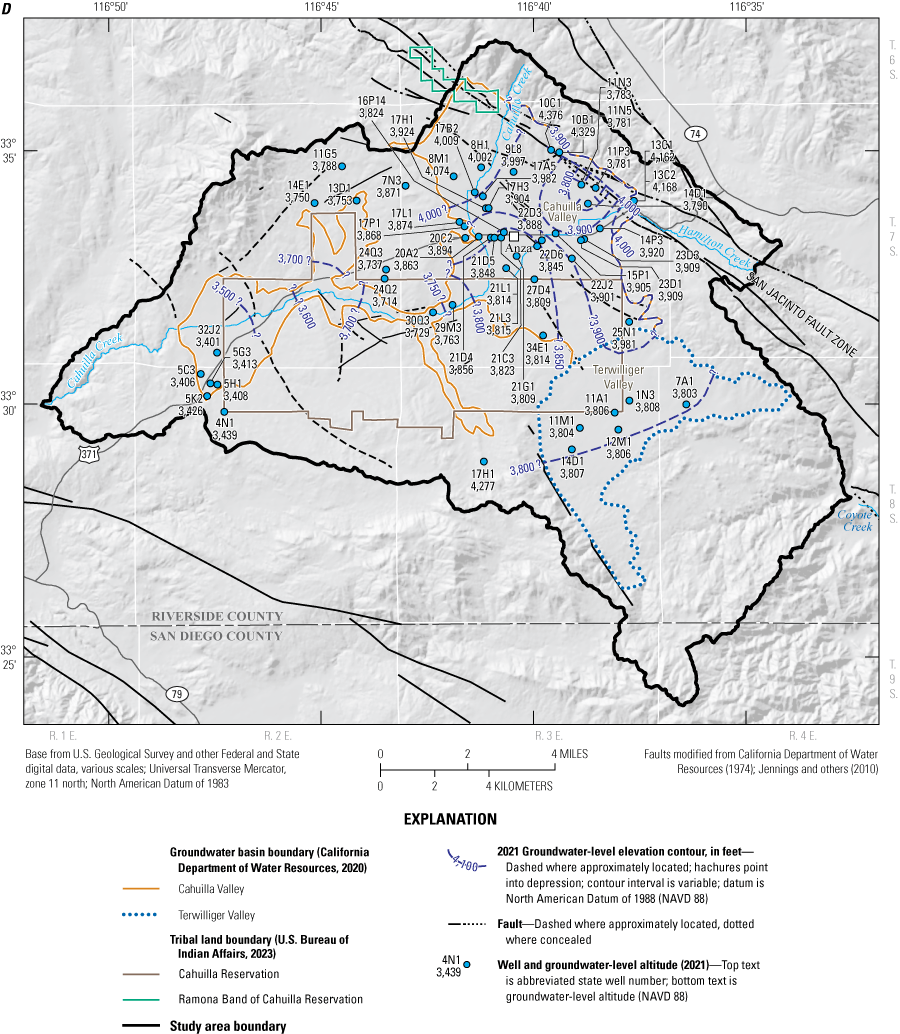
Groundwater-level elevations and contours for A, 1950 (Moyle, 1976); B, 1973 (Woolfenden and Bright, 1988); C, 1986 (Woolfenden and Bright, 1988); and D, fall 2021 (U.S. Geological Survey, 2021) near Anza, California.
Maps depicting the groundwater elevations and flow directions at selected periods help describe the changing hydrology of the groundwater basins and document how recharge (precipitation and runoff) and discharge (evapotranspiration, evaporation, and pumpage) affect the aquifer system (fig. 13). Moyle (1976) collated available groundwater-level data from 1950 and produced a contour map of the groundwater-level elevations, which he presented as steady state to represent conditions that existed before large-scale pumping had a significant effect on groundwater levels (fig. 13A). This representation of steady state in 1950 is reasonable in most places, considering that the DWR inventoried only 37 wells in 1953 (California Department of Water Resources, 1956); however, some areas had already been affected by pumpage, such as the area within and northeast of the town of Anza where groundwater-level contours show irregularities, including abrupt curves and steep gradients. The contoured data from 1950 also indicate that there was a groundwater divide between the Cahuilla Valley and Terwilliger Valley groundwater basins and that water that entered on the northeastern side of the surface-water divide flowed towards the Cahuilla Valley, and water that entered on the southeastern side flowed toward the Terwilliger Valley groundwater basin (fig. 13A).
Moyle’s groundwater-level contours extend beyond the boundaries of the Cahuilla Valley and Terwilliger Valley groundwater basins that are currently defined by the DWR (California Department of Water Resources, 2020) and cover the surrounding areas of exposed basement, hydraulically connecting the alluvium and the decomposed and competent basement (figs. 13A, 13B). Woolfenden and Bright (1988) examined the groundwater-level data from 1973 and 1986 from wells completed within the competent basement and alluvium (figs. 13B, 13C) and concluded that the hydraulic head did not vary substantially with depth, supporting the suggestion by Moyle that the groundwater-bearing units are hydraulically connected.
Moyle (1976) compared data for 1950 and 1973 and observed that pumping had changed the pattern of groundwater flow in some places in the 23 intervening years. Groundwater-level contours from 1973 by Moyle (1976) and modified by Woolfenden and Bright (1988; fig. 13B) showed that the overall regional direction of groundwater flow had not changed; however, pumpage had affected groundwater flow locally, and there were several areas of groundwater-level depressions in both the Cahuilla Valley and Terwilliger Valley groundwater basins, particularly in the area north of the Cahuilla Reservation. Woolfenden and Bright (1988) noted further perturbances to the groundwater-flow patterns in 1986 where continued decreases in groundwater levels resulted in larger pumping depressions next to the San Jacinto fault zone in the northeast, between Cahuilla Creek and Hamilton Creek, and southeast of the Cahuilla Reservation in the Terwilliger Valley (fig. 13C). These depressions were in areas where the alluvium is thickest and near wells that are capable of higher pumping rates compared to wells in other parts of the area. Through time, these groundwater-level depressions have migrated slightly in location and fluctuated in depth depending on how much and where groundwater was extracted for irrigation, and the amount of rainfall and subsequent recharge that reached the groundwater system each year.
Groundwater-level elevations and contours for wells measured in fall 2021 are shown on figure 13D. Groundwater-level contours were not constructed outside of the Cahuilla Valley and Terwilliger Valley groundwater basins, but discrete groundwater-level data for 2021 outside of the basins are included to show the similarities in groundwater levels between the DWR-defined groundwater basins and areas where the basement crops out at land surface. The contours of the 2021 data show that pumping continued to affect groundwater levels in the Cahuilla Valley groundwater basin near the town of Anza and north of the Cahuilla Reservation. The variability and extent of the groundwater elevations in the area over time indicate that the location of the natural groundwater divide between the Cahuilla Valley and Terwilliger Valley groundwater basins migrates depending on hydrologic stresses (figs. 13A–D). Data from wells that are closer to the boundary of these two groundwater basins would clarify groundwater flow and the location of the groundwater boundary under current conditions.
Groundwater data from structurally complex areas in the Cahuilla Valley groundwater basin point to mechanisms other than recharge and discharge that affect groundwater flow. The effects on groundwater flow on a large scale are evident in the northeastern part of the basin, where the strands of the San Jacinto fault zone act as barriers, or partial barriers, to groundwater flow (Landon and others, 2015). The fault’s effects are evident in the data from wells adjacent to, and within, this fault zone; these wells are less than 1 mi from each other but have differences in groundwater-level elevations of hundreds of ft. In April 2021, almost 390 vertical ft separated the groundwater-level elevations in well 7S/3E-13C2 (4,168 ft) on the east side of the fault zone, where depth to groundwater was about 42 ft bls, and well 7S/3E-11P3 (3,781 ft) on the west side of the fault zone, where depth to groundwater was about 340 ft bls (fig. 13D). In this zone, the fault strands act as barriers to groundwater flow likely owing to the cementation from mineral deposition within the fault zone and deformation of the geologic and groundwater-bearing units resulting from seismic activity along the fault (Londquist and Martin, 1991; Stamos and others, 2001). Commonly referred to as fault gouge, the fine-textured sediment or rock that fills fault planes has been observed in the San Jacinto fault zone by Dor and others (2006).
On a smaller scale, data collected from the Durasno Valley and discussed in the “Electrical Resistivity Tomography” and “Monitoring Wells” sections can be used to understand how groundwater flows through the groundwater-bearing units in this narrow valley, which is constricted on both sides and below by basement rocks (figs. 5, 7). Through this valley, surface water (when present in Cahuilla Creek) and groundwater flow from the upper part of the Cahuilla Valley groundwater basin (northeast) to its lower part (southwest); the geometry of this constriction and the potential quantity of groundwater that flows through it have not been previously studied. The two monitoring sites that were installed in 2018 and data from the ERT profiles not only enable groundwater-level monitoring and an understanding of the geometry at those sites, but also make it possible to determine the groundwater-level gradient between them.
There are differences in the groundwater elevations between the two monitoring sites and between the wells at each site. In April 2019, the groundwater elevations in the wells 7S/3E-29M2 and -29M3 at the upgradient profile 1 were about 28 ft higher compared to the shallow well 7S/3E-30Q3 at the downgradient profile 2—all of which were completed in the alluvium (figs. 5, 7, 8). In October 2019, the difference in groundwater elevations in the alluvium between the two ERT profiles, which are about 2,150 ft apart, was about 39 ft. The deep well at the downgradient profile was artesian when it was installed and was observed flowing in 2021, indicating an upward gradient at this site. Because artesian conditions indicate that the hydraulic head, or pressure head, in the groundwater-bearing unit in which a well is perforated is above land surface elevation, the upward gradient at this site indicates that the basement and decomposed basement contribute groundwater to the overlying alluvium laterally, from below, or both. This quantity of groundwater likely is small but is enough to cause the hydraulic head in the basement unit to be about 12 ft higher in well 7S/3E-30Q2 than in well 7S/3E-30Q3 in the overlying alluvium (fig. 8).
Using data obtained from the ERT profiles and the monitoring wells, it is possible to estimate the rate at which groundwater flows within the alluvium. As discussed in the “Electrical Resistivity Tomography” section, the cross-sectional area of the alluvium along the upgradient profile 1 (fig. 7) was about 67,000 ft2. Although this is a larger area than at profile 2, this profile can be used to estimate a high-end value for flow. The lithology encountered during the auguring was often difficult to distinguish at depth because of the method used, but most of the subsurface lithology was described as sand with silts and some clay (fig. 8). Assuming that the alluvium is homogeneous and that monitoring wells are parallel to the direction of groundwater flow, estimates of lateral groundwater flow can be made using Darcy’s Law:
whereQ
is flow, in ft/day;
K
is hydraulic conductivity, in ft/day;
a
is area, in ft2; and
i
is hydraulic gradient, in ft/ft.
Published values of hydraulic conductivity were used for silty and clean sands that range from 1 to 15 ft/day (Freeze and Cherry, 1979), and April 2019 groundwater levels in the alluvium were used (resulting in a hydraulic gradient of about 0.013 ft/ft); estimates of lateral groundwater flow within the alluvium between the two ERT profiles ranged from less than 10 acre-ft/yr to about 110 acre-ft/yr. The hydraulic gradient in October 2019 was slightly higher at about 0.018 ft/ft but resulted in similar estimates of flow, and estimates of groundwater flow within the alluvium at that time ranged from about 10 to 150 acre-ft/yr. The actual volume of groundwater flow between the two ERT profiles may be higher if coarser sediments with higher hydraulic conductivity values are present in parts of the narrow valley, or if lenses of coarser sediments are connected and are laterally extensive. Conversely, the volume may be lower if finer-grained sediments are present, which would lower the overall hydraulic conductivity and subsequent transmissivity of the groundwater-bearing deposits.
Short-Term Trends in Groundwater Levels
An examination of short-term trends in groundwater levels can show how some parts of the basin respond quickly to recharge and discharge, at least hydrologically, because depths to groundwater are shallow in many places and are affected by the variable cycles of wet or dry climatic periods. The effects of the interannual variability on recharge in this arid region were discussed in the “Natural Recharge” section and are evident when comparing groundwater-level responses after short-term precipitation events.
To show any potential effects of short-term local recharge events and stresses from pumpage in different areas, hydrographs were constructed using groundwater-level elevations from August 2017 to December 2021 from 10 wells and combined with data collected from two precipitation sites installed as part of this study (figs. 14, 15). The short-term responses to precipitation events provide information about the thickness of the alluvium and depth of the decomposed and competent basement, and the effects of local recharge, if present. Groundwater levels in wells that are outside the Cahuilla Valley groundwater basin, or in areas where the alluvium is thin, showed more pronounced responses from precipitation events than wells where the alluvium is thickest—mostly within the groundwater basin boundary (fig. 9A). For example, the hydrograph for well 7S/2E-13R1 (hydrograph 1 on figs. 14 and 15) shows that groundwater levels increased rapidly after a large storm event on February 14, 2019. As a result of that storm and others in the following winter and spring months, groundwater levels in well 7S/2E-13R1 rose almost 50 ft by June 2019, demonstrating a response to local recharge over about a 4-month period. This well is not near any local creeks, and according to the driller’s log (California Department of Water Resources, 2022), it is completed mostly in decomposed basement and competent basement which extend to at least 70 ft bls in this well. Heavy local precipitation may have occurred near the well that was not recorded by the precipitation gages, but the response in this well more likely represents lateral movement of groundwater through the decomposed basement. The rapid response to storm events in this and other wells completed in the decomposed basement and competent basement shows that local recharge infiltrates and then dissipates quickly and that these materials do not have much capacity for the long-term storage of groundwater compared to the alluvium.
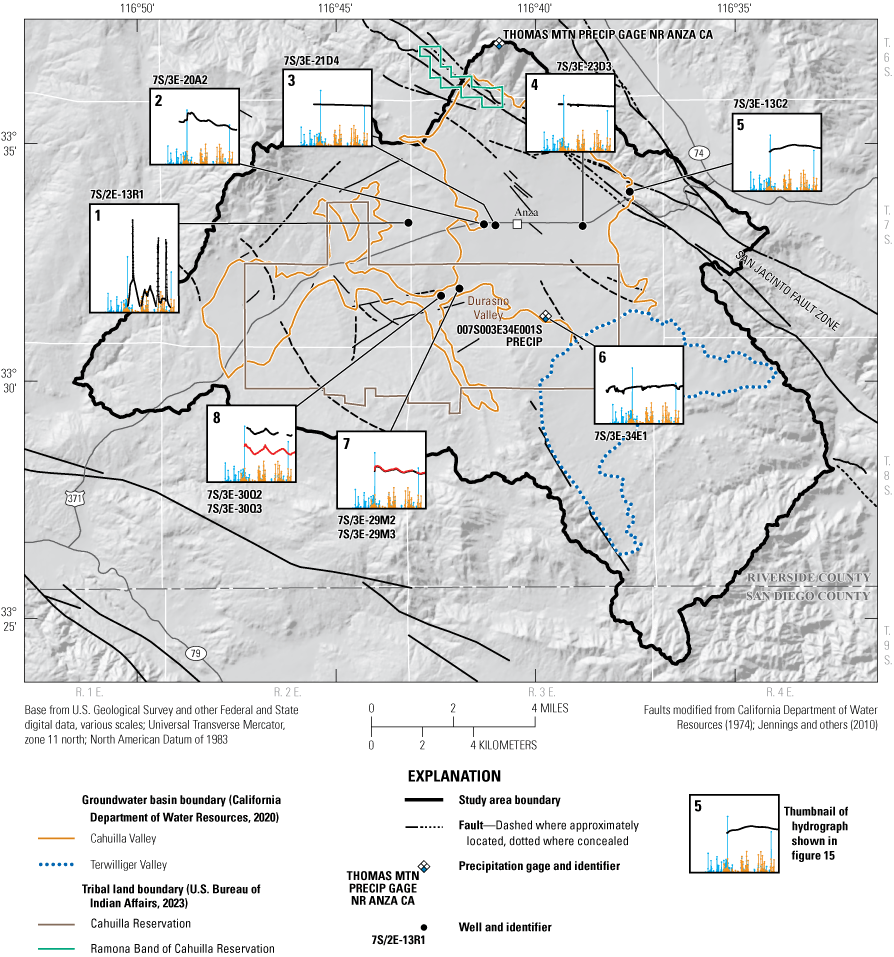
Location of wells with short-term hydrographs and precipitation data shown on figure 15 near Anza, California (U.S. Geological Survey, 2021).

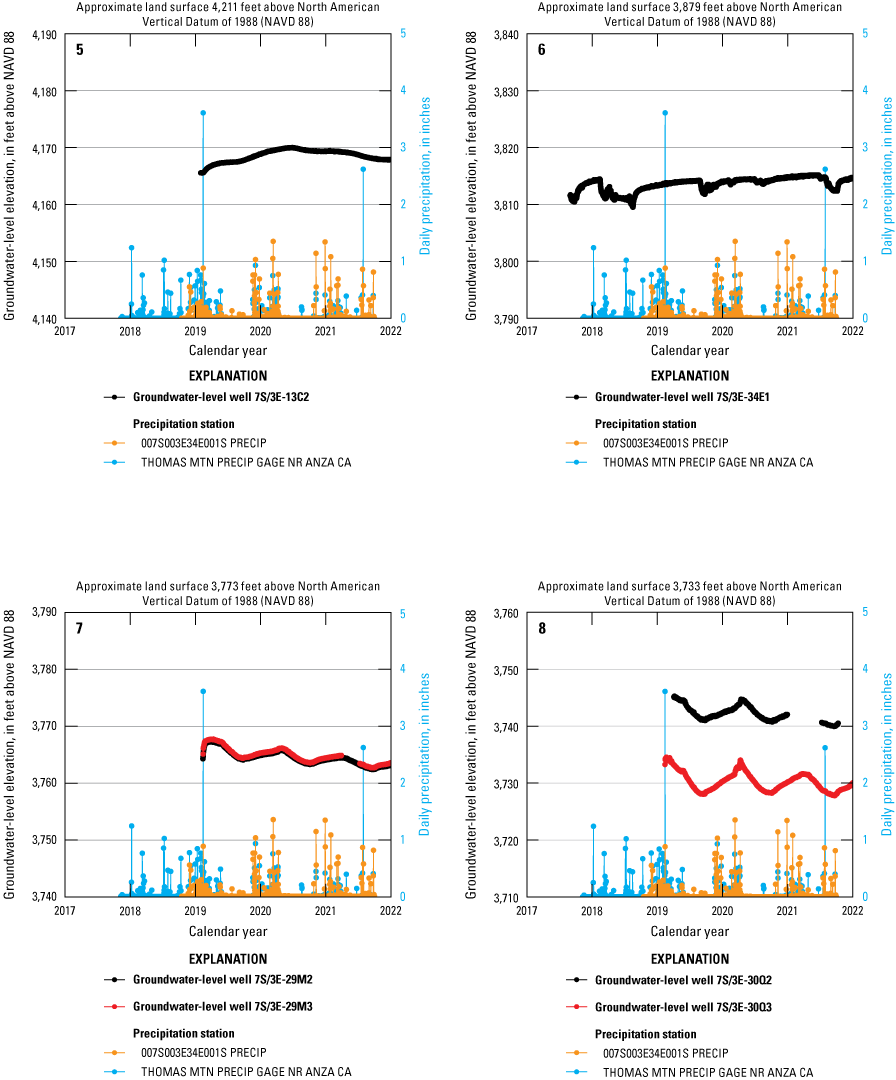
Groundwater-level hydrographs (2017–21) from wells and precipitation sites near Anza, California (U.S. Geological Survey, 2021; location of wells and precipitation sites shown on fig. 14).
Another well on the edge of the Cahuilla Valley groundwater basin boundary also showed a rapid, but more muted and prolonged response, to the storms in early 2019. Well 7S/3E-20A2 (figs. 14, 15, hydrograph 2) is about 100 ft from Cahuilla Creek, which had an estimated peak flow of 59 ft3/s from the February 2019 storm event (table 1). Groundwater-level elevations in this well rapidly increased by almost 5 ft, reached a peak in early March, and plateaued through May (figs. 14, 15, hydrograph 2). In this well, the rise in groundwater elevations began about 3 weeks after the largest storm event in February 2019. The driller’s log from this well indicates that it is perforated in granite (California Department of Water Resources, 2022), or basement rocks, as described in this report.
Wells that are further within the Cahuilla Valley groundwater basin, such as wells 7S/3E-21D4 and 7S/3E-23D3 (figs. 14, 15, hydrographs 3, 4), showed little response to the storms in the winter and spring of 2019. These wells are in the area where the alluvium is much thicker and have small but steady groundwater-level declines. For example, the groundwater levels in well 7S/3E-21D4 declined by slightly less than 1 ft between 2018 and 2021. Other wells, such as 7S/3E-34E1 (figs. 14, 15, hydrograph 6), show small, short-term fluctuations in groundwater levels, which are mostly due to varying pumping cycles in nearby wells.
Well 7S/3E-13C2 (figs. 14, 15, hydrograph 5) had subtle changes in groundwater levels, but these changes were not concurrent with any recorded precipitation event(s) nor did they show any effect from nearby pumping. The groundwater levels in this well increased steadily over 4 ft from 2019 to 2020 and reached a maximum in summer 2020, then steadily decreased through December 2021. This well is within the San Jacinto fault zone and showed almost no changes in groundwater levels related to precipitation events. The data for all the wells discussed herein are available on the USGS NWIS website (U.S. Geological Survey, 2021), as described in the “Accessing Data” section.
In general, the differences in groundwater-level responses in wells were due to several factors, including but not limited to, the following: (1) the hydrologic properties of the aquifer to transmit water both vertically and horizontally; (2) proximity to recharge sources; (3) variation in the spatial and temporal distribution of precipitation; (4) hydraulic properties of the aquifer to store water; (5) the thickness of the alluvium or basement materials in which wells are screened; or (6) a combination of these factors. Short-term groundwater-level fluctuations occurring over weeks or months are indicative of the limited capacity of the aquifer system for groundwater storage in some areas and the sensitivity of this basin to the amount and availability of recharge. In areas where sustained historical pumpage has occurred, primarily from the alluvium for agriculture near and northeast of the town of Anza, groundwater levels are deeper and generally do not show the short-term effects of local recharge from storm events or surface runoff.
Long-Term Trends in Groundwater Levels
Compiling long-term groundwater-level data from wells gives insight as to how stresses such as recharge and discharge (mainly pumpage) have affected the movement and direction of groundwater flow over decades. In most areas, a historical record of continuous groundwater-level data from a single well is rare, so data from wells that are near each other are often combined. Using groundwater-level data that were available from 1916 (Waring, 1919), 18 long-term hydrographs were constructed within the Cahuilla Valley groundwater basin, showing trends from 1916 to 2021. Most wells near the boundaries and outside of the Cahuilla Valley and Terwilliger Valley groundwater basins showed more rapid responses to stresses, and some wells outside of the groundwater basin had groundwater levels that remained mostly unchanged or had very little decline. In contrast, wells within the groundwater basins generally showed the effects of long-term pumping.
The data collected between 1916 and 2021 show that changes in groundwater levels within the boundary of the Cahuilla Valley groundwater basin were variable and dependent on location. As mentioned earlier, wells outside of both groundwater basins showed little or no long-term groundwater-level declines in contrast to wells within the groundwater basins. Wells within the groundwater basins had variable trends in groundwater levels depending on their location relative to recharge that originates mostly in the higher elevations and areas of long-term groundwater withdrawal for agricultural pumpage.
Groundwater levels in wells that are farthest from where most recharge occurs in the northeast had some of the largest long-term groundwater-level declines. Groundwater levels in areas farther from recharge sources do not respond rapidly to recharge events because recharge takes longer to arrive at these areas. For example, well 7S/3E-34E1 (figs. 16, 17, hydrograph 11), which is in the southeastern part of the Cahuilla Valley groundwater basin, declined by about 30 ft between 1951 and 2021, less than about 0.5 ft/year; groundwater levels in well 8S/3E-2D1, which is in the northwestern part of the Terwilliger Valley groundwater basin, declined by about 40 ft between 1960 and 2021, or about 0.7 ft/year (figs. 16, 17, hydrograph 10). In addition to the distance these wells are from the recharge sources in the higher elevations, the depth to groundwater ranged between 60 and 80 ft bls, so any potential locally-derived recharge would take longer to migrate downward to the water table than in places where the groundwater table is shallower (see the “Short-Term Trends in Groundwater Levels” section).
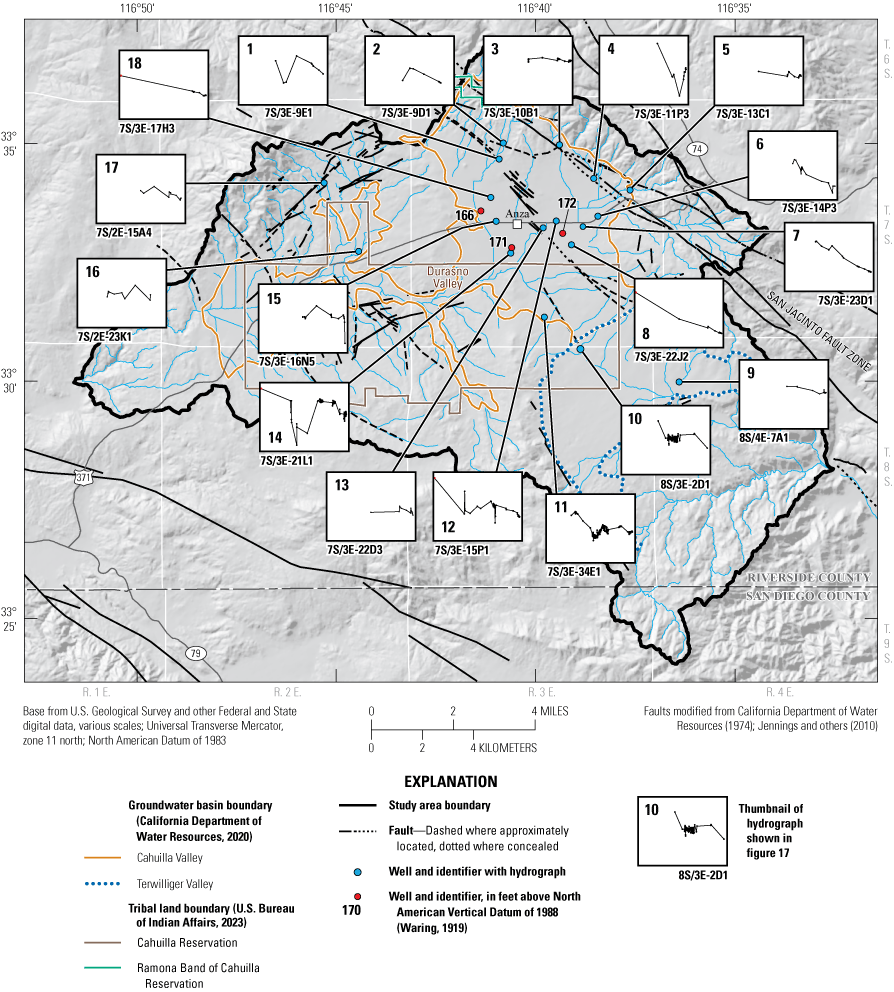
Location of wells with long-term hydrographs shown on figure 17 near Anza, California (U.S. Geological Survey, 2021).
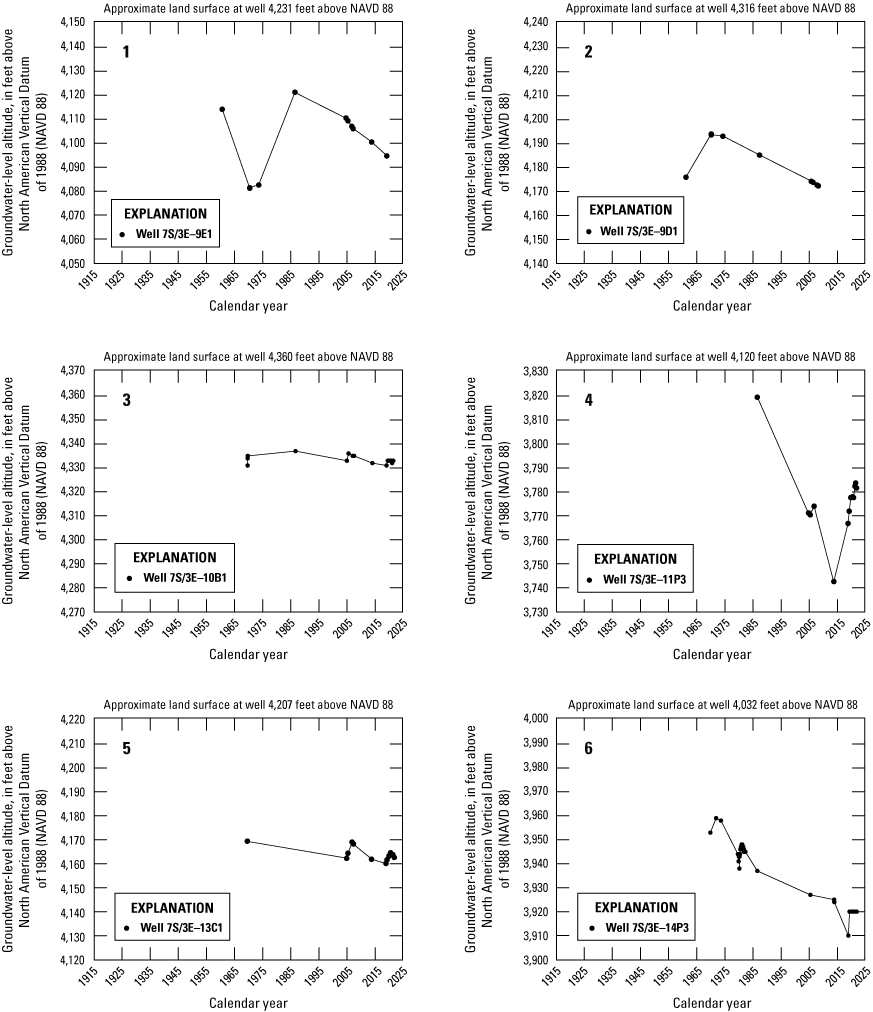
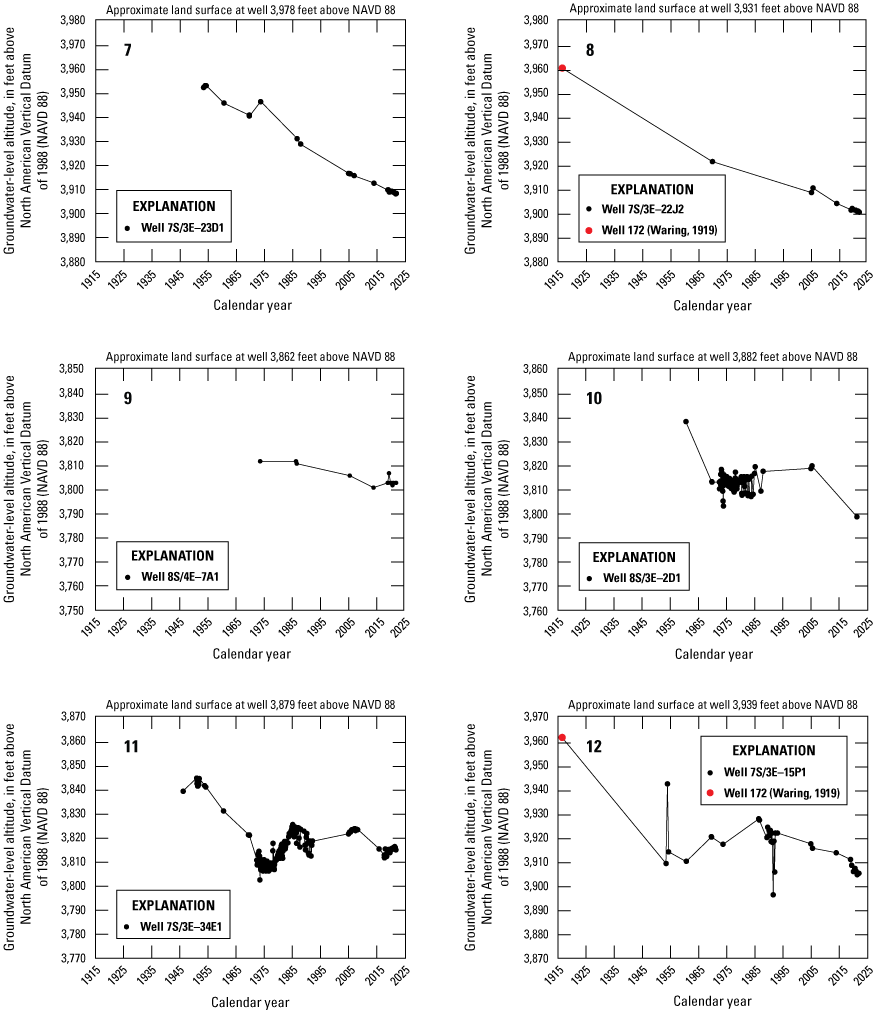
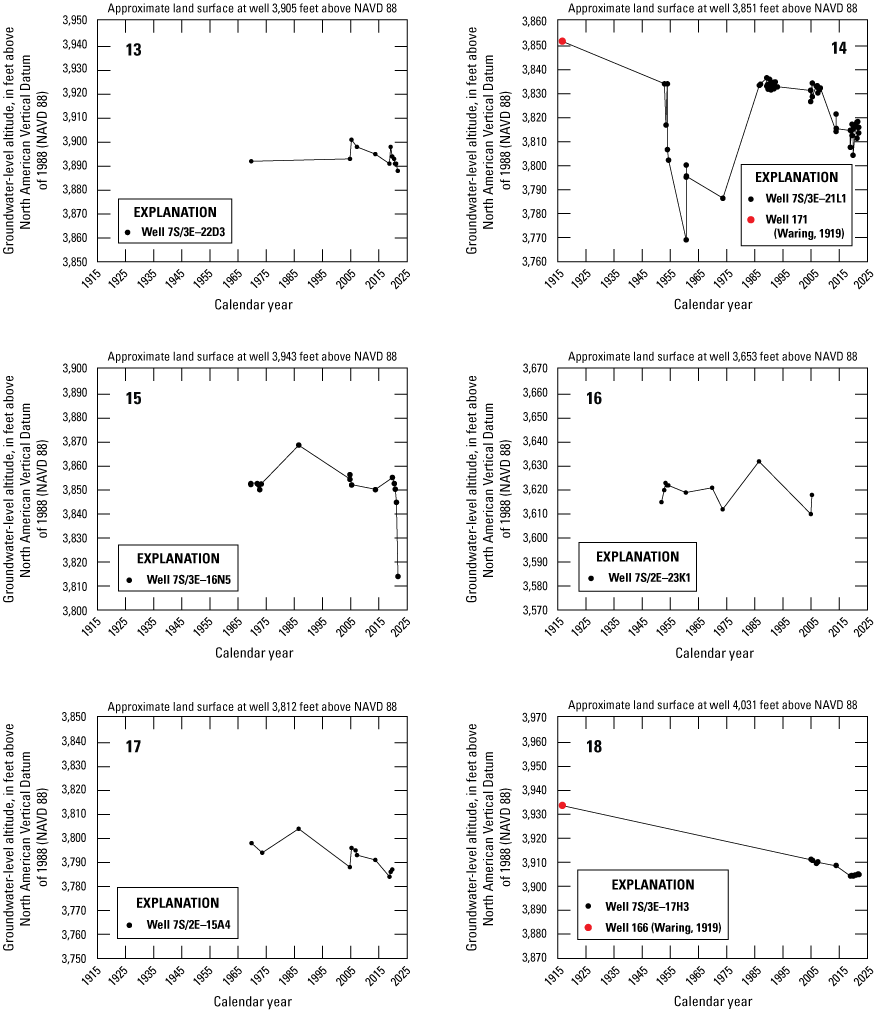
Groundwater-level hydrographs (1915–2021) from wells near Anza, California (U.S. Geological Survey, 2021). Location of wells shown on figure 16.
Areas of long-term agricultural pumpage had the largest groundwater-level declines because pumping has controlled the movement and direction of groundwater flow. Combining the records from one of the wells Waring (1919) reported in 1916 with the more recent measurements from well 7S/3E-22J2 shows that groundwater-levels declined about 60 ft between 1916 and 2021 (figs. 16, 17, hydrograph 8). Groundwater levels in well 7S/3E-14P3 have declined almost 40 ft over the shorter period between 1971 and 2021—a rate of about 0.8 ft/year (figs. 16, 17, hydrograph 6). Although this well is in the northeastern part of the Cahuilla Valley groundwater basin and is near recharge sources, the depth to groundwater in this well dropped from about 75 ft bls to more than 112 ft bls over those 50 years.
The long-term data show that several factors affect groundwater flow and levels. In addition to a well’s distance from recharge sources, some quantity of recharge is captured upgradient by pumping wells in the northeastern and southern parts of the groundwater basins, which diminishes the amount of recharge that reaches downgradient areas. The long-term declines in groundwater levels also suggest that the amount of water removed by pumpage has exceeded that which has been recharged and that groundwater has been removed from the aquifer system; that is, the amount of groundwater from aquifer storage has decreased. Moyle (1976) estimated that the total volume of groundwater removed from aquifer storage, or the amount of groundwater depletion, between 1950 and 1973 in two areas in the Cahuilla Valley groundwater basin was about 14,000 acre-ft, or about 600 acre-ft/yr. Long-term groundwater-level data are invaluable for understanding changes in groundwater flow, trends through time, and the effects of recharge and discharge. These long-term data indicate where imbalances between the volume of water that is recharged and amount of groundwater that is discharged, primarily by pumpage, exist. The continued evaluation of these long-term data is important to successfully managing the basins’ groundwater resources and exploring potential management strategies in the future.
Summary
Groundwater is the sole source of water supply for a rural community and two Native American Tribes in the Anza Valley, California, and the relation between the groundwater-bearing units of the groundwater system and the amount of natural recharge to the Cahuilla Valley and Terwilliger Valley groundwater basins is not well understood. During the 20th century, the reliance on groundwater for agricultural, domestic, and municipal uses often has exceeded recharge, and there is the potential for changes in groundwater availability related to climate change. To better manage the water resources in the area, the Ramona Band of Cahuilla and the U.S. Geological Survey (USGS) initiated a cooperative study to understand the hydrogeologic system encompassing the Cahuilla Valley and Terwilliger Valley groundwater basins and surrounding area. Increasing groundwater use has raised concerns about potential changes in water sustainability.
The purpose of this long-term, multi-phase study is to characterize the hydrogeology of the Cahuilla Valley and Terwilliger Valley groundwater basins and surrounding groundwater-bearing units, with the ultimate goal of developing a calibrated integrated hydrologic model to manage the groundwater supplies on a sustainable basis in the future. The purpose of this report is to describe the following: field data methods and interpretations, the development of the geologic framework model, the conceptual understanding of the hydrogeologic system, and the hydrologic stresses and changes in groundwater levels and flow through time.
Wells inventoried in the early 1900s were used for homesteads and to grow grain; in the late 1940s, crops were transitioning to alfalfa. By the 1950s, groundwater levels had declined about 7 feet relative to 1916. Publications by the California Department of Water Resources from 1956 and 1974 documented declines in groundwater levels since the 1950s, initiating more focused studies aimed at aquifer characterization to better quantify the effects of groundwater depletion. Most of the groundwater pumped from the area has been from the alluvium in the Cahuilla Valley and Terwilliger Valley groundwater basins; the underlying competent and decomposed basement rocks also yield groundwater and mainly serve as domestic supply. The abundance of wells completed with perforations that span the alluvium, the decomposed basement, and competent basement indicate that both units are important for water supply and likely are interconnected.
Groundwater, precipitation, and surface-water data were collected during this study to augment existing data to help better understand the hydrogeology of the groundwater basins. Since summer 2017, the USGS has collected discrete and continuous groundwater-level data from 90 wells throughout the study area as part of a long-term monitoring network. Pressure transducers were installed in 18 of the wells in 2021 to measure groundwater levels at 1-hour intervals to capture rapid changes in response to local stresses. Two precipitation sites were installed so that the amount of precipitation at higher elevations could be compared to what is received at the lower elevation in the Anza Valley.
Two electrical resistivity tomography (also known as direct-current resistivity) surveys were done about 2,150 feet apart to identify the thickness of the alluvium, its horizontal extent, and the depth-to-basement along two profiles perpendicular to Cahuilla Creek across a narrow section of Durasno Valley. The interpretation of the two resistivity profiles showed increasing resistivity with depth and mostly horizontally layered sediments. The resistivity of the alluvium was generally between 10 and 75 ohm-meters. The transitional boundary between the alluvium and basement, which likely represents a zone of decomposed basement, was thinner and shallower along the upgradient profile where Cahuilla Creek enters the Durasno Valley; there, the depth-to-basement was shallowest at about 70 feet below land surface. The depth-to-basement was greater at the downgradient profile; the basement was greater than 135 feet below land surface. The results from the electrical resistivity tomography profiles were used to place four monitoring wells at two sites in the Durasno Valley in 2018 using auger drilling methods. As part of the drilling and construction of the four monitoring wells, downhole geophysical logs were collected to evaluate the subsurface lithology and to verify the electrical resistivity tomography results. Groundwater-level data from the wells in April 2019 showed that the hydraulic heads in both upgradient wells were about 6 feet below land surface but differed at the downgradient wells. At the downgradient site, the hydraulic head in the shallower well was about 12 feet lower than the deeper well, which was artesian; this finding indicates that the decomposed and competent basement contribute groundwater to the overlying alluvium in this valley.
A digital three-dimensional geologic framework model was constructed to represent the subsurface geometry of the alluvium, decomposed basement, and competent basement within the study area. Lithology information from drillers’ log descriptions from about 1,185 well logs provided information on the subsurface geometry of the alluvium, decomposed basement, competent basement, and the variability of major lithologic textures within the alluvium. Interpreted surface and subsurface contacts for the geologic units were used as input data to construct the geologic framework model using EarthVision (version 11.0) software. Maps were made of the modeled thicknesses of the alluvium and decomposed basement, and the modeled elevation of the top of competent basement. Sections from the geologic framework model show the geometric relation of the modeled units, faults, and depth of selected wells. Additionally, the sections show the interpolated lithologic texture distribution within the alluvium.
The sources of natural recharge within the study area are mostly from the surrounding higher elevation areas of the San Jacinto Mountains to the northeast and from southeast of the Terwilliger Valley, but also include precipitation and runoff that mostly originate in the surrounding mountains and hills. Hamilton and Cahuilla Creeks and the many small unnamed creeks in the study area are ephemeral; no streams from adjacent surface-water basins drain into the study area. Recharge and runoff do not occur in large amounts every year, and when very wet years occur, most of the water becomes runoff, and a lesser component becomes recharge; both are controlled by the variable cycles of wet and dry weather and are temporally variable across the region. In addition to being temporally variable, recharge and runoff are spatially variable; recharge frequently occurs outside of the groundwater basins and rarely over the groundwater basins’ footprint. As part of this study, the regional-scale Basin Characterization Model for California was calibrated to estimate the potential in-place recharge and potential runoff into the groundwater system. Recharge and runoff have extreme interannual variability in arid regions, including the study area; the occurrence of recharge and runoff can be sporadic with many years lacking any substantive amount, so the long-term average value for recharge is not a reliable estimate for a particular year. Estimates of average annual recharge from a previous study and the Basin Characterization Model for California for four different periods ranged from 3,800 acre-feet per year (acre-ft/yr) for 1897–1947 to 5,900 acre-ft/yr for 1971–2000. Estimates of potential recharge from the disposal of domestic septic systems in this rural area were made from population and water-use data. Based on those data, the amount of potential recharge from septic effluent may have been as much as 500 acre-ft in 2020.
The natural sources of groundwater discharge are the evapotranspiration by vegetation, evaporation from open water bodies, areas where groundwater is at or near land surface, and groundwater underflow that exits the groundwater basins to the west and southeast. Estimates of potential evapotranspiration rates for selected years were made by applying crop coefficient values to publicly available land-use data. Some evaporation occurs from open water bodies and in areas where groundwater is near land surface. The combined potential amount of water evaporated from the open water bodies was estimated to be about 400 acre-ft/yr. Evaporation estimates from about 485 acres along Cahuilla Creek were about 2,400 acre-ft/yr for wet years; this quantity is likely much less in drier years.
Groundwater has been used as the sole source of water for Native American Tribes, municipal, and domestic supply, but most of the groundwater has been used for agriculture, which likely started near the turn of the 20th century. Estimates for agricultural and municipal pumpage for 1991–2021 were compiled for this report available from the Santa Margarita River Watershed Watermaster; these estimates were for users who irrigate 8 or more acres or use the equivalent quantity of water. Domestic groundwater use was estimated from population and per capita water use within the study area boundary. The estimated total pumpage for 1991–2021 ranged from about 1,140 acre-ft in 2019 to about 3,450 acre-ft in 1994. When summed, the cumulative amount of estimated pumpage between 1991 and 2021 was about 81,400 acre-ft.
The direction of groundwater flow is generally from along the San Jacinto fault zone in the northeast at the headwaters of Cahuilla and Hamilton Creeks, to the surface-water outlets at the western and southeastern parts of the study area. From the higher elevations, groundwater generally flows westward through the Cahuilla Valley sloping with Cahuilla and Hamilton Creeks; the depth to groundwater is shallower southwest of the town of Anza and is deepest adjacent to the fault zone in the Cahuilla Valley groundwater basin. Maps depicting the groundwater elevations and flow directions through time were compiled for the years 1950, 1973, 1986, and 2021. The groundwater-level contours from 1950 show pumping depressions, indicating that some areas had been affected by pumpage. The data from 1950 also indicate that there was a natural groundwater divide between the Cahuilla Valley and Terwilliger Valley groundwater basins. The contours of the 2021 data show that pumping continues to affect groundwater levels in the Cahuilla Valley groundwater basin between the town of Anza and the northern boundary of the Cahuilla Reservation. The variability and extent of the groundwater elevations in the area over time indicate that the location of the natural groundwater divide between the Cahuilla Valley and Terwilliger Valley groundwater basins has migrated over time. Data from wells that are closer to the boundary of these two groundwater basins would help clarify groundwater flow and the location of the groundwater boundary under current conditions.
Groundwater data from structurally complex areas in the Cahuilla Valley groundwater basin point to mechanisms other than recharge and discharge that affect groundwater flow, such as the San Jacinto fault zone. On a smaller scale, the data collected in the Durasno Valley were used to estimate the amount of groundwater that flows through the groundwater-bearing units in this narrow valley, which is constricted on both sides and underneath by basement rocks. Using Darcy’s Law, the geometry of the valley from the two electrical resistivity tomography profiles, groundwater levels from the monitoring wells installed near those profiles, and assumptions about the hydraulic properties of the alluvium, it was estimated that groundwater flow through the alluvium in the Durasno Valley in 2021 ranged from about 10 to 150 acre-ft/yr.
An examination of short-term trends in groundwater levels demonstrates how some parts of the basin react quickly, at least hydrologically, to local recharge and discharge stresses and the variable cycles of wet or dry climatic periods. Groundwater levels in wells that are outside the Cahuilla Valley and Terwilliger Valley groundwater basins, or in areas where the alluvium is thin, showed more pronounced responses from precipitation events than wells that are completed in the alluvium within the groundwater basin boundary. The rapid response to wells completed in the decomposed basement and competent basement likely is due to less pore space available for groundwater storage. Wells farther within the Cahuilla Valley groundwater basin perforated in the alluvium showed much less of a response to the storms in the winter and spring of 2019. Most of the recharge originates from the higher elevations and takes longer to arrive at wells in the valley, and the short-term fluctuations in groundwater levels in these wells mostly are due to pumpage cycles during the growing season. In general, the differences in how groundwater levels respond in wells may be due to several factors, including, but not limited to, the following: (1) the hydrologic properties of the aquifer to transmit water both vertically and horizontally; (2) proximity to recharge sources; (3) variation in the spatial and temporal distribution of precipitation; (4) hydraulic properties of the aquifer to store water; (5) the thickness of the alluvium or basement materials in which wells are completed; or (6) a combination of these factors. In areas where sustained historical pumpage has occurred in the alluvium, primarily for agriculture near and northeast of the town of Anza, groundwater levels have declined and generally do not show the short-term effects of local recharge from storm events or runoff.
The groundwater-level data collected between 1916 and 2021 show that changes in groundwater levels across the Cahuilla Valley groundwater basin are variable and dependent on location. Wells outside of the groundwater basins showed little or no long-term groundwater-level declines in contrast to wells within the groundwater basins. Groundwater levels in some wells that are farthest from where most of the recharge occurs had some of the largest long-term groundwater-level declines. Groundwater levels in wells that are farthest from areas where most recharge occurs do not respond rapidly to recharge events because recharge takes longer to arrive at these areas.
Areas of long-term agricultural pumpage had the largest groundwater-level declines, and the pumping has affected the movement and direction of groundwater flow. Groundwater levels in some wells have declined by about 40 feet over the period of 1971–2021, a rate of about 0.8 foot/year. Near areas of recharge, the depths to groundwater in some wells have dropped during that period because of long-term pumpage. The long-term groundwater-level data show that several factors affect groundwater flow and levels. In addition to a well’s distance from recharge sources, some quantity of recharge is captured upgradient by pumping wells, which diminishes the amount of recharge that reaches downgradient areas. The continued evaluation of these long-term data is an important part of successfully managing the basins’ groundwater resources and exploring potential management strategies in the future.
References Cited
Advanced Geosciences Inc., 2011, The SuperSting with Swift automatic resistivity and IP system instruction manual: Austin, Tex., Advanced Geosciences Inc., 93 p. [Available at https://geophysicalequipmentrental.com/files/2020/01/SuperStingManual.pdf.]
Allen, R.G., Pereira, L.S., Raes, D., and Smith, M., 1998, Crop evapotranspiration—Guidelines for computing crop water requirements: Food and Agriculture Organization of the United Nations Irrigation and Drainage Paper 56, 300 p., accessed July 22, 2021, at https://www.fao.org/3/x0490e/x0490e00.htm.
Alzraiee, A.H., Engott, J.A., Cromwell, G., and Woolfenden, L., 2022, Yucaipa Valley integrated hydrological model, chap. B in Cromwell, G., and Alzraiee, A.H., eds., Hydrology of the Yucaipa groundwater subbasin—Characterization and integrated numerical model, San Bernardino and Riverside Counties, California: U.S. Geological Survey Scientific Investigations Report 2021–5118-B, 76 p., accessed January 27, 2022, at https://doi.org/10.3133/sir20215118B.
Benson, M.A., and Dalrymple, T., 1967, General field and office procedures for indirect discharge measurements: U.S. Geological Survey Techniques of Water-Resources Investigations, book 03, chap. Al, 30 p., accessed August 29, 2018, at https://doi.org/10.3133/twri03A1.
Binley, A., and Kemna, A., 2005, DC resistivity and induced polarization methods, chap. 5 of Rubin, Y., and Hubbard, S.S., eds., Hydrogeophysics: Dordrecht, Netherlands, Springer, p. 129–156. [Available at https://doi.org/10.1007/1-4020-3102-5_5.]
California Department of Water Resources, 2012, California irrigation management system—Reference evapotranspiration zones: California Department of Water Resources report, 4 p., accessed May 14, 2020, at https://cimis.water.ca.gov/Content/PDF/CimisRefEvapZones.pdf.
California Department of Water Resources, 2020, Bulletin 118 groundwater basin boundary GIS data, ver. 6.1: California Department of Water Resources data, accessed July 23, 2021, at https://water.ca.gov/Programs/Groundwater-Management/Bulletin-118.
California Department of Water Resources, 2022, Well completion reports: California Department of Water Resources web page, accessed July 7, 2022, at https://water.ca.gov/Programs/Groundwater-Management/Wells/Well-Completion-Reports.
Climate Data, 2023, Weather by month—Weather averages Anza: Climate Data web page, accessed October 25, 2023, at https://en.climate-data.org/north-america/united-states-of-america/california/anza-124499/#climate-table.
Cunningham, W.L., and Schalk, C.W., comps., 2011, Groundwater technical procedures of the U.S. Geological Survey: U.S. Geological Survey Techniques and Methods, book 1, chap. A1, 151 p., accessed April 22, 2015, at https://doi.org/10.3133/tm1A1.
Day-Lewis, F.D., Johnson, C.D., Singha, K., and Lane, J.W., Jr., 2008, Best practices in electrical resistivity imagery—Data collection and processing, and application to data from Corinna, Maine: Washington D.C., Environmental Protection Agency, Administrative Report for Environmental Protection Agency Region 1, 227 p., accessed April 11, 2020, at https://cluin.org/programs/21m2/projects/EPA_admin_report_02Dec2008_final.pdf.
Dibblee, T.W., and Minch, J.A., 2008, Geologic map of the Hemet and Idyllwild 15 minute quadrangles, Riverside County, California: Dibblee Geological Foundation, Dibblee Foundation Map DF-371, 1 sheet, scale 1:62,500. [Available at https://www.sbnaturestore.org/collections/dibblee-geologic-maps/products/hemet-idyllwild-quadrangle-df371.]
Dieter, C.A., Maupin, M.A., Caldwell, R.R., Harris, M.A., Ivahnenko, T.I., Lovelace, J.K., Barber, N.L., and Linsey, K.S., 2018, Estimated use of water in the United States in 2015: U.S. Geological Survey Circular 1441, 65 p., accessed July 10, 2024, at https://doi.org/10.3133/cir1441. [Supersedes USGS Open-File Report 2017–1131.]
Dor, O., Rockwell, T.K., and Ben-Zion, Y., 2006, Geological observations of damage asymmetry in the structure of the San Jacinto, San Andreas, and Punchbowl Faults in southern California—A possible indicator for preferred rupture propagation direction: Pure and Applied Geophysics, v. 163, p. 301–349, accessed July 11, 2022, at https://doi.org/10.1007/s00024-005-0023-9.
Dynamic Graphics, Inc., 2021, Earthvision: Dynamic Graphics web page, accessed November 18, 2021, at https://www.dgi.com/earthvision-software-for-3d-modeling-and-visualization/.
Earthquake Track, 2024, Earthquakes in Anza, California, United States: Earthquake Track web page, accessed December 2, 2024, at https://earthquaketrack.com/us-ca-anza/recent#google_vignette.
Ely, C.P., Groover, K.D., Christensen, A.H., and Kohel, C.A., 2020, Electrical resistivity tomography in the Anza-Terwilliger Valley, Riverside County, California 2018: U.S. Geological Survey data release, https://doi.org/10.5066/P9LCEHD7.
Esri Data Development, 2023, Methodology statement—Census 2020 (revised October 2023): Redlands, Calif., Esri Technical Paper, 8 p., accessed May 6, 2024, at https://downloads.esri.com/esri_content_doc/dbl/us/2020_Census_Methodology_Statement_OCT2023_final.pdf.
Faunt, C.C., ed., 2009, Groundwater availability of the Central Valley Aquifer, California: U.S. Geological Survey Professional Paper 1766, 227 p., accessed July 23, 2021, at https://doi.org/10.3133/pp1766.
Faunt, C.C., Belitz, K., and Hanson, R.T., 2010, Development of a three-dimensional model of sedimentary texture in valley-fill deposits of Central Valley, California, USA: Hydrogeology Journal, v. 18, no. 3, p. 625–649, accessed July 23, 2021, at https://doi.org/10.1007/s10040-009-0539-7.
Faunt, C.C., Stamos, C.L., Flint, L.E., Wright, M.T., Burgess, M.K., Sneed, M., Brandt, J.T., Martin, P., and Coes, A.L., 2015, Hydrogeology, hydrologic effects of development, and simulation of groundwater flow in the Borrego Valley, San Diego County, California: U.S. Geological Survey Scientific Investigations Report 2015–5150, 135 p., accessed July 23, 2021, at https://doi.org/10.3133/sir20155150.
Fenton, N.C., Christensen, A.H., Shepherd, M.M., and Peterson, M.F., 2020, Select borehole data for Anza Valley, Anza, CA: U.S. Geological Survey data release, https://doi.org/10.5066/P93KA4IG.
Flint, L.E., and Flint, A.L., 2007, Regional analysis of groundwater recharge, chap. B of Stonestrom, D.A., Constantz, J., Ferré, T.P.A., and Leake, S.A., eds., Ground-water recharge in the arid and semiarid southwestern United States: U.S. Geological Survey Professional Paper 1703, p. 29–60, accessed July 23, 2021, at https://pubs.usgs.gov/pp/pp1703/.
Flint, L.E., Flint, A.L., Thorne, J.H., and Boynton, R., 2013, Fine-scale hydrologic modeling for regional landscape applications—The California Basin Characterization Model development and performance: Ecological Processes, v. 2, article 25, accessed July 23, 2021, at https://doi.org/10.1186/2192-1709-2-25.
Flint, L.E., and Martin, P., eds., with contributions by Brandt, J., Christensen, A.H., Flint, A.L., Flint, L.E., Hevesi, J.A., Jachens, R., Kulongoski, J.T., Martin, P., and Sneed, M., 2012, Geohydrology of Big Bear Valley, California—Phase 1—Geologic framework, recharge, and preliminary assessment of the source and age of groundwater: U.S. Geological Survey Scientific Investigations Report 2012–5100, 112 p., accessed July 23, 2021, at https://doi.org/10.3133/sir20125100.
Fraser, D.M., 1931, Geology of the San Jacinto quadrangle south of San Gorgonio Pass, California: California Division of Mines and Geology, Report of the State Mineralogist, v. 27, no. 4, p. 494–540. [Available at https://ngmdb.usgs.gov/Prodesc/proddesc_88886.htm.]
Jennings, C.W., Gutierrez, C., Bryant, W., Saucedo, G., and Wills, C., 2010, Geologic map of California: California Geological Survey, Geologic Data Map 2, 1 sheet, scale 1:750,000, accessed July 23, 2021, at https://www.conservation.ca.gov/cgs/publications/gmc.
Kjelgren, R., Beeson, R.C., Jr., Pittenger, D.P., and Montague, T., 2016, Simplified landscape irrigation demand estimation—SLIDE Rules: Applied Engineering in Agriculture, v. 32, no. 4, p. 363–378, accessed July 23, 2021, at https://doi.org/10.13031/aea.32.11307.
Landon, M.K., Morita, A.Y., Nawikas, J.M., Christensen, A.H., Faunt, C.C., and Langenheim, V.E., 2015, Aquifer geometry, lithology, and water levels in the Anza-Terwilliger Area—2013, Riverside and San Diego Counties, California: U.S. Geological Survey Scientific Investigations Report 2015–5131, 30 p., accessed July 23, 2021, at https://doi.org/10.3133/sir20155131.
Londquist, C.J., and Martin, P., 1991, Geohydrology and ground-water-flow simulation of the Surprise Spring basin aquifer system, San Bernardino County, California: U.S. Geological Survey Water-Resources Investigations Report 89–4099, 41 p., accessed July 23, 2021, at https://doi.org/10.3133/wri894099.
Manson, S., Schroeder, J., Van Riper, D., and Ruggles, S., 2019, IPUMS National Historical Geographic Information System—Version 14.0 [dataset]: Minneapolis, Minn., IPUMS database, accessed August 20, 2023, at https://doi.org/10.18128/D050.V14.0.
Milsom, J., and Eriksen, A., 2011, Field geophysics (4th ed.): Chichester, United Kingdom, John Wiley & Sons, Ltd., accessed April 5, 2020, at https://doi.org/10.1002/9780470972311.
Minsley, B.J., Ball, L.B., Burton, B.L., Caine, J.S., Curry-Elrod, E., and Manning, A.H., 2010, Geophysical characterization of subsurface properties relevant to the hydrology of the Standard Mine in Elk Basin, Colorado: U.S. Geological Survey Open-File Report 2009–1284, 46 p., accessed July 23, 2021, at https://doi.org/10.3133/ofr20091284.
Moyle, W.R., Jr., 1976, Geohydrology of the Anza-Terwilliger area, Riverside County, California: U.S. Geological Survey Water-Resources Investigations [Report] 76–10, 25 p., accessed July 23, 2021, at https://doi.org/10.3133/wri7610.
Oldenburg, D.W., and Li, Y., 1994, Inversion of induced polarization data: Geophysics, v. 59, no. 9, p. 1327–1341, accessed July 23, 2021, at https://doi.org/10.1190/1.1443692.
Onderdonk, N., McGill, S., and Rockwell, T., 2018, A 3700 yr paleoseismic record from the northern San Jacinto fault and implications for joint rupture of the San Jacinto and San Andreas faults: Geosphere, v. 14, no. 6, p. 2447–2468, accessed July 23, 2021, at https://doi.org/10.1130/GES01687.1.
Pereira, L.S., and Alves, I., 2005, Crop water requirements, in Hillel, D., ed., Encyclopedia of soils in the environment: Oxford, Elsevier, p. 322–334, accessed July 23, 2021, at https://doi.org/10.1016/B0-12-348530-4/00255-1.
Pereira, L.S., and Alves, I., 2013, Crop water requirements: Reference Module in Earth Systems and Environmental Sciences, p. 322–334, accessed July 23, 2021, at https://www.sciencedirect.com/science/article/pii/B9780124095489051290.
RockWare, 2021, Rockworks: RockWare web page, accessed June 23, 2021, at https://www.rockware.com/product/rockworks/.
Rogers, T.H., 1965, Geologic map of California—Santa Ana sheet: California Division of Mines and Geology, U.S. Geological Survey, and Association of American State Geologists, scale 1:250,000, accessed May 23, 2022, at https://ngmdb.usgs.gov/Prodesc/proddesc_452.htm.
Sanders, C.O., and Kanamori, H., 1984, A seismotectonic analysis of the Anza seismic gap, San Jacinto fault zone, southern California: Journal of Geophysical Research, v. 89, no. B7, p. 5873–5890, accessed July 23, 2021, at https://doi.org/10.1029/JB089iB07p05873.
Santa Margarita River Watershed Watermaster, 2024a, 2 - Court interlocutory judgements: Santa Margarita River Watershed Watermaster website, accessed June 24, 2024, at https://smrwm.org/documents/2-court-interlocutory-judgments/.
Santa Margarita River Watershed Watermaster, 2024b, Santa Margarita River Watershed Watermaster annual reports, Santa Margarita River Watershed Watermaster web page, accessed May 2, 2024, at https://smrwm.org/santa-margarita-river-watershed-watermaster/smrwm-annual-reports/.
Shepherd, M.M., Cromwell, G., and Ogle, S.E., and Rosenberg, C., 2022, Hydrogeologic data from the Cahuilla Valley and Terwilliger Valley groundwater basins, Riverside County, California, 2022 (ver. 2.0, August 2025): U.S. Geological Survey data release, https://doi.org/10.5066/P9DJLSOV.
Shuter, E., and Teasdale, W.E., 1989, Application of drilling, coring, and sampling techniques to test holes and wells: U.S. Geological Survey Techniques of Water-Resources Investigations, book 2, chap. F1, 97 p., accessed May 12, 2023, at https://doi.org/10.3133/twri02F1.
Southern California Association of Governments, 2005, Land use data (1990, 1993, 2001, 2005), Los Angeles, CA: Southern California Association of Governments database, accessed July 23, 2021, at https://gisdata.scag.ca.gov/Lists/GISData/DispForm.aspx?ID=22.
Southern California Association of Governments, 2019, Land use combined Riverside, Los Angeles, CA: Southern California Association of Governments database, accessed July 21, 2021, at https://gisdata-scag.opendata.arcgis.com/search?collection=Dataset.
Stamos, C.L., Martin, P., Nishikawa, T., and Cox, B.F., 2001, Simulation of ground-water flow in the Mojave River Basin, California (ver. 3): U.S. Geological Survey Water-Resources Investigations Report 01–4002, 129 p., 2 app., accessed January 16, 2018, at https://doi.org/10.3133/wri014002.
Stern, M.A., Flint, L.E., Flint, A.L., and Christensen, A.H., 2021, A basin-scale approach to estimating recharge in the desert—Anza-Cahuilla Groundwater Basin: Journal of the American Water Resources Association, v. 57, no. 6, p. 990–1003, accessed June 5, 2023, at https://doi.org/10.1111/1752-1688.12971.
Swift, A., and Sabourin, K., 2000, Historical California vegetation (1934): U.S. Forest Service Remote Sensing Lab, Sacramento, California, accessed July 23, 2021, at https://www.sacramentoriver.org/forum/index.php?id=gismy&rec_id=346.
Telford, W.M., Geldart, L.P., and Sheriff, R.E., 1990, Applied geophysics (2d ed.): Cambridge, Cambridge University Press, 792 p. [Available at https://doi.org/10.1017/CBO9781139167932.]
Umari, A.M.J., Martin, P.M., Schroeder, R.A., Duell, L.F.W., Jr., and Fay, R.G., 1995, Potential for ground-water contamination from movement of wastewater through the unsaturated zone, upper Mojave River Basin, California: U.S. Geological Survey Water-Resources Investigations Report 93–4137, 83 p., accessed March 17, 2020, at https://doi.org/10.3133/wri934137.
UNAVCO Community, 2005, PBO GPS Network—P583-KramerJnctCS2005 P.S.: The NSF GAGE Facility operated by UNAVCO, Inc., GPS/GNSS observations dataset, accessed July 30, 2025, at https://doi.org/10.7283/T55B00CR.
U.S. Bureau of Indian Affairs, 2023, Mapped lands in Indian Country: U.S. Bureau of Indian Affairs, Branch of Geospatial Support—Office of Trust Services interactive map, accessed May 1, 2023, at https://biamaps.geoplatform.gov/biatracts/.
U.S. Bureau of Reclamation, 1996, veg1945wie—Vegetation types of California (1945) by Wieslander: U.S. Bureau of Reclamation MPGIS Service Center digital database, accessed July 23, 2021, at, https://gisarchive.cnra.ca.gov/iso/ImageryBaseMapsLandCover/LandCover/Wieslander_Vegetation/2001-05-24/veg1945wie.zip.
U.S. District Court Southern District of California, 2021, Civil No. 51-CV-1247-GPC-RBB: U.S. District Courts—Southern District of California web page, accessed July 19, 2021, at https://www.casd.uscourts.gov/casesofinterest/USA-vs-Fallbrook-Public-Utility.aspx.
U.S. Geological Survey, 1990, Land use and land cover digital data from 1:250,000- and 1:100,000-scale maps: U.S. Geological Survey, Water Resources Division, Data Users Guide 4, accessed July 23, 2021, at https://doi.org/10.3133/70038386.
U.S. Geological Survey, 2019, USGS 13 arc-second n34w117 1 x 1 degree: U.S. Geological Survey data, accessed July 26, 2021, at https://www.sciencebase.gov/catalog/item/5f77841f82ce1d74e7d6c3c4.
U.S. Geological Survey, 2021, USGS water data for the Nation: U.S. Geological Survey National Water Information System database, accessed September 8, 2021, at https://doi.org/10.5066/F7P55KJN.
U.S. Geological Survey, 2022, National Geospatial Program, 20221206, USGS National Hydrography Dataset Best Resolution (NHD)—California (published 20221206) FileGDB: U.S. Geological Survey digital data, accessed December 28, 2022, at https://www.sciencebase.gov/catalog/item/61f8b8d2d34e622189c32902.
U.S. Geological Survey, 2023, U.S. Geological Survey GeoLog Locator: USGS GeoLog Locator interactive map application, accessed May 12, 2023, at https://webapps.usgs.gov/GeoLogLocator/#!/.
U.S. Geological Survey and Association of American State Geologists, 2025, National geologic map database, accessed February 19, 2025, at https://ngmdb.usgs.gov/Geolex/search.
U.S. Geological Survey and California Geological Survey, 2019, Quaternary fault and fold database of the United States: U.S. Geological Survey Earthquake Hazards Program database, accessed October 21, 2019, at https://www.usgs.gov/natural-hazards/earthquake-hazards/faults.
Waring, G.A., 1919, Ground water in the San Jacinto and Temecula basins, California: U.S. Geological Survey Water-Supply Paper 429, 113 p., accessed July 23, 2021, at https://doi.org/10.3133/wsp429.
Western Regional Climate Center, 2020a, Anza, California, National Climatic Data Center 1981–2010 monthly normal, Western Regional Climate Center web page, accessed July 23, 2021, at https://wrcc.dri.edu/cgi-bin/cliMAIN.pl?ca0235.
Western Regional Climate Center, 2020b, Idyllwild, California, National Climatic Data Center 1981–2010 monthly normal, Western Regional Climate Center web page, accessed July 23, 2021, at https://wrcc.dri.edu/cgi-bin/cliMAIN.pl?ca4211.
Woolfenden, L.R., and Bright, D.J., 1988, Ground-water conditions in the Anza-Terwilliger area, with emphasis on the Cahuilla Indian Reservation, Riverside County, California, 1973–86: U.S. Geological Survey Water-Resources Investigations Report 88–4029, 79 p., accessed July 23, 2021, at https://doi.org/10.3133/wri884029.
Conversion Factors
U.S. customary units to International System of Units
Temperature in degrees Fahrenheit (°F) may be converted to degrees Celsius (°C) as follows:
°C = (°F − 32) / 1.8.
Datums
Vertical coordinate information is referenced to the North American Vertical Datum of 1988 (NAVD 88) unless otherwise stated when information is sourced from historical publications. Horizontal coordinate information is referenced to the North American Datum of 1983 (NAD 83).
Elevation, as used in this report, refers to distance above the vertical datum. Measurements of the distance above or below the elevation datum are referred to as altitude and are referred to as above land surface or below land surface (bls).
Well-Numbering System
Wells are identified and numbered according to their location in the rectangular system for the subdivision of public lands. Identification consists of the township number, north or south; the range number, east or west; and the section number. Each section is divided into sixteen 40-acre tracts lettered consecutively (except I and O), beginning with “A” in the northeast corner of the section and progressing in a sinusoidal manner to “R” in the southeast corner. Within the 40-acre tract, wells are sequentially numbered in the order they are inventoried. The final letter refers to the base line and meridian. In California, there are three base lines and meridians: Humboldt (H), Mount Diablo (M), and San Bernardino (S). All wells in the study area are referenced to the San Bernardino baseline and meridian (S). Well numbers consist of 15 characters and follow the format 007S003E29M002S. In this report, well numbers are abbreviated and written 7S/3E-29M2. Wells that are not included in the U.S. Geological Survey (USGS) National Water Information System database are identified using the naming convention used in the original referenced report or non-USGS database.
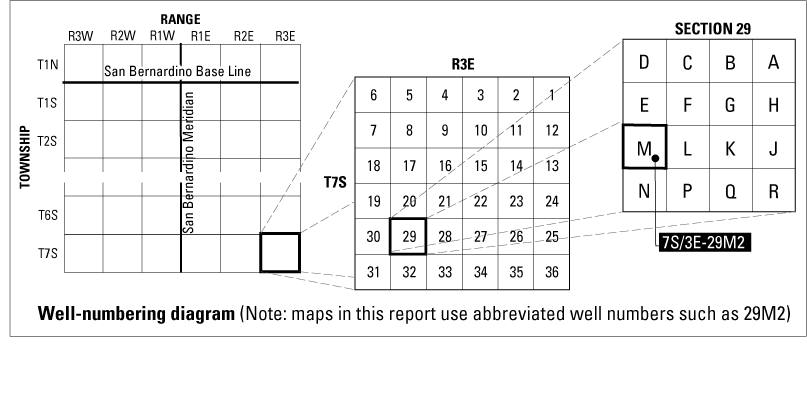
Abbreviations
BCM
Basin Characterization Model
bls
Below land surface
CA-BCM
Basin Characterization Model for California
CIMIS
California Irrigation Management Information System
DEM
digital elevation model
DWR
California Department of Water Resources
ERT
electrical resistivity tomography
ET
evapotranspiration
Eto
reference evapotranspiration
GFM
geologic framework model
Kc
crop coefficient
mA
milliamp
NHD
National Hydrography Dataset
NWIS
National Water Information System
ohm-m
ohm-meters
PET
potential evapotranspiration
USGS
U.S. Geological Survey
For more information concerning the research in this report, contact the
Director, California Water Science Center
U.S. Geological Survey
6000 J Street, Placer Hall
Sacramento, California 95819
https://www.usgs.gov/centers/california-water-science-center
Publishing support provided by the USGS Science Publishing Network,
Sacramento Publishing Service Center
Disclaimers
Any use of trade, firm, or product names is for descriptive purposes only and does not imply endorsement by the U.S. Government.
Although this information product, for the most part, is in the public domain, it also may contain copyrighted materials as noted in the text. Permission to reproduce copyrighted items must be secured from the copyright owner.
Suggested Citation
Stamos, C.L., Christensen, A.H., Cromwell, G., Dick, M.C., Ely, C.P., Jachens, E.R., Ogle, S.E., and Shepherd, M.M., 2025, Hydrogeologic characterization of the Cahuilla Valley and Terwilliger Valley Groundwater Basins, Riverside County, California: U.S. Geological Survey Scientific Investigations Report 2025–5073, 65 p., https://doi.org/10.3133/sir20255073.
ISSN: 2328-0328 (online)
Study Area
| Publication type | Report |
|---|---|
| Publication Subtype | USGS Numbered Series |
| Title | Hydrogeologic characterization of the Cahuilla Valley and Terwilliger Valley Groundwater Basins, Riverside County, California |
| Series title | Scientific Investigations Report |
| Series number | 2025-5073 |
| DOI | 10.3133/sir20255073 |
| Publication Date | December 19, 2025 |
| Year Published | 2025 |
| Language | English |
| Publisher | U.S. Geological Survey |
| Publisher location | Reston, VA |
| Contributing office(s) | California Water Science Center |
| Description | Report: ix, 65 p., 3 Data Releases |
| Country | United States |
| State | California |
| Other Geospatial | Cahuilla Valley and Terwilliger Valley groundwater basins |
| Online Only (Y/N) | Y |