

Using Satellite Imagery and Soil Data To Understand Occurrences and Migration of Soil Conditions Harmful to Archaeological Sites on Jamestown Island, Virginia
Links
- Document: Report (4.19 MB pdf) , HTML , XML
- Data Release: USGS data release - Satellite imagery products from 2010, 2011, 2018 and soil data from 2021–22 on Jamestown Island, Va.
- Version History: Version History (632 B txt)
- NGMDB Index Page: National Geologic Map Database Index Page
- Download citation as: RIS | Dublin Core
Abstract
Many know Jamestown Island, Virginia, hereafter referred to as “the Island,” located near the mouth of the James River into the Chesapeake Bay, as the home of the first permanent English settlement in North America. However, the Island is home to 15,000 years’ worth of cultural artifacts and archaeological sites. In addition to its rich history, the Island is home to a variety of native plants and animals, including many rare, threatened, and endangered species. Preserving historical and natural resources is part of Colonial National Historic Park’s (COLO) enabling legislation. To this end, COLO has been seeking data to inform management decisions on how to prioritize resources to preserve archaeological sites and anticipate changes to natural systems from sea-level rise and other effects of climate change. The U.S. Geological Survey (USGS), in partnership with COLO, collected and analyzed data to help determine soil conditions detrimental to archaeological sites across the Island using a combination of soil samples and assessments of vegetative health as a proxy for soil conditions. This study combined normalized difference vegetative index raster grids spanning 8 years, 2010 to 2018, and soil data from 50 sites sampled in dry (June 2021) and wet months (March 2022) at two different soil horizons to investigate potential hazards to plant health and corrosive conditions in the unsaturated subsurface. The data suggest that access to the James River drives soil pH and soil conductivity. Areas of the Island that are subject to frequent inundation were observed to have both higher soil conductivity (as high as 4,845 microsiemens per centimeter [mS/m]) and lower pH (as low as 3.84). Higher soil conductivity, or salinity, and more acidity create corrosive environment, which can destroy buried artifacts and are detrimental to vegetative health. These conditions were not limited to the edges of the Island, like Black Point. Inland locations, such as the Pitch and Tar Swamp, were observed to have some of the highest conductivity values, which were likely caused by from a combination of inflow of James River water along Back Creek into the Pitch and Tar Swamp and proximity to the Visitor Center and other high-traffic areas of the Island. A difference of normalized difference vegetative index values from 2010 to 2018 raster grid appears to support this, showing an apparent loss of vegetative health in marsh grass in the Pitch and Tar Swamp. These data may inform COLO about areas of the Island that are currently most threatened by corrosive conditions and how those conditions are likely to migrate in the future.
Introduction
Colonial National Historical Park’s (COLO) enabling legislation designated the National Park Service (NPS) as responsible for protecting and preserving its rich reserve of archaeological resources (16 U.S.C. 431, et seq.). This legislation recognized the importance of Jamestown Island, Virginia, in interpreting the earliest history of our Nation, which began with the first permanent English settlement in North America on Jamestown Island in 1607. Jamestown Island (fig. 1) is within the Atlantic Coastal Plain of southeastern Virginia adjacent to the peninsula between the lower tidal York River and the James River, 31 miles from its mouth into Chesapeake Bay. Decades of archaeological- and natural-resource inventories have revealed the historical influence of human presence spanning from the Paleoindian period (15,000–7000 B.C.) through the 20th century.
Human activity over the last 400 or more years drastically altered the ecology of the Island as timber was harvested and wetlands were drained to create land more suitable for residences, agriculture, commerce, and government. Under NPS management, much of the Island has recovered from wetland draining and timber harvesting. Ecological resources on Jamestown Island include diverse, forested uplands, nutrient-rich wetlands, and lowland tidal, freshwater, and oligohaline marshes. These ecosystems provide habitat for native plants and animals, several of which are classified as rare, threatened, or endangered species by State and Federal agencies (NPS, 2015). Aeschynomene virginica (Britton, Sterns & Poggenb; sensitive joint-vetch) is an intertidal annual plant classified as “threatened” by the Federal Government (Chazal and Van Alstine, 2001). Steinchisma hians (Nash; gaping grass) and Problema bulenta (Boisduval and Le Conte, 1837; rare skipper) are species considered rare by the Government of Virginia (Lookingbill and others, 2012); they are present in marshes around the Island. Twenty-six species of amphibians and 30 species of reptiles have been documented on Jamestown Island. The Island is also a designated birding hotspot, boasting nine active Haliaeetus leucocephalus (Linnaeus, 1766; American bald eagle) nests that have produced eaglets. However, many species of birds on the Island have been identified as species of concern.
COLO is one of 25 U.S. national parks classified by the NPS as being “at great risk” of the effects of climate change (Saunders and others, 2009). Sea-level rise is the primary threat to COLO. During the 20th and 21st centuries, sea-level rise averaged 1.51 feet (ft) per century at the National Oceanic Atmospheric Administration (NOAA) tide station 8638610 (Sewells Point, Virginia; NOAA, 2025) at the mouth of the James River (Ezer and Atkinson, 2015), more than 2.5 times the 0.59 ft per century global average (U.S. Climate Change Science Program and the Subcommittee on Global Change Research, 2009). Although the rate has accelerated in the decade preceding this report, it is uncertain if this is a long-term change or part of the variability throughout the record. The higher-than-average rate of sea-level rise results from global-scale thermal expansion and land-ice melting combined with other factors that primarily include land subsidence from large groundwater withdrawals in southeastern Virginia (Eggleston and Pope, 2013).
The threat to Jamestown Island is particularly critical because of the Island’s low land-surface elevation and gently sloping topography. Sea-level rise erodes shorelines, raises groundwater levels to saturate the soil, increases the frequency and depth of inundation, increases the salinity of surface water and groundwater, and creates groundwater chemistry detrimental to artifacts and vegetation (Passeri and others, 2015). A 2015 assessment of parkwide vulnerability to sea-level rise predicted that as much as 50 percent of the Island, which consists primarily of wetlands, will become inundated by 2050, and nearly two-thirds will be inundated by 2100 (Ricci and others, 2019). Based on records from a tide gage operated by the U.S. Geological Survey (USGS) since August 2015 near the Jamestown Island ferry pier (USGS site 02042770; USGS, 2025), tides average 0.5 ft above the North American Vertical Datum of 1988 (NAVD 88) with about a quarter of the daily high tides greater than 2.0 ft above the NAVD 88. The highest recorded tide from 2015 through 2019 was 5.16 ft above NAVD 88 on October 4, 2015. Rising sea levels, tides, and storm surges stress, damage, or destroy many of the ecological and archaeological resources of the Island (McCoy and others, 2021), all of which are specifically designated within the COLO enabling legislation (16 U.S.C. 431, et seq.).
Many ecological changes have been identified across the Island. On upland ridges in the southern part of the Island, for example, mature loblolly pine (Pinus taeda L.) trees used by American bald eagles (Haliaeetus leucocephalus) for nest sites (NPS, 2019) are dying, thereby reducing this habitat. As another example, pine and hardwood trees have been dying as the adjacent marsh advances into low-elevation, upland forests at Black Point on the eastern end of the Island. Locations of standing dead trees indicate that the marsh has encroached at least 40 ft into the former forest, as indicated by comparing a 2008 vegetation map to existing conditions (Patterson, 2008).
A report published in 2000 (Blanton and others, 2000) identified 61 archaeological sites as imminently threatened by predicted effects of sea-level rise, with 31 of those sites severely threatened. For example, the unsaturated flow of saline groundwater from the water table to the land surface deteriorated the original kiln-stone foundation of the glasshouse, just northwest of the Island (Johnson and Hobbs, 2001).
Although inundation of the land, rising groundwater levels, intrusion of saline water, and expanding marshes are threats, ecosystems and artifacts are also threatened by biogeochemical reactions caused by changing oxidation states on high sulfate concentrations in the intruding saline water (Lowery and others, 2012). Iron oxide minerals in rocks and sulfate in saline water are chemically reduced to form pyrite (iron sulfide) as the water becomes anoxic when flowing through marsh and other sediment. This reaction alters the composition and appearance of the surface and interior of lithic artifacts. When oxygen is reintroduced by any of several processes, the pyrite oxidizes back to iron oxides and sulfate. Two resulting chemical forms of sulfate damage or destroy ecological resources and archaeological artifacts: sulfuric acid and sulfate-mineral crystals. The former can damage or destroy metallic and other artifacts, such as historic building foundations. The latter forms and hydrates within lithic and other porous artifacts, producing larger minerals than the iron sulfide minerals they replace. This mineral production exerts internal pressure that causes the artifacts to crumble (Lowery and others, 2012).
Groundwater beneath the uplands at Black Point (fig. 1) provides evidence of these reduction reactions. The water table does not contain freshwater and is moderately saline and quite acidic, with a pH as low as 3.1 units, creating a “salinity inversion” in the shallow groundwater (McCoy and others, 2021). For vegetation to acquire the water needed for evapotranspiration, water flows from the water table through unsaturated soil to the tree roots in shallow soil, wherein artifacts are also located (Sánchez-Pérez and others, 2008). This can damage and destroy artifacts, stress trees, and cause tree mortality. Similarly, saline but less acidic water is at the water table beneath the forest or marsh edge at the Island House. Consequently, the absence of freshwater and the presence of acidic and (or) saline water at the water table combined with unsaturated flow caused by evapotranspiration pose an immediate risk to ecological and archaeological resources from sea-level rise. As archaeological sites are damaged or destroyed by different processes, interpretations of the sites to the larger archaeological context of the Island and their importance to previous inhabitants are lost.
In 2016, a team assembled by Region 1 of the NPS and COLO staff developed a protocol for integrating the assessment of risk from sea-level rise to ecological and archaeological resources and infrastructure and applied it across all of COLO (Ricci and others, 2019). From this assessment, COLO was identified as a park at great risk. In the 2018 follow-up, NPS staff and others developed a protocol to evaluate and rank the vulnerability and historic significance of individual archaeological sites outside of New Town. Soil saturation, inundation, erosion, soil chemistry, and site loss data were extrapolated from groundwater monitoring, tidal data, and other sources to assess vulnerability. The purpose of these assessments and rankings was to identify and prioritize management options to preserve the archeological sites around Jamestown Island. The collection of additional soil data and measures of vegetative health can provide greater resolution and confidence in the rankings of these assessments (Caldwell, 2024).
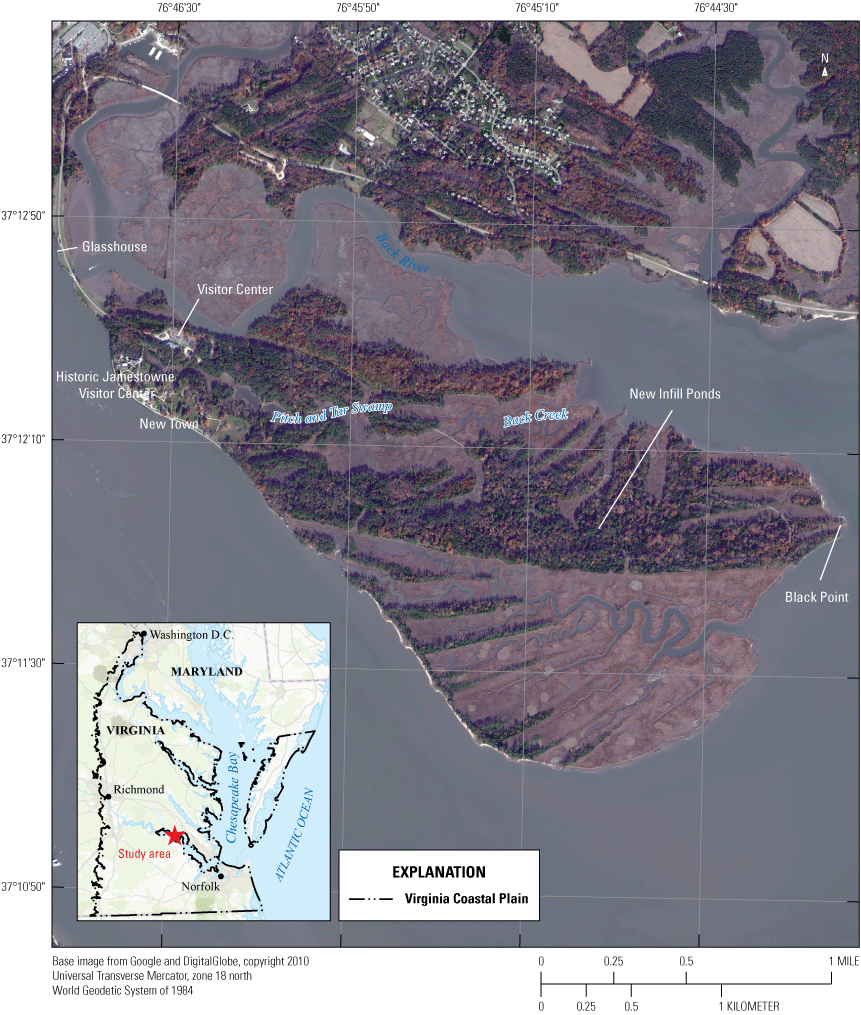
Map of Jamestown Island with labels on important areas of the Island.
Purpose and Scope
As many of the archaeological sites on Jamestown Island have been threatened, damaged, or destroyed by sea-level rise and the consequential changes to physical and chemical processes, COLO sought to understand where soil conditions that degrade artifacts occur and how these conditions might migrate on the Island. As such, COLO asked the USGS to evaluate vegetative health and soil conditions around Jamestown Island to further understand the extent and severity of conditions that threaten archaeological sites and vegetation, as well as to explore possible pathways through which these conditions may preferentially migrate. Data and results from this effort would then be used by COLO to prioritize resources to preserve threatened cultural sites.
The processes that threaten archaeological sites on the Island are the same as those that threaten and stress vegetation around the Island, namely increased acidity and salinity of the soil. The distribution of acidic and (or) saline water at the water table is a risk to all resources and the distribution of these conditions is unknown. The role of evapotranspiration in transporting this water from the water table to roots and artifacts in shallow soil indicates that a protocol for testing the pH and salinity of shallow soil can provide an inexpensive and effective tool for risk assessment for ecological and archaeological resources that can support effective management of all resources. Spatially discrete soil data informed by spatially continuous satellite data can be used to evaluate vegetative health and pathways for salinity, acidity, and therefore, the corrosive potential of the unsaturated subsurface of Jamestown Island. The USGS used normalized difference vegetative index (NDVI) maps, which are used to measure vegetative health by measuring the relative quantities of chlorophyll in vegetation, derived from commercially available satellite data and soil samples from around Jamestown Island to define vegetative stress. Orthomosaic imagery was used to contextualize and map the chemical conditions on the Island.
Study Area Description
Jamestown Island is low-lying, with maximum elevations not exceeding 16.5 ft above the North American Vertical Datum of 1988, and two-thirds of the Island does not exceed 5 ft above NAVD 88. The Island is covered mostly by coastal forest uplands and fresh-to-brackish, lowland marshes. A single road forms a “short” and “long” loop that provides tourist access to the center of the Island. A relatively small area on the western edge of the Island is dedicated to the Visitor Center for the Island, and Old Jamestown. Black Point (fig. 1) is the easternmost and most downstream point on the Island.
Methods
Two methods were used to investigate possible stressors to vegetative health on the Island: NDVI and orthomosaic maps derived from multispectral and pan-sharpened commercial satellite imagery, respectively, and discrete sampling of field parameters in the soil of 50 sites. This combination of spatially continuous and discrete data was used to investigate sources of vegetative stress and to correlate potential stressors by commonalities between sites, such as lowland versus upland.
Satellite Imagery
The satellite imagery used to derive the NDVI and pan-sharpened orthomosaics was acquired using the USGS Commercial Remote Sensing Space Policy’s Imagery-Derived Requirements Tool (USGS, 2021). The Data Acquisition Request parameters were set to search for collections of both multispectral and panchromatic satellite imagery of Jamestown Island, processed to level 2A (standard), from May 1, 2008, to July 8, 2022, with a cloud cover of up to 20 percent and a resolution of 1–4 meters (m). This search on USGS Commercial Remote Sensing Space Policy’s Imagery-Derived Requirements Tool returned scenes, or satellite images, from four dates:
-
• November 28, 2010, at 16:24 by the WorldView 2 satellite;
-
• June 25, 2011, at 15:56 by the GeoEye satellite;
-
• October 10, 2011, at 15:46 by the QuickBird 2 satellite; and
-
• December 12, 2018, at 16:08 by the WorldView 3 satellite.
The multispectral images were pan-sharpened to increase the resolution for visual light rasters of the study area. The ground sample distances for the pan-sharpened satellite imagery ranged from 1.017 ft in the WorldView 3 satellite data to 2.001 ft in the QuickBird 2 data (table 1). Pan-sharpening generally resulted in a threefold increase in resolution. Pan-sharpening was completed using “Pan-Sharpen” tool in ArcMap version 10.4 (Esri, Inc., Redlands, California). The Graham-Schmidt method (Laben and Brower, 2000) was used to process the pan-sharpening using the ArcMap’s default band weights for the satellite used in each image.
Table 1.
Summary of satellite imagery details at Jamestown Island.[Data are from Caldwell (2024). GSD, ground sample distances; ft, feet; nm, nanometer; NA, not applicable; NIR, near infrared]
NDVI raster grids were created for each of the four images using the NDVI tool in ArcMap. The native resolution of the multispectral images was used because of the possibility of spectral distortion introduced by pan-sharpening (Li and others, 2017). The spectral bandwidths for all four satellites were similar with a variation in bandwidth sizes within 25 nanometers of each comparable bandwidth. For images with multiple near infrared bands (WorldView 2 and 3 multispectral satellite imagery), the near infrared 1 band was used for NDVI calculations (table 1). One difference of NDVIs raster grid was created using the “Raster Calculator” tool in ArcGIS Pro. This was created by subtracting the values from the NDVI created from the November 28, 2010, at 16:24 by WorldView 2 image from the values of the NDVI created from the December 12, 2018, at 16:08 by the WorldView 3 image. All commercial satellite imagery used in this report is proprietary and therefore not available in the associated USGS data release; however, all satellite imagery products derived from those images, such as pan-sharpened images or NDVI maps, are available (Caldwell, 2024).
Soil Data
Analyses of soil conditions were conducted through two separate field efforts. The first was in June 2021, which represented a drier month on Jamestown Island. The second was in March 2022, which represented a wetter month. Soils were sampled at two depths representing two different soil horizons: (1) just below land surface in the O soil horizon, and (2) about 0.5 ft below land surface in the A horizon at 50 sites. The deeper sample was obtained using a 2-inch diameter hand auger. Sample sites were selected to cover the spatial extent of the Island and to represent transitions from upland to lowland sites. Soil sample site selection was informed by the NDVI data to ensure transects of soil sites would cover topographical changes as well as changes in vegetative type and health. Soil samples were measured for soil conductivity (in millisiemens per meter [mS/m]), soil moisture (percent), soil temperature (in degrees Celsius), and soil pH. Soil conductivity, moisture, and temperature were measured using a Dynamax WET 2 sensor, which operates using time-domain reflectometry (Whalley, 1993). Soil pH was measured using U.S. Environmental Protection Agency (2004) method 9045D. Soil samples used in the pH measurements were taken from soil removed by the hand auger and analyzed in a controlled laboratory environment. The Dynamax WET 2 sensor requires a minimum percentage of soil moisture to obtain conductivity data. Some samples lack conductivity data owing to a lack of soil moisture, particularly those from June 2021. Additionally, some soil sample sites were unreachable or flooded during the two field efforts given the low topography because many can only be accessed by kayak. The soil data are available in a USGS data release (Caldwell, 2024).
Results
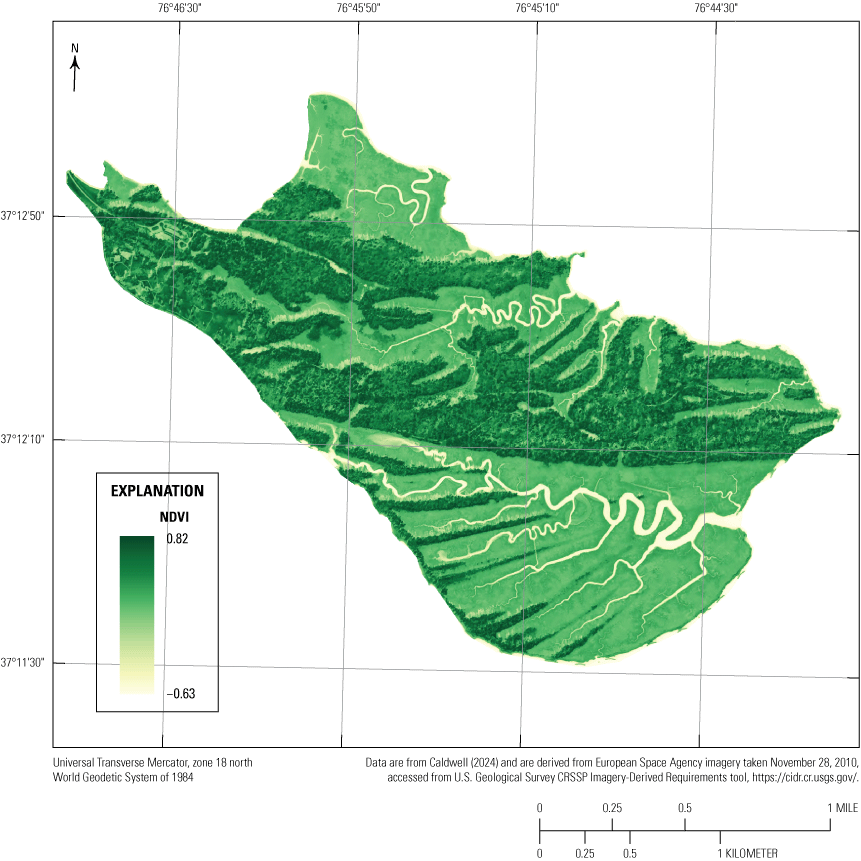
The four NDVI raster grids across 8 years and the 190 soil data points were analyzed to evaluate the state of subsurface conditions around the Island and how those conditions might migrate. Differences between June 2021 and March 2022 in soil data provided insight as to which parameters are controlled by fluctuations in the James River’s level, which is a large influence on the water table around Jamestown Island. Individual NDVI raster grids can provide information about vegetative stress in a given year. A suite of NDVI maps from different years, however, can be evaluated for forest retreat, marsh migration, and the evolution of vegetative stress in areas across the Island, thereby allowing for the observation of changes in subsurface conditions by proxy. However, this effort was greatly hindered owing to the small number of satellite scenes available from the search, combined with a wide variety of variables that affect NDVI results for which the scenes obtained were not able to control.
Satellite Imagery
The NDVI raster grids (figs. 2, 3, 4, and 5) were originally intended to be evaluated as a time series to document change over time for vegetation on the Island. However, this analysis was prevented by a lack of data, and lack of comparable images. Two of the four dates for which satellite data were available were in the fall months (October, November; figs. 3 and 4), one in winter (December; fig. 5), and the final in summer (June; fig. 2). These differing months have many different states of plant health, which limits the images’ utility for analysis of vegetative health given the mix of coastal pines, deciduous trees, and marsh grasses on the Island. This difference in vegetative health is particularly noticeable in the satellite image taken in June (fig. 2), which shows much healthier vegetation compared to the other three images. This is particularly noticeable in the marsh grass-dominated areas of the Island. However, determining any change in vegetation across the four images and the 8-year span they cover is difficult owing to the different seasons, months, and tidal conditions of each image. Given the amount of deciduous vegetation on the Island, it would be irresponsible to compare vegetation in winter to that in summer due to the loss of chlorophyll laden leaves. Comparing stress across winter and fall months is difficult at best. A canopy that already appears stressed or unhealthy on an NDVI raster when the deciduous foliage change color in the fall may appear even more so in winter owing to a lack of leaf cover, and therefore chlorophyll for a NDVI raster to highlight. Additionally, many of the images have tree shadows along the edges of the forested areas of the Island, further complicating the interpretation of NDVI raster grids. These shadows are most obvious in figure 6 at the green areas adjacent to the marshland along the north and northeastern edges of the forested parts of the island. The shadows are also present in figures 2, 3, and 5; however, the tree shadows present within the forested areas of the Island correspond with holes in the canopy of the forest, which are likely co-located with treefalls on the Island.
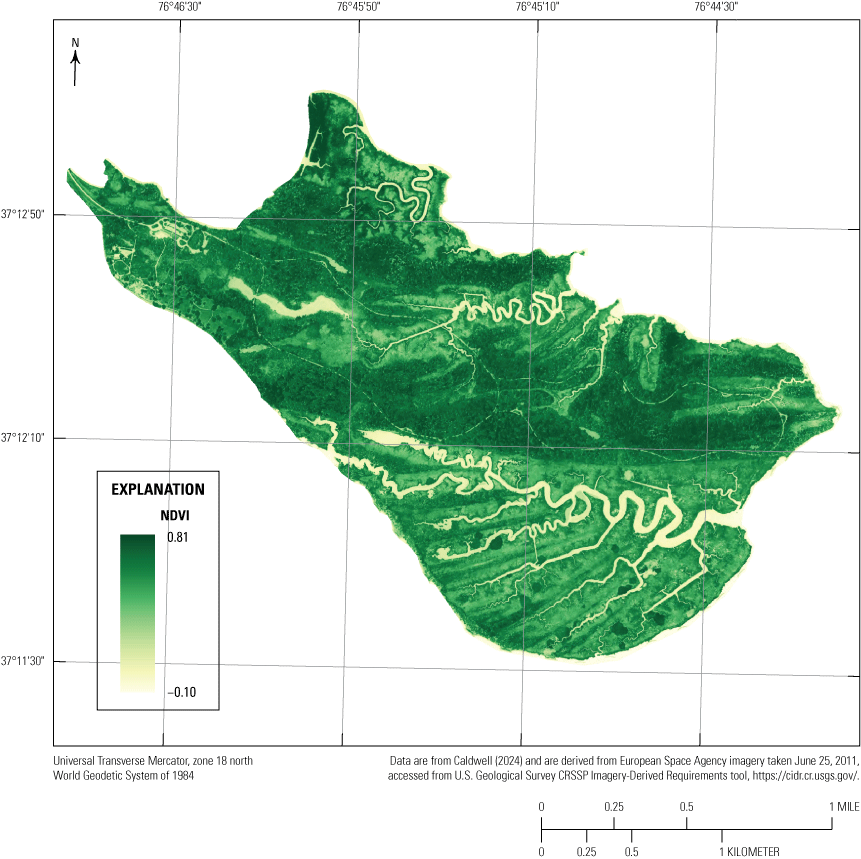
Normalized difference vegetative index (NDVI) raster grid of Jamestown Island from GeoEye satellite imagery on June 25, 2011.
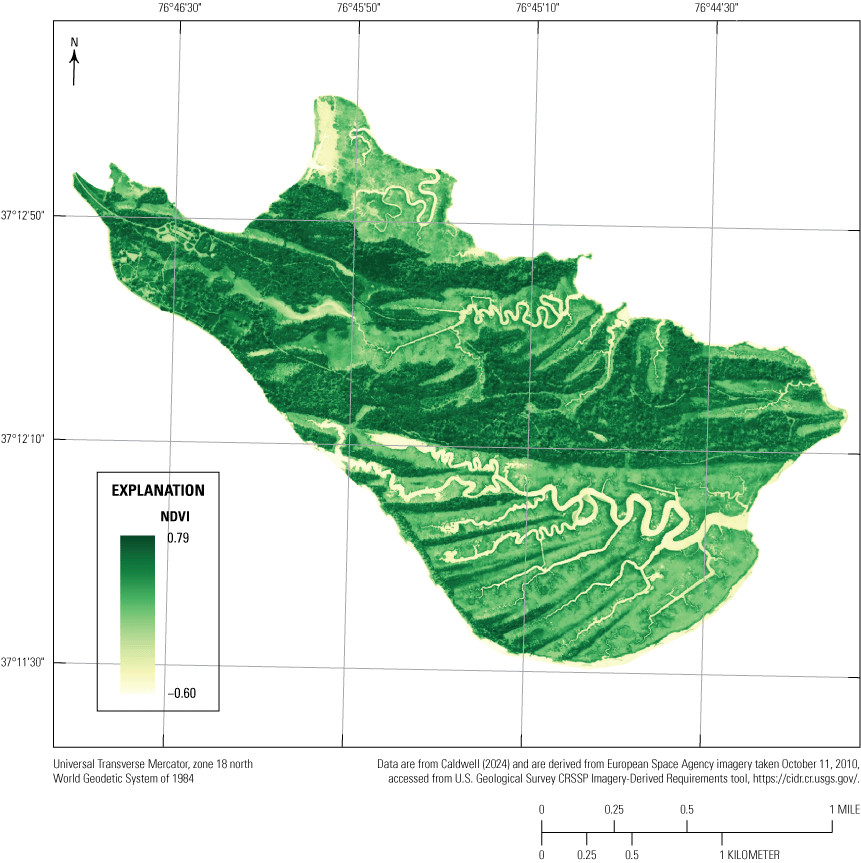
Northern difference vegetative index (NDVI) raster grid of Jamestown Island from QuickBird 2 satellite imagery on October 11, 2010.
Normalized difference vegetative index (NDVI) raster grid of Jamestown Island from WorldView 2 satellite imagery on November 28, 2010.
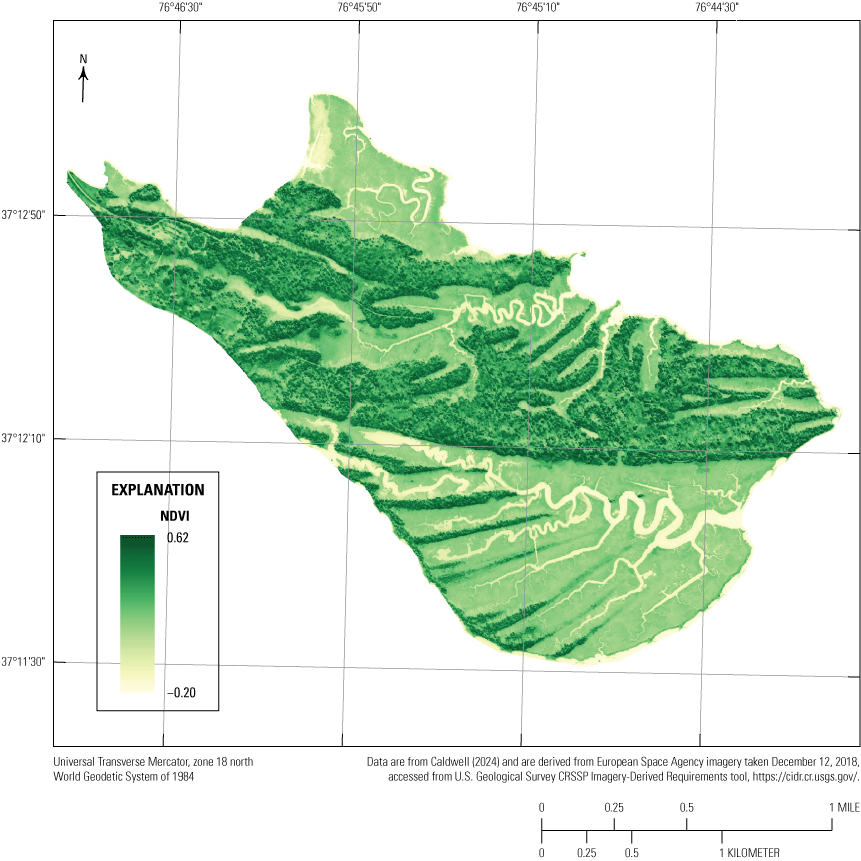
Normalized difference vegetative index (NDVI) raster grid of Jamestown Island from WorldView 3 satellite imagery on December 12, 2018.
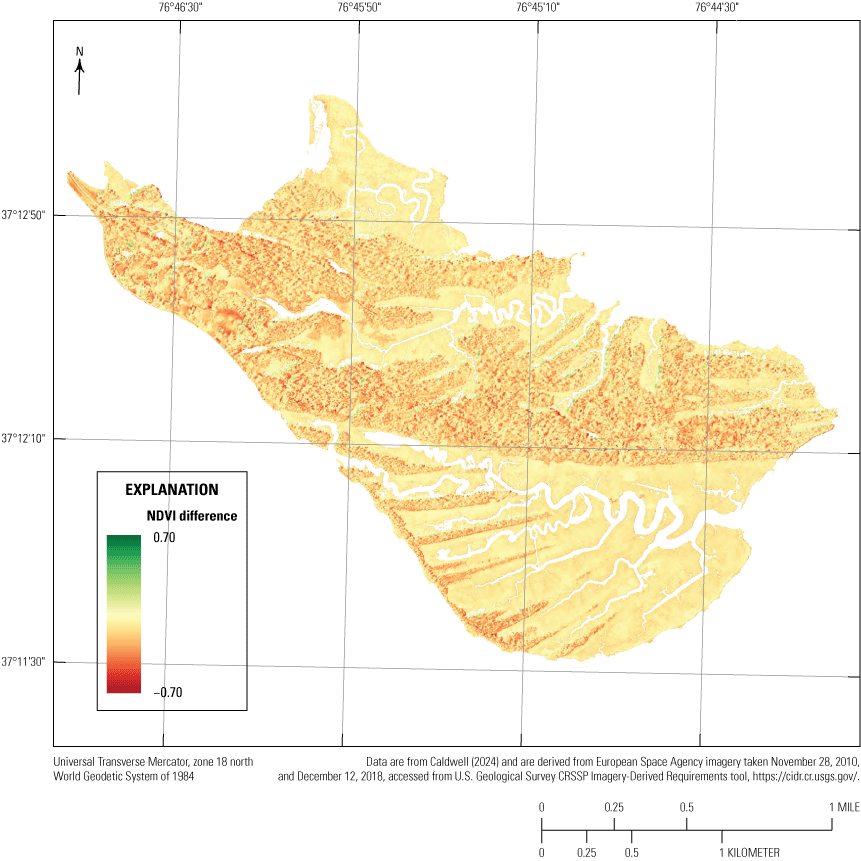
Difference of normalized difference vegetative index (NDVI) raster grids of Jamestown Island, showing the difference in values from the November 28, 2010, and December 12, 2018.
One difference of NDVIs raster grid was created (fig. 6) to compare the November and December images (figs. 4 and 5). The difference of NDVIs raster grid shows a loss in vegetative health across the Island from November 2010 to December 2018. Some of this could be explained by the later month in the year, but no clear trends are apparent in the image. Patches of marsh grass along the Pitch and Tar Swamp and Back Creek are less healthy in 2018 than in 2010. This could be from vegetative stress or differences in tidal conditions in the compared images. The areas of increased vegetative health throughout the image all correspond to tree shadows in one or both of the original images; however, this clearly highlights areas with a change in canopy cover from 2010 to 2018. This canopy change is concentrated in the middle of the Island as well as the Visitor Center.
The satellite imagery shows the many creeks on the Island; however, the images only show the largest pools of freshwater that have been observed infilling ditches made by treefalls, thereby making new ponds. Although individual trees can be discerned in certain areas of the Island, and marshland is clearly distinct from the forested upland on the Island in the NDVI raster grids, the resolution of the NDVI raster grids is insufficient to differentiate between species of trees or grass. This made it impossible to use changes in vegetative type as a method to track vegetative stress or changes in subsurface conditions over time. Documenting marsh migration using the satellite data was also difficult because the 8-year span was relatively short for that process, and the creep of marsh vegetation into forested areas during 2010–18 was hidden from view in the scenes by canopy cover.
Soil Data
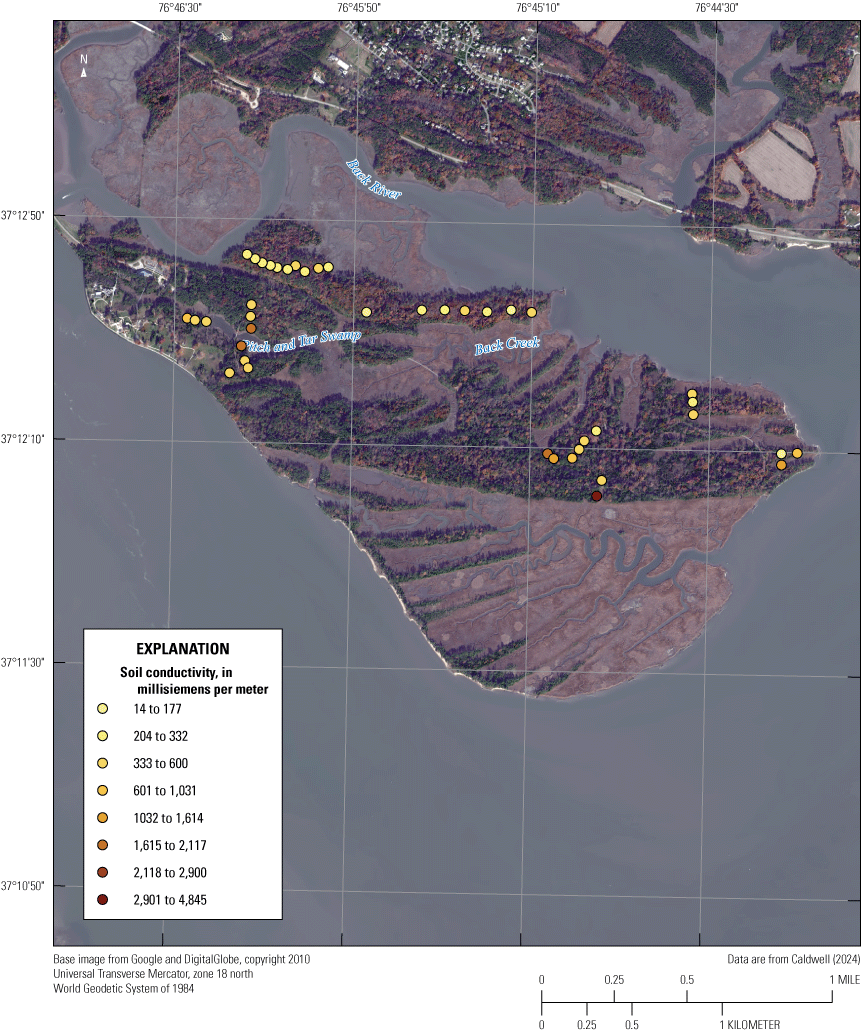
As demonstrated by the soil data, soil across Jamestown Island is largely heterogeneous owing to natural variation combined with anthropomorphic change on the Island. Soil conductivity was observed to be as low as 14 mS/m and as high as 4,845 mS/m when sites were wet enough to sample soil conductivity (table 2). Generally, soil conductivity on Jamestown Island increases with depth and was generally higher in June 2021 (figs. 7 and 8) compared to March 2022 (figs. 9 and 10). These patterns in conductivity are largely driven by the influence of the James River on the Island’s groundwater. The highest conductivity values measured in each month are adjacent to bodies of water or are on parts of the Island that are frequently inundated. An exception to this pattern is in the northwest corner of the Island along the Back River, where the Island’s elevation is at its highest. This may be a result of the elevation and differences in conductivity in the Back River than that of the James River (figs. 7, 8,9, and 10) or differences in depth to the water table and less frequent, if any, inundation events.

Soil conductivity across Jamestown Island data from soil at the land surface sampled during June 2021. [mS/m, millisiemens per meter]

Soil conductivity across Jamestown Island data from the second soil horizon during June 2021. [mS/m, millisiemens per meter]
Soil conductivity across Jamestown Island data from soil at the land surface sampled during March 2022. [mS/m, millisiemens per meter]
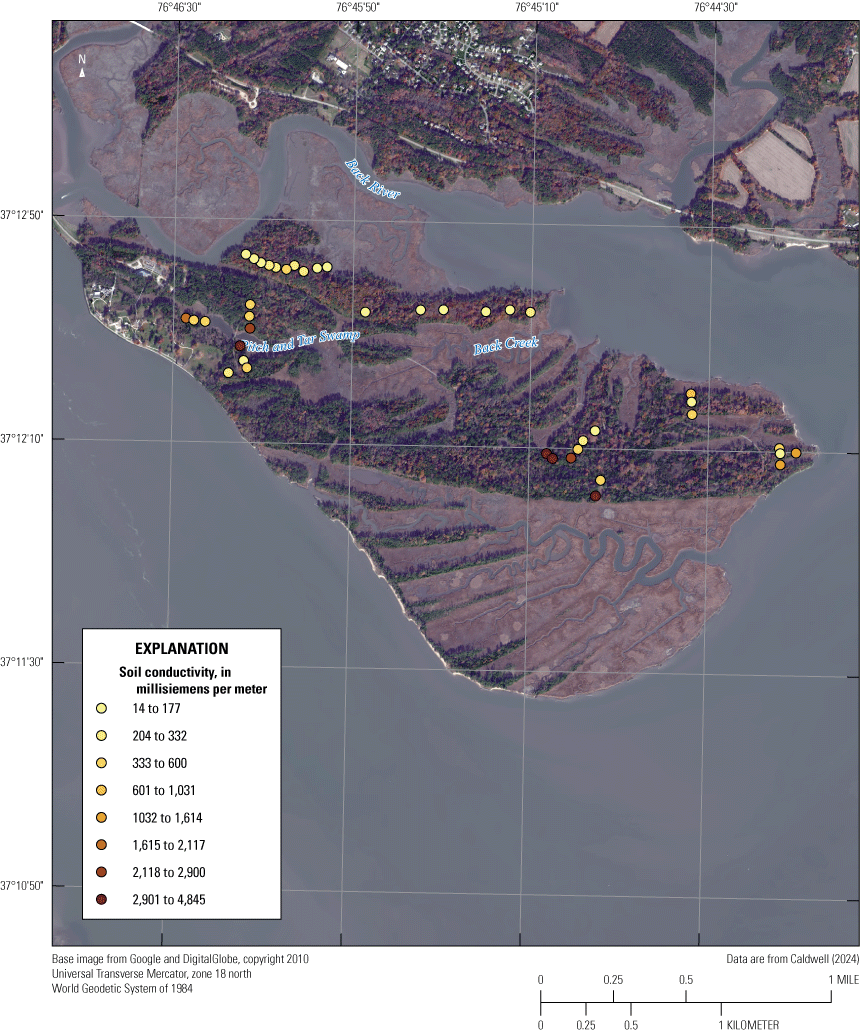
Soil conductivity across Jamestown Island data from the second soil horizon March 2022. [mS/m, millisiemens per meter]
Table 2.
Soil data on minimum and maximum soil conductivity, pH, and depth at Jamestown Island in June 2021 and March 2022.[Data are from Caldwell (2024). “Top” is the soil sample at a site closest to the land surface in the O soil horizon. “Deep” is the soil sample at a site in the A soil horizon. mS/m, soil conductivity]
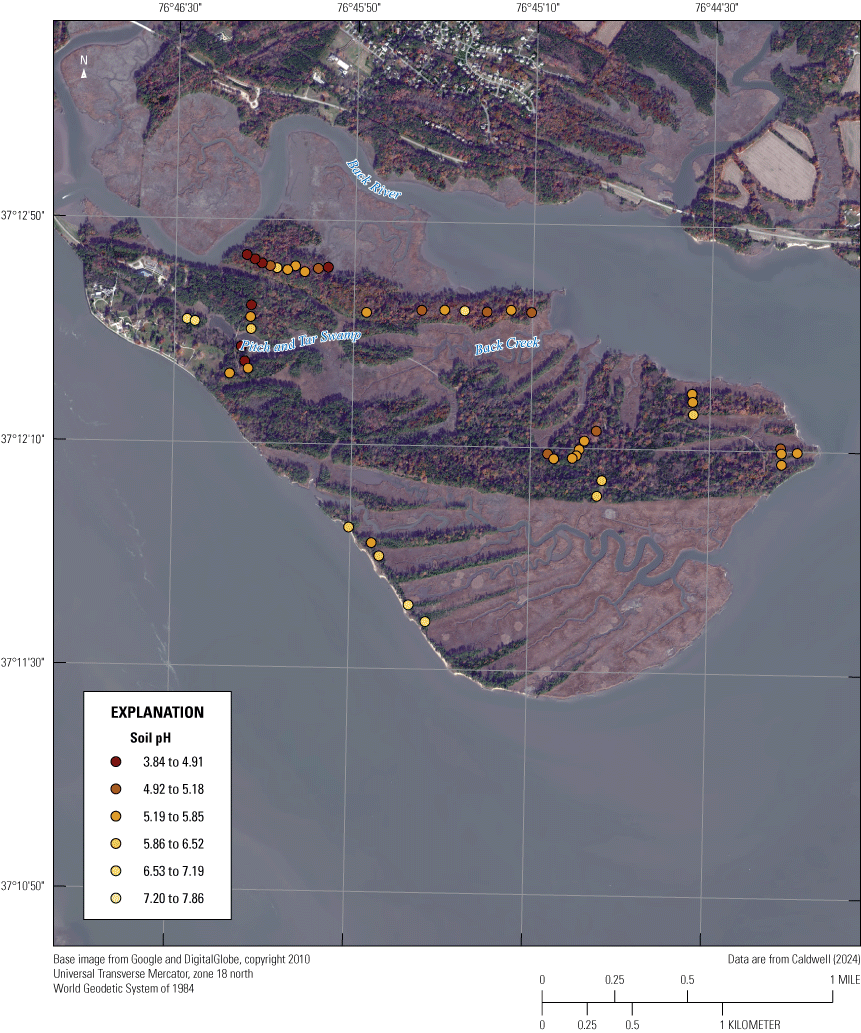
Soil pH (figs. 11, 12, 13, and 14) is more heterogeneous than soil conductivity. Soil pH was neutral to acidic across both sampling efforts ranging from 7.86 to 3.84 (table 2). The lowest observed pH in each sampling effort, like soil conductivity, was observed at sites adjacent to bodies of water or in areas that are frequently inundated. Unlike the conductivity observations, the pH values did not show a distinct difference between upland and lowland sites. For example, in the northwestern portion of the Island near the Back River, all sites have relatively similar soil conductivity, but a gradient from more acidic to less acidic pH progresses inland, returning to more acidic approaching the lowland marsh grasses. This pattern is present at both depths in both months sampled.
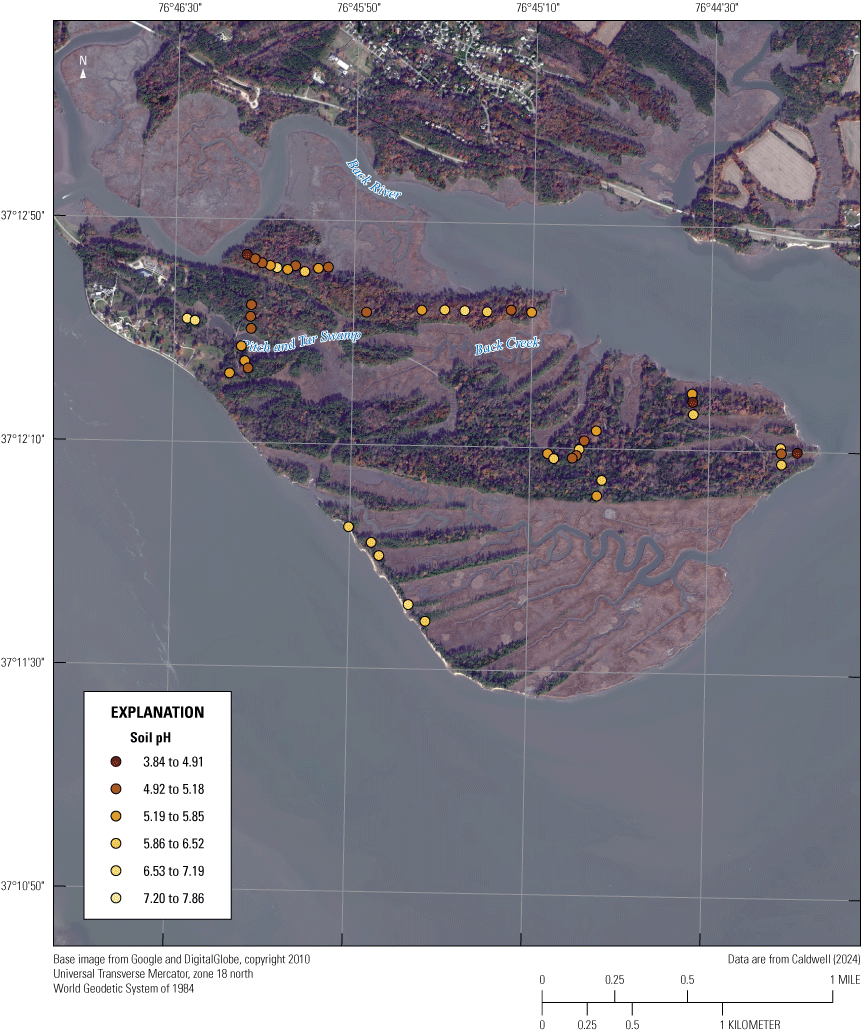
Soil pH sampled across Jamestown Island data from soil at the land surface sampled during June 2021.
Soil pH sampled across Jamestown Island data from the second soil horizon during June 2021.

Soil pH sampled across Jamestown Island data from soil at the land surface sampled during March 2022.

Soil pH sampled across Jamestown Island data from the second soil horizon during March 2022.
Summary
Archaeological and cultural sites on Jamestown Island have been documented to be as old as the Paleoindian period. Archaeological sites from the Jamestown settlement are extensive and dominate many areas of the Island. In addition to its rich archaeological record, the Island is home to a plethora of native plants and animals, including several rare, threatened, and endangered species. The Island is at particular risk to sea-level rise because two-thirds of the Island is at or below 5 ft above North American Vertical Datum of 1988. Furthermore, the Island is surrounded by the tidal waters of the James River. Marsh encroachment and treefalls associated with changes in groundwater quality have already been documented at Black Point.
The U.S. Geological Survey and Colonial National Historic Park seek to understand some of the changes brought about by a dynamic climate. To understand how the Island and its vegetation might respond to larger areas of the Island becoming inundated more frequently, if not becoming permanently submerged, data from parts of the Island that experience these conditions can be informative. The satellite imagery data collected were of little utility. The differing tidal conditions and seasons in each image make correlating vegetative change across images difficult. In an image with mixed plant species, a change in normalized difference vegetative index value could mean a change in the health of a plant or a change in species of plant from one pixel to the next. It is not difficult to differentiate lowland marsh grasses from upland forests; however, conclusions about plant health within each land type should be made and used cautiously.
The collected soil data reveal that the upland sites of the Island generally have low soil conductivity in the soil and have soil pH values that are neutral to slightly acidic, depending on proximity to water or subjection to inundation. The lowland sites of the Island have higher soil conductivity and acidic soil. This combination of conductivity and acidity makes the lowland sites of the Island hotspots for corrosion to any archaeological artifacts that may be buried there. Areas that are near water or frequently inundated, such as Black Point or the Pitch and Tar Swamp, have the highest observed conductivity and the lowest observed pH values from the soil data. This creates an environment with high susceptibility to corrosion in the unsaturated subsurface, and the least hospitable to the local vegetation and subsurface archaeological artifacts.
Acknowledgments
Special thanks are given to Dorothy Geyer of Colonial National Historic Park for her efforts in coordinating U.S. Geological Survey and National Park Service personnel and her help obtaining permissions for the fieldwork on Jamestown Island. Additionally, Veronica Mantha (National Park Service and U.S. Geological Survey) are thanked for her work in the field collecting data. The funding for this work was provided by the National Resource Protection Program. Any use of trade, firm, or product names is for descriptive purposes only and does not imply endorsement by the U.S. Government.
References Cited
Caldwell, S.H., 2024, Satellite imagery products from 2010, 2011, 2018 and soil data from 2021–22 on Jamestown Island, Va.: U.S. Geological Survey data release, https://doi.org/10.5066/P13J32J4.
Chazal, A.C., and Van Alstine, N.E., 2001, An inventory of rare, threatened, and endangered species in the Jamestown Island 400 project area, Colonial National Historical Park, Natural Heritage Technical Report 01–23: Richmond, Va., Commonwealth of Virginia, Department of Conservation and Recreation, Division of Natural Heritage, 49 p.
Eggleston, J., and Pope, J.P., 2013, Land subsidence and relative sea-level rise in the southern Chesapeake Bay region: U.S. Geological Survey Circular 1392, 24 p., accessed December 4, 2024, at https://doi.org/10.3133/cir1392.
Ezer, T., and Atkinson, L.P., 2015, Sea level rise in Virginia—Causes, effects, and response: Virginia Journal of Science, vol. 66, no. 3, article 8, p. 355–359, accessed December 4, 2024, at https://www.researchgate.net/publication/313139836_Ezer_T_and_L_Atkinson_2015_Sea_level_rise_in_Virginia-causes_effects_and_response_Virginia_Journal_ of_Science_663_355-359_Publication_of_the_Virginia_Academy_of_Science.
Johnson, G.H., and Hobbs, C.H., III, 2001, The geology of Jamestown Island, Virginia, in Brown, M.R., III, and Carson, C., eds., Geological development and environmental reconstruction of Jamestown Island, Jamestown archaeological assessment, 1992–1996: Colonial National Historical Park, National Park Service, 192 p.
Laben, C.A., and Brower, B.V., 2000, Process for enhancing the spatial resolution of multispectral imagery using pan-sharpening: United States Patent number 6,011,875, [unpaged, 9 p.], accessed December 12, 2024, at https://patents.google.com/patent/US6011875.
Li, H., Jing, L., and Tang, Y., 2017, Assessment of pansharpening methods applied to WorldView-2 imagery fusion: Sensors (Basel), v. 17, no. 1, article 89, accessed December 4, 2024, at 10.3390/s17010089.
Lookingbill, T., Bentsen, C.N., Carruthers, T.J.B., Costanzo, S., Dennison, W.C., Doherty, C., Lucier, S., Madrom, J., Poppell, E., and Saxby, T., 2012, Colonial National Historical Park natural resource condition assessment: National Park Service Natural Resource Report NPS/COLO/NRR—2012/544, accessed December 4, 2024, at https://ian.umces.edu/site/assets/files/11008/colonial-national-historical-park-natural-resource-condition-assessment.pdf.
Lowery, D.L., O’Neal, M.A., Cariso, S., and Montini, T., 2012, Sea level rise in coastal Virginia—Understanding impacts to archaeological resources: Newport News, Va., Virginia Department of Historic Resources, 63 p. accessed December 4, 2024, at https://www.academia.edu/2348853/Sea_Level_Rise_in_Coastal_Virginia_Understanding_Impacts_to_Archaeological_Resources.
McCoy, K.J., Rice, K.C., Rickles, E., Frederick, D., Cramer, J., and Geyer, D., 2021, Groundwater hydrology and chemistry of Jamestown Island, Virginia—Potential effects of tides, storm surges, and sea-level rise on archaeological, cultural, and ecological resources: U.S. Geological Survey Scientific Investigations Report 2021–5117, 50 p., accessed December 4, 2024, at https://doi.org/10.3133/sir20215117.
National Oceanic and Atmospheric Administration, [NOAA], 2025, 8638610 Sewells Point, VA Tides & Currents: NOAA web page, accessed May 1, 2025, at https://tidesandcurrents.noaa.gov/stationhome.html?id=8638610.
NPS, 2015, Plants: National Park Service web page, accessed September 16, 2024, at https://www.nps.gov/colo/learn/nature/plants.htm.
NPS, 2019, Northeast coastal and barrier network species spotlight—Bald eagle: Bald Eagles of Colonial National Historic Park, National Park Service web page, accessed July 25, 2025, at https://www.nps.gov/articles/ncbn-species-spotlight-bald-eagle.htm.
Passeri, D.L., Hagen, S.C., Medeiros, S.C., Bilskie, M.V., Alizad, K., and Wang, D., 2015, The dynamic effects of sea level rise on low-gradient coastal landscapes—A review: Earth’s Future, v. 3, no. 6, p. 159–181, accessed December 4, 2024, https://agupubs.onlinelibrary.wiley.com/doi/full/10.1002/2015EF000298
Patterson, K.D., 2008, Vegetation classification and mapping at Colonial National Historical Park, Virginia: National Park Service Technical Report NPS/NER/NRTR–2008/129, 369 p. [Also available at https://docslib.org/doc/3963223/vegetation-classification-and-mapping-project-report.]
Ricci, G., Robadue, D.D., Jr., Rubinoff, P., Casey, A., and Babson, A.L., 2019, Integrated coastal climate change vulnerability assessment—Colonial National Historical Park: National Park Service Natural Resources Report NPS/COLO/NRR—2019/1945, 308 p. [Also available at https://irma.nps.gov/DataStore/DownloadFile/694422.]
Saunders, S., Easley, T., Farver, S., Logan, J.A., and Spencer, T., 2009, National parks in peril—The threats of climate disruption: The Rocky Mountain Climate Organization and Natural Resources Defense Council, 56 p., accessed December 4, 2024, at https://typeset.io/pdf/national-parks-in-peril-the-threats-of-climate-disruption-3u6nnzf6y3.pdf.
Sánchez-Pérez, J.M., Lucot, E., Bariac, T., and Trémolières, M., 2008, Water uptake by trees in a riparian hardwood (Rhine floodplain, France): Hydrological Processes, v. 22, no. 3, p. 366–375, accessed December 4, 2024, https://onlinelibrary.wiley.com/doi/abs/10.1002/hyp.6604
U.S. Environmental Protection Agency, 2004, Method 9045D—Soil and waste pH (rev. 4, November 2004): Washington, D.C., U.S. Environmental Protection Agency, 5 p., accessed December 4, 2024, at https://www.epa.gov/sites/default/files/2015-12/documents/9045d.pdf.
U.S. Climate Change Science Program and the Subcommittee on Global Change Research, 2009, Coastal sensitivity to sea-level rise—A focus on the mid-Atlantic Region: Washington, D.C., U.S. Climate Change Science Program, 298 p., accessed December 4, 2024, at https://digital.library.unt.edu/ark:/67531/metadc12028/.
U.S. Geological Survey, [USGS], 2021, Commercial Remote Sensing Space Policy (CRSSP) Imagery-Derived Requirements (CIDR) Tool: U.S. Department of the Interior, accessed March 11, 2023, at https://cidr.cr.usgs.gov/.
U.S. Geological Survey, [USGS], 2025, USGS water data for the Nation: U.S. Geological Survey National Water Information System database, accessed May 1, 2025, at https://doi.org/10.5066/F7P55KJN.
Whalley, W.R., 1993, Considerations on the use of time-domain reflectometry (TDR) for measuring soil water content: European Journal of Soil Science, v. 44, no. 1, p. 1–9, accessed December 4, 2024, at 10.1111/j.1365-2389.1993.tb00429.x.
Conversion Factors
Temperature in degrees Celsius (°C) may be converted to degrees Fahrenheit (°F) as follows:
°F = (1.8 × °C) + 32.
Temperature in degrees Fahrenheit (°F) may be converted to degrees Celsius (°C) as follows:
°C = (°F – 32) / 1.8.
Datums
Vertical coordinate information is referenced to the North American Vertical Datum of 1988 (NAVD 88).
Horizontal coordinate information is referenced to the World Geodetic System of 1984 (WGS 84).
Altitude, as used in this report, refers to distance above the vertical datum.
Supplemental Information
Soil conductivity is in millisiemens per meter at 25 degrees Celsius (mS/m at 25 °C).
For additional information contact:
Director, Virginia and West Virginia Water Science Center
U.S. Geological Survey
1730 East Parham Road
Richmond, Virginia 23228
or visit our website at
https://www.usgs.gov/centers/virginia-and-west-virginia-water-science-center
Publishing support provided by the Baltimore Publishing Service Center.
Disclaimers
Any use of trade, firm, or product names is for descriptive purposes only and does not imply endorsement by the U.S. Government.
Although this information product, for the most part, is in the public domain, it also may contain copyrighted materials as noted in the text. Permission to reproduce copyrighted items must be secured from the copyright owner.
Suggested Citation
Caldwell, S.H., 2025, Using satellite imagery and soil data to understand occurrences and migration of soil conditions harmful to archaeological sites on Jamestown Island, Virginia (ver. 1.1, November 2025): U.S. Geological Survey Scientific Investigations Report 2025–5074, 22 p., https://doi.org/10.3133/sir20255074.
ISSN: 2328-0328 (online)
ISSN: 2328-031X (print)
Study Area
| Publication type | Report |
|---|---|
| Publication Subtype | USGS Numbered Series |
| Title | Using satellite imagery and soil data to understand occurrences and migration of soil conditions harmful to archaeological sites on Jamestown Island, Virginia |
| Series title | Scientific Investigations Report |
| Series number | 2025-5074 |
| ISBN | 978-1-4113-4629-1 |
| DOI | 10.3133/sir20255074 |
| Edition | Version 1.0: September 16, 2025; Version 1.1: September 30, 2025 |
| Publication Date | September 16, 2025 |
| Year Published | 2025 |
| Language | English |
| Publisher | U.S. Geological Survey |
| Publisher location | Reston, VA |
| Contributing office(s) | Virginia and West Virginia Water Science Center |
| Description | Report: vii, 22 p.; Data Release |
| Country | United States |
| State | Virginia |
| Other Geospatial | Jamestown Island |
| Online Only (Y/N) | N |
| Additional Online Files (Y/N) | N |