

Fluvial Sediment Dynamics in the Shoshone River and Tributaries Around Willwood Dam, Park County, Wyoming
Links
- Document: Report (9.28 MB pdf) , HTML , XML
- Dataset: USGS National Water Information System database - USGS water data for the Nation
- Data Release: USGS data release - Shapefiles of digitized backwater extent behind Willwood Dam on the Shoshone River, near Cody, Wyoming, derived from 2012, 2015, 2017, 2019, and 2022 National Agriculture Imagery Program imagery
- Download citation as: RIS | Dublin Core
Acknowledgments
The authors would like to thank individuals from the Willwood Work Groups 2 and 3 for their insights and assistance with the direction of the project. Agencies supporting those efforts include the Bureau of Reclamation, specifically Liz Cresto; Cody Conservation District; East Yellowstone Chapter of Trout Unlimited, specifically David Sweet and Mike Roell; Powell Clarks Fork Conservation District, specifically Ann Trosper and Floyd Derry; Shoshone Irrigation District, specifically Trent Reed; Trout Unlimited, specifically Brittany Swope; University of Wyoming Extension Office, specifically Jeremiah Vardiman; Bureau of Land Management, specifically Brad Tribby; Natural Resources Conservation Service, specifically Rory Karhu; Willwood Irrigation District, specifically Troy Pimentel; Wyoming Game and Fish Department, specifically Alan Osterland and Darby Schock; Wyoming Association of Conservation Districts, specifically Cathy Rosenthal and Triston Rice; Wyoming Department of Environmental Quality, specifically Alex Jeffers and Jennifer Zygmunt; and Wyoming Water Development Office.
U.S. Geological Survey employees Brittany Brasfield, Shea Musselman, Eric Blajszczak, Raymond Woodruff, Jason Swanson, Clayton Wells, Laura Hallberg, and Cailin Brugger are acknowledged for assistance with data collection, data review, and report preparation.
Abstract
Sedimentation affects many of the aging reservoirs in the United States. Dams and water diversions from rivers have been central elements of infrastructure supporting agricultural irrigation in the arid and semiarid regions of the Western United States for more than a century. The Willwood Irrigation District diversion dam (hereafter referred to as “Willwood Dam”) in Park County, Wyoming, is approximately 12 miles northeast of Cody, Wyo.; has a structural height of 70 feet; and impounds the Shoshone River for diversion into the Willwood Canal. Willwood Dam is part of a larger irrigation scheme supported by water storage in the much larger Buffalo Bill Dam, which is approximately 20 miles upstream. In October 2016, renovation construction activities at Willwood Dam and the Willwood Canal caused an unplanned evacuation of nearly 96,000 cubic yards of fine sediment.
The fine sediment release in 2016 raised concerns that ongoing sediment management at Willwood Dam could impose limits on the long-term health of the aquatic ecosystem and fish populations. The U.S. Geological Survey, in cooperation with Wyoming Department of Environmental Quality and Willwood Work Groups 2 and 3, initiated an investigation of the dynamics of sediment transport in the Shoshone River and selected tributaries between Buffalo Bill Dam and Willwood Dam. The goal of the study was to quantify sediment transport into and out of Willwood Dam on an annual, seasonal, and event basis to better understand the relative quantities of sediment coming from natural sources and human activities on the landscape. The study ran from March 2019 through October 2021 and used observations of streamflow, turbidity, and acoustic backscatter collected at streamgages upstream and downstream from Willwood Dam to quantify suspended-sediment loads into and out of the dam during irrigation and fallow seasons, precipitation-runoff events, and deliberate sediment releases. Each tributary’s relative contribution to the sediment load upstream from Willwood Dam was examined using discrete measurements of suspended-sediment concentration and bedload during irrigation and fallow seasons, precipitation events, and stable conditions.
Analysis of daily precipitation and temperature data indicated that conditions in the study area during the 2019 agricultural year were wetter and colder than period of record normal, and drier and near normal temperatures for the 2020 and 2021 agricultural years. Not all sediment load records between 2019 and 2021 are complete because of rejected observations (outliers), instrument failures or fouling, and instrument removal for calibrations.
Statistical modeling of suspended-sediment concentration using paired values of turbidity and acoustic backscatter produced four models that, after refinement, had coefficients of determination indicating that more than 84 percent of the variance was explained by either turbidity or acoustic backscatter. A system of rules was developed to select the model predictions based on the seasonal operations of Willwood Dam, assumptions about the grain sizes mobilized during these operations, and assumed accuracy of the models at the downstream streamgage (Shoshone River below Willwood Dam, near Ralston, Wyo. [streamgage 06284010]) under different operational conditions. The sediment budget between upstream and downstream estimates of loads was interpreted using the mean predicted values bound by their respective model prediction intervals. When mean predicted loads of one streamgage were contained in the prediction intervals of the other streamgage, and vice-versa, difference in the sediment budget were interpreted as “indeterminate.”
Modeled sediment load balances demonstrated the depositional and erosional behaviors expected from the conceptual model of dam operations whereby sediment tends to accumulate during irrigation seasons when the dam is spilling over the top, and sediment tends to evacuate during the fallow seasons when it is flowing through the sluice gates at the base of the dam. The sediment load calculations using the rules-based model criteria indicated that between 14,200 and 380,000 tons of suspended sediment moved through the Shoshone River around Willwood Dam during the irrigation seasons of 2019, 2020, and 2021; 380,000 tons of suspended sediment were transported during the cool, wet year of 2019, and 14,200 tons of suspended sediment were transported in 2020, which was relatively dry. During fallow seasons 2019, 2020, and 2021, which had fewer complete records, between 1,140 and 106,000 tons of suspended sediment was estimated to have moved through the river.
For all seasons except fallow season 2022, the models estimated that more sediment was released from the dam than entered the dam, but the modeled mean loads at each streamgage were nearly always within the prediction intervals of each other, making the sediment balance indeterminant. Examination of suspended-sediment loads during irrigation seasons indicated that between 65 and 85 percent of fine sediment was transported during annual high flows and storm events, with the remainder transported during steady, lower streamflows. Examination of suspended loads during fallow seasons indicated that deliberate sediment releases through Willwood Dam accounted for between 39 and 67 percent of the total sediment moved during the fallow seasons. Deliberate sediment releases from Willwood Dam had estimated net exports of between 1,360 and 22,400 tons.
Between August 2017 and July 2023, suspended-sediment concentration and bedload sediment samples were collected from 9 tributaries to the Shoshone River during 137 sampling events, including stable and precipitation-runoff conditions. During irrigation season precipitation events, the mean total sediment yields ranged from 0.33 to 9.51 tons per day per square mile; during fallow season precipitation events, the mean total yields ranged from 0.04 to 0.95 ton per day per square mile. The mean total sediment yield per unit area across all samples at each tributary site ranged from 0.26 to 3.08 tons per day per square mile. Bedload was a minor fraction of the total load, constituting a mean of 4 percent across all samples; 3 and 6 percent for events and nonevents, respectively, during irrigation season; and 3 and 1 percent for events and nonevents, respectively, during the fallow season. With the exception of one tributary, Dry Creek, these mean yield values were within the range of watershed-scale background sediment yield values estimated from reservoir surveys and previous suspended-sediment studies.
Imagery from irrigation seasons 2012, 2015, 2017, 2019, and 2022 was used to determine the planimetric backwater extent of the pool area in the Shoshone River behind Willwood Dam to identify any changes in sediment storage. Active river channel widths in the Shoshone River upstream from Willwood Dam were all similar between years except 2015, which was determined to be statistically different from all other years. Bathymetric data taken in the pool behind Willwood Dam during three different surveys between November 2017 and April 2022 indicated no statistically significant differences in bed elevations between the years. Results from the planimetric and bathymetric survey data provide multiple lines of evidence indicating that sediment did not accumulate behind the dam within the error of the methods used.
Examination of how precipitation affects sediment transport in the Shoshone River upstream from Willwood Dam indicated that accumulated rainfall from the natural runoff events captured during the study period varied from a trace to as much as 4.26 inches, with associated predicted suspended-sediment loads varying from 112 to 232,000 tons of suspended sediment. The behavior of the sediment loads relative to accumulated precipitation did not appear to change depending on irrigation or fallow season. A model of suspended-sediment concentrations relative to the 2-day accumulated precipitation indicated that suspended-sediment concentrations in the Shoshone River upstream from Willwood Dam increased exponentially for accumulations of 0.3 inch or more; such storms accounted for 10 percent or less of precipitation events observed during the 1981 to 2018 period of record.
The gaps in records, precision of the instrumentation, and large variation in grain sizes in suspended-sediment mixtures downstream from the dam made closing the sediment budgets for most seasons unattainable. The biggest recent change in sediment storage measured using the planimetric area of deposits behind Willwood Dam took place between 2015 and 2017. The main event between these two measurements was the installation of new Willwood Canal gates in October 2016, which resulted in the large unplanned sediment release. Because the sediment budgets were nearly always indeterminate and the planimetric and bathymetric data indicated little change in the bed and bank material, it is likely that the change in sediment storage behind the dam during the study period was small relative to the precision of the statistical models and other uncertainties.
This body of evidence suggests that, averaged during the 3-year study period, no major changes in storage took place, and that the current operations may be keeping storage at near-equilibrium. This condition could have been initiated because the middle sluice gate has now been operational since 2014, and the sediment release in October 2016 evacuated a large amount of legacy sediment from storage. Although the uncertainties are large, sluicing events allow for controlled releases of sediment that contributed to the near equilibrium conditions observed over an annual basis during this study.
Introduction
Sedimentation affects many of the aging reservoirs in the United States (Graf and others, 2010; Juracek, 2015). Long-term decision making to address reservoir sedimentation can benefit from economic planning that weighs the costs and benefits of continued maintenance and sediment mitigation strategies against alternatives such as changing water-use practices or dam decommissioning (National Reservoir Sedimentation and Sustainability Team, 2019). Such analyses are inevitably specific to each dam and strongly dependent on factors such as the dam’s structural condition and the feasibility to mitigate or reduce annual sediment influxes. Whereas assessment of the condition of a dam is a relatively straightforward engineering inspection, quantifying potential sediment mitigation strategies is complex and strongly dependent on the geology, climate, land-use practices, accessibility by heavy equipment to remove sediment, and the operational flexibility of the outlet works of the dam relative to the upstream hydrologic system (National Reservoir Sedimentation and Sustainability Team, 2019).
Dams and water diversions from rivers have been central elements of infrastructure supporting agricultural irrigation in the arid and semiarid regions of the Western United States for more than a century. The Willwood Irrigation District (WID) diversion dam (hereafter referred to as “Willwood Dam”) in Park County, Wyoming, was built on the Shoshone River in 1924 as part of the U.S. Department of the Interior’s Shoshone Project, an irrigation development plan centered on water storage in the reservoir created by the much larger Buffalo Bill Dam (Bonner, 2002). Willwood Dam is approximately 20 miles (mi) downstream from Buffalo Bill Dam; 12 mi northeast of Cody, Wyo. (fig. 1); and has a structural height of 70 feet (ft). The dam is owned by the Bureau of Reclamation (Reclamation) and operated through agreement by WID. Willwood Dam diverts water into the Willwood Canal, which delivers irrigation water to approximately 11,500 acres of agricultural land in the Shoshone River valley (fig. 1; Stone and Webster Engineering, 1982).
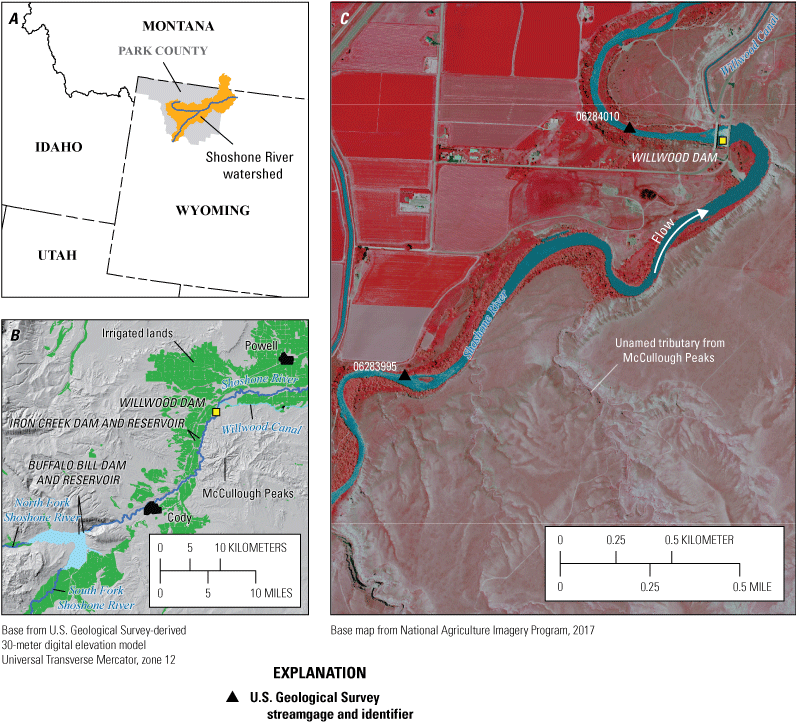
Map showing study area including the location of Willwood Irrigation District diversion dam (Willwood Dam) on the Shoshone River, Wyoming.
In October 2016, renovation construction activities at Willwood Dam and the Willwood Canal caused an unplanned and uncontrolled evacuation of nearly 96,000 cubic yards (yd3) of sediment (McElroy, 2017). The release lasted 37 days, causing sediment to accumulate on the bed of the Shoshone River downstream from the dam (McElroy, 2017). Although the direct effect of the sediment release on the fish population was difficult to quantify, local fisheries experts and residents observed dead fish encased in sediment along the riverbanks, indicating the release killed some part of the downstream fish community (Breeding, 2016; Wyoming Game and Fish Department, 2017). Trout fishing is common below Willwood Dam and is an important component of the growing recreation and tourism economy in Park County (DJ&A, 2021). The fine sediment (particles with nominal diameters less than or equal to 2 millimeters [mm], usually referred to as “sand, silt, and clay”) release in October 2016 raised concerns that ongoing sediment management at Willwood Dam can impose limits on the long-term health of the aquatic ecosystem and fish populations. In response, the Wyoming Department of Environmental Quality (WYDEQ) organized three work groups aimed at restoring aquatic life and habitats degraded by the release and reducing or eliminating future needs for sediment releases from Willwood Dam. Work Groups 2 and 3 (WRK2 and WRK3, respectively) were tasked with (1) “development of alternatives for the long-term management of sediment above Willwood Dam,” and (2) “addressing sediment sources upstream of Willwood Dam” (WYDEQ, 2017, p. 3).
The U.S. Geological Survey (USGS), in cooperation with the WYDEQ and members of WRK2 and WRK3, initiated an investigation of the dynamics of sediment transport in the Shoshone River and selected tributaries between Buffalo Bill Dam and Willwood Dam. The goal of the study was to quantify sediment transport into and out of Willwood Dam on an annual, seasonal, and event basis to better understand the relative quantities of sediment coming from natural and human sources on the landscape. The study included quantification of suspended-sediment transport during deliberate experimental sediment releases from Willwood Dam to determine if these kinds of events could help reduce sediment accumulation and prevent harmful sediment releases. Likewise, sediment from tributaries measured during various types of runoff events were examined for their relative contributions to the Shoshone River. Lastly, an empirical model of suspended-sediment concentrations from runoff was developed to quantify the frequency distribution of high-concentration events driven by precipitation.
Study Area Description
The study area is the Shoshone River watershed between Buffalo Bill Dam and Willwood Dam in northwestern Wyoming (fig. 1). The Shoshone River watershed upstream from Willwood Dam drains approximately 1,850 square miles (mi2), of which about 70 percent is within the Middle Rockies ecoregion and 30 percent is within the Wyoming Basin ecoregion (U.S. Geological Survey, 2024a). Elevation in the basin upstream from Willwood Dam ranges from approximately 4,520 to 12,490 ft above mean sea level (based on the North American Vertical Datum of 1988 [NAVD 88]), with approximately 58 percent of the basin above 7,500 ft (U.S. Geological Survey, 2024a). Mean annual temperature in the basin is approximately 37 degrees Fahrenheit (°F), and mean annual precipitation is about 24.7 inches (in.) (based on 1991–2020 period of record; U.S. Geological Survey, 2024a).
The Shoshone River is formed at the confluence of its north and south forks about 7 mi west of the city of Cody (fig. 1B). Both forks have their headwaters in the Absaroka Range to the west (not shown), and their confluence was flooded when Buffalo Bill Dam was completed in 1910 and reached full capacity (Blanton, 1991). Buffalo Bill Dam lies at the head of a canyon where the Shoshone River has cut through Precambrian basement and Paleozoic sedimentary bedrock (Pierce, 1997). At the mouth of the canyon, the Shoshone River enters the Bighorn Basin ecoregion, which is part of the Wyoming Basin ecoregion (Omernik and Griffith, 2014), a semiarid landscape of gently sloping rangelands consisting mostly of sagebrush shrublands.
Within the Bighorn Basin ecoregion, the Shoshone River is entrenched into Paleozoic and Mesozoic bedrock capped by flat-lying terraces and pediments composed of Quaternary sands and gravels (Mackin, 1937; Ritter and Kauffman, 1983). The terraces and pediments are the primary topographic surfaces used for agriculture and are traversed by networks of irrigation ditches. The porous nature of the terraces acts as a mechanism for irrigation return flow seepage to the Shoshone River through otherwise ephemeral drainages, as well as waterfalls and seeps in the bluffs along the river corridor (Bonner, 2002). About 5 mi east of Cody, the right bank of the Shoshone River impinges on the McCullough Peaks, a small mountain range composed of Cenozoic sedimentary rocks (Pierce, 1997; fig. 1B–C). McCullough Peaks is mostly composed of siltstones and claystones of the Willwood Formation (Neasham, 1967), and its network of ephemeral drainages that intersect the south bank of the Shoshone River are typically steep, deeply entrenched channels (Leopold and Miller, 1954). The annual precipitation in the drainage basin on the terraces of the Shoshone River near Willwood Dam that includes McCullough Peaks is approximately 10.4 in. (U.S. Geological Survey, 2024a).
Hydrology
Buffalo Bill Dam is approximately 350 ft tall and generally acts as a complete barrier to natural passage of upstream water and sediment. The dam is operated to maximize water storage during the snowmelt runoff season and release it during irrigation season, and dam operations would be expected to have substantial effects on the natural timing and magnitude of annual peak streamflows (Williams and Wolman, 1984; Schmidt and Wilcock, 2008). Data available from 1902 to 1909 at Shoshone River at Cody, Wyo. (USGS streamgage 06282500; U.S. Geological Survey, 2023a), indicates that prior to dam completion, annual peak discharge ranged from 7,850 to 22,200 cubic feet per second (ft3/s), with a mean of about 12,680 ft3/s (fig. 2).

Annual peak discharges downstream from Buffalo Bill Dam before and after closure of the dam from Shoshone River at Cody, Wyoming (USGS streamgage 06282500, U.S. Geological Survey, 2023a) and Shoshone River below Buffalo Bill Reservoir, Wyo. (USGS streamgage 06282000, U.S. Geological Survey, 2023d).
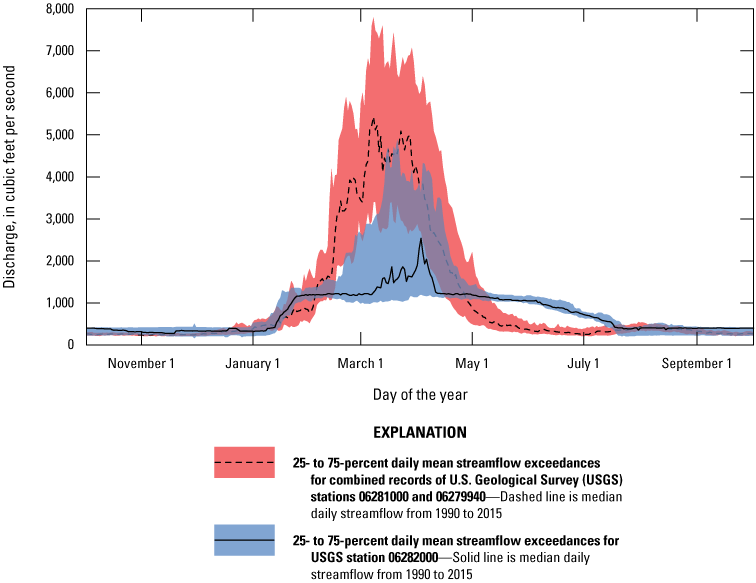
Exceedance hydrographs for the Shoshone River upstream and downstream from Buffalo Bill Dam using streamflow records from South Fork Shoshone River above Buffalo Bill Res, Wyoming (USGS streamgage 06281000; U.S. Geological Survey, 2023b), North Fork Shoshone River at Wapiti, Wyo. (USGS streamgage 06279940, U.S. Geological Survey, 2023c), and Shoshone River below Buffalo Bill Reservoir, Wyo. (USGS streamgage 06282000, U.S. Geological Survey, 2023d).
Peak streamflows recorded at Shoshone River below Buffalo Bill Reservoir, Wyo. (USGS streamgage 06282000; U.S. Geological Survey, 2023d), from water years 1921 to 2015 indicate that annual peak streamflow magnitudes likely declined after closure of the dam in 1910 and again after raising the height of the dam in 1993 (a water year is the 12-month period from October 1 through September 30 and is designated by the calendar year for which it ends). From 1921 to 1993, peak streamflows ranged from 1,290 to 17,300 ft3/s, with a mean of about 6,520 ft3/s; from 1994 to 2015, peak streamflows ranged from 1,330 to 8,550 ft3/s, with a mean of about 4,900 ft3/s (fig. 2). Examination of the 10-year moving average during the period of record (1921–2015) also indicates that peak streamflows declined after the 1930s (fig. 2), which may be associated with natural declines in peak streamflows observed in river basins elsewhere in the Western United States, changes in dam operations, or both (Stockton and Jacoby, 1976; Van Steeter and Pitlick, 1998; Allred and Schmidt, 1999; Grams and Schmidt, 2002).
Buffalo Bill Dam operations also alter the natural timing and magnitude of daily streamflows The upstream exceedance hydrograph (fig. 3) was constructed by summing the daily statistics for the South Fork Shoshone River above Buffalo Bill Reservoir, Wyoming (U.S. Geological Survey streamgage 06281000; U.S. Geological Survey, 2023b) and the North Fork Shoshone River at Wapiti, Wyo. (U.S. Geological Survey streamgage 06279940; U.S. Geological Survey, 2023c). A comparison of daily streamflow statistics upstream and downstream from Buffalo Bill Dam indicates the dam reduces daily mean streamflows relative to upstream during the spring runoff season from about late February through early May and elevates daily mean streamflows relative to upstream in late winter and summer to make room for spring runoff and to release water for irrigation demands, respectively (fig. 3). When the reservoir is releasing water for irrigation, daily flows are generally kept below 1,450 ft3/s, which is the current maximum flow capacity of Buffalo Bill Dam’s hydropower facilities (Mahonri Williams, Reclamation, oral commun., 2024); however, there are times during runoff when releases may be higher. Finally, the timing of elevated spring runoff flows appears to be later than the natural runoff pattern upstream from the dam, extending into July (fig. 3).
Fluvial Sediment Transport
Buffalo Bill and other large dams in the Bighorn River watershed accumulate sediments in their respective reservoirs, blocking fluvial sediment from being transported downstream and reducing storage capacities (Minear and Kondolf, 2009). Bathymetric reservoir surveys collected by Reclamation indicate mean unit sediment yields vary from 191 to 924 tons per year per square mile (tons/yr/mi2; table 1). Resurveys of Buffalo Bill Reservoir have shown that the combined sediment yields (annual mean sediment yields) of the North Fork Shoshone River and South Fork Shoshone River deliver between about 1 and 1.4 million tons per year (tons/yr) of sediment (table 1). Bathymetric surveys of Bighorn Lake, which receives sediment from the Shoshone and Bighorn Rivers, have shown that these rivers deliver a combined total of between about 2.0 and 4.2 million tons/yr of sediment (table 1).
Table 1.
Sediment accumulation data for large reservoirs in the Bighorn River watershed, Wyoming and Montana, 1941–2017.[All data based on data from Blanton (1991), Ferrari (1996), Ferrari (2010), and Hilldale (2020); mi2, square mile; acre-ft, acre-foot; lb/ft3, pound per cubic foot; ton/yr, short ton per year; ton/day/mi2, ton per day per square mile]
Estimates of basin sediment yields made from reservoir surveys are dependent on assumptions of sediment density, which can vary with time because of compaction and reservoir operations (Strand and Pemberton, 1982), but daily fluvial suspended-sediment records available for the Shoshone River at Kane, Wyo. (USGS streamgage 06286200; U.S. Geological Survey, 2023e), and the Bighorn River at Kane, Wyo. (USGS streamgage 06279500; U.S. Geological Survey, 2023f), corroborate the sedimentation rates calculated from bathymetry. The suspended-sediment records were computed using the method of Porterfield (1972), which uses a combination of frequent suspended-sediment measurements and the hydrograph to compute daily suspended-sediment loads. At the USGS streamgage 06286200, the USGS measured suspended sediment from 1960 to 1964 and reported annual sediment yields ranging from 0.7 to 2.7 million tons/yr, and an average of 1.6 million tons/yr (533 tons/yr/mi2; table 2). Measurements on the USGS streamgage 06279500 were made from 1949 to 1964 and resulted in annual sediment yield estimates ranging from about 1.6 to 8.6 million tons/yr, with an average of about 5.0 million tons/yr (319 tons/yr/mi2; table 2).
Table 2.
Statistics of total annual suspended-sediment yields for U.S. Geological Survey streamgages, Shoshone River at Kane, Wyoming (06286200, U.S. Geological Survey, 2023e) and Bighorn River at Kane, Wyoming (06279500, U.S. Geological Survey, 2023f) in the Bighorn River watershed, Wyoming, 1949–60.[All data from the U.S. Geological Survey National Water Information System (U.S. Geological Survey, 2024b); USGS, U.S. Geological Survey; ID, identifier; mi2, square mile; ton/yr, ton per year; ton/mi2/yr, ton per square mile per year]
Bed material transport conditions were also estimated for the Shoshone River upstream and downstream from Willwood Dam in response to the sediment released from the dam in 2016. These estimates were centered on understanding the potential to mobilize fine sediment clogging the interstices of spawning gravels used by trout. McElroy (2017) used measurements of bed material grain sizes and channel hydraulic geometry to estimate the magnitude of streamflow necessary to mobilize the gravel streambed of the Shoshone River. McElroy (2017) estimated a minimum streamflow of about 4,000 ft3/s sustained for approximately 2 weeks was needed to mobilize the bed material and evacuate and fully remove the fine sediment deposited in the channel from the 2016 sediment release. Cotton (2020) used stream velocity measurements to measure bed shear stresses upstream from Willwood Dam, and estimated streamflows of approximately 5,300 ft3/s sustained for at least 2 days were needed to fully mobilize the gravel bed and transport fine sediment out of the study area. McElroy (2021) investigated bed-material grain sizes and mobilization in two side channels of the Shoshone River near Cody, Wyo., and concluded that the side channels had similar grain sizes as the main channel and thus would likely be fully mobile under the conditions determined by Cotton (2020).
Willwood Dam
Willwood Dam was built with three sluice gates at the base of the dam intended to pass sediment. These gates are typically referred to as the “north,” “middle,” and “south” gates based on their location along the dam. Since the mid-20th century, excess accumulation of sediment behind the dam must occasionally be released through the sluice gates. Prior to 1982, sediment releases, often referred to as “sluicing” events, caused disruptions to municipal water-supply intakes (Bonner, 2002) and occasionally resulted in fish kills (Willwood Work Group 2, 2019). In 1982, WID and WYDEQ entered into an agreement whereby increases in water turbidity would be limited to no more than 10 nephelometric turbidity units (NTUs) between the upstream and downstream river reaches (Stone and Webster Engineering, 1982).
Bathymetric surveys of the pool behind Willwood Dam made in the late 1960s and sediment loading analyses made in the 1980s estimated that, in the absence of annual releases, the pool behind the dam accumulated approximately 200,000 to 210,000 yd3 (about 190,000 to 200,000 tons using a sediment density of 70 pounds per cubic feet) of sediment per year (Stone and Webster Engineering, 1982). An analysis of hydroelectric feasibility published in 1982 concluded that the turbidity limits would “quite likely…seriously restrict sluicing…resulting in a more filled-in reservoir” (Stone and Webster Engineering, 1982, p. III-2). Notes handwritten by WID staff indicate that the south gate was discovered to have a bent stem on August 8, 1974 (Travis Moger, WID, written commun., August 11, 2023). By 2009 a detailed inspection and assessment of Willwood Dam concluded that the south and middle sluice gates were “buried by siltation and have been nonoperable for some time” (Engineering Associates, 2009, p. 14). In 2014, an air injection method was used to mobilize sediment deposited against the back of the dam and allowed the middle gate to be repaired and operational again (Mathers, 2015; WYDEQ, 2022).
Willwood Dam has been in place for nearly a century and is an important component of Park County’s agricultural infrastructure and economy (DJ&A, 2021). The sediment accumulation and sluicing problem at the dam has been happening since at least the mid-20th century (Bonner, 2002) and continues to collide with the river’s legally designated and regulated uses, as well as with a growing recreation and tourism economy that benefits from the fishery in the Shoshone River. Previous work has indicated that siltation at the upstream face of Willwood Dam may pose long-term structural problems, and that the water quality restrictions in combination with siltation of the sluice gates impose operational limitations on the dam (Stone and Webster Engineering, 1982; Engineering Associates, 2009). Shih and others (2009) used a hydraulic and sediment transport model to examine the effects of different sediment removal and sluicing scenarios on the life of the dam. That study concluded that partial removal of sediment near the upstream dam face (approximately 255,000 yd3), combined with changes in seasonal sluice gate operations, could extend the life of the dam by 50 years. However, Shih and others (2009) did not examine upstream sources or variability of annual sediment volumes deposited behind the dam and, instead, assumed that nearly all the incoming sediment was derived from “channel bed erosion and bank erosion” (Shih and others, 2009, p. 2) on the main channel of the Shoshone River.
Hypothesized Sources of Sediment in Study Area
Data collection efforts by WRK2 and WRK3 since 2017 have indicated that the sediment system contributing to sedimentation at Willwood Dam is complex (this report). Discrete suspended-sediment measurements (individual physical samples collected in the field and analyzed by a laboratory) and continuous turbidity monitoring by the USGS have indicated that snowmelt and rainfall runoff events increase turbidity in short-duration (less than [<] 1 day) wave-like events, with measured suspended-sediment concentrations (SSCs) as high as 30,000 milligrams per liter (mg/L) upstream from Willwood Dam (U.S. Geological Survey, 2023g, 2023h). These events are assumed to come from the steep, arroyo-like badlands of the McCullough Peaks area, which directly abuts the southern bank of the Shoshone River for a length spanning from the Willwood Dam to approximately 9.5 mi upstream (fig. 1B–C). These sedimentation events have been observed to happen with relatively small changes in river discharge, indicating a complex, potentially weak relation between river discharge and SSC; this weak relation is common in many rivers, driven by hysteresis in one or more size classes of sediment in transport (Gray and Simões, 2008; Topping and Wright, 2016; Dean and others, 2022).
Continuous monitoring of turbidity also has demonstrated that human-caused sediment release events from Iron Creek Dam, a small dam operated by the Shoshone Irrigation District, contribute sediment in short-duration high-concentration waves (U.S. Geological Survey, 2023g, 2023h). These sediment release events typically take place at the end of irrigation season when irrigation water stored in Iron Creek Reservoir by Iron Creek Dam is released down Iron Creek (fig. 1B). Alternatively, data collected on tributaries by WRK3 have indicated that some tributaries deliver moderate concentrations of suspended sediment, but the deliveries may be over more extended periods of time (days to weeks; National Water Quality Monitoring Council, 2024). These data suggest that some tributaries may be delivering substantially more sediment than others, and that elevated sediment levels are potentially related to human activities on the landscape.
Purpose and Scope
The purpose of this report is to summarize the findings of a study of the fluvial sediment dynamics in the Shoshone River and its tributaries between Buffalo Bill Dam and Willwood Dam (fig. 1B). The study used a combination of hydroclimate data, continuous measurements of turbidity and acoustic backscatter (ABS), and discrete suspended- and bedload-sediment measurements taken during calendar years 2017 through 2023 to quantify the conditions and circumstances of loads of suspended sediment into and out of Willwood Dam and infer the sources of those sediments. Continuous and discrete measurements of suspended sediment were made in the main-stem Shoshone River at USGS streamgages 06284010, 06283995 upstream and downstream from Willwood Dam, and discrete measurements of suspended and bedload sediments were made in tributaries.
These data were combined to describe annual fine sediment loads moving into the dam pool and out of the dam, dynamics of the sediment accumulation behind the dam, and how operations of the dam affected sediment movement. Additionally, an evaluation of sediment yields from tributaries to the Shoshone River and the role of the magnitude and frequency of precipitation events in generating high concentrations of suspended sediment provides perspective on how the landscape upstream from Willwood Dam generates and delivers fine sediment to the river.
Approach
A sediment budget approach was used to quantify sediment dynamics in the study area (Reid and Dunne, 1996). For a given segment of stream, the term “sediment budget” refers to the mass balance of sediment incoming from upstream relative to sediment exported at the downstream end of the segment. The sediment balance can be expressed as a simple mass balance statement using equation 1:
whereSSLupstream
is the mass of sediment incoming to the segment measured during an observation period,
SSLdownstream
is the mass of sediment exported from the segment measured during the same period,
Δstorage
is the change in sediment storage between the upstream and downstream locations, and
ε
is the error term.
The ∆storage term refers to deposition or erosion of sediment within the stream segment between the upstream and downstream locations. If unmeasured tributaries bring sediment into the segment between the upstream and downstream measurement locations, the mass balance cannot be closed and the SSLdownstream term may include sediment loads from tributaries in addition to sediments deposited or eroded between streamgages. In the case of Willwood Dam, a portion of the suspended-sediment load is also exported into the Willwood Canal (fig. 4). The error term, ε, refers to error for any model-based predictions of suspended-sediment load.
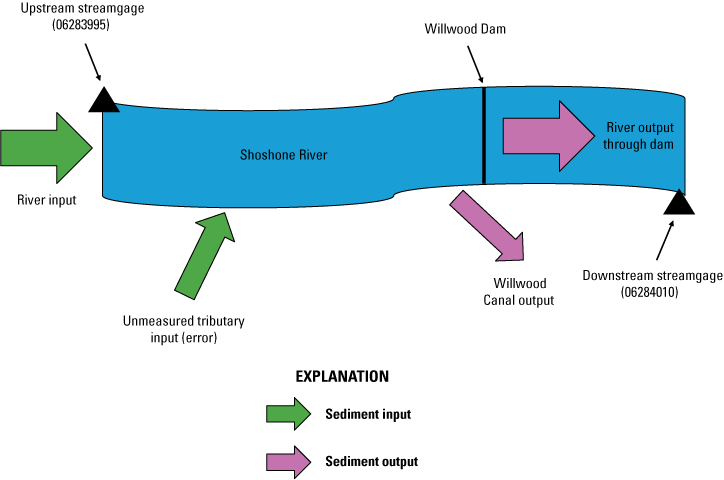
Conceptual model of sediment budget for Willwood Dam on the Shoshone River, Wyoming.
Methods
Sediment transport in any river is a complex function of the river’s energetic capacity to carry sediment and the supply of sediment available for transport (Church, 2006). In many rivers, suspended-sediment transport is not strongly related to streamflow (Gray and Simões, 2008); thus, high temporal resolution records of suspended-sediment transport must be built and combined with other contemporaneous information to adequately quantify loads and determine sources of sediment. Hydroclimatic records and knowledge of human-caused events were combined with direct and surrogate measurements of sediment transport to identify sediment sources and quantify the magnitudes of fine sediment contributions to the Shoshone River in the study area.
Characterization of Hydroclimatic Conditions
Sediment delivery and transport in river systems is driven by a combination of the forces that mobilize sediment on the landscape and the capacity of receiving streams to transport that sediment. In the study area, snowmelt, rainfall, and irrigation-related activities on the landscape (such as overturn of fields, irrigation return flow seepage into ephemeral stream channels) are hypothesized to be the primary forces mobilizing sediment from the landscapes draining to the Shoshone River, and releases from Buffalo Bill Dam are the primary determinant of streamflow magnitude and associated sediment transport capacity of the Shoshone River. Because the study period was limited, it is important to understand the hydroclimatic conditions during the study period relative to those observed in the study area in previous years.
Operational Modes of Willwood Dam
Willwood Dam has two primary operational modes associated with irrigation season and nonirrigation season (hereafter referred to as “fallow” season). During the irrigation season, the sluice gates on the dam are adjusted such that the Shoshone River rises behind the dam and reaches the elevation of the Willwood Canal headgate to deliver water to irrigators (Shih and others, 2009). During the fallow season, the sluice gates are adjusted to bring the elevation of the Shoshone River behind the dam below the elevation of the canal headgate to protect it from winter ice formation (fig. 5). Previous reports have indicated that the typical water level during the fallow season is around 14 ft below the canal intake (Stone and Webster Engineering, 1982).
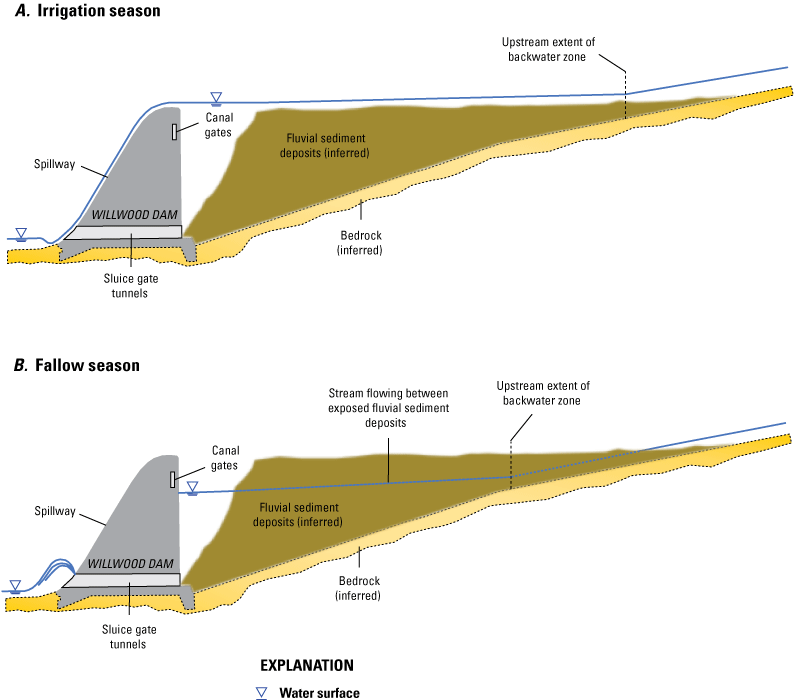
Schematic depicting Willwood Dam operation modes. A, Irrigation season. B, Fallow season. Schematic is for illustration purposes only and is not an accurate depiction of Willwood Dam dimensions, its features, or the bed or fluvial sediment deposits behind Willwood Dam.
These operational modes were hypothesized to have differing effects on sediment transport. When the dam is spilling over the top, we hypothesized that sediments passing over the dam are likely the “washload,” which is the portion of the sediment load composed of fine sediments that are nearly always in suspension, often assumed to be those less than 0.0625 mm, and colloquially referred to as “mud” (Julien, 1995). When streamflow is passing only through the sluice gates of the dam, the water surface slope behind the dam is steeper, and it is hypothesized that the stream has enough energy to transport sand grains (particles with nominal diameters between 0.0625 and 2 mm) in suspension, and that sand and coarse grains rolling on the river bed (bedload) have the potential to move through the dam. Because the sluice gate openings are used to regulate pool elevation during the irrigation season, there are times when streamflow is spilling over the top of the dam and going through the sluice gates. Under these mixed conditions it is hypothesized that suspended-sediment load and bedload can pass through the dam.
Because the two operation modes of Willwood Dam likely have a substantial effect on upstream channel hydraulics and sediment transport, boundaries were defined on the typical irrigation and fallow season for analysis of data in the context of historical conditions. Reclamation (Mahonri Williams, Reclamation, written commun., 2023) provided data, with the first year of information in 1996, that were used to identify the first and last days when water was flowing into Willwood Canal. The median starting and ending days for the available period of record (1996–2018) rounded to the nearest fifth day in the month (1, 5, 10, 15, 20, 25, or 30), were used to define the typical irrigation and fallow season periods.
Precipitation and Temperature
Daily precipitation and temperature data were used to quantify hydroclimatic conditions in the study area during the study period relative to “normal” values, defined here as a median or mean value from data taken from a reference period of record. Daily precipitation was obtained using the AN81d dataset from the Parameter-Elevation Regressions on Independent Slopes Model (PRISM) available from the PRISM Climate Group at Oregon State University (PRISM Climate Group, 2021). The AN81d daily precipitation dataset is available in gridded format at a 4-kilometer resolution and has a daily period of record spanning from January 1981 to the present. Gridded estimates of mean daily precipitation from the PRISM dataset were subset to the study area basin. The spatially averaged mean daily precipitation for each subbasin was taken as the simple arithmetic mean of the data points within each subbasin using equation 2:
whereis the spatially averaged precipitation on a given day for basin j, in millimeters; and
nj
is the total number of data points from the AN81d daily precipitation dataset within basin j.
The spatially averaged data were then compiled for each day to create a daily mean precipitation (mean precipitation value for each day) record for the irrigation and fallow seasons for the 1981 to 2018 period of record preceding the study period.
In the same manner described previously for precipitation data, a daily record of average temperature was created by spatially averaging data subset to the watershed boundary (fig. 1A):
whereis the spatially averaged precipitation on a given day for basin j, in degrees Fahrenheit; and
nj
is the total number of data points from the AN81d daily precipitation dataset within basin j.
The daily precipitation and temperature records were used in tandem to build measures of precipitation and temperature hypothesized to be broad measures of the potential for the study area to yield sediment. The AN81d daily precipitation record from PRISM is reported in units of liquid precipitation, and the daily temperature record was used to determine if the precipitation on the landscape was likely falling as liquid, solid, or a mixture. For days with at least a trace of precipitation, if the daily mean temperature was less than 22 °F, precipitation was assumed to be all solid (snow), and if the daily mean temperature was greater than 42 °F, precipitation was assumed to be all liquid (rain); for mean daily temperatures between 22 °F and 42 °F, precipitation was assumed to be mixed snow and rain. The temperature assumptions, although arbitrary, incorporate the fact that daily mean temperatures in the AN81d data are the average of the estimated minimum and maximum temperatures, and that the precipitation phase is affected by air temperature at the point of origin and near-surface air temperature.
Daily precipitation normals during the period of record were defined as the median total precipitation and number of dry (no precipitation), rain, mixed, and snow days for the fallow and irrigation seasons. Temperature during the period of record was quantified as mean temperatures during the fallow and irrigation seasons, as well as extreme cold temperatures during the fallow season. Mean temperatures during irrigation and fallow seasons were taken as the median of daily mean temperatures for the selected period. Cold days and extremely cold days were arbitrarily defined as days with mean temperatures between 10 and 22 °F, and less than 10 °F, respectively. Because cohesion of sediments has been shown to be inversely related to air temperature (Levy and Cvijanovich, 2023), the number of extreme cold days was used as a relative measure of cohesion of sediment on the landscape behind the dam. All measures of daily precipitation and temperature were then quantified for the irrigation and fallow seasons in 2019, 2020, and 2021 and compared against the 1981 to 2018 period of record normal.
Continuous Monitoring of Streamflow and Suspended-Sediment Surrogates
Two USGS streamgages were used to continuously monitor streamflow and sediment surrogates (turbidity and ABS) upstream and downstream from Willwood Dam. The USGS streamgage at Shoshone River above Willwood Dam, near Ralston, Wyo. (streamgage 06283995, U.S. Geological Survey, 2023g), hereafter referred to as the “upstream streamgage,” was established in October 2018 and is approximately 1.7 mi upstream from Willwood Dam on the left (north) bank of the river (fig. 1C). The USGS streamgage at Shoshone River below Willwood Dam, near Ralston, Wyo. (streamgage 06284010, U.S. Geological Survey, 2023h), hereafter referred to as the “downstream streamgage,” was established in November 2017 and is approximately 1,500 ft downstream from the spillway face of Willwood Dam on the right (north) bank of the river (fig. 1C). Field operations indicated that changes in water level at the upstream streamgage could be substantial between the two primary modes of operation of Willwood Dam (spilling or passing through sluice gates), indicating that stages at the streamgage were affected by backwater from Willwood Dam.
Optical and ABS measurements were used as surrogates for SSC at each streamgage. Optical measurements can have substantial bias when the relative concentrations of sand, and silt and clay change (Landers and Sturm, 2013; Merten and others, 2014; Manaster and others, 2020). The sensitivity of certain frequencies of ABS can be tuned to a narrow range of suspended-sediment grain sizes, typically sand, making these sensors less prone to bias for different mixtures of sand and mud (Merten and others, 2014; Landers and others, 2016; Topping and Wright, 2016; Manaster and others, 2020). The optical and acoustic signals were interpreted as relative measures of the concentrations of suspended mud and sand, respectively.
An Analite NEP-5000 turbidity sensor was used to measure optical backscatter using International Organization for Standardization Method 7027, with near-infrared wavelength beams, and a single light detector oriented at 90-degrees from the incident light path and is described in detail in Observator Instruments (2020). Native reporting units listed by the manufacturer are nephelometric turbidity units, but the reporting units in the USGS National Water Information System (NWIS) database (U.S. Geological Survey, 2024b) were formazin nephelometric units (FNUs), which are numerically equivalent to nephelometric turbidity units (International Organization for Standardization, 2016).
A Sequoia LISST–ABS sensor (Sequoia Scientific, Inc., 2017) was used to measure ABS. The ABS sensor emits an 8-megahertz acoustic signal into the water column and measures the signal backscatter intensity returning to the instrument from the sampling volume within 6 inches (in.) of the sensor face (Sequoia Scientific, Inc., 2017). The ABS measured by the LISST–ABS sensor is translated directly to a measure of SSC via mathematical relation of the scattering intensity, in micrometers (Agrawal and others, 2019). The ABS sensor can measure SSC as high as 30,000 mg/L (Sequoia Scientific, Inc., 2017) but has been shown to have low precision at concentrations of 10 mg/L or less (Alexander and others, 2023).
Continuous monitoring of turbidity began at the downstream and upstream streamgages in March and October 2018, respectively. Continuous monitoring of ABS began at the upstream and downstream streamgages in March and April 2019, respectively. Measurements from the sensors were recorded, and provisional data were provided to the public in 15-minute increments through NWIS (U.S. Geological Survey, 2024b). In 2018, the sensors were housed in the annulus of polyvinyl chloride pipes secured to the banks of the river. However, the sensors were moved to a suspension deployment (fig. 6) in the fall of 2018 after high flows in the summer of 2018 compromised the initial deployment configurations. The suspension deployments consisted of side-by-side aluminum housing tubes suspended from a cable into the river, approximately 7 to 10 ft from the bank. The faces of the sensors were staged within 0.5 in. of the end of the tubes, and the tubes could be adjusted vertically. Typical submergence depths were between 6 and 12 in. from the water surface, although these depths changed depending on stage and velocity and were adjusted on site visits as needed.

Equipment deployment configurations for streamgages in the study area. A, Shoshone River above Willwood Dam, near Ralston, Wyoming (upstream streamgage; 06283995, U.S. Geological Survey, 2023g). B, Shoshone River below Willwood Dam, near Ralston, Wyo. (downstream streamgage; 06284010, U.S. Geological Survey, 2023h). Photographs by Jason S. Alexander, U.S. Geological Survey.
Quality Control of Continuous Monitoring
Biofouling and calibration checks of the deployed turbidity sensors were made by field personnel typically once every 6 weeks. These checks followed the methods described in Wagner and others (2006), and included removal of debris, light scrubbing to remove algae, and cleaning or replacement of the optical sensor lens wiper. A secondary field turbidity sensor was used to check the relative accuracy of the deployed sensors during site visits. Turbidity cross sections, which quantify any differences between turbidity observations at the continuous monitor relative to the complete channel, were taken twice a year to quantify any potential differences between the sediment concentrations at the sensors and the rest of the channel.
The LISST–ABS sensors were less sensitive to algae growth, but the signal could become compromised by debris interference. At the time of the deployments, there was no established method for checking calibrations on the ABS sensors, and the primary quality control method was to remove them and send them to the manufacturer for annual re-calibrations, resulting in gaps in the data record, which happened in the winter 2019–20 period. In the winter 2020–21 period, the ABS sensors that were removed for re-calibration were immediately replaced with calibrated sensors. Portable LISST–ABS sensors were not available for making cross-sectional measurements, and we relied on the turbidity cross sections as the primary indicator of sediment mixing.
Discrete Sampling of Suspended Sediment
Discrete suspended-sediment samples were taken by the USGS, WYDEQ, and WID at streamgages near Willwood Dam starting in 2018 using a variety of methods. Suspended-sediment sampling was targeted to represent the range of turbidity and ABS conditions observed in the continuous record. Under steady streamflow conditions (constant stage and turbidity), two suspended-sediment samples (A and B sets) were taken concurrently using a US DH-74 depth-integrating water-quality sampler (Davis, 2005) using the 10-station equal-width increment (EWI) or 4-station equal-discharge increment (EDI) methods (Edwards and Glysson, 1999). These sequential samples provided quality control on the resulting concentrations.
At both streamgages, a single SSC sample required approximately 10 minutes to collect under optimal performance with the bank-operated cableway. When conditions (stage or turbidity) were changing rapidly, only single sample sets (A set) were taken using the EWI or EDI methods. In some cases, field judgements indicated that sample conditions may have been noncompliant with the EWI or EDI methods and these samples were labeled as “multiple verticals” or “non-isokinetic” if an EWI or EDI station was not sampled because of local conditions (for example, debris or heavy wind) or a bottle was judged to be overfilled, respectively. If a storm caused a spike in turbidity or ABS, and USGS personnel could not be on site, WID personnel collected either a single, depth-integrated sample using the US D-74 at midchannel or collected a grab sample with a 1-liter plastic bottle along the bank.
Automatic pumping samplers were installed at both streamgages in the summer of 2019 and were on site through the summer of 2020. Pump samples were used to capture high-concentration events at each site, which often occurred rapidly and, in some cases, overnight when conditions were unsafe for personnel to be on site. The pump samples were typically triggered during turbidity conditions higher than 300 FNUs and were taken sequentially every 30 minutes until all sample bottles (24) were full or turbidity receded below the threshold. At the upstream streamgage, the pump intake was secured to the outside of the sensor tube housing; at the downstream streamgage, the pump intake was secured along an aluminum I-beam protruding approximately 6 ft into the channel.
Suspended-sediment samples were analyzed at the USGS Wyoming-Montana Water Science Center sediment laboratory in Helena, Montana, and the USGS Central Midwest Center Science Center Iowa sediment laboratory, in Iowa City, Iowa. Samples were analyzed for SSC, and some samples were also analyzed for percentage of sample composed of grain sizes finer than 0.0625 mm (silt and clay) using the methods described in Guy (1969).
Statistical Modeling of Suspended-Sediment Concentrations in the Shoshone River
Suspended-sediment concentrations and loads in the Shoshone River were modeled from the turbidity and ABS records following the procedures outlined in Rasmussen and others (2009). Discrete SSC data were visually examined using scatterplots with streamflow, turbidity (FNUs), and ABS (milligrams per liter, 75–90-micrometer diameter glass beads) as the independent variables. Initial evaluations demonstrated that discharge was only weakly correlated to SSC, and its use as a predictor variable was not explored further. In most cases, the paired values of turbidity and ABS were taken directly from the record in NWIS (U.S. Geological Survey, 2024b) by averaging the two values nearest in time on either side of the discrete SSC sample, or the exact value when the sample time was recorded on a 15-minute whole value. However, in some cases, the turbidity or ABS value from the 15-minute record was absent because of equipment malfunction or because that portion of the record was deemed to be of low quality. In such cases, the field turbidity value (taken from the field turbidity sensor used during the site visit) was used for modeling. No field-based (secondary ABS sensor used during the site visit) ABS data were available for statistical modeling but, in some cases, median ABS values from the site sensor were recorded at the beginning and end of a sample period and, if these values were determined to be reasonable compared to the 15-minute record, they were paired with the SSC sample value for modeling.
Samples taken closely spaced in time are often correlated (serial correlation), which can introduce bias in statistical models through overrepresentation of a narrow set of conditions (Rasmussen and others, 2009). Serial correlation was evaluated and removed in two ways. First, sample pairs (A and B sets) were evaluated for representation and, if within 10 percent of each other, their values were averaged to a single point estimate. In rare cases, one of the sample pairs was evaluated to be an outlier and the nonoutlier value was used without averaging. Next, scatterplot evaluation and initial statistical model diagnostics indicated that pump samples had substantial serial correlation causing violations of model assumptions. The number of pump samples were reduced by randomly drawing samples such that a maximum of one pump sample was present for each 1-percent quantile of the empirical cumulative distributions of turbidity and ABS. This reduction was done using the “rsamp” function in language R (R Core Team, 2021) with a seed value of “307.”
Measurements of turbidity and ABS associated with each discrete SSC sample were evaluated for their range of natural conditions by calculating their quantiles within the empirical cumulative distribution function (ECDF) of the continuous records available in NWIS (U.S. Geological Survey, 2023g, 2023h). The ECDF of the continuous turbidity and ABS records and the quantile estimates of the turbidity and ABS values paired with discrete SSC measurements within the ECDF were calculated using the “ecdf” function in language R (R Core Team, 2021).
Single-variable linear least-squares regression models were used to predict SSC using turbidity and ABS as explanatory variables. The models took the following form:
whereSSC
is the suspended-sediment concentration, in milligrams per liter;
ꞵ0 and ꞵ1
are the model intercept and slope coefficients, respectively; and
xi
is the ith measurement of the explanatory variable (turbidity or ABS).
The base-10 logarithm (log10) transformed model was used because exploratory analysis indicated it was more compliant with the fundamental assumptions of linear least-squares regression (constant variance and normally distributed residuals) than nontransformed models. Each model was evaluated for homoscedasticity using the Breusch-Pagan test (Breusch and Pagan, 1979) and for bias from serial correlation using the Durbin-Watson test (Durbin and Watson, 1950). The predicted residual error sum of squares statistic was used as a primary measure of relative performance of each model. Log-transformed predictions of SSC statistical models were corrected for bias using the nonparametric bias correction factor of Duan (1983).
Sediment loads were computed for all available pairs of continuous turbidity and streamflow and ABS and streamflow data at each streamgage. Prediction intervals on predicted values of SSC were calculated using the “predict” function on each data model in language R (R Core Team, 2021). Sediment loads were calculated using equation 5:
whereSSLi
is the suspended-sediment load (SSL), in tons per second;
SSCi
is the suspended-sediment concentration (SSC), in milligrams per liter;
Qi
is streamflow for the ith value, in cubic feet per second; and
ci
is a constant for unit conversion.
Sediment loads over each 15-minute period were calculated using equation 6:
whereSSLn
is the calculated suspended-sediment load during the 15-minute time interval (n);
SSCi
is the suspended-sediment concentration, in milligrams per liter;
Qi
is streamflow for the ith value, in cubic feet per second;
ti
is the time of the ith measurement; and
ci
is a constant for unit conversion.
Construction of Basic Sediment Budgets
Sediment budgets require that a sediment load estimation is available for inputs and outputs over a given time interval (eq. 1). Sediment moving into and out of Willwood Dam must travel nearly 2 mi between streamgages, and thus an estimate of sediment travel time was considered essential for the accuracy of sediment budgets calculated for shorter time intervals (days or less). Time-of-travel between streamgages was estimated using cross-correlation analysis of the turbidity time-series whereby the lag with maximum correlation was assumed to represent the strongest overlap in sediment behavior between streamgages. Sediment loads calculated for the upstream streamgage were subtracted from the sediment loads calculated for the downstream streamgage offset by the estimated travel time such that a negative value indicated more sediment entered the dam pool than exited through the dam.
Sediment Load Partitioning
Sediment loads calculated at 15-minute intervals were summed at each streamgage to build sediment budgets (eq. 1) during various larger time intervals of interest. To quantify the relative balance of sediment into and out of Willwood Dam, as well as to understand the relative contribution of various sediment sources, sediment loads were partitioned into three primary time intervals: seasonal, dam releases, and runoff events. These intervals were chosen to quantify sediment budgets from agricultural dam operations, scheduled sediment releases, and natural sediment runoff events, respectively.
Seasonal Sediment Budgets
Seasonal intervals were restricted to summing the total number of observations during each irrigation and fallow season between spring 2019 and fall 2021. The boundaries of these seasons were identified using data from WID whereby the first observation in spring when flow entered Willwood Canal was the beginning of the irrigation season and the last day that water was in the canal was the first day of fallow season. It should be noted that the boundaries of these seasons are close to the major seasonal operational shifts at Willwood Dam affecting sediment transport discussed in the “Operational Modes of Willwood Dam” section but are not identical. For example, when the elevation of the pool behind the dam exceeds 4,499.0 ft above sea level (Stone and Webster Engineering, 1982) the dam begins spilling, but water does not flow into Willwood Canal until the canal gates are opened, which is not necessarily on the same day as spilling begins. Likewise, flow in the canal can cease before or after the pool elevation drops below 4,499.0 ft above NAVD 88 because the elevation of the canal gates is 4,487.0 ft above sea level (Stone and Webster Engineering, 1982; Shih and others, 2009).
Sediment Budgets from Dam Releases
Sediment loads were also quantified during time periods associated with “dam release events,” which are defined hereafter as those events that took place when dam operations are deliberately altered with the intention of mobilizing and passing fine sediment into the Shoshone River. Historically, these kinds of events included (1) dam releases colloquially referred to as “sediment sluicing” events, which have taken place in most years at Willwood Dam, typically in the weeks preceding the start of irrigation season; and (2) sediment releases from an irrigation dam on Iron Creek (fig. 1), which have typically taken place at the end of each irrigation season. During the study described in this report, dam releases also included scientific experiments with specific turbidity or sediment concentration targets intended to build understanding of the effects of dam operations on downstream sedimentation. For the primary study period described herein, sediment budgets were constructed for two Iron Creek Dam releases, three typical sediment sluicing events from Willwood Dam, and two scientific experiments at Willwood Dam. The start and end dates and times of each of these events were known amongst members of Willwood Work Group 2 and were used to set the time boundaries on their respective sediment budgets.
Sediment Budgets from Runoff Events
Sediment loads were quantified for sediment events deemed to be associated with natural runoff processes to better understand how much of the sediment load during each seasonal period was associated with uncontrolled runoff. Natural events were identified by visually inspecting the 15-minute turbidity and ABS records and identifying spikes (rapid increases) in observed values. The record from the upstream streamgage (06283995; U.S. Geological Survey, 2023g) was used to identify suspended-sediment spikes because it is unaffected by sediment releases from Willwood Dam and thus more accurately reflects increases in SSC from natural runoff. Because the shape of the sediment runoff curve changed between observations at the upstream and downstream streamgages, sediment loads were summed for the entire day of the event to reduce operator bias identifying when a runoff event ended. If the event lasted across more than 1 day, then loads for all days were summed and used to construct sediment budgets.
Tributary Yields
Discrete sediment yields were quantified in select tributaries (fig. 7) to describe variability of loading to the Shoshone River. Ranges of tributary sediment yields defined here as a mass of sediment per unit of time were calculated using discrete measurements of streamflow, SSC, and bedload. The measurements and samples were taken between 2017 and 2023 and targeted two primary conditions, stable (nonevent) and precipitation runoff, in irrigation and fallow seasons, for a total stratification of four different conditions (irrigation season-stable, irrigation season-runoff, fallow season-stable, fallow season-runoff). Streamflow measurements were taken on each sampling visit using a Marsh-McBirney Flo-Mate following methods outlined in Turnipseed and Sauer (2010). Suspended-sediment measurements were taken using the EWI method using a US DH-48 or US DH-81 sampler (Edwards and Glysson, 1999). Bedload samples were taken using the EWI method using a Helley-Smith type trap sampler (Emmett, 1980) with a 3-in. nozzle width. The suspended-sediment and bedload quantities were reported as discrete values and were normalized by drainage area to compare with ranges of long-term averages observed in reservoir surveys and past fluvial sediment measurements.

Location of Shoshone River tributaries sampled during calendar years 2017–23.
Analysis of Planimetric and Bathymetric Data in the Willwood Dam Pool
An aerial imagery analysis was used to identify changes in the water surface and channel characteristics behind the dam for multiple images between the irrigation seasons of 2012 and 2022. A bathymetric survey analysis was used to identify changes in channel morphology and bed surface elevation between November 2017 and April 2022. Changes in characteristics were used as a proxy to identify changes in sediment storage within the channel.
Backwater Extent and Cross Sections
The backwater extent produced by Willwood Dam was digitized to evaluate the differences through time to help understand sediment deposition within the river channel. The backwater extents were manually digitized from georeferenced National Agriculture Imagery Program (U.S. Geological Survey, 2023i) aerial imagery in a geographic information system (GIS). Aerial images from irrigation seasons 2012, 2015, 2017, 2019, and 2022 were digitized to determine backwater extents (table 3). Images contained four bands and were viewed in true color, false color, and a normalized difference vegetation index raster for the digitizing process. Initial digitizing was performed using a scale ranging between 1:80 and 1:150 while switching between different views. Refinements were made from the initial digitized layer in an iterative process at scales ranging from 1:150 to 1:500, focusing on one view until the user was satisfied with all views. To help address human bias and keep the methodology as constant as possible, one individual digitized all images.
Table 3.
Data for aerial images used to digitize backwater extent behind Willwood Dam.[All data retrieved from U.S. Geological Survey Earth Explorer (U.S. Geological Survey, 2023i); dates shown in month/day/year format; NAIP, National Agriculture Imagery Program; USDA, U.S. Department of Agriculture; FSA, Farm Service Agency; APFO, Aerial Photography Field Office]
Images were obtained during irrigation season (table 3) when pool elevations behind the dam are relatively consistent between years (fig. 8B). Water extent was separated into active channel, island, and incipient floodplain classifications. The active channel is defined as obvious flow of water; these areas were easiest to identify in false color and the normalized difference vegetation index raster, as they appeared blue or black, respectively. Islands are defined as bars within the active channel that appear unsaturated and persist through time. Incipient floodplain surfaces or mud flats are defined as areas at the fringe of the active channel where it appears saturated, but it is less clear if there is flowing water or not. Incipient floodplain surfaces included areas with a mix of vegetation and water, saturated sediment, or algae, appearing as dissimilar in coloration compared to the surrounding area of distinct active channel or floodplain.
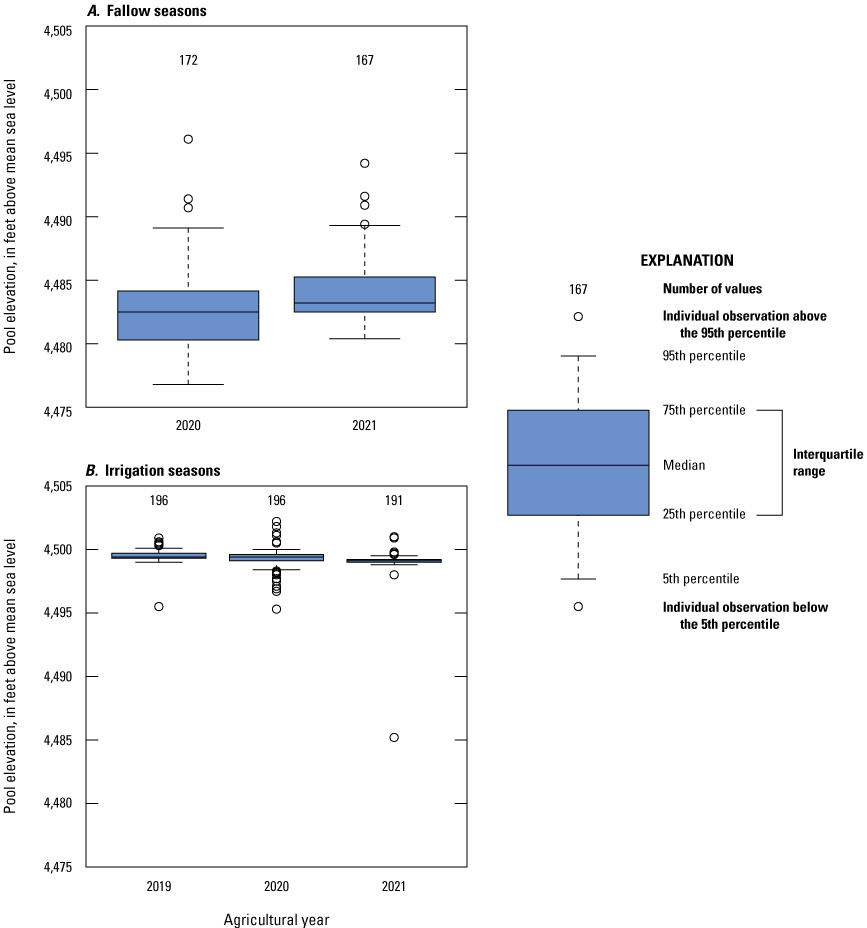
Pool elevations behind Willwood Dam during agricultural years 2019–22. A, Fallow seasons. B, Irrigation seasons.
A channel centerline was created using the midpoint line tool in ArcGIS Pro (Esri, 2023) on the 2017 channel bounds and used for generating all cross-sections for every year. Cross sections were placed along the channel centerline at 100-ft intervals. Cross sections were then clipped to each year’s active channel and total channel of the backwater extent and their widths were calculated. Cross-section widths were exported for statistical analysis in Wilcoxon rank sum tests (Bauer, 1972; Hollander and Wolfe, 1973) were used to evaluate differences in mean cross-section widths for each year. Because the images were not perfectly coregistered, the test was performed using the unpaired sample assumption to account for the additional uncertainty.
Sources of Uncertainty
Digital aerial images do not perfectly overlap in space, resulting in a slight offset, causing uncertainty in the location of features between images. This error in positioning is known as registration errors, which is the error resulting from the translation of aerial images into GIS (Gurnell and others, 1994). This uncertainty is important when comparing differences in measurements made in images taken in different years. To quantify the registration error, the root-mean-square difference (RMSD) was calculated between colocated points of identical features in each of the five images, based on methods outlined in Schaepe and others (2016). The RMSD is the mean distance between all the colocated points in an image compared to another images’ colocated points and is used to determine if differences in measurements are a result of the coregistration error or true detectable differences. Features were located in one image and then cross checked to determine if they still appeared in all images, which resulted in a total of 13 colocated points for each image. The RMSD was calculated for each of the years as a reference using equation 7:
whereRMSD
is the root-mean-square difference in horizontal position between colocated points of the target image and the reference image, in feet;
P(x)a
is the easting of the point on the reference image;
p(x)a
is the easting of the point on the target image;
P(y)a
is the northing of the point on the reference image;
p(y)a
is the northing of the point on the target image; and
n
is the total number of colocated points.
From the RMSD results, the 2019 image was chosen as the reference year because of its high spatial resolution and high contrast in all landscape features throughout the image. Using the 2019 image as the reference year, the RMSD was calculated between all the colocated points and the results were used in subsequent analyses.
The digitizing error or horizontal uncertainty, defined as the difference between the actual feature boundary and the digitized line drawn in GIS (Dunn and others, 1990), was estimated in two different ways. The first, again following the methods outlined in Schaepe and others (2016), summed the image resolution and the estimated uncertainty of choosing the feature boundary of 3 meters to determine the horizontal uncertainty. The second way, using the results of Dunn and others (1990), determined the percent area uncertainty, using a conservative epsilon band value of 3.1 meters, was between 3 and 10 percent.
Bathymetric Surveys
Bathymetric surveys were completed by Wyoming Game and Fish Department in November 2017 and WYDEQ in August 2019 and April 2022. The survey data contained x, y, z coordinates that were imported into ArcGIS Pro (Esri, 2023). The bathymetric survey data were taken using different instruments and survey designs and covered different extents of the backwater areas. The routing tools available in ArcGIS Pro were used to measure the distance of each survey point upstream from the dam along a common channel center line. The minimum bed elevation was then extracted from the surveys using 100-ft sampling intervals to construct a longitudinal profile of the thalweg behind Willwood Dam. Longitudinal profiles were only compared for overlapping areas, and the points nearest the dam were excluded because the resolution and overlap of the data were very different between each of the surveys.
Analysis of Frequency of High-Concentration Runoff Events
Observations of natural runoff events at the upstream streamgage indicated that these events could generate high magnitude SSCs, with one observation of approximately 30,000 mg/L (U.S. Geological Survey, 2023g, 2023h) after a late spring rainstorm (PRISM Climate Group, 2021). These high-concentration events have the potential to produce substantial accumulations of sediment behind Willwood Dam and are also potentially harmful to the fishery (Newcombe and Jensen, 1996) in the Shoshone River. To better understand the nature and frequency of high-concentration events, a model of rainfall and sediment runoff was constructed using the AN81d precipitation record and the SSC record estimated from the turbidity record at the upstream streamgage. A basic exponential relation was assumed between SSC and precipitation using equation 8:
whereSSCmod
is the SSC modeled from turbidity at the upstream streamgage, in milligrams per liter;
Ao
is a base SSC value for days when total accumulated precipitation (p) is greater than 0 inches;
p
is precipitation, in inches;
e
is Euler’s constant; and
k
is a growth constant.
The linear model was generated using language R (R Core Team, 2021) and fit using 1, 2, and 3 days of accumulated precipitation. The model statistical probability level (p-value) and coefficient of determination were used as basic diagnostics of best model fit, but the main purpose of the model was to gain inference on the precipitation conditions for generating elevated levels of suspended sediment in the Shoshone River. Precipitation on days when the temperature was greater than 42 °F was used to generate the model because snow was assumed to cause a lag in sediment runoff generation. The model intercept term, Ao, was interpreted as an estimate of the mean SSC on days with at least some rain, and the amount of precipitation (p) required to double this base value was interpreted as the beginning of rapid sediment runoff generation from the landscape upstream from Willwood Dam. The ECDF of the precipitation record was then used to extract the empirical frequency of storm events exceeding that value that happened during the 1981 to 2018 time period.
Fluvial Sediment Dynamics in the Shoshone River around Willwood Dam
Sediment dynamics during any selected period of time are affected by the hydroclimatic conditions within the watershed. The authors hypothesized that in the study area, snowmelt, rainfall, and irrigation-related activities on the landscape (overturn of fields, irrigation return flow seepage into ephemeral stream channels) are the primary forces mobilizing fine sediment throughout the landscape, and releases from Buffalo Bill Dam are the primary determinant of streamflow magnitude associated with the transport capacity of the Shoshone River in the study area.
Hydroclimatic Conditions
It was important to understand the hydroclimatic conditions during the study relative to previous years and to be able to place them in the context of differing dam operations because of the limited period of the study. Examination of precipitation records from agricultural years 1981 to 2018 (refer to the section “Characterization of Hydroclimatic Conditions”) indicates that the typical irrigation season is much wetter and much warmer than the typical fallow season. Daily precipitation and temperature data indicate that climate conditions in the study area were wetter and colder than the 1981–2018 period of record normal during agricultural year 2019, and conditions were drier and temperatures were near normal during agricultural years 2020 and 2021 (table 4).
Seasonal Operational Modes of Willwood Dam
Data from agricultural years 1996 to 2018 indicate that Willwood Dam began diverting water into the Willwood Canal between March 3 and May 9; diversions stopped between October 3 and as late as November 17. The median starting day of irrigation diversions was April 13, and the median ending day was October 23. For the purposes of examining historical hydroclimatic conditions, an irrigation season is defined as the period during which the Willwood Canal was in operation and was generally from April 15 to about October 24 of the same calendar year; the fallow season is defined as the nonirrigation period during which the Willwood Canal was generally not in operation and was commonly from about October 25 to about April 14 of the following calendar year. For the purposes of examining historical hydroclimatic and sediment-transport conditions, an agricultural year is thus defined as the 12-month period from October 25 through October 24 of the following year and is designated by the calendar year for which it ends.
Precipitation and Temperature Conditions
Median annual precipitation for the 1981 to 2018 period of record was 11.2 in., with a mean of 8.4 in. during the irrigation season and 2.8 in. during the fallow season (table 4). The study area had a median of 81 and 111 days with at least some precipitation during the fallow and irrigation seasons agricultural years 2019–21, respectively (table 4). During the 1981 to 2018 period of record, the fallow season had an average median of 25 cold and 10 extremely cold days, with a median mean temperature of 32 °F; the irrigation season had a median daily mean temperature of 58 °F (table 4).
Table 4.
Summary of climate conditions in the Shoshone River Watershed upstream from Willwood Dam, Wyoming, agricultural years 2019–21 relative to 1981–2018 period-of-record normals.[All data from the AN81d PRISM climate dataset (PRISM Climate Group, 2021). Agricultural year, defined herein as starting on October 25 and ending on October 24 of the following year; Fallow season, defined herein as starting on October 25 to April 14, which are the typical dates when irrigation water is not being carried in Willwood Canal; Irrigation Season, defined herein as starting on April 15 and ending on October 24, which are the typical dates when water is being carried in Willwood Canal; PPT, precipitation (assumed to be mostly liquid); in., inch; No., number; °F, degree Fahrenheit; --, not applicable]
Precipitation in agricultural year 2019 was near normal during the fallow season but was 5.6 in. above normal during the irrigation season (table 4). Irrigation season 2019 had 22 more days with at least some rainfall than normal. The median daily mean temperature for fallow season 2019 was 2 degrees less than normal, and there were 14 more cold and extremely cold days during the season than normal. In contrast to agricultural year 2019, agricultural year 2020 had 2.1 in. less total rainfall than normal, and 9 fewer days with any rainfall than normal (table 4). Similarly, agricultural year 2021 had 2.5 in. less rainfall than normal, and 20 fewer days with any rainfall than normal (table 4). The median daily mean temperatures during fallow seasons 2020 and 2021 were 1 degree less than normal, but the irrigation season temperatures were 4 degrees above normal (table 4).
Fluvial Sediment Concentrations and Loads
Sediment budget calculations require a combined overlapping record to calculate differences between the upstream and downstream streamgages at the same time. Overlapping records or coincident records are defined as a sensor (turbidity and ABS) value at the upstream and downstream streamgages at the same time (fig. 9A–C). A combined record is defined as there being a value for the turbidity and ABS sensors, then an overlapping combined record indicates there are turbidity and ABS values for both streamgages at the same time. Reasons for missing data include a lack of coincident record, which is attributed to either fouling of the sensor resulting in deletion of erroneous data (Wagner and others, 2006) or a sensor that was not present at the streamgage because of required sensor maintenance. The records used for the sediment load and budget calculations were taken in 15-minute intervals, but not all intervals were available for the analysis, including longer periods such as December 12 to March 19, when the ABS sensors were removed from both streamgages for re-calibration at the manufacturer. A complete description of the number and completeness of the discharge, turbidity, and ABS records is available in appendix 1. Quality control of the sensor representation of the channel at each streamgage is available in appendix 2.

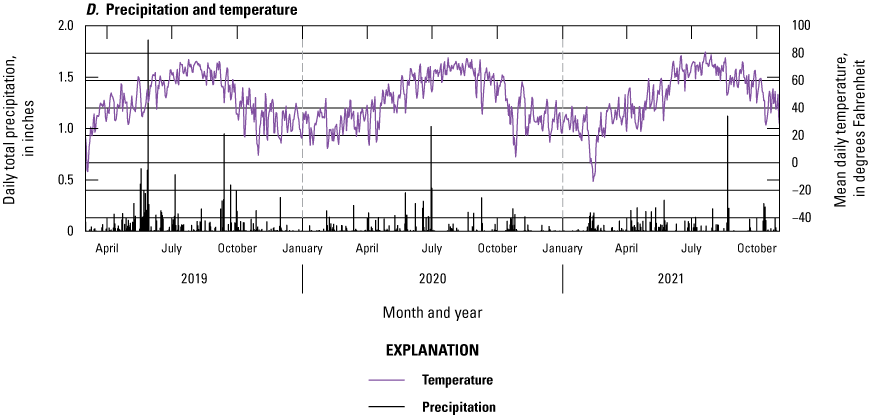
Time-series data (March 2019–October 2021) for U.S. Geological Survey (USGS) streamgages upstream and downstream from Willwood Dam. A, 15-minute streamflow and pool elevation record for Shoshone River above Willwood Dam, near Ralston, Wyoming (upstream streamgage; 06283995, USGS, 2023g) and Shoshone River below Willwood Dam, near Ralston, Wyo. (downstream streamgage; 06284010, USGS, 2023h). B, 15-minute turbidity and acoustic backscatter (ABS) record for Shoshone River above Willwood Dam, near Ralston, Wyo. (upstream streamgage; 06283995, USGS, 2023g), including timing and magnitude of discrete suspended-sediment samples. C, 15-minute turbidity and ABS record for Shoshone River below Willwood Dam, near Ralston, Wyo. (downstream streamgage; 06284010, USGS, 2023h), including timing and magnitude of discrete suspended-sediment samples. D, Total daily precipitation and mean daily temperature for study reach (PRISM Climate Group, 2021).
Discrete Samples of Suspended Sediment
Paired sampling of suspended sediment and turbidity began in October 2018 at both streamgages, and paired ABS values were available starting in March 2019. At the upstream streamgage, a total of 147 suspended-sediment samples were paired with turbidity or ABS, or both. Of these samples, 107 were pump samples with SSCs ranging from 62 to 36,100 mg/L, 4 were grab samples with SSCs ranging from 46 to 3,330 mg/L, and 36 were depth- and (or) width-integrated samples with SSCs ranging from 9.5 to 23,200 mg/L (U.S. Geological Survey, 2023g). The SSC samples ranged from the 15th to 99.9th turbidity ECDF quantiles (fig. 10A), and from the 8th to the 99.9th ABS ECDF quantiles (fig. 10B). Analysis of five suspended-sediment samples taken with the pump sampler at the upstream streamgage indicated low bias (2 percent) relative to width- and depth-integrated samples. The 2-percent bias indicated by this comparison was considered acceptable given that it is less than the mean percent difference between A and B samples taken concurrently using cross-sectional integrated samples at that location (4 percent), and thus no bias correction was made to the pump samples. A complete description of the comparison between pump and cross-sectionally average suspended-sediment samples is available in appendix 3.
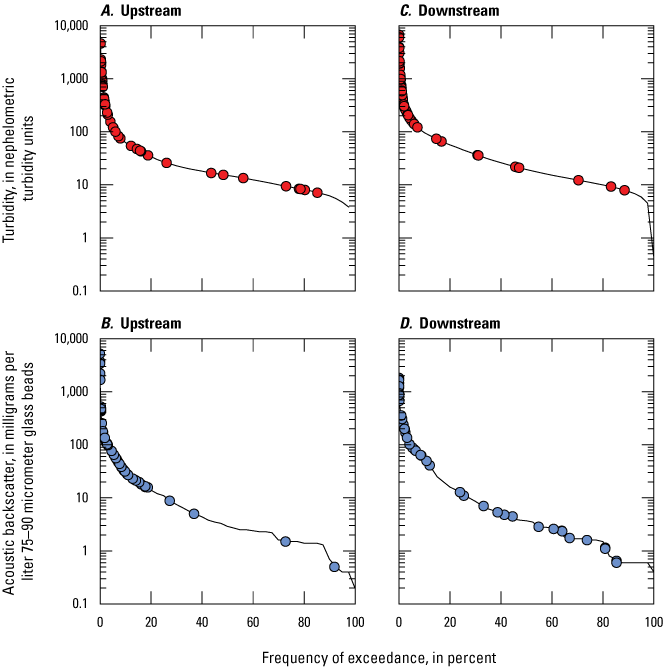
Plots showing the cumulative distribution of discrete samples associated with suspended-sediment samples relative to the full empirical cumulative distribution. A, Continuous record of turbidity and B, continuous record of acoustic backscatter at the Shoshone River above Willwood Dam, near Ralston, Wyoming (upstream streamgage; 06283995, U.S. Geological Survey, 2023g). C, Continuous record of turbidity and D, continuous record of acoustic backscatter for the Shoshone River below Willwood Dam, near Ralston, Wyo. (downstream streamgage; 06284010, U.S. Geological Survey, 2023h).
At the downstream streamgage, a total of 126 suspended-sediment samples were paired with turbidity or ABS, or both. Of these samples, 79 were pump samples spanning a range of SSCs from 22 to 13,300 mg/L, 1 was a grab sample of 8,395 mg/L, and 46 were depth- and (or) width-integrated samples spanning a range of SSCs from 6.0 to 13,500 mg/L (U.S. Geological Survey, 2023h). The SSC samples spanned from the 11th to 99.9th turbidity ECDF quantiles (fig. 10C), and from the 0 to the 99.9th ABS ECDF quantiles (fig. 10D). The ABS sensor at the downstream streamgage failed and was at the manufacturer in late May 2019 when the storm that produced SSCs of as much as 36,100 mg/L (U.S. Geological Survey, 2023h) at the upstream streamgage happened. Although numerous pump samples were collected at the downstream streamgage during that event, none could be paired with a turbidity or ABS values because the NEP–5000 had reached its operational limit, and no ABS sensor was in place. The maximum SSC measured at the downstream streamgage was 32,600 mg/L (U.S. Geological Survey, 2023h) from a pump sample taken during the storm on May 27, 2019. Analysis of six suspended-sediment samples taken with the pump sampler at the downstream streamgage indicated low bias (1 percent) relative to width- and depth-integrated samples. The 1-percent bias indicated by this comparison was considered acceptable given that it was nearly identical in magnitude to the mean percent difference between A and B samples taken concurrently using cross-sectional integrated samples at that location (−1 percent), and thus no bias correction was made to the pump samples.
Suspended-Sediment Statistical Models
Statistical modeling of SSC using paired values of turbidity and ABS produced four initial models that had poor model diagnostics including heteroscedastic and serially correlated model residuals (table 5). These models were improved by downsampling and accounting for bias from serial correlation using the method of Cochrane and Orcutt (1949). At the upstream streamgage, 117 pairs of SSC and turbidity values and 138 pairs of SSC and ABS values were used to produce the initial models; those sample pairs were downsampled to 43 and 52, respectively, again improving the explanatory power and diagnostics of both models (table 5), but both models failed the Durbin-Watson test (Durbin and Watson, 1950) for serially correlated residuals. The Cochrane-Orcutt method (Cochrane and Orcutt, 1949) was applied to both models and resulted in improved balance of diagnostics and performance (table 5).
Table 5.
Summary of linear least-squares regression models of turbidity and suspended-sediment concentration built for the Shoshone River, Wyoming.[n, number of samples; mg/L, milligram per liter; R2, coefficient of determination of statistical model; p-value, statistical probability value; PRESS, prediction residual sum of squares; BCF, Duan's bias correction factor; SSC, suspended-sediment concentration, in milligrams per liter; Q, streamflow discharge, in cubic feet per second; <, less than; --, not applicable; TURB, turbidity, in nephelometric turbidity units; ABS, acoustic backscatter, in milligrams per liter 75–90 micrometer glass beads]
Value shown is smaller than the actual number of samples taken because replicate samples taken concurrently were averaged.
Test of data heteroskedasticity for which the value shown is the p-value of the hypothesis test in which the null hypothesis is that the data are heteroskedastic (Breusch and Pagan, 1979).
Test of data serial correlation for which the value shown is the p-value of the hypothesis test in which the null hypothesis is that the data are serially correlated (Durbin and Watson, 1950).
A nonparametric retransformation method used for correcting bias in predictions from log-transformed regression models. (Duan, 1983).
At the downstream streamgage, 89 pairs of SSC and turbidity values, and 72 pairs of SSC and ABS values were used to produce the initial models; those sample pairs were downsampled to 51 and 45, respectively, which again improved the explanatory power and diagnostics of both models (table 5), but the turbidity model failed the Durbin-Watson test (Durbin and Watson, 1950). The turbidity model was bias-corrected using the Cochrane-Orcutt method (Cochrane and Orcutt, 1949), which resulted in improved model performance and diagnostics (table 5).
Model fits were generally good (fig. 11), with coefficients of determination indicating that more than 84 percent of the variance was explained by either turbidity or ABS, and the downsampled models had reasonable compliance with normality (table 5). The turbidity model at the upstream streamgage was excellent, explaining 94 percent of the variance, whereas the ABS model was the best of the two downstream, explaining 87 percent of the variance in SSC. The better fit of turbidity upstream likely reflects the more natural sediment supply system upstream whereby the grain sizes reaching the streamgage do not vary substantially over time; the better fit of the ABS model downstream likely reflects the wider range of grain sizes produced by the dam when it sluices sediment.
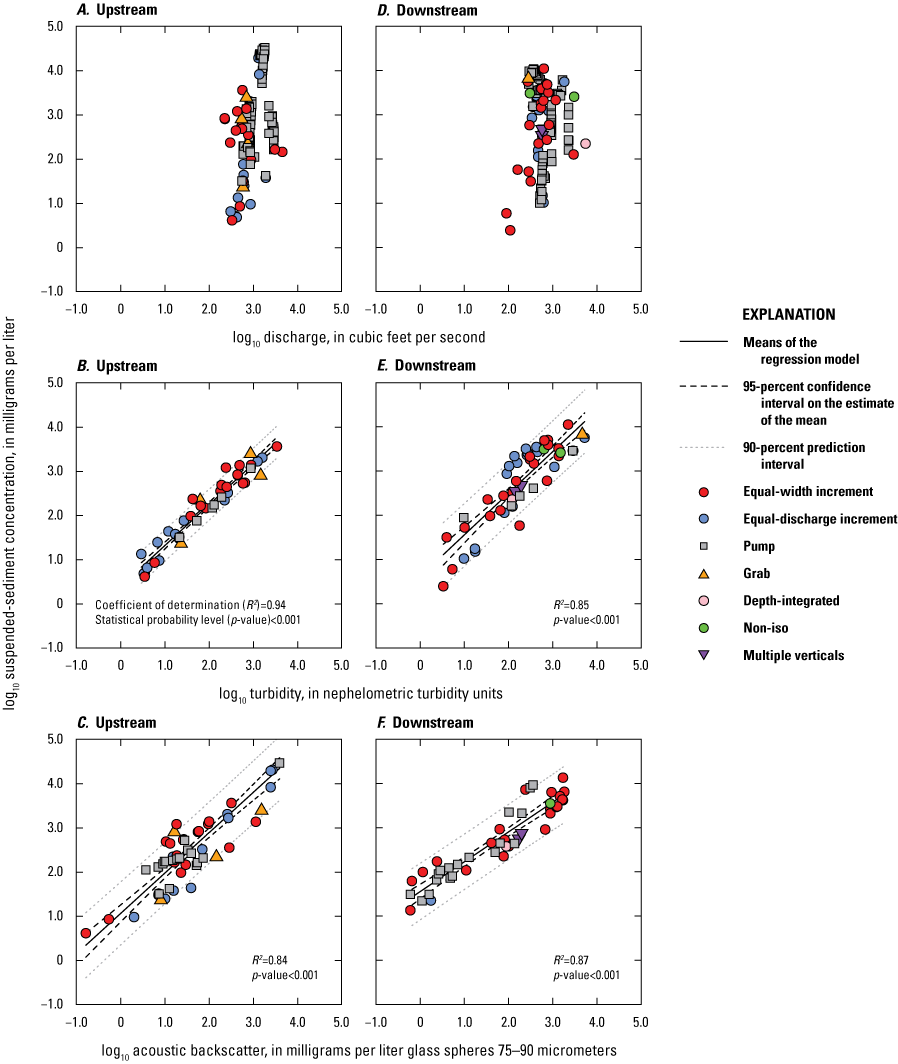
Plots showing correlations and data models for discharge, turbidity, acoustic backscatter (ABS), and suspended sediment in the Shoshone River above Willwood Dam, near Ralston, Wyoming (upstream streamgage; 06283995, U.S. Geological Survey, 2023g) and Shoshone River below Willwood Dam, near Ralston, Wyo. (downstream streamgage; 06284010, U.S. Geological Survey, 2023h). A, Suspended-sediment concentration (SSC) relative to river discharge for upstream streamgage. B, Data model of SSC relative to turbidity measurements made at the continuous monitor at the upstream streamgage. C, Data model of SSC relative to ABS measurements made at the continuous monitor at the upstream streamgage. D, SSC relative to river discharge for downstream streamgage. E, Data model of SSC relative to turbidity measurements made at the continuous monitor at the downstream streamgage. F, Data model of SSC relative to ABS measurements made at the continuous monitor at the downstream streamgage.
Slope and intercept values differed between turbidity and ABS models at each streamgage, and for turbidity and ABS models between upstream and downstream streamgages. At both streamgages, the ABS models had higher intercept terms, whereas the turbidity models had higher slope terms (table 5), likely reflecting the higher sensitivity of the turbidity sensor to suspended mud particles and poor precision of the ABS when sand concentrations are very low. Although these model diagnostics were generally sufficient, Duan’s bias correction factors (Duan, 1983) indicated that three of four models had bias corrections of more than 10 percent (table 5).
Suspended-Sediment Loads
The goal of the statistical modeling was to produce the most accurate records of suspended-sediment loads in the Shoshone River. To calculate a complete sediment budget, an SSC value would need to be produced for every 15-minute time step during the entire chosen period of interest. As stated in the previous section, not all 15-minute observations were accepted in the final turbidity and ABS records at each streamgage, which resulted in some time stamps that had only turbidity, or ABS, or neither. Ideally, we could use the statistical model with the most explanatory power for a streamgage when that variable was available in the record, and default to a statistical model with less explanatory power when that was the only variable available. However, the best models and resolution of records for each variable differed between streamgages, and the final models demonstrate that ABS and turbidity respond differently to the same concentrations, with ABS producing higher values at low concentrations and turbidity producing higher values at higher concentrations (fig. 11). These factors imply that using the only model available to estimate a sediment load can be intractable because any imbalances between upstream and downstream could be attributable to differences in the models chosen for each streamgage.
Instead of using the model with the most explanatory power available to generate sediment loads, a system of rules was constructed to select the models used for each time step. The rules are based on the seasonal operations of Willwood Dam, assumptions about the grain sizes mobilized during these operations, and assumed accuracy of the models at the downstream streamgage under different operational conditions. Sediment samples taken at the downstream streamgage during the irrigation season were always dominated by mud (greater than [>] 80 percent mud), whereas sediment samples taken during the fallow season had much more variability and much larger proportions of sand (fig. 12). The primary goal of the rule-based system was to produce sediment load estimates at both streamgages that were calculated using the same method, while maximizing the number of observations with a load estimate. The system of rules devised for the load estimates is depicted in figure 13, with the fundamental rule being the pool elevation behind Willwood Dam, which dictates the assumptions about the best model to use. When the pool is less than 4,499 ft NAVD 88, it was assumed that sand could be leaving Willwood Dam at any time, and the ABS model was likely most accurate. Likewise, when the pool elevation exceeded 4,499 ft NAVD 88 and the dam was spilling, it was assumed that turbidity was the better model downstream. It was also assumed that turbidity was more accurate for lower concentrations (<100 mg/L). Once a method for load calculation was selected for the downstream streamgage based on the rules in figure 13, the same method was applied upstream for that time step.
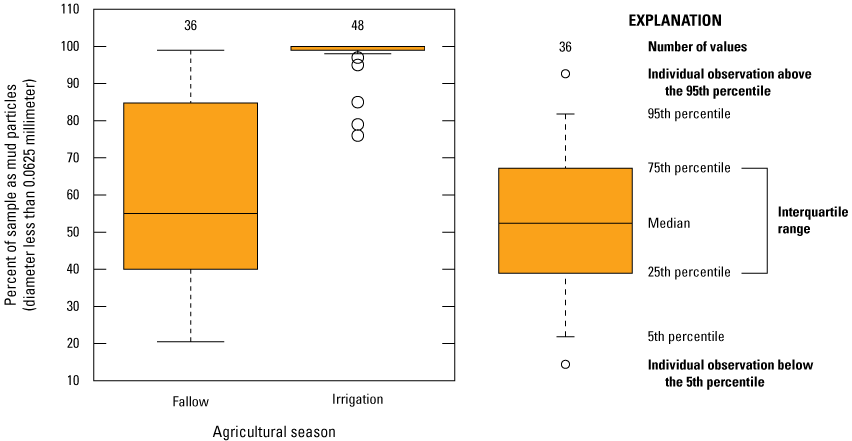
Boxplots showing the percentage of suspended-sediment samples as mud particles (median diameter of 0.0625 millimeter or less) for samples taken at the Shoshone River below Willwood Dam, near Ralston, Wyoming (downstream streamgage; 06284010, U.S. Geological Survey, 2023h), for the irrigation and fallow seasons for agriculture years 2019–22.
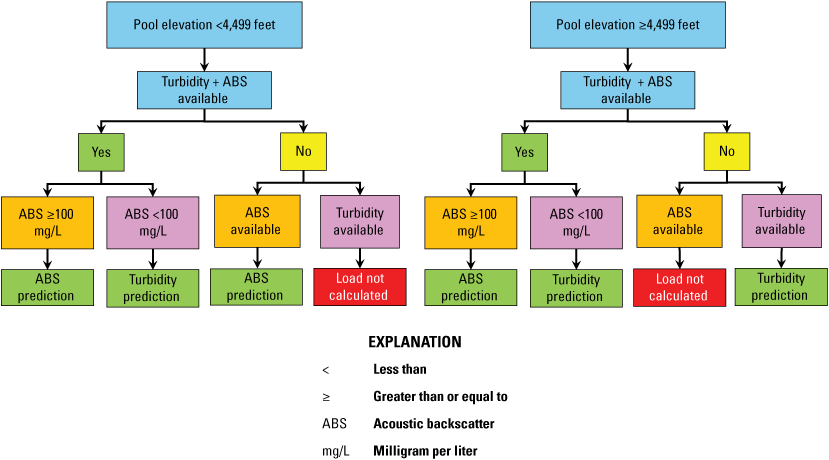
Flowchart showing decision tree rules for selection of the appropriate suspended-sediment model based on operations at Willwood Dam.
The sediment budget between upstream and downstream estimates of loads was interpreted using the mean predicted values bound by their respective model prediction intervals. If the mean predicted loads of one streamgage were contained in the prediction intervals of the other streamgage, and vice-versa, difference in the sediment budget were interpreted as “indeterminate.” If the mean predicted load of one streamgage was outside the prediction intervals of the other, the sediment budget was interpreted to be “weakly significant.” Finally, if the mean predicted load for both streamgages was outside the respective prediction intervals of the other streamgage, the sediment budget was interpreted to be “significant.” It should be noted that an “indeterminate” sediment budget does not signify no net change in sediment storage behind Willwood Dam, but it does signify that any changes during a given time period were not large enough to measure given the precision of the sediment models.
Season Loads
Modeled sediment load balances demonstrate the depositional and erosional behaviors expected from the conceptual model of dam operations whereby sediment accumulation tends to happen during irrigation seasons when the dam is spilling mainly over the top (shown as “Deposit” on fig. 14), and sediment export tends to happen during the fallow seasons when it is flowing through the sluice gates (shown as “Export” on fig. 14). There are times during the irrigation season when the models show more sediment leaving the dam than entering, but this sediment may or may not be from tributary inputs and therefore may not necessarily be evacuating from storage. For all seasons, except for fallow season 2022, the model calculated that more sediment left the dam than entered the dam (table 6), but the modeled mean loads at each streamgage were nearly always within the prediction intervals of each other, making the sediment balance indeterminant (fig. 15). The one exception was fallow season 2020, when the predicted means were not contained by either prediction interval, indicating a conclusive signal that more sediment left the dam than entered during the coincident periods of record. Although most of the seasonal budgets are indeterminate, the pattern of sediment accumulation and transport through the dam is captured by the models, and within the scale of previous estimates of sediment loads for the Shoshone River.
Table 6.
Predicted suspended-sediment loads for the Shoshone River above Willwood Dam, near Ralston, Wyoming (06283995, U.S. Geological Survey, 2023g) and Shoshone River below Willwood Dam, near Ralston, Wyo. (06284010, U.S. Geological Survey, 2023h), for selected time periods.[n, number of 15-minute measurements used to make prediction; USGS, U.S. Geological Survey; NC, not calculated using turbidity and acoustic backscatter data (turbidity values shown in table 7)]
Sediment load calculated for 15-minute measurements in period of record common to both streamgages.

Time series showing suspended-sediment load balance.

Predicted season sediment loads with 90-percent prediction interval using the coincident record for Shoshone River above Willwood Dam, near Ralston, Wyoming (upstream streamgage; 06283995, U.S. Geological Survey, 2023g), and Shoshone River below Willwood Dam, near Ralston, Wyo. (downstream streamgage; 06284010, U.S. Geological Survey, 2023h).
The results presented in the subsections that follow reference the estimated sediment loads only for the overlapping records at the upstream and downstream streamgages because these are the sediment budgets for which there is the most certainty. The total suspended-sediment loads presented in table 6 are a more accurate measure of the total amount of suspended sediment that can move through the Shoshone River in an agricultural season but should be interpreted with caution in the context of understanding changes in storage behind Willwood Dam because they are incomplete relative to each other.
Fallow Season 2019
For fallow season 2019, the mean coincident upstream and downstream loads were estimated at 1,140 (prediction interval of 538–2,420 tons) and 2,120 tons (prediction interval of 468–9,620 tons), respectively, indicating that about 980 more tons of sediment exited the dam than accumulated behind it (table 6, fig. 15). However, the predicted means of each load estimate were within the 90-percent prediction intervals of each other, and the sediment budget was indeterminate.
Irrigation Season 2019
For irrigation season 2019, the mean coincident upstream and downstream loads were estimated at 173,000 (prediction interval of 78,700–395,000 tons) and 372,000 tons (prediction interval of 84,400–1,650,000 tons), respectively, indicating that about 199,000 more tons of sediment exited the dam than accumulated behind it (table 6; fig. 15). However, the predicted means of each load estimate were within the 90-percent prediction intervals of each other, and the sediment budget was indeterminate. No human events (sluices or sediment releases) took place during this season, but there were a number of rainfall-driven events that account for 69 and 76 percent of the upstream and downstream loads, respectively. The mean load calculated for natural events at the downstream streamgage was outside of the prediction intervals of the load calculated for the upstream streamgage, indicating the rainfall-driven loads were weakly significant.
The 2019 irrigation season had the largest sediment loads out of all the seasons in the study period, which is most likely explained by the amount of precipitation received (table 4). These events include a nearly 2-week period in late May and early June when more than 4.25 in. of rainfall caused large amounts of sediment to runoff. The storm resulted in observations of SSC of more than 30,000 mg/L at both streamgages. This storm could have caused substantial sediment runoff from the intervening ungaged tributary, which may account for some of the difference in loads between streamgages.
Fallow Season 2020
For fallow season 2020, the mean coincident upstream and downstream loads were estimated at 16,000 (prediction interval of 5,540–52,500 tons) and at 87,300 tons (prediction interval of 23,800–326,000 tons), respectively, indicating that about 71,300 more tons of sediment exited the dam than accumulated behind it (table 6; fig. 15). The predicted mean estimates were outside the prediction intervals of each streamgage, indicating the sediment budget was significant and export of fine sediment through the dam was likely. There were three human events during this season: two sluicing events, one traditional and one experimental; and an Iron Creek Dam release. The human events collectively account for 39 percent of the net export. There were also several natural events that collectively account for about 10 percent of the net export during this time, but those differences were considered indeterminate.
Importantly, the fallow season 2020 was the only season when the total coincident sediment budget was significant. It is also notable that this season had a substantial portion of its record missing (mid-December 2019 through mid-March 2020) because the ABS sensors were sent back to the manufacturer for service (fig. 9B–C). Under the rules-based load calculations, no loads were calculated for the period when the ABS sensors were out of the water because suspended-sediment mixtures when the dam is spilling through the sluice gates are known to be enriched with sand (fig. 12). Although the sediment loads estimated during this time with the turbidity sensors are not likely to be accurate, turbidity values at the downstream streamgage were elevated above those recorded at the upstream streamgage during the time when the ABS sensors were not present, and the ABS values at the downstream streamgage were elevated relative to the upstream streamgage at the time they were removed and again when they were re-installed in the spring of 2020. These data indicate it is very likely that much more sediment was exported through the dam than was accounted for using the rules-based budgeting approach.
Irrigation Season 2020
For irrigation season 2020, the mean coincident upstream and downstream loads were estimated at 47,200 (prediction interval of 16,800–151,000 tons) and 80,700 tons (prediction interval of 20,700–321,000 tons), respectively, indicating that about 33,500 more tons of sediment exited the dam than accumulated behind it (table 6; fig. 15). However, the predicted means of each load estimate were within the 90-percent prediction intervals of each other, and the sediment budget was indeterminate. No human events took place during this season, but rainfall-driven sediment runoff events account for approximately one-half of the upstream and downstream estimated loads (table 6).
Fallow Season 2021
For fallow season 2021, the mean coincident upstream and downstream loads were estimated at 27,300 (prediction interval of 9,320–91,800 tons) and 43,900 tons (prediction interval of 11,100–177,000 tons), respectively, indicating that about 16,600 more tons exited the dam than accumulated behind it (table 6; fig. 15). However, the predicted means of each load estimate were within the 90-percent prediction intervals of each other, and the sediment budget was indeterminate. There were two human events during this season: an experimental flushing flow and the Iron Creek Reservoir release that collectively contributed 67 and 51 percent of the upstream and downstream loads, respectively. There were also several natural events that collectively contributed 18 and 14 percent of the upstream and downstream loads, respectively.
Irrigation Season 2021
For irrigation season 2021, the mean coincident upstream and downstream loads were estimated at 14,200 (prediction interval of 6,620–30,800 tons) and 16,200 tons (prediction interval of 3,670–72,200 tons), respectively, indicating that about 2,000 more tons of sediment exited the dam than accumulated behind it (table 6; fig. 15). However, the predicted means of each load estimate were within the 90-percent prediction intervals of each other, and the sediment budget was indeterminate. No human events took place during this season, but there were a number of natural events explaining 68 and 70 percent of the upstream and downstream loads, respectively.
Fallow Season 2022
The observation period for fallow season 2022 was very short relative to the previous two fallow seasons as October 31, 2021, marked the end of the study period. The mean coincident upstream and downstream loads were estimated at 3,160 (prediction interval of 1,510–6,620 tons) and 1,530 tons (prediction interval of 347–6,700 tons), respectively, indicating that 1,630 more tons of sediment exited the dam than accumulated behind it (table 6; fig. 15). However, the predicted means of each load estimate were within the 90-percent prediction intervals of each other, and the sediment budget was indeterminate. There was one human event during this season: an Iron Creek Reservoir release that overlapped with one of the two natural events. The Iron Creek Reservoir release and the natural event could not be separated, so a combined event load was calculated. The combined event load contributed 95 and 40 percent of the upstream and downstream loads, respectively.
Event-Based Loads
Three types of human events took place during the period of study, including typical sluices, a sediment flush from Willwood Dam, and Iron Creek Dam sediment releases. One of the sluice events was an experimental sluice that was part of a separate study aimed at understanding effects of different sediment concentrations on fish spawning habitat (Pilkerton, 2024). The flushing event was also considered an experiment because it was the first attempt in this system to combine high-concentration sediment releases from Willwood Dam with a deliberate bed-mobilizing streamflow event from Buffalo Bill Dam designed to flush the fine sediment downstream to the next reservoir. All calculated event loads are shown in table 7 and figure 16. The sluicing and flushing events are used to remove sediment from the pool behind Willwood Dam, and therefore the expected load balance should indicate a greater amount of sediment exiting the dam than accumulating behind it. For the sluicing and flushing events during the study period, more sediment exited the dam than entered it. For the Iron Creek Dam sediment releases that happened during the study period, sediment was hypothesized to accumulate behind the dam because the pool behind the dam reduces the energy of the streamflow. Our load predictions indicated that more sediment entered the dam than exited during the Iron Creek Dam releases, as expected.
Table 7.
Predicted suspended-sediment loads for the Shoshone River upstream and downstream from Willwood Dam (U.S. Geological Survey streamgages 06283995 and 06284010, respectively [U.S. Geological Survey, 2023g, h]) for individual events using the coincident record for the rules-based model.[n, number of 15-minute measurements used to make prediction; sediment load calculated for 15-minute measurements in period of record common to both streamgages]
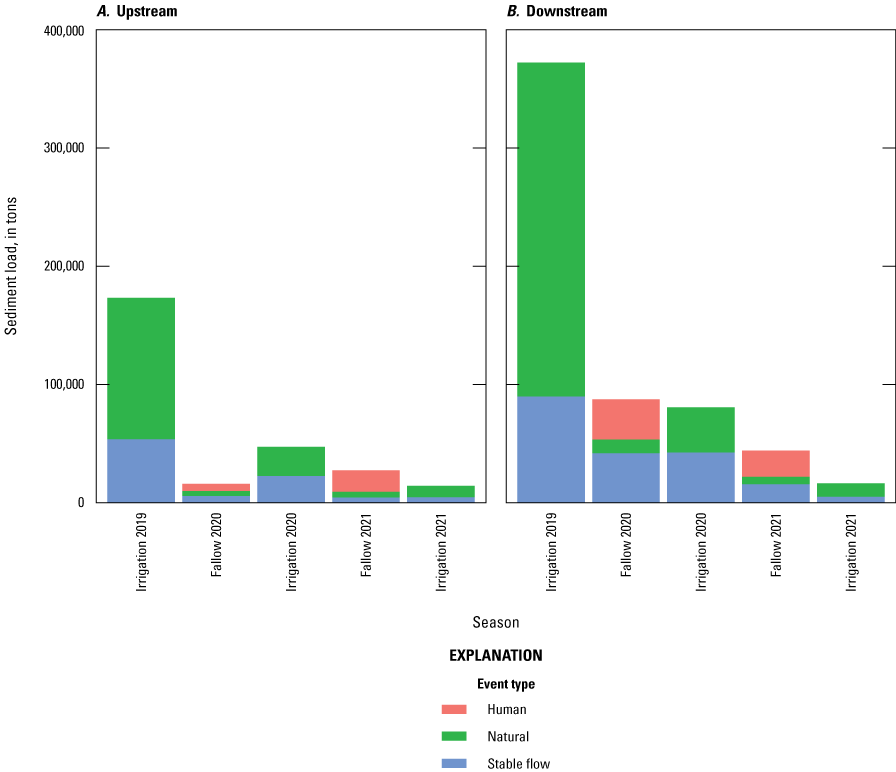
Portion of season sediment load totals as human event (sluices or sediment releases), natural event, and stable flows for the Shoshone River upstream and downstream from Willwood Dam. A, Shoshone River above Willwood Dam, near Ralston, Wyoming (upstream streamgage; 06283995, U.S. Geological Survey, 2023g). B, Shoshone River below Willwood Dam, near Ralston, Wyo. (upstream streamgage; 06284010, U.S. Geological Survey, 2023h).
Sluicing Events
The first two sluicing events happened back-to-back at the end of fallow season 2019 during March 16–21, 2019, and March 31–April 1, 2019, when the downstream ABS sensor was not yet installed; therefore, values determined using only the turbidity model are reported, which as discussed in the “Suspended-Sediment Statistical Models” section, are biased low when larger grain sizes are present in SSC. For the first sluicing event, the mean coincident upstream and downstream loads were calculated at 662 (prediction interval of 315–1,390 tons) and 4,910 tons (prediction interval of 1,140–21,200 tons), respectively, indicating that 4,248 more tons of sediment exited Willwood Dam than accumulated behind it (table 7). Based on the mean coincident estimated load and prediction intervals, this net export was considered significant. For the second sluicing event (table 7), the mean coincident upstream and downstream loads were estimated at 27 (prediction interval of 13–57 tons) and 1,390 tons (prediction interval of 322–6,000 tons), respectively, indicating that 1,363 more tons of sediment exited the dam than accumulated behind it (table 7). Based on mean estimates and prediction intervals, this export is considered significant.
The third sluice event happened at the beginning of fallow season 2020 during October 21–November 2, 2019. This event was an atypical sluice event that was an experiment for a University of Wyoming graduate student who was monitoring water column and sediment deposition conditions below the dam during varying dam operations (Pilkerton and others, 2022). For this sluice event, the mean coincident upstream and downstream loads were estimated at 2,740 (prediction interval of 659–11,600 tons) and 25,200 tons (prediction interval of 7,480–84,800 tons), respectively, indicating that 22,460 more tons of sediment exited the dam than accumulated behind it (table 7). The predicted mean coincident load estimates were outside the prediction intervals for each streamgage, indicating a true export of fine sediment through the dam was likely. The larger sluicing event load is likely explained by several different factors. Firstly, the models indicate that during the later part of the 2019 irrigation season there is accumulation behind the dam, indicating there is more sediment being stored in the pool behind the dam. Second, this sluicing event lasted longer and had higher suspended-sediment concentrations than a typical sluice event.
The last sluicing event happened from March 27–April 2, 2020. For this event, the mean coincident upstream and downstream loads were estimated at 330 (prediction interval of 79–1,420 tons) and 8,000 tons (prediction interval of 2,390–26,800 tons), respectively, indicating that 7,670 more tons of sediment exited the dam than accumulated behind it (table 7).
Experimental Sediment Flush
During April 7–10, 2021, Willwood WRK2 performed an experimental sediment flushing event at Willwood Dam. This flushing event consisted of an approximately 8-hour period of intense sluicing followed by an intentional flood to keep the fine sediment mobile in the water column. The mean coincident upstream and downstream loads were estimated at 18,200 (prediction interval of 5,100–71,400 tons) and 22,200 tons (prediction interval of 6,000–83,500 tons), respectively, indicating that 4,000 more tons of sediment exited the dam than accumulated behind it (table 7). However, the predicted means of each load estimate were within the 90-percent prediction intervals of each other, and the sediment budget was indeterminate. This experimental flushing event increased the daily mean streamflow to 3,504–3,964 ft3/s from 896–945 ft3/s at the upstream streamgage and to 3,555–3,985 ft3/s from 965–1,007 ft3/s at the downstream streamgage for 3 days. These daily mean discharges (3,504–3,095 ft3/s) are near the minimum estimated bed mobilizing streamflow of 4,000 ft3/s (McElroy, 2017).
The upstream load (18,200 tons) for the experimental sediment flushing event was an order of magnitude larger than loads (ranging from 27 to 2,740 tons) for all other sluicing events (table 7). The heavy sediment load was likely due to mobilization of sediment stored in pools, side channels, and potentially from the interstices of mobilized coarser (>64 mm) particles in the river bed between Buffalo Bill Dam and Willwood Dam.
Iron Creek Dam Sediment Releases
Iron Creek Reservoir is used as storage for the Shoshone Irrigation District canal system. Releases from Iron Creek Reservoir (fig. 1B) are used to lower water levels below the canal intake and drain sediment accumulated in the reservoir during the irrigation season. The releases are sudden, lasting a short period (3 to 4 hours), and release large amounts of sediment directly to the main stem of the Shoshone River above the study reach. It is hypothesized by the authors that more sediment accumulates behind Willwood Dam than exits it during the dam releases because the amount of streamflow does not increase enough to mobilize stored sediment behind the dam.
There were three Iron Creek Reservoir releases during the study period (fig. 9A). As previously discussed in the “Fallow Season 2022” section, the reservoir release in fallow season 2022 overlapped with a natural event; therefore, the amount of the load attributable to the release compared to the natural event could not be determined. For the first release (October 18, 2019), the mean coincident upstream and downstream loads were estimated at 3,180 (prediction interval of 775–13,600 tons) and 879 tons (prediction interval of 229–3,430 tons), respectively, indicating that 2,301 more tons of sediment accumulated behind the dam than exited it (table 7), but the sediment budget was indeterminate. The mean coincident upstream and downstream loads for the second release (October 21, 2020) were estimated at 122 (prediction interval of 58–253 tons) and 33 tons (prediction interval of 7–148 tons), respectively, indicating that 89 more tons of sediment accumulated behind the dam (table 7) than exited it, but the sediment budget was indeterminate.
Natural Events
Natural events were summed for each season of the study period (table 6; fig. 16). Fallow season 2019 did not have any natural events. Depending on the season, the load balance might be expected to behave differently depending on a combination of dam operations and events. Fallow season 2022 had one natural event overlap with a human event; as previously discussed in the “Fallow Season 2022” section, the amount of the load attributable to the natural event compared to the Iron Creek Reservoir release event could not be determined (refer to table 6 for the combined load).
For irrigation season 2019, the calculated total estimated upstream and downstream loads from eight natural events were 120,000 (prediction interval of 53,200–281,00 tons) and 282,000 tons (prediction interval of 63,900–1,250,000 tons), respectively, for a total load balance of 162,000 more tons of sediment from natural events exiting Willwood Dam than entering it (table 6). This perceived net export of sediment from the dam is considered weakly significant because the mean predicted downstream load is just outside of the upper bound of the prediction interval for the upstream streamgage. These natural load estimates constitute approximately 69 and 75 percent of the total coincident upstream and downstream loads, respectively, for the 2019 irrigation season. One natural event had missing data, which prevented the load from being calculated. Three natural events happened either on the rising or falling limb of the hydrograph, when flows were higher, resulting in more sediment being transported through the dam than accumulated behind it. During these high flow events it is likely that water was flowing over the top of the dam and through the sluice gates. The remaining four natural events happened during August and September when streamflows were low, resulting in more sediment accumulating behind the dam than exiting it during these events.
In irrigation season 2019, there was an order of magnitude more suspended sediment moving through both streamgages, compared to any other season, much of which was from natural events, reflecting much larger total precipitation relative to total precipitation of the period of record normal and other seasons (table 4). Because irrigation season 2019 included a large, persistent storm with cumulative total precipitation of more than 4 in. (refer to “Rainfall Runoff” section), the net export of suspended sediment through the dam is not unrealistic because the intervening tributaries would be expected to yield some sediment (fig. 1). However, these tributaries only constitute approximately 3 mi2 of additional drainage area, which would require a seasonally averaged yield of approximately 300 tons per day per square mile (ton/day/mi2) to approach the net export of 162,000 tons of sediment during the irrigation season. This sediment yield would be larger than any yield measured for Shoshone River tributaries (fig. 17). Considering the intervening tributaries drain steep, barren terrain, these values are not unrealistic for individual runoff events, but it is very unlikely that these heavy sediment yields are reflective of a seasonally averaged yield.
For fallow season 2020, the calculated total estimated upstream and downstream loads from six natural events were 4,270 (prediction interval of 1,730–11,800 tons) and 11,600 tons (prediction interval of 3,030–44,900 tons), respectively, indicating 7,330 more tons of suspended sediment exited the dam than accumulated behind it, but the sediment budget was indeterminate. These natural load estimates constitute 27 and 13 percent of the total coincident upstream and downstream loads, respectively, for the 2020 fallow season. Two of eight natural events had missing data, so loads could not be calculated for these events. Load balances calculated for the remaining six natural events indicated more sediment exited the dam than accumulated behind it. Nearly one-half of the fallow season 2020 record was missing because the ABS sensor was removed for factory re-calibration (refer to “Fallow Season 2020” subsection); therefore, sediment load was not calculated during this time.
For irrigation season 2020, the calculated total estimated upstream and downstream loads from six natural events were 24,800 (prediction interval of 6,870–97,400 tons) and 38,300 tons (prediction interval of 10,900–136,000 tons), respectively, indicating 13,500 more tons of suspended sediment exited the dam than accumulated behind it, but the sediment budget was indeterminate. These natural load estimates constitute 53 and 47 percent of the total coincident upstream and downstream loads, respectively, for the 2020 irrigation season. Only one natural event had a load balance that indicated sediment accumulation behind the dam, which is likely because it was the only event during irrigation season 2020 with a mean daily flow below 800 ft3/s at the upstream streamgage.
For fallow season 2021, the calculated total estimated upstream and downstream loads from eight natural events were 4,790 (prediction interval of 2,270–10,200 tons) and 6,250 tons (prediction interval of 1,440–27,100 tons), respectively, indicating 1,460 more tons of suspended sediment exited the dam than accumulated behind it, but the sediment budget was indeterminate. These natural load estimates constitute 18 and 14 percent of the total upstream and downstream loads, respectively, for the 2021 fallow season. The first seven natural events in fallow season 2021 each had a calculated load balance indicating more sediment exited the dam than accumulated behind it. The last natural event happened after the experimental flush and during the change from the fallow season to the irrigation season. The load balance calculated for this natural event indicated that sediment was accumulating behind the dam, potentially as a consequence of the sediment supply behind the dam being depleted from the experimental flush.
For irrigation season 2021, the calculated total estimated upstream and downstream loads from four natural events were 9,710 (prediction interval of 4,490–21,200 tons) and 11,300 tons (prediction interval of 2,590–49,900 tons), respectively, indicating 1,590 more tons of suspended sediment exited the dam than accumulated behind it, but the sediment budget was indeterminate. These natural load estimates constitute 68 and 70 percent of the total coincident upstream and downstream loads, respectively, for the 2021 irrigation season. The first irrigation season 2021 natural event was a continuation of the last natural event in fallow season 2021, with the pool elevation having reached the canal head gate and the calculated load balance indicating that sediment was accumulating behind the dam. Load balances calculated for the next two natural events indicate sediment accumulated behind the dam. The last natural event happened in mid-August 2021, and the calculated load balance indicated that more sediment exited the dam than accumulated behind it. During this last natural event, the mean daily flow was 791 ft3/s at the upstream streamgage, which was the largest daily mean flow at this streamgage since late-April. Irrigation season 2021 was the only irrigation season during the study period that did not have a typical hydrograph consisting of a rising limb, peak, and recessional limb; the hydrograph does not have the large peak that typically arises during the irrigation season because the annual peak was a result of the experimental flush in the preceding fallow season.
For fallow season 2022, the calculated combined human and natural event total upstream and downstream loads were 3,020 (prediction interval of 1,440–6,320 tons) and 612 tons (prediction interval of 139 to 2,700 tons), respectively, indicating that more than 2,408 tons of sediment accumulated behind the dam than exited it, but the sediment budget was indeterminate. These values represent 96 and 40 percent of the respective upstream and downstream total coincident sediment loads. A load could not be calculated for one of the two natural events during fallow season 2022 because of missing data.
Sediment Yields from Selected Tributaries
Between August 2017 and July 2023, sediment samples were collected from 9 tributaries to the Shoshone River during 137 sampling events (National Water Quality Monitoring Council, 2024) (table 8; fig. 7). Tributaries were sampled between 1 and 27 times during this period. The tributary sites were located between Buffalo Bill Reservoir (not shown) and Willwood Dam (fig. 7), and samples were collected near the mouths of the tributaries. All tributaries in the sample program receive water from irrigation canals either through seepage or direct return flow. The drainage area of the sampling sites in the tributaries ranged from 3.05 to 98.4 mi2 (table 8). Sediment yields at each site varied substantially (table 8), with the data range at each site spanning two to five orders of magnitude (fig. 17). The largest sediment yield, 1,005 tons per day, was calculated for a sample from Sulphur Creek with a drainage area of 46.4 mi2 (table 8). The next highest yield, 655 tons per day, was from Dry Creek, with a drainage area of 17.3 mi2 (table 8).
Table 8.
Sediment yields for Shoshone River tributaries during irrigation and fallow seasons, 2017–23. [—Left][mi2, square mile; ton/day, ton per day; ton/day/mi2, ton per day per square mile; --, no data collected]
| Site number | Site name | Short name (fig. 7) | Drainage area (mi2) | Irrigation season determination | Event | Number of sampling events | Median (ton/day) | Mean1 (ton/day) | Minimum (ton/day) | Maximum (ton/day) | Mean sediment yield per unit area1 (ton/day/mi2) | Minimum sediment yield per unit area (ton/day/mi2) | Maximum sediment yield per unit area (ton/day/mi2) |
|---|---|---|---|---|---|---|---|---|---|---|---|---|---|
| 443126109050601 | Sulphur Creek at mouth, at Cody, Wyoming | Sulphur Creek | 46.4 | Irrigation | No event | 5 | 4.49 | 9.44 | 2.72 | 28.1 | 0.2 | 0.06 | 0.61 |
| Precipitation event | 10 | 64 | 174 | 16.6 | 1,005 | 3.74 | 0.36 | 21.66 | |||||
| Fallow | No event | 7 | 0.48 | 0.6 | 0.2 | 1.17 | 0.01 | 0.004 | 0.03 | ||||
| Precipitation event | 5 | 22.8 | 23.9 | 0.26 | 61.4 | 0.51 | 0.01 | 1.32 | |||||
| 443254109013701 | Cottonwood Creek at mouth, near Cody, Wyoming | Cottonwood Creek | 26.4 | Irrigation | No event | 5 | 4.49 | 6.64 | 3.81 | 14.3 | 0.25 | 0.14 | 0.54 |
| Precipitation event | 5 | 123 | 142 | 63.8 | 293 | 5.39 | 2.42 | 11.09 | |||||
| Fallow | No event | 5 | 1.65 | 1.49 | 0.79 | 1.89 | 0.06 | 0.03 | 0.07 | ||||
| Precipitation event | 3 | 0.8 | 1.79 | 0.26 | 4.31 | 0.07 | 0.01 | 0.16 | |||||
| 443332108595001 | Sage Creek at mouth, near Cody, Wyoming | Sage Creek | 98.4 | Irrigation | No event | 4 | 4.62 | 5.77 | 2.61 | 11.2 | 0.06 | 0.03 | 0.11 |
| Precipitation event | 7 | 27.5 | 107 | 8.2 | 555 | 1.09 | 0.08 | 5.64 | |||||
| Fallow | No event | 4 | 9.59 | 8.57 | 2.68 | 12.4 | 0.09 | 0.03 | 0.13 | ||||
| Precipitation event | 4 | 16.1 | 23.8 | 7.66 | 55.2 | 0.24 | 0.08 | 0.56 | |||||
| 443353108593601 | Idaho Creek at mouth, near Cody, Wyoming | Idaho Creek | 17.4 | Irrigation | No event | 5 | 4.86 | 5.56 | 2.58 | 9.76 | 0.32 | 0.15 | 0.56 |
| Precipitation event | 6 | 30.9 | 74.9 | 21.4 | 268 | 4.30 | 1.23 | 15.40 | |||||
| Fallow | No event | 4 | 2.7 | 2.66 | 1.92 | 3.32 | 0.15 | 0.11 | 0.19 | ||||
| Precipitation event | 5 | 4.16 | 3.45 | 1.51 | 4.51 | 0.2 | 0.09 | 0.26 | |||||
| 443437108581501 | Dry Creek at mouth, near Cody, Wyoming | Dry Creek | 17.3 | Irrigation | No event | 5 | 17.6 | 13.4 | 1.57 | 21.1 | 0.77 | 0.09 | 1.22 |
| Precipitation event | 5 | 46 | 165 | 24.6 | 655 | 9.51 | 1.42 | 37.86 | |||||
| Fallow | No event | 5 | 0.2 | 2.57 | 0.06 | 11.5 | 0.15 | 0.003 | 0.67 | ||||
| Precipitation event | 2 | 0.61 | 0.61 | 0.1 | 1.11 | 0.04 | 0.01 | 0.06 | |||||
| 443448108572701 | Rough Gulch at mouth near Cody, Wyoming | Rough Gulch | 6.63 | Irrigation | No event | -- | -- | -- | -- | -- | -- | -- | -- |
| Precipitation event | -- | -- | -- | -- | -- | -- | -- | -- | |||||
| Fallow | No event | -- | -- | -- | -- | -- | -- | -- | -- | ||||
| Precipitation event | 1 | -- | 6.27 | -- | -- | 0.95 | -- | -- | |||||
| 443817108562701 | Iron Creek at mouth, near Ralston, Wyoming | Iron Creek | 12.6 | Irrigation | No event | -- | -- | -- | -- | -- | -- | -- | -- |
| Precipitation event | -- | -- | -- | -- | -- | -- | -- | -- | |||||
| Fallow | No event | 5 | 3.23 | 4.43 | 3.2 | 7.34 | 0.35 | 0.25 | 0.58 | ||||
| Precipitation event | -- | -- | -- | -- | -- | -- | -- | -- | |||||
| 443927108555301 | Buck Creek at mouth, near Ralston, Wyoming | Buck Creek | 12.1 | Irrigation | No event | 5 | 4.59 | 4.77 | 2.91 | 6.91 | 0.39 | 0.24 | 0.57 |
| Precipitation event | 5 | 17.4 | 25.1 | 4.6 | 69.6 | 2.08 | 0.38 | 5.76 | |||||
| Fallow | No event | 5 | 0.72 | 1.13 | 0.22 | 2.6 | 0.09 | 0.02 | 0.21 | ||||
| Precipitation event | -- | -- | -- | -- | -- | -- | -- | -- | |||||
| 443438108582301 | Dry Gulch at mouth, near Cody, Wyoming | Dry Gulch | 3.05 | Irrigation | No event | 6 | 0.55 | 1.28 | 0.09 | 3.58 | 0.42 | 0.03 | 1.17 |
| Precipitation event | 2 | 1.02 | 1.02 | 0.94 | 1.1 | 0.33 | 0.31 | 0.36 | |||||
| Fallow | No event | 5 | 0.1 | 0.14 | 0.06 | 0.24 | 0.05 | 0.02 | 0.08 | ||||
| Precipitation event | 2 | 0.53 | 0.53 | 0.39 | 0.67 | 0.17 | 0.13 | 0.22 |
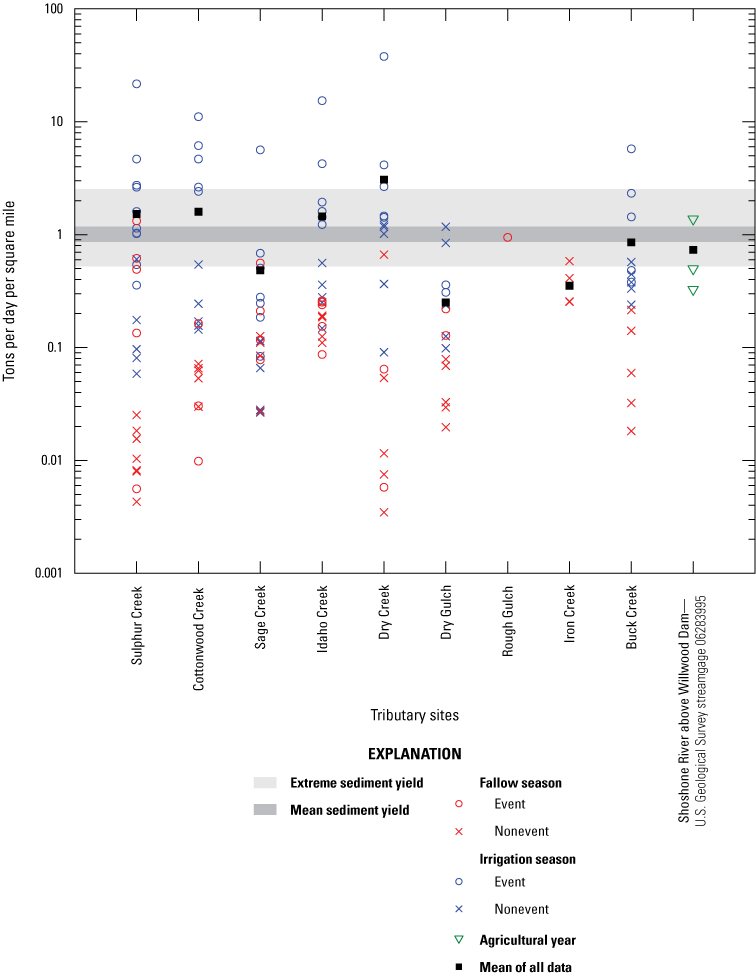
Sediment yields normalized by basin drainage area from discrete sampling events at nine Shoshone River tributary sites, compared to large reservoirs in the Bighorn River watershed (Buffalo Bill Reservoir, Bighorn Lake, and Boysen Reservoir) and streamgages at Shoshone River at Kane, Wyoming (06286200, U.S. Geological Survey, 2023e) and Bighorn River at Kane, Wyo. (06279500, U.S. Geological Survey, 2023f).
Comparison of area-normalized yields for tributaries without precipitation events (referred to as “nonevents”) showed larger normalized yields during the irrigation season, but most sites had a similar large variation of loading during the period of sampling (fig. 17). During the irrigation season, the mean normalized yields from all sites ranged from 0.06 to 0.77 ton/day/mi2 for nonevents, whereas the mean normalized yields from all sites during fallow season nonevents ranged from 0.01 to 0.35 ton/day/mi2. During irrigation season precipitation events, the mean normalized yields ranged from 0.33 to 9.51 tons/day/mi2, with five of the nine sites having averages >2 tons/day/mi2. During fallow season precipitation events, the mean normalized yields ranged from 0.04 to 0.95 ton/day/mi2.
All sites sampled for irrigation season precipitation events had the highest median yield and mean normalized yield compared to all other season event types except for Dry Gulch, which had its highest mean normalized yield measured during a nonevent in irrigation season. The second highest median yields and mean normalized yields were observed half during irrigation season nonevents and half during fallow season precipitation events, except for Dry Gulch, which had its second highest mean normalized yields during irrigation season precipitation events. The third highest median yields were spread evenly between irrigation nonevents and fallow season precipitation events and nonevents. The third highest mean normalized yields were mostly seen during fallow season precipitation events, except for Sulphur Creek, Sage Creek, and Buck Creek. The smallest median yields took place during fallow season nonevents except for Cottonwood Creek and Sage Creek. The smallest mean normalized yields also took place during fallow season nonevents except for Dry Creek and Sage Creek. Buck Creek was not sampled during fallow season precipitation events and its smallest median yield and mean normalized yields were during fallow season nonevents.
The range of group mean daily sediment yield per unit area across all samples at each tributary site ranged from 0.26 to 3.08 tons/day/mi2 (table 9). Data describing sediment accumulation for three large reservoirs (Buffalo Bill Reservoir, Bighorn Lake, and Boysen Reservoir) in the Bighorn River watershed (Blanton, 1991; Ferrari, 1996, 201024; Hilldale, 2020) were used to provide geologic context for sediment yields from the tributary sites. Mean daily unit sediment yields to the three reservoirs ranged from 0.5 to 2.5 tons/day/mi2 (table 1). These data indicate that although individual events on the tributaries can produce higher than average sediment yields, the mean sediment loading from the tributary sites are in a similar range to data collected in other locations in the Bighorn River watershed. Tributaries with mean normalized yields higher than the mean range of background sediment yield included Sulphur Creek, Cottonwood Creek, Idaho Creek, and Dry Creek (fig. 17), which had a mean sediment yield higher than the upper limit of the range of background sediment yields from literature.
Table 9.
Mean sediment yields for Shoshone River tributaries, Wyoming, 2017–23.[mi2, square mile; ton/day, ton per day; ton/day/mi2, ton per day per square mile]
| Site number | Site name | Short name (fig. 7) | Drainage area (mi2) | Number of sampling events | Mean daily1 (ton/day) | Mean daily sediment yield per unit area1 (ton/day/mi2) |
|---|---|---|---|---|---|---|
| 443126109050601 | Sulphur Creek at mouth, at Cody, Wyoming | Sulphur Creek | 46.4 | 27 | 70.6 | 1.52 |
| 443254109013701 | Cottonwood Creek at mouth, near Cody, Wyoming | Cottonwood Creek | 26.4 | 18 | 42.1 | 1.59 |
| 443332108595001 | Sage Creek at mouth, near Cody, Wyoming | Sage Creek | 98.4 | 19 | 47.5 | 0.48 |
| 443353108593601 | Idaho Creek at mouth, near Cody, Wyoming | Idaho Creek | 17.4 | 20 | 25.3 | 1.45 |
| 443437108581501 | Dry Creek at mouth, near Cody, Wyoming | Dry Creek | 17.3 | 17 | 53.2 | 3.08 |
| 443448108572701 | Rough Gulch at mouth near Cody, Wyoming | Rough Gulch | 6.63 | 1 | 6.3 | 0.95 |
| 443817108562701 | Iron Creek at mouth, near Ralston, Wyoming | Iron Creek | 12.6 | 5 | 4.4 | 0.35 |
| 443927108555301 | Buck Creek at mouth, near Ralston, Wyoming | Buck Creek | 12.1 | 15 | 10.3 | 0.85 |
| 443438108582301 | Dry Gulch at mouth, near Cody, Wyoming | Dry Gulch | 3.05 | 15 | 0.8 | 0.26 |
Sediment Loads During Irrigation Season Stable Flows
Under stable conditions during the irrigation season, streamflows in the Shoshone River upstream from Willwood Dam are dominated by clear water originating out of Buffalo Bill Dam. Additional contributions to flow between Buffalo Bill Dam and the study area come from tributary contributions, which likely originate in the complex systems of irrigation canals and are delivered either directly by way of diversion gates in the canals or through seepage losses to the groundwater system (Willwood Work Group 3, 2019). Although these tributary contributions may be expected to be a relatively small component of the total suspended-sediment loads, because they are persistent, they may contribute more sediment than first perceived.
To estimate the potential maximum contribution of suspended sediment from tributaries carrying irrigation water, the relative percent contribution of suspended-sediment loads was calculated during stable conditions for irrigation seasons 2019, 2020, and 2021. These loads were calculated by subtracting suspended-sediment loads during high flows and natural (rainfall-runoff) events from the total for each irrigation season. These estimates require the assumption that all suspended sediment being carried by the Shoshone River during stable conditions originates in tributaries carrying irrigation return flows. This assumption is likely incorrect, because other sources of sediment from bank erosion in tributaries and the main-stem Shoshone River, yields from tributaries without return flows (McCullough Peaks; fig. 1B–C), as well as urban runoff, are present in the system. Likewise, suspended sediment in the Shoshone River during runoff events includes sediment from tributaries that may be carrying irrigation water. Nonetheless, the estimates allow for inference on the maximum possible suspended-sediment contributions from irrigation return flows.
In the 2019 irrigation season, suspended-sediment loads during stable conditions were estimated at 35,500 and 51,300 tons at the upstream and downstream streamgages, respectively. These totals represent 21 and 14 percent of the respective upstream and downstream total coincident suspended-sediment loads (table 10). These percentages increased at both streamgages to approximately 30 percent for the 2020 and 2021 irrigation seasons, which had near average rainfall runoff conditions and lower overall streamflow conditions relative to the 2019 irrigation season. These data indicate that a maximum of about one-third of the suspended-sediment loads measured during the study period happened during stable conditions when tributary contributions were likely dominated by return flow from irrigation water. Interpreting this maximum value may be affected by assumptions stated earlier in the section.
Table 10.
Predicted suspended-sediment loads for the Shoshone River upstream and downstream from Willwood Dam (U.S. Geological Survey streamgages 06283995 and 06284010, respectively [U.S. Geological Survey, 2023g, 2023h]) for irrigation seasons 2019, 2020, and 2021 under stable and natural runoff and high-flow conditions.[n, number of 15-minute measurements used to make prediction; USGS, U.S. Geological Survey]
Analysis of Planimetric and Bathymetric Data in the Willwood Dam Pool
Changes in channel characteristics were measured and analyzed using aerial images from irrigation seasons 2012, 2015, 2017, 2019, and 2022 and bathymetric surveys from November 2017, April 2019, and April 2022. The channel characteristics results are presented by analysis type, including planimetric and bathymetric, and then combined as a proxy for sediment storage behind the dam. This analysis supports the suspended-sediment statistical modeling of sediment transport through the dam.
Planimetric Analysis
Imagery from irrigation seasons 2012, 2015, 2017, 2019, and 2022 was used to determine the backwater extent of the pool area to calculate cross-sectional widths. Backwater extents were further divided into active channel, islands that persist through time, and incipient floodplain (Brown and others, 2025), and the areas for each were calculated (table 11; fig. 18). These areas were used as a proxy for storage within the channel corridor rather than to compare differences in classification or the areas directly. Cross-sectional widths were extracted for 100 cross sections using total backwater extent and active channel backwater extent data.
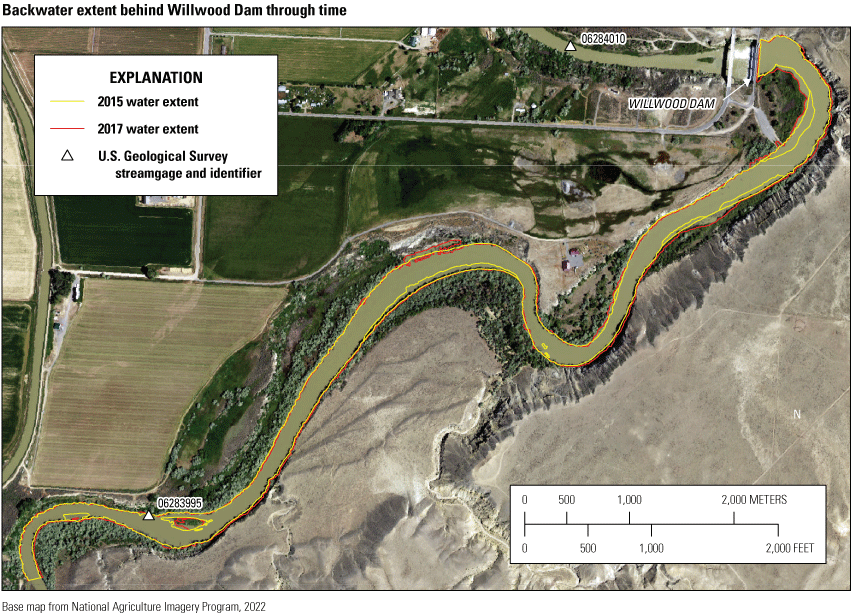
Differences in digitized pool area extent behind Willwood Dam between irrigation seasons 2015 and 2017.
Table 11.
Calculated pool areas by classification from backwater extent digitized from aerial images from irrigation season 2012, 2015, 2017, 2019, and 2022.[Dates shown in month/day/year format. All areas have an uncertainty of plus or minus 10 percent following methods from Dunn and others (1990)]
Total channel widths obtained from the imagery analysis ranged from 86.8 to 338.1 ft across all years (fig. 19). The total channel widths tended to be relatively similar between the years (fig. 19), with the only statistically significant differences in the populations appearing between irrigation seasons 2015 and 2017 (p-value=0.016), and irrigation season 2015 compared to irrigation season 2022 (p-value=0.036). Active channel widths obtained from imagery analysis ranged from 70.9 to 338.1 ft (fig. 19). Active channel widths were all similar between years except for irrigation season 2015, which was determined to be statistically different from all other irrigation seasons (all p-values <0.05).
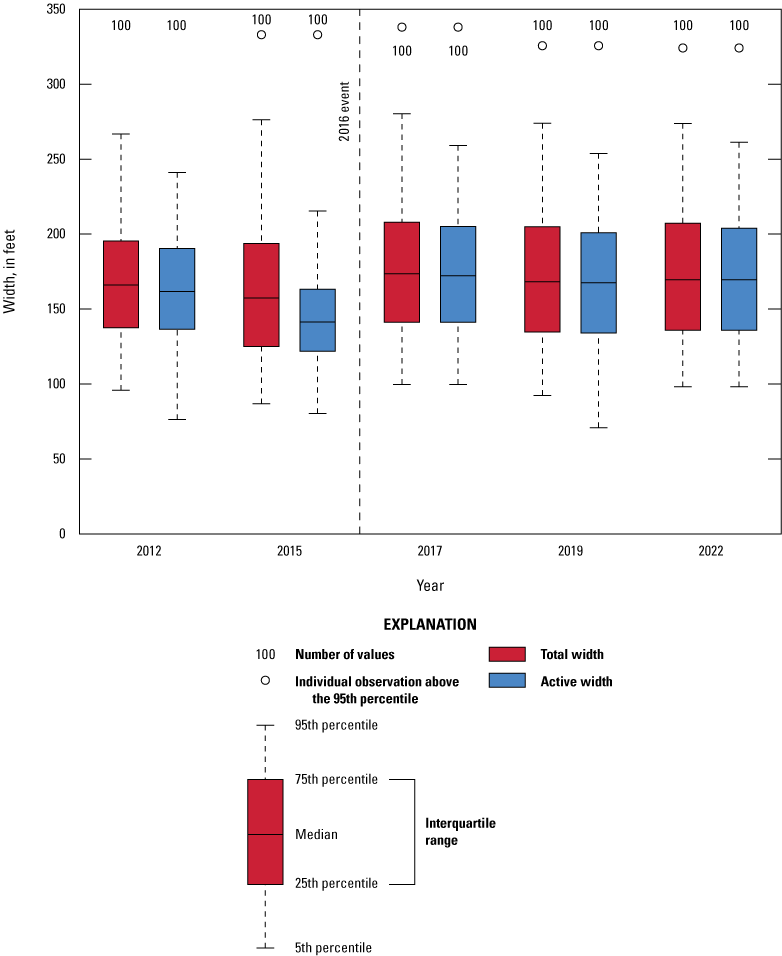
Boxplots showing the distribution of channel widths of 100 cross sections in the pool behind Willwood Dam during irrigation seasons 2012, 2015, 2017, 2019, and 2022.
Understanding uncertainty allows a frame of reference for evaluating data. First, the RMSD between all of the co-located features in the images was used to determine how comparable the images were to each other. Using the 2019 image as the reference image, the difference between co-located features ranged from 3.1 to 5.4 ft. These results indicated that cross sections created using GIS were not in the same physical location within the images requiring unpaired statistical analysis. Cross-sectional width error was analyzed using two methods: (1) the Wilcoxon rank sum test and (2) comparing the difference in mean width to the sum of the image resolution and human feature boundary drawing uncertainty (3 meters) (Schaepe and others, 2016). Both methods resulted in nearly the same statistically significant results, except for one difference in means resulting in a significant difference (2019 compared to 2015, p-value=0.068) and one Wilcoxon rank sum test resulting in no significant difference (2019 compared to 2015, difference of means >11.8 ft [sum of image resolution and human feature boundary drawing uncertainty]).
Bathymetric Analysis
Bathymetric data provided by WYDEQ were used to assist with the evaluation of sediment retention in the pool behind Willwood Dam. Measurement of the bed elevation at three different times provided an indication of whether the overall bed elevation was increasing, indicating sediment deposition, or decreasing, indicating scour (fig. 20). Minimum and mean bed elevations were determined; however, the evaluation of bed changes used the minimum elevation because the minimum value is easier to determine and therefore is considered a more robust measurement. The number of measured points varied between surveys, with some intervals having far fewer points to determine mean bed elevation, introducing bias in some intervals and none in others. Analysis of the minimum bed elevations using unpaired Wilcoxon rank sum tests indicated no statistically significant differences in bed elevations between the years (all p-values >0.05).

Minimum streambed elevation along a longitudinal profile upstream from Willwood Dam, November 2017, April 2019, and April 2022.
Determination of Sediment Retention in Willwood Dam Pool
A direct examination of the sediment storage behind Willwood Dam was not explicitly evaluated during the study period. A planimetric and bathymetric survey was used as a proxy for storage, which supported the model findings and indicated that on an annual basis the system appears to be in a quasi-equilibrium. This difference between the upstream and downstream loads can be caused by sediment movement out of storage or into the area behind the dam and from sediment loads from unmeasured tributaries between the upstream streamgage and the dam. Additionally, hillslope erosion can contribute an unknown sediment load that could be moved through or stored behind the dam. These considerations help to explain the pool areas, cross-sectional widths, and longitudinal profiles not indicating any strong trends in either sediment accumulation or transport through the dam.
Results from the planimetric and bathymetric survey data provide multiple lines of evidence to show that the sediment accumulation behind the dam, on an annual basis, did not happen within the error of the methods. Both methods of measurement have inherent uncertainty; however, multiple methods used to evaluate the sediment accumulation support the idea that the current system operation is in a quasi-equilibrium on an annual basis. Although the sediment balance on an annual basis is a near equilibrium with dam operations, evaluation of the data over the course of a given year does indicate periods of accumulation during irrigation season and export during the fallow season, sluicing events, and flushing events.
Precipitation Runoff Analysis and Modeling
Naturally occurring high-magnitude SSC runoff events have the potential to accumulate a substantial amount of sediment behind Willwood Dam. The relation between these high-concentration events and individual runoff events observed at the upstream streamgage can be modeled. This relation can be used to provide historical context for such events.
Rainfall Runoff
Estimates of sediment loads for natural runoff events described in the “Natural Events” section for the upstream streamgage (table 6) were combined with daily average precipitation data from the PRISM AN81d dataset (PRISM Climate Group, 2021) for the Shoshone River watershed upstream from Willwood Dam. Total accumulated precipitation was summed from the day before the beginning of each event until the last day of the event. These data indicate that accumulated rainfall from the natural runoff events captured during the study period varied from a trace to as much as 4.26 in. (fig. 21). The turbidity suspended-sediment model predicted a range of sediment loads varying from 112 to 99,000 tons, whereas the ABS model predicted a range of 47 to 232,000 tons of suspended sediment from these events. The behavior of the sediment loads relative to accumulated precipitation did not appear to change depending on irrigation or fallow season (fig. 21A), but only a few runoff events were captured during fallow season, so any differences would not be expected to be apparent.

Scatterplots showing accumulated rainfall in relation to predicted sediment loads for the Shoshone River above Willwood Dam, near Ralston, Wyoming (upstream streamgage 06283995, U.S. Geological Survey, 2023g). A, Acoustic backscatter suspended-sediment model. B, Turbidity suspended-sediment model.
The plots in figure 21 show that the amount of sediment delivered to the Shoshone River during rainfall events varies substantially for a given rainfall accumulation. For the area of the plot near 0.1 in. of rain, there is a variation of nearly two orders of magnitude of suspended-sediment loads between events calculated using the ABS sensor (fig. 21A). This variation is weaker using the turbidity model (fig. 21B), but still covers approximately one order of magnitude. These data indicate that fine sediment runoff from the basin between Buffalo Bill Dam and Willwood Dam is complex and likely dependent on where the precipitation is concentrated on the landscape. However, the data in figure 21 also indicate that sediment loads begin to increase exponentially after about 0.3 in. of accumulated rainfall, suggesting the system begins to respond in unison to larger, more persistent storms.
Snowmelt Runoff
Snowmelt runoff events were identified as events when diel fluctuations in sediment loads were parallel and consistent with the hydrograph in the late winter and early spring. The beginning and end of these events were identified by examination of the simultaneous turbidity, ABS, and streamflow timeseries for the upstream streamgage. Estimates of suspended-sediment loads from snowmelt runoff event ranged from 9 to 562 tons for the ABS suspended-sediment model and 87 to 10,600 tons for the turbidity model (table 12). Snowmelt events constituted 7 percent and 6 percent of the total coincident fallow season suspended-sediment loads predicted with the ABS and turbidity models, respectively (table 6).
Table 12.
Suspended-sediment loads predicted with statistical models for the Shoshone River above Willwood Dam, near Ralston, Wyoming (streamgage 06283995; U.S. Geological Survey, 2023g), for snowmelt-driven runoff events during agricultural years 2020–21.[Dates shown in month/day/year format; ABS, acoustic backscatter; LB, lower bound of 90-percent prediction interval; Load, mean predicted load; UB, upper bound of 90-percent prediction interval]
Precipitation Runoff Modeling
There are turbidity records for the upstream streamgage from March 2018 through October 2021 and an average turbidity-predicted SSC was determined for a total of 1,002 days at that streamgage. Of those, 254 had days with at least some precipitation recorded with an average temperature greater than 42 °F (rain); these days had rainfall totals ranging from a trace to 1.86 in. A plot of the modeled daily average SSC relative to 2-day accumulated precipitation (fig. 22) shows that days with snow had low SSC relative to days with rain or mixed precipitation, and mixed days had the greatest variability in SSC.

Scatterplot showing relation between 2-day accumulated precipitation and modeled suspended sediment for days with measurable precipitation.

Frequency plot showing the frequency of exceeding the threshold of modeled suspended-sediment concentrations and 2-day accumulated rainfall.
Exponential models were fitted to the 1-, 2-, and 3-day accumulated precipitation. All model coefficients were statistically significant at the 0.001 level, and the 2-day accumulated precipitation model explained the most variance (coefficient of determination=0.42; fig. 22). That model fits the data pattern well, effectively capturing the change in data behavior when 2-day precipitation exceeds 0.1 in., shown as 10−1 in. on figures 22 and 23. The model slope constant (k, eq. 8) was estimated to be 2.3. The model intercept was estimated to be approximately 42 mg/L, which is a reasonable approximation of mean SSC values for days when accumulated precipitation was less than 0.1 in., shown as 10−1 in. on figure 22.
Using the model to estimate the magnitude of 2-day accumulated precipitation required to double the intercept value resulted in a value of 0.3 in., indicating this is the threshold value when SSC in the Shoshone River begins to rapidly increase beyond slightly elevated levels associated with minor rainfall. Based on the empirical cumulative distribution function of the PRISM Climate Group (2021) rainfall record for days when precipitation exceeds 0 in., 0.3 in. of rain was approximately equal to the 90th percentile. These data indicate that days when the accumulated rainfall exceeded 0.3 in. occurred in 10 percent or less of all storms (fig. 23). Examination of the precipitation record from 1981 to 2021 indicates that rainstorms with accumulated precipitation greater than 0.3 in. occur on average 4.5 times a year in the Shoshone River watershed upstream from Willwood Dam and as many as 11 times in a single year.
Discussion
Closing a fluvial sediment budget requires that the change in storage is large enough to be outside the error of the input and output measurement terms (eq. 1). There are at least three primary sources of uncertainty in the models that did not permit closure of sediment budgets for many of the seasons measured. First, the southeast bank (right bank when facing downstream) of the Shoshone River as it flows through the Willwood Dam pool intersects two tributaries, one of which is reasonably large, and both of which originate in the badlands of McCullough Peaks (fig. 1). The larger intervening tributary has been observed by the authors to be a deeply incised arroyo-like channel and is known to contribute fine sediment when runoff occurs. The magnitude of the sediment yield from these tributaries is unknown because they are extremely difficult to access and only have significant flow during rainstorms, and prior attempts by WYDEQ to use automatic samplers have failed. Nonetheless, the difference in basin areas between the upstream streamgage and the face of Willwood Dam is only approximately 3 mi2 (U.S. Geological Survey, 2024a), so even at our maximum observed annual yield rate of approximately 40 tons/day/mi2 (refer to fig. 17 for sediment yields for Shoshone River tributary sites), this tributary cannot account for the large discrepancies in the mean calculated values.
The second source of uncertainty is sediment exiting the Willwood Canal during the irrigation season. The bulk of the suspended sediment that would be exiting the canal would be in the form of washload because the canal gates are positioned high in the water column near the face of Willwood Dam. The amount of sediment leaving via the canal was estimated using the assumption that concentrations were similar at the canal gate and the downstream streamgage. These calculations estimate that 6, 1, and 29 percent of the total estimated suspended load left through the canal during irrigation seasons 2019, 2020, and 2021, respectively, which again does not account for the large discrepancies in the mean estimated sediment loads between streamgages in most seasons.
Finally, there is the precision of the statistical models coupled with the discrete nature of when large loads of suspended sediment are being transported. Although the models demonstrated the basic pattern of sediment transport expected from our conceptual understanding of dam operations (accumulation during irrigation season, export during fallow season), the bulk of the inordinately large differences in mean estimated suspended-sediment transport between the upstream and downstream streamgages happened during large floods or large rainstorm events (fig. 14). The perception of net sediment export is thus mainly restricted to the large differences when streamflows were at their maximum for the year and concentrations were at their highest, and these are the conditions when there are only minor differences in streamflow between streamgages because the canal export is small or, in some cases, not exporting at all. Under such conditions, even minor differences in estimated SSC result in large, calculated differences in loads because streamflow is so high.
The gaps in records, precision of the instrumentation, and large variation in grain sizes in suspended-sediment mixtures downstream from the dam made closing the sediment budgets for most seasons unattainable. Given that the sediment budgets here were nearly always indeterminate, and that the planimetric and bathymetric data indicated little change in the bed and bank material, it is likely that the change in sediment storage behind the dam was simply too small relative to the precision of the statistical models and other uncertainties. Nonetheless, the models demonstrated reasonable approximations of the seasonal processes of accumulation and export, and provided reasonable estimates of the potential of Willwood Dam to pass sediment loads and prevent uncontrolled sediment releases.
The biggest recent change in sediment storage measured using the planimetric area of deposits behind Willwood Dam took place between irrigation seasons 2015 and 2017, and this change was almost entirely in the point bar deposits on the river left of the pool immediately upstream from the dam (fig. 18; table 10). The main event that took place between these two measurements was the installation of new Willwood Canal gates in October 2016. The construction activity was associated with the 2016 sediment release event. Given that the large point bar deposit disappeared between these images, it is likely that much of that deposit was removed during the sediment release in 2016.
Because the middle sluice gate has been operational since 2014, allowing more sediment to pass through the dam than at any time since at least the early 2000s, the current sediment in storage may be in approximate equilibrium with current dam operations when averaged over multiple years. If the south sluice gate was made operational, it is likely that another equilibrium condition, with even less sediment stored behind Willwood Dam, could be possible. An additional functional sluice gate could also provide more operational flexibility for controlled sediment releases because Willwood Dam could pass more water through its sluice gates, thereby maximizing the net sediment export from behind the dam for a given sediment concentration; the additional water may also help maintain suspended transport in the Shoshone River while minimizing fine sediment deposition on the channel bed.
The analysis indicated that the primary times of significant fine sediment export from Willwood Dam were during the fallow seasons and during deliberate sluicing events. The only season with a significant prediction of fine sediment export was fallow season 2020, from October 2019 through April 2020. A possible explanation for the large, significant export of sediment during this time is that more sediment had been delivered from the upstream landscape owing to the wet conditions of irrigation season 2019. Another possible explanation is that the pool elevations during fallow season 2020 were lower and had more variability than those during 2021 (fig. 8). Lower pool elevations reduce confining hydrostatic pressure on the sediment deposits behind the dam and steepen the water surface slope. If pool elevations are responsible for the reduced sediment exports during fallow season 2021, pool elevation targets could be set to minimize uncontrolled fine sediment releases in the fallow season. However, any reduced uncontrolled fine sediment exports during the fallow season may disrupt fine sediment storage equilibrium if not counterbalanced by deliberate, controlled fine sediment releases.
Effects of Controlled Sluicing and Flushing Events on the Release of Sediment Stored Behind Dam
There were four sluicing events and one flushing event during the study period. The loads from these events indicated that sluicing events are capable of net export of hundreds to thousands of tons. The April 2021 experimental release was the only event for which the uncertainty bounds did not allow us to close the budget. That event relied on the ABS data models because of the presence of large amounts of sand, and those models have large prediction intervals, reflecting the complexity of measuring unpredictable grain size mixtures. Even though the budget could not be closed for that experiment (table 7), large portions of the sediment piles behind the dam were observed by the authors to be calving into the pool during the sluicing experiment, indicating that there was likely net export of sediment from behind Willwood Dam.
Although the uncertainties are large, sluicing events allow for controlled releases of sediment that contribute to the near equilibrium conditions that occurred measured over the annual timescale during this study. With the exception of the fallow season 2020, there was not a measurable change in storage given the precision of the methods applied. The detectable export of sediment in the fallow season of 2020 took place after an irrigation season that had much more rain than average, and thus net export of sediment from Willwood Dam during the fallow season was likely due to an unusually high amount of sediment input that year. Field personnel observed substantial amounts of accumulated sediment on the bed of the Shoshone River below Willwood Dam in the spring of 2020. Wyoming Game and Fish Department also measured near all-time lows numbers and biomass of trout (Salmoninae) below Willwood Dam measured by (Jason Burckhardt, Wyoming Game and Fish Department, oral commun., May 2023). The net export of sediment from Willwood Dam during the 2020 fallow season likely contributed to the near-equilibrium conditions, and it also potentially had a negative effect on the fish community.
Quantity and Variability of Sediment Yields from Select Tributaries
Sediment samples were collected during a total of 137 sampling events during calendar years 2017–23 on nine tributaries to the Shoshone River between Buffalo Bill Reservoir (not shown) and Willwood Dam (fig. 7). At nearly all sites, sediment yields ranged substantially, spanning two to five orders of magnitude. As expected, sediment loading from each tributary was higher during precipitation events, especially during irrigation season precipitation events, and tended to be larger in tributaries with large drainage areas, but the mean daily sediment yield per unit area for all sites was in a similar range to longer-term averages of sediment loading calculated using data from Bighorn River watershed reservoirs. Tributaries with mean normalized yields higher than the mean range of background sediment yield included Sulphur Creek, Cottonwood Creek, Idaho Creek, and Dry Creek (fig. 17); however, only one tributary site, Dry Creek, had a mean value higher than the upper limit of the range of background sediment yields (tables 1 and 2). Sediment yields from the tributaries in the badlands of McCullough Peaks remain unknown but are likely to be higher on a unit-area basis than others originating in the flatter, more vegetated portions of the landscape.
Although no single Shoshone River tributary had normalized sediment yields that were extraordinary relative to others, local sediment control efforts are limited in the areas where they can use mitigation measures. Mitigation efforts in the arroyo-like tributaries originating in McCullough Peaks are unlikely to be successful given the steepness of the terrain and lack of vegetation cover. Alternatively, mitigation efforts are more likely to have success in the creeks flowing in the flatter-lying alluvial bottoms.
Natural Long-Term Average Frequency and Magnitude of High-Concentration Sediment Events
Large proportions of annual suspended-sediment loads coming into the Shoshone River were associated with runoff events (tables 8–9). These events are uncontrolled and are expected given the high desert landscape of the Bighorn Basin ecoregion. Analysis of rainfall-induced sediment runoff indicates that high-concentration events happened somewhat frequently in the basin between Buffalo Bill Dam and Willwood Dam and would be happening regardless of the sluicing events generated by Willwood Dam. However, the sluicing events documented in the “Sluicing Events” section indicate that Willwood Dam is capable of passing reasonable proportions of the accumulated sediment in a controlled manner and that, when combined with a controlled high flow from Buffalo Bill Dam, this sediment is unlikely to accumulate on the bed downstream from Willwood Dam. Given that dam operations during this study indicated no net accumulation of sediment behind Willwood Dam, operations that continue to sluice sediment in a controlled manner similar to those documented herein have the potential to reduce the likelihood of uncontrolled releases detrimental to the downstream fishery and could mitigate issues among local stakeholders.
Summary
Sedimentation affects many of the Nation’s aging reservoirs. Dams and water diversions from rivers have been central elements of infrastructure supporting agricultural irrigation in the arid and semiarid regions of the Western United States for more than a century. The Willwood Irrigation District diversion dam (hereafter referred to as “Willwood Dam”) in Park County, Wyoming, was built on the Shoshone River in 1924 as part of the U.S. Department of the Interior’s Shoshone Project. Willwood Dam is approximately 12 miles northeast of Cody, Wyo., and has a structural height of 70 feet. The dam is operated by Willwood Irrigation District and delivers irrigation water to approximately 11,500 acres of agricultural land in the Shoshone River valley.
In October 2016, renovation construction activities at Willwood Dam and the Willwood Canal caused an evacuation of nearly 96,000 cubic yards (yd3) of sediment. Although the direct effect of the sediment release on the fish population was difficult to quantify, local fisheries experts and residents observed dead fish encased in sediment along the riverbanks, indicating the release killed some part of the downstream fish community. The fine sediment release in 2016 raised concerns that ongoing sediment management at Willwood Dam imposes limits on the long-term health of the aquatic ecosystem and fish populations. In response, the Wyoming Department of Environmental Quality organized three work groups aimed at restoring aquatic life and habitats degraded by the release and determining the effects or needs of potential future sediment releases from Willwood Dam.
The U.S. Geological Survey, in cooperation with the Wyoming Department of Environmental Quality and members of Work Groups 2 and 3, initiated an investigation of the dynamics of sediment transport in the Shoshone River and selected tributaries between Buffalo Bill Dam and Willwood Dam. The goal of the study was to quantify sediment transport into and out of Willwood Dam on an annual, seasonal, and event basis to further understand the relative quantities of sediment coming from natural and human-influenced sources on the landscape. The study ran from March 2019 through October 2021 and used observations of streamflow, turbidity, and acoustic backscatter (ABS) collected at streamgages upstream and downstream from Willwood Dam to quantify suspended-sediment loads into and out of the dam during irrigation and fallow seasons, precipitation-runoff events, and deliberate sediment releases. The relative contribution of tributaries upstream from Willwood Dam was examined using discrete measurements of suspended-sediment concentration and bedload during irrigation and fallow seasons, precipitation events, and stable conditions.
Analysis of daily precipitation and temperature data indicated that conditions in the study area during the 2019 agricultural year were wetter and colder than period of record normal, and drier and near normal temperatures for the 2020 and 2021 agricultural years. Not all sediment load records were complete because of rejected observations (outliers), instrument failures or fouling, and instrument removal for calibrations.
Statistical modeling of suspended-sediment concentration (SSC) using paired values of turbidity and ABS produced four initial models that had poor model diagnostics. These models were improved by downsampling and accounting for bias from serial correlation. At both streamgages, the ABS models had higher intercept terms, whereas the turbidity models had higher slope terms. Final model fits were generally good, had reasonable compliance with normality, and coefficients of determination indicating that more than 84 percent of the variance was explained by either turbidity or ABS. Slope and intercept values differed between turbidity and ABS models at each streamgage, and for turbidity and ABS models between upstream and downstream streamgages. Instead of simply using the model with the most explanatory power available to generate sediment loads, a system of rules was developed to select the model predictions used for each time step. The rules are based on the seasonal operations of Willwood Dam, assumptions about the grain sizes mobilized during these operations, and assumed accuracy of the models at the downstream streamgage under different operational conditions. The primary goal of the rule-based system was to produce sediment load estimates at both streamgages that were calculated using the same method, while maximizing the number of observations with a load estimate.
The sediment budget between upstream and downstream estimates of loads was interpreted using the mean predicted values bound by their respective model prediction intervals. When mean predicted loads of one streamgage were contained in the prediction intervals of the other streamgage, and vice-versa, difference in the sediment budget were interpreted as “indeterminate.” If the mean predicted load of one streamgage was outside the prediction intervals of the other, the sediment budget was interpreted to be “weakly significant.” Finally, if the mean predicted load for both streamgages was outside the respective prediction intervals of the other streamgage, the sediment budget was interpreted to be “significant.”
Modeled sediment load balances demonstrated the depositional and erosional behaviors expected from the conceptual model of dam operations whereby sediment accumulation tends to happen during irrigation seasons when the dam is spilling over the top and evacuating sediment during the fallow seasons when it is spilling through the sluice gates at the base of the dam. The sediment load calculations using the rules-based model criteria indicated that between 14,200 and 380,000 tons of suspended sediment moved through the Shoshone River around Willwood Dam during irrigation seasons 2019, 2020, and 2021. During fallow seasons 2019, 2020, and 2021, which had fewer complete records, between 1,140 and 106,000 tons of suspended sediment was estimated to have moved through the river.
For all seasons, except fallow season 2022, the models estimated that more sediment was released from the dam than entered the dam, but the modeled mean loads at each streamgage were nearly always within the prediction intervals of each other, making the sediment balance indeterminant. The one exception was fallow season 2020, when the predicted means were not contained by either prediction interval, indicating a conclusive signal that more sediment left the dam than entered during the coincident periods of record. A weakly significant signal was also detected for irrigation season 2019 natural events when the sediment budget indicated more sediment was exported through the dam than came in. Irrigation season 2019, which had above normal precipitation, had the largest estimated total suspended-sediment loads, about 69 percent of which was moved during storm events. These heavy sediment loads were likely the cause for the significant export of sediment from the dam detected in fallow season 2020.
Examination of suspended-sediment loads during irrigation seasons indicated that between 65 and 85 percent of fine sediment was transported during annual high flows and storm events, with the remainder transported during steady, lower streamflows. Examination of suspended loads during fallow seasons indicated that deliberate sediment releases (sluicing events) through Willwood Dam accounted for between 39 and 67 percent of the total sediment moved during those seasons. Sediment budgets calculated during the shorter periods of sluicing events indicated that between 39 and 67 percent of the measured sediment was moved during deliberate human-caused sediment release events, such as sediment sluices. Deliberate sediment releases from Willwood Dam had estimated net exports of between 1,360 and 22,400 tons.
Between August 2017 and July 2023, sediment samples were collected from 9 tributaries to the Shoshone River during 137 sampling events, including stable and precipitation-runoff conditions. Sediment concentrations and the resulting sediment loading at each streamgage varied substantially, with the data range at each streamgage spanning two to five orders of magnitude. Comparison of area-normalized yields without precipitation events ranged from 0.06 to 0.77 ton per day per square mile (ton/day/mi2), whereas the mean normalized yields from all sites during fallow season nonevents ranged from 0.01 to 0.35 ton/day/mi2. During irrigation season precipitation events, the mean normalized yields ranged from 0.33 to 9.51 tons/day/mi2; during fallow season precipitation events, the mean normalized yields ranged from 0.04 to 0.95 ton/day/mi2. The range of group mean daily sediment yield per unit area across all samples at each tributary site ranged from 0.26 to 3.08 tons/day/mi2. With the exception of one tributary, Dry Creek, these mean values were within the range of basin-scale background sediment yield values estimated from reservoir surveys and previous suspended-sediment studies.
Imagery from irrigation seasons 2012, 2015, 2017, 2019, and 2022 was used to determine the planimetric backwater extent of the pool area behind Willwood Dam to identify any changes in sediment storage. Cross-sectional widths were extracted for 100 cross sections using total backwater extent and active channel backwater extent data. Active channel widths in the pool area behind Willwood Dam ranged from 70.9 to 338.1 feet. Active channel widths were all similar between years except for 2015, which was determined to be statistically different from all other irrigation seasons. Bathymetric data taken in three increments between November 2017 and April 2022 were used to assist with evaluating changes in sediment storage behind the dam. Measurement of the minimum bed elevation along the length of the pool provided an indication of whether or not the overall bed elevation was increasing, indicating sediment deposition, or decreasing, indicating scour. The number of measured points varied between surveys, with some intervals having far fewer points to determine mean bed elevation, introducing bias in some intervals and none in others. Analysis of the minimum bed elevations using unpaired Wilcoxon rank sum tests indicated no statistically significant differences in bed elevations between the years. Results from the planimetric and bathymetric survey data provide multiple lines of evidence to indicate that annual sediment accumulation behind the dam did not occur within the error of the methods used.
Estimates of sediment concentrations and loads for natural runoff events for the upstream streamgage were combined with daily average precipitation data for the Shoshone River watershed upstream from Willwood Dam. These data indicate that accumulated rainfall from the natural runoff events captured during the study period varied from a trace to as much as 4.26 inches, with associated predicted suspended-sediment loads varying from 112 to 232,000 tons of suspended sediment depending on the model used (turbidity or ABS). The behavior of the sediment yields relative to accumulated precipitation did not appear to change depending on irrigation or fallow season. Exponential models of suspended-sediment concentrations were fitted to the 1-, 2-, and 3-day accumulated precipitation values. All model coefficients were statistically significant at the 0.001 level, and the 2-day accumulated precipitation model explained the most variance. That model indicated that suspended-sediment concentrations in the Shoshone River increase exponentially for 2-day accumulations of 0.3 inch or more. These storms account for 10 percent or less of all storms observed between 1981 and 2018.
The gaps in records, precision of the instrumentation, and complexity of sediment mixtures downstream from the dam made closing the sediment budgets for most seasons unattainable. The biggest recent change in sediment storage measured using the planimetric area of deposits behind Willwood Dam took place between agricultural years 2015 and 2017. The main event between these two measurements was the installation of new Willwood Canal gates in October 2016, which resulted in a large uncontrolled sediment release. Because the sediment budgets were nearly always indeterminate and the planimetric and bathymetric data indicated little change in the bed and bank material, it is likely that the change in sediment storage behind the dam during the study period was simply too small relative to the precision of the statistical models and other uncertainties.
This body of evidence suggests that, averaged during the 3-year study period, no major changes in sediment storage occurred, and that the current operations may be keeping storage at near-equilibrium. This condition could have been initiated because the middle sluice gate has now been operational since 2014, and the sediment release in October 2016 evacuated a large amount of legacy stored sediment. Although the uncertainties are large, sluicing events allow for controlled releases of sediment that contributed to the near equilibrium conditions present during this study. If the south sluice gate was made operational, another equilibrium condition, with even less sediment stored behind Willwood Dam, could be possible. An additional functional sluice gate could also provide additional operational flexibility for controlled sediment releases because Willwood Dam could pass more water through its sluice gates, keeping concentrations lower while maximizing the net sediment mass exported.
References Cited
Agrawal, Y.C., Pottsmith, H.C., Dana, D., and Mikkelsen, O.A., 2019, Super-turbidity meter—LISST-AOBS combines optical turbidity with acoustics in Proceedings of the 38th IAHR World Congress, Panama City, Panama, September 1–6, 2019: Bellevue, Wash., Sequoia Scientific, Inc., 6 p., accessed August 2022 at https://www.sequoiasci.com/wp-content/uploads/2019/06/Agrawal_Panama_AOBS_full_Paper.pdf.
Alexander, J.S., O’Connell, J.P., and Brown, J.E., 2023, Interim guidance for calibration checks on a submersible acoustic backscatter sediment sensor (ver. 1.1, November 2023): U.S. Geological Survey Open-File Report 2023–1039, 23 p., accessed June 22, 2024, at https://doi.org/10.3133/ofr20231039.
Allred, T.M., and Schmidt, J.C., 1999, Channel narrowing by vertical accretion along the Green River near Green River, Utah: Geological Society of America Bulletin, v. 111, no. 12, p. 1757–1772, accessed June 22, 2024, at https://doi.org/10.1130/0016-7606(1999)111<1757:CNBVAA>2.3.CO;2.
Bauer, D.F., 1972, Constructing confidence sets using rank statistics: Journal of the American Statistical Association, v. 67, no. .339, p. 687–690, accessed June 20, 2024, at https://doi.org/10.1080/01621459.1972.10481279.
Bonner, R.E., 2002, The dam and the valley—Land, people, and environment below Buffalo Bill Dam in the twentieth century: Agricultural History, v. 76, no. 2, p. 272–288, accessed June 22, 2024, at https://doi.org/10.1215/00021482-76.2.272.
Breeding, R., 2016, River choked with silt: Cody [Wyoming] Enterprise, accessed September 12, 2019, at https://www.codyenterprise.com/news/local/article_9dda05f2-9a2b-11e6-b872-0bcc36edbc6f.html.
Breusch, T.S., and Pagan, A.R., 1979, A simple test for heteroscedasticity and random coefficient variation: Econometrica, v. 47, no. 5, p. 1287–1294, accessed June 20, 2024, at https://doi.org/10.2307/1911963.
Brown, H.M., Wells, C.R., and Brugger, C.L., 2025, Shapefiles of digitized backwater extent behind Willwood Dam on the Shoshone River, near Cody, Wyoming, derived from 2012, 2015, 2017, 2019, and 2022 National Agriculture Imagery Program imagery: U.S. Geological Survey data release, https://doi.org/10.5066/P13VHDRG.
Church, M., 2006, Bed material transport and the morphology of alluvial river channels: Annual Review of Earth and Planetary Sciences, v. 34, no. 1, p. 325–354, accessed June 20, 2024, at https://doi.org/10.1146/annurev.earth.33.092203.122721.
Cochrane, D., and Orcutt, G.H., 1949, Application of least squares regression to relationships containing auto-correlated error terms: Journal of the American Statistical Association, v. 44, no. 245, p. 32–61, accessed June 22, 2024, at https://doi.org/10.1080/01621459.1949.10483290.
Davis, B.E., 2005, A guide to the proper selection and use of federally approved sediment and water-quality samplers: U.S. Geological Survey Open-File Report 2005–1087, 20 p. [Also available at https://doi.org/10.3133/ofr20051087.]
Dean, D.J., Topping, D.J., Buscombe, D.D., Groten, J.T., Ziegeweid, J., Fitzpatrick, F.A., Lund, J.W., and Coenen, E.N., 2022, The use of continuous sediment‐transport measurements to improve sand‐load estimates in a large sand‐bedded river—The lower Chippewa River, Wisconsin: Earth Surface Processes and Landforms, v. 47, no. 8, p. 2006–2023. [Also available at https://doi.org/10.1002/esp.5360.]
DJ&A, 2021, Natural resource management plan for state and federal lands in Park County, Wyoming: Park County Board of County Commissioners, prepared by DJ&A, 127 p., accessed June 21, 2024, at https://parkcounty-wy.gov/wp-content/uploads/Documents/Planning%20and%20Zoning/Documents/NRMP/2021.08.20%20FINAL%20Park%20County%20NRMP.pdf.
Duan, N., 1983, Smearing estimate—A nonparametric retransformation method: Journal of the American Statistical Association, v. 78, no. 383, p. 605–610, accessed June 21, 2024, at https://doi.org/10.1080/01621459.1983.10478017.
Dunn, R., Harrison, A.R., and White, J.C., 1990, Positional accuracy and measurement error in digital databases of land use—An empirical study: International Journal of Geographical Information Systems, v. 4, no. 4, p. 385–398, accessed June 21, 2024, at https://doi.org/10.1080/02693799008941554.
Durbin, J., and Watson, G.S., 1950, Testing for serial correlation in least squares regression: I: Biometrika, v. 37, no. 3/4, p. 409–428, accessed June 21, 2024, at https://doi.org/10.2307/2332391.
Edwards, T.K., and Glysson, G.D., 1999, Field methods for measurement of fluvial sediment: U.S. Geological Survey Techniques of Water-Resources Investigations, book 3, chap. C2, 89 p., accessed June 21, 2024, at https://doi.org/10.3133/twri03C2.
Emmett, W.W., 1980, A field calibration of the sediment-trapping characteristics of the Helley-Smith bedload sampler: U.S. Geological Survey Professional Paper 1139, 44 p. [Also available at https://doi.org/10.3133/pp1139.]
Esri, 2023, ArcGIS Pro 3.1.2: Redlands, Calif., Esri software, accessed July 2023 at https://www.esri.com/software/arcgis/arcgis-for-desktop.
Graf, W.L., Wohl, E., Sinha, T., and Sabo, J.L., 2010, Sedimentation and sustainability of western American reservoirs: Water Resources Research, v. 46, no. 12, article W12535, 13 p. [Also available at https://doi.org/10.1029/2009WR008836.]
Grams, P.E., and Schmidt, J.C., 2002, Streamflow regulation and multi-level flood plain formation—Channel narrowing on the aggrading Green River in the eastern Uinta Mountains, Colorado and Utah: Geomorphology, v. 44, no. 3–4, p. 337–360, accessed June 22, 2024, at https://doi.org/10.1016/S0169-555X(01)00182-9.
Gurnell, A.M., Downward, S.R., and Jones, R., 1994, Channel planform change on the River Dee meanders, 1876–1992: Regulated Rivers, v. 9, no. 4, p. 187–204. [Also available at https://doi.org/10.1002/rrr.3450090402.]
Guy, H., 1969, Laboratory theory and methods for sediment analysis: U.S. Geological Survey Techniques of Water-Resources Investigations Report, book 5, chap. C1, 58 p., accessed June 21, 2024, at https://doi.org/10.3133/twri05C1.
International Organization for Standardization, 2016, ISO 2017–1:2016—Water quality—Determination of turbidity, part 1—Quantitative methods: International Organization for Standardization, Technical Committee ISO/TC 147/SC 2, 9 p., accessed March 29, 2024, at https://www.iso.org/standard/62801.html.
Julien, P.Y., 1995, Erosion and sedimentation: Cambridge, United Kingdom, Cambridge University Press, 286 p. [Also available at https://doi.org/10.1017/CBO9781139174107.]
Juracek, K.E., 2015, The aging of America’s reservoirs—In‐reservoir and downstream physical changes and habitat implications: Journal of the American Water Resources Association, v. 51, no. 1, p. 168–184. [Also available at https://doi.org/10.1111/jawr.12238.]
Landers, M.N., and Sturm, T.W., 2013, Hysteresis in suspended sediment to turbidity relations due to changing particle size distributions: Water Resources Research, v. 49, no. 9, p. 5487–5500 [Also available at https://doi.org/10.1002/wrcr.20394.]
Landers, M.N., Straub, T.D., Wood, M.S., and Domanski, M.M., 2016, Sediment acoustic index method for computing continuous suspended-sediment concentrations: U.S. Geological Survey Techniques and Methods, book 3, chap. C5, 63 p., accessed June 21, 2024, at https://doi.org/10.3133/tm3C5.
Leopold, L.B., and Miller, J.P., 1954, A postglacial chronology for some alluvial valleys in Wyoming: U.S. Geological Survey Water-Supply Paper 1261, 89 p., accessed June 21, 2024, at https://doi.org/10.3133/wsp1261.
Levy, J.S., and Cvijanovich, B., 2023, Meandering river evolution in an unvegetated permafrost environment: Geomorphology, v. 432, article 108705, 9 p., accessed June 21, 2024, at https://doi.org/10.1016/j.geomorph.2023.108705.
Mackin, J.H., 1937, Erosional history of the Big Horn Basin, Wyoming: Geological Society of America Bulletin, v. 48, no. 6, p. 813–894, accessed June 21, 2024, at https://doi.org/10.1130/GSAB-48-813.
Manaster, A.E., Straub, T.D., Wood, M.S., Bell, J.M., Dombroski, D.E., and Curran, C.A., 2020, Field evaluation of the Sequoia Scientific LISST-ABS acoustic backscatter sediment sensor: U.S. Geological Survey Open-File Report 2020–1096, 26 p., accessed June 21, 2024, at https://doi.org/10.3133/ofr20201096.
Mathers, G., 2015, Willwood Dam being examined: Powell [Wyoming] Tribune, February, 26, 2015, accessed October 21, 2024, at https://www.powelltribune.com/stories/willwood-dam-being-examined,3703.
McElroy, B., 2017, Report on potential to flush Shoshone River channel of fine sediment deposited after October 2016 evacuation from Willwood Dam: Wyoming Game and Fish Department, 28 p. [Also available at https://drive.google.com/file/d/1TA2-4HcJCIKNXxClNH_UtoJm-J2F0Wc4/view.]
Merten, G.H., Capel, P.D., and Minella, J.P., 2014, Effects of suspended sediment concentration and grain size on three optical turbidity sensors: Journal of Soils and Sediments, v. 14, no. 7, p. 1235–1241, accessed June 21, 2024, at https://doi.org/10.1007/s11368-013-0813-0.
Minear, J.T., and Kondolf, G.M., 2009, Estimating reservoir sedimentation rates at large spatial and temporal scales—A case study of California: Water Resources Research, v. 45, no. 12, article W12502, 8 p. [Also available at https://doi.org/10.1029/2007WR006703.]
National Reservoir Sedimentation and Sustainability Team, 2019, Reservoir sediment management—Building a legacy of sustainable water storage reservoirs: National Reservoir Sedimentation and Sustainability Team, accessed June 21, 2024, at https://www.sedhyd.org/reservoir-sedimentation/National%20Res%20Sed%20White%20Paper%202019-06-21.pdf.
National Water Quality Monitoring Council [NWQMC], 2024, Water quality portal: National Water Quality Monitoring Council digital data, accessed March 21, 2024, at https://www.waterqualitydata.us.
Newcombe, C.P., and Jensen, J.O., 1996, Channel suspended sediment and fisheries—A synthesis for quantitative assessment of risk and impact: North American Journal of Fisheries Management, v. 16, no. 4, p. 693–727. [Also available at https://doi.org/10.1577/1548-8675(1996)016<0693:CSSAFA>2.3.CO;2.]
Observator Instruments, 2020, ANALITE NEP–5000 turbidity sensor datasheet (ver. 20200308): Observator Instruments, 5 p., accessed June 22, 2024, at https://observator.com/wp-content/uploads/2019/07/Datasheet-NEP-5000-V20200308-min.pdf.
Omernik, J.M., and Griffith, G.E., 2014, Ecoregions of the conterminous United States—Evolution of a hierarchical spatial framework: Environmental Management, v. 54, no. 6, p. 1249–1266, accessed June 21, 2024, at https://doi.org/10.1007/s00267-014-0364-1.
Pierce, W.G., 1997, Geologic map of the Cody l degree x 2 degrees Quadrangle, northwestern Wyoming: U.S. Geological Survey Miscellaneous Investigations Series Map I–2500, 1 sheet, scale 1:250,000, accessed June 21, 2024, at https://doi.org/10.3133/i2500.
Pilkerton, A., Walters, A., and Rahel, F., 2022, Sediment and fisheries—An assessment to inform sediment management practices at Wyoming dams: U.S. Geological Survey Wyoming Water Development Office (USGS–WWDC) Water Research Program, 23 p., accessed June 22, 2024, at https://www.uwyo.edu/owp/_files/final-report-project57---walters.pdf.
Porterfield, G.P., 1972, Computation of fluvial-sediment discharge: U.S. Geological Survey Techniques of Water-Resources Investigations, book 3, chap. C3, 66 p., accessed June 22, 2024, at https://doi.org/10.3133/twri03C3.
PRISM Climate Group, 2021, PRISM climate data: PRISM Climate Group digital data, accessed July 2023 at http://prism.oregonstate.edu.
R Core Team, 2021, R—A language and environment for statistical computing: Vienna, Austria, R Foundation for Statistical Computing, accessed June 15, 2021, at https://www.r-project.org/.
Rasmussen, P.P., Gray, J.R., Glysson, G.D., and Ziegler, A.C., 2009, Guidelines and procedures for computing time-series suspended-sediment concentrations and loads from in-stream turbidity-sensor and streamflow data: U.S. Geological Survey Techniques and Methods, book 3, chap. C4, 52 p., accessed June 21, 2024, at https://doi.org/10.3133/tm3C4.
Schaepe, N.J., Alexander, J.S., and Folz-Donahue, K., 2016, Effects of streamflows on stream-channel morphology in the eastern Niobrara National Scenic River, Nebraska, 1988–2010: U.S. Geological Survey Scientific Investigations Report 2016–5004, 30 p., accessed June 21, 2024, at https://doi.org/10.3133/sir20165004.
Schmidt, J.C., and Wilcock, P.R., 2008, Metrics for assessing the downstream effects of dams. Water Resources Research, v. 44, no. 4, article W04404, 19 p. [Also available at https://doi.org/10.1029/2006WR005092,]
Shih, M., Yang, C.T., Horn, P.F., and Stutzman, L.C., 2009, Alternatives study of Willwood Diversion Dam siltation removal in Wyoming, USA: World Environmental and Water Resources Conference 2009, 19 p. [Also available at https://doi.org/10.1061/41036(342)305.]
Topping, D.J., and Wright, S.A., 2016, Long-term continuous acoustical suspended-sediment measurements in rivers—Theory, application, bias, and error: U.S. Geological Survey Professional Paper 1823, 98 p., accessed June 21, 2024, at https://doi.org/10.3133/pp1823.
U.S. Geological Survey, 2023a, USGS 06282500 Shoshone River at Cody, Wyoming, in USGS water data for the Nation: U.S. Geological Survey National Water Information System database, accessed August 2023 at https://doi.org/10.5066/F7P55KJN. [Site information directly accessible at https://waterdata.usgs.gov/monitoring-location/06282500/#period=P1Y&showMedian=true.]
U.S. Geological Survey, 2023b, USGS 06281000, South Fork Shoshone River above Buffalo Bill Reservoir, Wyoming, in USGS water data for the Nation: U.S. Geological Survey National Water Information System database, accessed August 2023 at https://doi.org/10.5066/F7P55KJN. [Site information directly accessible at https://waterdata.usgs.gov/monitoring-location/06281000/#parameterCode=00065&period=P7D&showMedian=false.]
U.S. Geological Survey, 2023c, USGS 06279940 North Fork Shoshone River at Wapiti, Wyoming, in USGS water data for the Nation: U.S. Geological Survey National Water Information System database, accessed August 2023 at https://doi.org/10.5066/F7P55KJN. [Site information directly accessible at https://waterdata.usgs.gov/monitoring-location/06279940/#parameterCode=00065&period=P7D&showMedian=false.]
U.S. Geological Survey, 2023d, USGS 06282000 Shoshone River below Buffalo Bill Reservoir, Wyoming, in USGS water data for the Nation: U.S. Geological Survey National Water Information System database, accessed August 2023 at https://doi.org/10.5066/F7P55KJN. [Site information directly accessible at https://waterdata.usgs.gov/monitoring-location/06282000/#parameterCode=00060&period=P7D&showMedian=true.]
U.S. Geological Survey, 2023e, USGS 06286200 Shoshone River at Kane, Wyoming, in USGS water data for the Nation: U.S. Geological Survey National Water Information System database, accessed August 2023 at https://doi.org/10.5066/F7P55KJN. [Site information directly accessible at https://waterdata.usgs.gov/monitoring-location/06286200/#period=P1Y&showMedian=true.]
U.S. Geological Survey, 2023f, USGS 06279500 Bighorn River at Kane, Wyoming, in USGS water data for the Nation: U.S. Geological Survey National Water Information System database, accessed August 2023 at https://doi.org/10.5066/F7P55KJN. [Site information directly accessible at https://waterdata.usgs.gov/monitoring-location/06279500/#parameterCode=00065&period=P7D&showMedian=false.]
U.S. Geological Survey, 2023g, USGS 06283995 Shoshone River above Willwood Dam, near Ralston, Wyoming, in USGS water data for the Nation: U.S. Geological Survey National Water Information System database, accessed August 2023 at https://doi.org/10.5066/F7P55KJN. [Site information directly accessible at https://waterdata.usgs.gov/nwis/monitoring-location/06283995/.]
U.S. Geological Survey, 2023h, USGS 06284010 Shoshone River below Willwood Dam, near Ralston, Wyoming, in USGS water data for the Nation: U.S. Geological Survey National Water Information System database, accessed August 2023 at https://doi.org/10.5066/F7P55KJN. [Site information directly accessible at https://waterdata.usgs.gov/monitoring-location/06284010/.]
U.S. Geological Survey, 2023i, EarthExplorer—Aerial photographs from the National Agriculture Imagery Program: U.S. Geological Survey data portal, accessed June 2023 at https://earthexplorer.usgs.gov.
U.S. Geological Survey, 2024a, StreamStats: U.S. Geological Survey website, accessed March 27, 2024, at https://streamstats.usgs.gov/ss/.
U.S. Geological Survey, 2024b, USGS water data for the Nation: U.S. Geological Survey National Water Information System database, accessed June 28, 2024, at https://doi.org/10.5066/F7P55KJN.
Van Steeter, M.M., and Pitlick, J., 1998, Geomorphology and endangered fish habitats of the upper Colorado River—1. Historic changes in streamflow, sediment load, and channel morphology: Water Resources Research, v. 34, no. 2, p. 287–302, accessed June 17, 2024, at https://doi.org/10.1029/97WR02766.
Wagner, R.J., Boulger, R.W., Jr., Oblinger, C.J., and Smith, B.A., 2006, Guidelines and standard procedures for continuous water-quality monitors—Station operation, record computation, and data reporting: U.S. Geological Survey Techniques and Methods, book 1, chap. D3, 51 p. + 8 attachments, accessed April 10, 2006, at https://doi.org/10.3133/tm1D3.
Williams, G.P., and Wolman, M.G., 1984, Downstream effects of dams on alluvial rivers: U.S. Geological Survey Professional Paper 1286, 83 p., accessed June 21, 2024, at https://doi.org/10.3133/pp1286.
Willwood Work Group 2, 2019, Operating recommendations for Willwood Dam: Joint report compiled by members of Willwood Work Group 2, including Wyoming Game and Fish Department, Wyoming Department of Environmental Quality, Wyoming State Engineers Office, Willwood Irrigation District, Bureau of Reclamation, and Wyoming Water Development Office, 22 p. [Also available at https://drive.google.com/file/d/1aCp9LPEqcD-F1asTiVKz8DVfr-6zkCnz/view.]
Willwood Work Group 3, 2019, Working together to protect the Shoshone River: accessed May 2024 at https://arcg.is/0PmPvS.
Wyoming Department of Environmental Quality [WYDEQ], 2017, Willwood Dam advisory committee and working groups terms of reference: Wyoming Department of Environmental Quality, 4 p., accessed June 21, 2024, at https://drive.google.com/file/d/15Ai4CttNchQfFp6D4g-Ya03AzPAtZfeQ/view?pli=1.
Appendix 1. Suspended-Sediment Surrogate Continuous Monitoring Records
Fallow Season 2019
The period of record for the 2019 fallow season consisted of 30 days, March 15 to April 13, 2019, for a total of 2,871 possible measurements (recorded every 15 minutes). Of the 2,871 possible measurements, the upstream streamgage had 2,867 (about 100 percent) and 2,817 (98 percent) of the turbidity and acoustic backscatter (ABS) measurements accepted, respectively, and the downstream streamgage had 2,656 (93 percent) and 0 (0 percent) of the turbidity and ABS measurements accepted, respectively (refer to table 6 in “Record from Continuous Monitoring” section of the main report). This resulted in an overlapping turbidity and ABS records of 2,652 (92 percent) and 0 (0 percent) measurements, respectively. The accepted combined upstream and downstream records were 1,043 (36 percent) and 900 measurements (31 percent), respectively, with an overlapping combined record of 898 measurements (31 percent). Due to repairs, the ABS sensor for the downstream streamgage was not installed until April 19, 2019, so a rules-based load could not be calculated (fig. 9C in the main report).
Irrigation Season 2019
The period of record for the 2019 irrigation season consisted of 185 days, April 14 to October 15, 2019, for a total of 17,760 possible measurements. Of the 17,760 possible measurements, the upstream streamgage had 16,914 (95 percent) and 17,721 (100 percent) of the turbidity and ABS measurements accepted, respectively, and the downstream streamgage had 15,963 (90 percent) and 13,568 (76 percent) of the turbidity and ABS measurements accepted, respectively. This resulted in an overlapping turbidity and ABS records of 15,205 (86 percent) and 13,546 (76 percent) measurements, respectively. The accepted combined upstream and downstream records were 15,279 (86 percent) and 15,963 measurements (90 percent), respectively, with an overlapping combined record of 14,953 measurements (84 percent). The downstream turbidity sensor experienced fouling, resulting in multiple erroneous spikes and data from August 2–12 and October 11–14 being deleted (fig. 9C in the main report). Beginning on May 19, the downstream ABS sensor had to be sent to the manufacturer for repairs and was reinstalled on June 26 (fig. 9C in the main report).
Fallow Season 2020
The period of record for the 2020 fallow season consisted of 180 days, October 16, 2019, to April 12, 2020, for a total of 17,280 possible measurements. Of the 17,280 possible measurements, the upstream streamgage had 17,219 (100 percent) and 8,484 (49 percent) of the turbidity and ABS measurements accepted, respectively, and the downstream streamgage had 16,931 (98 percent) and 7,073 (41 percent) of the turbidity and ABS measurements accepted, respectively. This resulted in an overlapping turbidity and ABS records of 16,881 (98 percent) and 6,997 (40 percent) measurements, respectively. The accepted combined upstream and downstream records were 7,024 (41 percent) and 7,073 measurements (41 percent), respectively, with an overlapping combined record of 6,430 measurements (37 percent). The ABS sensors were removed from the stream on December 12, 2019, for the winter season and for calibrations at the manufacturer until March 12, 2020, for the upstream streamgage and March 19, 2020, for the downstream streamgage (fig. 9B–C in the main report).
Irrigation Season 2020
The period of record for the 2020 irrigation season consisted of 176 days, April 13 to October 5, 2020, for a total of 16,896 possible measurements. Of the 16,896 possible measurements, the upstream streamgage had 16,035 (95 percent) and 16,861 (about 100 percent) of the turbidity and ABS measurements accepted, respectively, and the downstream streamgage had 14,693 (87 percent) and 8,554 (51 percent) of the turbidity and ABS measurements accepted, respectively. This resulted in an overlapping turbidity and ABS records of 14,092 (83 percent) and 8,554 (51 percent) measurements, respectively. The accepted combined upstream and downstream records were 14,087 (83 percent) and 14,694 measurements (87 percent), respectively, with an overlapping combined record of 13,517 measurements (80 percent). The downstream ABS sensor experienced several erroneous spikes from substantial fouling during July 1–6, resulting in deletions to part of the record (fig. 9C in the main report). Beginning on July 21, ABS values decreased to less than 2.0 mg/L, with most of the values equal to 0.0 mg/L for the remainder of the season (fig. 9C in the main report). The downstream turbidity sensor experienced fouling on several occasions, including several erroneous spikes and fouling that lasted multiple hours throughout the season and for longer periods during May 1–2, May 6–9, June 3–6, and August 15–17 (fig. 9C in the main report).
Fallow Season 2021
The period of record for the 2021 fallow season consisted of 195 days, October 6, 2020, to April 18, 2021, for a total of 18,720 possible measurements. Of the 18,720 possible measurements, the upstream streamgage had 16,735 (89 percent) and 16,945 (91 percent) of the turbidity and ABS measurements accepted, respectively, and the downstream streamgage had 16,997 (91 percent) and 16,630 (89 percent) of the turbidity and ABS measurements accepted, respectively. This resulted in an overlapping turbidity and ABS records of 15,061 (80 percent) and 15,137 (81 percent) measurements, respectively. The accepted combined upstream and downstream records were 15,042 (80 percent) and 16,692 measurements (89 percent), respectively, with an overlapping combined record of 14,900 measurements (80 percent). The upstream turbidity sensor experienced multiple erroneous spikes due to fouling between November 18 and December 3, 2020, that were removed from the record (fig. 9B in the main report). The upstream ABS sensor was affected by ice between February 9 and 13, 2021, and values of 0.0 mg/L between February 24 and March 7, 2021 (fig. 9B in the main report). The downstream ABS sensor continued to record values equal to 0.0 mg/L that began during irrigation season 2020 (refer to “Irrigation Season 2020” section in the main report) and continued until October 19, 2020, which was near the beginning of fallow season 2021 (fig. 9C in the main report). The downstream turbidity sensor experienced fouling, resulting in multiple erroneous spikes between December 27 and January 7, and March 21 and 22 (fig. 9C in the main report) being deleted from the record. The downstream ABS sensor was affected by ice between February 9 and 16, 2021, so much of this part of the record was deleted as well as multiple erroneous spikes throughout the season (fig. 9C in the main report).
Irrigation Season 2021
The period of record for the 2021 irrigation season consisted of 171 days, April 19 to October 6, 2021, for a total of 16,416 possible measurements. Of the possible 16,416 measurements, the upstream streamgage had 14,150 (86 percent) and 16,262 (99 percent) of the turbidity and ABS measurements accepted, respectively, and the downstream streamgage had 12,561 (77 percent) and 4,185 (25 percent) of the turbidity and ABS measurements accepted, respectively. This resulted in an overlapping turbidity and ABS records of 10,828 (66 percent) and 4,185 (25 percent) measurements, respectively. The accepted combined upstream and downstream records were 10,827 (66 percent) and 12,561 measurements (77 percent), respectively, with an overlapping combined record of 10,360 measurements (63 percent). The upstream turbidity sensor experienced multiple erroneous spikes due to fouling that were deleted from the record, and the sensor also experienced substantial fouling between May 6 and 12, resulting in all the record for this period being deleted; longer periods of fouling during April 30–May 5, May 30–June 2, June 7–9, July 15–17, August 2–3, September 4–10, September 15–20, and October 2–6 resulted in additional record deletions (fig. 9C in the main report). ABS values at the downstream streamgage oscillated between erroneous spikes from fouling and values less than 1.0 mg/L, many of which were equal to 0.0 mg/L, resulting in most of the irrigation season 2021 record for this sensor being deleted (fig. 9C in the main report).
Fallow Season 2022
The period of record for the 2022 fallow season consisted of 25 days, October 7 to October 31, 2021, for a total of 2,409 possible measurements. Of the possible 2,409 measurements, the upstream streamgage had 2,340 (97 percent) and 1,586 (66 percent) of the turbidity and ABS measurements accepted, respectively, and the downstream streamgage had 2,099 (87 percent) and 620 (26 percent) of the turbidity and ABS measurements accepted, respectively. This resulted in an overlapping turbidity and ABS record of 2,039 (85 percent) and 188 (8 percent) measurements, respectively. The accepted combined upstream and downstream records of 1,087 (45 percent) and 1,145 measurements (48 percent), respectively, with an overlapping combined record of 925 measurements (38 percent). The ABS sensor for the upstream streamgage experienced multiple erroneous spikes due to fouling, and then starting on October 23 values decreased to and remained at 0.0 mg/L until the sensor was removed on November 1 at the end of data collection (fig. 9B in the main report). The turbidity sensor for the downstream streamgage experienced multiple erroneous spikes from fouling that were deleted from the record (fig. 9C in the main report). ABS values at the downstream streamgage continued to oscillate between erroneous spikes from fouling and values less than 1.0 mg/L, many of which were equal to 0.0 mg/L for most of the season until the ABS sensor was removed on November 1, resulting in most of the record being deleted (fig. 9C in the main report).
Appendix 2. Site Monitor Representation of Channel Suspended-Sediment Conditions

Scatterplots showing comparison of turbidity measurements made at the location of the continuous instream sensor relative to measurements taken across the entire channel. A, Shoshone River above Willwood Dam, near Ralston, Wyoming (upstream streamgage; 06283995, U.S. Geological Survey, 2023a). B, Shoshone River below Willwood Dam, near Ralston, Wyo. (downstream streamgage; 06284010, U.S. Geological Survey, 2023b).
References Cited
U.S. Geological Survey, 2023a, USGS 06283995 Shoshone River above Willwood Dam, near Ralston, Wyoming, in USGS water data for the Nation: U.S. Geological Survey National Water Information System database, accessed August 2023 at https://doi.org/10.5066/F7P55KJN. [Site information directly accessible at https://waterdata.usgs.gov/nwis/monitoring-location/06283995/.]
U.S. Geological Survey, 2023b, USGS 06284010 Shoshone River below Willwood Dam, near Ralston, Wyoming, in USGS water data for the Nation: U.S. Geological Survey National Water Information System database, accessed August 2023 at https://doi.org/10.5066/F7P55KJN. [Site information directly accessible at https://waterdata.usgs.gov/monitoring-location/06284010/.]
Appendix 3. Comparison of Pump and Depth-Integrated Suspended-Sediment Samples
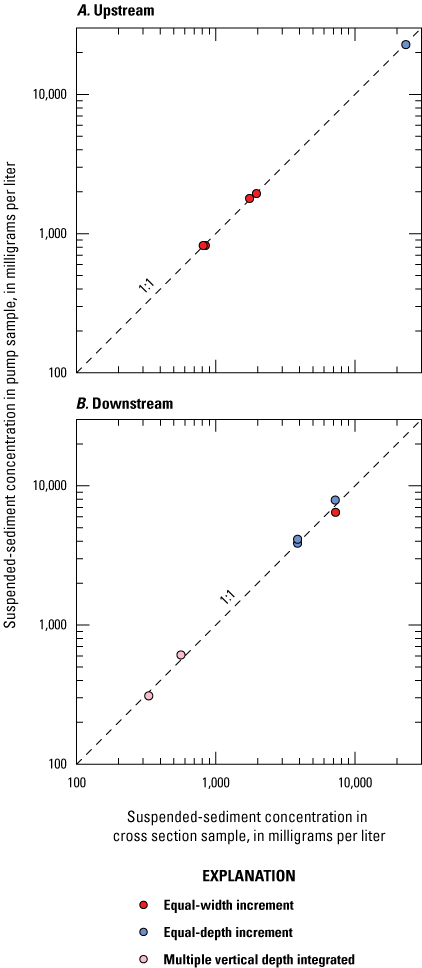
Scatterplots showing comparison of suspended-sediment concentrations from samples taken using a width- and depth-integrated method and pump samples taken at a point near the bank. A, Shoshone River above Willwood Dam, near Ralston, Wyoming (upstream streamgage; 06283995, U.S. Geological Survey, 2023a). B, Shoshone River below Willwood Dam, near Ralston, Wyo. (downstream streamgage; 06284010, U.S. Geological Survey, 2023b).

Scatterplots showing comparison of predicted versus observed suspended-sediment concentrations in the models. A, Turbidity for Shoshone River above Willwood Dam, near Ralston, Wyoming (upstream streamgage; 06283995, U.S. Geological Survey, 2023a). B, Acoustic backscatter for Shoshone River above Willwood Dam, near Ralston, Wyo. (upstream streamgage; 06283995, U.S. Geological Survey, 2023a).

Scatterplots showing comparison of predicted versus observed suspended-sediment concentrations in the models. A, Turbidity for the Shoshone River below Willwood Dam, near Ralston, Wyoming (downstream streamgage; 06284010, U.S. Geological Survey, 2023b). B, Acoustic backscatter for the Shoshone River below Willwood Dam, near Ralston, Wyo. (downstream streamgage; 06284010, U.S. Geological Survey, 2023b).
References Cited
Edwards, T.K., and Glysson, G.D., 1999, Field methods for measurement of fluvial sediment: U.S. Geological Survey Techniques of Water-Resources Investigations, book 3, chap. C2, 89 p., accessed June 21, 2024, at https://pubs.usgs.gov/twri/twri3-c2/.
U.S. Geological Survey, 2023a, USGS 06283995 Shoshone River above Willwood Dam, near Ralston, Wyoming, in USGS water data for the Nation: U.S. Geological Survey National Water Information System database, accessed August 2023 at https://doi.org/10.5066/F7P55KJN. [Site information directly accessible at https://waterdata.usgs.gov/nwis/monitoring-location/06283995/.]
U.S. Geological Survey, 2023b, USGS 06284010 Shoshone River below Willwood Dam, near Ralston, Wyoming, in USGS water data for the Nation: U.S. Geological Survey National Water Information System database, accessed August 2023 at https://doi.org/10.5066/F7P55KJN. [Site information directly accessible at https://waterdata.usgs.gov/monitoring-location/06284010/.]
Conversion Factors
U.S. customary units to International System of Units
Temperature in degrees Fahrenheit (°F) may be converted to degrees Celsius (°C) as follows:
°C = (°F – 32) / 1.8.
Datum
Vertical coordinate information is referenced to the North American Vertical Datum of 1988 (NAVD 88).
Elevation, as used in this report, refers to distance above the vertical datum.
Supplemental Information
Concentrations of suspended sediment in water are given in milligrams per liter (mg/L).
A water year is the 12-month period from October 1 through September 30 and is designated by the calendar year for which it ends (for example, water year 2019 is the period beginning October 1, 2018, and ending September 30, 2019).
An agricultural year is defined as the 12-month period from October 25 through October 24 of the following year and is designated by the calendar year for which it ends.
Irrigation season is defined as the period during which the Willwood Canal is in operation and is generally from about April 15 to about October 24.
Fallow season is the nonirrigation period and is defined as the period of time during which the Willwood Canal is generally not in operation, which is commonly from about October 25 to about April 14.
Abbreviations
<
less than
>
greater than
ABS
acoustic backscatter
ECDF
empirical cumulative distribution function
EDI
equal-discharge increment
EWI
equal-width increment
FNU
formazin nephelometric unit
GIS
geographic information system
NAVD 88
North American Vertical Datum of 1988
NTU
nephelometric turbidity unit
NWIS
National Water Information System
p-value
statistical probability level
PRISM
Parameter-elevation Regressions on Independent Slopes Model
Reclamation
Bureau of Reclamation
RMSD
root-mean-square difference
SSC
suspended-sediment concentration
USGS
U.S. Geological Survey
WID
Willwood Irrigation District
WRK2
Work Group 2
WRK3
Work Group 3
WYDEQ
Wyoming Department of Environmental Quality
For more information about this publication, contact:
Director, USGS Wyoming-Montana Water Science Center
3162 Bozeman Avenue
Helena, MT 59601
406–457–5900
For additional information, visit: https://www.usgs.gov/centers/wy-mt-water/
Publishing support provided by the
Rolla, Baltimore, and Lafayette Publishing Service Centers
Disclaimers
Any use of trade, firm, or product names is for descriptive purposes only and does not imply endorsement by the U.S. Government.
Although this information product, for the most part, is in the public domain, it also may contain copyrighted materials as noted in the text. Permission to reproduce copyrighted items must be secured from the copyright owner.
Suggested Citation
Alexander, J.S., Brown, H., Eddy-Miller, C.A., Burckhardt, J., Burckhardt, L., Ellison, C., McIntyre, C., Moger, T., Patterson, L., Tavelli, C., Waterstreet, D., and Williams, M., 2025, Fluvial sediment dynamics in the Shoshone River and tributaries around Willwood Dam, Park County, Wyoming: U.S. Geological Survey Scientific Investigations Report 2025–5077, 70 p., https://doi.org/10.3133/sir20255077.
ISSN: 2328-0328 (online)
Study Area
| Publication type | Report |
|---|---|
| Publication Subtype | USGS Numbered Series |
| Title | Fluvial sediment dynamics in the Shoshone River and tributaries around Willwood Dam, Park County, Wyoming |
| Series title | Scientific Investigations Report |
| Series number | 2025-5077 |
| DOI | 10.3133/sir20255077 |
| Publication Date | August 29, 2025 |
| Year Published | 2025 |
| Language | English |
| Publisher | U.S. Geological Survey |
| Publisher location | Reston, VA |
| Contributing office(s) | Wyoming-Montana Water Science Center |
| Description | Report: x, 70 p.; Data Release; Dataset |
| Country | United States |
| State | Wyoming |
| County | Park County |
| Other Geospatial | Shoshone River and tributaries around Willwood Dam |
| Online Only (Y/N) | Y |
| Additional Online Files (Y/N) | N |