

Channel and Floodplain Cross-Section and Bed-Elevation Analyses of the Green River in Echo, Island, and Rainbow Parks, Dinosaur National Monument, Colorado and Utah
Links
- Document: Report (4.8 MB pdf) , HTML , XML
- Related Work: Scientific Investigations Report 2025-5075 - Controls on sediment transport and storage in the Little Snake, Yampa, and Green Rivers in the vicinities of Dinosaur National Monument and Ouray National Wildlife Refuge, Colorado and Utah, with implications for fish habitat in the middle Green River
- Data Release: USGS data release - Channel and floodplain cross-section and bed-elevation data for the Green River in Echo, Island, and Rainbow Parks, Dinosaur National Monument, Colorado and Utah
- NGMDB Index Page: National Geologic Map Database Index Page
- Download citation as: RIS | Dublin Core
Acknowledgments
This work was carried out with funding from the National Park Service Water Resources Division. We thank Mark Wondzell, Tamara Naumann, and Emily Spencer with the National Park Service for supporting this research. We also thank Rebecca Diehl (University of Vermont) and Jason Alexander (National Park Service) for their reviews of this report.
Abstract
This report by the U.S. Geological Survey focuses on describing geomorphic changes in the alluvial segments of the Green River within Echo, Island, and Rainbow Parks of Dinosaur National Monument, between the 1990s and 2019. Substantial channel change occurred within these meandering alluvial segments following the construction and closure of Flaming Gorge Dam in 1962. Geomorphic analyses in the early 1990s documented this change, but variations in dam operations, climate, and the natural sand supply from the Yampa River have since occurred. It was unclear whether channel change within those meandering alluvial segments had continued since the early 1990s; hence, our study provides an update to previous work. This study used three primary methods to quantify the amount and style of channel change that occurred within those alluvial segments of the Green River: (1) digital aerial-photograph analyses, (2) surveys of alluvial topography in the 1990s and 2019 at fixed cross-section locations, and (3) surveys of channel bathymetry in 1998 and 2019. Our analyses show that channel narrowing has continued, with declines in channel width of 4 percent in Echo Park, 16 percent in Island Park, and 15 percent in Rainbow Park from 1993 through 2019. In 11 of the 15 cross sections examined, vertical accretion of sediment on the floodplain and lateral accretion of sediment on the channel margins led to net sediment deposition and a loss of cross-sectional area. Mean changes in bed elevations showed slight erosion; however, bed elevations were considered stable within the bounds of measurement uncertainty and annual variability within the study area.
These results show that channel change has continued to occur in these alluvial segments of the Green River from 1993 through 2019, with the dominant changes including sediment deposition and channel narrowing. Although changes in the operations of Flaming Gorge Dam have occurred, these changes have had little effect on flood peak or duration in the segment of the Green River downstream from its confluence with the Yampa River. Instead, ongoing channel change is likely driven by the amount of sediment supplied from the Yampa River, the duration and magnitude of the combined annual spring snowmelt flood from both the Green River upstream from the Yampa River confluence and the Yampa River, and the capacity of this flood to convey the supplied sediment through these wider alluvial reaches.
Introduction
This report focuses on describing geomorphic changes of the channel and floodplain in the alluvial segments of the Green River within Echo, Island, and Rainbow Parks in Dinosaur National Monument (DINO) between the 1990s and 2019. It was unclear whether channel narrowing in the alluvial segments within DINO had continued since the 1990s, thus our study provides an update to the findings of Grams and Schmidt (2002) and Gessler and Moser (2001). Channel adjustment of the Green River within and near DINO (fig. 1) has been caused by complex interactions among changes in climate, the construction and operations of Flaming Gorge Dam, upstream consumptive water uses and losses, natural changes in sediment supply, and the expansion of riparian vegetation (Graf, 1978; Andrews, 1986; Allred and Schmidt, 1999; Merritt and Cooper, 2000; Grams and Schmidt, 2002, 2005; Birken and Cooper, 2006; Alexander, 2007; Topping and others, 2018; Walker and others, 2020). The greatest amount of Green River channel change within DINO has been linked to the 1962 closure and subsequent operations of Flaming Gorge Dam, which resulted in reduced peak flows, increased baseflow, and a reduced sediment supply in the segment of the Green River upstream from the Yampa River confluence (referred to herein as the upper Green River) (Grams and Schmidt, 2002, 2005). In the Green River downstream from its confluence with the Yampa River (referred to herein as the middle Green River), the combined peak flows from Flaming Gorge Dam and the Yampa River have also declined (Topping and others, 2018), as measured at U.S. Geological Survey (USGS) Green River near Jensen, Utah, 09261000 gaging station (referred to herein as the “Jensen gaging station”) (USGS, 2016); however, flood peaks may still inundate floodplains along the middle Green River. Geomorphic changes in the middle Green River within DINO following the closure of Flaming Gorge Dam have consisted of channel narrowing, inset floodplain formation, vertical floodplain accretion, and abandonment of secondary channels (Grams and Schmidt, 2002, 2005). These changes may have resulted in the loss of important aquatic habitat for the threatened and endangered fishes that inhabit the meandering segments of the Green River within DINO (Muth and others, 2000; LaGory and others, 2019).
Thus, the existence and operation of Flaming Gorge Dam has affected the hydrology, sediment supply, and sediment-transport characteristics of the Green River. The operations of Flaming Gorge Dam substantially reduced the magnitude of the spring snowmelt flood and increased baseflows, thereby reducing seasonal flow variability in the Green River. Additionally, Flaming Gorge Reservoir acts as a complete sediment trap, and has substantially reduced the natural sediment supply from most of the upper Green River watershed. The Yampa River joins the Green River approximately 106 kilometers (km) downstream from Flaming Gorge Dam, has a largely natural hydrology and sediment supply, and supplies most of the sediment to the middle Green River (Topping and others, 2018). Thus, the Yampa River ameliorates many of the effects of Flaming Gorge Dam on the Green River downstream from the confluence of the Yampa and Green Rivers. However, changes in streamflow and sediment supply have also occurred in the Yampa River. Manners and others (2014) showed that channel width decreased by 6 percent in wide segments of the Yampa River in DINO and attributed that change to extended periods of small annual floods that occurred in the 1990s and early 2000s. Topping and others (2018) showed that changes in sediment supply from tributaries to the Yampa River have propagated downstream to affect sediment-transport dynamics in the middle Green River, thereby potentially contributing to geomorphic change within DINO.
Although many studies have documented changes in Green River hydrology and geomorphology within and near DINO between the closure of Flaming Gorge Dam in 1962 and the early 2000s (Andrews, 1986; Lyons and others, 1992; Grams and Schmidt, 1999; Merritt and Cooper, 2000; Gessler and Moser, 2001; Grams and Schmidt, 2002, 2005; Alexander, 2007; Mueller and others, 2014), most of the analyses in these studies have focused on detecting geomorphic changes in canyon-bound segments and the alluvial segment upstream of DINO in Browns Park (fig. 1B). Only Grams and Schmidt (2002) and Gessler and Moser (2001) have described geomorphic changes in the alluvial segments of the Green River within Echo, Island, and Rainbow Parks. Ongoing changes to Flaming Gorge Dam operations, climatic variability, and relatively natural changes in sediment supply have likely resulted in additional changes to the channel and floodplain in the alluvial segments of the middle Green River between the 1990s and 2019 (fig. 1).

Maps of the Dinosaur National Monument area, Colorado and Utah. A, Regional map showing the location of Flaming Gorge Reservoir and major regional rivers that make up a portion of the upper Colorado River Basin, and B, Detailed inset map of Dinosaur National Monument showing the locations of Echo, Island, and Rainbow Parks within the Monument. Jensen is the U.S. Geological Survey (USGS) Green River near Jensen, Utah, 0926100 gaging station. Greendale is the USGS Green River near Greendale, Utah, 09234500 gaging station.
Background
The closure of Flaming Gorge Dam had a substantial effect on the hydrology of the upper Green River. Annual peak discharges released from Flaming Gorge Dam are approximately 50 percent smaller than the pre-dam flood peaks (fig 2A), as measured at USGS Green River near Greendale, Utah, 09234500 gaging station (USGS, 2016), herein referred to as the “Greendale gaging station” (Grams and Schmidt, 2002; Topping and others, 2018). In addition, dam operations have substantially increased baseflow and have introduced daily fluctuations in discharge for power generation. Farther downstream in the middle Green River, the Yampa River partially enhances the reduced annual flood peaks; however, operation of Flaming Gorge Dam has caused an approximate 30 percent reduction in peak discharge in the middle Green River, as measured at the Jensen gaging station (Grams and Schmidt, 2002; Topping and others, 2018) (fig. 2B). This 30 percent reduction is solely caused by Flaming Gorge Dam operations because there has been no long-term decrease in the annual flood peaks within the Yampa River (Manners and others, 2014; Topping and others, 2018).
Beginning in the early 1990s, Flaming Gorge Dam releases were modified such that larger releases occurred in the spring (May and June) to more closely mimic the natural hydrology (U.S. Fish and Wildlife Service, 1992; Muth and others, 2000; U.S. Bureau of Reclamation, 2005, 2006; Bestgen and others, 2011; LaGory and others, 2012, 2019). Additionally, daily fluctuations were reduced, and baseflows were modified. Despite the post-1992 increases in Flaming Gorge Dam spring releases, the magnitude of annual flood peaks in the middle Green River has not changed substantially (fig. 2B) because peak Flaming Gorge Dam releases are generally offset from the annual peak of the Yampa River. Furthermore, there have been no statistically significant changes in the duration of floods above the 1.5-year recurrence interval discharge since 1992, also reflecting the offset between Flaming Gorge Dam releases and the annual peak discharge of the Yampa River. Thus, annual flood peaks in the middle Green River, which likely drive much of the channel change in the alluvial segments within DINO, remain similar to the annual flood peaks that occurred between the closure of Flaming Gorge Dam and the early 1990s, when much of the geomorphic data in the middle Green River were last collected and analyzed by Grams and Schmidt (2002).
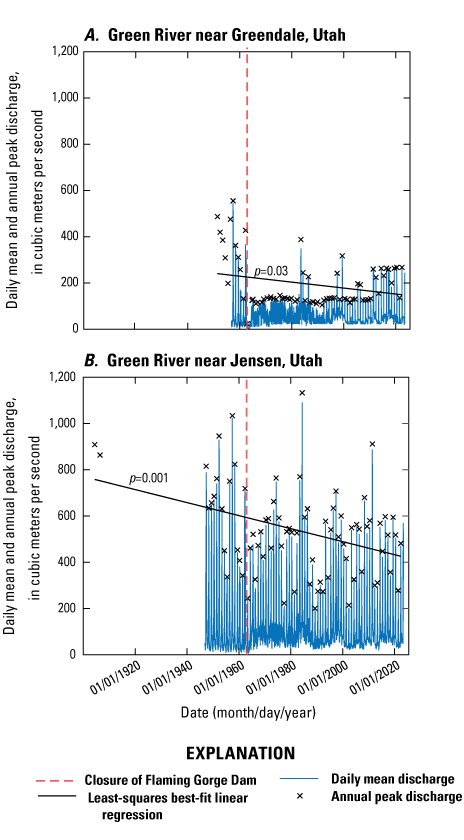
Graphs of daily mean discharge and annual peak discharge at the U.S. Geological Survey (USGS) 09234500 gaging station, Green River near Greendale, Utah (A), and the 09261000 gaging station, USGS Green River near Jensen, Utah (B) (USGS, 2016). Regressions are fit to the annual peak discharge time series. F-tests were conducted on the linear regressions to determine if the slopes of the linear regressions were statistically significant at the 95-percent confidence level (that is, p [level of significance] < 0.05). The slopes of both regressions are negative and statistically significant, indicating that annual peak discharges have declined. Note that the post-1962 discharges at the gaging station near Greendale, Utah, are the discharges released from Flaming Gorge Dam and that the annual peak discharges released from Flaming Gorge Dam increased in the 1990s to more closely mimic the natural annual flood peak (U.S. Fish and Wildlife Service, 1992).
Grams and Schmidt (2002) showed that the alluvial segments of the Green River within DINO narrowed substantially between the closure of Flaming Gorge Dam and 1993. In Echo Park, immediately downstream from the confluence of the Yampa and Green Rivers, the Green River narrowed by 10 percent. Farther downstream in the combined Island and Rainbow Parks segment, the river narrowed by 25 percent. This percentage of narrowing in the alluvial segments was greater than in the canyon-bound segments downstream from the confluence of the Yampa and Green Rivers; the channel in Whirlpool and Split Mountain Canyons narrowed by 11 and 12 percent, respectively (figure 1B). In the alluvial segments, channel narrowing occurred primarily by the abandonment of secondary channels around islands and the deposition of fine sediment along the channel margins, which formed a post-dam floodplain inset within pre-dam flood deposits (Grams and Schmidt, 2002). Because of the reduction in flood peak magnitude by Flaming Gorge Dam, the lowest pre-dam deposit, referred to as “the intermediate bench” (Grams and Schmidt, 2002) is rarely inundated. Gessler and Moser (2001) also showed that some secondary channels were continuing to fill with sediment and could be abandoned if sediment deposition continued. It was unclear whether channel narrowing in the alluvial segments within DINO has continued since 1993, and this study seeks to address this uncertainty.
Despite the long-term decrease in annual flood peaks caused by Flaming Gorge Dam, erosion and (or) deposition of sediment in the alluvial segments of the middle Green River in DINO is strongly dependent upon the streamflow and sediment dynamics of the Yampa River for two reasons: (1) the Yampa River supplies most of the sediment, and (2) annual peak floods from the Yampa River can substantially exceed the peak releases from Flaming Gorge Dam. Analyses of sediment budgets for the sediment budget reach that brackets Echo, Island, and Rainbow Parks (refer to USGS Grand Canyon Monitoring and Research Center at https://www.gcmrc.gov/discharge_qw_sediment/reaches/DINO [Sibley and others, 2015]) show that when the annual flood of the Yampa River is small (that is, annual peak discharge is less than 425 cubic meters per second [m3/s], and median March–July discharge is less than 99 m3/s), sand likely accumulates somewhere between the downstream end of Deerlodge Park on the Yampa River, and Green River near Jensen, Utah (fig. 1B) (Topping and others, 2025). However, when either the annual peak discharge or median March–July streamflow on the Yampa River exceed those thresholds, sand is likely eroded from this river segment.
Since 1996, when channel cross sections were last measured in Echo, Island, and Rainbow Parks, the peak discharge of the Yampa River annual flood was small (less than 425 m3/s) in 16 out of 26 years (figure 2) and the March–July median discharge was small (less than 99 m3/s) in 17 years. Together, there were 16 years when discharge conditions were less than both thresholds. Albeit the magnitude of channel change in any given year is unknown, the fact that the annual flood peak and the March–July median discharge failed to exceed the above thresholds in approximately 60 percent of the years since 1996 suggests that it is likely that sand has accumulated in Echo, Island, and Rainbow Parks since the mid- to late 1990s. Although changes in sediment storage can occur in both alluvial and canyon-bound segments, we hypothesize that most of the change in sediment storage within DINO occurs in the alluvial segments of Echo, Island, and Rainbow Parks, because those segments are generally wider than the canyons, and there is more space to accommodate increases in sediment storage compared to the canyon-bound segments.
Purpose and Scope
The purposes of this study are threefold: (1) determine whether changes in sediment storage have occurred in the middle Green River in Echo, Island, and Rainbow Parks between the 1990s and 2019, (2) determine the style of any resultant channel adjustment arising from net sediment deposition or erosion in these river segments, and (3) evaluate the Topping and others (2025) hypothesis that certain Yampa River hydrologic thresholds can prevent sand from accumulating between Deerlodge Park, Colorado, and Jensen, Utah (fig. 1). This report presents the results from aerial-photograph analyses and a June 2019 resurvey of the channel cross sections and bathymetry in Echo, Island, and Rainbow Parks that were originally surveyed in 1993 and 1994. Cross-section data collected by Grams (1997) in the 1990s and all cross section and bathymetric data collected during our 2019 resurvey are available from the USGS data release that accompanies this report (Dean and others, 2024).
Study Area
Our study area consists of the meandering segments within the alluvial valleys of the middle Green River within DINO, including Echo, Island, and Rainbow Parks (fig. 1B). Echo Park is the narrowest of these valleys, beginning just above the confluence of the Yampa and Green Rivers near river km (rkm) 106.0. River kilometers are measured downstream from Flaming Gorge Dam, Utah. The Green River within Echo Park is approximately 3.5 km long, extending downstream to approximately rkm 109.5. At low flow, the Green River in Echo Park is multi-threaded among migrating sand and gravel bars; at high flow, the channel is single threaded and is bounded by vegetated floodplains (fig. 3).
Downstream from Echo Park, the Green River flows through Whirlpool Canyon for approximately 14 km before entering Island Park. The Green River in Island Park is approximately 7 km long extending from rkm 123.8 to 130.8. The channel in Island Park is anabranching, woven among stable floodplain islands, although some single-threaded reaches exist (fig. 4). In the upstream half of Island Park, the bed of the Green River is composed of plane-bedded gravel alternating with migrating dune fields composed of sand; note that the term gravel includes all size classes of sediment coarser than 2 millimeters (mm) (Krumbein, 1934). The channel bed in the downstream half of Island Park is composed primarily of migrating dune fields of sand, although small, localized patches of gravel are also present.
The Green River in Rainbow Park, which is immediately downstream from Island Park, is approximately 4 km long and extends from rkm 130.8 to 134.8 (fig. 4). The Green River within Rainbow Park is also anabranching, and the channel bed primarily consists of sand dunes and lesser amounts of gravel, with active bars that are emergent at low flow. In this study, we collected data in the upstream-most 2.5 km of Rainbow Park, upstream from the Rainbow Park boat ramp.

Map of the Echo Park area of the Green River, Dinosaur National Monument, Colorado. Cross sections are numbered from upstream to downstream. The channel bathymetry is depicted as a digital elevation model created from multibeam-sonar data (Dean and others, 2024). XS, cross section.

Map of the Island and Rainbow Parks area of the Green River, Dinosaur National Monument, Utah. In Rainbow Park, we collected data in the upstream-most 2.5 km, upstream from the Rainbow Park boat ramp (Dean and others, 2024). Cross sections are numbered from upstream to downstream. The channel bathymetry is depicted as a digital elevation model created from multibeam-sonar data (Dean and others, 2024). XS, cross section.
Methods
We used three primary methods to quantify channel change: (1) analyses of digital aerial photographs to measure changes in channel width of the Green River over the entire lengths of Echo, Island, and Rainbow Parks, (2) analyses of alluvial topography at fixed cross sections, obtained from surveys collected in the 1990s and in 2019, to measure changes in channel and floodplain topography at those locations, and (3) analyses of riverbed topography over approximately half of Island Park, obtained from bathymetric surveys in 1998 and 2019, to measure changes in bed elevation. These are further described in the following six sections.
Aerial-Photograph Analyses
We analyzed aerial photographs of Echo, Island, and Rainbow Parks taken in 1993 through 2019. For Echo Park, photographs used were collected in 1993, 2006, 2013, 2015, and 2019. For Island and Rainbow Parks, photographs used were collected in 1993, 2006, 2014, and 2018. Photographs also exist for 2009, 2011, 2016, and 2017, but were not used either because high flows at the time of the photographs limited the ability to accurately map in-channel features or because complete photograph coverage of the river in the study area did not exist. The 1993 photographs were acquired from the USGS National Aerial Photograph Program (NAPP; USGS, 1993), and all subsequent photographs were acquired from the U.S. Department of Agriculture (USDA) National Agriculture Imagery Program (NAIP; USDA, 2006, 2013, 2014, 2015, 2018, 2019). In all analyzed photographs, we mapped the boundaries of the active channel, which consisted of the wet parts of the channel, and the active sand deposits in the channel and on the banks that were generally devoid of vegetation. Although small amounts of sparse vegetation were present on some active sand deposits, these areas were included within the boundaries of the active channel. Active-channel width was determined by dividing the area of the active channel by the length of the channel centerline. For each photograph set in a given year, the percent change in the active-channel width was calculated relative to the 1993 width. We analyzed changes in width for each segment and for individual 1-km-long reaches roughly centered on the rkm.
We calculated uncertainty in the active channel width for each segment using a method adapted from Mount and others (2003), Swanson and others (2011), and Dean and Topping (2019, 2024), where active-channel width error (Eω) is defined as follows:
where is the potential error in active-channel-width delineation, R is the pixel size of a given set of aerial photographs, and Θ is the average image distortion error for a given set of aerial photographs.The term is the error associated with delineation of the bank lines. A large source of uncertainty in active-channel width calculations involved the delineation of sparsely vegetated channel-margin deposits, because it was unclear whether these deposits resided within the active channel, or whether they were part of the floodplain. In this study, we included all the sparsely vegetated deposits within the extent of the active channel, because it appeared that the bare sand on these deposits was regularly reworked by floods. However, that decision was uncertain. Thus, to calculate , we divided the area of active channel deposits with sparse vegetation by the length of the segment to get active channel width uncertainty for that segment. Since all active-channel delineations included the sparsely vegetated deposits within the active channel, was only applied to the negative error bars, because the active channel would become smaller if those deposits were instead mapped outside of the active channel.
To calculate , we identified permanent, identifiable points (for example, the corners of large boulders) in the alluvial valleys using a 2015 light detection and ranging (LiDAR) surface collected by the State of Utah and others (2019). We identified seven points in or near Echo Park and six points in Island and Rainbow Parks. We then identified the same points in each year’s set of aerial photographs, and calculated the average offset for each set of images for each river segment.
Channel Cross-Section Installation and Initial Surveys
Between November 1993 and September–October 1994, Utah State University (Grams, 1997) established a network of 66 cross sections extending from approximately 1.5 km downstream from Flaming Gorge Dam to Split Mountain Canyon, within DINO. The endpoints of these cross sections were monumented with either rebar or fence posts. In some cases, existing fence posts were used as monuments. Topographic data were collected in a local coordinate system and were not georeferenced. The topography of the floodplain at these cross sections was measured using a total station, and the topography of the wetted portion of the channel was measured using a depth sounder. Resurveys were conducted in June 1995, August 1995, May 1996, and June 1996. Only a subset of the cross sections was measured during each resurvey trip (table 1). Cross sections 32–34 were established in Echo Park, 48a–53 in Island Park, and 54–56 in Rainbow Park, upstream from the boat ramp.
Table 1.
Dates of cross-section surveys of the Green River within Echo, Island, and Rainbow Parks, Dinosaur National Monument, Colorado and Utah.[Between November 1993 and September–October 1994, Grams (1997) established a network of 66 cross sections extending from approximately 1.5 kilometers downstream from Flaming Gorge Dam to Split Mountain Canyon. Resurveys were conducted in June 1995, August 1995, May 1996, and June 1996, but only a subset of the cross sections was measured during each resurvey trip. All survey data within Echo, Island, and Rainbow Parks are available from the U.S. Geological Survey data release that accompanies this report (Dean and others, 2024). Cross section 34 was established in Echo Park, 48a–53 in Island Park, and 54–56 in Rainbow Park, upstream from the boat ramp. Dates in mm/dd/yyyy format. Cross-section locations in figures 3 and 4. —, no data; x, cross section was measured]
1998 Channel Bathymetry Collected Using an Acoustic-Doppler Current Profiler
In June 1998, Gessler and Moser (2001) measured channel bathymetry using an acoustic-Doppler current profiler (ADCP) over an approximate 3.2-km-long reach in Island Park (fig. 4).
Geographic positioning of the ADCP was acquired using a real-time kinematic (RTK) Global Positioning System (GPS) installed over known and surveyed control points, whose coordinates were transmitted to the ADCP software using a radio link. Horizontal geographic positions were acquired using the North American Datum of 1983 (NAD 83) and were subsequently converted to the State Plane Coordinate System (Utah central zone). Ellipsoid heights were acquired using the North American Vertical Datum of 1988 (NAVD 88). Geoid elevations were calculated post-hoc for analyses in this report by adding −15.93 meters (m) to the ellipsoid heights using the Geoid 18 model. The horizontal and vertical accuracy of the surveyed control points was reported to be ±0.09 m (Gessler and Moser, 2001). Gessler and Moser (2001) reported that their 1998 ADCP bathymetric measurements had a positive bias of 0.3048 m, thus we subtracted 0.3048 m from their ADCP elevations.
2019 Cross-Section Resurveys using Multibeam Sonar and Real-Time Kinematic Global Navigation Satellite System
In June 2019, the USGS resurveyed the cross sections within Echo, Island, and Rainbow Parks using multibeam sonar to measure channel bathymetry and an RTK global navigation satellite system (GNSS) to measure the topography of emergent bars and floodplains (Dean and others, 2024). In Echo Park, surveys were conducted at a discharge of 566 m3/s, as measured at the Jensen gaging station (USGS, 2016), which has a recurrence interval of approximately 2.4 years. In Island and Rainbow Parks, surveys were conducted at discharges between 507 and 518 m3/s as measured at the Jensen gaging station (USGS, 2016), which both have recurrence intervals of approximately 1.7 years. Survey control points were established, and static GNSS data were collected using GNSS base stations. Static data files were uploaded to the National Geodetic Survey Online Positioning User Service (https://www.ngs.noaa.gov/OPUS/) to obtain positional accuracy within 1–2 centimeters (cm) in the horizontal dimension and 4–5 cm in the vertical dimension.
The endpoints of each cross section were georeferenced using RTK GNSS, thus tying the local coordinates of the cross-section endpoints to the Universal Transverse Mercator (UTM) coordinate system (zone 12 north). The emergent topography along each cross section was measured by surveying along the line connecting the two endpoints of the cross section using the “stake out” procedure in Trimble Access data collection software. Submerged bathymetry was measured using a Norbit iWBMSh multibeam echosounder with an integrated Applanix OceanMaster GNSS-aided inertial navigation system. Multibeam data were acquired using RTK positioning in Hypack 2017, and post-processed using PosPac MMS v8.0 to compute the smoothed best estimate of boat trajectory (SBET) for the surveys. Raw data were edited by hand and by using Hypack filters to remove bad soundings, and the SBET files were applied to the edited data. Edited soundings were filtered within Hypack to a uniform density of 1 point per 0.25 m2 in Echo and Island Parks and 1 point per 0.5 m2 in Rainbow Park, using the mean elevation for each grid cell.
In Echo Park, the entire wetted channel bed was surveyed using multibeam sonar (fig. 3). In some areas, obstruction of the sky by canyon walls limited the number of satellites useable for RTK GNSS; thus, the endpoints and floodplains of cross sections 32 and 33 (fig. 3) could not be surveyed. Although the entire channel bed was surveyed with sonar, it was impossible to determine exactly how the channel bed had changed at cross sections 32 and 33 because the endpoints of the cross sections were not initially georeferenced to a projected coordinate system, and they could not be accurately located due to poor RTK GNSS coverage. Using geographic information system (GIS) software, bathymetry data along cross section 34 were extracted from the sonar data and combined with the RTK GNSS data to obtain topography for the entire cross section.
In Island Park, swaths of the channel bed that encompassed each cross-section line were surveyed using multibeam sonar for cross sections 48a–52. A longitudinal profile of the channel bed was also surveyed using the sonar between the cross-section swaths. Starting approximately 850 m downstream from cross section 52, we mapped the entire channel bed downstream to the Rainbow Park boat ramp (fig. 4). Using GIS software, bathymetry data along each cross-section line were extracted from the sonar data and combined with the RTK GNSS data of the above-water topography to obtain the full cross-section topography.
Changes in Cross-Sectional Area, Channel Width, and Bed Elevation
Changes in cross-sectional area indicate whether sediment has deposited or eroded within each cross section. Deposition may result in channel narrowing, bed aggradation, or vertical floodplain accretion with no change in channel width. Conversely, erosion may result in channel widening, bed scour, or vertical floodplain scour with no change in channel width. Thus, to determine changes in cross-sectional area, the method used must be able to detect lateral changes in width, and vertical changes in the bed and floodplain. To account for this, we calculated cross-sectional area as the area between the top of the highest, most stable floodplain and the channel bed. The top of the floodplain was defined by the inflection point between the relatively vertical channel bank and the relatively flat floodplain top (fig. 5). Variations in accuracy between surveys can result in slight differences (<5 cm) in the elevations of the top of the floodplains. To ensure that changes in area were only a result of topographic change, and not because of survey uncertainty and (or) error in the elevations of the floodplain, we set the elevations of the top of the floodplain to be the same among all years of surveys at an individual cross section (fig. 5). Note that for cross sections 51 and 52, which exist in multi-threaded parts of the channel, the change in cross-sectional area was measured separately for each channel because the channels are separated by large, stable islands. Thus, the total cross-sectional area involved in channel change is a small proportion of the total cross-sectional area between the endpoints of these cross sections.
Changes in channel width may occur through the lateral accretion of sediment on the channel banks, lateral bank erosion, or the vertical accretion of relatively low-elevation surfaces as they are converted to floodplains. Since changes in channel width may occur by both lateral and vertical depositional and (or) erosional processes, there is often an array of geomorphic surfaces and (or) floodplains that exist at different elevations above the channel bed. Thus, changes in channel width were measured at the cross-section locations by identifying the width of the channel at the water surface elevation surveyed in 2019 (and not simply the line that was previously used to calculate changes in cross-sectional area, as that line was delineated from the highest, relatively static floodplain surface, which does not typically intersect actively changing surfaces at lower elevations). The discharges during the 2019 surveys were equivalent to an approximate 2.4-year flood in Echo Park and an approximate 1.7-year flood in Island and Rainbow Parks. This operation allowed us to directly compare the changes in channel width determined from the surveys to the changes in active-channel width inferred from aerial photographs at the location of each cross section. In general, these two measurements should be highly correlated; however, they may differ slightly because of the way they were quantified. The channel width measured from the cross-section surveys represents the wetted width of the channel at the specific surveyed discharge, whereas the active-channel width measured on the aerial photographs, was primarily based on the presence or absence of vegetation. Demonstrating that channel widths measured on aerial photographs are similar to channel widths measured on the cross-section surveys provides the ability to then relate changes in channel width on the aerial photographs to changes in sediment storage at the cross sections.
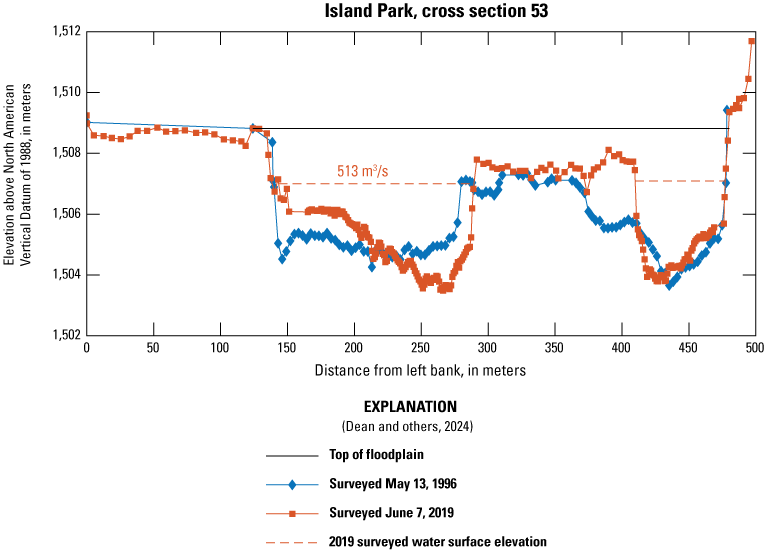
Plot of the cross-sectional area and channel width for two separate surveys of cross section 53 across the Green River in Island Park, Dinosaur National Monument, Utah. The cross-sectional area is measured as the area below the floodplain top and above the channel bed for each cross-section survey. Channel cross-section width is the width of the channel measured at the elevation of the 2019 surveyed water surface (513 m3/s) (Dean and others, 2024). For the location of cross section 53, refer to figure 4. Topographic data were collected using the North American Datum of 1983 Universal Transverse Mercator zone 12 north, coordinate system. Banks are called right or left as viewed facing downstream. m3/s, cubic meters per second.
Changes in the minimum bed elevation were also quantified at the channel cross sections between each successive survey. For a more spatially robust analysis of bed-elevation change, we analyzed changes in the channel bed elevation between the 1998 ADCP survey (Gessler and Moser, 2001) and the 2019 multibeam-sonar survey. The 1998 ADCP data were not collected at a spatial resolution sufficient to build a three-dimensional digital elevation model (DEM), thus it was not possible to simply compare changes of the overlapping parts of the 1998 and 2019 DEMs. Instead, changes in bed elevation were evaluated using the following five-step process:
-
1. A DEM of the 2019 sonar data at a grid spacing of 0.25 m was created.
-
2. The 2019 DEM elevation was extracted at the location of each 1998 ADCP data point.
-
3. The 2019 bed elevations were subtracted from the 1998 bed elevations and a histogram of the results was created.
-
4. The mean elevation change from this histogram was calculated.
-
5. Dune heights were analyzed in the 2019 sonar data to provide a range of bed-elevation uncertainty for the gridded 2019 data.
To analyze dune heights, we used the Bedform Tracking Tool (Van der Mark and Blom, 2007) to determine the mean dune height at the time of the 2019 survey. This height was used to define the error bars around the mean bed-elevation change. Thus, to be considered significant, the change in bed elevation between 1998 and 2019 would have to exceed the error bars associated with mean dune height.
Lastly, the texture of the 2019 DEM was used to describe general channel-bed characteristics. Migrating dunes appear as quasi-linear features extending across the channel. Areas of the bed consisting of sand or fine-gravel bars (that is, <128 mm) without dunes appear smooth, and areas of the bed composed of large gravel (that is, >128 mm) appear rough (size-class divisions based on Wentworth, 1922 and Pettijohn, 1975). Thus, based on image resolution, it can be difficult to determine the difference between plane-bedded sand and gravel that is less than 128 mm, but can be relatively more straightforward to determine the difference between dune fields and parts of the bed composed of gravel coarser than 128 mm because the grain size begins to approach the size of the DEM grid cell (0.25m).
Longitudinal Trends in Bed-Sediment Grain Size
During our 2019 resurvey, bed-sediment samples were collected in most of the surveyed cross sections. At most cross sections, a minimum of three bed-sediment samples were collected using a US BMH–60 sampler at the channel center and at one-quarter and three-quarters of the distance across the width of the wetted channel (measured from the left to the right bank, as viewed facing downstream). Samples were collected at cross sections 32–34, 49, 50, and 52–56 (figs. 3, 4). In cross section 32, only one sample was collected, at one-quarter the distance from the left to right bank, and no samples were retrieved from the middle or three-quarters of the distance from the left to right bank. This is likely because the bed was composed of gravel that was too coarse for the US BMH–60 to sample. In cross section 51, no samples were retrieved, also likely because of the coarse bed. At cross section 52, there were two channels, and three samples were collected in each channel according to the sampling scheme described above. At cross section 55, there was a main channel and a small secondary channel; three samples were collected in the main channel, and one sample was collected in the center of the secondary channel. Samples were sieved at ¼-ϕ (phi unit of sediment grain size [D], defined as ϕ = −log2 D) intervals (Krumbein, 1934) to determine the grain-size distributions.
The median grain size (D50) of the total sediment sample and of the sand fraction was measured, as well as a further subdivision of sand into percent of very fine sand (PVFS), to determine if there were different grain-size characteristics between Echo Park and Island and Rainbow Parks. The PVFS was analyzed because changes in bed-sand grain size most relevant for sand transport occur mainly through changes in the fine tail of the bed-sand grain-size distribution (Topping and others, 2018). Two-sided t-tests were conducted on the populations of total-sediment D50, sand D50, and PVFS to determine if the means of these distributions were significantly different from each other at the 95-percent confidence level. Prior to carrying out the t-tests, F-tests were used to determine whether to conduct the t-tests assuming equal or unequal variances.
We also analyzed the bed-sediment data to determine if there were longitudinal trends in grain size downstream through each river segment. We thus regressed the mean values of the total-sediment D50, sand D50, and PVFS among the samples collected across each cross section against the rkm downstream from Flaming Gorge Dam. F-tests were conducted to determine whether the slopes of the best-fit linear regression lines were statistically significant at the 95-percent confidence level.
Results
Aerial-Photograph Analyses
Aerial-photograph analyses indicate that channel narrowing has continued within Echo, Island, and Rainbow Parks since 1993. Between 1993 and 2018–2019, the channel has narrowed on average by 4 percent in Echo Park, 16 percent in Island Park, and 15 percent in Rainbow Park (table 2; fig. 6). Although narrowing was the general pattern in each park’s river segment, there was substantial variability in the magnitude and direction of channel width changes over shorter reaches. For example, although the Green River narrowed by 4 percent on average over the entire length of the Echo Park segment, one individual 1-km-long reach widened by 2 percent, whereas another one 1-km-long reach narrowed by 9 percent (fig. 6). In Island Park, all of the 1-km-long reaches narrowed; the 1-km-long reach at rkm 126 only narrowed by 4 percent, but the 1-km-long reach at rkm 124 narrowed by 35 percent (fig. 6). In Rainbow Park, the 1-km-long reach at rkm 131 widened by 2 percent, whereas the 1-km-long reach at rkm 132 narrowed by 26 percent. These results indicate that the alluvial reaches of Echo, Island, and Rainbow Parks remain dynamic, but with a dominant trend of channel narrowing.
Table 2.
Active-channel width measurements from aerial photographs of the Green River in Echo, Island, and Rainbow Parks, Dinosaur National Monument, Colorado and Utah.[The 1993 photographs were acquired from the U.S. Geological Survey (USGS) National Aerial Photograph Program (NAPP; USGS, 1993), and all subsequent photographs were acquired from the U.S. Department of Agriculture (USDA) National Agriculture Imagery Program (NAIP; USDA, 2006, 2013, 2014, 2015., 2018, 2019). The active channel consisted of the wet parts of the channel and the active sand deposits, in the channel and on the banks, that were generally devoid of vegetation. We divided the area of the active channel by the length of the channel centerline to determine the active-channel width. Dates in mm/dd/yyyy format. m, meter; %. percent; —, no data]

Plots of percent change in active-channel width visible in aerial photographs, relative to the channel width measured in the 1993 aerial photographs, for segments of the Green River within Echo, Island, and Rainbow Parks, Dinosaur National Monument, Colorado and Utah. The active channel consisted of the wet parts of the channel and the active sand deposits, in the channel and on the banks, that were generally devoid of vegetation. We divided the area of the active channel by the length of the channel centerline to determine the active-channel width. Aerial photograph analysis includes error bars around the active-channel width delineation for each year. River kilometers (rkm) are measured as downstream from Flaming Gorge Dam, Utah. In all river segments, narrowing occurred at faster rates between the 1993 and 2006 aerial photographs compared to the post-2006 aerial photographs. Refer to figures 3 and 4 for location of rkm markers. Echo Park extends from rkm 106 to approximately 109.5; Island Park extends from approximately rkm 124.0 to 130.8; Rainbow Park extends from approximately rkm 130.8 to 134.8.
In all river segments, narrowing occurred at faster rates between the 1993 and 2006 aerial photographs (0.6 m/year in Echo Park, and 1.9 to 2.4 m/year in Island and Rainbow Parks, respectively) compared to post-2006 aerial photographs (0 to 0.5 m/year in all segments) (fig. 6). This is likely because the annual floods from the Yampa River were relatively small between 1993 and 2006, when the hydrologic thresholds defined by Topping and others (2025) were infrequently met; during that period, 66 percent of the years did not exceed the peak discharge threshold of 425 m3/s, and 70 percent of the years did not exceed the median March–July discharge of 99 m3/s. Topping and others (2025) indicate that sand accumulation is likely to occur within the Yampa River and (or) the middle Green River when those thresholds are not exceeded. Conversely, between the 2006 and 2018–2019 aerial photographs, those discharge thresholds were exceeded approximately 50 percent of the time, and the rates of channel narrowing were smaller. These results indicate that hydrologic thresholds defined by Topping and others (2025) are important for limiting sediment deposition within the sediment-budget reach between Deerlodge Park and Jensen, Utah.
Changes in Cross-Sectional Area, Active-Channel Width, and Bed Elevation
Comparisons of cross-section measurements show that a variety of styles of geomorphic change have occurred within Echo, Island, and Rainbow Parks, arising from both net depositional and erosional processes. Depositional processes include vertical floodplain accretion (figs. 7, 8; figs. 1.6, 1.7 in appendix 1), lateral accretion (fig. 9; figs. 1.1–1.4 in appendix 1), and bed aggradation (fig. 1.5 in appendix 1). Erosional processes include channel widening (fig. 1.9 in appendix 1), cutbank retreat (fig. 8; fig. 1.9 in appendix 1), and minor bed scour (fig. 1.9 in appendix 1). In multi-threaded reaches, some channel migration has occurred (fig. 8; figs. 1.7, 1.9 in appendix 1). Elsewhere, the cross sections were stable, with very little change in cross-sectional area and no channel migration (figs. 1.6, 1.8 in appendix 1). Cross-section measurements thus illustrate the dynamic channel behavior that continues to occur within Echo, Island, and Rainbow Parks, in agreement with the results of aerial-photograph analyses.
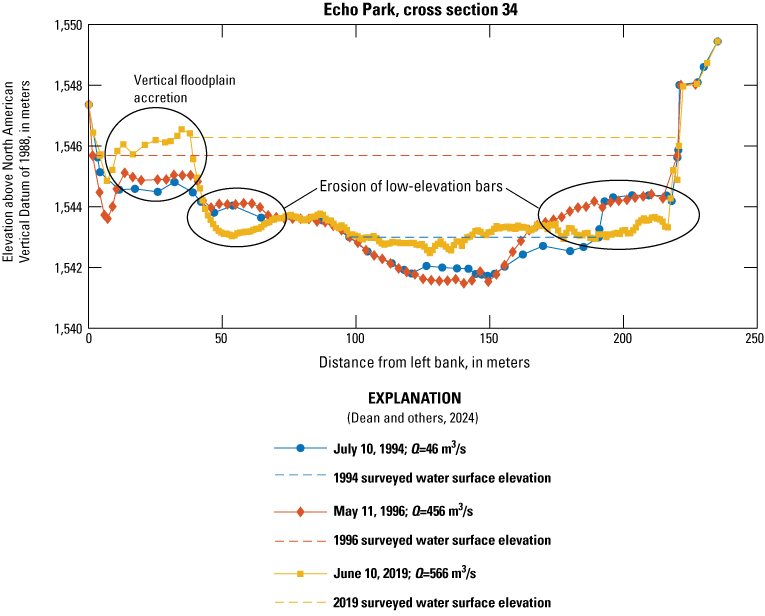
Plot of the cross section 34 measurements of the Green River in Echo Park, Dinosaur National Monument, Colorado, showing vertical floodplain accretion on the left bank, erosion of low-elevation bars on both channel margins, and widening of the low-flow channel. Discharges (Q) are the daily mean discharges measured at the U.S. Geological Survey (USGS) gaging station 09261000 for the Green River near Jensen, Utah (USGS, 2016). Cross-section location shown in figure 3. Topographic data were collected using the North American Datum of 1983 (NAD 83), Universal Transverse Mercator zone 12 north coordinate system. Banks are called right or left as viewed facing downstream. m3/s, cubic meter per second.

Plot of the cross section 53 measurements of the Green River in Island Park, Dinosaur National Monument, Utah, showing vertical floodplain accretion on a mid-channel island and channel migration of the left channel. Discharges (Q) are the daily mean discharges measured at the U.S. Geological Survey (USGS) gaging station 09261000, Green River near Jensen, Utah (USGS, 2016). Cross-section location shown in figure 4. Topographic data were collected using the North American Datum of 1983 (NAD 83), Universal Transverse Mercator zone 12 north coordinate system. Banks are called right or left as viewed facing downstream; right and left channels, respectively, refer to the channels to the left and right of the mid-channel islands, respectively. m3/s, cubic meter per second.
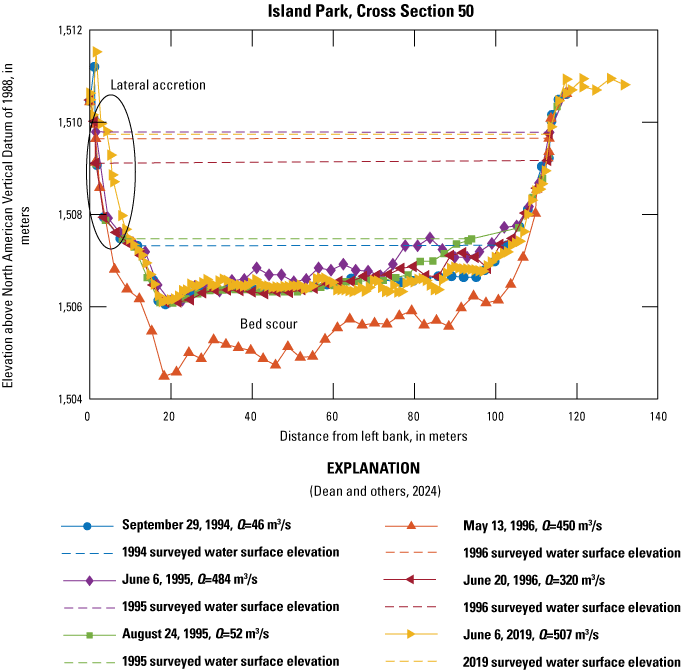
Plot of the cross section 50 measurements of the Green River in Island Park, Dinosaur National Monument, Utah, showing bed scour during the rising limb of the 1996 snowmelt flood and lateral accretion on the left bank. Discharges (Q) are the daily mean discharges measured at the U.S. Geological Survey (USGS) gaging station 09261000, Green River near Jensen, Utah (USGS, 2016). Cross-section locations shown in figure 4. Topographic data were collected using the North American Datum of 1983 Universal Transverse Mercator zone 12 north coordinate system. Banks are called right or left as viewed facing downstream. m3/s, cubic meter per second.
Repeat measurements of channel width among the cross sections also indicate that the channel has predominantly narrowed between 1993–1994 and 2019 (fig. 10A; table 3). The changes in channel width calculated from the repeat cross-section surveys are significantly correlated with changes in channel width measured on the aerial photographs at the cross-section locations (level of significance [p] = 0.004, as indicated by an F-test conducted on the linear regression). On average, the cross-section measurements show that the channel has narrowed by approximately 9 percent since the earliest measurements were made in 1993–1994, compared to narrowing by approximately 15 percent on the aerial photographs at the cross-section locations from 1993 through 2018–2019. The narrowing measured on the cross sections is less than the narrowing inferred from the aerial photographs because on the photographs, we delineated where narrowing had been caused by vegetation encroachment, even if there has been little or no associated topographic change to the channel itself. Note that cross section 55 (fig. 1.9 in appendix 1) is noted by an asterisk because cutbank erosion has resulted in channel widening that is visible in the surveyed cross sections; however, a vegetated mid-channel island had developed as of 2019, and was visible in the aerial photographs, indicating channel narrowing.

Plots comparing changes in channel width and cross-sectional area in the Green River study area within Dinosaur National Monument, Colorado and Utah. A, Percent change in active-channel width, as measured on the aerial photographs at the cross-section locations, compared to change in channel width, as measured from the cross-sections surveys (table 3). B, Percent change in cross-sectional area, as measured from the repeat cross-section surveys, compared to the percent change in channel width, as measured on aerial photographs at the cross-section locations. Changes measured on aerial photographs were between 1993 and 2018–2019. Changes measured using the cross-section surveys were between 1993–1994 and 2019. In A, cross section 55 is denoted by an asterisk, because at the time of the 2019 survey, much of the vegetated island at that cross section was underwater; thus, its existence did not substantially affect measurements of channel width at that water surface elevation. This explains the disparity between the channel narrowing visible in the aerial photographs and the channel widening shown in the surveyed cross section. In B, cross section 49 (fig. 1.5 in app. 1) is denoted by an asterisk because aerial photographs showed slight channel widening, but declines in cross-sectional area occurred through deposition of sediment on the bed. The red squares refer to cross section 56 (fig. 1.10 in app. 1); the right end point was not found in 2019, and thus the changes in cross-sectional width and area at that location are likely incorrect. In A, cross section 56 was excluded from the linear regression. XS, cross section; p, level of significance.
Table 3.
Comparisons of changes in Green River channel width using aerial-photograph analyses at the cross-section locations, and channel width measured on the cross sections, in Echo, Island, and Rainbow Parks, Dinosaur National Monument, Colorado and Utah.[The 1993 photographs were acquired from the U.S. Geological Survey (USGS)’s National Aerial Photograph Program (NAPP; USGS, 1993), and the 2018–2019 photographs were acquired from the U.S. Department of Agriculture (USDA) National Agriculture Imagery Program (NAIP; USDA, 2018, 2019). Initial channel-width surveys were conducted between November 1993 and October 1994, and final channel-width surveys were conducted in June 2019 (table 1; Dean and others, 2024). Cross-section locations are shown in figures 3 and 4. Visual representation of this data is shown in figure 10. Channels are called left or right as viewed facing downstream. L, left channel; R, right channel]
Between the 1993–1994 surveys and the 2019 surveys, the average direction of channel-width change at the cross sections in Echo and Island Parks agreed with the direction of the average channel-width change measured on the aerial photographs (table 4). In Rainbow Park, however, the average channel width at the cross sections widened by approximately 2 percent, whereas the aerial photographs showed an average narrowing by approximately 15 percent. This disparity is because only two cross sections were used to calculate the average change in channel width of the cross sections, and one cross section had substantial cutbank erosion (cross section 55, fig 1.9 in appendix 1).
In 9 of the 15 cross sections, the narrowing measured on the aerial photographs is associated with a loss in cross-sectional area (fig. 10B; table 4). This indicates that the deposition associated with channel narrowing and (or) floodplain aggradation has generally outpaced erosional processes, such as bed scour or erosion of low-elevation benches. Net deposition of sediment and associated declines in cross-sectional area occurred in 10 of the 15 cross sections between the initial 1993–1994 surveys and our 2019 survey (figs. 10B, 11); the average decline in cross-sectional area was 6.3 percent for those 10 cross sections, with a standard deviation of 3.8 percent. Only 5 of the 15 cross sections showed sediment erosion and increases in cross-sectional area: 0.8 percent for the left channel of cross section 51 (fig. 7), 2.2 percent for the right channel of cross section 52 (fig. 1.7 in appendix 1), 15.0 percent for cross section 54 (fig. 1.8 in appendix 1), 8.4 percent for cross section 55 (fig. 1.9 in appendix 1), and 44.9 percent for cross section 56 (fig. 1.10 in appendix 1). The increase in area of the left channel of cross section 51 was negligible. The increases in area of the right channel of cross sections 52 and 54 were a result of bed scour during the 2019 annual flood. The increase in area of cross section 55 was caused by cutbank retreat. The large increase in cross-sectional area from cross section 56 includes substantial uncertainty, because the right-bank endpoint was not found; thus, the exact location of the original cross section could only be estimated during the 2019 survey, and the result cannot be verified.
Table 4.
Comparisons of average changes in cross-sectional area and channel width determined from repeat surveys at each cross section, to changes in channel width determined from the aerial-photograph analyses, in the alluvial segments of the Green River within Echo, Island, and Rainbow Parks, Dinosaur National Monument, Colorado and Utah.[Average changes at cross sections compare initial values from 1993–1994 to 2019 (Dean and others, 2024), and changes from aerial photographs compare 1993 values (U.S. Geological Survey, 1993) to 2018–2019 values (U.S. Department of Agriculture, 2018, 2019). Note that direction of change does not always agree between aerial-photograph analyses and cross-section surveys; for example, in Rainbow Park, aerial photographs indicate channel narrowing, and therefore, possible sediment deposition, whereas cross-section surveys indicate that erosion occurred. Cross section (XS) locations shown in figures 3 and 4. %, percent; m, meter]
Analyses of cross sections and channel bathymetry data in the study area suggest that no major changes in bed elevation occurred between the 1990s and 2019. At the cross-section locations, the minimum bed elevation in the 2019 channel was slightly lower on average than in the most recent measurements from the 1990s, but the variability between cross sections greatly exceeded the mean change (fig. 11). The mean change in minimum bed elevation between the first cross-section measurements in 1993–1994 and the 2019 measurements was −0.30 m (standard deviation of 0.76 m), and the mean change between the last cross-section measurements from the 1990s and the 2019 measurements was −0.08 m (standard deviation of 0.91 m). Similarly, analyses of bed-elevation change between the 1998 ADCP measurements and the DEM, created from the 2019 multibeam-sonar survey, showed that the channel bed was approximately 0.30 m lower on average in 2019 than in 1998 (fig. 12). However, the spatial distribution of bed-elevation change between the 1998 ADCP data and the 2019 multibeam-sonar data substantially overlaps zero (fig. 12). Moreover, the uncertainty in bed elevation associated with the mean dune height in 2019 is similar in magnitude to the absolute value of the approximately 0.30 m change in bed elevation between 1998 and 2019. Thus, although the data indicate that slight mean scour likely occurred between the late 1990s and 2019, this scour was much smaller than the spatial variability in bed-elevation change, indicating insignificance in the context of this study.

Plot of changes in bed elevation as a function of changes in cross-sectional area for the Green River study area within Dinosaur National Monument, Colorado and Utah. Each marker represents the change at one cross section compared to a previous measurement at the same cross section, where the first year listed is the original measurement, and the second year is the new measurement. Survey data suggest that no major changes in bed elevation have occurred between the 1990s and 2019; although minimum bed elevations at the cross sections in the 2019 channel were slightly lower on average than in the most recent measurements from the 1990s, the variability between cross sections greatly exceeded the mean change. Comparisons of the 2019 data to the 1990s data are depicted by larger symbols. Cross-section locations shown in figures 3 and 4.
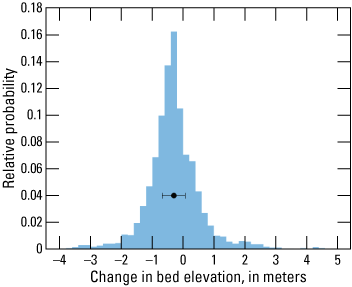
Histogram of the distribution of bed-elevation changes in the Green River within Island Park, Dinosaur National Monument, Utah. Bed-elevation changes were calculated by subtracting the 2019 bed elevations (obtained from multibeam-sonar data; Dean and others, 2024) from the 1998 acoustic-Doppler current profiler (ADCP) data (Gessler and Moser, 2001). Comparisons of the 1998 ADCP measurements and the digital elevation model created from the 2019 multibeam-sonar survey showed that the channel bed was on average approximately 0.30 meters (m) lower in 2019 than in 1998. However, the spatial distribution of bed-elevation changes between the 1998 ADCP data and 2019 multibeam-sonar data substantially overlaps zero. The black dot shows the mean change between the two surveys (-0.30 m), and the length of the error bars is equal to the mean dune height during the 2019 survey (0.37 m).
Longitudinal profiles of bed-elevation change, calculated from the 1998 and 2019 surveys, further illustrate the large spatial variability in bed-elevation change that occurred within Island Park (fig. 13). Upstream from rkm 128.5, where the bed alternates between a plane bed and sand dunes, the variability in bed-elevation change is rather small (fig. 13A); there was as much as 2.5 m of scour within the sandy secondary channel at approximately rkm 127.8 (downstream from cross section 51), but changes elsewhere consisted of smaller amounts of scour and fill that were generally less than 0.75 m (fig. 13A). Downstream from rkm 128.5, where the bed is largely sand, changes in bed elevation were much more variable, with as much as 4.9 m of fill and 3.8 m of scour in some areas. Some of these larger changes occurred in nearly the same longitudinal location, indicating that large amounts of local scour were offset by large amounts of local deposition (for example, at rkm 130.4, fig. 13A).
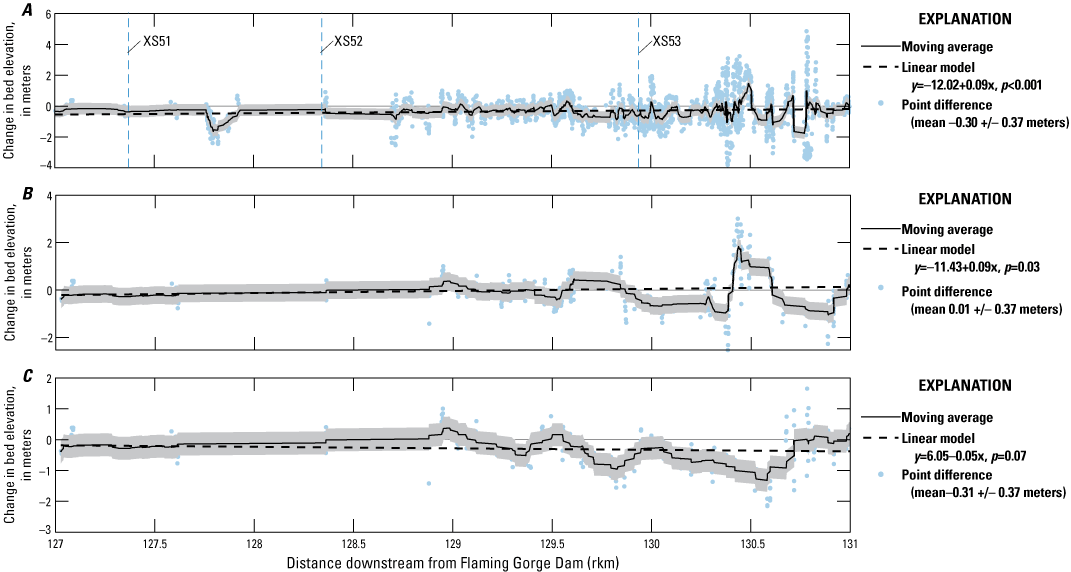
Plots of longitudinal profiles of bed-elevation change in the Green River within Island Park, Dinosaur National Monument, Utah. A, Longitudinal profile of all data. B, Longitudinal profile of data within 10 meters (m) of the channel centerline; from river kilometer (rkm) 129 to 131, data are from the center line in the left channel. C, Longitudinal profile of data within 10 m of the channel centerline; from rkm 129 to 131, data are from the centerline in the right channel. The data near the channel centerlines were plotted to show the variability between the two channels in the dominantly sand-bedded reach where large amounts and scour and fill can occur. Individual comparisons between the 1998 acoustic-Doppler current profiler (ADCP) measurements (Gessler and Moser, 2001) and the 2019 digital elevation model (Dean and others, 2024) are shown with blue dots; solid, undulating lines are 20-point moving averages; horizontal black lines show line of zero change; and dashed, black lines show the best-fit linear regression. The shaded region is the uncertainty associated with the mean bedform height. Cross-section locations are shown in figure 4. Channels are called left or right as viewed facing downstream. River kilometers are measured downstream from Flaming Gorge Dam, Utah. p, level of significance; XS, cross section.
Between approximately rkm 129 and 130.5, longitudinal changes along the channel centerlines of both the left and right channels show different patterns of scour and fill. In the left channel, there are short reaches, approximately half a kilometer in length, of alternating scour and fill along the centerline (fig. 13B), but the moving average shows that the bed-elevation change is approximately 0 at the start of Rainbow Park at rkm 131. In the right channel, much of the bed along the channel centerline in 2019 was scoured compared to the 1998 data. However, the scour does not persist into Rainbow Park, and the bed-elevation change downstream from rkm 130.7, as shown by the moving average, is approximately 0 (fig. 13C). The longitudinal profiles in figure 13 thus show both the longitudinal and cross-stream variability in scour and fill that occurred between 1998 and 2019.
The apparent bed erosion between the 1990s and 2019 could be an artifact of the timing of the surveys (figs. 11–13). Throughout the Green River system, from Flaming Gorge Dam to the confluence with the Colorado River in Canyonlands National Park, it is common for the bed to scour and fill during spring snowmelt floods, although these patterns are highly spatially variable (Allred and Schmidt, 1999; Grams and Schmidt, 2005; Alexander, 2007; Dean and others, 2020; Grams and others, 2020; Walker and others, 2020). Because of how the flow interacts with nonuniform planform geometry and bed topography in any given reach, some cross sections fill whereas others scour during the flood rise and recession (Colby, 1964; Andrews, 1979; Howard and Dolan, 1981; Topping and others, 2000). Thus, it is difficult to detect long-term changes in bed elevation because of the natural processes of scour and fill that occur every year, especially because the local magnitudes of scour and fill can greatly exceed the possible 0.2–0.3 m of long-term scour detected in our study. At the locations of the cross sections in Island Park, cross-section surveys show that the channel bed often scours on the rising limb of the snowmelt flood, at times as much as 2 m (fig. 9), and subsequently fills during the falling limb of the flood (fig. 11; figs. 1.7, 1.8 in appendix 1). Survey frequency in Echo and Rainbow Parks was not sufficient to analyze scour and fill dynamics during individual floods in those segments. Our 2019 survey data was collected during the rising limb of the snowmelt flood, when the channel bed usually scours at the Island Park cross sections. Conversely, the 1998 ADCP data was collected at a lower discharge during the falling limb, when the channel bed usually fills at the Island Park cross sections. Thus, the apparent erosion of the channel bed between the 1998 and 2019 surveys (figs. 12, 13C) cannot be differentiated beyond the scour and fill processes that occur annually. The timing of scour and fill also likely influenced the increase in cross-sectional area for the right channel of cross sections 52 and 54 (fig. 10B); the initial surveys were conducted in September–October of 1994, whereas the 2019 survey was conducted near the peak of the annual flood, when the bed is usually scoured at those cross sections.
Bed-Sediment Grain Size
Within Echo Park, the channel bed consisted of relatively smooth sand and gravel, and of dunes composed of sand. Bed-sediment samples at cross sections 33 and 34 indicate the bed at those locations was predominantly gravel (fig. 14A). Multibeam-sonar data show that in the upstream part of Island Park, between cross sections 48a (rkm 123.8) and 49 (rkm 125.5), the bed was primarily composed of gravel (fig. 15A). Between cross section 49 (rkm 125.5) and approximately rkm 127, the bed surface transitioned from gravel to sand dunes. Between river km 127 and cross section 52 (rkm 128.7), the bed was likely composed of a mixture of gravel and sand dunes; however, in some patches of the channel, no multibeam-sonar data were collected. Downstream from cross section 52, nearly the entire bed was composed of migrating sand dunes (fig. 15B). Isolated patches of gravel were present among the dune fields, such as near the left bank at cross section 54 (rkm 130.9; fig. 15B). No bed-sediment sample was collected along the left part of the channel at that cross section because that part of the channel bed was likely composed of gravel too coarse to be retrieved by the sampler. However, some gravel was sampled in the center of the channel at cross section 55 (rkm 132.1) in Rainbow Park (fig. 14A).
Although bed-sediment samples indicate the bed in Echo Park was primarily gravel, and the bed in Island Park was primarily sand, t-tests indicate that there are no statistically significant differences in the sampled bed sediment between Echo Park and Island and Rainbow Parks. This result arises from the small sample size (n=7) and the large variance in grain size among samples in Echo Park. The p-values associated with the t-tests were 0.06 for total-sediment D50, 0.40 for sand D50, and 0.84 for PVFS; thus, the differences were not statistically significant at the 95-percent confidence level. Linear regression showed that there were no longitudinal trends in bed-sediment grain size in either Echo Park or Island and Rainbow Parks (fig. 14); p-values were all greater than 0.05, indicating that the slopes of the linear regressions were not statistically significant at the 95-percent confidence level. Although there were no longitudinal trends in bed-sediment grain size among the bed-sediment samples in Island Park, there is a distinct transition from gravel to sand downstream from cross section 49 (rkm 125.5); however, no samples were collected at cross sections 48a–d because the US BMH–60 sampler could not retrieve the coarse gravel from the bed.
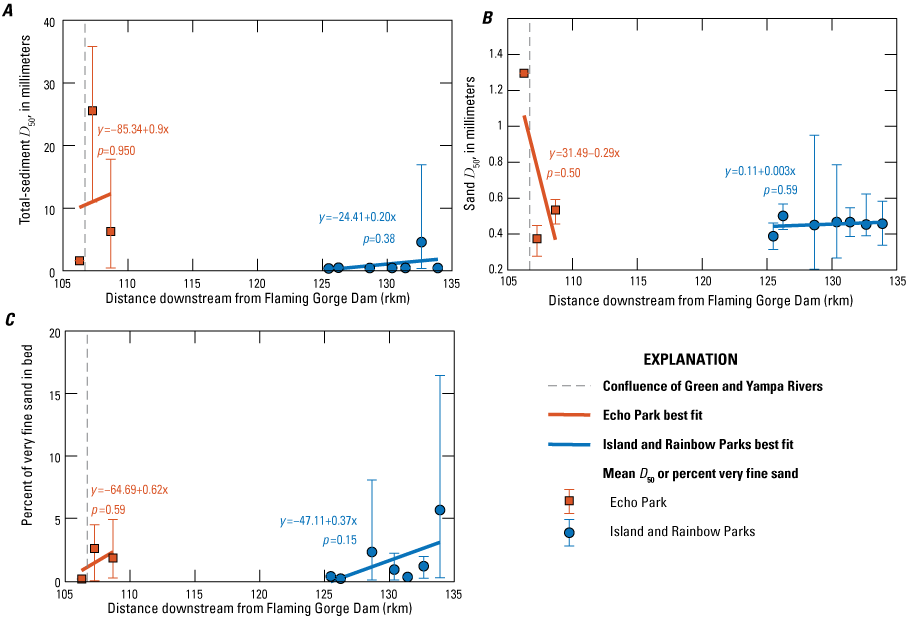
Plots of longitudinal trends in bed-sediment grain size in the Green River, within Echo Park and Island and Rainbow Parks, Dinosaur National Monument, Colorado and Utah. Mean values at each cross section calculated for A, Total sediment D50 (median grain size); B, Sand D50; and C, Percent of very fine sand (PVFS) within the bed-sediment samples, plotted as a function of distance in river kilometers (rkm) downstream from Flaming Gorge Dam. Linear regression showed that there were no longitudinal trends in bed-sediment grain size in either Echo Park or Island and Rainbow Parks; p-values were all greater than 0.05, indicating that the slopes of the linear regressions were not statistically significant at the 95-percent confidence level. Although there were no longitudinal trends in bed-sediment grain size among the bed-sediment samples in Island Park, there is a distinct transition from gravel to sand downstream from cross section 49 (rkm 125.5). Data points are mean values of the samples collected at each cross section and error bars are the minimum and maximum values. p, level of significance.
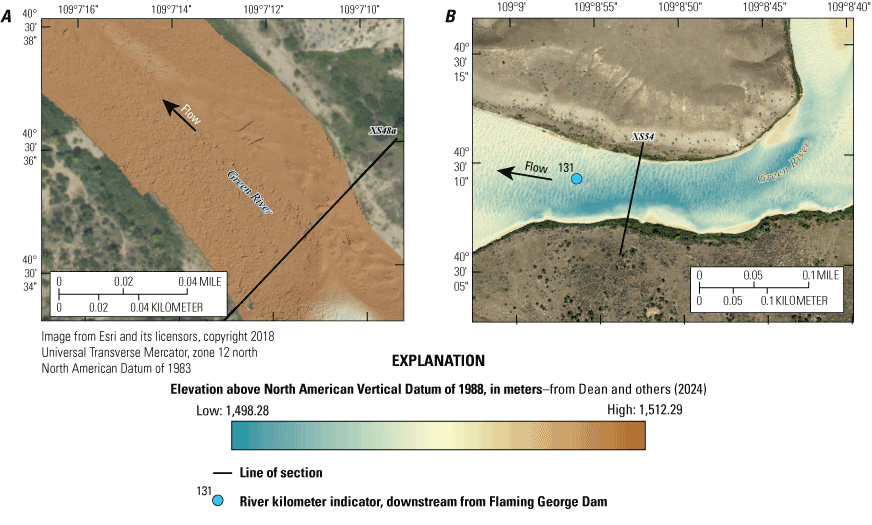
Images of the channel bed in the vicinity of cross sections (XS) 48a and 54, constructed using multibeam-sonar data (Dean and others, 2024) of the Green River in Island and Rainbow Parks, Dinosaur National Monument, Utah. A, By cross section 48a, sand dunes are present along the right bank, but the remainder of the channel bed is composed of gravel, as shown by the rough texture along the left bank. B, By cross section 54, sand dunes cover nearly the entire channel bed, except along the left bank. Cross-section locations are shown in figure 4. Banks are called right or left as viewed facing downstream.
Conclusions
The Green River channel narrowed substantially between the 1962 closure of the Flaming Gorge Dam and 1993: 10 percent in Echo Park and 25 percent in both Island and Rainbow Parks. Since then, ongoing changes to Flaming Gorge Dam operations, climatic variability, and relatively natural changes in sediment supply have likely contributed to additional changes to the channel and floodplain in the alluvial segments of the middle Green River (downstream from its confluence with the Yampa River). Ongoing changes have potentially affected threatened and endangered fishes that inhabit the meandering segments of the Green River. We conducted aerial-photograph analyses and resurveyed channel cross sections and channel bathymetry to quantify the rate and magnitude of channel adjustment between 1993 and 2019. Aerial-photograph analyses in this study show that channel narrowing has continued in the alluvial reaches of the middle Green River; between 1993 and 2018–2019, the river narrowed by 4 percent in Echo Park, 16 percent in Island Park, and 15 percent in Rainbow Park.
Channel cross-section measurements show that cross-sectional area decreased in 10 of the 15 cross sections through vertical floodplain accretion, lateral accretion of sediment on channel banks, and in some areas, bed aggradation; bed aggradation may be transitory. Cross-section analyses show that the channel narrowed in 11 of the 15 cross sections (table 3), whereas aerial-photograph analyses show that the channel narrowed at all cross sections except cross section 49. Narrowing measured on the aerial photographs was generally greater than the narrowing measured by the cross-sections surveys; a result of vegetation encroachment upon the channel that is visible in the aerial photographs, even if little topographical change had occurred. Bed-elevation measurements indicate that slight erosion of the channel bed occurred between the late 1990s and 2019, with spatial variability that exceeds the mean change. Consequently, this apparent scour may be an artifact of the timing of the surveys relative to annual floods that affect scour and fill dynamics.
These results indicate that channel and floodplain adjustments continue to occur within the alluvial segments of the middle Green River within Dinosaur National Monument, 56 years after the closure of the Flaming Gorge Dam. Studies indicate that ongoing channel adjustment is mostly caused by the magnitude of the annual flood of the Yampa River, and changes in the sand-transport dynamics in the middle Green River that are caused by related variation in the Yampa River sand supply, generally not by ongoing Flaming Gorge Dam operations. This is known because changes in Flaming Gorge Dam operations have not resulted in larger or longer floods in the middle Green River. Aerial photographs show that channel narrowing occurred at the fastest rates between 1993 and 2006 (between 0.6 and 2.4 meters per year), when the annual peak discharge of the Yampa River was less than 425 cubic meters per second (m3/s) in 70 percent of those years, and when the median March–July discharge of the Yampa was less than 99 m3/s in 66 percent of those years; multi-year sand accumulation in the middle Green River within Dinosaur National Monument likely occurs when those thresholds are not exceeded. Between 2006 and 2019, aerial photographs show that channel narrowing was less (0 to 0.5 meters per year) than between 1993 and 2006, when those discharge thresholds were exceeded approximately 50 percent of the time.
References Cited
Alexander, J.S., 2007, The timing and magnitude of channel adjustments in the upper Green River below Flaming Gorge Dam in Browns Park and Lodore Canyon, Colorado—An analysis of the pre- and post-dam river using high-resolution dendrogeomorphology and repeat topographic surveys: Logan, Utah, Utah State University, Master’s thesis, 96 p., accessed September 8, 2016, at https://doi.org/10.26076/876b-02b5.
Allred, T.M., and Schmidt, J.C., 1999, Channel narrowing by vertical accretion along the Green River near Green River, Utah: Geological Society of America Bulletin, v. 111, no. 12, p. 1757–1772, accessed April 16, 2009, at https://doi.org/10.1130/0016-7606(1999)111<1757:CNBVAA>2.3.CO;2.
Andrews, E.D., 1979, Scour and fill in a stream channel, East Fork River, western Wyoming: U.S. Geological Survey Professional Paper 1117, 49 p. [Also available at https://doi.org/10.3133/pp1117.]
Andrews, E.D., 1986, Downstream effects of Flaming Gorge Reservoir on the Green River, Colorado and Utah: Geological Society of America Bulletin, v. 97, no. 8, p. 1012–1023. [Also available at https://doi.org/10.1130/0016-7606(1986)97%3C1012:DEOFGR%3E2.0.CO;2.]
Bestgen, K.R., Haines, G.B., and Hill, A.A., 2011, Synthesis of flood plain wetland information—Timing of razorback sucker reproduction in the Green River, Utah, related to stream flow, water temperature, and flood plain wetland availability: Fort Collins, Colo., Colorado State University, Colorado River Recovery Implementation Program Projects 22F and FR–FP Synthesis, Larval Fish Laboratory contribution 163, 190 p. [Also available at https://warnercnr.colostate.edu/wp-content/uploads/sites/2/2017/04/LFL-163-Bestgen_et_al-2011-Rpt.pdf.]
Birken, A.S., and Cooper, D.J., 2006, Processes of Tamarix invasion and floodplain development along the lower Green River, Utah: Ecological Applications, v. 16, no. 3, p. 1103–1120, accessed June 8, 2007, at https://doi.org/10.1890/1051-0761(2006)016[1103:POTIAF]2.0.CO;2.
Colby, B.R., 1964, Scour and fill in sand-bed streams: U.S. Geological Survey Professional Paper 462–D, 32 p. [Also available at https://doi.org/10.3133/pp462D.]
Dean, D.J., and Topping, D.J., 2024, The effects of vegetative feedbacks on flood shape, sediment transport, and geomorphic change in a dryland river—Moenkopi Wash, AZ: Geomorphology, v. 447, p. 109017, at https://doi.org/10.1016/j.geomorph.2023.109017.
Dean, D.J., Grams, P.E., Griffiths, R.E., Unema, J.A., Sartain, S.L., and Topping, D.J., 2024, Channel and floodplain cross-section and bed-elevation data for the Green River in Echo, Island, and Rainbow Parks, Dinosaur National Monument, Colorado and Utah: U.S. Geological Survey data release, at https://doi.org/10.5066/P13MZCVJ.
Dean, D.J., Topping, D.J., Grams, P.E., Walker, A.E., and Schmidt, J.C., 2020, Does channel narrowing by floodplain growth necessarily indicate sediment surplus? Lessons from sediment transport analyses in the Green and Colorado Rivers, Canyonlands, Utah: Journal of Geophysical Research Earth Surface, v. 125, no. 11, article e2019JF005414. [Available at https://doi.org/10.1029/2019JF005414.]
Dean, D.J., and Topping, D.J., 2019, Geomorphic change and biogeomorphic feedbacks in a dryland river—The Little Colorado River, Arizona, USA: Geological Society of America Bulletin, v. 131, nos. 11–12, p. 1920–1942, https://doi.org/10.1130/B35047.1.
Gessler, D., and Moser, E., 2001, Two-dimensional computer modeling of Green River at Dinosaur National Monument and Canyonlands National Park: Fort Collins, Colo., National Park Service Water Resources Division Water Rights Branch, 63 p. [Also available at http://www.riversimulator.org/Resources/NPS/Canyonlands/ModelingGreenRiverFloodplain.pdf.]
Graf, W.L., 1978, Fluvial adjustments to the spread of tamarisk in the Colorado Plateau region: Geological Society of America Bulletin, v. 89, no.10, p. 1491–1501. [Also available at https://doi.org/10.1130/0016-7606(1978)89%3C1491:FATTSO%3E2.0.CO;2.]
Grams, P.E., 1997, Geomorphology of the Green River in Dinosaur National Monument: Logan, Utah, Utah State University, Master’s thesis. [Also available at https://digitalcommons.usu.edu/etd/6703.]
Grams, P.E., Dean, D.J., Walker, A.E., Kasprak, A., and Schmidt, J.C., 2020, The roles of flood magnitude and duration in controlling channel width and complexity on the Green River in Canyonlands, Utah, USA: Geomorphology, v. 371, article 107438. [Also available at https://doi.org/10.1016/j.geomorph.2020.107438.]
Grams, P.E., and Schmidt, J.C., 2002, Streamflow regulation and multi-level flood plain formation—Channel narrowing on the aggrading Green River in the eastern Unita Mountains, Colorado and Utah: Geomorphology, v. 44, no. 3–4, p. 337–360, accessed December 2, 2010, at https://doi.org/10.1016/S0169-555X(01)00182-9.
Grams, P.E., and Schmidt, J.C., 2005, Equilibrium or indeterminate? Where sediment budgets fail—Sediment mass balance and adjustment of channel form, Green River downstream from Flaming Gorge Dam, Utah and Colorado: Geomorphology, v. 71, nos. 1–2, p. 156–181, accessed October 4, 2006, at https://doi.org/10.1016/j.geomorph.2004.10.012.
Howard, A., and Dolan, R., 1981, Geomorphology of the Colorado River in the Grand Canyon: The Journal of Geology, v. 89, no. 3, p. 269–298. [Also available at https://doi.org/10.1086/628592.]
Krumbein, W.C., 1934, Size frequency distributions of sediments: Journal of Sedimentary Research, v. 4, no. 2, p. 65–77. [Also available at https://doi.org/10.1306/D4268EB9-2B26-11D7-8648000102C1865D.]
LaGory, K., Bestgen, K., Patno, H., Wilhite, J., Speas, D., and Trammell, M., 2019, Evaluation and suggested revisions of flow and temperature recommendations for endangered fish in the Green River downstream of Flaming Gorge Dam, Final Report: Upper Colorado River Endangered Fish Recovery Program, accessed June 21, 2023, at https://coloradoriverrecovery.org/uc/wp-content/uploads/sites/2/2022/07/GREAT-Final-Report_Oct-2019_508_2.pdf.
LaGory, K., Chart, T., Bestgen, K., Wilhite, J., Capron, S., Speas, D., Hermansen, H., McAbee, K., Mohrman, J., and Trammell, M., 2012, Study plan to examine the effects of using larval razorback sucker occurrence in the Green River as a trigger for Flaming Gorge Dam peak releases, Final report: Upper Colorado River Endangered Fish Recovery Program, prepared by the Larval Trigger Study Plan Ad Hoc Committee, 29 p. [Also available at https://coloradoriverrecovery.org/uc/wp-content/uploads/sites/2/2021/11/TechnicalReport-ISF-Lagory-2012-LarvalTriggerStudy.pdf.]
Lyons, J.K., Pucherelli, M.J., and Clark, R.C., 1992, Sediment transport and channel characteristics of a sand-bed portion of the Green River below Flaming Gorge Dam, Utah, USA: Regulated Rivers—Research and Management, v. 7, no. 3, p. 219–232. [Also available at https://doi.org/10.1002/rrr.3450070302.]
Manners, R.B., Schmidt, J.C., and Scott, M.L., 2014, Mechanisms of vegetation-induced channel narrowing of an unregulated canyon river—Results from a natural field-scale experiment: Geomorphology, v. 211, p. 100–115, accessed March 5, 2014, at https://doi.org/10.1016/j.geomorph.2013.12.033.]
Merritt, D.M., and Cooper, D.J., 2000, Riparian vegetation and channel change in response to river regulation—A comparative study of regulated and unregulated streams in the Green River Basin, USA: Regulated Rivers—Research and Management, v. 16, no. 6, p. 543–564. [Also available at https://doi.org/10.1002/1099-1646(200011/12)16:6%3C543::AID-RRR590%3E3.0.CO;2-N.]
Mount, N.J., Louis, J., Teeuw, R.M., Zukowskyj, P.M., and Stott, T., 2003, Estimation of error in bankfull width comparisons from temporally sequenced raw and corrected aerial photographs: Geomorphology, v. 56, nos. 1–2, p. 65–77, at https://doi.org/10.1016/S0169-555X(03)00046-1.
Mueller, E.R., Grams, P.E., Schmidt, J.C., Hazel, J.E., Alexander, J.S., and Kaplinski, M., 2014, The influence of controlled floods on fine sediment storage in debris fan-affected canyons of the Colorado River basin: Geomorphology, v. 226, no. 1, p. 65–75. [Also available at https://doi.org/10.1016/j.geomorph.2014.07.029.]
Muth, R.T., Crist, L.W., LaGory, K.E., Hayse, J.W., Bestgen, K.R., Ryan, T.P., Lyons, J.K., and Valdez, R.A., 2000, Flow and temperature recommendations for endangered fishes in the Green River downstream of Flaming Gorge Dam, Final Report: Upper Colorado River Endangered Fish Recovery Program Project FG–53, 343 p. [Also available at https://coloradoriverrecovery.org/uc/wp-content/uploads/sites/2/2021/11/TechnicalReport-ISF-Muth-2000-FlamingGorgeTemperatures.pdf.]
State of Utah, Quantum Spatial Incorporated, Digital Mapping Incorporated, and Aero-graphics Incorporated, 2019, Regional Utah high-resolution lidar data 2015–2017: OpenTopography, accessed May 19, 2020, at https://doi.org/10.5069/G9RV0KSQ.
Swanson, B.J., Meyer, G.A., and Coonrod, J.E., 2011. Historical channel narrowing along the Rio Grande near Albuquerque, New Mexico in response to peak discharge reductions and engineering—magnitude and uncertainty of change from air photo measurements: Earth Surface Processes and Landforms, v. 36, no. 7, p. 885–900, at https://doi.org/10.1002/esp.2119.
Topping, D.J., Griffiths, R.E., Unema, J.A., and Dean, D.J., 2025, Controls on sediment transport and storage in the Little Snake, Yampa, and Green Rivers in the vicinities of Dinosaur National Monument and Ouray National Wildlife Refuge, Colorado and Utah, with implications for fish habitat in the middle Green River: U.S. Geological Survey Scientific Investigations Report 2025–5075, 117 p., https://doi.org/10.3133/sir20255075.
Topping, D.J., Mueller, E.R., Schmidt, J.C., Griffiths, R.E., Dean, D.J., and Grams, P.E., 2018, Long-term evolution of sand transport through a river network—Relative influences of a dam versus natural changes in grain size from sand waves: Journal of Geophysical Research Earth Surface, v. 123, no. 8, p. 1879–1909. [Available at https://doi.org/10.1029/2017JF004534.]
Topping, D.J., Rubin, D.M., Nelson, J.M., Kinzel, P.J., III, and Corson, I.C., 2000, Colorado River sediment transport, 2. Systematic bed-elevation and grain-size effects of sand supply limitation: Water Resources Research, v. 36, no. 2, p. 543–570. [Also available at https://doi.org/10.1029/1999WR900286.]
U.S. Bureau of Reclamation, 2005, Operation of Flaming Gorge Dam, Final Environmental Impact Statement: Bureau of Reclamation web page, accessed September 30, 2023, at https://www.usbr.gov/uc/envdocs/eis/fgFEIS/index.html.
U.S. Bureau of Reclamation, 2006, Record of Decision, operation of Flaming Gorge Dam, Final Environmental Impact Statement: Bureau of Reclamation, 10 p. [Also available at https://www.usbr.gov/uc/envdocs/rod/fgFEIS/final-ROD-15feb06.pdf].
U.S. Department of Agriculture, 2006, One-meter National Agriculture Imagery Program digital orthophotographs, 2006: U.S. Department of Agriculture, Farm Service Agency, Aerial Photography Field Office, National Agriculture Imagery Program, digital data accessed from https://earthexplorer.usgs.gov.
U.S. Department of Agriculture, 2013, One-meter National Agriculture Imagery Program digital orthophotographs, 2013: U.S. Department of Agriculture, Farm Service Agency, Aerial Photography Field Office, National Agriculture Imagery Program, digital data accessed from https://earthexplorer.usgs.gov.
U.S. Department of Agriculture, 2014, One-meter National Agriculture Imagery Program digital orthophotographs, 2014: U.S. Department of Agriculture, Farm Service Agency, Aerial Photography Field Office, National Agriculture Imagery Program, digital data accessed from https://earthexplorer.usgs.gov/.
U.S. Department of Agriculture, 2015, One-meter National Agriculture Imagery Program digital orthophotographs, 2015: U.S. Department of Agriculture, Farm Service Agency, Aerial Photography Field Office, National Agriculture Imagery Program, digital data accessed from https://earthexplorer.usgs.gov.
U.S. Department of Agriculture, 2018, Sixty-centimeter National Agriculture Imagery Program digital orthophotographs, 2018: U.S. Department of Agriculture, Farm Service Agency, Aerial Photography Field Office, National Agriculture Imagery Program, digital data accessed from https://earthexplorer.usgs.gov.
U.S. Department of Agriculture, 2019, Sixty-centimeter National Agriculture Imagery Program digital orthophotographs, 2019: U.S. Department of Agriculture, Farm Service Agency, Aerial Photography Field Office, National Agriculture Imagery Program, digital data accessed from https://earthexplorer.usgs.gov.
U.S. Fish and Wildlife Service, 1992, Final biological opinion on the operation of Flaming Gorge Dam, November 25, 1992: U.S. Fish and Wildlife Service, 160 p. [Also available at http://www.riversimulator.org/Resources/LawOfTheRiver/HooverDamDocs/Supplements/1992FinalBOFlamingGorgeDam.pdf.].
U.S. Geological Survey [USGS], 1993, One-meter National Aerial Photography Program (NAPP) digital orthophotographs: U.S. Geological Survey, digital data accessed from https://earthexplorer.usgs.gov.
U.S. Geological Survey [USGS], 2016, USGS water data for the Nation: U.S. Geological Survey National Water Information System database, accessed June 16, 2023, at https://doi.org/10.5066/F7P55KJN.
Van der Mark, C., and Blom, A., 2007, A new and widely applicable tool for determining the geometric properties of bedforms: Enschede, Netherlands, University of Twente, Civil Engineering and Management Research Report 2007R–003/WEM–002, 44 p., accessed June 14, 2016, at https://doi.org/10.13140/RG.2.2.17637.40161.
Walker, A.E., Moore, J.N., Grams, P.E., Dean, D.J., and Schmidt, J.C., 2020, Channel narrowing by inset floodplain formation of the lower Green River in the Canyonlands region, Utah: Geological Society of America Bulletin, v. 132, nos. 11–12, p. 2333–2352. [Also available at https://doi.org/10.1130/B35233.1.]
Wentworth, C.K., 1922, A scale of grade and class terms for clastic sediments: The journal of geology, v. 30, no. 5, p. 377-392, at https://doi.org/10.1086/622910
Appendix 1. Channel Cross Sections of the Green River in Echo, Island, and Rainbow Parks, Dinosaur National Monument, Colorado and Utah

Plot of the cross section 48a measurements of the Green River in Island Park, Dinosaur National Monument, Utah. Discharges (Q) are the daily mean discharges measured at the U.S. Geological Survey (USGS) gaging station 09261000 for the Green River near Jensen, Utah (USGS, 2016). Cross-section location shown in figure 4. Topographic data were collected using the North American Datum of 1983, Universal Transverse Mercator zone 12 north coordinate system. Banks are called right or left as viewed facing downstream. m3/s, cubic meter per second.

Plot of the cross section 48b measurements of the Green River in Island Park, Dinosaur National Monument, Utah. Discharges (Q) are the daily mean discharges measured at the U.S. Geological Survey (USGS) gaging station 09261000 for the Green River near Jensen, Utah (USGS, 2016). Cross-section location shown in figure 4. Topographic data were collected using the North American Datum of 1983, Universal Transverse Mercator zone 12 north coordinate system. Banks are called right or left as viewed facing downstream. m3/s, cubic meter per second.

Plot of the cross section 48c measurements of the Green River in Island Park, Dinosaur National Monument, Utah. Discharges (Q) are the daily mean discharges measured at the U.S. Geological Survey (USGS) gaging station 09261000 for the Green River near Jensen, Utah (USGS, 2016). Cross-section location shown in figure 4. Topographic data were collected using the North American Datum of 1983, Universal Transverse Mercator zone 12 north coordinate system. Banks are called right or left as viewed facing downstream. m3/s, cubic meter per second.

Plot of the cross section 48d measurements of the Green River in Island Park, Dinosaur National Monument, Utah. Discharges (Q) are the daily mean discharges measured at the U.S. Geological Survey (USGS) gaging station 09261000 for the Green River near Jensen, Utah (USGS, 2016). Cross-section location shown in figure 4. Topographic data were collected using the North American Datum of 1983, Universal Transverse Mercator zone 12 north coordinate system. Banks are called right or left as viewed facing downstream. m3/s, cubic meter per second.
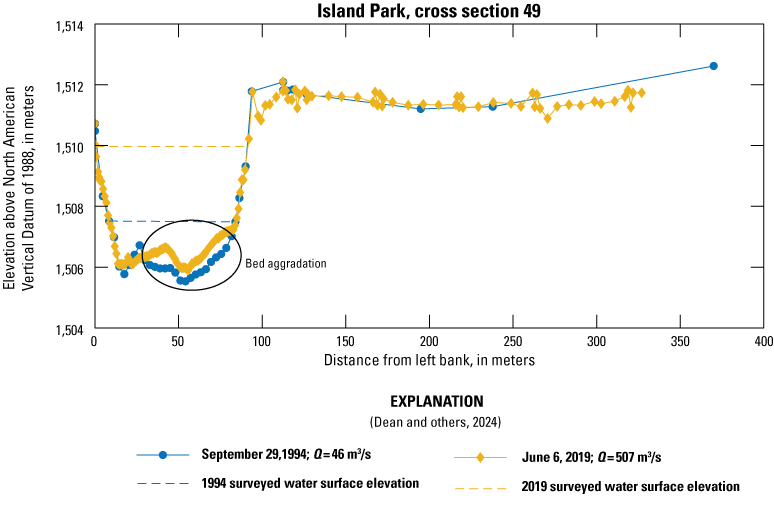
Plot of the cross section 49 measurements of the Green River in Island Park, Dinosaur National Monument, Utah. Discharges (Q) are the daily mean discharges measured at the U.S. Geological Survey (USGS) gaging station 09261000 for the Green River near Jensen, Utah (USGS, 2016). Cross-section location shown in figure 4. Topographic data were collected using the North American Datum of 1983, Universal Transverse Mercator zone 12 north coordinate system. Banks are called right or left as viewed facing downstream. m3/s, cubic meter per second.
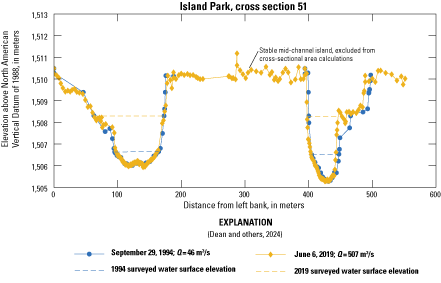
Plot of the cross section 51 measurements of the Green River in Island Park, Dinosaur National Monument, Utah. Discharges (Q) are the daily mean discharges measured at the U.S. Geological Survey (USGS) gaging station 09261000 for the Green River near Jensen, Utah (USGS, 2016). Cross-section location shown in figure 4. Topographic data were collected using the North American Datum of 1983, Universal Transverse Mercator zone 12 north coordinate system. Banks are called right or left as viewed facing downstream. m3/s, cubic meter per second.
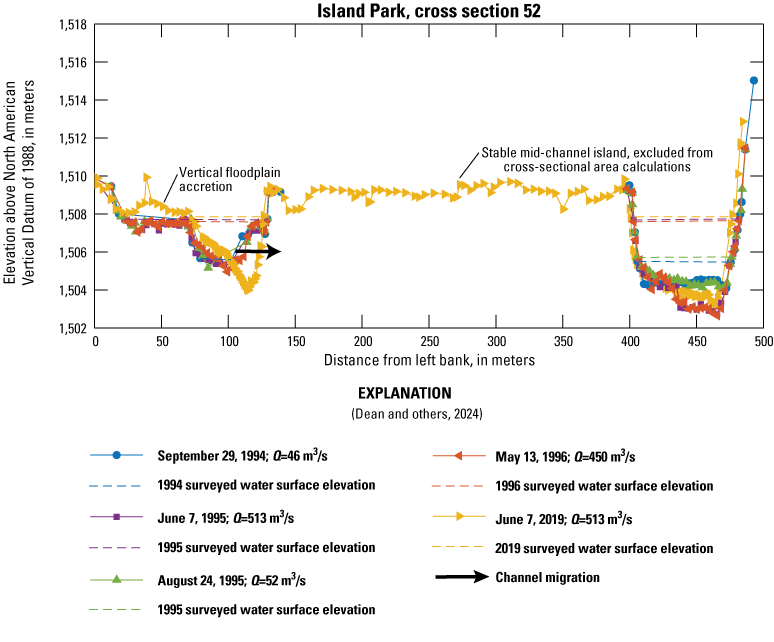
Plot of the cross section 52 measurements of the Green River in Island Park, Dinosaur National Monument, Utah. Discharges (Q) are the daily mean discharges measured at the U.S. Geological Survey (USGS) gaging station 09261000 for the Green River near Jensen, Utah (USGS, 2016). Cross-section location shown in figure 4. Topographic data were collected using the North American Datum of 1983, Universal Transverse Mercator zone 12 north coordinate system. Banks are called right or left as viewed facing downstream. m3/s, cubic meter per second.

Plot of the cross section 54 measurements of the Green River in Rainbow Park, Dinosaur National Monument, Utah. Discharges (Q) are the daily mean discharges measured at the U.S. Geological Survey (USGS) gaging station 09261000 for the Green River near Jensen, Utah (USGS, 2016). Cross-section location shown in figure 4. Topographic data were collected using the North American Datum of 1983, Universal Transverse Mercator zone 12 north coordinate system. Banks are called right or left as viewed facing downstream. m3/s, cubic meter per second.

Plot of the cross section 55 measurements of the Green River in Rainbow Park, Dinosaur National Monument, Utah. Discharges (Q) are the daily mean discharges measured at the U.S. Geological Survey (USGS) gaging station 09261000 for the Green River near Jensen, Utah (USGS, 2016). Cross-section location shown in figure 4. Topographic data were collected using the North American Datum of 1983, Universal Transverse Mercator zone 12 north coordinate system. Banks are called right or left as viewed facing downstream. m3/s, cubic meter per second.

Plot of the cross section 56 measurements of the Green River in Rainbow Park, Dinosaur National Monument, Utah. Discharges (Q) are the daily mean discharges measured at the U.S. Geological Survey (USGS) gaging station 09261000 for the Green River near Jensen, Utah (USGS, 2016). Cross-section location shown in figure 4. Topographic data were collected using the North American Datum of 1983, Universal Transverse Mercator zone 12 north coordinate system. Banks are called right or left as viewed facing downstream. m3/s, cubic meter per second.
References Cited
Dean, D.J., Grams, P.E., Griffiths, R.E., Unema, J.A., Sartain, S.L., and Topping, D.J., 2024, Channel and floodplain cross-section and bed-elevation data for the Green River in Echo, Island, and Rainbow Parks, Dinosaur National Monument, Colorado and Utah: U.S. Geological Survey data release, https://doi.org/10.5066/P13MZCVJ.
Gessler, D., and Moser, E., 2001, Two-dimensional computer modeling of Green River at Dinosaur National Monument and Canyonlands National Park: Fort Collins, Colo., National Park Service Water Resources Division Water Rights Branch, 63 p. [Also available at http://www.riversimulator.org/Resources/NPS/Canyonlands/ModelingGreenRiverFloodplain.pdf.]
Grams, P.E., and Schmidt, J.C., 2002, Streamflow regulation and multi-level flood plain formation—Channel narrowing on the aggrading Green River in the eastern Unita Mountains, Colorado and Utah: Geomorphology, v. 44, no. 3–4, p. 337–360, accessed December 2, 2010, at https://doi.org/10.1016/S0169-555X(01)00182-9.
U.S. Geological Survey [USGS], 2016, USGS water data for the Nation: U.S. Geological Survey National Water Information System database, accessed June 16, 2023, at https://doi.org/10.5066/F7P55KJN.
Conversion Factors
U.S. customary units to International System of Units
International System of Units to U.S. customary units
Datum
Horizontal coordinate information is referenced to the 2011 adjustment of the North American Datum of 1983 (NAD 83).
Vertical coordinate information is referenced to the North American Vertical Datum of 1988 (NAVD 88) using the Geoid 18 model.
Supplemental Information
River kilometers (rkm) are measured downstream from Flaming Gorge Dam, Utah.
Banks are called left or right as viewed facing downstream; left and right channels, respectively, refer to the channels to the left and right of mid-channel islands.
Abbreviations
ADCP
acoustic-Doppler current profiler
D50
median grain size
DEM
digital elevation model
DINO
Dinosaur National Monument
GNSS
global navigation satellite system
GPS
Global Positioning System
NAD 83
North American Datum of 1983
NAVD 88
North American Vertical Datum of 1988
p
level of significance
ϕ
phi unit of sediment grain size (D), defined as ϕ = −log2 D (Krumbein, 1934)
PVFS
percent of very fine sand
Q
water discharge
rkm
river kilometers
RTK
real-time kinematic
SBET
smoothed best estimate of boat trajectory
USGS
U.S. Geological Survey
UTM
Universal Transverse Mercator
XS
cross section
Moffett Field Publishing Service Center, California
Manuscript approved for publication July 28, 2025
Edited by Crystal Czarniecki
Layout and design by Kimber Petersen
Illustration support by Emerson Gusto
Disclaimers
Any use of trade, firm, or product names is for descriptive purposes only and does not imply endorsement by the U.S. Government.
Although this information product, for the most part, is in the public domain, it also may contain copyrighted materials as noted in the text. Permission to reproduce copyrighted items must be secured from the copyright owner.
Suggested Citation
Dean, D.J., Grams, P.E., Sartain, S.L., Leonard, C.M., Griffiths, R.E., Unema, J.A., Topping, D.J., and Schmidt, J.C., 2025, Channel and floodplain cross-section and bed-elevation analyses of the Green River in Echo, Island, and Rainbow Parks, Dinosaur National Monument, Colorado and Utah: U.S. Geological Survey Scientific Investigations Report 2025–5078, 36 p., https://doi.org/10.3133/sir20255078.
ISSN: 2328-0328 (online)
Study Area
| Publication type | Report |
|---|---|
| Publication Subtype | USGS Numbered Series |
| Title | Channel and floodplain cross-section and bed-elevation analyses of the Green River in Echo, Island, and Rainbow Parks, Dinosaur National Monument, Colorado and Utah |
| Series title | Scientific Investigations Report |
| Series number | 2025-5078 |
| DOI | 10.3133/sir20255078 |
| Publication Date | September 29, 2025 |
| Year Published | 2025 |
| Language | English |
| Publisher | U.S. Geological Survey |
| Publisher location | Reston, VA |
| Contributing office(s) | Southwest Biological Science Center |
| Description | Report: vii, 36 p.; Data Release |
| Country | United States |
| State | Colorado, Utah |
| Online Only (Y/N) | Y |