

Microbial Source Tracking in Cedar and Crane Creeks Near Curtice, Ohio, 2021
Links
- Document: Report (2.11 MB pdf) , HTML , XML
- Datasets:
- USGS National Water Information System database - USGS water data for the Nation
- USGS National Water Information System database (csv) - Data for all 12 monitoring locations
- Project Site: Ohio Water Microbiology Laboratory
- Download citation as: RIS | Dublin Core
Acknowledgments
The authors would like to thank Paul Gledhill, Christopher Riddle, Will Kiourtsis, and Kris Barnswell of the Ohio Environmental Protection Agency for providing background data and documentation, field sample collection, and feedback on this report.
Abstract
Elevated concentrations of Escherichia coli (E. coli) bacteria and signs of sewage lead to impairment of Cedar and Crane Creeks near the town of Curtice, Ohio. In 2021, the U.S. Geological Survey, in cooperation with Ohio Environmental Protection Agency, collected samples and analyzed them for concentrations of E. coli and microbial source tracking (MST) markers to help characterize the locations and sources of fecal contamination and better inform potential remediation strategies. The study included a total of 118 samples collected at 12 sites (6 on Cedar Creek and 6 on Crane Creek) from May to September 2021 during wet and dry weather conditions.
All samples were analyzed for E. coli concentrations, and human and canine-associated MST markers. A subset of samples was analyzed for MST markers associated with swine, ruminant, cattle, horse, waterfowl, and poultry. Human-origin fecal contamination was found at all sites sampled in this study and concentrations of the human-associated MST marker HF183/BacR287 were significantly correlated with E. coli concentrations. The HF183/BacR287 marker was detected in 114 of 118 samples and the detection frequency in samples at each site ranged from 90 to 100 percent. E. coli concentrations exceeded the Ohio Environmental Protection Agency’s regulatory statistical threshold (410 most probable number of E. coli per 100 milliliters) in 91 percent of samples.
These findings verified that Cedar and Crane Creeks are impaired by bacteria, and the HF183/BacR287 marker results support that human-origin fecal contamination is the dominant contributor to that impairment. The canine-associated MST marker BacCan was also prevalent in collected samples (detected in 112 of 118 samples); however, BacCan can also be detected in human waste, so it is not feasible to ascertain whether canine feces is a source of contamination in these watersheds.
Human fecal contamination was nearly uniform among sites, but the Martin Williston Road ditch effluent site along Crane Creek had a significantly higher median HF183/BacR287 concentration than the other Crane Creek sites. Results indicate that the Martin Williston Road ditch is a potential source of human-origin fecal contamination to Crane Creek. There is likely additional human fecal contamination upstream from the study area.
Introduction
In Curtice and Williston, Ohio, persistent elevated concentrations of the bacteria Escherichia coli (E. coli) in Cedar and Crane Creeks, respectively, have led to the Ohio Environmental Protection Agency (Ohio EPA) listing these two water bodies as impaired for primary contact recreation (Tetra Tech, Inc., 2012). Additionally, these two creeks are frequently the subject of public complaints due to strong odors of sewage in certain locations (Kris Barnswell, Ohio EPA, written commun., March 2024). In 2016, the Ohio EPA conducted a public health nuisance investigation in accordance with rule 3745–1–04(F) of the Ohio Administrative Code (Ohio EPA, 2024b) on Cedar Creek and Crane Creek in Lucas and Ottawa Counties, Ohio. Nuisance conditions were verified on Cedar Creek downstream from Wildacre Road in Curtice, Ohio (fig. 1; Kris Barnswell, Ohio EPA, written commun., March 2024).
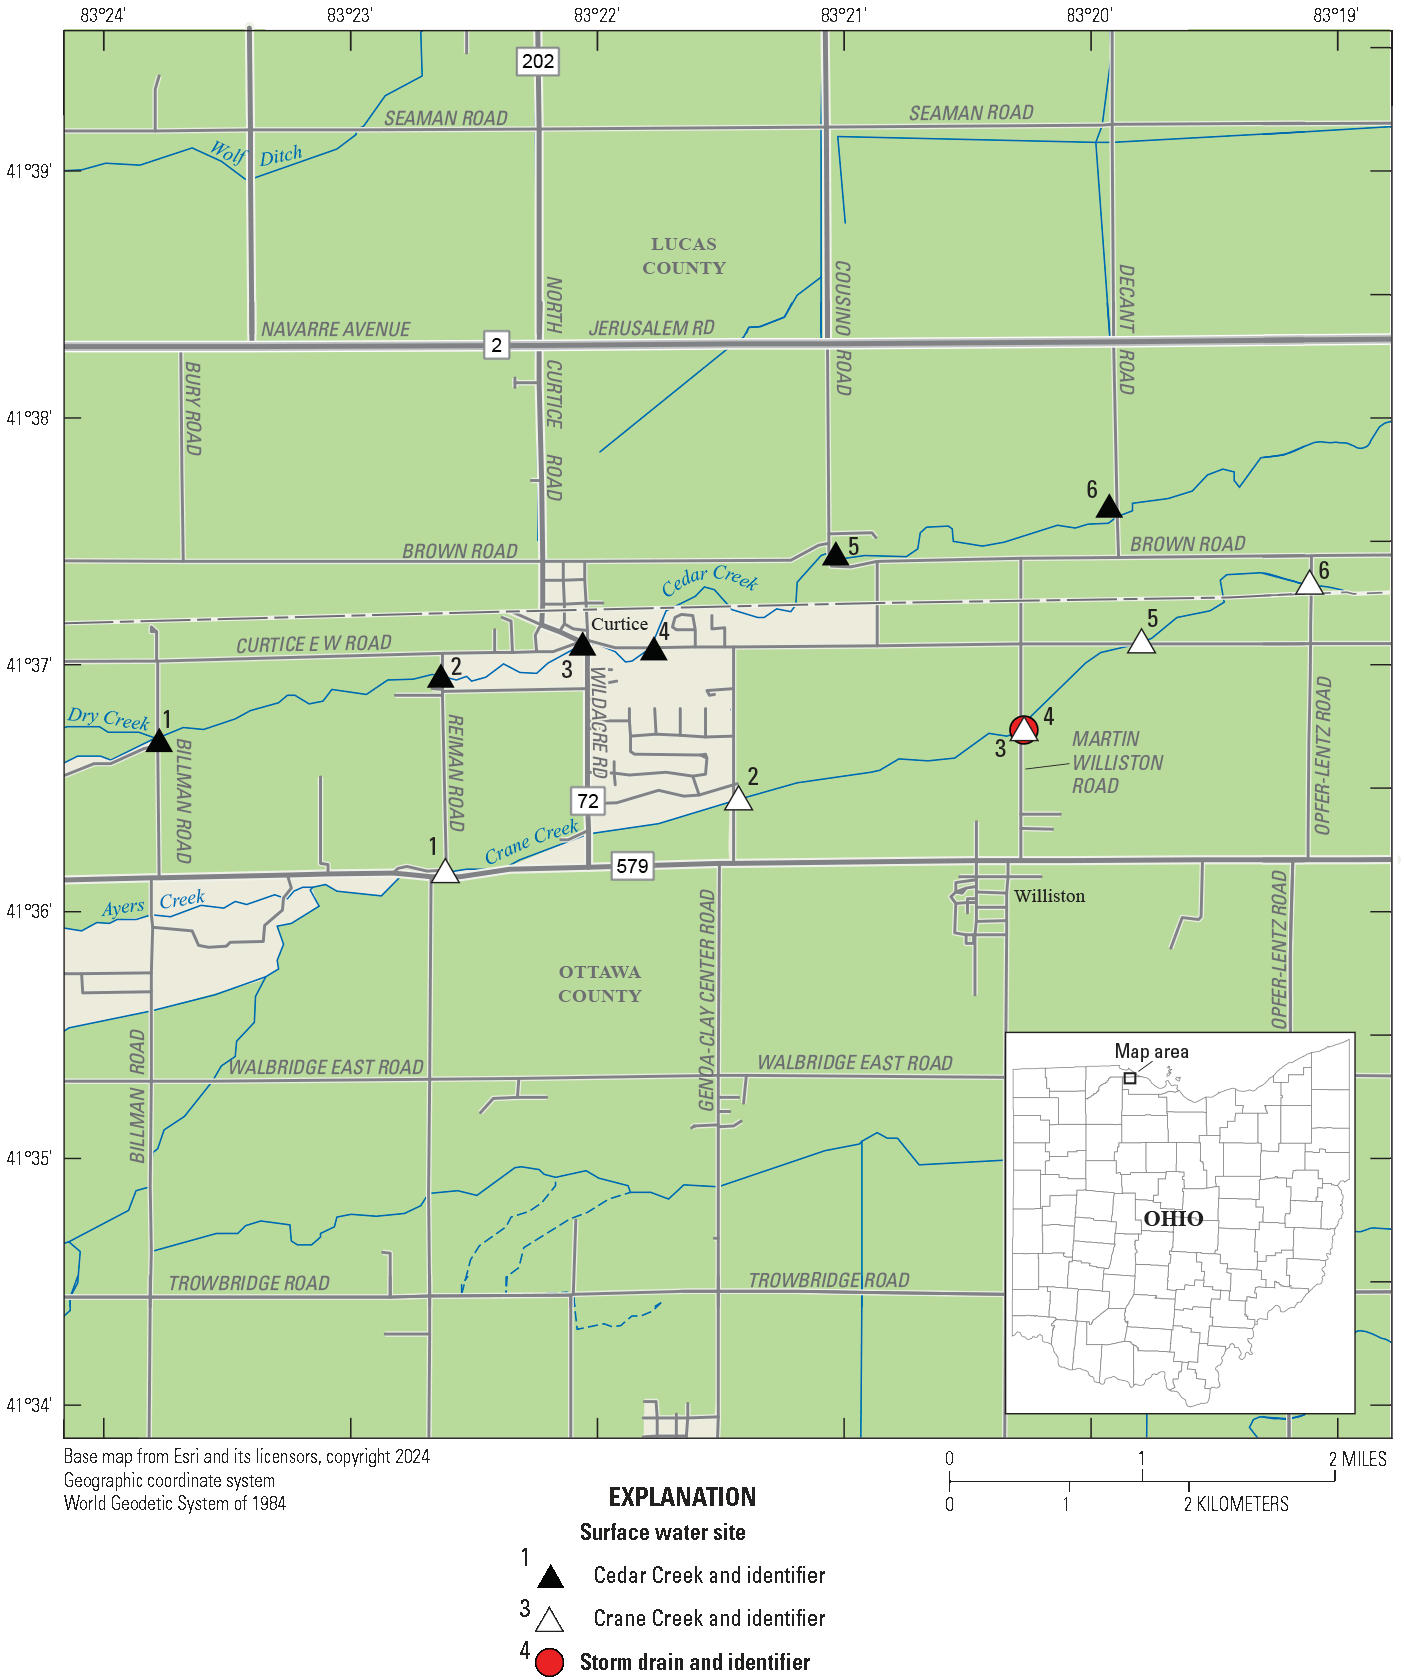
Map of study area consisting of 12 sampling sites used for microbial source tracking in Cedar and Crane Creeks, near Curtice, Ohio, 2021.
In 2017, the Ohio EPA conducted a water-quality survey that included Cedar and Crane Creeks (Ohio EPA, 2023). This survey collected chemistry, biology, sediment, and fecal indicator bacteria data in the watersheds. Evaluations of these streams included sampling at two locations upstream from where the 2016 nuisance investigation occurred. Sampling downstream from the nuisance investigation area was limited to biological sampling only because of the lacustuary zone (mixing of stream and Lake Erie water). Results from this survey indicated that the nuisance conditions could be caused by the presence of sewage in Cedar and Crane Creeks (Ohio EPA, 2023). There is also documented fecal bacteria concentrations (E. coli) exceeding regulatory standards under both dry and wet weather conditions (Ohio EPA, 2023). The sewage odors and E. coli survey results indicated human sources, potentially from unsewered areas, as one potential cause of these conditions. However, as suggested in the Ohio EPA water-quality survey, other sources may be contributing to the nuisance conditions and elevated fecal bacteria, such as wastewater treatment plant effluent violations, livestock waste, wildlife waste, combined sewer overflows, urban runoff, and biosolid application (Ohio EPA, 2023). An examination of the sources of fecal contamination within the Cedar and Crane Creek watersheds could help water-resource managers identify primary fecal sources, and water-resource managers may use the information to improve focus areas for remediation efforts.
Exposure to microbiological pathogens from human or animal feces poses a major human health risk. Water-quality criteria and standards to protect the public from exposure to microbiological contaminants are based on fecal indicator bacteria such as E. coli, but these bacteria are common to all warm-blooded animals, and thus, do not provide information about the source of the contamination. Microbial source tracking (MST) refers to a group of methods and strategies that can be used to help characterize the dominant sources of fecal contamination in a water body. (Santo Domingo and others, 2007). The detection of fecal source-associated genetic markers in the aquatic environment from MST can help reveal the timing and area of fecal contamination in a watershed.
To better understand the sources of fecal contamination in Cedar and Crane Creeks, the U.S. Geological Survey (USGS), in cooperation with the Ohio EPA, monitored 12 sites on Cedar and Crane Creeks during the recreational season of 2021 (May through September). A total of 118 water samples were evaluated for the magnitude of E. coli and source-associated MST markers. All samples were evaluated for MST markers associated with human and canine sources and a subset of samples were evaluated for MST markers associated with swine, ruminant, cattle, horse, waterfowl, and poultry sources. Samples were also collected and analyzed for nutrients including ammonia, total Kjeldahl nitrogen, nitrate plus nitrite, nitrite, total phosphorus, and phosphate. Nutrient and E. coli samples were collected and analyzed by Ohio EPA. At the time of publication, nutrient and E. coli data were not publicly available from the Ohio EPA.
Study Area and Site Descriptions
Cedar and Crane Creeks are tributaries to Lake Erie that respectively flow through the towns of Curtice in Lucas County and just north of Williston in Ottawa County, Ohio (fig. 1). Drainage areas for Cedar and Crane Creeks are about 58 and 56 square miles, respectively. (Tetra Tech, Inc., 2012). These waterways have a beneficial use designation of warmwater habitat for aquatic life (Tetra Tech, Inc., 2012). The creeks are used for agricultural and industrial water supplies and are assigned as primary contact recreation by the Ohio EPA (waters that, during the recreation season, are suitable for one or more full-body contact recreation activities such as, but not limited to, wading, swimming, boating, water skiing, canoeing, kayaking, and scuba diving; Tetra Tech, Inc., 2012). Based on 2006 data for Cedar and Crane Creeks, along with several other surrounding Lake Erie tributaries, land use in these watersheds is dominated by cultivated cropland (64 percent), low-intensity development (10 percent), and emergent herbaceous wetlands (8 percent; Tetra Tech, Inc., 2012).
Sampling was done at 12 sites (table 1) as part of this study: 6 Cedar Creek sites and 6 Crane Creek sites. The study area (fig. 1) includes Cedar Creek from river mile 9.59 (Billman Road) to river mile 5.56 (Decant Road) and Crane Creek from river mile 10.98 (Reiman Road) to river mile 7.45 (Opfer-Lentz Road). A river mile is the curvilinear distance, in miles, measured upstream from the mouth of the stream along the path of the stream channel.
Table 1.
Site information for 12 sites used for microbial source tracking in Cedar and Crane Creeks, Ohio, 2021.[Data are from U.S. Geological Survey (USGS; 2025). Coordinates are referenced to the North American Datum of 1983. Site names appear as written in the USGS National Water Information System (USGS, 2025). Ohio EPA, Ohio Environmental Protection Agency; OH, Ohio; Rd, Road; nr, near]
Methods
This section describes the general procedures for environmental and quality-control sample collection and laboratory analytical methods. Data availability and analysis also are described.
Sample Collection and Ancillary Data Compilation
Ohio EPA personnel collected samples on 10 sampling dates from May to September 2021. Samples for MST marker analysis were collected into bleach-sterilized, 1-liter polypropylene bottles. Samples for E. coli analysis were collected into sterile, 125-milliliter (mL) polypropylene bottles. All sampling sites were in the center of the stream channel except the Martin Williston Road ditch effluent site, where stormwater runoff from a roadside ditch flows through a pipe that discharges into Crane Creek. Samples for this site were collected directly from the pipe. Samples were not collected at the Martin Williston Road ditch effluent site on July 8, 2021, or August 26, 2021, because Crane Creek water levels were at or near the top of the pipe. Stream samples were collected using the hand-dip grab method as described in the USGS National Field Manual Section 7.1.2.A (Myers and others, 2007). All samples were placed immediately on ice and shielded from light exposure. Samples that were collected for MST analysis were transported to the USGS Ohio Water Microbiology Laboratory in Columbus, Ohio. Samples collected for E. coli analysis were transported to Jones & Henry Laboratories Inc. in Northwood, Ohio.
Precipitation data were obtained from a National Weather Service station at Toledo Executive Airport (Weather Bureau Army Navy station 04848) by accessing the historical data from the National Oceanic and Atmospheric Administration (2025). Daily rainfall amounts were tabulated, and the sum of the 72-hour rainfall amount antecedent to the time of sampling was calculated for each sample. Samples that were collected when the sum of the previous 72 hours of rainfall at Toledo Executive Airport was greater than 0.5 inch were classified as wet-weather samples, whereas samples that were collected when the previous 72 hours of rainfall at the airport was 0.5 inch or less were classified as dry-weather samples. Table 2 contains the sampling dates along with the weather condition and 72-hour antecedent rainfall.
Table 2.
Sampling schedule, precipitation conditions, and fecal sources evaluated for microbial source tracking in Cedar and Crane Creeks, near Curtice, Ohio.[Precipitation data from National Oceanic and Atmospheric Administration (2025) at Toledo Executive Airport, station identifier WBAN:04848]
Laboratory Analytical Methods
The laboratory methods used to analyze samples are described in the subsequent sections.
Escherichia coli Analysis
All E. coli samples were processed by Jones & Henry Laboratories Inc. within 6 hours of collection by use of the Colilert-18 test kit (IDEXX Laboratories, Inc.) and following Standard Method 9223 (Best and others, 2016). E. coli results are reported as most probable number (MPN) per 100 milliliters of sample (MPN/100 mL).
Microbial Source Tracking Marker Analysis
Following are the methods of the MST analysis and quality controls in the order of procedure.
Sample Filtration and Deoxyribonucleic Acid (DNA) Extraction
Water samples were transported to the Ohio Water Microbiology Laboratory, and within 24 hours of sample collection, a matrix-dependent volume (up to 100 mL) was filtered through a 47-millimeter, 0.4-micrometer polycarbonate filter (Whatman brand supplied by Cytiva). Filters were then folded aseptically and put into 2-mL screw-cap vials containing approximately 0.3 grams of acid-washed glass beads (supplied from Sigma-Aldrich). Each day that samples were processed, a negative control, also known as a method blank, was processed by filtering 100 mL of sterile phosphate buffered water. After being filtered, samples were stored at −70 degrees Celsius (°C) until analysis.
Deoxyribonucleic acid (DNA) was extracted from thawed filtered samples using GeneRite's DNA-EZ extraction kit. Apart from not using a prefilter, the extraction was carried out in accordance with the manufacturer's instructions. Each batch of extractions included the processing of two negative extraction controls, also known as extraction blanks, which are 2-mL vials containing only acid-washed glass beads. After extraction, DNA extracts were kept at 4 °C for up to seven days before analysis by quantitative polymerase chain reaction (qPCR).
Quantitative Polymerase Chain Reaction (qPCR) Analysis
All sample extracts underwent qPCR for detection and quantification of the human-associated Bacteroides marker (HF183/BacR287, hereafter referred to as “human marker;” Bernhard and Field, 2000; Green and others, 2014a) and the canine-associated Bacteroides marker (BacCan, hereafter referred to as “canine marker;” Kildare and others, 2007). A subset of sample extracts (3 of the 10 sampling events; table 2) was additionally analyzed for the following:
-
• the swine-associated Bacteroides marker (Pig1Bac; Mieszkin and others, 2009),
-
• ruminant-associated Bacteroides marker (Rum2Bac, which would target ruminants such as deer, sheep, and cattle; Mieszkin and others, 2010),
-
• cattle-associated Bacteroides marker (CowM2; Shanks and others, 2008),
-
• horse-associated Bacteroides marker (HorBac; Tambalo and others, 2012b),
-
• waterfowl-associated Helicobacter marker (GFD, which would target birds such as Canada geese, gulls, ducks, and chickens; Green and others, 2012), and
-
• poultry-associated Brevibacterium marker (CL; Ryu and others, 2014).
Standard Curves and Quantification
Plasmids are pieces of DNA in bacteria that are not part of chromosomes. Plasmids containing the sequences for each of the targeted MST marker genes were used to create known concentrations of each targeted MST marker. These positive controls were then serially diluted and analyzed with each qPCR run as seven-point standard curves and used as the spiking material for the matrix spike analyses (Francy and Stelzer, 2012). By interpolating from these standard curves, the qPCR results were converted to MST marker concentrations in number of copies per 100 milliliters (copies/100 mL).
Each standard curve that was run was assessed for acceptable criteria in terms of amplification efficiency and coefficient of determination. The slope of the log-linear component of the standard curve is used to compute amplification efficiency; specifically, qPCR efficiency = (10−1/slope)−1. An amplification efficiency of 100 percent means an exact doubling of the target DNA sequence throughout the polymerase chain reaction, and thus an accurate quantification of the target in the sample. A typical range of efficiency that is acceptable is 90 to 100 percent (Bustin and others, 2009). In this study, each standard curve was determined to have an acceptable efficiency except for the waterfowl marker, GFD. This standard curve had a lower than acceptable efficiency of 77.62 percent. Samples were not reanalyzed for the GFD marker despite this low amplification efficiency because no water samples had detectable levels of this marker. The coefficient of determination for the standard curve was used to assess the fit of the linear regression line to the curve data points. The closer the coefficient of determination is to 1, the better the fit and better predictor qPCR results are of target concentrations (Bustin and others, 2009). Each standard curve run had an acceptable coefficient of determination.
The limit of blanks (LoB), limit of detection (LoD), and limit of quantification (LoQ) were established for each assay to characterize the lowest concentration of each MST marker that could be consistently detected and quantified and to assist in the interpretation of qPCR data. Methods used to establish these limits are based on Forootan and others (2017) and are summarized in the following paragraphs.
The LoDs were determined by examining at least 10 replicates each of various dilutions of a positive control. The LoD is the lowest concentration of a marker that can be detected with at least 95 percent confidence that it is a true detection and distinct from the results of a blank sample.
The LoQ is the lowest concentration of each MST marker that can be measured accurately. The LoQ was calculated by examining at least 10 replicates, each of various dilutions of a positive control. The dilution with the lowest concentration that has a coefficient of variation below 35 percent and a standard deviation at or below 0.5 was selected and the LoQ was calculated according to Forootan and others (2017).
The LoB is the lowest concentration that can be reported with a 95 percent confidence that it is greater than the concentration of the blanks. The LoB was determined for each qPCR run based on the results from negative filtration controls, negative extraction controls, and no-template controls. If the LoB was greater than the LoD, the LoB would be used instead of the LoD in the reporting of results. The LoB was never greater than the LoD for any of the analyses.
Sample results are designated as an estimate if the concentration is lower than the LoQ but higher than the LoD. Results are reported as less than the sample reporting limit if the MST marker was not found in a sample or if the concentration was less than the LoD. The LoD was used to determine the sample reporting limit, which is unique to each sample and is based on the dilution being analyzed and the initial sample volume that was filtered.
Quality Assurance and Quality Control
Quality-control samples were collected to ensure that measured values were consistent and that field and laboratory analyses were not potentially affected by contamination. Replicate sample sets were collected by sequential grab samples of water that were processed and analyzed normally. Field blank samples were collected by pouring sterile phosphate buffer solution into sample collection bottles at the field sites and then processed normally.
Two field blanks and three replicates were collected to assess quality control for MST analyses through the entire process, beginning with sample collection. Additionally, various negative control samples were included to assess the potential for bias from contamination during different phases of the laboratory analytical process for MST markers. These negative controls included the analysis of 10 method blanks, 10 extraction blanks, and the 19 qPCR blanks. The qPCR analysis was done in duplicate for each sample.
Variability among field replicate pairs was assessed by calculating the absolute value log10 difference (AVLD) for the human and canine MST marker concentrations (Francy and others, 2011). The AVLD ranges varied by MST marker: 0.01–0.10 for a human marker and 0.01–0.06 for a canine marker (table 3). The concentration for one sample from one of the replicate pairs analyzed for the human marker was below the detection limit, therefore, the AVLD could not be calculated for that replicate pair collected on August 5, 2021. None of the results from the negative control analyses required adjustment of established limits of detection or quantification. Additionally, none of the qPCR matrix spikes demonstrated inhibitory matrix effects on the analysis.
Table 3.
Quality-control sequential replicate data for microbial source tracking markers, Cedar Creek and Crane Creeks, near Curtice, Ohio, 2021.[Site names appear as written in the U.S. Geological Survey (USGS) National Water Information System (USGS, 2025). The absolute value log10 difference (AVLD) is between replicates A and B; microbial source tracking markers are reported in copies per 100 milliliters. HF183/BacR287, human-associated Bacteroides marker; BacCan, canine-associated Bacteroides marker; OH, Ohio; Rd, road; nr, near; <, less than; —, could not be calculated]
Data Availability and Analysis
MST marker data from this study are publicly available at the USGS National Water Information System website (USGS, 2025) by entering the USGS station identification listed in table 1 and selecting “Site Information” and then “Site Number” on the web page. At the time of publication, E. coli data are not currently publicly available from Ohio EPA. Contact Ohio EPA to request the E. coli data.
Results from E. coli and MST marker analyses are described in terms of percent detection and magnitude for each site. Nonparametric statistical methods were used to determine if there were statistically significant relations between constituent concentrations and differences in constituent concentrations between sites and between wet-weather and dry-weather sampling conditions (Helsel and others, 2020). Specifically, the Kendall rank correlation coefficient was calculated to measure monotonic relations between constituent concentrations; the Kruskal-Wallis test was used to determine if there were statistically significant differences in constituent concentrations among sites, followed by the “Wilcoxon Each Pair” test (in JMP, equivalent to the Wilcoxon rank-sum test) to determine which sites were significantly different from one another, if any; and the Peto-Prentice test was used to determine if there were significant differences between constituent concentrations collected during dry- and wet-weather conditions (Helsel, 2005). For these nonparametric analyses, all concentrations less than the limit of detection for a constituent were assigned the same value that was less than all reported concentrations, so that ranks of values less than the highest reporting level were tied, yet less than the rank for the lowest measured concentration. All statistical analyses were completed in JMP version 17.2 (JMP Statistical Discovery LLC, 1989) or the R statistical computing environment (R Core Team, 2025), specifically, the NADA (Lee, 2020) and NADA2 (Julian and Helsel, 2021) packages. A significance level (alpha value) of 0.05 was used for all statistical tests. The significance level is the probability (p value) of incorrectly rejecting the null hypothesis.
Results
Microbial source tracking and E. coli results from samples collected along Cedar and Crane Creeks are presented here in the context of site and sampling conditions (dry or wet weather). Based on the distribution analysis of the rainfall data (National Oceanic and Atmospheric Administration, 2025), classification of sampling events resulted in 4 of the 10 sampling dates being classified as wet weather and 6 of the 10 sampling dates being classified as dry weather (table 2).
In three sampling events, samples were tested for all eight investigated sources of fecal contamination: swine, ruminants, cattle, horses, waterfowl, poultry, humans, and canines (table 2). Among these three sampling events, one of them was during wet-weather conditions. Fecal contamination from swine, ruminants, cattle, horses, waterfowl, and poultry was not detected above the assay LoD in any of the samples from these three dates (U.S. Geological Survey, 2025). In these three sampling events, fecal contamination from humans and canines was detected, and the two MST markers associated with those sources (HF183/BacR287 and BacCan) were analyzed in all samples collected in this study.
All data for the human and canine MST markers from each site are presented in boxplots (fig. 2); and the same data are categorized into dry- and wet-weather conditions for each stream (fig. 3).
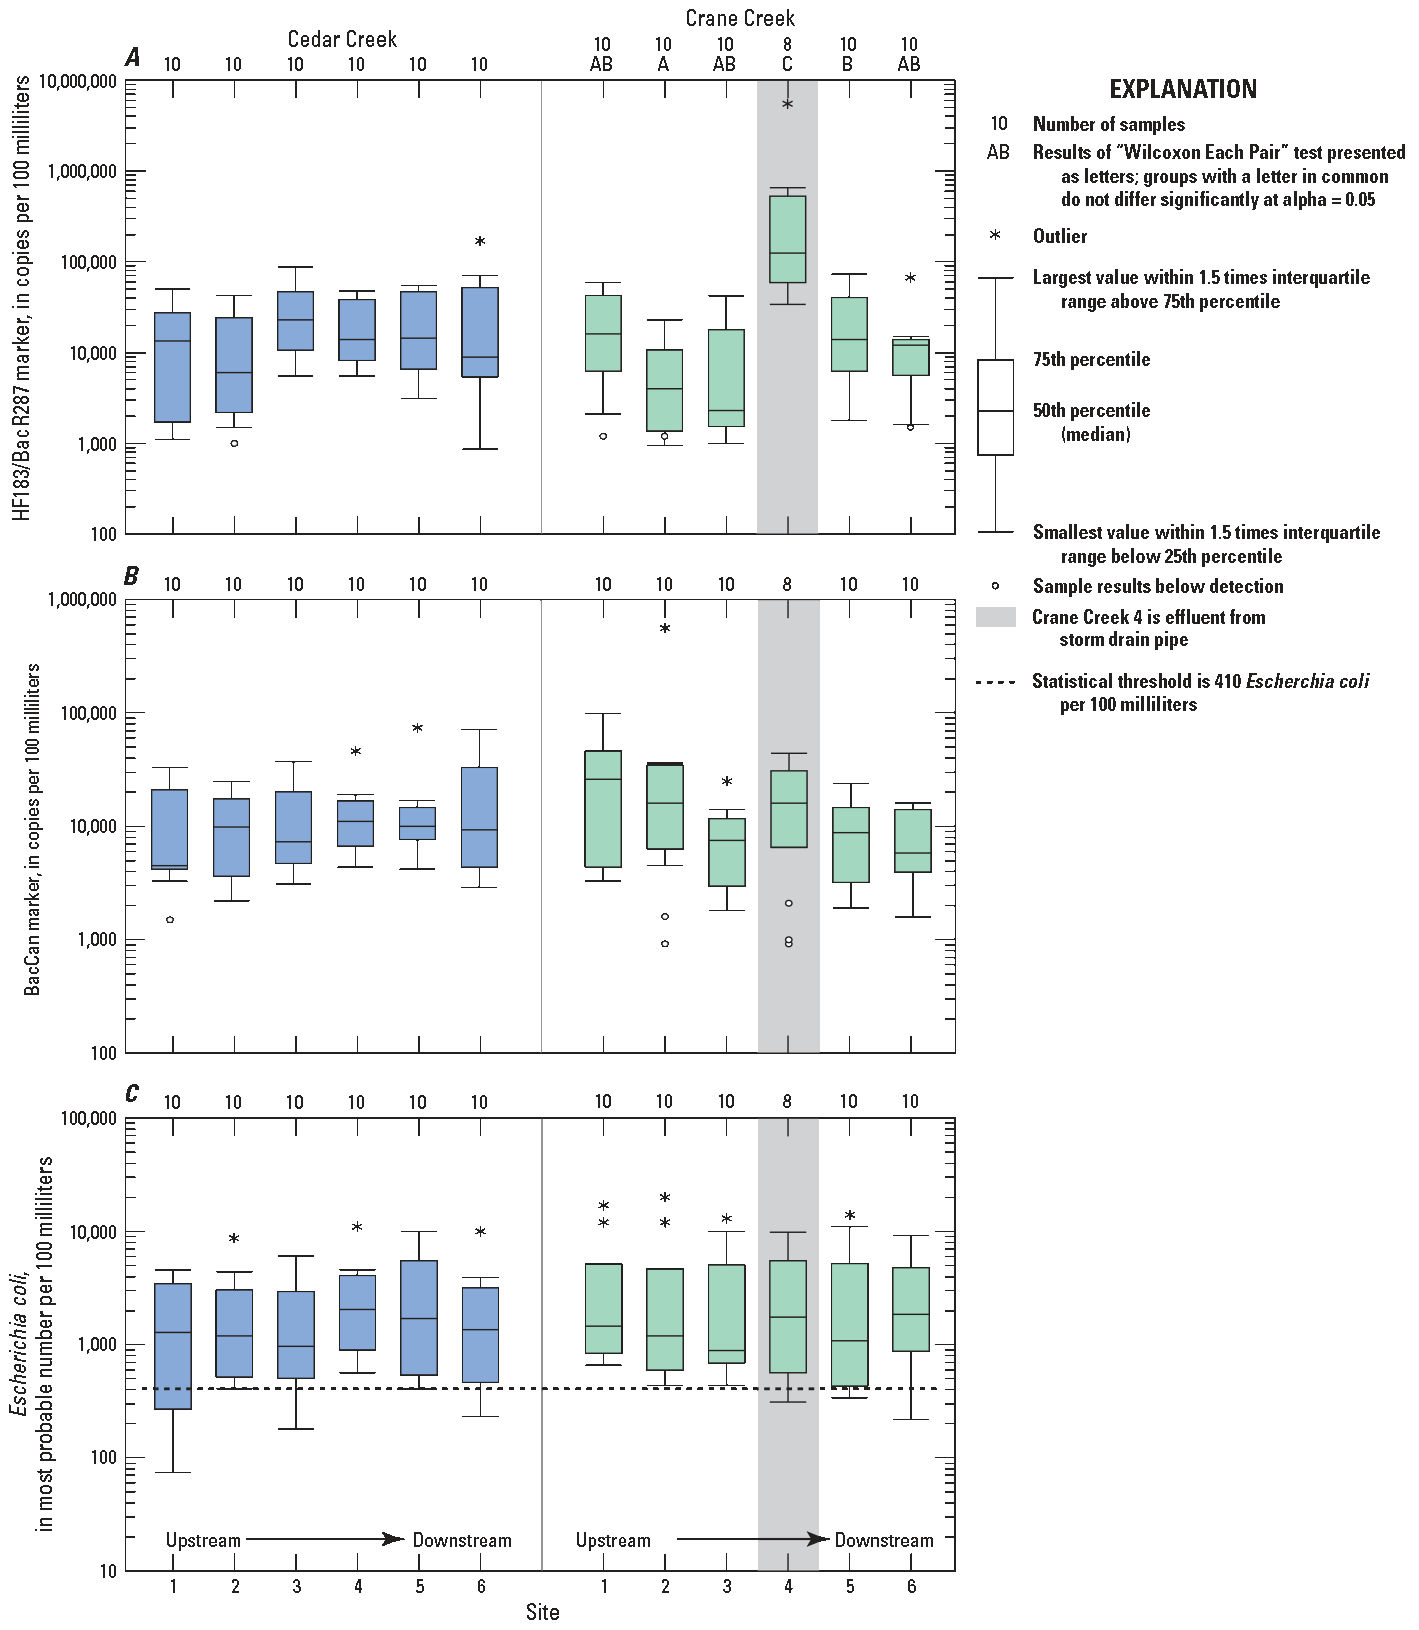
Boxplots showing concentrations of constituents for samples at Cedar Creek and Crane Creek, near Curtice, Ohio, May 4 through September 16, 2021. A, Human HF183/BacR287 marker, B, Canine BacCan marker, and C, Escherichia coli. Data from U.S. Geological Survey (2025). At the time of publication, E. coli data are not publicly available from the Ohio Environmental Protection Agency. The "Wilcoxon Each Pair" test in the software JMP (JMP Statistical Discovery LLC, 1989) is equivalent to the Wilcoxon rank-sum test.
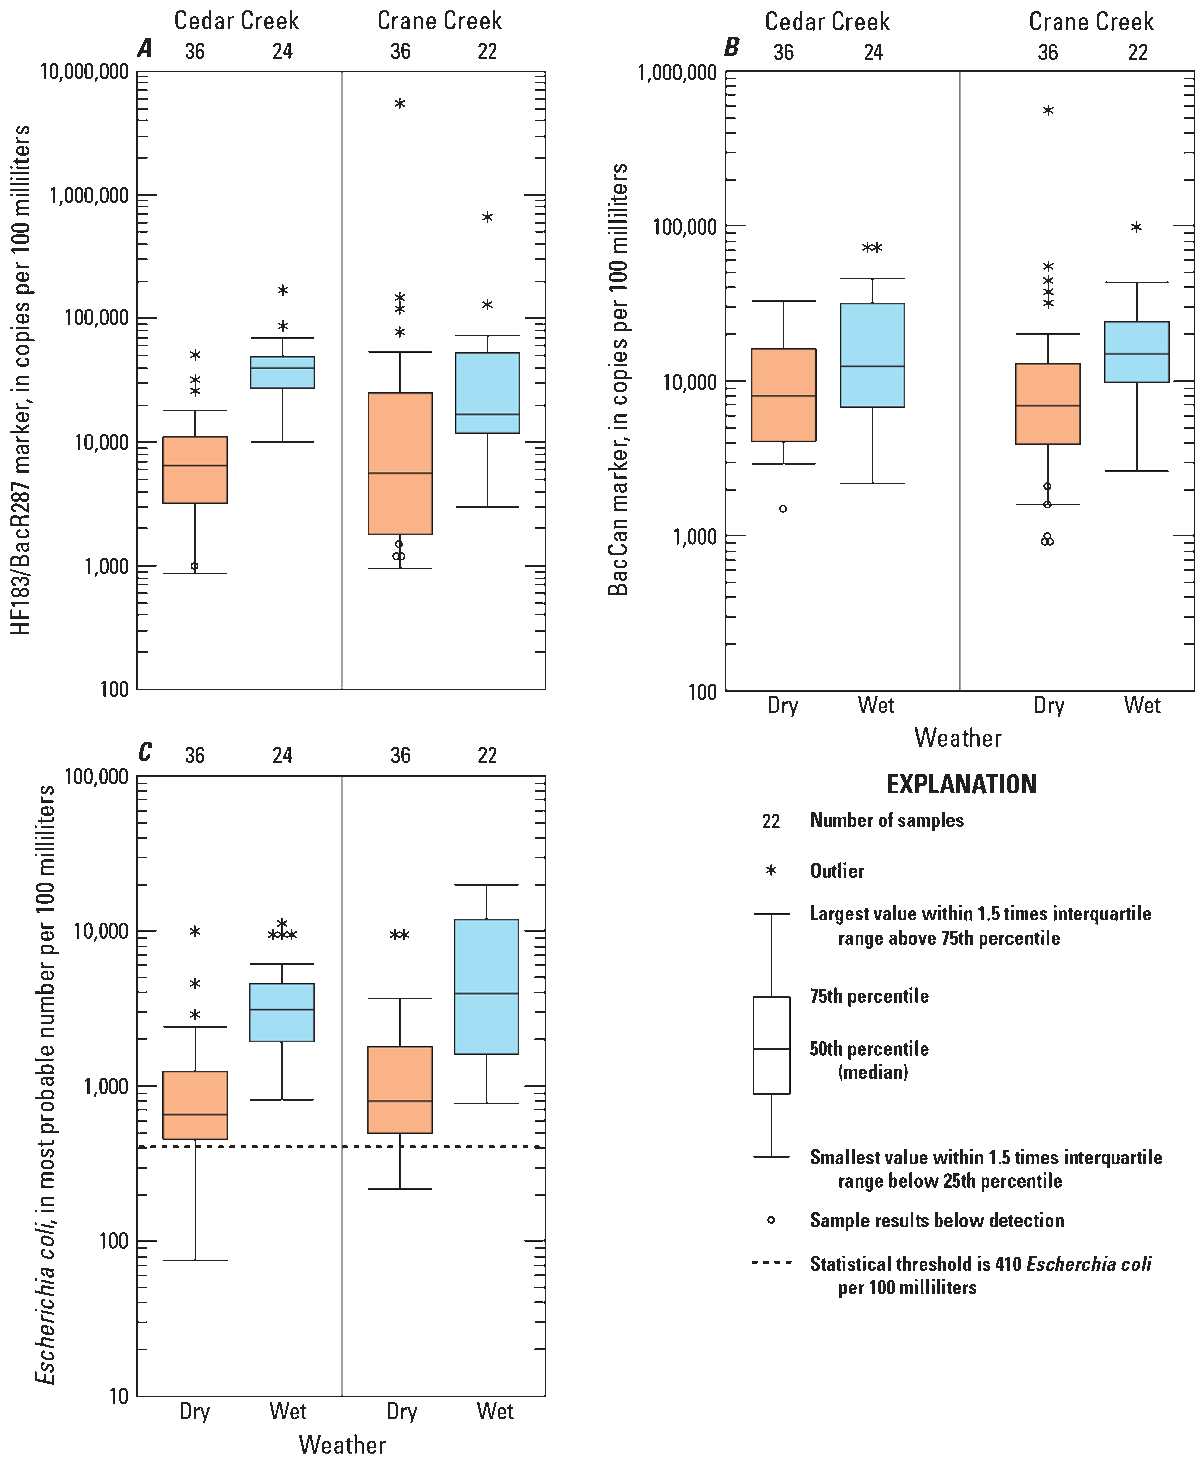
Boxplots showing concentrations of constituents for samples collected during dry- and wet-weather sampling conditions at Cedar Creek and Crane Creek near Curtice, Ohio, May 4 through September 16, 2021. A, Human HF183/BacR287 marker, B, Canine BacCan marker, and C, Escherichia coli. Data from U.S. Geological Survey (2025). At the time of publication, E. coli data are not publicly available from the Ohio Environmental Protection Agency.
The human and canine MST markers were prevalent in samples collected for this study (figs. 2 and 3; summary data presented in table 4). The human marker was detected in 114 of 118 samples and percent detection among sites ranged from 90 to 100 percent. The canine marker was detected in 112 of 118 samples and percent detection among sites ranged from 62 to 100 percent. Among the 114 detections of the human marker, 32 were qualified as estimates based on concentrations being below the LoQ (28 percent); whereas among the 112 detections of the canine marker, 58 were qualified as estimates based on concentrations being below the LoQ (52 percent).
Elevated E. coli concentrations were persistent in samples collected for this study (figs. 2 and 3; table 4). For all samples collected, E. coli concentrations ranged from 75 to 20,000 MPN/100 mL. Median concentrations of E. coli at each site ranged from 880 to 2,000 MPN/100 mL. Results of Kendall rank correlation coefficient analysis indicate that within each creek, log concentrations of E. coli positively correlate with log concentrations of the human marker (Cedar Creek Kendall rank correlation is 0.48, and significant with a p value of less than 0.0001; Crane Creek Kendall rank correlation is 0.3, and significant with a p value of 0.0009).
Table 4.
Summary of microbial source tracking and Escherichia coli data for Cedar Creek and Crane Creek near Curtice, Ohio, 2021.[Microbial source tracking marker data are from U.S. Geological Survey (USGS), 2025. At the time of publication, E. coli data are not publicly available from the Ohio Environmental Protection Agency. MST, microbial source tracking; MST markers are reported in copies per 100 milliliters; HF183/BacR287, human-associated Bacteroides marker; BacCan, canine-associated Bacteroides marker; E. coli concentration results are reported in most probable number per 100 milliliters of sample (MPN/100 mL)]
Results of the Kruskal-Wallis test indicate that the distribution of concentrations of the human marker, the canine marker, and E. coli are not statistically significantly different among sites in Cedar Creek. However, results from the same test in Crane Creek indicate that, for the human marker, the distribution of concentrations of the human marker are significantly different. Results of the “Wilcoxon Each Pair” test indicate that at the Martin Williston Road ditch effluent site (Crane Creek site 4), human marker concentrations are significantly higher than at other sites (p value 0.0002). The median human marker concentration at Crane Creek site 4 was 120,000 copies/100 mL; median concentrations at the other five sites on Crane Creek ranged from 2,300 to 16,000 copies/100 mL. Additionally, results from the “Wilcoxon Each Pair” test indicate that the distribution of human marker concentrations at Crane Creek at Curtice E W Rd. (Crane Creek site 5) are significantly higher than at Crane Creek at Genoa-Clay Rd. (Crane Creek site 2). Results of the Kruskal-Wallis test for differences in the distribution of concentrations of the canine marker (p value 0.25) and E. coli (p value 0.95) are not significantly different for sites in Crane Creek.
Results of the Peto-Prentice test (Helsel, 2005) indicate that human marker, canine marker, and E. coli concentrations are significantly greater in both Cedar and Crane Creeks when collected during wet-weather than when collected during dry-weather conditions (fig. 3). Median concentrations at each site during wet-weather and during dry-weather conditions are listed in table 4.
Discussion
Following the analysis of results from the three sampling events (May 4, June 9, and June 30, 2021) that evaluated eight MST markers from various animal sources, it was found that only human and canine markers were detected above the limit of detection. Consequently, the remainder of the study concentrated solely on these two markers (refer to table 2 for sampling dates and evaluated MST sources). The absence of MST markers associated with swine, ruminants, cattle, horses, waterfowl, and poultry in all of the 36 samples collected during the three sampling events does not prove that fecal contamination from these animals is absent, but it does indicate that these sources are unlikely to be the primary contributors of the elevated E. coli concentrations and nuisance conditions observed in these watersheds. Therefore, efforts to reduce fecal contamination from swine, ruminants, cattle, horses, waterfowl, and poultry may not lead to a decrease of E. coli concentrations or nuisance conditions in the Cedar and Crane Creek watersheds.
Human fecal contamination was prevalent at all sites sampled in this study and was greater during wet-weather conditions than when compared to dry-weather conditions. This finding, along with persistently elevated E. coli concentrations, corroborated prior evidence of nuisance conditions based on observations of sewage odors and high E. coli concentrations (Kris Barnswell, Ohio EPA, written commun., March 2024; Tetra Tech, Inc., 2012; and Ohio EPA, 2023). In Cedar Creek, although human fecal contamination was detected at all sites, differences in concentrations among the sites were not significant. In contrast, at the Martin Williston Road ditch effluent site on Crane Creek (site 4), the concentration of human fecal contamination was statistically significantly higher than at other Crane Creek sites. This finding indicates that while contamination was present at all sites, only the Martin Williston Road ditch drain pipe site on Crane Creek exhibited a substantial difference in contamination levels compared to the other sites. The high concentration at the Martin Williston Road ditch indicates that this site is likely a source of human fecal contamination to Crane Creek at its outfall. Aside from the Martin Williston Road ditch, the results at all other study sites indicate that human fecal contamination was nearly uniform for the reaches of these two streams during this evaluation. Elevated concentrations of the human MST marker at the most upstream sites sampled in Cedar and Crane Creeks indicate that human fecal sources may exist upstream from the study sites. Previous monitoring and these study results show that there are sources of human feces contaminating Cedar Creek and Crane Creek near Curtice.
Concentrations of the human MST marker from the Martin Williston Road ditch samples were at magnitudes that are typically seen in raw human waste sample types such as sewage or septic wastewater. Ahmed and others (2016) summarized current MST research on human fecal contamination in environmental waters that included concentration data for the HF183 marker (the predecessor MST marker from which HF183/BacR287 is based) in various types of raw human waste. The mean concentrations of the human marker in those sample types, obtained from 18 studies reporting on raw sewage and 7 on septic wastewater, were 17,000,000 and 8,000,000 copies/100 mL, respectively.
The canine and human markers were commonly detected together in this study. The canine marker was detected in 95 percent of the samples where the human marker was detected. Co-occurrence of these two markers is not unexpected, given the cohabitation of dogs and humans. Additionally, BacCan targets the same region of highly conserved gene found at high concentrations in a number of hosts (Green and others, 2014b). Previous studies have reported BacCan occurrence in human sources (known as cross-reactivity), including in human septage (Boehm and others, 2013; Schriewer and others, 2013), stool (Kildare and others, 2007; Tambalo and others, 2012a; Schriewer and others, 2013; Nshimyimana and others, 2017), and sewage (Kildare and others, 2007; Schriewer and others, 2013; Nshimyimana and others, 2017). The cross-reactivity of BacCan in human sources does not rule out canine feces as contributing to overall fecal contamination in the watershed. However, the occurrence of BacCan in human sources calls into question the predominance of canine fecal contamination, especially given the co-occurrence with human marker detections. Additionally, the frequency of low-level detections of the canine marker (52 percent below the limit of quantification) implies that canine sources of fecal contamination may be less prevalent than human sources.
E. coli is used as an indicator to determine attainment or nonattainment of recreational uses as codified in rule 3745–1–07 of the Ohio Administrative Code (Ohio EPA, 2024a). Water quality for primary contact recreation must meet a 90-day geometric mean (126 MPN/100 mL) and a statistical threshold not to be exceeded by more than 10 percent of samples taken during any 90-day period (410 MPN/100 mL). Among the 118 samples collected, 107 samples (91 percent) had E. coli concentrations exceeding 410 MPN/100 mL. Median E. coli concentrations for each site ranged from 2.1 to 4.9 times the statistical threshold of 410 MPN/100 mL.
Summary
Cedar and Crane Creeks, near the towns of Curtice in Lucas County and Williston in Ottawa County), Ohio, have been the topic of community complaints due to sewage-like odor problems and have also been listed by the Ohio Environmental Protection Agency (Ohio EPA) as impaired for recreational use because of elevated Escherichia coli (E. coli) concentrations. Because these creeks were impaired for beneficial use and presented nuisance conditions, Cedar and Crane Creeks were evaluated for potential sources of fecal contamination in the watersheds. In cooperation with the Ohio EPA, the U.S. Geological Survey conducted a study from May to September 2021 using microbial source tracking (MST) methods to characterize host fecal contamination sources. Samples were collected during 10 sampling events from 12 sites: 6 sites along Cedar Creek and 6 sites along Crane Creek. All samples were analyzed for E. coli concentrations and MST markers associated with human and canine fecal sources. A subset of samples was analyzed for swine, ruminant, cattle, horse, waterfowl, and poultry fecal sources.
Results from this study showed persistently elevated concentrations of E. coli and persistent detection of both the human- and canine-associated MST markers (HF183/BacR287 and BacCan, respectively), regardless of site or sampling conditions. There were no detections of MST markers associated with the other sources evaluated (swine, ruminant, cattle, horse, waterfowl, or poultry). Among all samples, 91 percent had E. coli concentrations exceeding the statistical threshold of 410 counts per 100 milliliters, indicating that all sites evaluated were impaired by fecal contamination and were unsuitable for recreational uses. The human marker was detected in 114 of 118 samples, and the canine marker was detected in 112 of 118 samples. Concentrations of E. coli, the human marker, and the canine marker were statistically significantly higher during wet-weather in comparison to dry-weather conditions.
This study provides support that human fecal contamination is likely the dominant source of elevated E. coli concentrations in both the Cedar Creek and Crane Creek. In addition to the prevalence of the human marker both spatially and temporally in the study area, concentrations in the Martin Williston Road ditch were at magnitudes that are typically seen in raw human waste sample types such as sewage or septic wastewater. The E. coli concentrations are significantly correlated with human marker concentrations, further supporting the potential predominance of human fecal contamination among potential sources. Although the canine marker was also persistently detected, co-occurrence issues with human sources confounds the characterization of canine waste as a dominant fecal source.
There were no statistically significant differences among MST marker or E. coli concentrations at sites in either Cedar or Crane Creek with one exception. The Martin Williston Road ditch site along Crane Creek had significantly higher human marker concentrations than the other Crane Creek sites and could be a source of human fecal contamination. The near uniformity of human fecal contamination at the other sites evaluated in this study indicates that sources may exist upstream from evaluated sites or at other locations within these reaches of Cedar and Crane Creeks. With additional data collected from more sites in the watersheds, it may be possible to more clearly identify the entry points of human fecal contamination. This study, taken in concert with previous monitoring, suggests that while further data collection might determine the location of additional human fecal contamination sources upstream, there are likely existing human fecal contamination sources to Cedar and Crane Creeks near Curtice, Ohio.
References Cited
Ahmed, W., Hughes, B., and Harwood, V.J., 2016, Current status of marker genes of Bacteroides and related taxa for identifying sewage pollution in environmental waters: Water, v. 8, no. 6, 27 p., accessed February 25, 2025, at https://doi.org/10.3390/w8060231.
Bernhard, A.E., and Field, K.G., 2000, A PCR assay to discriminate human and ruminant feces on the basis of host differences in Bacteroides-Prevotella genes encoding 16S rRNA: Applied and Environmental Microbiology, v. 66, no. 10, p. 4571–4574, accessed February 25, 2025, at https://doi.org/10.1128/AEM.66.10.4571-4574.2000.
Best, J., Cockerel, B.L., Jr., Dichter, G., Hall, N.H., Northeimer, W.W., Reynolds, V., Solo-Gabriele, H., eds., 2016, Enzyme substrate coliform test, pt. 9223 of Standard methods for the examination of water and wastewater (21st ed.): Washington, D.C., American Public Health Association, 4 p. [Also available at https://www.standardmethods.org/doi/suppl/10.2105/SMWW.2882.194/suppl_file/9223+%282016%29.pdf.]
Boehm, A.B., Van De Werfhorst, L.C., Griffith, J.F., Holden, P.A., Jay, J.A., Shanks, O.C., Wang, D., and Weisberg, S.B., 2013, Performance of forty-one microbial source tracking methods—A twenty-seven lab evaluation study: Water Resources, v. 47, p. 6812–6828, accessed February 25, 2025, at https://doi.org/10.1016/j.watres.2012.12.046.
Bustin, S.A., Benes, V., Garson, J.A., Hellemans, J., Huggett, J., Kubista, M., Mueller, R., Nolan, T., Pfaffl, M.W., Shipley, G.L., Vandesompele, J., and Wittwer, C.T., 2009, The MIQE Guidelines—Minimum information for publication of quantitative real-time PCR experiments: Clinical Chemistry, v. 55, no. 4, p. 611–622, accessed February 25, 2025, at https://doi.org/10.1373/clinchem.2008.112797.
Forootan, A., Sjoback, R., Bjorkman, J., Sjogreen, B., Linz, L., and Kubista, M., 2017, Methods to determine limit of detection and limit of quantification in quantitative real-time PCR (qPCR): Biomolecular Detection and Quantification, v. 12, p. 1–6, accessed February 25, 2025, at https://doi.org/10.1016/j.bdq.2017.04.001.
Francy, D.S., and Stelzer, E.A., 2012, Microbial source tracking markers at three inland recreational lakes in Ohio, 2011: U.S. Geological Survey Open-File Report 2012–1222, 8 p., accessed February 25, 2025, at https://doi.org/10.3133/ofr20121222.
Francy, D.S., Stelzer, E.A., Bushon, R.N., Brady, A.M.G., Mailot, B.E., Spencer, S.K., Borchardt, M.A., Elber, A.G., Riddell, K.R., and Gellner, T.M., 2011, Quantifying viruses and bacteria in wastewater—Results, interpretation methods, and quality control (ver. 1.1): U.S. Geological Survey Scientific Investigations Report 2011–5150, 44 p., accessed February 25, 2025, at https://doi.org/10.3133/sir20115150.
Green, H.C., Dick, L.K., Gilpin, B., Samadpour, M., and Field, K.G., 2012, Genetic markers for rapid PCR-based identification of gull, Canada goose, duck, and chicken fecal contamination in water: Applied and Environmental Microbiology, v. 78, no. 2, p. 503–510, accessed February 26, 2025, at https://doi.org/10.1128/AEM.05734-11.
Green, H.C., Haugland, R.A., Varma, M., Millen, H.T., Borchardt, M.A., Field, K.G., Walters, W.A., Knight, R., Sivaganesan, M., Kelty, C.A., and Shanks, O.C., 2014a, Improved HF183 quantitative real-time PCR assay for characterization of human fecal pollution in ambient surface water samples: Applied and Environmental Microbiology, v. 80, no. 10, p. 3086–3094, accessed February 26, 2025, at https://doi.org/10.1128/AEM.04137-13.
Green, H.C., White, K.M., Kelty, C.A., and Shanks, O.C., 2014b, Development of rapid canine fecal source identification PCR-based assays: Environmental Science & Technology, v. 48, no. 19, p. 11453–11461, accessed February 26, 2025, at https://doi.org/10.1021/es502637b.
Helsel, D.R., Hirsch, R.M., Ryberg, K.R., Archfield, S.A., and Gilroy, E.J., 2020, Statistical methods in water resources: U.S. Geological Survey Techniques and Methods, book 4, chap. A3, 458 p., accessed February 26, 2025, at https://doi.org/10.3133/tm4A3. [Supersedes USGS Techniques of Water-Resources Investigations, book 4, chap. A3, version 1.1.]
JMP Statistical Discovery LLC, [1989], JMP (ver. 17.2, 2023): JMP Statistical Discovery LLC software release, accessed August 28, 2024, at https://www.jmp.com/en/home.
Julian, P., and Helsel, D., 2021, NADA2—Data analysis for censored environmental data (ver. 1.0.1, April 30, 2021): R Foundation for Statistical Computing software package release, accessed April 2025, at https://cran.r-project.org/web/packages/NADA2.
Kildare, B.J., Leutenegger, C.M., McSwain, B.S., Bambic, D.G., Rajal, V.B., and Wuertz, S., 2007, 16S rRNA-based assays for quantitative detection of universal, human-, cow-, and dog-specific fecal Bacteroidales—A Bayesian approach: Water Research, v. 41, no. 16, p. 3701–3715, accessed February 26, 2025, at https://doi.org/10.1016/j.watres.2007.06.037.
Lee, L., 2020, NADA—Nondetects and data analysis for environmental data (ver. 1.6–1.1, March 22, 2020): R Foundation for Statistical Computing software package release, accessed April 2025, at https://cran.r-project.org/web/packages/NADA/
Mieszkin, S., Furet, J., Corthier, G., and Gourmelon, M., 2009, Estimation of pig fecal contamination in a river catchment by real-time PCR using two pig-specific Bacteroidales 16S rRNA genetic markers: Applied and Environmental Microbiology, v. 75, no. 10, p. 3045–3054, accessed February 26, 2025, at https://doi.org/10.1128/AEM.02343-08.
Mieszkin, S., Yala, J.-F., Joubrel, R., and Gourmelon, M., 2010, Phylogenetic analysis of Bacteroidales 16S rRNA gene sequences from human and animal effluents and assessment of ruminant faecal pollution by real‐time PCR: Journal of Applied Microbiology, v. 108, no. 3, p. 974–984, accessed February 26, 2025, at https://doi.org/10.1111/j.1365-2672.2009.04499.x.
Myers, D.N., Stoeckel, D.M., Bushon, R.N., Francy, D.S., and Brady, A.M.G., 2007, Fecal indicator bacteria: U.S. Geological Survey Techniques of Water-Resources Investigations, book 9, chap. A7, section 7.1 (version 2.0), accessed February 26, 2025, at https://water.usgs.gov/owq/FieldManual/Chapter7/index.html.
National Oceanic and Atmospheric Administration, 2025, Data tools—Local climatological data (LCD): National Oceanic and Atmospheric Administration National Centers for Environmental Information database, accessed February 26, 2025, at https://www.ncdc.noaa.gov/cdo-web/datatools/lcd.
Nshimyimana, J.P., Cruz, M.C., Thompson, R.J., and Wuertz, S., 2017, Bacteriodales markers for microbial source tracking in Southeast Asia: Water Research, v. 118, p. 239–248, accessed February 26, 2025, at https://doi.org/10.1016/j.watres.2017.04.027.
Ohio Environmental Protection Agency [Ohio EPA], 2023, Biological and water quality study of Swan Creek, Toussaint River, western Lake Erie tributaries, and lower Maumee River tributaries: Ohio Environmental Protection Agency Technical Report AMS/2017-STEM-2, 187 p. [Also available at https://dam.assets.ohio.gov/image/upload/epa.ohio.gov/Portals/35/tmdl/TSD/STEM-TSD.pdf.]
Ohio Environmental Protection Agency [Ohio EPA], 2024a, Beneficial use designations and biological criteria, rule 3745–1–07 of Water quality standards: Ohio Administrative Code, chap. 3745–1, accessed February 26, 2025, at https://codes.ohio.gov/ohio-administrative-code/rule-3745-1-07.
Ohio Environmental Protection Agency [Ohio EPA], 2024b, Criteria applicable to all waters, rule 3745–1–04 of Water quality standards: Ohio Administrative Code, chap. 3745–1, accessed February 26, 2025, at https://codes.ohio.gov/ohio-administrative-code/rule-3745-1-04.
R Core Team, 2025, R—A language and environment for statistical computing [ver. 4?]: R Foundation for Statistical Computing software release, accessed 2025?, at https://www.r-project.org/ and https://cran.r-project.org/src/base/R-4/.
Ryu, H., Elk, M., Khan, I.U.H., Harwood, V.J., Molina, M., Edge, T.A., and Santo Domingo, J., 2014, Comparison of two poultry litter qPCR assays targeting the 16S rRNA gene of Brevibacterium sp.: Water Research, v. 48, p. 613–621, accessed February 26, 2025, at https://doi.org/10.1016/j.watres.2013.10.015.
Santo Domingo, J.W., Bambic, D.G., Edge, T.A., and Wuertz, S., 2007, Quo vadis source tracking? Towards a strategic framework for environmental monitoring of fecal pollution: Water Research, v. 41, no. 16, p. 3539–3552, accessed August 11, 2025, at https://doi.org/10.1016/j.watres.2007.06.001.
Schriewer, A., Goodwin, K.D., Sinigalliano, C.D., Cox, A.M., Wanless, D., Bartkowiak, J., Ebentier, D.L., Hanley, K.T., Ervin, J., Deering, L.A., Shanks, O.C., Peed, L.A., Meijer, W.G., Griffith, J.F., Santo Domingo, J., Jay, J.A., Holden, P.A., and Wuertz, S., 2013, Performance evaluation of canine-associated Bacteroidales assays in a multi-laboratory comparison study: Water Research, v. 47, no. 18, p. 6909–6920, accessed February 26, 2025, at https://doi.org/10.1016/j.watres.2013.03.062.
Shanks, O.C., Atikovic, E., Blackwood, A.D., Lu, J., Noble, R.D., Santo Domingo, J., Seifring, S., Sivaganesan, M., and Haugland, R.A., 2008, Quantitative PCR for detection and enumeration of genetic markers of bovine fecal pollution: Applied and Environmental Microbiology, v. 74, no. 3, p. 745–752, accessed February 26, 2025, at https://doi.org/10.1128/AEM.01843-07.
Tambalo, D.D., Boa, T., Liljebjelke, K., and Yost, C.K., 2012a, Evaluation of two quantitative PCR assays using Bacteroidales and mitochondrial DNA markers for tracking dog fecal contamination in waterbodies: Journal of Microbiological Methods, v. 91, no. 3, p. 459–467, accessed February 26, 2025, at https://doi.org/10.1016/j.mimet.2012.09.029.
Tambalo, D.D., Fremaux, B., Boa, T., and Yost, C.K., 2012b, Persistence of host-associated Bacteroidales gene markers and their quantitative detection in an urban and agricultural mixed prairie watershed: Water Research, v. 46, no. 9, p. 2891–2904, accessed February 26, 2025, at https://doi.org/10.1016/j.watres.2012.02.048.
Tetra Tech, Inc., 2012, Total maximum daily loads for the Maumee River (lower) tributaries and Lake Erie tributaries watershed: Ohio Environmental Protection Agency, prepared by Tetra Tech, Inc., 175 p. [Also available at https://dam.assets.ohio.gov/image/upload/epa.ohio.gov/Portals/35/tmdl/MLLEtribs_Final_Report.pdf.]
U.S. Geological Survey [USGS], 2025, USGS water data for the Nation: U.S. Geological Survey National Water Information System database, accessed February 26, 2025, at https://doi.org/10.5066/F7P55KJN. [Data for all 12 monitoring locations directly accessible as a download at https://api.waterdata.usgs.gov/samples-data/results/fullbio?mimeType=text%2Fcsv&monitoringLocationIdentifier=USGS-413609083223700&monitoringLocationId entifier=USGS-413627083212700&monitoringLocationIdentifier=USGS-413642083234700&monitoringLocationIdentifier=USGS-413644083201700&monitoringLocationId entifier=USGS-413644083201701&monitoringLocationIdentifier=USGS-413657083223700&monitoringLocationIdentifier=USGS-413704083214700&monitoringLocationId entifier=USGS-413705083194800&monitoringLocationIdentifier=USGS-413705083220200&monitoringLocationIdentifier=USGS-413719083190700&monitoringLocationId entifier=USGS-413727083210300&monitoringLocationIdentifier=USGS-413736083195300.]
Conversion Factors
Supplemental Information
Concentrations of Escherichia coli (E. coli) bacteria are reported as most probable number (MPN) per 100 milliliters (MPN/100 mL).
Concentrations of microbial source tracking markers are reported as number of marker copies per 100 milliliters (copies/100 mL).
A river mile is the curvilinear distance, in miles, measured upstream from the mouth of the stream along the path of the stream channel. It is typically is used to denote location along a stream.
For more information about this report, contact:
Director, Ohio-Kentucky-Indiana Water Science Center
U.S. Geological Survey
6460 Busch Blvd, Suite 100
Columbus, OH 43229
gs-w-oki_director@usgs.gov
or visit our website at
https://www.usgs.gov/centers/oki-water
Publishing support provided by the Pembroke and Reston Publishing Service Centers
Disclaimers
Any use of trade, firm, or product names is for descriptive purposes only and does not imply endorsement by the U.S. Government.
Although this information product, for the most part, is in the public domain, it also may contain copyrighted materials as noted in the text. Permission to reproduce copyrighted items must be secured from the copyright owner.
Suggested Citation
Kephart, C.M., and Lynch, L.D., 2025, Microbial source tracking in Cedar and Crane Creeks near Curtice, Ohio, 2021: U.S. Geological Survey Scientific Investigations Report 2025–5079, 15 p., https://doi.org/10.3133/sir20255079.
ISSN: 2328-0328 (online)
Study Area
| Publication type | Report |
|---|---|
| Publication Subtype | USGS Numbered Series |
| Title | Microbial source tracking in Cedar and Crane Creeks near Curtice, Ohio, 2021 |
| Series title | Scientific Investigations Report |
| Series number | 2025-5079 |
| DOI | 10.3133/sir20255079 |
| Publication Date | September 19, 2025 |
| Year Published | 2025 |
| Language | English |
| Publisher | U.S. Geological Survey |
| Publisher location | Reston, VA |
| Contributing office(s) | Ohio-Kentucky-Indiana Water Science Center |
| Description | Report: vii, 15 p.; 2 Dataset: Project Site |
| Country | United States |
| State | Ohio |
| City | Curtice |
| Other Geospatial | Cedar and Crane Creeks |
| Online Only (Y/N) | Y |
| Additional Online Files (Y/N) | N |