

Geochemical and Hydrological Investigations of Historical Data Collected at the Lee Acres Landfill and Giant Bloomfield Refinery, New Mexico, 1985–2020
Links
- Document: Report (1.64 MB pdf) , HTML , XML
- NGMDB Index Page: National Geologic Map Database Index Page
- Download citation as: RIS | Dublin Core
Acknowledgments
The authors would like to acknowledge the Farmington Field Office of the Bureau of Land Management for their funding of this work.
Abstract
The Lee Acres Landfill and Giant Bloomfield Refinery are adjacent properties near the City of Farmington, New Mexico, each having undergone monitoring and remediation related to historical site activities. At the landfill, site cleanup has included the installation of a capillary barrier over former liquid waste lagoons and periodic monitoring of groundwater elevations and groundwater quality. At the refinery, remediation has focused on several petrochemical and crude oil release areas and included soil excavation, groundwater treatment, and regular monitoring of groundwater elevations and quality. Groundwater at both sites has higher concentrations of volatile organic compounds and trace metals than background aquifer concentrations. In 2022, the U.S. Geological Survey compiled the Lee Acres-Giant Bloomfield Refinery Database (LAGBRD), which contains publicly available groundwater-elevation data and organic and inorganic groundwater-quality data from both sites, spanning from 1985 to 2020. Data from the LAGBRD and precipitation data from other sources were used to better understand the cause of relatively high manganese concentrations observed in some groundwater wells at the site through comparison of groundwater chemistry to chemical end members, interpretation of spatial and temporal patterns in the groundwater chemistry, and interpretation of groundwater flow properties. In this study, elevated chloride concentrations in groundwater downgradient from the landfill have been attributed to landfill leachate based on the temporal and spatial variability of chloride concentrations and chloride-to-bromide ratios. Installation of a capillary barrier and surface-water runoff controls at the landfill in 2005 appears to have altered infiltration patterns at that site, resulting in a decrease in chloride at some wells but an increase in chloride and dissolved manganese at others. The timing and relation among groundwater elevation, chloride concentration, and manganese concentration suggest that leachate stored in the vadose zone provides a continued source of contamination to groundwater.
Introduction
The Lee Acres Landfill, in northwestern New Mexico, approximately 6 miles east of the City of Farmington, is a former 60-acre landfill that is adjacent to an unnamed arroyo approximately one mile above its confluence with the San Juan River (fig. 1). Bordering the landfill to the south is the Giant Bloomfield Refinery (GBR), a former crude oil refinery and truck maintenance and dispatching headquarters for Giant Industries. The landfill and the refinery each have complex histories of releases of harmful materials (including septic wastes, industrial wastes, and fuels) into the environment, site investigations, and remediation activities that overlap spatially and temporally (New Mexico Environment Department [NMED], 1986; Geoscience Consultants, Ltd., 1988; Roy F. Weston, Inc., 1995; Bureau of Land Management [BLM], 2009; BLM, 2019; LT Environmental, Inc., 2020). To better understand the dynamics of impacted groundwater downgradient from the landfill, the U.S. Geological Survey (USGS) gathered site investigation and monitoring data from the landfill and the refinery and compiled them into the Lee Acres-Giant Bloomfield Refinery Database (LAGBRD; Gray and Ferguson, 2022). The data in the LAGBRD extend from 1985 to 2020 and include organic and inorganic chemistry data from the landfill’s liquid waste lagoons, organic and inorganic groundwater-quality data derived from site investigations at the landfill, and routine groundwater-elevation and organic and inorganic groundwater-quality monitoring data from both sites. The current study uses the data within the LAGBRD to better understand the spatial and temporal distribution of and hydrogeologic controls on dissolved manganese at the site, the only constituent of concern that continues to exceed target cleanup levels in groundwater (BLM, 2019).
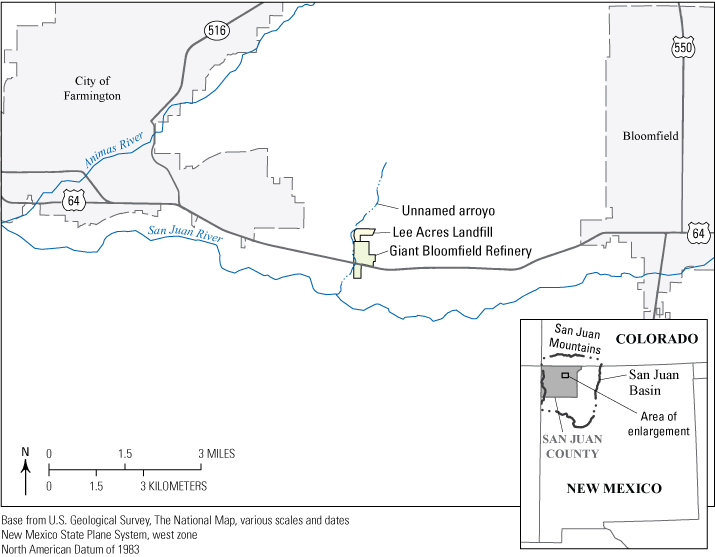
Map showing the study area, roughly 1 mile north of the San Juan River near the City of Farmington, New Mexico.
Lee Acres Landfill Site Background
The Lee Acres Landfill was operated by San Juan County from May 1962 through April 1986 on land leased from the BLM. Unlined liquid waste lagoons at the landfill, which were present beginning in approximately 1979 (Roy F. Weston, Inc., 1995), accepted a variety of wastes, including chlorinated solvents, produced water from oil and gas fields, spent acid, and septic waste (NMED, 1986). The landfill's county operators applied potassium permanganate to the liquid waste lagoons to control hydrogen sulfide emissions generated by septic wastes (Norman Norvelle, El Paso Natural Gas Company, written comm., 2022). While performing a broader investigation into groundwater contamination related to landfills in New Mexico, NMED (1986) detected chlorinated solvents in liquid waste lagoons at the Lee Acres Landfill in 1985. Also, in 1985, a berm at the landfill’s northernmost liquid waste lagoon was breached, resulting in the release of liquid waste to the adjacent arroyo and the release of hydrogen sulfide gas that adversely affected individuals present at the time of the breach. As an emergency response to the release of hydrogen sulfide gas, NMED applied ferric chloride to the liquid wastes in the breached lagoon (NMED, 1986; U.S. Environmental Protection Agency [EPA], 2004). Shortly after the lagoon breach in 1985, the landfill discontinued the acceptance of liquid waste. The liquid waste lagoons had mostly dried through evaporation and infiltration by January 1986 (96–97 percent), and the former lagoons were covered with fresh soil later that year (BLM, 2009). The Lee Acres Landfill was placed on the National Priorities List in 1990 by the EPA because of the presence of heavy metals and volatile organic compounds related to the landfill in groundwater and soils surrounding the site (EPA, 2004).
Alluvial aquifer background concentration ranges were published in the landfill’s remedial investigation report (Roy F. Weston, Inc., 1995), and cleanup levels for seven constituents of concern were set by the EPA in the site’s record of decision (ROD; EPA, 2004). The alluvial aquifer background concentration ranges for several parameters and cleanup levels for the constituents of concern at the landfill are listed in table 1. Dissolved manganese is the only constituent of concern that is persistent in monitoring wells directly downgradient from the landfill in concentrations greater than the cleanup levels described in the ROD (Gray and Ferguson, 2022). The following remedies to address groundwater contamination were selected in the ROD:
-
(1) installation of a capillary barrier and surface-water runoff controls (completed in 2005) to limit the infiltration of rainwater through contaminated soils in the vadose zone and to direct runoff from County Road 350 (fig. 2), which was built in 2005, away from the landfill;
-
(2) installation of lysimeters to monitor leachate generation in soils beneath the landfill (completed in 2005);
-
(3) institutional controls that prevent the public from accessing the site; and
-
(4) monitored natural attenuation.
The USGS—in cooperation with the BLM, which oversees the Lee Acres Landfill site—regularly monitors groundwater in wells at the site to satisfy the monitored natural attenuation requirement. The landfill’s location adjacent to an unnamed arroyo and the locations of site features, including liquid waste lagoons, monitoring wells, and the outlet of a culvert where surface-water runoff from County Road 350 is directed, are shown in Figure 2.
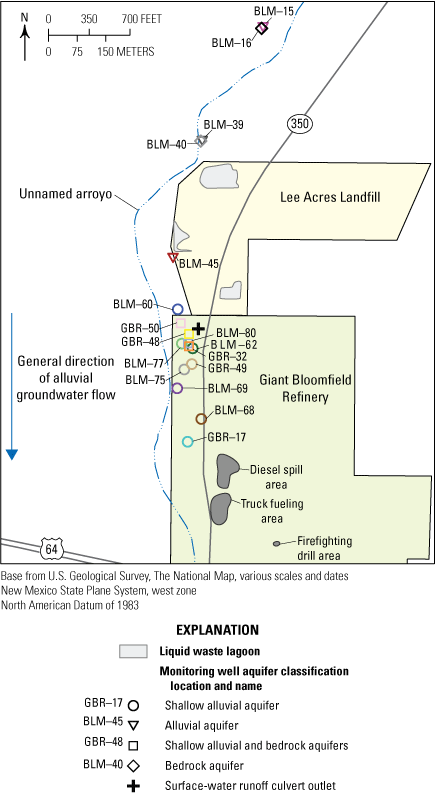
Map showing the site boundaries, locations of monitoring wells, and locations of site features at the Lee Acres Landfill and the Giant Bloomfield Refinery in New Mexico.
Table 1.
Alluvial aquifer background concentrations for selected parameters and cleanup levels for constituents of concern at the Lee Acres Landfill.[The alluvial aquifer background concentrations and cleanup levels for the organic constituents (cis-1,2-dichloroethene, trans-1,2-dichloroethene, tetrachloroethene, trichloroethene, and vinyl chloride) refer to values of raw, unfiltered water. NA, not applicable (not a constituent of concern at the Lee Acres Landfill); ND, not detected]
Alluvial aquifer background concentration ranges from the “Remedial Investigation Report for the Lee Acres Landfill” (Roy F. Weston, Inc., 1995) and from the Lee Acres-Giant Bloomfield Refinery Database (Gray and Ferguson, 2022).
Giant Bloomfield Refinery Site Background
The GBR is a former crude oil refinery operated by Giant Industries from 1973 to 1982. Following the discontinuation of refinery operations in 1982, the site was used as a truck maintenance and dispatching headquarters for Giant Industries. In 1986, Giant Industries began investigating the impact of several historical releases of diesel fuel, crude oil, and gasoline in soils and groundwater at the refinery (Geoscience Consultants, Ltd., 1988). Shortly thereafter, a groundwater monitoring plan was established, and a treatment system was installed that targeted groundwater and soil-water contamination related to a large (10,000 to 15,000 gallon) diesel spill, regular small-scale spills at a truck fueling area, and regular releases of crude oil and gas in a firefighting drill area (fig. 2). During regular monitoring at the site between 2010 and 2020, dissolved manganese and chloride were detected in GBR monitoring wells upgradient from the refinery’s primary oil and fuel release areas (the diesel spill area, truck fueling area, and firefighting drill area) and downgradient from the landfill (fig. 2) at concentrations exceeding alluvial aquifer background concentration ranges established in the landfill’s remedial investigation (table 1; Roy F. Weston, Inc., 1995; LT Environmental, Inc., 2020).
Hydrogeologic Setting
The Lee Acres Landfill receives less than 10 inches of rainfall a year and is therefore considered arid. From 1991 to 2020, the mean annual precipitation in the nearby City of Farmington was 7.76 inches, and the daily mean temperature ranged from 31.1 degrees Fahrenheit in January to 77.1 degrees Fahrenheit in July (National Oceanic and Atmospheric Administration, 2023).
Lee Acres Landfill is within a broad physiographic region known as the San Juan Basin. The basin is filled mainly with sedimentary rocks that are Triassic to Quaternary in age (Craigg, 2001). The landfill is on San Juan River Quaternary floodplain alluvium, which consists of pebbly, gravely sand with clay lenses and boulders, and associated soil. Much of the fine-grain sediment in the area is of eolian origin, but fine-grained sediment at the site may come from fluvial deposits of the nearby unnamed arroyo. Larger clasts are likely derived from glacial outwash deposits from the Pleistocene era. These larger clasts are typically metamorphic or igneous, well-rounded, and lithologically similar to glacial outwash deposits along the Animas River (Brown and Stone, 1979). Also present at the site are soils of various development stages (Ward, 1990). Based on geologic logs from the landfill’s remedial investigation (Roy F. Weston, Inc., 1995), the combined alluvium and soils generally range from 13 to 62 feet thick and lie directly atop the Paleocene Nacimiento Formation. Alluvium is generally thickest within a buried channel incised in the underlying bedrock Nacimiento Formation (Peter and others, 1987). Groundwater in the alluvial aquifer is typically present where the alluvium is sufficiently deep; the water table is typically between 25 to 40 feet below land surface in the wells surrounding the landfill (Gray and Ferguson, 2022).
The Nacimiento Formation comprises shales, mudstones, and sandstones deposited in lake beds or stream channels (Craigg, 2001). The sandstones are typically fine- to coarse-grained, consisting of igneous-derived grains, and may be cemented by clay, hematite, silica, or calcite (Pederson and Dehler, 2004). The shales in this formation tend to display a popcorn-like texture on the surface that is associated with the presence of swelling clays, and the shales often display piping where the unit is exposed (Stone and others, 1983; Pederson and Dehler, 2004). The lower part of the formation contains black, carbonaceous mudstones interbedded with white sandstones, whereas the upper part consists of more neutral-colored sandstones and mudstones (Stone and others, 1983). The thickness of the formation varies but is generally thickest (as much as 1,300 feet) in the central part of the San Juan Basin, where the landfill is located (fig. 2; Stone and others, 1983; Craigg, 2001).
The two aquifers of interest in the study area are the alluvial aquifer and the underlying Nacimiento Formation aquifer, also referred to as the bedrock aquifer in this report. Groundwater flow in the alluvial aquifer at the site is generally from north to south, and groundwater flow in the bedrock aquifer is generally from northeast to southwest (Roy F. Weston, Inc., 1995). According to the landfill’s remedial investigation (Roy F. Weston, Inc., 1995), the alluvial aquifer at the site is heterogeneous and composed of bedded clay, silt, fine to coarse sand, and fine gravel. Although the dominant clast size is coarse sand, borehole and cone penetrometer data collected during the landfill’s remedial investigation (Roy F. Weston, Inc., 1995) indicate the presence of thick (more than 10 feet thick) clay layers in the alluvium. However, such clay deposits are not present at the surface, and their deposition cannot be explained by current stratigraphy. The bedrock aquifer at the site comprises shales and sandstones of various degrees of cementation and is discontinuously confined by a shale unit (Roy F. Weston, Inc., 1995). Previous work in the area has shown that the alluvial aquifer in the San Juan Basin is generally fresh and is a sodium-calcium-sulfate-bicarbonate type of water (Kelley and others, 2014; Newton and others, 2017). The bedrock aquifer is generally described as having a sodium-sulfate water type with high total dissolved solids relative to alluvial water (Brown and Stone, 1979; Kelley and others, 2014; Newton and others, 2017). Newton and others (2017) found water in the Nacimiento Formation aquifer to be pre-modern (at least several thousand years old) and water in the alluvial aquifer to be recharged within the last 10 years. Recharge to the Nacimiento Formation aquifer happens north of the study area near the San Juan Mountains in Colorado (Newton and others, 2017). This distance from the recharge source to the withdrawal site could account for this aquifer's generally older and more geochemically evolved water.
In a study focused on the neighboring Animas River alluvial aquifer within the San Juan Basin—which is assumed to be similar to the alluvial aquifer in the study area—Newton and others (2017) found that the primary source of recharge to that alluvial aquifer is from infiltration of irrigation water. Irrigation water originates as river water and infiltrates the shallow alluvium during conveyance and after application to crops and pastures. They also found that leakage from the regional bedrock aquifer and infiltration of focused precipitation along ephemeral arroyos were also possible sources of recharge to the Animas River alluvial aquifer, though relatively minor contributors—leakage from the regional bedrock aquifer accounted for as much as 20 percent but generally less than 5 percent of the alluvial aquifer water and the contribution of precipitation recharge to the aquifer was not quantified. A dense network of canals, crops, and pastures immediately surrounding the San Juan River near the study area (fig. 3) indicates that the recharge of irrigation water is likely a recharge mechanism to the alluvial aquifer in that area. However, upgradient from and directly surrounding the landfill, no evidence of irrigation is present (fig. 3). This suggests that infiltration of precipitation through the adjacent unnamed arroyo channel and leakage of the Nacimiento Formation aquifer could be the primary sources of recharge to the alluvial aquifer at the landfill. Although annual potential evapotranspiration exceeds annual precipitation in the study area, recharge from precipitation may happen periodically when precipitation exceeds runoff and evapotranspiration (Kernodle, 1996). The landfill’s remedial investigation found that a shale unit near the landfill discontinuously confines the Nacimiento Formation aquifer and that upward gradients are present, particularly on the east side of the arroyo where the landfill is located (Roy F. Weston, Inc., 1995). Upward leakage from the Nacimiento Formation aquifer is a likely source of recharge to the alluvial aquifer in areas with upward gradients but where the confining layer is not present, thin, or fractured.
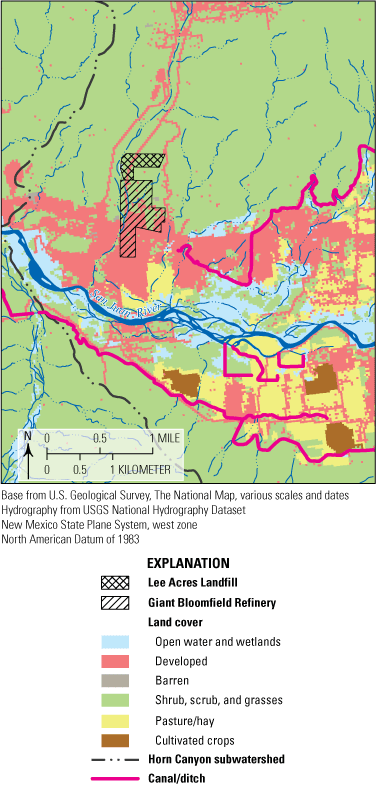
Map showing the land cover and hydrography in the study area and around the San Juan River near the study area in New Mexico.
Yields for wells completed in the alluvial aquifers throughout the San Juan Basin are between 1 and 1,100 gallons per minute, and those wells have a median output of about 15 gallons per minute (Kernodle, 1996). During the landfill’s remedial investigation (Roy F. Weston, Inc., 1995), slug testing was performed to measure the hydraulic conductivity in the alluvial and bedrock aquifers underlying the site. The mean hydraulic conductivity measured in the alluvial aquifer was 3.13 feet per day (ft/d). A reasonable upper boundary of hydraulic conductivity in the alluvial aquifer was estimated to be 10.0 ft/d, two standard deviations above the mean. Wells completed in the Nacimiento Formation aquifer throughout the San Juan Basin generally have yields between 2 and 90 gallons per minute and a median yield of about 7.5 gallons per minute (Kernodle, 1996). The mean hydraulic conductivity measured among bedrock wells at the site during the remedial investigation was 0.33 ft/d, an order of magnitude lower than hydraulic conductivity in the alluvial aquifer (Roy F. Weston, Inc., 1995).
The shallow alluvial aquifer can also be considered distinct from the deeper parts of the alluvial aquifer because of differing geochemical processes at various depths. For instance, oxidizing conditions are more likely to be found near the water table, where oxygen from the vadose zone is available. However, reducing conditions may become prevalent in deeper portions of the saturated alluvium. As in the landfill’s remedial investigation (Roy F. Weston, Inc., 1995), “shallow alluvial aquifer wells” are defined in this report as wells in which the screened interval intersects the water table in the alluvial aquifer, as opposed to being completely submerged within the alluvial aquifer. The landfill’s remedial investigation also defines “bedrock wells” as those having screens that encompass the top of the uppermost saturated bedrock zone (Roy F. Weston, Inc., 1995), and this report will use that definition. The aquifer classifications of the wells used in this study are listed in table 2. These classifications represent usual conditions while acknowledging that, for short periods, water level fluctuations may have fully submerged the screen of a shallow alluvial well or exposed the screen of a well classified as alluvial. Wells can be reclassified if conditions within that well change. For example, the aquifer classification of well BLM-39 has changed since the initial well installation because of rising groundwater levels relative to the screened interval in that well. In areas where the alluvial aquifer is thin, some wells have screens that intersect the water table in the alluvium and also extend into the bedrock. These are classified as shallow alluvial and bedrock aquifer wells in this report and in table 2. Instances where the groundwater elevation was lower than the bottom of the screen could indicate inaccuracy in the well construction information.
Table 2.
Aquifer classification, screen elevation range, and groundwater elevation range from July 1987 to August 2020 for Bureau of Land Management wells at Lee Acres Landfill and Giant Bloomfield Refinery wells used in this study.[USGS, U.S. Geological Survey; BLM, Bureau of Land Management; GBR, Giant Bloomfield Refinery]
Aquifer classifications are based on geologic logs from the “Remedial Investigation Report for the Lee Acres Landfill” (Roy F. Weston, Inc., 1995), borehole logs from the Giant Bloomfield Refinery’s operations manual (Giant Industries Arizona, Inc., 1991), and groundwater levels from the Lee Acres-Giant Bloomfield Refinery Database (Gray and Ferguson, 2022).
From the National Water Information System (USGS, 2023). Elevation and depth accuracies equal to or less than 1 foot at all wells.
From the Lee Acres-Giant Bloomfield Refinery Database (Gray and Ferguson, 2022) and corrected with updated land surface elevations.
No groundwater measurements have been recorded at this well in the National Water Information System (USGS, 2023) or in the Lee Acres-Giant Bloomfield Refinery Database (Gray and Ferguson, 2022).
Conceptual Site Model
Liquid waste stored in the landfill’s lagoons likely leached into the subsurface during the period that the lagoons were wetted, from approximately 1979 to 1985. During infiltration, leachate could have encountered low-hydraulic-conductivity silt or clay lenses present in the unsaturated alluvium, causing it to spread laterally and seek alternate vertical infiltration routes. In addition, some portion of the leachate was probably retained in the vadose zone (the undersaturated portion of the subsurface above the groundwater table), particularly in fine-grained layers. Once the leachate reached the water table, it could have mixed with groundwater and flowed advectively (with the bulk of the fluid) downgradient. Though the primary alluvial groundwater gradient at the site is directed toward the south, steeper gradients caused by local mounding of the leachate could have also resulted in the lateral spread of leachate in all directions around the liquid waste lagoons. Seasonal and annual variation in groundwater levels likely resulted in vertical smearing of leachate mixed with groundwater. During initial infiltration and subsequent groundwater-level fluctuations (the latter of which is ongoing), landfill leachate could be retained in the vadose zone through the following mechanisms: incorporation in dead-end pore spaces, sorption onto sediment surfaces driven by surface charges, changes in the oxidation-reduction (redox) state of the leachate leading to precipitation, or evaporation of pore water leading to precipitation.
These processes may have led to the development of a dispersed vadose-zone source of leachate and leachate-related chemistry. Despite installing the capillary barrier and surface-water runoff controls over the landfill in 2005, a vadose-zone source of leachate could be mobilized into groundwater where it is encountered by rising groundwater levels. Furthermore, though the surface-water runoff controls direct surface water away from infiltrating within the landfill’s boundary, the location of the runoff culvert outlet near the landfill’s southern boundary (fig. 2) indicates that focused runoff could potentially mobilize landfill leachate stored in the vadose zone into groundwater. This study’s assessment of groundwater elevations, groundwater flow directions, and the timing of changes in groundwater chemistry could help distinguish among the following leachate-transport pathways: (1) a vadose-zone source of leachate mobilized by a fluctuating water table, (2) a vadose-zone source of leachate mobilized to groundwater through the infiltration of precipitation, possibly by focused storm-water runoff, and (3) leachate mixed with groundwater flowing downgradient.
Landfill leachate frequently contains organic chemicals and other compounds that can be electron donors in redox reactions. Redox reactions are chemical reactions in which electrons are transferred from an electron donor (oxidized compound) to an electron acceptor (reduced compound). Landfill groundwater plumes, therefore, commonly contain elevated concentrations of reduced manganese and other reduced species, but electron acceptors like nitrate and manganese oxides become depleted. This process is frequently associated with distinct redox zones within an aquifer; the distribution of these zones is controlled by the extent of leachate transport, the availability of electron acceptors, and the rate of electron donor degradation (Lyngkilde and Christensen, 1992a, 1992b). Therefore, in addition to investigating contaminants directly associated with the landfill, this study’s assessment of the distribution of redox conditions can also indicate aquifer zones affected by landfill leachate.
Purpose and Scope
The purpose of this report is to use the site investigation (Roy F. Weston, Inc., 1995) and long-term monitoring data in the LAGBRD to describe groundwater conditions within the study area and their corresponding implications regarding hydrogeochemical processes affecting groundwater chemistry. First, the water types among various aquifers underlying the landfill are classified. This classification is used to identify differences among groundwater upgradient, adjacent to, or downgradient from the landfill, providing insight into the impacts of landfill activities on groundwater chemistry. Next, temporal groundwater-quality patterns are assessed with the aim of understanding the impacts on groundwater chemistry of the 2005 installation of a capillary barrier and surface-water runoff controls over the landfill’s former liquid waste lagoons. Finally, the relationship of groundwater chemistry at the site to groundwater elevations and groundwater flow directions is assessed with the goal of better understanding contaminant transport processes.
Methods
This report's groundwater monitoring data (which includes groundwater elevation and quality data) originated from the LAGBRD (Gray and Ferguson, 2022). Elevation of the land surface at some of the monitoring wells at the site was surveyed and published in the USGS National Water Information System (USGS, 2023) after the LAGBRD was published. The updated elevation measurements are more accurate than those published in the LAGBRD based on available elevation accuracy information (USGS, 2023), and, therefore, groundwater elevation values from the LAGBRD were corrected and are used in this report. If water-level data were stored in the LAGBRD as a depth below land surface, then groundwater elevation could be computed directly. If water-level data were stored in the LAGBRD as depth below measuring point, the top of casing value stored in the LAGBRD was used with the updated land-surface elevation to calculate groundwater elevation. Land-surface elevations used in this report are listed in table 1. For some water levels compiled into the LAGBRD at GBR-49 and GBR-50, the monitoring report did not give the casing top elevation. For those measurements, the updated elevation (table 1) and casing top values from the LAGBRD were used to compute groundwater elevations used in this report.
The LAGBRD contains over 5,800 groundwater-elevation measurements and water-quality results from over 1,800 sampling events at 134 sites related to the Lee Acres Landfill and GBR. To better focus this study, 16 wells were selected from the large volume of information within the LAGBRD; this report focuses on groundwater data from nine regularly monitored BLM wells (BLM-39, BLM-45, BLM-60, BLM-62, BLM-68, BLM-69, BLM-75, BLM-77, and BLM-80; BLM-69 was monitored regularly between 1998 and 2004 then again between 2019 and 2020; BLM-80 was installed in 2005 and was monitored regularly after installation), two BLM bedrock wells upgradient from the landfill (BLM-16 and BLM-40), and five GBR wells upgradient from the main fuel release areas that are the focus of remediation at the GBR (GBR-17, GBR-32, GBR-48, GBR-49, and GBR-50; fig. 2).
As discussed in Gray and Ferguson (2022), sampling plans varied over time and among the entities involved in monitoring at the landfill and refinery. For instance, groundwater monitoring performed by the USGS at the landfill included several GBR wells until 2004. The GBR wells were monitored by contractors on behalf of the refinery, but their chemical analyses did not include metals consistently until 2012. Furthermore, USGS monitoring results typically included dissolved (filtered with an 0.45-micron pore size filter) metals, whereas results produced by the refinery’s contractors were typically for total (unfiltered) metals. Filtration of major ions has also been inconsistent between the two sites and through time. For some results, the filtration process was not apparent in the refinery’s monitoring reports. Therefore, in this report, dissolved (filtered), total (unfiltered), and unknown filter fraction data for major ions are plotted and discussed together without distinction, except when multiple filter fractions exist for a given sample; in such cases, the filtered major ion result has been preferentially used.
Some samples in the LAGBRD were analyzed for dissolved and total major ions; the average relative percentage difference (RPD; expressed as the absolute difference between two values divided by the mean of the values) between filtered and unfiltered results is listed in table 3. The RPDs in table 3 are generally less than 20 percent, a threshold considered reasonable for replicate sample variability (Mueller and others, 2015), suggesting that plotting and discussing dissolved and total results from these sites without distinction is appropriate. The higher RPD among potassium results is not expected to affect the interpretations within this report, as potassium is only plotted on Piper diagrams where potassium is summed with sodium. Potassium also represents a smaller component of the groundwater in these samples than sodium.
Although some total manganese data are available, particularly originating from GBR monitoring data, this report focuses on dissolved manganese. It has not been established that total and dissolved manganese are comparable in the groundwater at this site. Furthermore, research has established that sediments in aquatic systems generally contain substantially more trace metals than the dissolved phase (Horowitz, 1985). Total manganese results are therefore not included in the analyses herein.
Table 3.
Summary of the average relative percentage difference between dissolved and total major ions.[RPD, relative percentage difference]
In this report, non-detect values have been plotted at their reporting levels, when available, in time-series plots of dissolved manganese and nitrate concentrations. Typical detection levels in this dataset are 10 micrograms per liter (µg/L) for dissolved manganese, and for nitrate, they range from 0.25 to 1.0 milligrams per liter (mg/L) as nitrogen. This report also contains time-series plots of chloride concentrations, but no non-detect values in the chloride concentrations are plotted herein.
In addition to groundwater data, this report also relies on water quality data collected from the landfill’s liquid waste lagoons during site investigations (NMED, 1986) and on chemistry data from the National Atmospheric Deposition Program’s (NADP) National Trends Network (NTN). Annual (based on water-year) precipitation-weighted means of major ion concentrations from water years 1985 to 2020 were used from the NTN’s Mesa Verde National Park-Chapin Mesa site in southwestern Colorado (NADP, 2022). Only complete annual mean values are used, meaning at least 75 percent of the water year is represented by valid samples, precipitation amounts are known for at least 90 percent of the water year, and at least 75 percent of the total measured precipitation within the water year is represented by valid samples. Valid samples pass the NADP’s requirements for sample volume and quality assurance and (or) quality control, which can be found on the NTN website at https://nadp.slh.wisc.edu/networks/national-trends-network. Available ions in the NTN dataset include calcium, magnesium, potassium, sodium, nitrate, chloride, and sulfate. To plot the precipitation data, bicarbonate was calculated using the relation between bicarbonate and pH described by Keresztesi and others (2020).
Precipitation data were compiled for the same period from the National Oceanic and Atmospheric Administration’s online climate data portal (National Oceanic and Atmospheric Administration, 2022) from 28 stations in the Bloomfield-Farmington area. Daily precipitation amounts were averaged for all sites; then, the averages were summed to get monthly precipitation totals. Daily mean temperature data were used from these sites to calculate monthly potential evapotranspiration using the Thornthwaite method (Thornthwaite, 1948). This report interprets the difference between monthly precipitation and monthly potential evapotranspiration as the water surplus. These values have been integrated over the calendar year to arrive at the annual water surplus. When annual potential evapotranspiration exceeds annual precipitation (that is, when the calculated annual water surplus is negative), this represents an annual water deficit, and little, if any, recharge of the alluvial aquifer is expected during those years. Recharge is more likely in years when annual precipitation exceeds annual potential evapotranspiration (that is, when the annual water surplus is positive). Runoff and infiltration not resulting in recharge to the aquifer (that is, infiltration stored as soil moisture in the vadose zone) is not accounted for in the annual water surplus calculation. This value is, therefore, not an estimation of recharge. Rather, the annual water surplus, as calculated here, can provide insight into the timing of when recharge to the alluvial aquifer is likely.
Because of the large variety of water quality parameters stored in the LAGBRD (156 inorganic parameters for the sites focused on in this report), the long period covered by the available data, and the inconsistent timing of water-quality data at BLM and GBR wells, correlation of various groundwater monitoring data was performed on a well-by-well basis for each of the regularly monitored BLM and GBR wells. Correlation was also performed among the various water quality parameters and groundwater elevation. Understanding correlations between various geochemical and physical monitoring data can be helpful in understanding the processes controlling groundwater chemistry in this large dataset. For instance, a significant (p-value of less than 0.01) correlation between redox state indicators and manganese concentrations would suggest that redox conditions play a role in manganese mobility at the site. In contrast, a positive correlation between groundwater elevation and various indicators of landfill leachate would suggest the mobilization of a vadose-zone source of leachate chemistry.
Prior to correlation, and for each well and analyte, groundwater-quality data were censored to the highest analytical reporting limit for the corresponding samples. Results with high reporting limits for dissolved manganese (reporting limits of 100 µg/L, compared with the standard reporting limit of 10 µg/L and typical groundwater concentrations below 100 µg/L at several wells) were excluded from the correlation analysis. These high reporting limits are all associated with results from one sampling event in March 2019 and are likely related to the dilution of the sample for laboratory analysis. Only a small portion of the dissolved manganese results were excluded (4 out of 410 results), and their removal is not expected to affect the integrity of the correlation results.
Following these exclusions, the remaining censored data were ranked. Average rankings were used for ties, and Spearman’s correlation coefficients (Helsel, 2012) were determined for the ranked data. A p-value of less than 0.01 indicated statistical significance for Spearman’s correlation. Spearman’s correlation was used because of the dataset's censored results.
A Wilcoxon rank-sum test with continuity correction was performed to test for a step change in chloride concentrations following the capillary barrier and surface-water runoff control installation in 2005 (Wilcoxon, 1945; Helsel and others, 2020). A p-value of less than 0.01 was used to indicate statistical significance for the Wilcoxon rank-sum test. The Wilcoxon rank-sum test was selected because chloride data from the wells at the site before and after capillary barrier installation are not normally distributed.
The extent and distribution of landfill leachate in groundwater were assessed by mapping alluvial and bedrock groundwater potentiometric surface contours for the following three time periods: 1987, shortly after the landfill’s liquid waste lagoons were active; 1993, before the capillary barrier and surface-water runoff control installation; and winter 2013–14 (December 2013–January 2014), after the capillary barrier and runoff controls had been in place for 8 years. Bedrock potentiometric contours are only available from 1993. The 1987 surface is from Peter and others (1987). The 1993 alluvial and bedrock surfaces are from the landfill’s remedial investigation (Roy F. Weston, Inc., 1995). The winter 2013–14 alluvial aquifer surface is hand-drawn using groundwater-elevation data from the LAGBRD. These maps were used to estimate the hydraulic gradient in the alluvial aquifer at the site, which is needed to calculate the average linear groundwater velocity (), which in turn helps estimate the arrival times of landfill constituents at various monitoring locations. Equation 1 shows how is calculated:
where
is the hydraulic conductivity of the aquifer,
is the effective porosity of the aquifer, and
is the hydraulic gradient, which is, by convention, negative in the direction of decreasing head (Freeze and Cherry, 1979).
In this report, is only calculated for the alluvial aquifer because the low hydraulic conductivity in the bedrock aquifer suggests groundwater transport of landfill leachate would preferentially happen in the alluvial aquifer. This report uses the same range of hydraulic conductivity values used in the landfill’s remedial investigation to estimate travel times in the alluvial aquifer: between 3.3 and 10 ft/d. Roy F. Weston, Inc. (1995) statistically determined this range from hydraulic conductivities measured in multiple alluvial monitoring wells by slug testing. This report uses an effective porosity estimate for the site of 0.25, also provided by the remedial investigation (Roy F. Weston, Inc., 1995). The hydraulic gradient used to calculate is −0.016 (the average of −0.018 from 1987 groundwater contours, −0.015 from 1993, and −0.016 from winter 2013–14).
Geochemical signatures of groundwater at the Lee Acres Landfill
Groundwater chemistry is controlled by many factors, including the initial chemistry of the source water, residence time, geochemical reactions with the aquifer matrix, and mixing along flow paths (Marandi and Shand, 2018). Anthropogenic inputs can also affect groundwater chemistry. Landfill leachate and septic wastes can cause reducing conditions in groundwater through the input of organic compounds, which can stimulate microbial reduction, potentially leading to anoxic conditions and increased concentrations of reduced forms of iron and manganese in groundwater (Baedecker and Back, 1979; Christensen and others, 2001). Landfill leachate and septic contamination can also cause changes in the ionic composition of groundwater, including increases in major ion concentrations, through various mechanisms (Christensen and others, 2001). Ionic ratios and correlations, such as those involving chloride, sodium, and bromide, can be used to distinguish natural and anthropogenic sources of chloride in groundwater (Davis and others, 1998; Vengosh and Pankratov, 1998; Panno and others, 2006; Katz and others, 2011).
In this section, water chemistry in the alluvial aquifer underlying the Lee Acres Landfill will be analyzed to assess spatial and temporal patterns and to identify possible relations to three end members: bedrock aquifer water, precipitation, and the landfill’s liquid waste lagoons.
Water Chemistry—Major Ions and Bromide
Major ion chemistry for groundwater samples collected at the regularly monitored BLM and GBR wells is plotted on a Piper diagram (fig. 4), along with data for the bedrock aquifer, precipitation, and Lee Acres Landfill liquid waste lagoon water. Groundwater from the bedrock aquifer is a sodium-sulfate type water, precipitation is a calcium-sulfate type water, and liquid waste lagoon water is a sodium-chloride type water. In a San Juan Basin-wide study by Kelley and others (2014), produced water (for oil and gas operations) from Cretaceous units in the San Juan Basin, which was accepted as waste at the lagoons, was found primarily to be sodium-chloride type water. This could explain the ionic composition of the liquid waste lagoons.
Recent (2019–20) groundwater data from the site falls into two groups on the central (anion-cation) portion of that diagram, both of which are between the precipitation end member and the bedrock and lagoon end members (fig. 4A). The first group, comprised of BLM-39, BLM-45, BLM-60, BLM-69, BLM-75, BLM-77, GBR-17, and GBR-50, is calcium-sulfate type water and plots closer to precipitation in figure 4A. The wells in this group are mostly shallow alluvial and alluvial wells (except for GBR-50, which has screens that extend from the shallow alluvial aquifer to the bedrock aquifer) and are in all areas surrounding the landfill: upgradient, adjacent, and downgradient from the landfill. The second group, comprised of BLM-62, BLM-68, BLM-80, GBR-32, GBR-48, and GBR-49, is a calcium-sodium-sulfate type water and plots closer to bedrock aquifer water in the central and cation plots in figure 4A. This group of wells is a mixture of shallow alluvial wells and wells with screens that extend from the shallow alluvial aquifer to the bedrock aquifer. The wells in this group are exclusively downgradient from the landfill. The distribution of all three end members in a straight line and the major ion composition of the recent groundwater monitoring data compared to that of the end members, particularly on the central and cation plots, makes it difficult to determine whether alluvial groundwater is mixing with water from the bedrock aquifer or the liquid waste lagoons. However, some wells from the second group (BLM-62, GBR-32, and GBR-48) do not plot between the bedrock aquifer and precipitation on the anion plot and are slightly shifted off the precipitation compositions toward the liquid waste lagoons, indicating that groundwater in these wells could potentially be mixing with a minor fraction of leachate from the lagoons in this recent time period.
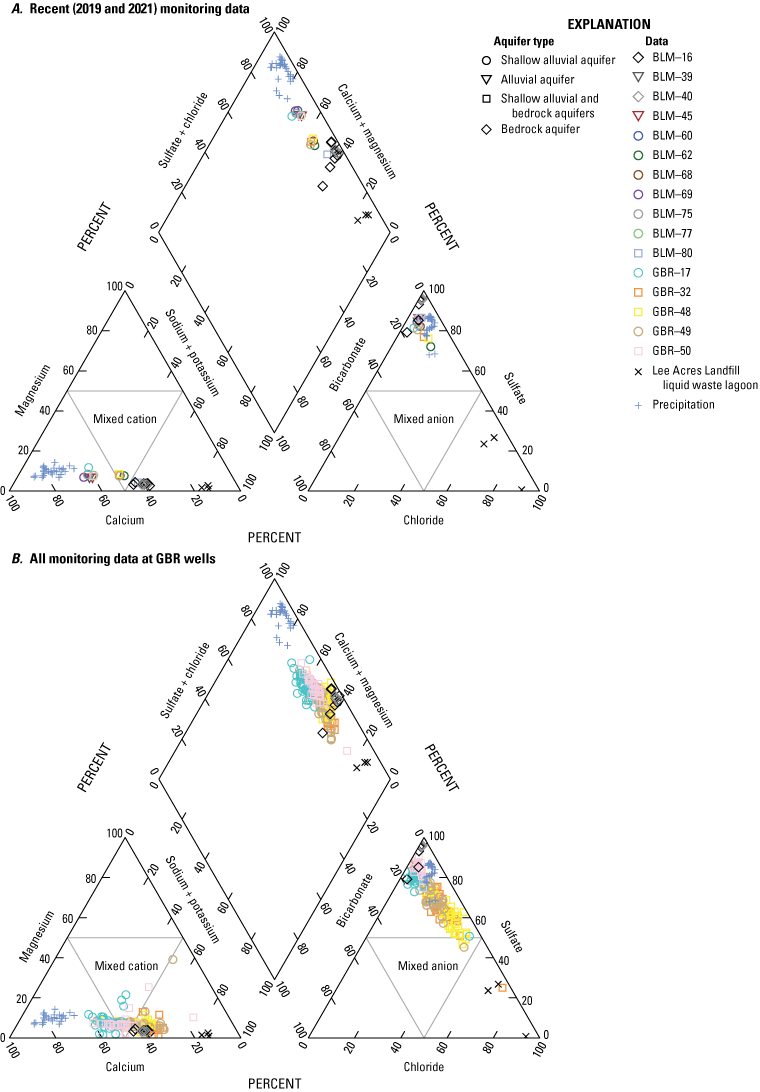
Piper diagrams showing the general water chemistry of bedrock aquifer water, Lee Acres Landfill liquid waste, precipitation, and alluvial groundwater. A, 2019 and 2020 samples collected at regularly monitored Bureau of Land Management (BLM) wells and Giant Bloomfield Refinery (GBR) wells directly downgradient from the Lee Acres Landfill. B, all available data in the Lee Acres-Giant Bloomfield Refinery Database (spanning from 1988 to 2019) at GBR wells directly downgradient from the Lee Acres Landfill.
End-member data, as well as all available monitoring data from the GBR wells, which spans from 1988 to 2019, are shown in Figure 4B. These data show that historical groundwater chemistry at the GBR wells differs from more recent (2019–20) conditions. Data from GBR-32, GBR-48, and GBR-49 display ion compositions that imply a greater degree of mixing with the sodium-chloride type water of the liquid waste lagoons than is indicated by more recent data. Bicarbonate data are not available for most historical BLM samples, so those data cannot be plotted on a Piper diagram. Other methods were used to ascertain whether BLM wells also historically displayed mixing with a sodium-chloride type water. Furthermore, other methods can help distinguish between natural causes, such as evaporite dissolution, and anthropogenic causes, such as leaching from the landfill, of the sodium and chloride enrichment seen in the historical GBR well data.
The relation between chloride and sodium (fig. 5) provides information on natural geochemical processes and anthropogenic impacts that are likely affecting groundwater in the alluvial aquifer. Alluvial aquifer data plotting between precipitation and bedrock aquifer end members in figure 5 could be the result of mixing between these two sources or could be the result of chemical evolution of the precipitation end member. During or following recharge to the alluvial aquifer, precipitation could acquire sodium through silicate mineral weathering (Meybeck, 1987) or cation exchange in sodium-rich clays (Cerling and others, 1989). The latter process is particularly associated with shales such as those found in the Nacimiento Formation (Cerling and others, 1989) and could explain the sodium content in the bedrock aquifer. Few natural processes cause chloride to increase independently of sodium, and groundwater plotting above the one-to-one chloride-to-sodium line in figure 5 is likely the result of mixing with the liquid waste lagoon end member. The high chloride content in the lagoons relative to groundwater and other end members could be the result of biotic and abiotic transformation of chlorinated solvents stored at the landfill (Witt and others, 2002; He and others, 2015). Furthermore, this process could potentially cause increasing chloride concentrations along flow paths as parent compounds in leachate are depleted. Some oil and gas produced waters from Cretaceous units in the San Juan Basin (produced water is a component of the liquid waste lagoons) also exhibit a chloride excess relative to sodium, which is indicative of the presence of connate seawater (Kelley and others, 2014).
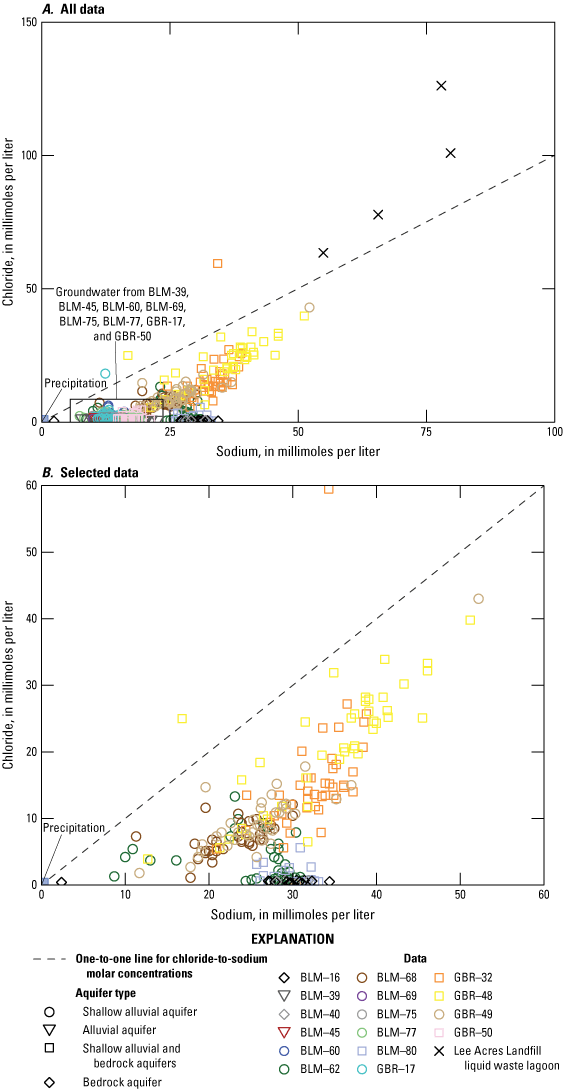
Scatterplots showing the relation between chloride and sodium (molar concentrations) in the Lee Acres Landfill liquid waste lagoons, the bedrock aquifer water upgradient from the Lee Acres Landfill, precipitation, and alluvial groundwater from regularly monitored Bureau of Land Management (BLM) wells and Giant Bloomfield Refinery (GBR) wells at the Lee Acres Landfill. A, all data. B, data from the bedrock aquifer upgradient from the Lee Acres Landfill, precipitation, and wells BLM-62, BLM-68, BLM-80, GBR-32, GBR-48, and GBR-49.
All the wells identified as producing calcium-sulfate type water in figure 4A (BLM-39, BLM-45, BLM-60, BLM-69, BLM-75, BLM-77, GBR-17, and GBR-50) plot between precipitation and the bedrock aquifer in figure 5A. Those wells are from all portions of the alluvial aquifer underlying the site (shallow alluvial, alluvial, and screened across the shallow alluvial and bedrock aquifers) and are in all areas relative to the landfill (upgradient from, adjacent to, and downgradient from the landfill). As discussed, the relation between chloride and sodium in these data is indicative of mixing between the precipitation and bedrock aquifer end members or geochemical evolution of precipitation in the shallow alluvium. However, some data from BLM-60, GBR-17, and GBR-50 have exhibited higher chloride concentrations than can be explained by available data from those two end members (chloride concentrations more than 4 millimoles per liter [mmol/L]). This is particularly the case at GBR-17, where a sample from 1988 plotted above the one-to-one chloride-to-sodium line (chloride molar concentration of 18 mmol/L). Although BLM-80, which is screened across the shallow alluvial aquifer and the bedrock aquifer, plots in the same area as bedrock aquifer data, some samples exhibit higher chloride concentrations (as much as 5.6 mmol/L in figure 5A) than can be explained by the available bedrock aquifer data. The available bedrock aquifer data, which is limited to samples collected between 1987 and 1990 for the landfill’s remedial investigation (Roy F. Weston, Inc., 1995), might not capture the full variability of chloride concentration in the bedrock aquifer. Also, groundwater data with high chloride concentrations might be the result of mixing with a more concentrated source, such as leachate from the liquid waste lagoons.
Data from shallow alluvial and bedrock aquifer wells GBR-32 and GBR-48 plot between groundwater located between precipitation and bedrock end members ( BLM-39, BLM-45, BLM-60, BLM-69, BLM-75, BLM-77, GBR-17, and GBR-50) and the liquid waste lagoon end member (fig. 5), suggesting that those wells have been impacted by leachate originating from the lagoons. Based on chloride concentrations, shallow alluvial groundwater at BLM-68 and GBR-49 also appears to be a mixture of alluvial aquifer water and the liquid waste lagoon end member, but to a lesser degree. Data from BLM-68 and GBR-49 generally overlap with the lower chloride and sodium data range of GBR-32 and GBR-48 in figure 5. Data from BLM-62, a shallow alluvial aquifer well, are plotted in several locations in figure 5. Some BLM-62 data plots near the calcium-sulfate type groundwater that has more dilute concentrations of sodium and chloride (chloride less than 5.4 mmol/L and sodium between 8.7 mmol/L and 16.1 mmol/L). Another group of data from BLM-62 overlaps with upgradient bedrock aquifer data. Finally, some BLM-62 data overlap with groundwater from BLM-68 and GBR-49, and with the less-concentrated data from GBR-32 and GBR-48, or plots along a mixing line between that area and the bedrock-aquifer end member. Groundwater at BLM-62 has likely mixed with landfill leachate to varying degrees over the monitoring period.
From the analysis of the relation of chloride and sodium, it is apparent that a source outside of the bedrock alluvial aquifer and precipitation end members has contributed chloride to groundwater at BLM-62, BLM-68, BLM-80, GBR-32, GBR-48, and GBR-49. In particular, the groundwater at GBR-32 and GBR-48 appears to have likely mixed, to varying degrees, with leachate from the landfill’s liquid waste lagoons. Chloride-to-bromide ratios can be used to evaluate the possibility of chloride inputs from other sources, as this ratio is distinct among various natural and anthropogenic sources (Davis and others, 1998; Katz and others, 2011). Analysis of this ratio could be useful at Lee Acres, where road salts and general runoff from County Road 350 might also account for the high sodium and chloride concentrations observed in figure 5. The relation between chloride-to-bromide molar ratios and chloride molar concentrations in the bedrock aquifer water and in alluvial groundwater at the site is shown in figure 6. Bromide data were not available for the precipitation or the liquid waste lagoon end members, so literature values (table 4) for precipitation and various anthropogenic sources that could potentially impact groundwater at the site have been included.
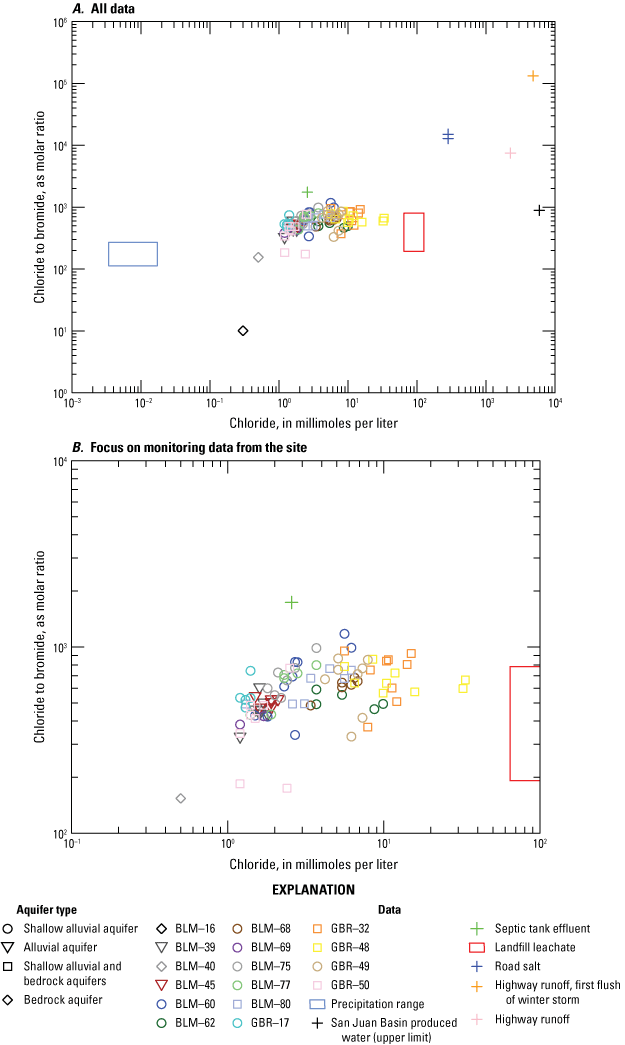
Scatterplots showing the relation between chloride-to-bromide molar ratios and chloride molar concentrations in the bedrock aquifer water upgradient from the Lee Acres Landfill, precipitation, various anthropogenic sources of chloride, and in groundwater from regularly monitored wells at the Lee Acres Landfill. A, the full extent data. B, groundwater monitoring data from the site.
Table 4.
Literature values of chloride concentrations and chloride-to-bromide ratios of precipitation and various anthropogenic sources.Data from Davis and others, 1998.
Chloride concentration ranges in precipitation are from the National Atmospheric Deposition Program, National Trends Network (National Atmospheric Deposition Program [NADP], 2022).
Data from Blondes and others, 2018.
Data from Panno and others, 2005.
Chloride concentration ranges in landfill leachate are from the Lee Acres-Giant Bloomfield Refinery Database (Gray and Ferguson, 2022).
Data from Granato, 1996.
Data from Schoonen and others, 1995.
Bedrock aquifer and precipitation data have lower chloride molar concentrations and generally lower chloride-to-bromide ratios than other groundwater data from the site (fig. 6), suggesting that another source contributes chloride to groundwater at the site. Data from BLM-39, BLM-45, BLM-69, GBR-17, and GBR-50 plot together in figure 6, generally between background bedrock aquifer water from well BLM-40 and septic tank effluent (wastewater discharge). The chloride-to-bromide molar ratios range between 176 and 761 and chloride concentrations range between 1.2 mmol/L and 2.5 mmol/L. Notably, these wells are all included in the group of calcium-sulfate type groundwater that appear to be a mixture of precipitation and bedrock aquifer water in figure 4A and figure 5A. Data from BLM-62, BLM-68, GBR-32, GBR-48, and GBR-49 plot together in figure 6 with similar to slightly higher chloride-to-bromide molar ratios (between 329 and 959) and higher chloride concentrations (between 3.4 mmol/L and 33 mmol/L) relative to wells in the first grouping. In figure 6, data from this group are generally located between the septic tank effluent and landfill leachate data. Some data points from BLM-62, BLM-68, and GBR-49 spread farther toward the more dilute groundwater of the first group. The second grouping of wells also showed evidence of mixing with liquid waste lagoon water in figure 5B. Other groundwater data at the site (data from BLM-60, BLM-75, BLM-77, and BLM-80) mainly plot between the first two groups, implying a mixture of water from those other groups.
Bromide tends to sorb (take up and hold by either adsorption or absorption) to organic materials, causing the depletion of bromide in solution (Davis and others, 1998). This observation is consistent with literature values (table 4) that show higher chloride-to-bromide ratios in septic tank effluent (where organic materials are present) as compared to landfill leachate and produced water from oil and gas operations in the San Juan Basin. Waste stored in the liquid waste lagoons at Lee Acres included septic wastes, produced water from oil and gas operations, and industrial wastes, and likely had a chloride-to-bromide molar ratio within the range of literature values for those sources, which appears reasonable based on figure 6 and the range in composition of produced water indicated in table 4. The high chloride-to-bromide ratios in the second group of wells in figure 6 (those with data plotting closer to a landfill end member) are likely explained by mixing with leachate from the Lee Acres Landfill. The compositions of groundwater from these wells appear to be following along a mixing line with landfill leachate as the higher-chloride end member rather than toward road-salt and highway-runoff compositions, which have higher chloride-to-bromide ratios than the landfill leachate. This pattern indicates that landfill leachate is more likely than road salt and runoff from County Road 350 to be a source of elevated chloride concentrations in groundwater at the site.
Temporal Changes in Groundwater Chemistry
Patterns in major ion and bromide chemistry, as discussed in the “Water Chemistry—Major Ions and Bromide” section, indicate that groundwater at the site, particularly at BLM-62, BLM-68, GBR-32, GBR-48, and GBR-49, has likely mixed with leachate from Lee Acres Landfill liquid waste lagoons as these wells are downgradient from the landfill. The data also establish that elevated chloride is an indicator of likely mixing with the landfill leachate. Piper diagrams (fig. 4) and the relation of chloride and sodium (fig. 5) show substantial changes in groundwater chemistry at some wells. This section assesses temporal changes in the concentrations of chloride (an indicator of contamination from the landfill’s liquid waste lagoons), manganese (a constituent of concern at the Lee Acres Landfill), and nitrate (an indicator of the redox state of groundwater for which available data are in the LAGBRD).
Chloride concentrations over time from the regularly monitored wells at Lee Acres are shown in figure 7. In the “Water Chemistry—Major Ions and Bromide” section, molar concentrations were a useful tool in relating the chloride and sodium content of groundwater, then relating those inferences derived about recharge sources from those concentrations to chloride-to-bromide ratios. Moving forward, chloride concentrations and other groundwater constituents will also be described in mass concentrations, which are more commonly used, particularly regarding regulatory limits. Two vertical axes display chloride in mass and molar concentrations in figure 7. Chloride concentrations in groundwater from most wells in this study (fig. 7) are generally much lower than the EPA’s secondary drinking water standard of 250 mg/L (EPA, 2023); chloride concentration did not exceed or only rarely exceeded 250 mg/L at over half of the 14 wells. Secondary standards are non-mandatory water-quality standards often based on aesthetic effects; in the case of chloride, the 250 mg/L secondary standard is based on salty taste (EPA, 2023). At BLM-39, BLM-45, BLM-60, BLM-69, BLM-75, BLM-77, BLM-80, GBR-17, and GBR-50, chloride concentrations generally did not exceed 140 mg/L except during specific time periods at the following subset of these wells downgradient from the landfill: BLM-60, BLM-75, BLM-77, BLM-80, GBR-17, and GBR-50. The first period with an exceedance of 140 mg/L at one of these wells is between 1986 and 1989, when the chloride concentration of groundwater from GBR-17 reached as high as 1,105 mg/L and from GBR-50 reached 141.85 mg/L (the number of significant figures is as reported). There are data gaps between 1991 and 1997, particularly at BLM wells, but during that period, GBR-17 and GBR-50 returned to lower chloride concentrations (generally less than 100 mg/L). The next period of high chloride concentrations among these generally low-chloride wells was between December 1997 and November 1999, when chloride concentrations exceeded 140 mg/L at BLM-60, BLM-75, and BLM-77, and again at GBR-50. Chloride concentrations did not exceed 140 mg/L again at these wells until 2016 when chloride reached 220 mg/L in September at BLM-60 and 220 mg/L in December at BLM-80. Chloride also increased at BLM-75 and BLM-77 in 2016 (as high as 130 mg/L in September at BLM-75 and 130 mg/L in March at BLM-77). Chloride concentrations have remained consistently low (less than 91 mg/L) throughout the assessed period at BLM-39, BLM-45, and BLM-69.
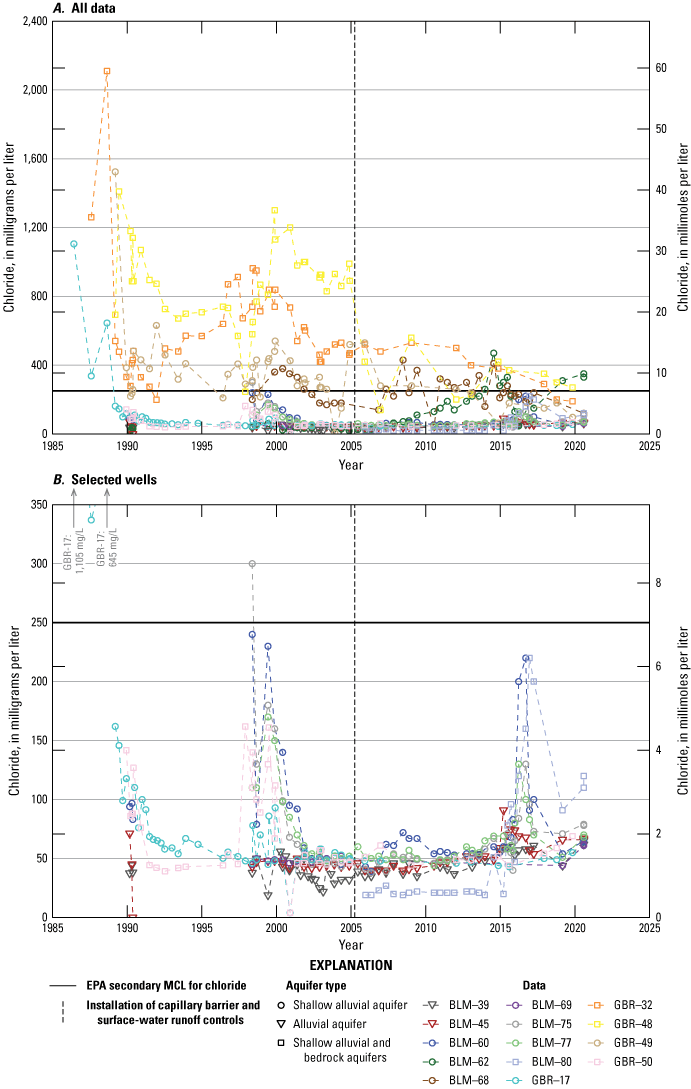
Scatterplots showing chloride concentrations over time in regularly monitored wells at the Lee Acres Landfill. A, all data. B, a subset of wells that generally have low chloride concentrations. The U.S. Environmental Protection Agency’s (EPA) secondary maximum contaminant level (MCL) for chloride in drinking water is 250 milligrams per liter (EPA, 2023).
Compared to the low chloride concentrations (usually less than 140 mg/L) at BLM-39, BLM-45, BLM-60, BLM-69, BLM-75, BLM-77, BLM-80, GBR-17, and GBR-50, chloride concentrations have been consistently high (higher than 140 mg/L, and at times as high as 2,110 mg/L) at BLM-62, BLM-68, GBR-32, GBR-48, and GBR-49. Chloride concentrations were particularly high (higher than 800 mg/L) in some early samples (from 1991 and earlier) from GRB-17, GBR-32, GBR-48, and GBR-49 (fig. 7). Given that the landfill’s liquid waste lagoons had dried and were covered with fresh soil in 1986, the substantial decline of chloride concentrations after the early monitoring period is inferred evidence of the slowing of active leaching from the lagoons because of their drying. Chloride concentrations exceeded 800 mg/L again at GBR-32 between 1996 and 1999 and at GBR-48 between 1998 and 2004.
A Wilcoxon rank-sum test with continuity correction was performed to test for a step change in chloride concentrations following the installation of the capillary barrier and surface-water runoff controls. The test rejected the null hypothesis that the chloride concentrations for GBR-32 and GBR-48 were similar before and after installation in April 2005 (p-values of 5.9×10⁻³ and 4.3×10⁻⁶, respectively), indicating that chloride concentrations were significantly different between the two time periods. The change is particularly pronounced at GBR-48, where the chloride concentration decreased from 890 mg/L in December 2004 to 420 mg/L in December 2005 and has not exceeded 560 mg/L since the barrier’s installation. This pattern in concentration could indicate that the capillary barrier did reduce the leaching of liquid waste lagoon water to groundwater around GBR-32 and GBR-48. Even though areal recharge (recharge across a broad area) is generally minimal compared to focused recharge in arid regions, several berms within the landfill boundary and covered by the barrier in 2005 may have caused runoff to pool and resulted in focused recharge prior to 2005. These berms were identified in the site’s remedial investigation (Roy F. Weston, Inc., 1995). Chloride concentrations at BLM-68 and GBR-49 are generally moderate, having median values of 240 mg/L and 310 mg/L, respectively. No significant difference in chloride concentrations appears before and after capillary barrier installation at BLM-68 (Wilcoxon rank-sum p-value of 0.97), but there is a significant decrease in concentrations (p-value of 6.1×10⁻³) at GBR-49. No significant difference in chloride concentrations at BLM-68, despite a significant decrease at nearby GBR-49, might be because of the gap in monitoring data at BLM-68 from 1991 to 1998, when increased chloride concentrations were observed at GBR-49. The hydraulic conductivity at BLM-68 was measured as 8.70 ft/d, higher than the mean hydraulic conductivity in the alluvial aquifer of 3.13 ft/d (Roy F. Weston, Inc., 1995), indicating that the lack of a significant decrease in chloride at that well is probably not a result of increased time for the arrival and dispersion of landfill leachate. This is confirmed by the apparent arrival of landfill leachate at GBR-17, farther from the landfill’s liquid waste lagoons than BLM-68, as early as 1986. Interestingly, chloride concentrations at BLM-62 rose significantly (p-value of 7.7×10⁻⁶) after the capillary barrier was installed. The median chloride concentration at BLM-62 was 36 mg/L prior to capillary barrier installation and 150 mg/L after the barrier was installed. Chloride reached its highest value at BLM-62 of 470 mg/L in July 2014, then subsequently decreased to 47 mg/L in March 2016 before climbing again to the most recent value in this dataset of 350 mg/L in August 2020. These changes suggest that the capillary barrier installation could have altered groundwater flow paths, causing the groundwater at BLM-62 to subsequently mix to a greater degree with water influenced by the liquid waste lagoons. A more compelling hypothesis may be that increasing chloride concentrations at BLM-62 could be the result of chloride being flushed from the vadose zone: surface-water runoff controls also installed in 2005 directed runoff from County Road 350 to a culvert with an outlet about 175 feet north of BLM-62 (fig. 2). Concentrated runoff may have recharged through the vadose zone, mobilizing chloride into groundwater. The source of this flushed chloride could be connected to the landfill or could be natural, as chloride and other salts are known to accumulate in the vadose zone in arid regions, particularly in settings where recharge is negligible (Scanlon and others, 2005); however, the timing of high manganese concentrations at this well, discussed later, suggests that groundwater at this well has mixed with landfill leachate.
Dissolved manganese concentrations in the regularly monitored wells at Lee Acres are shown in figure 8. The range of dissolved manganese at BLM-39, which is in the arroyo upgradient from the landfill and is described as the background well in the landfill’s ROD (EPA, 2004), is between 30 µg/L and 1,200 µg/L, and has a median concentration of 472 µg/L. Analysis of data from BLM-39 indicates that background manganese concentrations in the alluvial aquifer, which are unaffected by the landfill, have frequently exceeded the regulatory cleanup level of 346 µg/L. Most dissolved manganese concentrations in the regularly monitored wells do not exceed the maximum concentration of 1,200 µg/L observed in BLM-39 (fig. 8.) Therefore, in this report, manganese results for other wells will be compared to the maximum dissolved manganese concentration at BLM-39, instead of the regulatory cleanup level, as this is likely to be more representative of the maximum concentration for background aquifer conditions. For comparison, the range of dissolved manganese concentrations in the bedrock aquifer is between 149 µg/L and 504 µg/L, and the range of manganese concentrations (of unknown fraction, total or dissolved) at the liquid waste lagoons is between 800 µg/L and 2,100 µg/L.
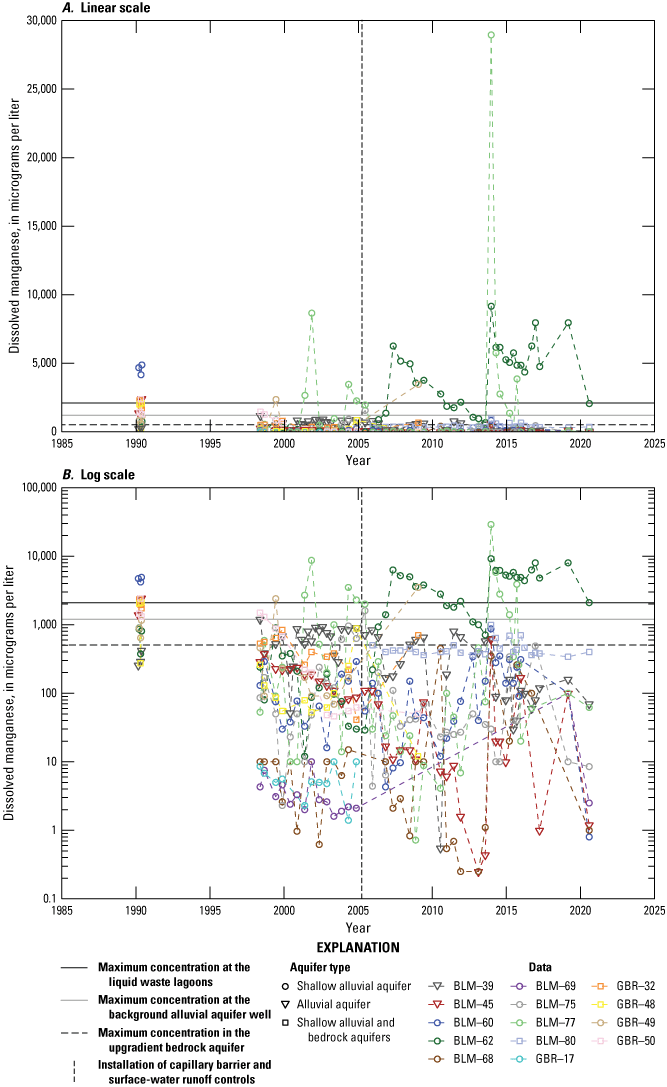
Scatterplots show dissolved manganese concentrations over time in regularly monitored wells at the Lee Acres Landfill. A, Manganese concentrations on a linear scale. B, Manganese concentrations on a log scale.
In 1990, the earliest date with available dissolved manganese concentrations for groundwater from the regularly monitored wells at this site, the dissolved manganese concentration exceeded the maximum 1,200 µg/L background aquifer concentration and the maximum 2,100 µg/L liquid waste lagoon concentration at BLM-45, BLM-60, GBR-32, GBR-48, and GBR-50 (these wells are adjacent to and downgradient from the landfill). The only other wells with manganese data for 1990 are BLM-39, BLM-62, and GBR-49. After 1990, the next available dissolved manganese data are from 1998. In 1998, dissolved manganese had returned to levels below 1,200 µg/L at all wells with previously higher concentrations except GBR-50, where concentrations decreased below 1,200 µg/L by June 1999 and have not exceeded 1,200 µg/L since that time. As with early high chloride concentrations, early high dissolved manganese concentrations are evidence of direct leaching from the landfill’s liquid waste lagoons to wells adjacent to and downgradient from the landfill; subsequent decreases in manganese concentrations indicate that this leaching slowed over a period of several years after the lagoons had dried around 1986.
Since 1990, dissolved manganese exceeded the liquid waste lagoon maximum of 2,100 µg/L at BLM-62, BLM-77, and GBR-49. Dissolved manganese exceeded 2,100 µg/L at BLM-77 and GBR-49 before and after the capillary barrier and surface-water runoff controls were installed in April 2005. However, dissolved manganese exceeded 2,100 µg/L at BLM-62 only after 2005, coinciding with the period discussed above, when chloride was also high at BLM-62. Chloride and dissolved manganese are highly correlated at BLM-62, having a Spearman’s correlation coefficient of 0.73 and a p-value of 1.0×10⁻⁸. High dissolved manganese concentrations found at BLM-62 after 2005 provide an indication that altered flow paths or recharge locations induced by the capillary barrier or surface-water runoff controls have increased mixing of groundwater at that well with leachate from the landfill’s liquid waste lagoons. This finding is corroborated by the high positive correlation between dissolved manganese and chloride at BLM-62.
Dissolved manganese concentrations reached maximums of 9,200 µg/L at BLM-62 and 29,000 µg/L at BLM-77 in December 2013. Particularly at BLM-77, where the maximum detected dissolved manganese concentration is an order of magnitude above the concentrations detected in the landfill’s liquid waste lagoons, manganese originating from the lagoons and leaching directly into groundwater is probably not responsible for these high concentrations observed in groundwater. Rather, the redox state of the groundwater, which can determine the mobility of dissolved constituents—including manganese (Chapelle and others, 1995; Paschke and others, 2007; McMahon and Chapelle, 2008), could help explain the high dissolved manganese observed in some groundwater at the site. Microbially mediated reduction of manganese oxides, resulting in increased manganese mobility, can be stimulated by the presence of organic carbon (Chapelle and others, 1995; Christensen and others, 2001; McMahon and Chapelle, 2008; McMahon and others, 2019). Wastes stored in the landfill’s liquid waste lagoons, including septic wastes and chlorinated solvents, could act as a source of organic carbon for microbially-mediated manganese reduction at the site.
Data in the LAGBRD, though limited, could be used to infer the redox state of the monitored groundwater; for instance, some nitrate data are available in the LAGBRD. Redox frameworks developed for studies on diverse aquifers suggest that manganese reduction can happen at nitrate concentrations of less than 0.5 mg/L as nitrogen (Chapelle and others, 1995; Paschke and others, 2007; McMahon and Chapelle, 2008). The maximum nitrate value observed at BLM-62 was 0.52 mg/L as nitrogen (this value was below the reporting level and qualified as estimated). At BLM-77, nitrate is moderately negatively correlated to dissolved manganese and has a Spearman’s correlation coefficient of −0.63 and a p-value of 1.9×10⁻⁵ (nitrate values at BLM-62 were all below the censoring level, and so the ranked correlation between nitrate and manganese could not be calculated). Furthermore, nitrate was not detected (at a reporting level of 0.5 mg/L as nitrogen) in the BLM-77 sample with a dissolved manganese concentration of 29,000 µg/L.
For comparison, the range of nitrate concentrations in precipitation is 0.42 to 1.0 mg/L as nitrogen, and the median concentration is 0.93 mg/L as nitrogen (NADP, 2022), and the range of nitrate in the background well BLM-39 is 0.57 to 13 mg/L as nitrogen, and the median concentration is 4.4 mg/L as nitrogen. Nitrate was not detected (the reporting level was unknown) in the single liquid waste lagoon sample with available nitrate data. Nitrate concentrations over time from the regularly monitored wells at Lee Acres are shown in figure 9. Nitrate concentrations vary at BLM-77 and frequently exceed the 0.5 mg/L as nitrogen threshold for manganese reduction (fig. 9), suggesting that conditions at this well are not always sufficiently reducing to the point of manganese reduction and mobilization. The negative correlation between nitrate and dissolved manganese at BLM-77 suggests that the redox state of groundwater is a control on manganese concentrations at that well.
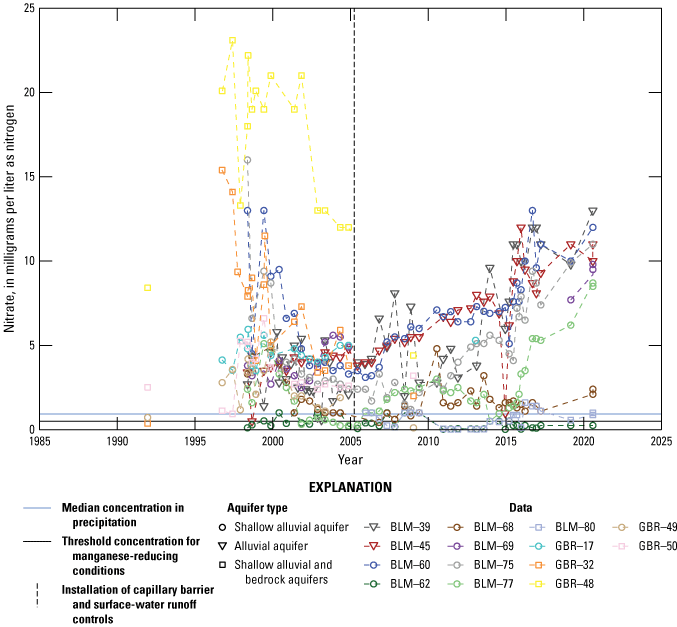
Scatterplot showing nitrate concentrations over time in regularly monitored wells at the Lee Acres Landfill.
Dissolved manganese data are available at the GBR wells until the installation of the capillary barrier and surface-water runoff controls in April 2005, except for one sample date in January 2009 (there is no dissolved manganese result for GBR-17 on this date). Among the available data, dissolved manganese concentrations at GBR wells have generally been below the 1,200 µg/L maximum at background well BLM-39 (except when noted, above). This is true even at GBR-32 and GBR-48, where chloride concentrations and chloride-to-bromide ratios indicate mixing with landfill leachate, particularly (in the case of GBR-48) prior to capillary barrier and surface-water runoff control installation, when dissolved manganese concentration data are available. A possible explanation for the elevated chloride concentrations concurrent with lower (less than 1,200 µg/L) manganese concentrations observed at wells like GBR-32 and GBR-48 is that oxidizing conditions could be limiting manganese mobility. All nitrate concentrations, except for one GBR-32 result from December 1991, were above the nitrate threshold of 0.5 mg/L as nitrogen for manganese reduction (fig. 9). Nitrate concentrations are particularly high at GBR-48, reaching a maximum value of 23.1 mg/L as nitrogen in June 1997. Though nitrate was not detected in the one liquid waste lagoon sample analyzed for nitrate, the lagoons, which accepted septic waste, might be a source of nitrate that may have spread to the vadose zone and to groundwater. This would be feasible under oxidizing conditions, which may have happened periodically throughout the lifespan of the lagoons. The source of nitrate in groundwater at the site might be natural, as the vadose zone can act as a reservoir where natural nitrate can accumulate in arid regions where recharge is negligible (Scanlon and others, 2005; Linhoff and Lunzer, 2021). Nitrate from natural and anthropogenic sources can be mobilized from the vadose zone and released to groundwater in arroyos by migration of the stream channel (Linhoff and Lunzer, 2021; Linhoff, 2022). Land use changes have also been linked to the mobilization of vadose-zone nitrate into groundwater (Scanlon and others, 2005; Linhoff and Lunzer, 2021). Beyond natural arroyo channel migration, vadose-zone nitrate at Lee Acres may have been mobilized by infiltration of leachate from the landfill’s liquid waste lagoons, which had mostly dried by 1986, or by recharge of concentrated surface-water runoff at a culvert outlet (fig. 2) installed in 2005. A full investigation of the sources of nitrate in groundwater at the site is outside of the scope of this investigation, though further research could enhance understanding of how and if nitrate controls manganese concentrations in groundwater at the site.
Groundwater Elevation
Temporal Changes in Groundwater Elevation
As discussed in the “Hydrogeologic Setting” section, the alluvial aquifer at the landfill is likely recharged through leakage from the Nacimiento Formation aquifer and infiltration of precipitation focused in the adjacent arroyo channel. In this arid region, the timing of precipitation and potential evapotranspiration determine whether precipitation is sufficient to recharge groundwater (Kernodle, 1996). To determine the amount of precipitation that could potentially reach the aquifer in the study area, the annual water surplus was calculated. Annual precipitation and the annual water surplus are shown in figure 10, overlain by groundwater elevations at regularly monitored BLM and GBR wells at the site. The date of the 2005 installation of the capillary barrier and surface-water runoff controls is also shown in figure 10.
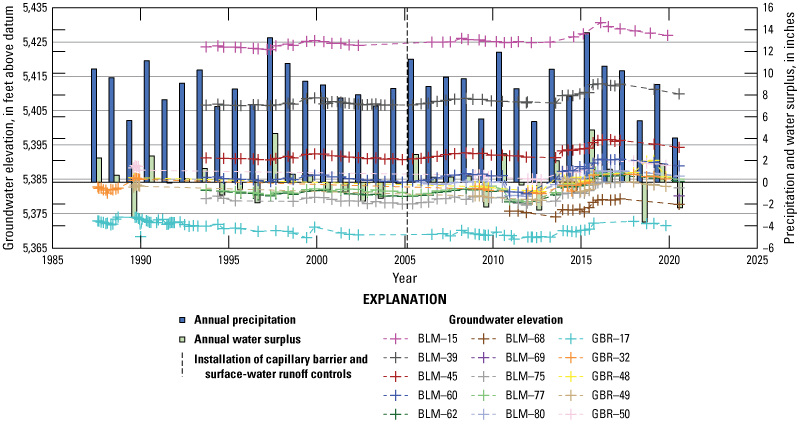
Bar graph showing annual precipitation, annual water surplus, and groundwater elevations in regularly monitored wells at the Lee Acres Landfill over time.
Comparison of temporal changes in groundwater elevation to the annual water surplus (fig. 10) reveals several periods when focused recharge of precipitation in the arroyo channel probably happened, as indicated by increasing groundwater elevations concurrent with years of positive annual water surplus. For example, groundwater elevations increased at most wells from 1997 to 1999 and from 2005 to 2008—periods when the annual water surplus was positive. Groundwater decline in response to annual water deficit is also apparent, as during the 2000–2004 period when these four successive years of annual water deficit were concurrent with gradual groundwater decline. These observations confirm that precipitation is a component of groundwater recharge in this area. However, wells near and downgradient from the landfill’s southern boundary (within 500 feet of the southern landfill boundary) exhibited a substantial decline in groundwater elevation between about 2010–13 despite substantial annual water surplus in 2010. This was apparent at BLM-60, BLM-62, BLM-75, BLM-77, and BLM-80. GBR-32, GBR-48, GBR-49, and GBR-50 did not have sufficient groundwater-elevation data in the LAGBRD during this period to determine whether a similar decline happened at those wells. Notably, no concurrent decline in groundwater elevation was observed at wells BLM-15 and BLM-39 upgradient from the landfill, at BLM-45 adjacent to the landfill, or at GBR-17 farthest downgradient from the landfill, though during other periods groundwater elevation variability was generally consistent across all wells in the study area. The location of the decreased water levels suggests that this is the effect of the landfill’s capillary barrier retarding local infiltration, though given the more immediate response of groundwater elevations to climatic forcing in this area, one would expect a groundwater decline related to the barrier to happen more immediately after barrier installation. Another explanation of the observed groundwater decline is downwards infiltration of water from the alluvial aquifer to the bedrock aquifer, which may not be fully confined at the location of these wells (Roy F. Weston, Inc., 1995), and for which no groundwater elevation data are in the LAGBRD during this 2010–13 period. Additionally, the wells that exhibited groundwater decline are near the surface-water runoff control outfall; changes in recharge dynamics related to the capillary barrier and surface-water runoff controls may have caused the decline.
The highest level of annual water surplus was in 2015 (fig. 10) and was followed by a distinct increase in groundwater elevations in all wells. Despite the apparent recharge response at all wells, including those near the landfill, infiltrating precipitation associated with this surplus probably did not recharge directly through the surface of the landfill. According to the most recent five-year site review (BLM, 2019), the capillary barrier has been functioning optimally since installation, as indicated by lysimeters within the barrier. Focused recharge through the sandy bottom of the adjacent arroyo probably causes groundwater mounding that can be observed as increased groundwater elevation in alluvial wells outside of the main arroyo channel. Focused runoff from the surface-water runoff control outfall probably supplements recharge at the wells downgradient from the landfill.
As discussed, years of substantial water surplus are generally followed by increased groundwater elevations at all wells in figure 10, indicating that focused recharge of precipitation is the cause of these increases. Groundwater mounding would be indicated by local increases in groundwater elevation that propagate away from the landfill over time. No evidence of groundwater mounding that may be associated with landfill leachate infiltration from the time that the liquid waste lagoons were active is seen in figure 10. The groundwater-elevation behavior at BLM-15 provides evidence that mounding is not observed in figure 10. The location of the BLM-15 well suggests that a groundwater mound would probably not be evident at this well at the scale or measurement frequency shown in figure 10; the well is over 1,000 feet upgradient from the landfill, and the groundwater elevation at that well is about 13 feet higher than at BLM-39, near the landfill’s northern boundary. If a propagating groundwater mound were observable at this well, it would be attenuated (would have a smaller relative increase and would happen later) relative to wells like BLM-39, BLM-45, and BLM-60, that are closer to the landfill. However, the timing and magnitude of groundwater-elevation changes observed at wells near and downgradient from the landfill are also reflected at BLM-15, suggesting that a groundwater mound spreading from the landfill’s liquid waste lagoons is probably not influencing the groundwater-elevation changes observed in figure 10.
Groundwater Elevation and Groundwater Chemistry
Assessing temporal variation in groundwater elevation and groundwater chemistry can provide insight into the mechanisms that control groundwater mixing with landfill leachate. In addition to assessing the timing of groundwater-elevation and groundwater-chemistry changes, well location in relation to the landfill and to the surface-water runoff culvert can be incorporated to consider the effects of the 2005 installation of the capillary barrier and surface-water runoff controls. In this section, the following two mechanisms of mixing with leachate outlined in the “Conceptual Site Model” section will be assessed: (1) a vadose-zone source of leachate captured by a fluctuating water table, and (2) a vadose-zone source of leachate mobilized to groundwater through the infiltration of precipitation, possibly by focused storm-water runoff. A third mechanism described in the “Conceptual Site Model” section, leachate mixed with groundwater flowing downgradient, is discussed in the “Groundwater Gradients and Transport” section. This section focuses on comparing the concentrations of manganese and chloride, two elements that are associated with Lee Acres Landfill leachate, with groundwater elevations over time in selected regularly monitored wells at the Lee Acres Landfill site. Groundwater elevations, manganese concentrations (dissolved, in µg/L), and chloride concentrations (dissolved and total, in mg/L) for BLM-39, BLM-62, BLM-77, BLM-80, GBR-32, GBR-48, and GBR-50 are shown in Figure 11. These wells were selected for figure 11 because of their locations or chemical characteristics: BLM-39 is upgradient from the landfill and was established as the background well in the remedial investigation (Roy F. Weston, Inc., 1995); BLM-62 and BLM-77 have historically had the highest dissolved manganese concentrations; BLM-80 is adjacent to alluvial wells BLM-62 and BLM-77 but is screened in the alluvial and bedrock aquifers and displays different behaviors with respect to manganese and chloride concentrations; and GBR-32, GBR-48, and GBR-50 are screened in the bedrock and alluvial aquifers near BLM-62 and BLM-77, but show different behaviors with respect to their manganese and chloride concentrations.
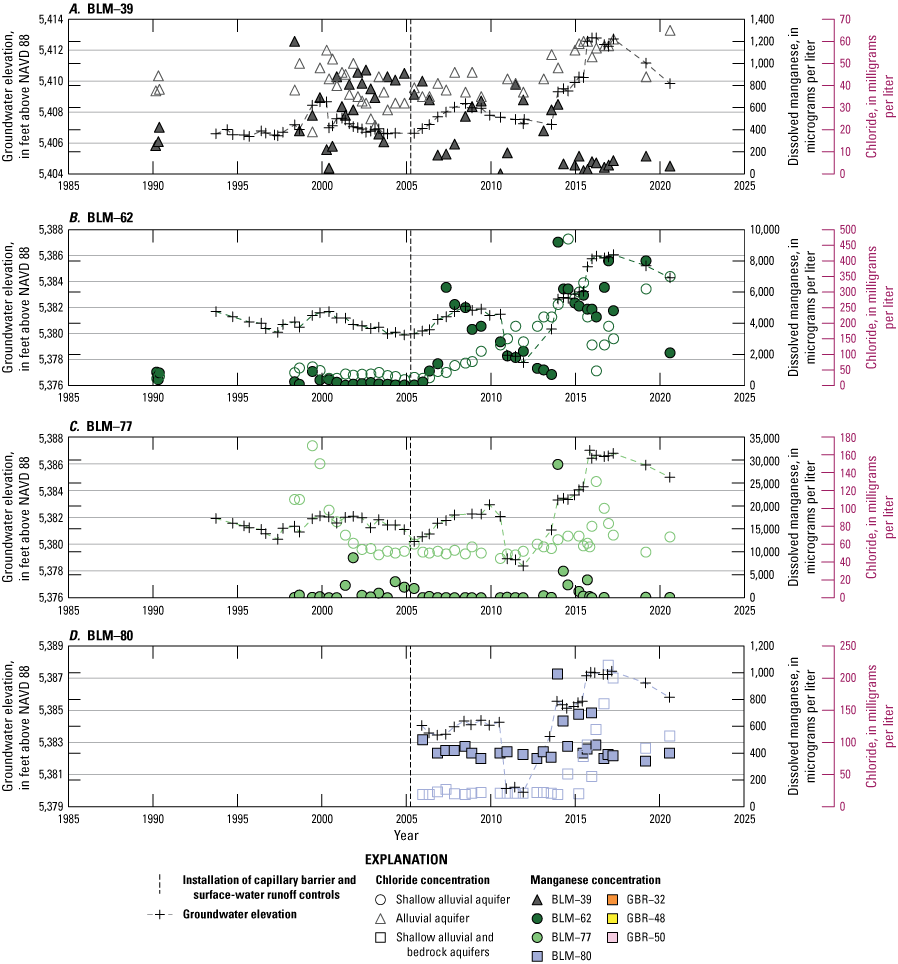
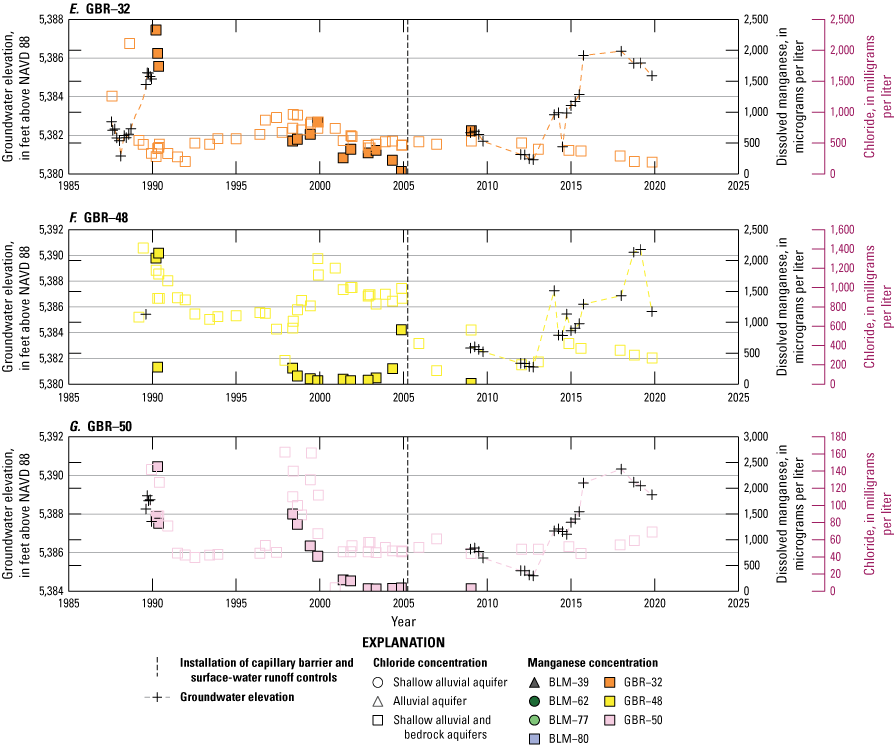
Scatterplots showing groundwater elevation, manganese concentration, and chloride concentration (dissolved and total) over time in select Bureau of Land Management (BLM) and Giant Bloomfield Refinery (GBR) monitoring wells. A, BLM-39, B, BLM-62, C, BLM-77, D, BLM-80, E, GBR-32, F, GBR-48, and, G, GBR-50.
Several groundwater-elevation changes that are relevant to the interpretation of the chemical data and are common across multiple wells are shown in figure 11. A 3–4-ft decrease in groundwater elevations around 2011 is apparent in figure 11 at BLM-62, BLM-77, and BLM-80 (wells directly downgradient from the landfill) but not at BLM-39 (upgradient from the landfill). As previously discussed, this could be the result of recharge from the alluvial aquifer to the bedrock aquifer at the location of the downgradient wells or to changes in recharge dynamics related to the 2005 installation of the landfill capillary barrier and surface-water runoff controls. The same decrease is not observed at GBR wells in figure 11 in a similar area, though groundwater-elevation data are not available at the GBR wells in 2011. A general rapid increase is shown in all wells in figure 11 between around 2013 (2012 at GBR wells) and 2015. Increases range from around 4 to 6 ft. This is followed by a more gradual decline in water levels (ranging from 2 to 3 ft at most wells) at all wells except GBR-48 until the end of the record around 2020. Several groundwater-elevation measurements at GBR-48 between 2015 and 2019 are higher relative to elevations observed at nearby wells, but these observations do not affect the interpretations of this section and are not discussed in additional detail in this report.
The highest dissolved manganese concentration at BLM-39 (1,200 µg/L) was in May 1998 and did not coincide with a substantial change in groundwater elevation (fig. 11A). However, dissolved manganese concentrations were consistently lower after 2013, corresponding with the period of highest groundwater elevations at the well. At this well, the increases in groundwater elevation in the 2013–15 period are associated with decreases in dissolved manganese concentrations and increases in chloride concentrations. Groundwater elevations are moderately negatively correlated with dissolved manganese concentrations at this well (Spearman’s correlation coefficient of −0.67 and a p-value of 3.2×10⁻⁷) and moderately positively correlated with chloride concentrations (Spearman’s correlation coefficient of 0.70 and a p-value of 9.9×10⁻⁸). Chloride concentrations and dissolved manganese concentrations are strongly negatively correlated (Spearman’s correlation coefficient of −0.73 and a p-value of 9.4×10⁻¹⁰). A plausible explanation for increases in chloride concentrations as groundwater elevations increase at BLM-39 is that mixing with landfill leachate is happening as rising groundwater encounters leachate stored in the vadose zone. This could be feasible even at this location upgradient from the landfill because leachate could have both spread laterally and been retained in the vadose zone during infiltration upon interception with low conductivity units such as the thick clay layers known to be present in the alluvium at the site (Roy F. Weston, Inc., 1995). Redox conditions likely favor oxidation and precipitation of manganese at these groundwater elevations, as indicated by generally high nitrate concentrations at BLM-39 during this period (fig. 9) and low manganese concentrations. Installation of the landfill capillary barrier and surface-water runoff controls in 2005 does not appear to have affected groundwater elevations or groundwater chemistry at this well.
Groundwater elevations and dissolved manganese concentrations are strongly positively correlated at BLM-62 (Spearman’s correlation coefficient of 0.73 and a p-value of 5.0×10⁻⁸), though it appears that dissolved manganese concentrations did not change substantially with changes in groundwater elevation until after the 2005 installation of the landfill’s capillary barrier and surface-water runoff controls (fig. 11B). After 2005, dissolved manganese concentrations increased overall but increases were more rapid during periods of groundwater-level rise during two periods, first in 2007 and then in 2013. During both periods, the groundwater level at BLM-62 was around 5,382 ft above datum, suggesting that the increase in dissolved manganese concentrations could be caused by a horizon in the aquifer at this elevation that contains reducing constituents or soluble manganese, possibly related to landfill leachate. Alternatively, or possibly in addition to, increased manganese concentrations after 2005 could be related to focused runoff being directed to the land surface near this well after surface-water runoff control installation. This focused runoff may have mobilized leachate containing manganese or reducing compounds stored in the vadose zone (as discussed in the “Conceptual Site Model” section) into groundwater or into new areas of the vadose zone.
Manganese and chloride concentrations are strongly positively correlated at BLM-62 (Spearman’s correlation coefficient of 0.73 and a p-value of 1.0×10⁻⁸), suggesting that landfill leachate is the likely source of manganese or reducing constituents that mobilize manganese into groundwater at these horizons in the aquifer or during these precipitation recharge conditions. Increases in chloride concentration that began after capillary barrier and surface-water runoff control installation in 2005 at this well (discussed in the “Temporal Changes in Groundwater Chemistry” section) and the correlation between manganese and groundwater elevation that only began after capillary barrier installation suggest that the capillary barrier or surface-water runoff control installation altered flow paths or recharge locations and caused increased mixing with landfill leachate at BLM-62.
Dissolved manganese concentrations and groundwater elevations are not significantly correlated at BLM-77 (Spearman’s correlation coefficient of 0.10 and a p-value of 0.57). Prior to the installation of the capillary barrier and surface-water runoff controls in 2005, the highest dissolved manganese concentration was 8,700 µg/L in November 2001. The first sample collected following the capillary barrier and runoff control installation (June 2005) had a dissolved manganese concentration of 2,900 µg/L. After that, dissolved manganese concentrations were below the 1,200 µg/L background alluvial aquifer threshold until the highest concentration (29,000 µg/L) was detected in December 2013, during the 2013–15 period of rapid groundwater-elevation rise. Subsequent dissolved manganese concentrations were much lower than 29,000 µg/L, even though groundwater elevations continued to rise. In fact, beginning with the sample collected in November 2015, all dissolved manganese concentrations at this well were below the background alluvial aquifer threshold concentration of 1,200 µg/L. This pattern of an abrupt, but short-lived, increase in dissolved manganese concentrations following a substantial increase in groundwater elevations suggests that soluble manganese or reducing constituents were either flushed from the vadose zone by infiltrating precipitation or that the water table had risen into an area of the vadose zone where such constituents were stored. The temporary decline in nitrate concentrations (fig. 9) at this well during the period of increased manganese indicates that reducing conditions are responsible for the observed mobilization of manganese. Reducing conditions could have been stimulated by acids or organic constituents leached from the landfill. The short-term nature of the increased manganese concentrations shows that oxidizing conditions prevailed as groundwater elevations continued to rise or that the compounds stimulating reducing conditions were rapidly flushed.
Chloride concentrations at BLM-77 have a statistically significant but weak positive correlation with groundwater elevations (Spearman’s correlation coefficient of 0.41, p-value of 8.8×10⁻³). Prior to 2005, the highest concentration of chloride was 170 mg/L in June 1999, around the same time that several other wells with generally low chloride concentrations (less than 140 mg/L) showed increased chloride, as discussed in a previous section. Chloride concentrations fell rapidly between June 1999 and May 2002, then remained stable between 44 and 60 mg/L until they begin to rise again in December 2013, coinciding with the sharp rise in groundwater elevations discussed above. The highest concentration of chloride after this date was 130 mg/L in March 2016, right after groundwater elevations reached their highest level observed for BLM-77 and about 2 years after the highest dissolved manganese observation at this well. Around the same time, chloride concentrations at BLM-62 reached their lowest values since 2007 (fig. 11B) and were within a similar range of concurrent BLM-77 concentrations (chloride concentrations at BLM-62 ranged between 47 and 130 mg/L between December 2015 and September 2016). Groundwater elevations were similarly high at BLM-77 and BLM-62 during this 2016 period (5,386.63 and 5,385.97 ft above datum, respectively, in March 2016). The presence of similar chloride concentrations at BLM-62 and BLM-77 around a groundwater elevation of 5,386 ft could indicate that a conductive layer exists around this elevation, and that groundwater at these nearby wells was mixed as it encountered this layer. The presence of a conductive layer in this area at an elevation of 5,386 ft is confirmed by Roy F. Weston, Inc.’s (1995) geologic logs from BLM-62 and BLM-77. These logs show a sandy layer at this elevation, and furthermore show a thick, about 8-ft layer of sandy clay at lower elevations at BLM-62 that is not present at BLM-77 and that likely inhibits groundwater mixing between these wells at lower groundwater elevations (Roy F. Weston, Inc., 1995). After 2016, chloride concentrations fell rapidly at BLM-77 (they did not exceed 70 mg/L after March 2017), chloride concentrations increased at BLM-62 (reaching 310 mg/L by March 2019), and groundwater elevations gradually decreased at both wells. This evidence indicates that at a groundwater elevation of 5,386 ft, landfill leachate from the source impacting BLM-62 is mixing with groundwater at BLM-77, resulting in the dilution of the chloride leachate signal at BLM-62 and simultaneous increased chloride concentrations at BLM-77. Below this groundwater elevation, low conductivity aquifer materials at BLM-62 may inhibit landfill leachate from mixing with groundwater at BLM-77.
Because BLM-80 was not installed until late 2005, no data exist prior to the installation of the capillary barrier or surface-water runoff controls. Dissolved manganese concentrations are not significantly correlated with groundwater elevations at this well (Spearman’s correlation coefficient of 0.01, p-value of 0.98). All dissolved manganese concentrations for this well are below the 1,200 µg/L background alluvial aquifer threshold value established at BLM-39. For most of the record, manganese concentrations remain fairly steady, ranging from 340 to 500 µg/L. Only four samples have higher manganese concentrations, and these were during the 2013–15 period of groundwater elevation rise. Dissolved manganese reached as high as 990 µg/L during that period. As at BLM-77, the timing of low nitrate concentrations (fig. 9) during periods of high manganese concentrations suggests that reducing conditions are responsible for the mobilization of manganese at BLM-80. Reducing conditions may have been captured by rising groundwater levels or reducing constituents may have been flushed from the vadose zone during periods of high recharge. The availability of more energetically favorable electron acceptors than manganese oxides may explain the variability of manganese chemistry at BLM-80 during this period.
Chloride concentrations at BLM-80 are moderately correlated with groundwater elevations (Spearman’s correlation coefficient of 0.65, p-value of 4.8×10⁻⁴). Chloride concentrations prior to July 2014 were low and fairly steady, ranging between 19 and 27 mg/L. Beginning in July 2014, the concentrations of chloride increased until reaching their historical maximum of 220 mg/L in December 2016. This concentration increase corresponds with generally increasing groundwater elevations during that time. The groundwater elevation of 5,386 ft above datum is associated with apparent groundwater mixing at BLM-62 and BLM-77 (groundwater elevation ranged from 5,385.12 ft above datum in July 2014 to 5,387.43 ft above datum in March 2017 at BLM-80). After 2016, chloride concentrations and groundwater elevations decreased at BLM-80, though chloride did not return to the lower concentrations seen previously. The rise in chloride concentrations combined with increased groundwater elevations could be indicative of a flushing event wherein landfill leachate stored in the vadose zone (discussed in the “Conceptual Site Model” section) was mobilized into groundwater through recharge of precipitation or was encountered by rising groundwater. Alternatively, and similar to BLM-77, mixing with leachate at this location could be controlled by low-conductivity clays around BLM-62 that inhibit leachate mixing at BLM-80 until groundwater at BLM-62 encounters more conductive aquifer materials around the elevation of 5,386 ft.
Dissolved manganese concentrations and groundwater elevations at GBR wells do not have enough overlapping data (n=1) to provide correlation statistics. This is because of the 30-year gap in groundwater-elevation data and because most of the manganese data collected after 2009 were total concentrations, as opposed to the dissolved concentrations reported previously. The total concentrations are not shown in figure 11 because interpretation of changes in the concentration of metals could be affected by examining different fractions (total or dissolved; as discussed in the “Methods” section).
The highest concentrations of dissolved manganese at GBR-32 (2,330 µg/L) and at GBR-48 (2,120 µg/L) were measured in 1990. At GBR-32, the high dissolved manganese sample occurred shortly after an increase in groundwater elevations. During this period, not enough groundwater data are available to establish a similar relation at GBR-48. The high dissolved manganese at GBR-32 and GBR-48 in 1990 also occurred shortly after the period of early elevated chloride concentrations at these wells that is likely associated with infiltration of leachate from landfill liquid waste lagoons before they had dried. Most remaining manganese samples at these wells were collected between 1998 and 2005, prior to the installation of the capillary barrier and surface-water runoff controls, but all remaining dissolved manganese results are below the background alluvial aquifer dissolved manganese concentration of 1,200 µg/L established at BLM-39. As previously discussed, redox conditions (as indicated by nitrate concentrations; fig. 9) likely control manganese concentrations at these wells; early high manganese could have been caused by mixing of reducing constituents in landfill leachate with groundwater but the increased availability of nitrate that started around 1998, a more energetically favorable electron acceptor than manganese oxides, likely prevented the reductive dissolution of manganese oxides.
Chloride concentrations and groundwater elevations are not significantly correlated at either GBR-32 or GBR-48 (Spearman’s correlation coefficient of −0.71 with a p-value of 7.1×10⁻² at GBR-32 and Spearman’s correlation coefficient of 0.40, p-value of 0.60 at GBR-48). Even though the landfill’s capillary barrier installation apparently reduced mixing with the landfill end member at these wells (discussed in a previous section), chloride concentrations remained high relative to alluvial chloride concentrations upgradient from the landfill at BLM-39, which never exceeded 65 mg/L; after capillary barrier installation, chloride ranged from 190 to 530 mg/L at GBR-32 and from 140 to 560 mg/L at GBR-48. The lingering high chloride at GBR-32 and GBR-48 indicates that some mixing with leachate has persisted in groundwater at these nearby wells. Chloride concentrations did not increase at these wells (or GBR-50, discussed below) following periods of increased groundwater elevation that are associated with mixing with landfill leachate at nearby BLM-77 and BLM-80. However, this lack of chloride increase at GBR-32 and GBR-48 does not preclude the possibility that a similar source of leachate was encountered as water levels increased in these wells; rather, the pre-existing, elevated chloride concentrations at these wells may have obscured the signal of mixing with a relatively less-concentrated leachate source. Heterogeneity in the vadose zone and the aquifer leading to preferential leachate flow paths could explain the uneven distribution of chloride among these nearby wells. Chloride concentrations and dissolved manganese concentrations at GBR-32 and GBR-48 are not significantly correlated (Spearman’s correlation coefficient of −0.20 and a p-value of 0.49 at GBR-32 and Spearman’s correlation coefficient of 0.20, p-value of 0.49 at GBR-48), confirming that the availability of energetically favorable electron acceptors like nitrate likely inhibits the mobilization of manganese into groundwater at these wells despite apparent mixing with leachate.
The highest dissolved manganese concentration at GBR-50, 2,420 µg/L, was in April 1990. Dissolved manganese again exceeded the 1,200 µg/L background alluvial aquifer threshold value in 1998, reaching 1,500 µg/L in May 1998 before decreasing to concentrations below 65 µg/L beginning in November 2002. This decrease in dissolved manganese concentrations was during the gap in groundwater-elevation data, so it is not clear if the concentrations were affected by changes in groundwater elevations. Only one sample for dissolved manganese was collected after the installation of the landfill capillary barrier and surface-water runoff controls. This January 2009 sample had a dissolved manganese concentration of 50 µg/L.
Chloride concentrations and groundwater elevations at GBR-50 are not significantly correlated (Spearman’s correlation coefficient of 0.50 and a p-value of 0.39), though groundwater-elevation data are not consistently available during two periods when chloride concentrations were higher than the typical range at this well (between 39 and 69 mg/L). Those periods of elevated chloride concentration are concurrent with the two periods of high manganese concentration discussed above, and chloride and dissolved manganese concentrations are strongly positively correlated at this well (Spearman’s correlation coefficient of 0.83, p-value of 2.5×10⁻⁴). The correlation between chloride and dissolved manganese concentrations at GBR-50 indicates that, even though less prevalent than at BLM-62, BLM-77, GBR-32, and GBR-48 (which have exhibited more extreme chloride and dissolved manganese concentrations than those seen at GBR-50), historical mixing with landfill leachate is evident at this well. Following the 2005 installation of the capillary barrier and surface-water runoff controls, chloride concentrations remained within the more typical range for this well (39 to 69 mg/L), indicating that mixing with landfill leachate has not been substantial at this well since the barrier’s installation. The heterogeneity in the alluvium surrounding the landfill suggests that preferential flow paths could contribute to the complex nature of chloride distribution in groundwater. The location of GBR-50, farther north and west of BLM-62, BLM-77, BLM-80, GBR-32, and GBR-48 (which are very near one another), could place this well outside of flow paths connected to landfill leachate sources that affect other wells. Furthermore, the location of GBR-50 slightly upgradient from the surface-water runoff culvert (fig. 2) suggests that this well might not be affected by recharge of concentrated surface-water runoff that is likely mobilizing landfill leachate from the vadose zone into groundwater observed at the downgradient wells.
Groundwater Gradients and Transport
Water-table and potentiometric contours and the extent of saturated alluvium during three time periods (1987, 1993, and winter 2013–14) are shown in figure 12. The 1987 water-table contours are from Peter and others (1987) and represent an early monitoring period shortly after the landfill’s liquid waste lagoons had dried. In 1987, water was still present in the fire water storage pond, which stored water from the San Juan River that was used for fire training that took place at the refinery. This pond was emptied shortly after 1988 (Geoscience Consultants, Ltd., 1988). A limited number of wells were available to create the 1987 contours; many monitoring wells were installed after 1987 for the landfill’s remedial investigation (Roy F. Weston, Inc., 1995). The sparsity of data is reflected in the number of contours that are approximately located (fig. 12). The 1993 water-table and bedrock aquifer potentiometric contours are from the landfill’s remedial investigation (Roy F. Weston, Inc., 1995). Bedrock aquifer potentiometric contours are only available in 1993. The 1993 contours are from several years after the landfill’s liquid waste lagoons had dried, at a time when chloride concentrations had decreased from initial elevated values at GBR-17, GBR-32, GBR-48, and GBR-49. Chloride data are not available at BLM wells in 1993. The 1993 contours benefited from the most data because a large number of wells installed for the remedial investigation were available (many were abandoned prior to the winter 2013–14 contour period). This relatively rich data availability in 1993 can be seen in the definition in the saturated alluvium boundary. Winter 2013–14 water-table contours were created using alluvial groundwater elevation data from table 5, which were calculated using the groundwater-monitoring data in the LAGBRD and updated land-surface elevation data in table 1. Groundwater elevation from wells screened across part of the bedrock aquifer was not used for creating the alluvial contours but is labeled in figure 12. The 2013–14 period was selected for contouring because during this time groundwater elevations were rising at all monitoring wells at the site, and dissolved manganese concentrations spiked at BLM-62, BLM-77, and BLM-80. Wells used to create these contours are shown in figure 12. No alluvial wells were dry during that period, so the extent of saturated alluvium could not be estimated.
Table 5.
Groundwater elevations used to create water-table contours in figure 12.[Date given in Month/Day/Year format. Datum is the North American Vertical Datum of 1988. BLM, Bureau of Land Management; GBR, Giant Bloomfield Refinery]
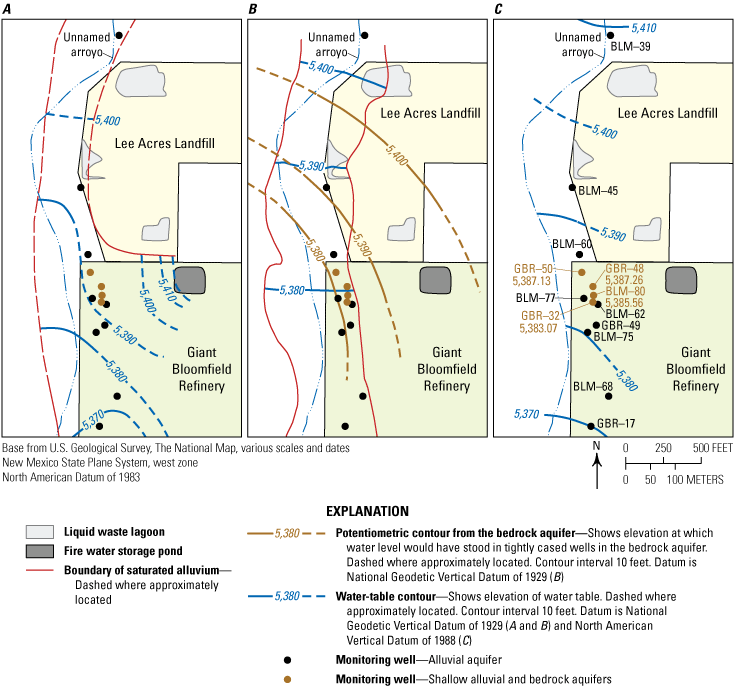
Maps showing the water-table contours, bedrock aquifer potentiometric contours (when available), and the extent of saturated alluvium (when available) at the Lee Acres Landfill and the Giant Bloomfield Refinery in New Mexico. A, February 1987 (Peter and others, 1987), B, May (water-table) and September (potentiometric) 1993 (Roy F. Weston, Inc., 1995), and, C, December 2013 through January 2014 (Gray and Ferguson, 2022). Monitoring well locations shown in all figure parts are those with data from winter 2013–14 and are only displayed in figure parts A and B to provide context for contour locations.
Though data scarcity around the fire water storage pond led to many of the 1987 contours being approximated, these contours suggest that the extent of mounding related to the pond reached GBR wells directly downgradient from the landfill (GBR-32, GBR-48, and GBR-49). These wells exhibited high chloride prior to 1991, suggesting that some early chloride concentrations in this area may, in fact, have been diluted by this relatively fresh source (dissolved chloride concentrations between 1961 and 2021 range from 0.8 to 6.0 mg/L at the nearby USGS site 09357000, San Juan River at Bloomfield, New Mexico; USGS, 2023). Groundwater mounding in relation to the landfill’s liquid waste lagoons is not evident in any of the periods of groundwater contours shown in figure 12, though the monitoring data density was likely sufficient to discern such mounds only in the 1993 period.
To assess advective leachate transport in groundwater relative to other mechanisms of leachate transport at the site (noted in the “Conceptual Site Model” section), groundwater transport times from the landfill’s liquid waste lagoons to BLM-62 and GBR-17 have been calculated. BLM-62 was selected as a well near the landfill that exhibited mixing with landfill leachate. Furthermore, BLM-62 is in close proximity to other wells near the landfill’s southern boundary (particularly BLM-77, BLM-80, GBR-32, GBR-48, and GBR-49), and these wells may, therefore, share similar groundwater transport times to the lagoons. Because GBR-17 is farthest from the landfill, it was selected as the monitoring well. The range of average linear groundwater velocity at the site, calculated using the average hydraulic gradient (see “Methods” section) from the three alluvial surfaces in figure 12, is 77 to 230 ft per year. Groundwater traveling from the northernmost lagoon would take 6–19 years to arrive at BLM-62 and 10–30 years to arrive at GBR-17. Groundwater traveling from the southernmost lagoon would take 2–7 years to arrive at BLM-62 and 6–17 years to arrive at GBR-17.
Despite these wide ranges of groundwater transport time estimates, it is possible to infer that groundwater transporting landfill leachate could have reached BLM-62 and GBR-17 by the start of groundwater monitoring at GBR-17 in 1986 (liquid waste lagoons were present at the landfill starting in approximately 1979; Roy F. Weston, Inc., 1995). This could explain the high chloride concentrations at that well prior to 1990. By around 1991, about 5 years after the liquid waste lagoons had dried, chloride at this well had decreased substantially, suggesting dilution with relatively fresh groundwater after the leachate supply diminished. This indicates that groundwater transport between the liquid waste lagoons and GBR-17 is relatively rapid because the dilution of leachate happens around the low end of the transport time range. No chloride data are available for BLM-62 until 1990 (and chloride concentrations at this well were low until after the capillary barrier and surface-water runoff controls were installed in 2005), though groundwater at nearby GBR-32, GBR-48, and GBR-49 exhibited a similar pattern of high initial chloride concentrations that tapered by 1991. However, unlike at GBR-17, groundwater at GBR-32, GBR-48, and GBR-49 continued to remain higher than background concentrations. Chloride concentrations did not stabilize at lower values until after the capillary barrier’s installation. Differences in the timing of chloride concentrations between the near and far locations could be attributed to local low conductivity units retarding groundwater flow and inhibiting dilution with relatively fresh water at wells near the landfill. The relatively high chloride concentrations at wells on the landfill’s southern boundary prior to roughly 2005 may also be the result of leachate stored in the vadose zone being mobilized into groundwater, a process that is apparently inhibited by the landfill’s capillary barrier.
Advective groundwater transport of landfill leachate does not explain the presence of leachate observed at BLM-62, BLM-77, or BLM-80 after the landfill’s capillary barrier and surface-water runoff control installation in 2005. At the upper range of groundwater transport times, a plume of leachate traveling from the furthest, northernmost liquid waste lagoon would have reached these locations around 2004. Leachate from nearer lagoons would have arrived earlier. Evidence of groundwater mixing with leachate at BLM-62 persists until 2020 in the latest records available in this dataset, which show generally increasing chloride concentrations between 2016 and 2020. Leachate transported advectively from the landfill’s liquid waste lagoons would have likely arrived earlier at this well. Groundwater mixing with leachate near BLM-62, BLM-77, or BLM-80 is more likely to be controlled by local conductivity, and mobilization of vadose-zone leachate into groundwater is likely enhanced by surface-water runoff controls in this area.
Further Considerations
As discussed, the available data within the study area suggest that the redox state of groundwater at specific wells may be sufficiently reducing to favor the mobilization of manganese through the reduction of manganese that is present in aquifer sediments in the solid phase, although the available data are insufficient to fully characterize the reduction potential. Additional evidence, such as dissolved oxygen content, redox potential, and ferrous iron and sulfide concentrations, would help characterize the redox state of groundwater at the site, which can provide insight into the mobility of natural and anthropogenic trace constituents like manganese. The USGS currently (September 2025) plans to measure these parameters at the site on an annual monitoring basis. The first additional parameters were collected in August 2020. Most of those data are not in the LAGBRD, and their discussion is outside the scope of this report. A thorough interpretation of the redox data at this site is planned. Furthermore, the USGS has collected sediment cores from newly installed monitoring wells at the site and plans to analyze the sediment chemistry and perform manganese mobility tests. These additional sources of data may help determine whether the sources of manganese oxides are natural (geologic) or originate from the landfill (anthropogenic). Manganese that originated from the landfill may have been in the aqueous phase as a part of leachate, a substance that likely favors manganese reduction. This solubilized manganese may have precipitated on sediment surfaces upon encountering sufficiently oxidizing conditions in the vadose zone or in groundwater upon infiltration.
Summary and Conclusions
The Lee Acres Landfill is a former San Juan County operated landfill on land leased from the Bureau of Land Management (BLM) near the City of Farmington, New Mexico. The site operated as a landfill from 1962 to 1986. During that time, liquid waste lagoons at the landfill accepted a variety of wastes, including chlorinated solvents, produced water from oil and gas fields, spent acid, and septic waste. The site was placed on the National Priorities List in 1990 after a breach of one of the liquid waste lagoons in 1986. In 2005, a capillary barrier was constructed over the landfill to retard the infiltration of precipitation through contaminated soils. At the same time, County Road 350 was built over the landfill, and surface-water runoff controls were installed that directed runoff to the outlet of a culvert downgradient from the landfill and upgradient from several landfill monitoring wells. Since initial site investigations, the BLM has been monitoring groundwater in the alluvial and bedrock aquifers hydrologically upgradient, adjacent to, and downgradient from the landfill. Bordering the landfill to the south and directly downgradient from the landfill is a former crude oil refinery and truck maintenance and dispatching headquarters for Giant Industries called the Giant Bloomfield Refinery (GBR). The GBR has been affected by several historical fuel releases that initiated groundwater monitoring and remediation related to that site. In 2022, the U.S. Geological Survey compiled site investigation and monitoring data (groundwater level, groundwater quality, and liquid waste lagoon chemistry data) from the Lee Acres Landfill and GBR into the Lee Acres-Giant Bloomfield Refinery Database (LAGBRD; Gray and Ferguson, 2022). The data within the LAGBRD are used herein to classify groundwater types in aquifers underlying the site and identify patterns in groundwater quality. Variations in groundwater type and groundwater quality were assessed for indication of mixing with landfill leachate. The timing of groundwater elevation and groundwater quality was compared in order to determine whether leachate stored in the vadose zone may be mobilized into groundwater. Historical groundwater contours are used to assess an alternate leachate transport mechanism: advective transport in groundwater.
End members at the site have the following water types: regional groundwater in the bedrock aquifer is a sodium-sulfate type water, precipitation is a calcium-sulfate-bicarbonate type water, and liquid waste lagoon water is a sodium-chloride type water. Recent (2019 and 2020) groundwater compositions from the site fall into the following two groups: calcium-sulfate type water at wells BLM-39, BLM-45, BLM-60, BLM-69, BLM-75, BLM-77, GBR-17, and GBR-50, and calcium-sodium-sulfate type water at wells BLM-62, BLM-68, BLM-80, GBR-32, GBR-48, and GBR-49. Both groups include wells screened only in the shallow alluvial aquifer and wells screened across the shallow alluvial and bedrock aquifers, but the second group (wells with calcium-sodium-sulfate type water) consists exclusively of wells downgradient from the landfill. Their location and geochemical composition—containing a greater proportion of sodium than alluvial groundwater upgradient from the landfill—indicate that groundwater in this second group of wells could be mixing with constituents leached from liquid waste lagoons at the Lee Acres Landfill.
The distinct chloride and sodium relation of the end members has aided in characterizing likely end member mixing in alluvial groundwater at the site. Based on the relation between chloride and sodium concentrations, monitoring wells at the site with a calcium-sulfate type water appear likely to be either a mixture of precipitation and groundwater from the bedrock aquifer or the result of geochemical evolution of precipitation in the alluvial aquifer toward the composition of regional groundwater in the bedrock aquifer. Data from the other wells at the site, those with a calcium-sodium-sulfate water type, cannot be explained by the mixing of precipitation and the bedrock aquifer or by the geochemical evolution of precipitation toward the composition of regional groundwater. The relation of chloride to sodium at BLM-80 is similar to that of the bedrock aquifer, though, in some samples, high chloride concentrations indicate likely mixing with leachate from the liquid waste lagoons. Chloride and sodium concentrations at GBR-32 and GBR-48 indicate that groundwater at these wells is a mixture of calcium-sulfate type groundwater and landfill leachate. The older (prior to 2010) sample data at GBR-32 and GBR-48 appear to show a greater degree of mixing with landfill leachate than more recent (after 2010) data do. BLM-68 and GBR-49 have chloride and sodium concentrations that are similar to the more recent data from GBR-32 and GBR-48. Chloride and sodium concentrations at BLM-62 vary and, at different times, are similar to the calcium-sulfate type groundwater at the site, the more recent data from GBR-32 and GBR-48, the bedrock aquifer water, or mixtures of those groups. The relation of chloride-to-bromide ratios and chloride concentrations supports the conclusion that the landfill’s liquid waste lagoons are likely the source of the elevated chloride concentrations observed in wells downgradient from the landfill, as opposed to road salt or runoff from the nearby County Road 350.
Chloride concentrations are generally low among the calcium-sulfate type groundwater wells and at BLM-80. Among these wells, only a few periods show that chloride exceeded 140 milligrams per liter (mg/L), including among the earliest samples represented in the LAGBRD at these sites between 1986 and 1989. Among the wells with generally higher (above 140 mg/L) chloride concentrations (BLM-62, BLM-68, GBR-32, GBR-48, and GBR-49), there were periods of particularly elevated chloride concentrations (above 800 mg/L) at GBR-32, GBR-48, and GBR-49 prior to the April 2005 installation of a capillary barrier and surface-water runoff controls. Particularly high chloride concentrations at GBR-17, GBR-32, GBR-48, and GBR-49 during earliest period of record in the LAGBRD (in 1990 and before), shortly after the landfill’s liquid waste lagoons had dried by January 1986, indicate that leaching from the landfill’s liquid waste lagoons was the cause of elevated chloride. The decline of chloride concentrations at GBR-32 and GBR-48 after 2005 is evidence that the capillary barrier reduced mixing with landfill leachate at that well. However, the increase of chloride at BLM-62 after 2005 indicates that groundwater flow paths or recharge locations could have been impacted by the capillary barrier or surface-water runoff controls in such a way that increased mixing with landfill leachate was induced at BLM-62.
Most of the dissolved manganese concentrations from the site do not exceed the maximum dissolved manganese concentration at the background alluvial aquifer well BLM-39 (1,200 micrograms per liter [µg/L]) or the maximum manganese concentration (fraction unknown) in the liquid waste lagoons (2,100 µg/L). Exceedances of the 1,200 µg/L background alluvial aquifer maximum concentration in 1990 (the earliest date with available manganese data) in groundwater from some wells is likely the result of direct leaching from the landfill’s liquid waste lagoons. At BLM-62, the increase in dissolved manganese and chloride concentrations after the capillary barrier and surface-water runoff controls were installed in April 2005, and the strong positive correlation between dissolved manganese and chloride concentrations (Spearman’s correlation coefficient of 0.73 and a p-value of 1.0×10⁻⁸), are evidence that high dissolved manganese concentrations at that well are likely the result of mixing with the landfill leachate. The timing of chloride and manganese concentrations increases suggests that the leachate mixing with groundwater at this well could have previously been entrained in the vadose zone and then mobilized into groundwater upon infiltration of focused surface-water runoff at the outlet of surface-water runoff controls installed in 2005.
Evidence of reducing conditions (nitrate concentrations below 0.5 mg/L) concurrent with high dissolved manganese concentrations at BLM-62 and BLM-77 suggests groundwater at those wells might be manganese-reducing during some time periods. More oxidizing conditions (nitrate concentrations above 0.5 mg/L) at GBR-32 and GBR-48, wells that show evidence of mixing with leachate from the liquid waste lagoons, could be preventing manganese from mobilizing into groundwater at those sites.
The direction of groundwater elevation changes in monitoring wells generally agrees with the annual water surplus, confirming that precipitation is a component of groundwater recharge at the site. A decrease in groundwater elevation in wells near and downgradient from the landfill’s southern boundary between 2010 and 2013, despite a substantial annual water surplus in 2010, could be the result of recharge from the alluvial aquifer to the bedrock aquifer at this location or changes in recharge dynamics related to the 2005 installation of the landfill capillary barrier and surface-water runoff controls. Groundwater elevation changes are generally consistent among monitoring wells at all locations surrounding the site (outside of the 2010–2013 decline in water levels at wells near the landfill’s southern boundary), indicating no substantial groundwater mounding related to landfill leachate infiltration during the monitoring period.
The timing of changes in groundwater elevation, manganese concentrations, and chloride concentrations at monitoring wells indicates that landfill leachate affecting groundwater at the site likely has a vadose-zone source. This leachate in the vadose zone may have spread through and been retained in the vadose zone after encountering low conductivity units during infiltration. Changes in groundwater elevation and chloride concentrations suggest that mixing with landfill leachate is controlled in part by the conductivity of aquifer materials around wells BLM-62, BLM-77, and BLM-80, downgradient from the landfill. Conversely, at GBR-32, GBR-48, and GBR-50, the primary control on mixing with landfill leachate is the landfill’s capillary barrier, the installation of which is associated with decreased chloride concentrations at GBR-32 and GBR-48, in particular. At GBR-50, chloride and dissolved manganese concentrations are highly correlated, but the timing of high manganese and chloride concentrations indicate that groundwater at this well likely has not mixed with landfill leachate since the landfill’s capillary barrier installation.
Groundwater mounding in relation to the landfill’s liquid waste lagoons is not evident in groundwater contours at the site during three time periods, though limited data availability indicates that contours would only be discernable in 1993. Groundwater transport times suggest that advective transport of leachate in groundwater is not responsible for leachate mixing observed at some wells directly downgradient from the landfill (GBR-32, GBR-48, or GBR-49) where the capillary barrier installation has apparently inhibited the mobilization of landfill leachate stored in the vadose zone to groundwater. At other wells directly downgradient from the landfill (BLM-62, BLM-77, and BLM-80), groundwater transport times indicate that the relatively recent mixing with landfill leachate is likely not caused by advective leachate transport in groundwater. The mixing of leachate with groundwater in this area is likely controlled by local conductivity and mobilization of vadose-zone leachate into groundwater because of surface-water runoff control installation.
Planned work at the site includes collection and analysis of additional analytes that can help constrain the oxidation-reduction state in the aquifer as well as sediment coring and new monitoring well installation. These investigations can provide insight into the mobility and the source of manganese at the site.
This study has found through assessment of groundwater geochemical conditions that chloride is an indicator of leachate associated with the Lee Acres Landfill, as indicated by chloride-to-bromide ratios and the relation of chloride to sodium. The timing and location of chloride concentrations has implications regarding the understanding of leachate transport at the site. High chloride before 1991 (not long after the landfill’s liquid waste lagoons had dried in early 1986) at GBR-17, GBR-32, GBR-48, and GBR-49 was likely a result of mixing with landfill leachate. The decrease in chloride concentrations after 1991 suggests that active leaching slowed after the liquid waste lagoons had dried. Significant (p-value of less than 0.01) decreases in chloride concentrations at several wells downgradient from the landfill (GBR-32, GBR-48, and GBR-49) after capillary barrier and surface-water runoff control installation in 2005 indicate that these measures were successful at reducing the amount of leachate mobilized to groundwater by infiltrating precipitation at these locations. However, the timing and behavior of chloride and manganese concentrations after 2005, particularly at BLM-62, suggest that at some locations focused recharge connected to the 2005 surface-water runoff control installation resulted in the mobilization of landfill leachate into groundwater. A plausible theory for this transport process is that focused runoff may have mobilized landfill leachate stored in the vadose zone, either mobilizing it directly to groundwater upon infiltration and recharge, or altering the distribution of leachate, allowing groundwater to encounter it during subsequent periods of groundwater-level rise. Leachate stored in the vadose zone that acts as a continued source of groundwater contamination at the site may have been a result of lateral spreading and retention in low-conductivity layers encountered during initial infiltration.
Nitrate results indicate that manganese concentrations in groundwater at the site are controlled by oxidation-reduction conditions. More reducing conditions allow increased manganese mobility. It is not certain, based on the historical monitoring data interpreted here, whether the source of this manganese in groundwater at the site has a natural origin or whether it is a component of landfill leachate. Additional evidence is needed to determine the source or sources of manganese in groundwater at the site; however, this report has provided evidence of the transport processes (specifically, mobilization of leachate in the vadose zone by the recharge of focused runoff coupled with water-level increases) controlling elevated manganese concentrations at a cluster of wells (BLM-62, BLM-77, and BLM-80) directly downgradient from the landfill.
References Cited
Baedecker, M.J., and Back, W., 1979, Hydrogeological processes and chemical reactions at a landfill: Groundwater, v. 17, no. 5, p. 429–437, accessed February 3, 2023, at https://doi.org/10.1111/j.1745-6584.1979.tb03338.x.
Blondes, M.S., Gans, K.D., Engle, M.A., Kharaka, Y.K., Reidy, M.E., Saraswathula, V., Thordsen, J.J., Rowan, E.L., and Morrissey, E.A., 2018, U.S. Geological Survey National produced waters geochemical database (ver. 2.3, January 2018): U.S. Geological Survey data release, accessed February 3, 2023, at https://doi.org/10.5066/F7J964W8.
Brown, D.R., and Stone, W.J., 1979, Hydrogeology of Aztec quadrangle, San Juan County, New Mexico: New Mexico Bureau of Geology and Mineral Resources Map No. 13243, accessed October 20, 2022, at https://geoinfo.nmt.edu/publications/water/hs/home.cfml?volume=1.
Bureau of Land Management [BLM], 2009, Five-year review—Lee Acres Landfill Farmington, New Mexico: Farmington, N. Mex., Bureau of Land Management Farmington Field Office, 126 p., accessed June 22, 2024, at https://semspub.epa.gov/work/06/877978.pdf.
Bureau of Land Management [BLM], 2019, Third five-year review report for the Lee Acres Superfund Site—San Juan, New Mexico: Farmington, N. Mex., Bureau of Land Management Farmington District Office, 121 p., accessed March 17, 2024, at https://semspub.epa.gov/work/06/100018127.pdf.
Cerling, T.E., Pederson, B.L., and Von Damm, K.L., 1989, Sodium-calcium ion exchange in the weathering of shales—Implications for global weathering budgets: Geology, v. 17, no. 6, p. 552–554, accessed February 4, 2023, at https://doi.org/10.1130/0091-7613(1989)017<0552:SCIEIT>2.3.CO;2.
Chapelle, F.H., McMahon, P.B., Dubrovsky, N.M., Fujii, R.F., Oaksford, E.T., and Vroblesky, D.A., 1995, Deducing the distribution of terminal electron-accepting processes in hydrologically diverse groundwater systems: Water Resources Research, v. 31, no. 2, p. 359–371, accessed February 1, 2023, at https://doi.org/10.1029/94WR02525.
Christensen, T.H., Kjeldsen, P., Bjerg, P.L., Jensen, D.L., Christensen, J.B., Baun, A., Albrechtsen, H., and Heron, G., 2001, Biogeochemistry of landfill leachate plumes: Applied Geochemistry, v. 16, no. 7–8, p. 659–718, accessed February 2, 2023, at https://doi.org/10.1016/S0883-2927(00)00082-2.
Craigg, S.D., 2001, Geologic framework of the San Juan structural basin of New Mexico, Colorado, Arizona, and Utah, with emphasis on Triassic through Tertiary rocks: U.S. Geological Survey Professional Paper 1420, 81 p., accessed June 3, 2021, at https://doi.org/10.3133/pp1420.
Davis, S.N., Whittemore, D.O., and Fabryka-Martin, J., 1998, Uses of chloride/bromide ratios in studies of potable water: Groundwater, v. 36, no. 2, p. 338–350, accessed January 10, 2023, at https://doi.org/10.1111/j.1745-6584.1998.tb01099.x.
Geoscience Consultants, Ltd., 1988, Discharge plan application for Giant Bloomfield Refinery, Bloomfield, NM: Montgomery & Andrews, P.A., prepared by Geoscience Consultants, Ltd., 77 p., accessed November 24, 2020, at https://ocdimage.emnrd.nm.gov/Imaging/FileStore/santafeenvironmental/ao/b-51571/penv000gw00042_0007.pdf.
Giant Industries Arizona, Inc., 1991, Giant Refining Company Bloomfield Refinery—Remediation project operating and instruction manual: Farmington, N. Mex., State of New Mexico, Energy, Minerals and Natural Resources Department, Oil Conservation Division, prepared by Giant Industries Arizona, Inc., 184 p., accessed November 24, 2020, at https://ocdimage.emnrd.nm.gov/Imaging/FileStore/santafeenvironmental/ao/b-51571/penv000gw00042_0019.pdf.
Granato, G.E., 1996, Deicing chemicals as source of constituents of highway runoff: Transportation Research Record—Journal of the Transportation Research Board, v. 1533, no. 1, p. 50–58, accessed January 10, 2023, at https://doi.org/10.1177/0361198196153300108.
Gray, E.L., and Ferguson, C.L., 2022, Database of water quality and groundwater elevation within and surrounding the Lee Acres Landfill, New Mexico, 1985–2020: U.S. Geological Survey Data Report 1154, 80 p., accessed December 15, 2022, at https://doi.org/10.3133/dr1154.
He, Y.T., Wilson, J.T., Su, C., and Wilkin, R.T., 2015, Review of abiotic degradation of chlorinated solvents by reactive iron minerals in aquifers: Groundwater Monitoring & Remediation, v. 35, no. 3, p. 57–75, accessed April 28, 2023, at https://doi.org/10.1111/gwmr.12111.
Helsel, D.R., 2012, Statistics for censored environmental data using Minitab® and R (2d ed.): Hoboken, N.J., Wiley, 324 p. [Also available at https://doi.org/10.1002/9781118162729.]
Helsel, D.R., Hirsch, R.M., Ryberg, K.R., Archfield, S.A., and Gilroy, E.J., 2020, Statistical methods in water resources: U.S. Geological Survey Techniques and Methods, book 4, chap.A3, 458 p., accessed February 24, 2024, at https://doi.org/10.3133/tm4A3.
Horowitz, A.J., 1985, A primer on trace metal-sediment chemistry: U.S. Geological Survey Water Supply Paper 2277, 67 p., accessed May 1, 2024, at https://doi.org/10.3133/wsp2277.
Katz, B.G., Eberts, S.M., and Kauffman, L.J., 2011, Using Cl/Br ratios and other indicators to assess potential impacts on groundwater quality from septic systems—A review and examples from principal aquifers in the United States: Journal of Hydrology, v. 397, no. 3–4, p. 151–166, accessed January 6, 2023, at https://doi.org/10.1016/j.jhydrol.2010.11.017.
Kelley, S., Engler, T., Cather, M., Pokorny, C., Yang, C.-H., Mamer, E., Hoffman, G., Wilch, J., Johnson, P., and Zeigler, K., 2014, Hydrologic assessment of oil and gas resource development of the Mancos Shale in the San Juan Basin, New Mexico: New Mexico Bureau of Geology and Mineral Resources Open-File Report 566, 64 p., accessed March 1, 2022, at https://geoinfo.nmt.edu/publications/openfile/downloads/500-599/566/ofr-566_report.pdf.
Keresztesi, Á., Nita, I., Boga, R., Birsan, M., Bodor, Z., and Szép, R., 2020, Spatial and long-term analysis of rainwater chemistry over the conterminous United States: Environmental Research, v. 188, article 109872, 14 p., accessed September 20, 2023, at https://doi.org/10.1016/j.envres.2020.109872.
Kernodle, J.M., 1996, Hydrogeology and steady-state simulation of ground-water flow in the San Juan Basin, New Mexico, Colorado, Arizona, and Utah: U.S. Geological Survey Water-Resources Investigations Report 95–4187, 117 p., accessed February 1, 2023, at https://doi.org/10.3133/wri954187.
Linhoff, B.S., 2022, Deciphering natural and anthropogenic nitrate and recharge sources in arid region groundwater: Science of the Total Environment, v. 848, article 157345, 16 p., accessed February 1, 2023, at https://doi.org/10.1016/j.scitotenv.2022.157345.
Linhoff, B.S., and Lunzer, J.J., 2021, Discovery of a large subsoil nitrate reservoir in an arroyo floodplain and associated aquifer contamination: Geology, v. 49, no. 6, p. 667–671, accessed February 1, 2023, at https://doi.org/10.1130/G47916.1.
LT Environmental, Inc., 2020, Stage 1 abatement plan—Former Giant Bloomfield Refinery, Bloomfield, New Mexico: Western Refining, Inc., prepared by LT Environmental, Inc., 10 p., accessed November 24, 2020, at https://ocdimage.emnrd.nm.gov/Imaging/FileStore/santafeenvironmental/ao/20200911/penv000gw00042_09_11_2020_11_38_27.pdf.
Lyngkilde, J., and Christensen, T.H., 1992a, Redox zones of a landfill leachate pollution plume (Vejen, Denmark): Journal of Contaminant Hydrology, v. 10, no. 4, p. 273–289, accessed April 28, 2024, at https://doi.org/10.1016/0169-7722(92)90011-3.
Lyngkilde, J., and Christensen, T.H., 1992b, Fate of organic contaminants in the redox zones of a landfill leachate pollution plume (Vejen, Denmark): Journal of Contaminant Hydrology, v. 10, no. 4, p. 291–307, accessed April 28, 2024, at https://doi.org/10.1016/0169-7722(92)90012-4.
Marandi, A., and Shand, P., 2018, Groundwater chemistry and the Gibbs Diagram: Applied Geochemistry, v. 97, p. 209–212, accessed April 23, 2021, at https://doi.org/10.1016/j.apgeochem.2018.07.009.
McMahon, P.B., Belitz, K., Reddy, J.E., and Johnson, T.D., 2019, Elevated manganese concentrations in United States groundwater, role of land surface–soil–aquifer connections: Environmental Science & Technology, v. 53, no. 1, p. 29–38, accessed April 23, 2021, at https://doi.org/10.1021/acs.est.8b04055.
McMahon, P.B., and Chapelle, F.H., 2008, Redox processes and water quality of selected principal aquifer systems: Groundwater, v. 46, no. 2, p. 259–271, accessed February 2, 2023, at https://doi.org/10.1111/j.1745-6584.2007.00385.x.
Meybeck, M., 1987, Global chemical weathering of surficial rocks estimated from river dissolved loads: American Journal of Science, v. 287, no. 5, p. 401–428, accessed February 4, 2023, at https://doi.org/10.2475/ajs.287.5.401.
Mueller, D.K., Schertz, T.L., Martin, J.D., and Sandstrom, M.W., 2015, Design, analysis, and interpretation of field quality-control data for water-sampling projects: U.S. Geological Survey Techniques and Methods, book 4, chap. C4, 54 p., accessed October 10, 2023, at https://doi.org/10.3133/tm4C4.
National Atmospheric Deposition Program [NADP], 2022, Precipitation-weighted mean annual concentrations at Mesa Verde National Park in Montezuma, Colorado: National Trends Network, accessed February 9, 2022, at https://nadp.slh.wisc.edu/sites/ntn-CO99/.
National Oceanic and Atmospheric Administration, 2022, Climate Data Online: National Climatic Data Center archived data, accessed February 9, 2022, at https://www.ncdc.noaa.gov/cdo-web.
National Oceanic and Atmospheric Administration, 2023, National Oceanic and Atmospheric Administration’s U.S. Monthly Climate Normals (1991–2020): Farmington Regional Airport, New Mexico, station USW00023090, National Oceanic and Atmospheric Administration National Centers for Environmental Information, accessed on June 29, 2023 at https://www.ncei.noaa.gov/products/land-based-station/us-climate-normals.
Newton, B.T., Mamer, E., and Timmons, S., 2017, Hydrogeology and geochemistry of the Animas River alluvial aquifer after the Gold King Mine Spill, San Juan County, New Mexico: New Mexico Bureau of Geology and Mineral Resources Open-File Report 592, 65 p., accessed May 1, 2022, at https://geoinfo.nmt.edu/publications/openfile/downloads/500-599/592/OFR-592_Animas_River.pdf.
Panno, S.V., Hackley, K.C., Hwang, H.H., Greenberg, S.E., Krapac, I.G., Landsberger, S., and O’Kelly, D.J., 2005, Database for the characterization and identification of the sources of sodium and chloride in natural waters of Illinois: Champaign, Ill., Illinois State Geological Survey Open-File series 2005–1, 15 p., accessed January 10, 2023, at http://library.isgs.illinois.edu/Pubs/pdfs/ofs/2005/ofs2005-01.pdf.
Panno, S.V., Hackley, K.C., Hwang, H.H., Greenberg, S.E., Krapac, I.G., Landsberger, S., and O’Kelly, D.J., 2006, Characterization and identification of Na-Cl sources in ground water: Groundwater, v. 44, no. 2, p. 176–187, accessed January 10, 2023, at https://doi.org/10.1111/j.1745-6584.2005.00127.x.
Paschke, S.S., Kauffman, L.J., Eberts, S.M., and Hinkle, S.R., 2007, Overview of regional studies of the transport of anthropogenic and natural contaminants to public-supply wells, section 1 of Paschke, S.S., ed., Hydrogeologic settings and ground-water flow simulations for regional studies of the transport of anthropogenic and natural contaminants to public-supply wells—Studies begun in 2001: U.S. Geological Survey Professional Paper 1737–A, 17 p., accessed February 2, 2023, at https://pubs.usgs.gov/pp/2007/1737a/Section1.pdf.
Pederson, J.L., and Dehler, C.M., 2004, Geologic map of the Farmington North quadrangle, San Juan County, New Mexico: New Mexico Bureau of Geology and Mineral Resources Open-File Map Series, OFGM 82, accessed November 8, 2022, at https://geoinfo.nmt.edu/publications/maps/geologic/ofgm/details.cfml?volume=82.
Peter, K.D., Williams, R.A., and King, K.W., 1987, Hydrogeologic characteristics of the Lee Acres Landfill area, San Juan County, New Mexico: U.S. Geological Survey Water-Resources Investigations Report 87–4246, 69 p., accessed February 1, 2023, at https://doi.org/10.3133/wri874246.
Scanlon, B.R., Reedy, R.C., Stonestrom, D.A., Prudic, D.E., and Dennehy, K.F., 2005, Impact of land use and land cover change on groundwater recharge and quality in the southwestern US: Global Change Biology, v. 11, no. 10, p. 1577–1593, accessed April 15, 2024, at https://doi.org/10.1111/j.1365-2486.2005.01026.x.
Schoonen, M.A.A., Devoe, V., and Brown, C.J., 1995, Bromide in Long Island groundwaters and surface waters: Stony Brook, N.Y., Long Island Groundwater Research Institute and Department of Earth and Space Sciences, Stony Brook University, p. 188–126, accessed on January 10, 2023, at https://ir.stonybrook.edu/xmlui/bitstream/handle/11401/65016/SCHOON00.pdf?sequence=1.
Stone, W.J., Lyford, F.P., Frenzel, P.F., Mizell, N.H., and Padgett, E.T., 1983, Hydrogeology and water resources of San Juan Basin, New Mexico: New Mexico Bureau of Mines and Mineral Resources Hydrologic Report 6, 70 p., accessed February 5, 2023, at https://geoinfo.nmt.edu/publications/water/hr/6/HR6.pdf.
Thornthwaite, C.W., 1948, An approach towards a rational classification of climate: Geographical Review, v. 38, no. 1, p. 55–94, accessed February 3, 2024, at https://doi.org/10.2307/210739.
U.S. Environmental Protection Agency [EPA], 2004, Record of decision for the Lee Acres Landfill superfund site, Farmington, New Mexico: U.S. Environmental Protection Agency Region 6 Superfund Division, 92 p., accessed January 21, 2021, at https://semspub.epa.gov/work/06/171035.pdf.
U.S. Environmental Protection Agency [EPA], 2023, Secondary drinking water standards—Guidance for nuisance chemicals: U.S. Environmental Protection Agency website, accessed February 11, 2024, at https://www.epa.gov/sdwa/secondary-drinking-water-standards-guidance-nuisance-chemicals.
Vengosh, A., and Pankratov, I., 1998, Chloride/bromide and chloride/fluoride ratios of domestic sewage effluents and associated contaminated ground water: Groundwater, v. 36, no. 5, p. 815–824, accessed January 7, 2023, at https://doi.org/10.1111/j.1745-6584.1998.tb02200.x.
Ward, A.W., 1990, Geologic map emphasizing the surficial deposits of the Farmington 30’ X 60’ quadrangle, New Mexico and Colorado: U.S. Geological Survey Miscellaneous Investigations Series Map I-1978, accessed November 17, 2021, at https://ngmdb.usgs.gov/Prodesc/proddesc_10056.htm.
Wilcoxon, F., 1945, Individual comparisons by ranking methods: Biometrics Bulletin, v. 1, no. 6, p. 80–83, accessed February 24, 2024, at https://doi.org/10.2307/3001968.
Witt, M.E., Klecka, G.M., Lutz, E.J., Ei, T.A., Grosso, N.R., and Chapelle, F.H., 2002, Natural attenuation of chlorinated solvents at Area 6, Dover Air Force Base—Groundwater biogeochemistry: Journal of Contaminant Hydrology, v. 57, no. 1–2, p. 61–80, accessed April 28, 2023, at https://doi.org/10.1016/S0169-7722(01)00218-2.
Datums
Vertical coordinate information is referenced to the North American Vertical Datum of 1988 (NAVD 88), unless otherwise indicated.
Horizontal coordinate information is referenced to the North American Datum of 1983 (NAD 83).
Elevation, as used in this report, refers to distance above the vertical datum.
Supplemental Information
Concentrations of chemical constituents in water are given in either milligrams per liter (mg/L), micrograms per liter (µg/L), or millimoles per liter (mmol/L).
Hydraulic conductivity of groundwater is given as feet per day (ft/d), which is simplified from volumetric flux units (for instance gallons per square foot per day).
A water year is the 12-month period from October 1 through September 30 of the following year and is designated by the calendar year in which it ends.
Abbreviations
BLM
Bureau of Land Management
EPA
U.S. Environmental Protection Agency
GBR
Giant Bloomfield Refinery
LAGBRD
Lee Acres-Giant Bloomfield Refinery Database
NADP
National Atmospheric Deposition Program
NMED
New Mexico Environment Department
NTN
National Trends Network
redox
oxidation-reduction
ROD
record of decision
RPD
relative percentage difference
USGS
U.S. Geological Survey
Director, New Mexico Water Science Center
U.S. Geological Survey
6700 Edith Blvd. NE
Albuquerque, NM 87113
For additional information, visit
https://www.usgs.gov/centers/nm-water
Publishing support provided by
U.S. Geological Survey Science Publishing Network
Lafayette and Baltimore Publishing Service Centers
Disclaimers
Any use of trade, firm, or product names is for descriptive purposes only and does not imply endorsement by the U.S. Government.
Although this information product, for the most part, is in the public domain, it also may contain copyrighted materials as noted in the text. Permission to reproduce copyrighted items must be secured from the copyright owner.
Suggested Citation
Gray, E.L., and Ferguson, C.L., 2025, Geochemical and hydrological investigations of historical data collected at the Lee Acres Landfill and Giant Bloomfield Refinery, New Mexico, 1985–2020: U.S. Geological Survey Scientific Investigations Report 2025–5091, 35 p., https://doi.org/10.3133/sir20255091.
ISSN: 2328-0328 (online)
Study Area
| Publication type | Report |
|---|---|
| Publication Subtype | USGS Numbered Series |
| Title | Geochemical and hydrological investigations of historical data collected at the Lee Acres Landfill and Giant Bloomfield Refinery, New Mexico, 1985–2020 |
| Series title | Scientific Investigations Report |
| Series number | 2025-5091 |
| DOI | 10.3133/sir20255091 |
| Publication Date | December 08, 2025 |
| Year Published | 2025 |
| Language | English |
| Publisher | U.S. Geological Survey |
| Publisher location | Reston, VA |
| Contributing office(s) | New Mexico Water Science Center |
| Description | viii, 35 p. |
| Country | United States |
| State | New Mexico |
| Other Geospatial | Lee Acres Landfill and Giant Bloomfield Refinery |
| Online Only (Y/N) | Y |