

Flood-inundation maps of the Current and Jacks Fork Rivers including the Ozark National Scenic Riverways, southeast Missouri, 2023
Links
- Document: Report (17 MB pdf) , HTML , XML
- Dataset: USGS National Water Information System database - USGS water data for the Nation
- Data Release: USGS data release - Hydraulic models and geospatial products associated with flood-inundation mapping of the Current and Jacks Fork Rivers including the Ozark National Scenic Riverways, Southeast Missouri, 2022–25
- NGMDB Index Page: National Geologic Map Database Index Page
- Download citation as: RIS | Dublin Core
Acknowledgments
The authors acknowledge funding provided by the South Central Council of Governments and the Ozark Foothills Regional Planning Commission. The authors also acknowledge the Missouri Department of Natural Resources, the National Park Service, and the U.S. Army Corps of Engineers for funding the operation and maintenance of the streamgages used for this study. Lastly, the authors acknowledge the National Weather Service for their continued support of the U.S. Geological Survey Flood Inundation Mapping Program.
Abstract
Digital flood-inundation maps for a 131.8-mile reach of the Current River and a 44.6-mile reach of the Jacks Fork River, in southeast Missouri, were created by the U.S. Geological Survey (USGS) in cooperation with the Ozark Foothills Regional Planning Commission and the South Central Ozark Council of Governments. The maps also encompass the 134 miles of the Current and Jacks Fork Rivers within the Ozark National Scenic Riverways, which is the first national park area to protect a river system. The flood-inundation maps, which can be accessed through the USGS Flood Inundation Mapping Program website at https://water.usgs.gov/osw/flood_inundation/, depict estimates of the areal extent and depth of flooding corresponding to selected water levels (hereafter referred to as “stages”) at eight reference USGS streamgages—five on the Current River (USGS station numbers 07064440, 07064533, 07066510, 07067000, and 07068000) and three on the Jacks Fork River (USGS station numbers 07065200, 07065495, and 07066000). Near-real-time stages at these streamgages may be obtained from the USGS National Water Information System at https://doi.org/10.5066/F7P55KJN or the National Weather Service National Water Prediction Service at http://water.noaa.gov/, which also forecasts flood hydrographs at four of these sites (USGS station numbers 07067000, 07068000, 07065495, and 07066000).
Flood profiles were computed for seven of the eight map reaches by means of two-dimensional hydraulic models and the remaining reach by a one-dimensional hydraulic model. The models were calibrated by using stage-streamflow relations or streamflow measurements at the USGS streamgages and from high-flow stage measurements from water-level loggers distributed throughout the reaches.
The hydraulic models were used to compute water-surface profiles for flood stages at 1-foot intervals referenced to the streamgage datums. The profile stages ranged from the National Weather Service “action stage” or near bankfull, to a stage exceeding the highest recorded water level at each streamgage. The simulated water-surface profiles were then combined with a digital elevation model (derived from light detection and ranging data having a nonvegetated vertical accuracy of a maximum 10-centimeter root mean square error) to delineate the area flooded at each water level and the associated water depths.
The availability of these maps, along with information regarding current stage from the USGS streamgage and forecasted high-flow stages from the National Weather Service, will provide emergency management personnel, resource managers, and residents with information that is critical for flood-response activities such as evacuations and road closures, as well as for postflood recovery efforts.
Introduction
Historic widespread flooding in southern Missouri, and much of the southern Midwest, in late April and early May 2017 (Heimann and others, 2018) resulted in streamflow and stage peaks of record (at that time) at seven of eight streamgages along the Current and Jacks Fork Rivers in Missouri (U.S. Geological Survey [USGS], 2021c). The calculated flood recurrence intervals of the 2017 peaks were 200 to 500 years (0.4- to 0.2-percent annual exceedance probabilities) at selected streamgages on these rivers (Heimann and others, 2018). Floodwaters from the 2017 event damaged many commercial and residential properties in and near the communities of Doniphan and Van Buren along the Current River, and Eminence along the Jacks Fork River (fig. 1). Damage estimates from this event for the State of Missouri were $86 million (State Emergency Management Agency, 2017). The flooding during this event required the rescue of several visitors in portions of the Ozark National Scenic Riverways—the first national park area to protect a river system (National Park Service, 2024c)—and resulted in damage to many park facilities including campgrounds and river access points (National Park Service, 2017). Localized flooding along the upper Current River in November of 2024 resulted in new peaks of record at two USGS streamgages (station numbers 07064440 and 07064533; fig. 2; USGS, 2024), and substantial damage to park infrastructure in the affected reaches (National Park Service, 2024b). Additional recent floods on the Current and Jacks Fork Rivers that affected park operations were documented in May 2019, July 2014, April–May 2011, August 2009, March 2008, and May 2002 (National Park Service, 2024a).
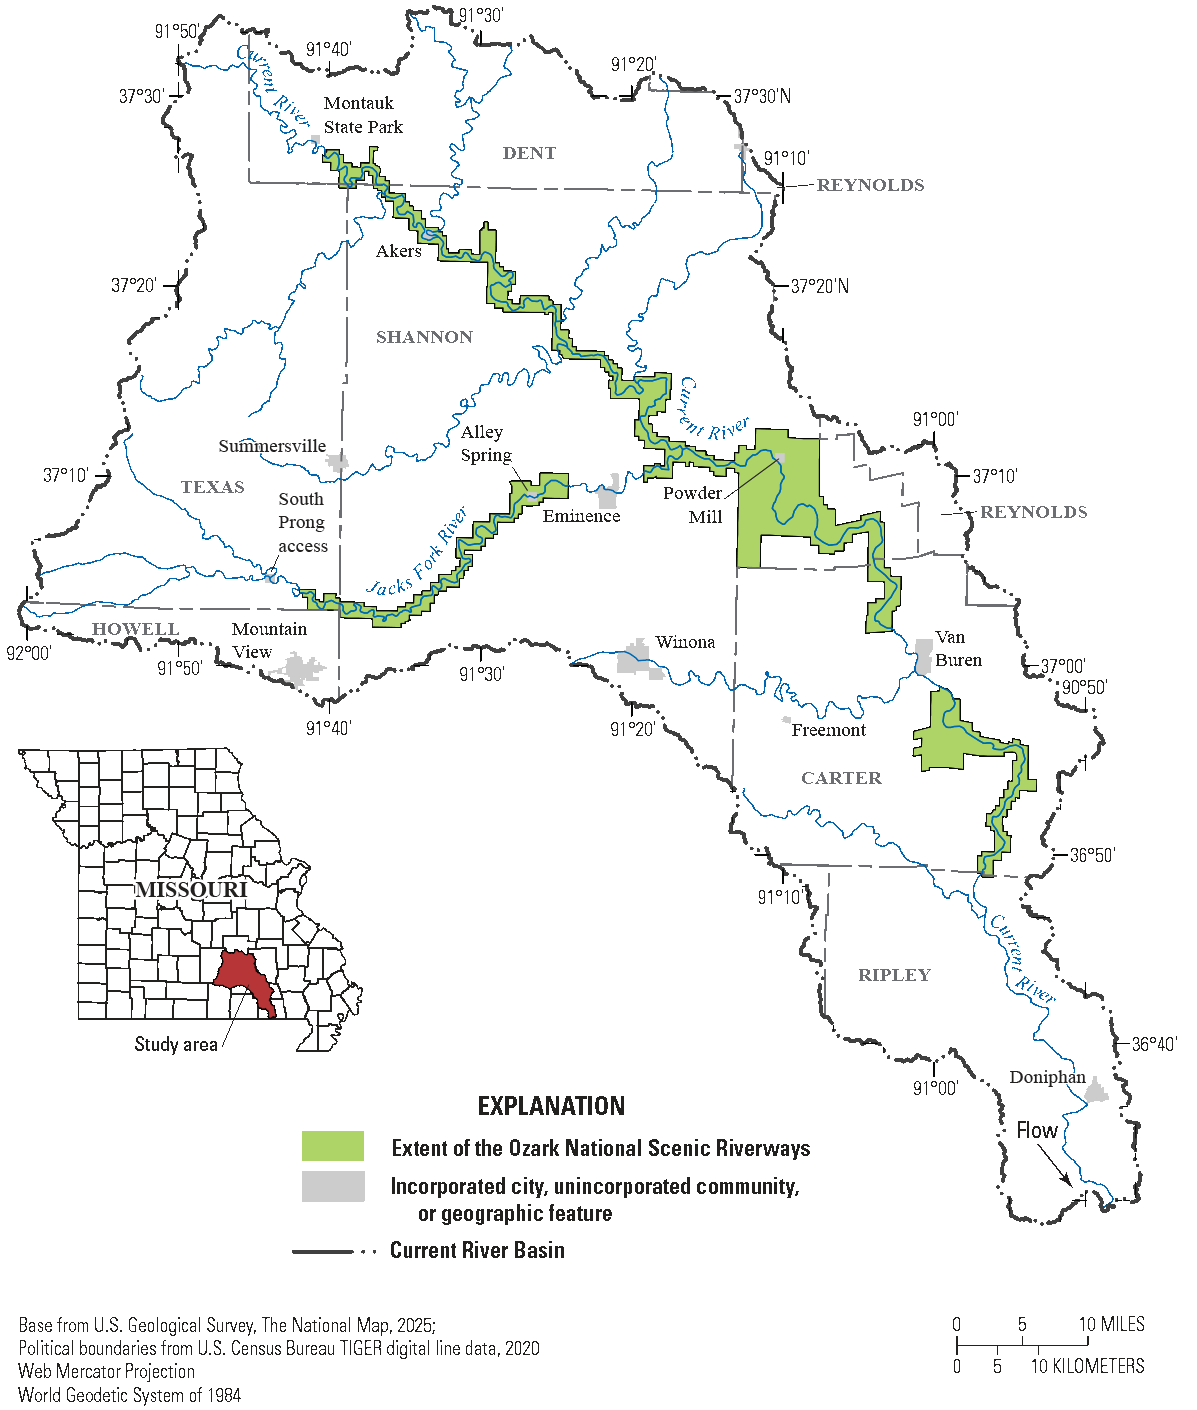
Map showing Current River study basin and extent of the Ozark National Scenic Riverways.
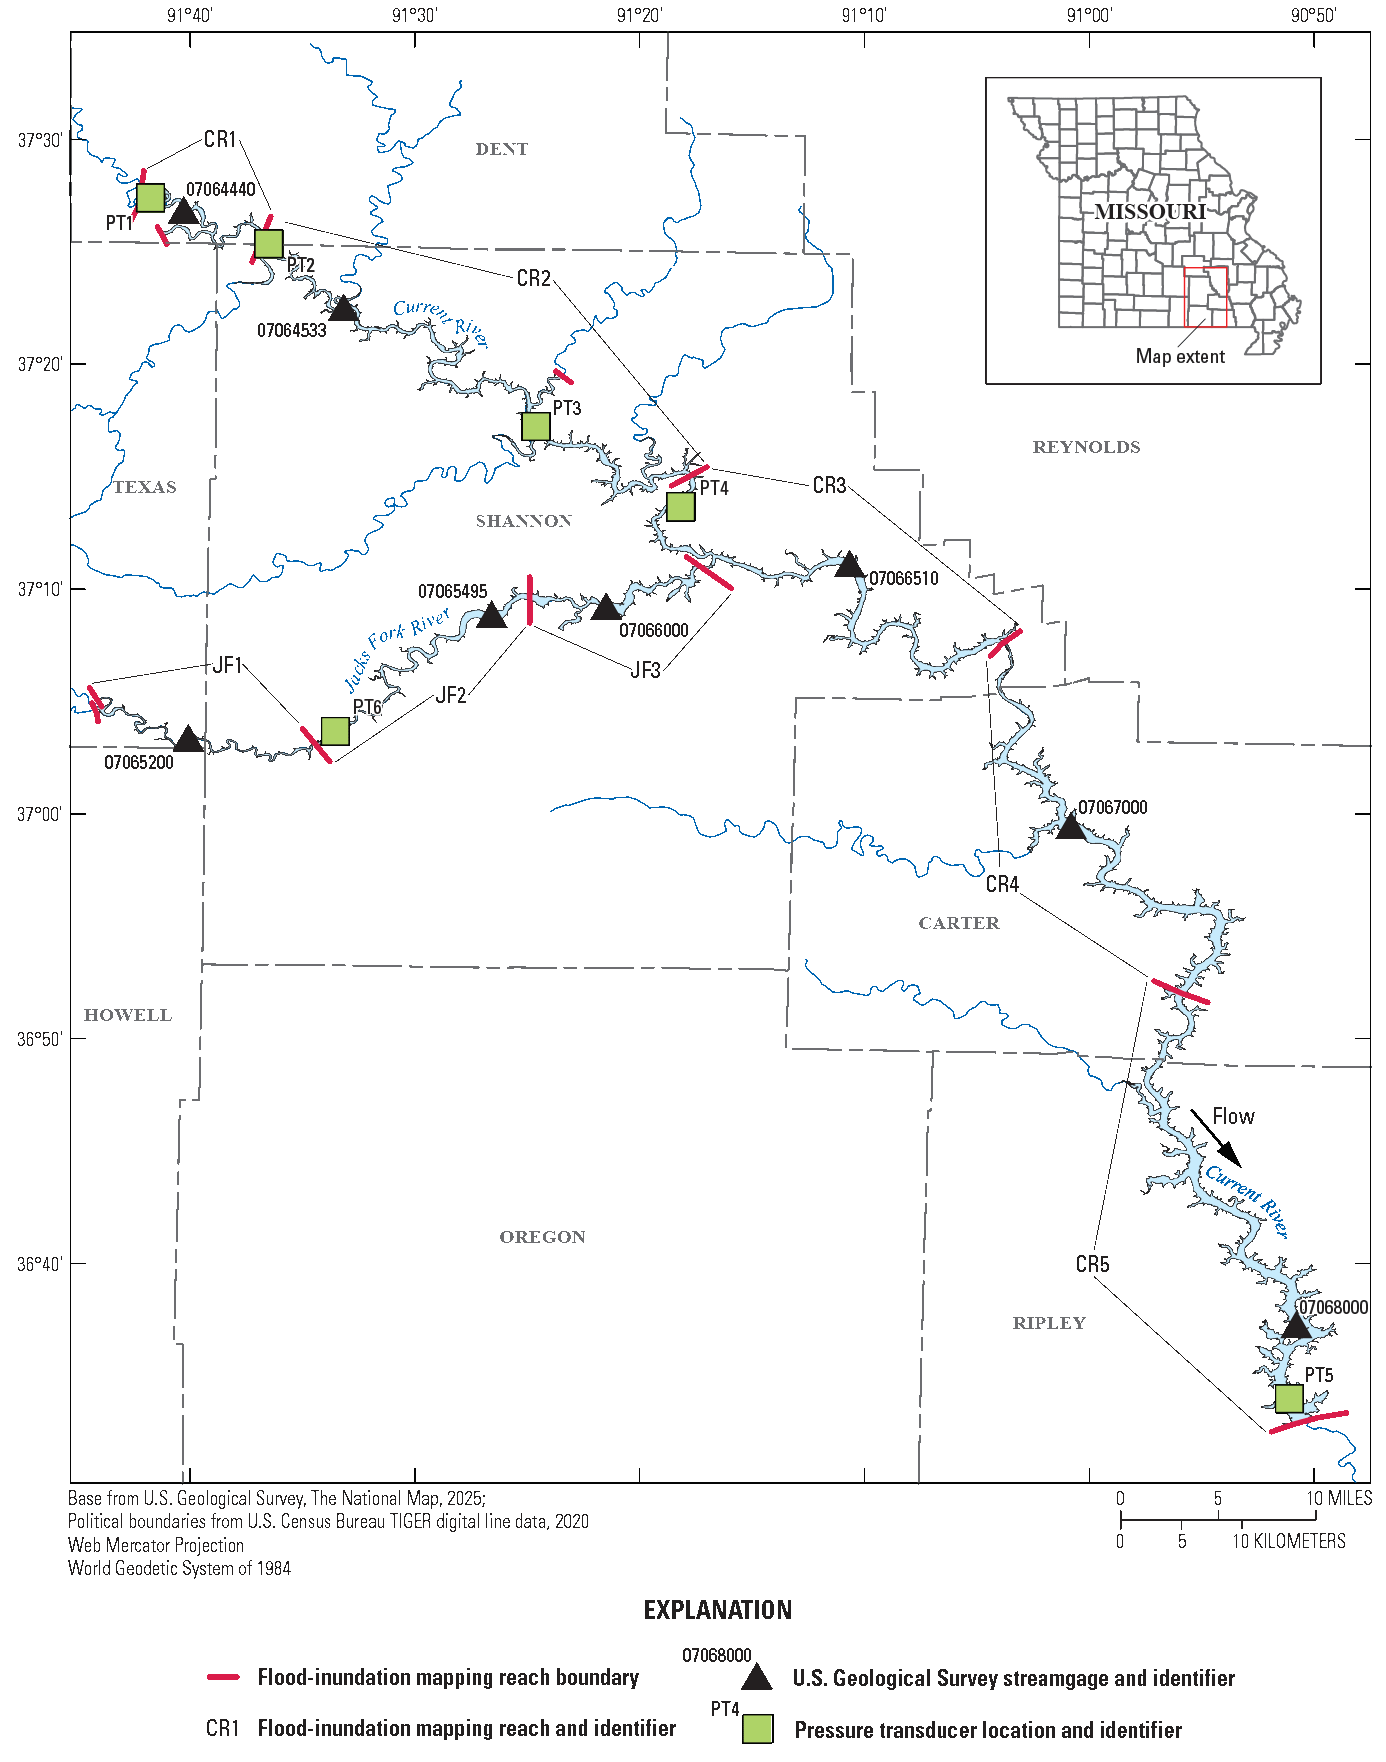
Map showing location of flood-inundation mapping reaches, U.S. Geological Survey streamgages, and pressure transducers used in study. Information from U.S. Geological Survey (2021c) and Heimann and others (2025).
Before this study, emergency responders and resource managers in communities along the Current and Jacks Fork Rivers relied on several information sources to make decisions on how to best alert the public and mitigate flood damages. One source is the Federal Emergency Management Agency (FEMA) flood insurance studies (FISs) for counties and communities in the study area (Butler County [FEMA, 2010]; Ripley County [FEMA, 2019]; Carter County [FEMA, 2024a]; Dent County [FEMA, 2023]; and Shannon County [FEMA, 2024b]). A second source of information are the USGS streamgages from which current (USGS, 2021c) and historical stages and streamflow, including annual peak flows, can be obtained (table 1). A third source of flood-related information is the National Weather Service (NWS) National Water Prediction Service (NWPS), which displays the USGS stage data from the streamgages and also issues forecasts of stage at selected sites, including four of the sites used in this study (USGS station numbers 07067000, 07068000, 07065495, and 07066000) (NWS, 2024a).
Table 1.
U.S. Geological Survey streamgage information for Current and Jacks Fork Rivers, Missouri.[Station location is shown in figure 2. mi2, square mile; ft, foot; NAVD 88, North American Vertical Datum of 1988; ft3/s, cubic foot per second; site information from U.S. Geological Survey (2021c)]
Although the stage at a USGS streamgage is particularly useful for residents in the immediate vicinity of the streamgage, it is of limited use to residents farther upstream or downstream because the water-surface elevation is not constant along the entire stream reach. Knowledge of a water level at a streamgage is difficult to translate into depth and areal extent of flooding at points distant from the streamgage. One way to address these informational gaps is to produce a library of flood-inundation maps that are referenced to the stages recorded at the USGS streamgage. By referring to the appropriate map, emergency responders can discern the severity of flooding (depth of water and areal extent), identify roads that are or will soon be flooded, and make plans for notification or evacuation of residents in danger for some distance upstream and downstream from the streamgage. In addition, the capability to visualize the potential extent of flooding has been shown to motivate residents to take precautions and heed warnings that they previously might have disregarded. In 2021, the USGS, in cooperation with the South Central Ozark Council of Governments and Ozark Foothills Regional Planning Commission, began a project to produce a library of flood-inundation maps for reaches of the Current and Jacks Fork Rivers, which include the Ozark National Scenic Riverways.
Purpose and Scope
This report describes the development of a series of estimated flood-inundation maps for a 131.8-mile reach of the Current River and 44.6-mile reach of the Jacks Fork River in southeast Missouri and identifies where the maps can be accessed and ancillary data (geographic information system [GIS] flood polygons and depth grids) can be downloaded. The upstream extent of the series of flood-inundation maps of the Current River is 1.9 miles upstream from Montauk State Park, and the downstream extent is 5.8 miles downstream from Doniphan (fig. 1). The flood-inundation maps referenced to streamgages on the Jacks Fork River extend from the South Prong access downstream to 0.4 mile upstream from the confluence of the Jacks Fork River with the Current River (fig. 1). The maps were produced for flood levels referenced to the stage recorded at eight reference USGS streamgages—five reference streamgages on the Current River and three on the Jacks Fork River (table 1, fig. 2). The map libraries in each reach cover a range in stage from the NWS “action stage” (NWS, 2024b), or approximately bankfull, up to a stage exceeding the highest recorded stage at the reference streamgage in each map reach.
Study Area Description
The Current River and its primary tributary, the Jacks Fork River, are located within the Salem Plateau of the Ozark Plateaus Physiographic Province (Fenneman, 1938). The area is characterized by rolling hills and rugged terrain, with narrow steep-walled valleys and generally thin soils. The Current and Jacks Fork River Basins have incised deep valleys with as much as several hundred feet of local relief (Mugel and others, 2009); however, uplands between valleys have a gentle rolling topography with relief of less than 100 feet (ft; Jacobson and Primm, 1997). Karst features, including caves, springs, and spring-fed streams are present throughout most of the study area. About 80 percent of the Current River Basin is forested, with grasslands constituting about 16 percent of the basin (Wilkerson, 2003), whereas about 76 percent of the Jacks Fork River Basin is forested, with grassland and cropland constituting about 23 percent of the basin (Wilkerson, 1999). The cultivated land in these basins is primarily restricted to valleys and creek bottoms, whereas cleared upland areas are used for pasture and livestock (Chapman and others, 2002). About 32 percent of the Current River Basin is in public land holdings (Wilkerson, 2003), whereas about 19 percent of the Jacks Fork River Basin is in public land ownership (Wilkerson, 1999).
The slope of fourth order and larger streams in the Current River Basin were determined to be 1.2 to 84.5 feet per mile, and the Current River mainstem has an average slope of 3.9 feet per mile (Wilkerson, 2003). The average slope of the Jacks Fork River is 7.1 feet per mile (Wilkerson, 1999). The hydraulic characteristics of the modeled river reaches also are affected by 27 structures, consisting of 13 culverts, 2 low-water road crossings, 11 two-lane road crossings, and 1 four-lane road crossing, which have the potential to affect water-surface elevations during floods along the study reaches.
The Ozark National Scenic Riverways park, established on August 27, 1964, to protect 134 miles of the Current and Jacks Fork Rivers in southeast Missouri (fig. 1), is encompassed in the study area. Within the boundaries of the park are more than 300 caves; numerous springs including Big Spring, one of the largest springs in the United States; and a variety of recreation opportunities for about 1.5 million visitors per year (National Park Service, 2024c).
Previous Studies
Previous investigations of the flood characteristics of the study area include historical flood-inundation maps, information on the 2017 flood-of-record on the Current and Jacks Fork Rivers, and county and community flood-insurance studies. The results of this study supersede the results from a previous USGS study by Alexander (1990a, 1990b) in which flood-inundation areas were delineated for portions of a 134-mile combined reach of the Current River and Jacks Fork River within the Ozark National Scenic Riverways. Information on the April–May 2017 flood in the southern Midwest States, including the calculated flood-frequency estimates for selected Current River and Jacks Fork River streamgages, was provided in Heimann and others (2018). This event produced the flood of record at all streamgages used in this study with the exception of Jacks Fork near Mountain View, Mo. (USGS station number 07065200; refer to fig. 2 for location). The FEMA county and community FISs in the study area include the determination of flood-frequency analyses for primary streams and rivers in Butler County (FEMA, 2010), Ripley County (FEMA, 2019), Carter County (FEMA, 2024a), Dent County (FEMA, 2023), and Shannon County (FEMA, 2024b).
Creation of the Flood-Inundation-Map Libraries
The USGS has standardized the procedures for creating flood-inundation maps for flood-prone communities (USGS, 2021a) so that the process followed, and products produced, are similar regardless of which USGS office is responsible for the work. Tasks specific to the development of the flood maps for this study included (1) the surveying of bridge cross-sections and river thalweg within the study reach, (2) installation of temporary water-level loggers (hereafter referred to as “pressure transducers” [PTs]) in selected ungaged reaches of the Current River and Jacks Fork River, (3) development of hydraulic models including the acquisition of hydraulic models and calibration of energy-loss factors (roughness coefficients) in the stream channel and flood plain and determination of quasi-unsteady flow data for model input, (4) computation of water-surface profiles using the U.S. Army Corps of Engineers (USACE) Hydrologic Engineering Center’s River Analysis System (HEC–RAS) computer program (USACE, 2022), (5) production of estimated flood-inundation maps for selected stream stages using HEC–RAS and a GIS, and (6) preparation of the maps as shapefile polygons that depict the areal extent of flood inundation at various stages and as depth grids that provide the depth of floodwaters for display on a USGS flood-inundation mapping application (USGS, 2021a).
Computation of Water-Surface Profiles
The two-dimensional and one-dimensional hydraulic models used in this study were developed by WSP Consultants (Alecia Williams, WSP consultants, written commun., 2020) for updating the FISs for Carter, Shannon, Dent, Ripley, and Butler Counties. Two-dimensional models were used for four of the five mapping reaches of the Current River and all three reaches along the Jacks Fork River. A one-dimensional model was used for the downstream-most Current River reach referenced to the Current River at Doniphan, Mo., streamgage (USGS station number 07068000; fig. 2). The hydraulic models were revised with updated bathymetry and the addition of selected bridge and culvert structures. The models were calibrated, and flood-profiles were produced, using HEC–RAS version 6.3.1 (USACE, 2022). HEC–RAS is a one- or two-dimensional model for simulation of water-surface profiles with steady-state (gradually varied) or unsteady-state flow computation options. Quasi-unsteady (temporally varied or “stair-stepped”) streamflow conditions were used in this study such that inflows were incrementally increased at 24-hour intervals throughout the range of streamflows in the reference streamgage stage-streamflow relations (hereafter referred to as “ratings”).
Hydrologic Data
The study reach included eight USGS reference streamgages (hereafter referred to as “streamgages”; fig. 2; table 1) that began operation between 1913 and 2007 (USGS, 2021c). Data from six PTs temporarily installed for this project to monitor high-flow events also were used in model calibration in areas away from the USGS streamgage locations (fig. 2). Stage is measured at the USGS streamgages every 15 minutes, transmitted hourly by a satellite radio in the streamgage, and made available through the USGS National Water Information System (NWIS; USGS, 2021c). Stage data from the streamgages and PTs are referenced to a local datum but can be converted to water-surface elevations by adding the datum elevations, referenced to the North American Vertical Datum of 1988 (NAVD 88), listed in tables 1 and 2, respectively. Continuous records of streamflow are computed from a stage-streamflow rating, which has been developed for each streamgage, and are available through the USGS NWIS (USGS, 2021c). The Current River above Powder Mill, Mo. (USGS station number 07066510) is a stage-only streamgage and, therefore, does not have a stage-streamflow rating available. Pressure transducers were established near or above bankfull conditions adjacent to the channel, and datums were established using global positioning system (GPS) surveys consistent with Level IV survey techniques (Rydlund and Densmore, 2012). Water levels at the PTs were measured every 15 minutes, and data were downloaded following substantial high-flow events.
Table 2.
Vertical datums of pressure transducers used in study.[mi2, square mile; ft, foot; NAVD 88, North American Vertical Datum of 1988; information from Heimann and others (2025)]
The inflows used in the model simulations were taken from the current stage-streamflow rating at each streamgage (or a drainage-area adjusted range of streamflows based on the stage-streamflow rating at Van Buren in the case of the Current River above Powder Mill, Mo., streamgage [USGS station number 07066510]). The inflows ranged from near zero flow to a maximum flow that exceeded the 500-year recurrence interval (0.2-percent annual exceedance probability) flow as determined from the USGS StreamStats application (USGS, 2021b). The streamgage-derived streamflows were adjusted, as necessary, to account for tributary inflows using internal boundary conditions in the models. These adjustments were estimated by applying a drainage-area ratio correction to the main-channel flows and using internal boundary conditions placed at locations corresponding to 5- to 10-percent changes in drainage area from the upstream model extent. The range of inflows used in the model simulations (table 3) was obtained from the streamgage stage-streamflow rating or, in the case of the stage-only streamgage (Current River above Powder Mill, Mo. [USGS station number 07066510]), a drainage-area adjusted range of streamflows based on the stage-streamflow rating at the downstream Current River at Van Buren, Mo., streamgage (USGS station number 07067000).
Table 3.
Range of simulated conditions at each reference streamgage for the eight flood-inundation map reaches in this study.[ft, foot; NAVD 88, North American Vertical Datum of 1988; ft3/s, cubic foot per second; information from Heimann and others (2025)]
| Map reach (refer to fig. 2) | Reference streamgage | Stages (and number) of water-surface profiles (ft) | Water-surface elevations (ft, NAVD 88) | Simulated streamflows (ft3/s) |
|---|---|---|---|---|
| CR1 | Current River at Montauk State Park, Mo. | 5–21 (17) | 899.42–915.42 | 1,080–29,000 |
| CR2 | Current River above Akers, Mo. | 4–37 (34) | 772.26–805.26 | 2,760–61,200 |
| CR3 | Current River above Powder Mill, Mo. | 6–44 (39) | 552.60–588.60 | 4,500–137,000 |
| CR4 | Current River at Van Buren, Mo. | 10–40 (31) | 453.01–483.01 | 14,200–208,000 |
| CR5 | Current River at Doniphan, Mo. | 10–35 (26) | 331.42–356.42 | 20,300–207,000 |
| JF1 | Jacks Fork near Mountain View, Mo. | 4–31 (28) | 840.06–867.06 | 1,030–57,200 |
| JF2 | Jacks Fork at Alley Spring, Mo. | 5–24 (20) | 661.95–678.95 | 1,540–73,800 |
| JF3 | Jacks Fork at Eminence, Mo. (Current River above Powder Mill, Mo.)1 | 6–28 (23) for (4, 8, 12, 16, 20, 24, 28, 32, 36, 40, 44 ft) | 622.18–643.18 (550.60–590.60) |
3,500–95,600 (2,200–145,000) |
Topographic and Bathymetric Data
All topographic data used in this study are referenced vertically to NAVD 88 and horizontally to the North American Datum of 1983. The Butler and Ripley County model terrains were obtained from a digital elevation model (DEM) that was derived from light detection and ranging (lidar) data that were collected December 2015–March 2016 and processed by Atlantic, LLC (USGS, 2021d). Terrain data for the remaining study areas were collected and processed by Quantum Spatial, Inc., and acquired between December 12, 2017, and April 24, 2018 (USGS, 2021d). As per USGS V1.2 QL2 data accuracy specifications (Heidemann, 2018), the lidar data required a nonvegetated vertical accuracy of a maximum 10 centimeters (cm; actual was 5.49 cm) root mean square error and a vegetated vertical accuracy of a maximum 30 cm (actual was 16.92 cm) at the 95th percentile (USGS, 2021d). The accuracy specifications met or exceeded the National Map Accuracy standards for vertical and horizontal accuracy guidelines for 2-ft contours (American Society for Photogrammetry and Remote Sensing, 1990, 2004).
Because lidar data cannot provide ground elevations below the water surface of a stream, the lidar-derived DEM data used in the hydraulic models were augmented with channel and bridge survey data collected by USGS field crews between December 2021 and May 2023. Channel water depths in the thalweg were acquired using an acoustic Doppler current profiler, and water-surface elevations were obtained using GPS with real-time kinematic technology or static observations. Water depths were subtracted from the interpolated water-surface elevations to obtain channel depths. Additional bathymetric data were acquired by “tape down” measurements from bridge decks. A differential GPS with real-time kinematic technology was used to derive reference elevations for the bridge decks from which channel bed elevations were derived. A Level IV survey procedure (Rydlund and Densmore, 2012) was used to acquire reference point elevations with a resulting vertical accuracy of the reference points within 0.32 ft. The bathymetric data were incorporated into the HEC–RAS model by merging the bathymetry DEM with the terrain DEM (Heimann and others, 2025).
Hydraulic Structures
Twenty-seven modeled structures, consisting of 13 culverts, 2 low-water road crossings, 11 two-lane road crossings, and 1 four-lane road crossing, have the potential to affect water-surface elevations during floods along the stream reaches. Bridge-geometry data were obtained from field surveys completed by USGS personnel and from bridge plans obtained from the Missouri Department of Transportation (Bryan Hartnagel, Missouri Department of Transportation, written commun., 2022).
Energy-Loss Factors
Hydraulic analyses require the estimation of energy losses that result from frictional resistance exerted by a channel on flow. These energy losses are quantified by the Manning’s roughness coefficient (n-value). Initial (precalibration) n-values were selected on the basis of National Land Cover Data, field observations, and tabulated estimates of n-values (Chow, 1959).
As part of the calibration process, the initial n-values were varied by flow and adjusted until the differences between simulated and observed water-surface elevations at the streamgage within each map reach and elsewhere along the study reach were minimized. The final n-values ranged from 0.027 to 0.040 for the main channel and from 0.030 to 0.200 for the overbank areas modeled in this analysis (Heimann and others, 2025). The lowest channel coefficients were placed in downstream reaches of the mapping area with fine-material substrate, and the highest were placed in sinuous, large substrate upstream reaches of the mapping area. The lowest roughness coefficients on the flood plain were placed in open water bodies and grasslands, and the highest were placed in densely forested areas.
Hydraulic Model
The HEC–RAS analysis for this study was done by using multiple two-dimensional hydraulic models and a single one-dimensional hydraulic model. The models were run using a quasi-unsteady-state flow condition because model input data consisted of a “stair-stepped” temporally varied flow regime and specified downstream boundary conditions used to match the target stage-streamflow rating. The range of streamflows that were used in the models were discussed in the “Hydrologic Data” section. The models were used to generate water-surface profiles at target elevations that coincided with 1-ft increments of stage, referenced to the local streamgage datum. Subcritical (tranquil) flow regime was assumed for the simulations. The extent of the supplied hydraulic models did not coincide with the flood-inundation mapping reaches; therefore, some of the flood-inundation mapping reaches were comprised of more than one hydraulic model. One model was used in reaches CR1, CR5, JF1, JF2, and JF3; two “chained” models (models were run in sequence starting with the downstream reach) were used in reaches CR2 and CR3; and four chained models were used in reach CR4. Normal depth, based on an estimated average water-surface slope, was used as a given reach’s downstream boundary condition. In the case of the chained models, normal depth was used as the downstream boundary condition of the most downstream model. The downstream boundary condition of the other models in the chain were obtained from a water-surface elevation time series at the overlap location of the next downstream model in the chain. For the Jacks Fork River at Eminence reach (map reach JF3; fig. 2), the downstream boundary conditions also included additional scenarios to represent the effects of the downstream Current River at high-flow conditions. In these scenarios, the downstream boundary condition of the lower Jacks Fork model near the junction with the Current River were set to varying Current River water-surface elevations representing a range of Current River flood conditions. More detailed information regarding the hydraulic models used in each map reach of this study can be obtained from Heimann and others (2025).
Developed stage-streamflow ratings at the streamgages, water-surface elevations from PTs, and discrete stage-streamflow measurements were used in calibrating the models. Model calibration for each map reach was accomplished by adjusting Manning’s n-values until the results of the hydraulic computations closely agreed with the observed water-surface elevations for given flows.
Map Reach CR1—Current River near Montauk State Park
The hydraulic model used for representing reach CR1 was calibrated to the stage-streamflow rating at the USGS streamgage Current River at Montauk State Park, Mo. (station number 07064440; hereafter referred to as the “Montauk streamgage”) along with water-level data from PT1 (fig. 2). The simulated elevation-streamflow rating at the streamgage location in the model reach was compared to rating number 3.0 at the Montauk streamgage from the action stage of 5.0 ft through 20.0 ft. The absolute differences between the USGS rating and simulated values at 1-ft increments ranged from 0.03 to 0.71 ft, with a mean absolute difference of 0.48 ft (table 4). The model also was calibrated to PT1 located near the upstream end of the model reach (fig. 2). The absolute differences between observed water-surface elevations and simulated values at this location ranged from 0.14 to 0.36 ft with a mean absolute difference of 0.27 ft (table 5).
Table 4.
Calibration of model to water-surface elevations for stage-streamflow rating number 3.0 at the U.S. Geological Survey streamgage Current River at Montauk State Park, Missouri (station number 07064440).[ft, foot; NAVD 88, North American Vertical Datum of 1988; NA, not applicable; information from U.S. Geological Survey (2021c) and Heimann and others (2025)]
Table 5.
Calibration of model to high-water level readings at pressure transducer PT1 within the CR1—Current River at Montauk State Park mapping reach.[ft, foot; NAVD 88, North American Vertical Datum of 1988; ft3/s, cubic foot per second; NA, not applicable; mi2, square mile; information from U.S. Geological Survey (2021c) and Heimann and others (2025)]
Map Reach CR2—Current River near Akers
The USGS streamgage for the Current River map reach CR2 (fig. 2) was the Current River above Akers, Mo. (station number 07064533; hereafter referred to as the “Akers streamgage”). The simulated water elevation-streamflow rating at the streamgage location was compared to rating number 5.0 at the Akers streamgage from the action stage of 4.0 ft through 21.0 ft (a stage exceeding the stage corresponding to the highest measured streamflow [about 19 ft]). The absolute differences between the USGS rating and simulated values at 1-ft increments ranged from 0.02 to 0.61 ft with a mean absolute difference of 0.43 ft (table 6).
Table 6.
Calibration of model to water-surface elevations for stage-streamflow rating number 5.0 at the U.S. Geological Survey streamgage Current River above Akers, Missouri (station number 07064533).[ft, foot; NAVD 88, North American Vertical Datum of 1988; NA, not applicable; information from U.S. Geological Survey (2021c) and Heimann and others (2025)]
In addition to model profile comparisons at the Akers streamgage, the simulated water-surface elevation also was compared to observed water-surface elevation readings at two pressure transducer locations—PT2 and PT3 (fig. 2). The difference between simulated and observed water-surface readings at PT2 for a February 17, 2022, high-flow event was 0.72 ft and the difference for a March 25, 2023, event was 0.61 ft with a mean absolute difference of 0.66 ft (table 7). The difference between simulated and observed water-surface readings at PT3 for a March 25, 2023, event was 0.60 ft (table 8). In all three comparisons of observed and simulated water-surface elevations at PT locations, the streamflows used in the comparison were estimated based on drainage-area adjusted peak flows from the streamgages upstream and downstream from the PT locations.
Table 7.
Calibration results of water-level readings at pressure transducer PT2 within the Current River CR2 mapping reach.[ft, foot; NAVD 88, North American Vertical Datum of 1988; ft3/s, cubic foot per second; NA, not applicable; mi2, square mile; information from U.S. Geological Survey (2021c) and Heimann and others (2025)]
Table 8.
Calibration results of water-level readings at pressure transducer PT3 within the Current River CR2 mapping reach.[ft, foot; NAVD 88, North American Vertical Datum of 1988; ft3/s, cubic foot per second; ft3/s/mi2, cubic foot per second per square mile; information from U.S. Geological Survey (2021c) and Heimann and others (2025)]
Peak streamflow at PT3 is estimated using the peak streamflow at the Current River above Akers, Mo., streamgage plus the drainage-area weighted yield between the Akers and the Current River at Van Buren, Mo., streamgage computed as: peak flow at Akers=13,500 ft3/s; drainage area weighted yield=area at Van Buren–area at Akers=1,667−295=1,372 mi2; peak flow at Van Buren–peak flow at Akers=44,400−13,500=30,900 ft3/s; mean peak flow yield=30,900/1,372=22.52 ft3/s/mi2; difference in area between PT3 and Akers=572 mi2–295 mi2=277 mi2; PT3 area contribution × mean peak flow yield=277×22.5=6,230 ft3/s; peak streamflow at PT3=13,500+6,230=19,700 ft3/s.
Map Reach CR3—Current River near Powder Mill
Map reach CR3 was referenced to the USGS streamgage Current River above Powder Mill, Mo. (station number 07066510; hereafter referred to as the “Powder Mill streamgage”; fig. 2). This station is a stage-only streamgage and, therefore, does not have a developed stage-streamflow rating. There are three discrete stage-streamflow measurements available at the streamgage that were collected near the action stage condition. These measurements were used in the calibration of the hydraulic models for this reach along with the comparison of observed and simulated peak water-surface elevations associated with the April 30, 2017, flood of record. There is substantial uncertainty in estimating a peak streamflow at the Powder Mill streamgage associated with the April 2017 peak stage given the location of the streamgage just downstream from the confluence of the Current and Jacks Fork Rivers (fig. 2) and the disproportionate contributions to peak flows from each river during this event. The Jacks Fork at Eminence, Mo. (USGS station number 07066000) Apil 2017 peak flow of 106,000 ft3/s represents nearly 60 percent of the Current River at Van Buren, Mo. (USGS station number 07067000) peak streamflow of 179,000 ft3/s despite the drainage area at Eminence being only about 24 percent of the drainage area at Van Buren (USGS, 2021d; table 1). A peak flow estimate of 152,000 ft3/s was determined at the Powder Mill streamgage for this event (table 9) using the average of a total drainage-area adjusted peak estimate (144,000 ft3/s) and a basin-weighted estimate (160,000 ft3/s).
Differences between simulated and observed water-surface elevations associated with the three discrete streamflow measurements were −0.38, −0.03, and 0.20 ft, for a mean absolute difference of 0.20 ft (table 9). The difference between observed and simulated water-surface elevations associated with the April 30, 2017, peak flow estimate of 152,000 ft3/s was 0.01 ft.
Table 9.
Calibration of model to water-surface elevations for selected measurements and the April 30, 2017, record flood at the U.S. Geological Survey streamgage Current River above Powder Mill, Missouri.[ft, foot; NAVD 88, North American Vertical Datum of 1988; ft3/s, cubic foot per second; NA, not applicable; mi2, square mile; information from U.S. Geological Survey (2021c) and Heimann and others (2025)]
The average of the area-adjusted peak flow and the combined peak flow estimates, computed as follows: Area-adjusted peak flow: peak flow at Van Buren=179,000 ft3/s; area ratio=area at Powder Mill/area at Van Buren=1,340/1,667=0.804; area-adjusted peak flow at Powder Mill=179,000/0.804=144,000 ft3/s. Basin-weighted peak flow: peak flow of Jacks Fork at Eminence=106,000 ft3/s. Peak flow of Current River alone as an area-adjusted value at Powder Mill: peak flow on Current River at the mouth of Jacks Fork River: 179,000–106,000=73,000 ft3/s; area of Current River at Van Buren with Jacks Fork River removed=1,667–398=1,269 mi2; area of Current River at Powder Mill with Jacks Fork River removed=1,340–398=942 mi2; area ratio of Current River with Jacks Fork River removed=942/1,296=0.742; peak flow of Current River alone=63,000×0.742=54,000 ft3/s; basin-weighted peak flow=106,000+54,000=160,000 ft3/s; average of area-adjusted and basin-weighted peak flows=(144,000+160,000)/2=152,000 ft3/s.
The simulated water surface of the second of two hydraulic models representing this reach (refer to Heimann and others, 2025, for detailed information regarding the hydraulic models used in this study) was compared to an observed water-surface elevation reading at PT4 (fig. 2). The difference between simulated and observed water-surface readings for a March 25, 2023, event at this PT was 0.43 ft (table 10).
Table 10.
Calibration of model to high-water reading at pressure transducer PT4 within the Powder Mill mapping reach.[ft, foot; NAVD 88, North American Vertical Datum of 1988; ft3/s, cubic foot per second; mi2, square mile; ft3/s/mi2, cubic foot per second per square mile; information from U.S. Geological Survey (2021c) and Heimann and others (2025)]
The estimated streamflow is a drainage-area adjusted value based on the distributed yield in peak streamflow between the Current River above Akers, Mo., and Current River at Van Buren, Mo., streamgages calculated as follows: Distributed peak flow yield: difference in peak flows between the Current River at Van Buren and Akers=44,000 ft3/s–13,500 ft3/s=30,900 ft3/s; difference in drainage area between Van Buren and Akers=1,667 mi2–295 mi2=1,372 mi2; peak flow yield=30,900 ft3/s/1,372 mi2=22.5 ft3/s/mi2; difference in area between Akers and PT4=815 mi2−295 mi2=520 mi2; interim peak flow contribution=520 mi2×22.5 ft3/s/mi2=11,700 ft3/s; estimate PT4 peak streamflow=Akers peak flow + interim area peak flow contribution from distributed peak flow yield calculations=13,500 ft3/s+11,700 ft3/s=25,200 ft3/s.
Map Reach CR4—Current River near Van Buren
Map reach CR4 along the middle Current River was referenced to the USGS streamgage Current River at Van Buren, Mo. (station number 07067000; hereafter referred to as the “Van Buren streamgage”). The simulated elevation-streamflow rating at the streamgage location was compared to rating number 14.0 at the Van Buren streamgage over the range from the action stage of 10.0 ft through 40.0 ft—a stage exceeding the highest observed stage of 37.42 ft at this streamgage. The absolute differences between the USGS rating and simulated values at 1-ft increments ranged from 0.0 to 0.47 ft with a mean absolute difference of 0.24 ft (table 11). There were four chained hydraulic models used in the development of the flood-inundation maps for this reach, and the Manning's n-values from the calibrated model that contained the streamgage were applied to the other three models in the reach.
Table 11.
Calibration of model to water-surface elevations for stage-streamflow rating number 14.0 at the U.S. Geological Survey streamgage Current River at Van Buren, Missouri (station number 07067000).[ft, foot; NAVD 88, North American Vertical Datum of 1988; NA, not applicable; information from U.S. Geological Survey (2021c) and Heimann and others (2025)]
Map Reach CR5—Current River near Doniphan
The downstream-most map reach (CR5) on the Current River was developed with a one-dimensional hydraulic model and referenced to the USGS streamgage Current River at Doniphan, Mo. (station number 07068000; hereafter referred to as the “Doniphan streamgage”). The simulated elevation-streamflow rating at the streamgage location was compared to the observed rating number 21.0 at the Doniphan streamgage from the action stage of 10.0 ft through a stage of 35.0 ft, which exceeded the stage associated with the maximum discharge measurement at the streamgage (stage of about 33 ft). The absolute differences between the USGS rating and simulated values at 1-ft increments through this range were 0.0 to 0.49 ft, with a mean absolute difference of 0.25 ft (table 12).
Table 12.
Calibration of model to water-surface elevations for stage-streamflow rating number 21.0 at the U.S. Geological Survey streamgage Current River at Doniphan, Missouri (station number 07068000).[ft, foot; NAVD 88, North American Vertical Datum of 1988; NA, not applicable; information from U.S. Geological Survey (2021c) and Heimann and others (2025)]
In addition to the calibration of the model to the streamgage stage-streamflow rating, the one-dimensional model also was calibrated to PT5 for a February 19, 2022, event. The absolute difference between the observed and simulated water-surface elevation for this event was 0.56 ft (table 13).
Table 13.
Calibration of model to high-water reading at pressure transducer PT5 within the Doniphan mapping reach.[ft, foot; NAVD 88, North American Vertical Datum of 1988; ft3/s, cubic foot per second; mi2, square mile; information from U.S. Geological Survey (2021c) and Heimann and others (2025)]
Map Reach JF1—Jacks Fork near Mountain View
Map reach JF1 located in the upper Jacks Fork River (fig. 2) was referenced to the USGS streamgage Jacks Fork near Mountain View, Mo. (station number 07065200; hereafter referred to as the “Mountain View streamgage”). The simulated elevation-streamflow rating at the streamgage location was compared to rating number 5.0 at the Mountain View streamgage from the action stage of 4.0 ft through the maximum of the rating at about a stage of 28.0 ft. The absolute differences between the USGS rating and simulated values at 1-ft increments ranged from −0.65 to 0.32 ft with a mean absolute difference of 0.20 ft (table 14).
Table 14.
Calibration of model to water-surface elevations for stage-streamflow rating number 5.0 at the U.S. Geological Survey streamgage Jacks Fork near Mountain View, Missouri (station number 07065200).[ft, foot; NAVD 88, North American Vertical Datum of 1988; NA, not applicable; information from U.S. Geological Survey (2021c) and Heimann and others (2025)]
Map Reach JF2—Jacks Fork near Alley Springs
The streamgage for map reach JF2 along the middle Jacks Fork River was referenced to USGS streamgage Jacks Fork at Alley Spring, Mo. (station number 07065495; hereafter referred to as the “Alley Spring streamgage”). The simulated elevation-streamflow rating was compared to rating number 11.0 at the Alley Spring streamgage from the action stage of about 5.0 ft through 19.0 ft. The absolute differences between the USGS rating and simulated values at 1-ft increments ranged from 0.0 to 0.50 with a mean absolute difference of 0.29 ft (table 15). Using drainage-area adjusted peak streamflow estimates for the location of PT6, based on corresponding peak streamflows at the Mountain View and Alley Spring streamgages, simulated peak water-surface elevations were compared to observed values for PT6 during four high-flow events. The absolute differences in simulated and observed water-surface elevations at this location ranged from 0.02 to 0.51 ft with a mean absolute difference of 0.26 ft (table 16).
Table 15.
Calibration of model to water-surface elevations for stage-streamflow rating number 11.0 at the U.S. Geological Survey streamgage Jacks Fork at Alley Spring, Missouri (station number 07065495).[ft, foot; NAVD 88, North American Vertical Datum of 1988; NA, not applicable; information from U.S. Geological Survey (2021c) and Heimann and others (2025)]
Table 16.
Calibration of model to high-water readings at pressure transducer PT6 within the Alley Spring mapping reach.[ft, foot; NAVD 88, North American Vertical Datum of 1988; ft3/s, cubic foot per second; NA, not applicable; mi2, square mile; ft3/s/mi2, cubic foot per second per square mile; information from U.S. Geological Survey (2021c) and Heimann and others (2025)]
The estimated streamflows are drainage-area adjusted values based on the distributed yield in peak streamflow between the Jacks Fork near Mountain View, Mo. and Jacks Fork at Alley Spring, Mo. streamgages calculated as the following: difference in 12/18/2021 peak flows between Alley Spring and Mountain View=18,800 ft3/s–16,500 ft3/s=2,300 ft3/s; difference in drainage area between Alley Spring and Mountain View=298 mi2–185 mi2=113 mi2; peak flow yield=2,300 ft3/s/113 mi2=20.35 ft3/s/mi2; difference in area between Mountain View and PT6=232 mi2−185 mi2=47 mi2; interim peak flow contribution=47 mi2×20.35 ft3/s/mi2=956 ft3/s; estimate PT4 peak streamflow=Mountain View + interim area peak flow contribution from distributed peak flow yield calculations=16,500 ft3/s+956 ft3/s=17,456 ft3/s.
The difference in 3/31/2022 peak flows between Alley Spring and Mountain View=13,300 ft3/s–14,100 ft3/s =−800 ft3/s; difference in drainage area between Alley Spring and Mountain View=298 mi2–185 mi2=113 mi2; peak flow yield = -800 ft3/s / 113 mi2 =−7.08 ft3/s/mi2; difference in area between Mountain View and PT6=232 mi2−185 mi2=47 mi2; interim peak flow contribution=47 mi2×−7.08 ft3/s/mi2=−333 ft3/s; estimate PT4 peak streamflow=Mountain View + interim area peak flow contribution from distributed peak flow yield calculations=14,100 ft3/s+−333 ft3/s=13,800 ft3/s.
The difference in 3/3/2023 peak flows between Alley Spring and Mountain View=14,900 ft3/s–12,200 ft3/s=2,700 ft3/s; difference in drainage area between Alley Spring and Mountain View=298 mi2–185 mi2=113 mi2; peak flow yield=2,700 ft3/s/113 mi2=23.89 ft3/s/mi2; difference in area between Mountain View and PT6=232 mi2−185 mi2=47 mi2; interim peak flow contribution=47 mi2×23.89 ft3/s/mi2=1,123 ft3/s; estimate PT4 peak streamflow = Mountain View + interim area peak flow contribution from distributed peak flow yield calculations=12,200 ft3/s+1,123 ft3/s=13,323 ft3/s.
The difference in 3/24/2023–3/25/2023 peak flows between Alley Spring and Mountain View=18,700 ft3/s–15,400 ft3/s=3,300 ft3/s; difference in drainage area between Alley Spring and Mountain View=298 mi2–185 mi2=113 mi2; peak flow yield=3,300 ft3/s/113 mi2=29.20 ft3/s/mi2; difference in area between Mountain View and PT6=232 mi2−185 mi2=47 mi2; interim peak flow contribution=47 mi2×29.20 ft3/s/mi2=1,372 ft3/s; estimate PT4 peak streamflow=Mountain View + interim area peak flow contribution from distributed peak flow yield calculations=15,400 ft3/s+1,372 ft3/s=16,772 ft3/s.
Map Reach JF3—Jacks Fork near Eminence
Map reach JF3 was referenced to the USGS streamgage Jacks Fork at Eminence, Mo. (station number 07066000; fig. 2). The simulated elevation-streamflow rating at the location of the streamgage was compared to rating number 20.0 at the streamgage from the action stage of about 6.0 ft through the maximum streamflow measurement used in the rating corresponding to a stage of about 19.0 ft. The absolute differences between the rating at station 07066000 and simulated values at 1-ft increments through the comparison ranged from −0.02 to 0.62 ft with a mean absolute difference of 0.35 ft (table 17).
Table 17.
Calibration of model to water-surface elevations for stage-streamflow rating number 20.0 at the U.S. Geological Survey streamgage Jacks Fork at Eminence, Missouri (station number 07066000).[ft, foot; NAVD 88, North American Vertical Datum of 1988; NA, not applicable; information from U.S. Geological Survey (2021c) and Heimann and others (2025)]
Overall, the differences between the comparisons of simulated and observed streamgage rating values and the simulated and observed water-surface elevations at PTs generally were less than or equal to 0.50 ft. The results demonstrate that the hydraulic models used in this study are capable of simulating accurate water levels at one or more locations in the reaches and over a large range of stages and streamflows.
Development of Water-Surface Profiles
The calibrated hydraulic models were used to generate from 17 to 39 water-surface profiles, depending on the map reach (table 3), for stages at 1-ft intervals that were referenced to the USGS streamgage within the reach. A total of 253 water-surface profiles were generated for reach JF3 on the Jacks Fork River that included a series of 23 profiles under 11 varying backwater conditions from the Current River. Streamflows corresponding to the various target stages for each map reach were obtained from streamflow measurements, the stage-streamflow rating curve at the streamgage within the reach, or from a rating curve extension using the calibrated model. Streamflows were then adjusted throughout the reaches to account for tributary inflows.
Development of Flood-Inundation Maps
Flood-inundation maps were created for eight flood-inundation map reaches and referenced to a USGS streamgage within each reach. The DEM data were derived from the same lidar data described previously in the “Topographic and Bathymetric Data” section and, therefore, have an estimated vertical accuracy of 2 ft (that is, plus or minus 1 ft). Estimated flood-inundation boundaries for each simulated profile were then exported from HEC–RAS (USACE, 2022). Shapefile polygons and depth grids of the inundated areas for each profile were modified, as needed, in the ArcPro application of ArcGIS (Esri, 2024) to ensure a hydraulically reasonable transition of the flood boundaries between modeled areas.
Any inundated areas that were detached from the main channel were examined to identify subsurface connections with the main river, such as through culverts under roadways. Where such connections existed, the mapped inundated areas were retained in their respective flood maps; otherwise, the erroneously delineated parts of the flood extent were deleted. The flood-inundation areas were overlaid on high-resolution, georeferenced, aerial photographs of the study area. Bridge surfaces are shown as not inundated until the simulated water surface exceeds the bridge deck. Estimates of water depth can be obtained from the depth-grid data (Heimann and others, 2025) that are included with the presentation of the flood maps on an interactive USGS mapping application described in the following “Flood-Inundation Map Delivery” section. The flood maps corresponding to the highest simulated water-surface profile (exceeding the highest recorded stage at the reference streamgage) in each map reach are presented in figures 3–10.
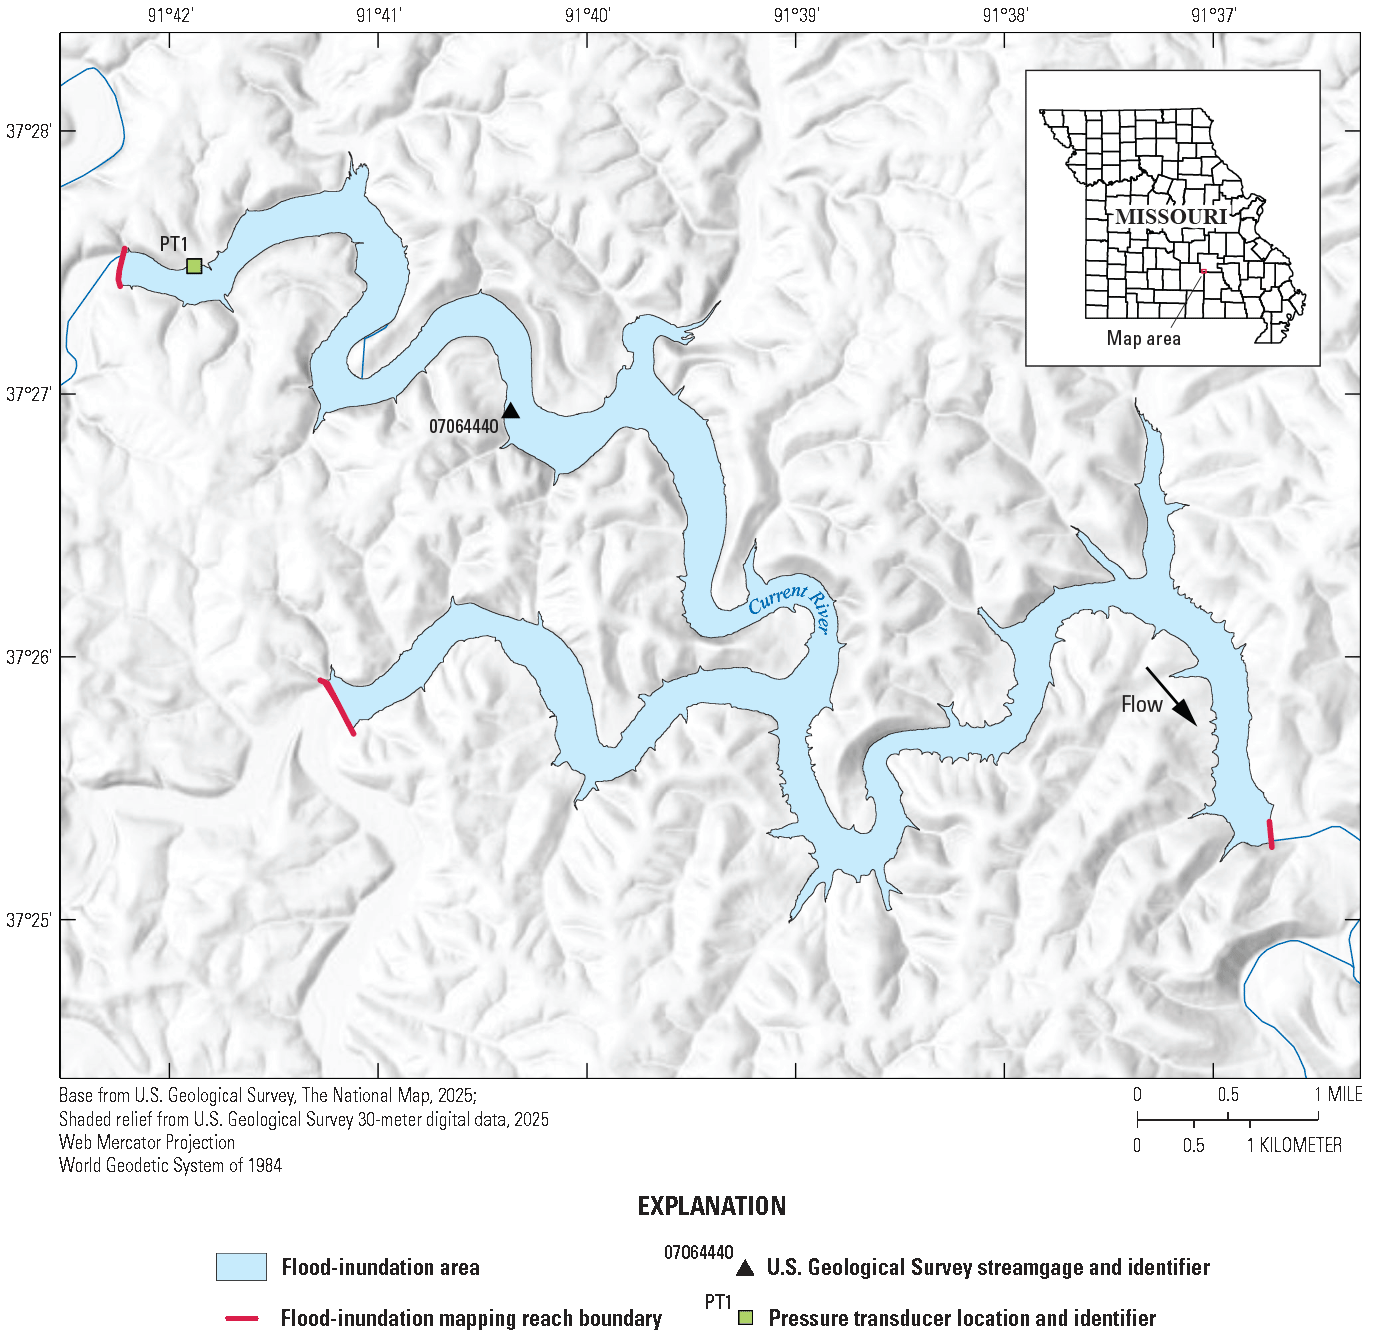
Flood-inundation map of the Current River map reach CR1 corresponding to a stage of 21.0 feet at the U.S. Geological Survey streamgage Current River at Montauk State Park, Missouri (station number 07064440). Data from Heimann and others (2025).
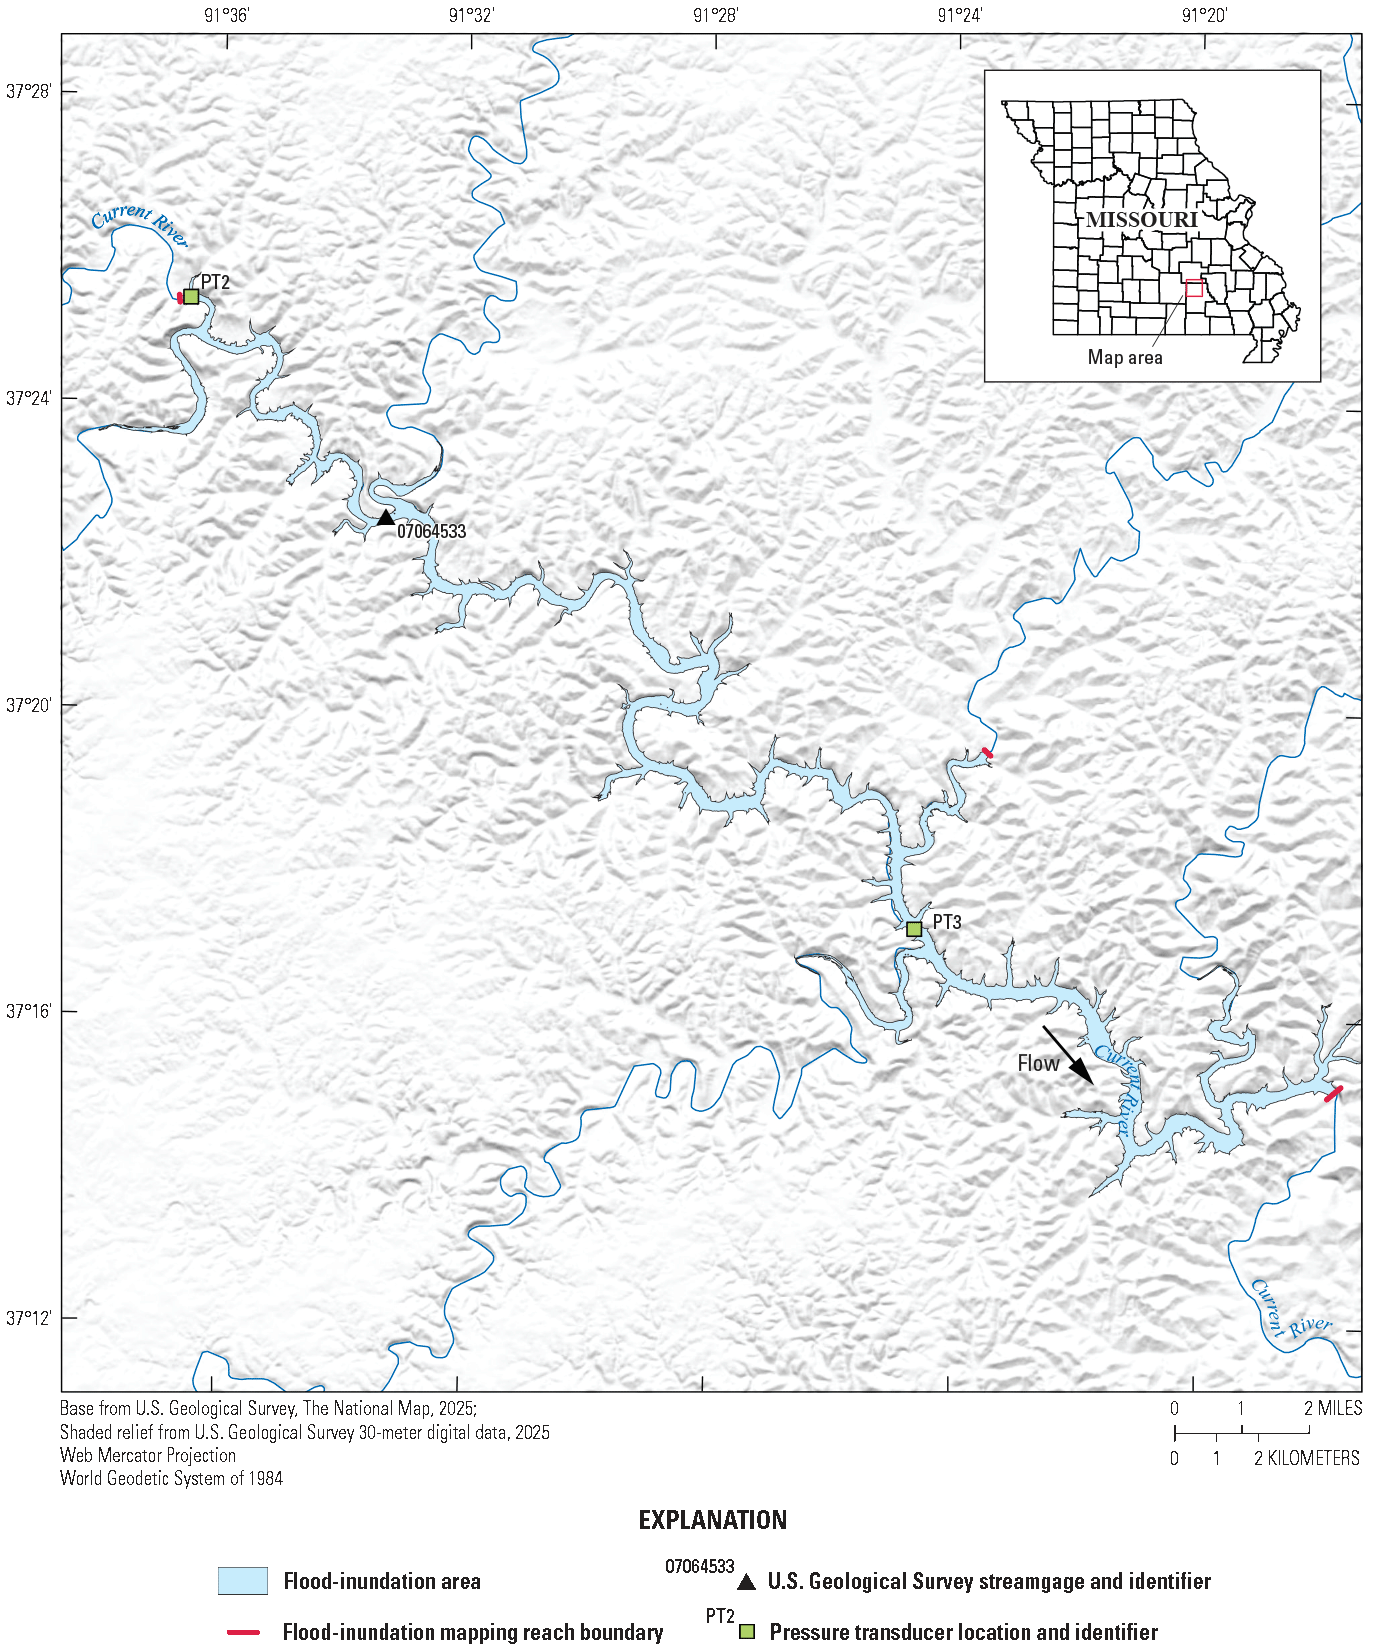
Flood-inundation map of the Current River map reach CR2 corresponding to a stage of 37.0 feet at the U.S. Geological Survey streamgage Current River above Akers, Missouri (station number 07064533). Data from Heimann and others (2025).
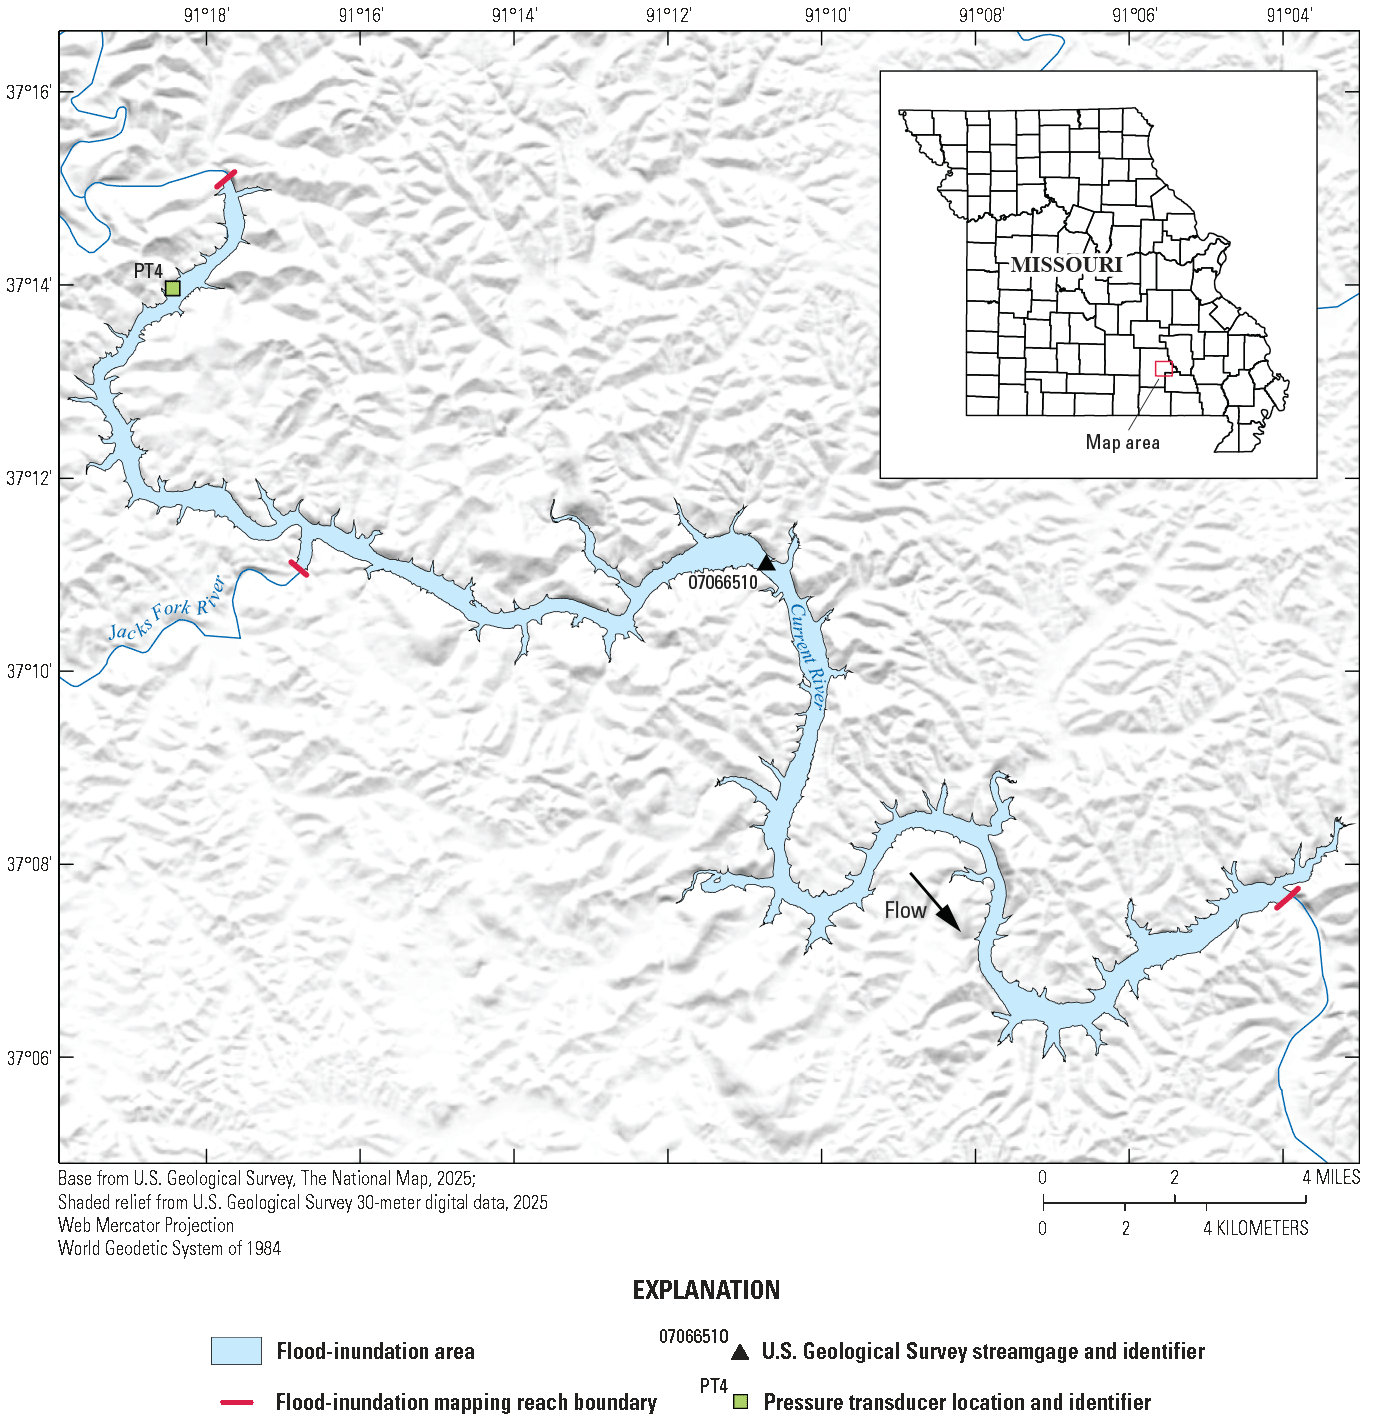
Flood-inundation map of the Current River map reach CR3 corresponding to a stage of 42.0 feet at the U.S. Geological Survey streamgage Current River above Powder Mill, Missouri (station number 07066510). Data from Heimann and others (2025).
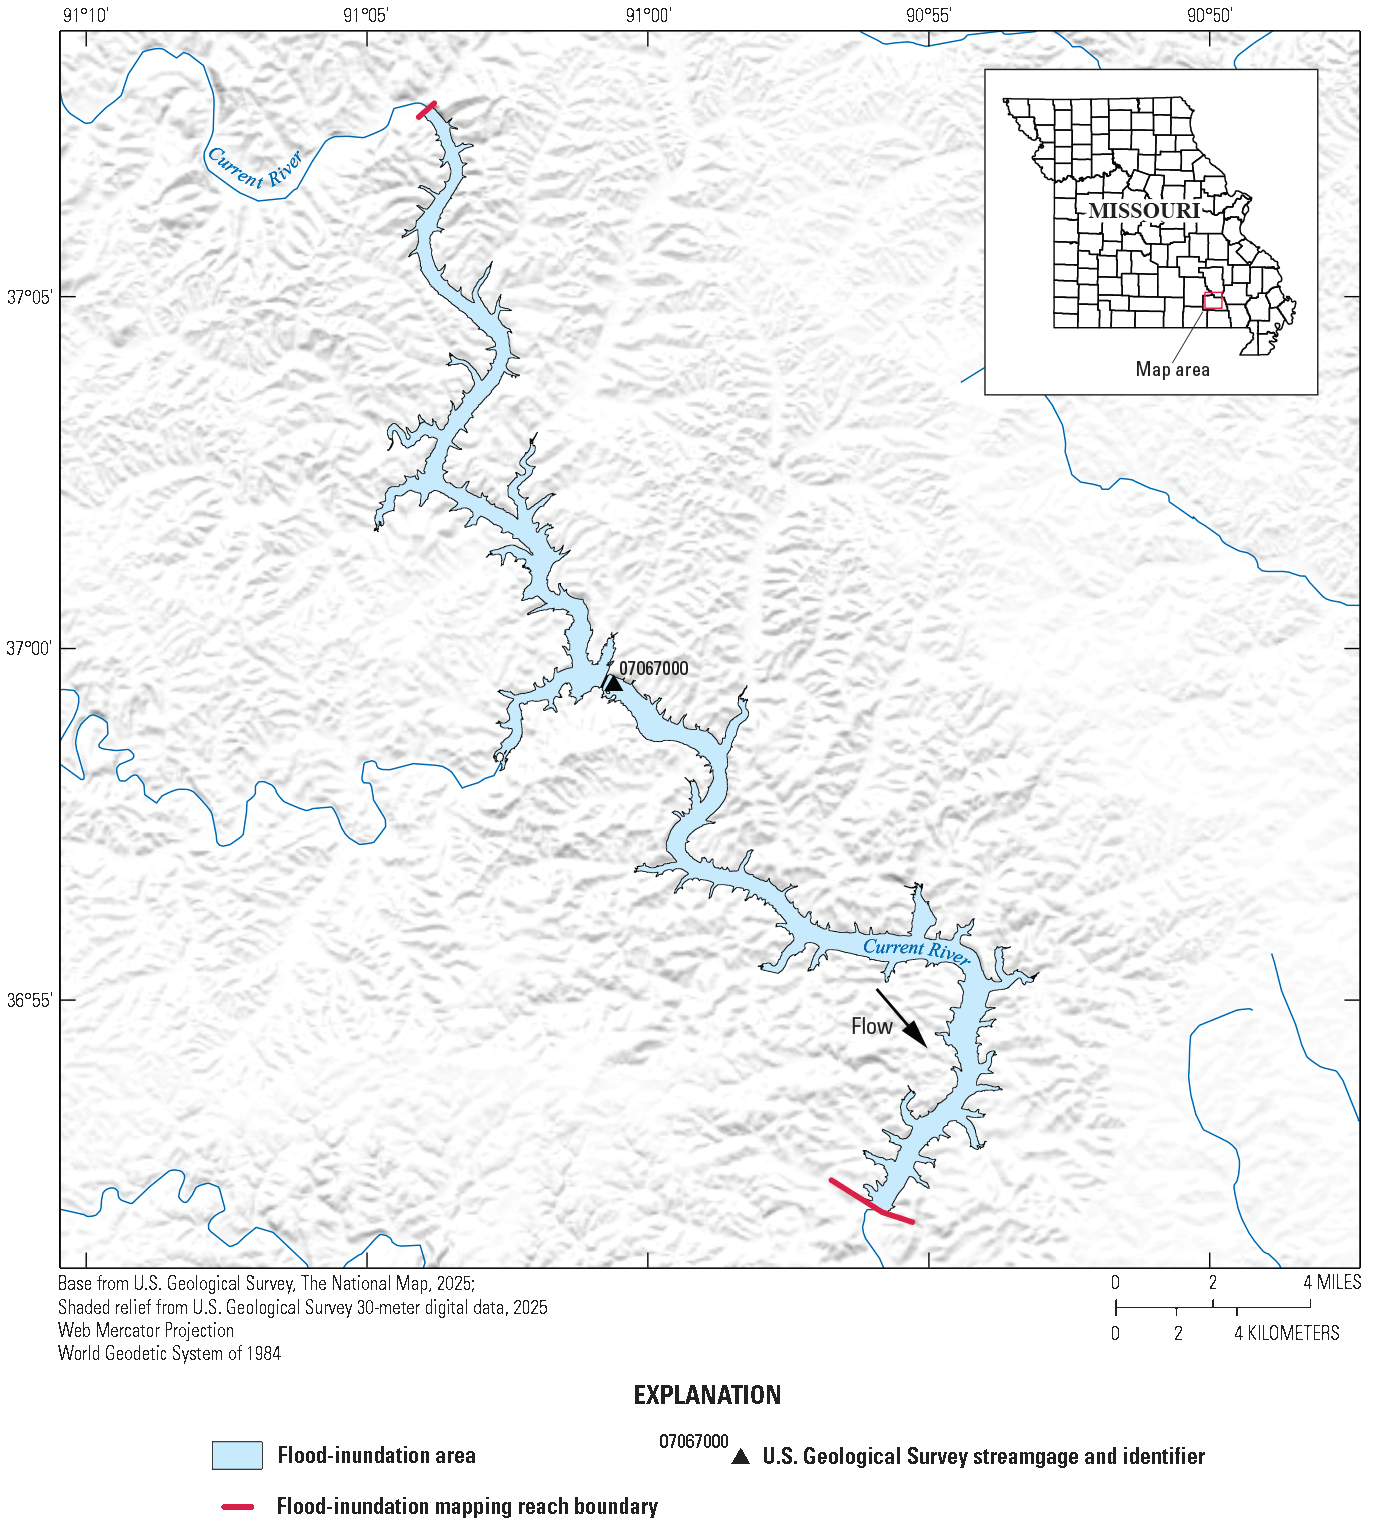
Flood-inundation map of the Current River map reach CR4 corresponding to a stage of 40.0 feet at the U.S. Geological Survey streamgage Current River at Van Buren, Missouri (station number 07067000). Data from Heimann and others (2025).
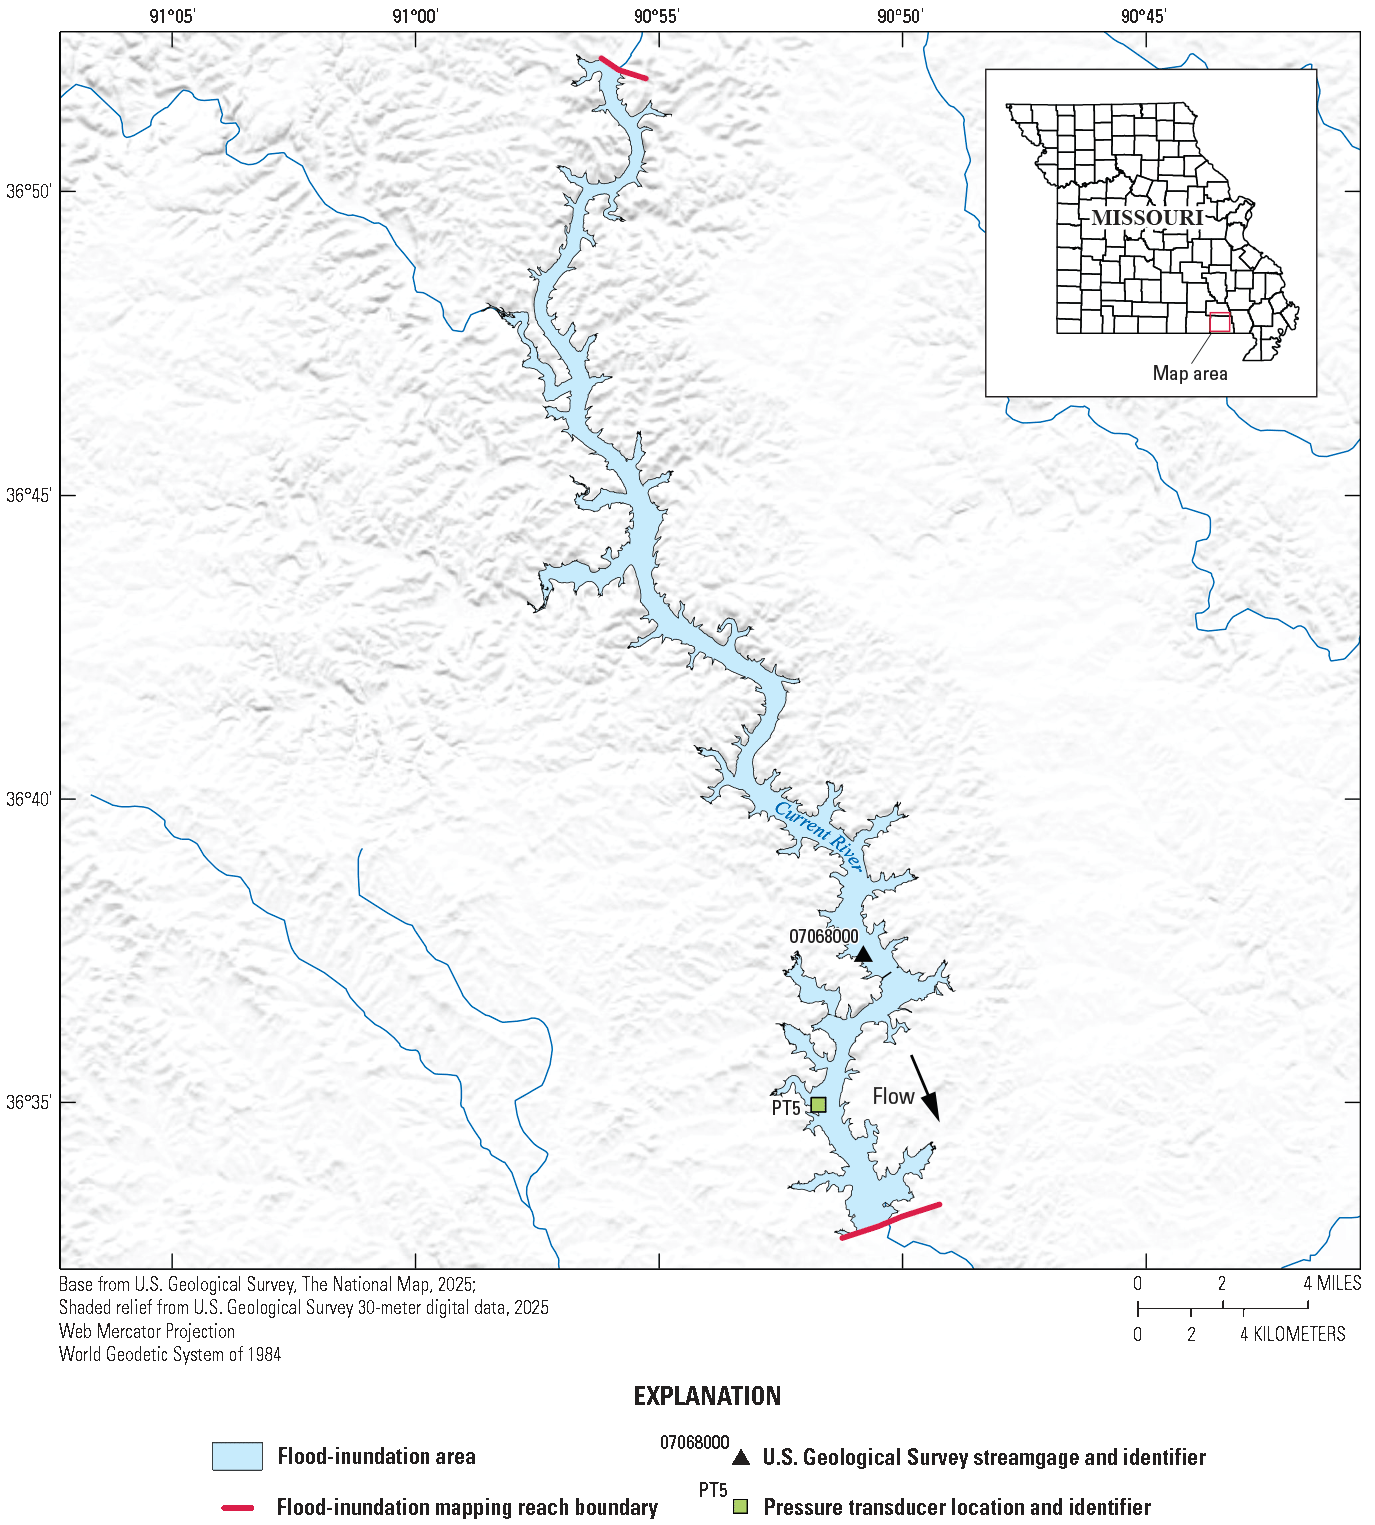
Flood-inundation map of the Current River map reach CR5 corresponding to a stage of 35.0 feet at the U.S. Geological Survey streamgage Current River at Doniphan, Missouri (station number 07068000). Data from Heimann and others (2025).
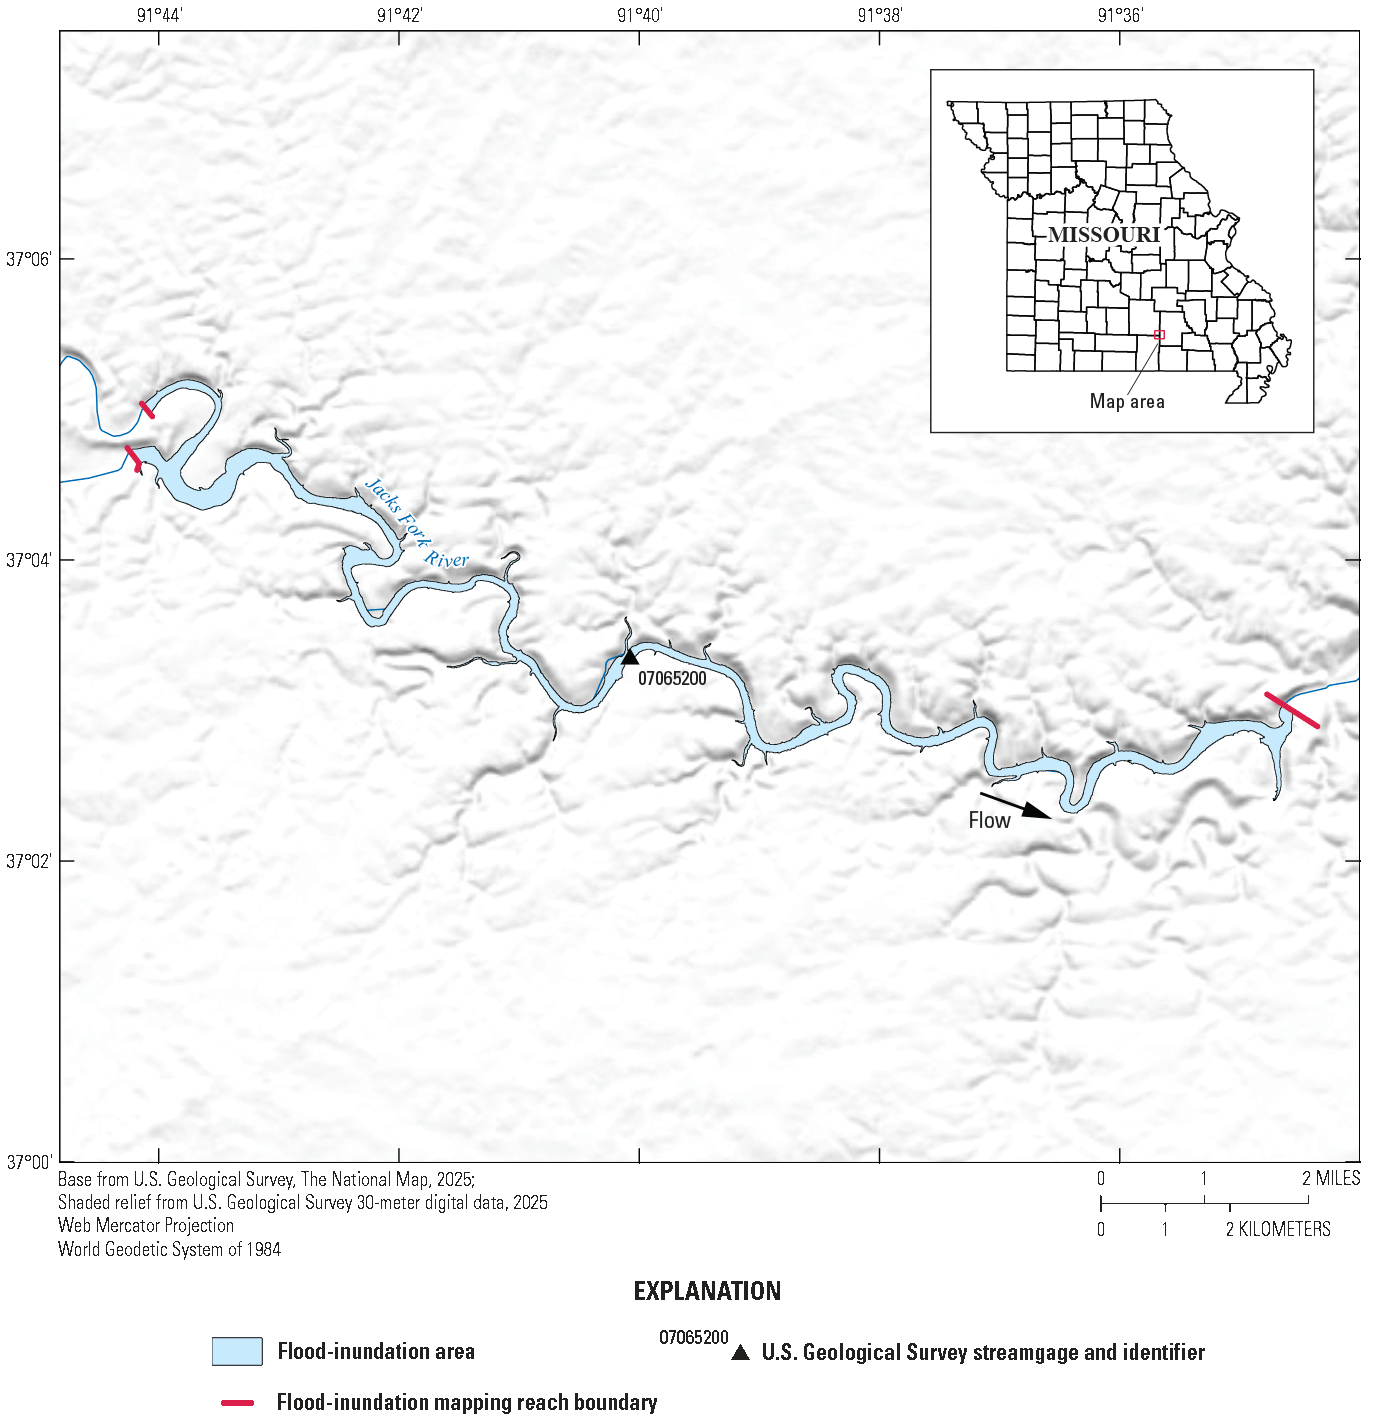
Flood-inundation map of the Jacks Fork River map reach JF1 corresponding to a stage of 31.0 feet at the U.S. Geological Survey streamgage Jacks Fork near Mountain View, Missouri (station number 07065200). Data from Heimann and others (2025).
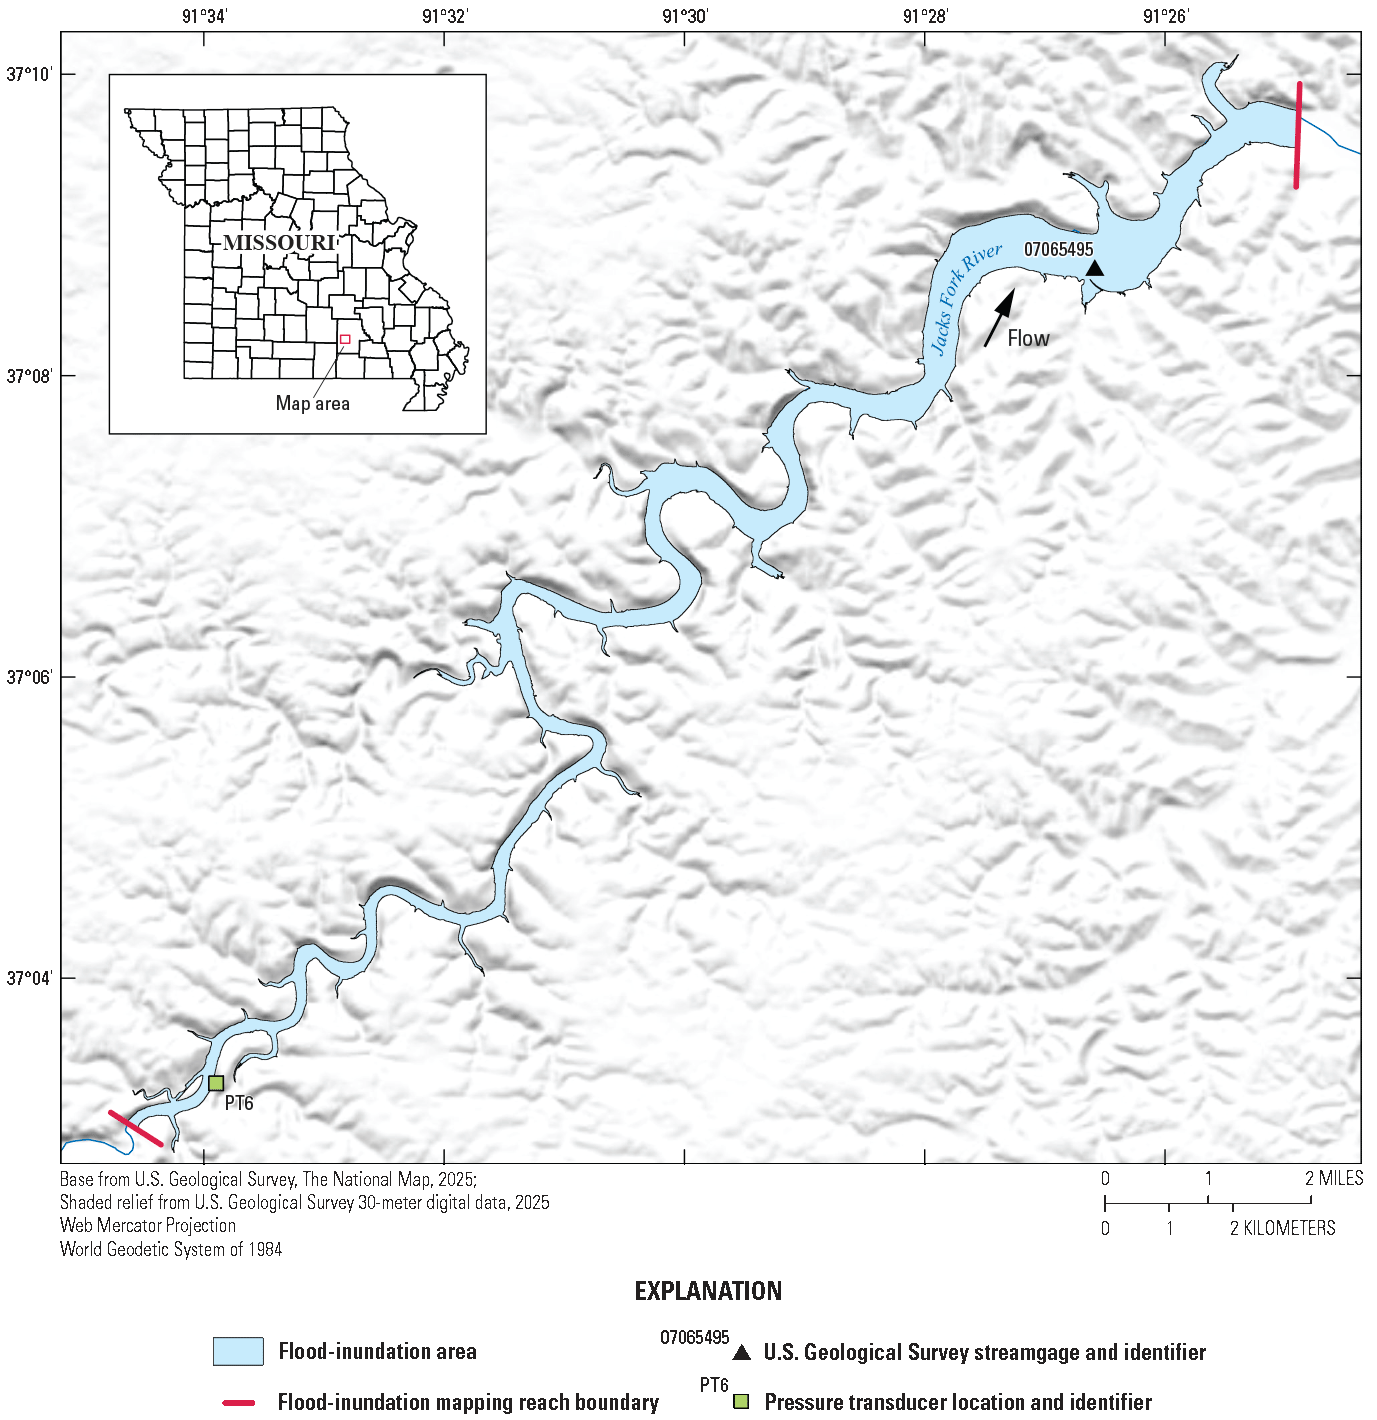
Flood-inundation map of the Jacks Fork River map reach JF2 corresponding to a stage of 22.0 feet at the U.S. Geological Survey streamgage Jacks Fork at Alley Spring, Missouri (station number 07065495). Data from Heimann and others (2025).
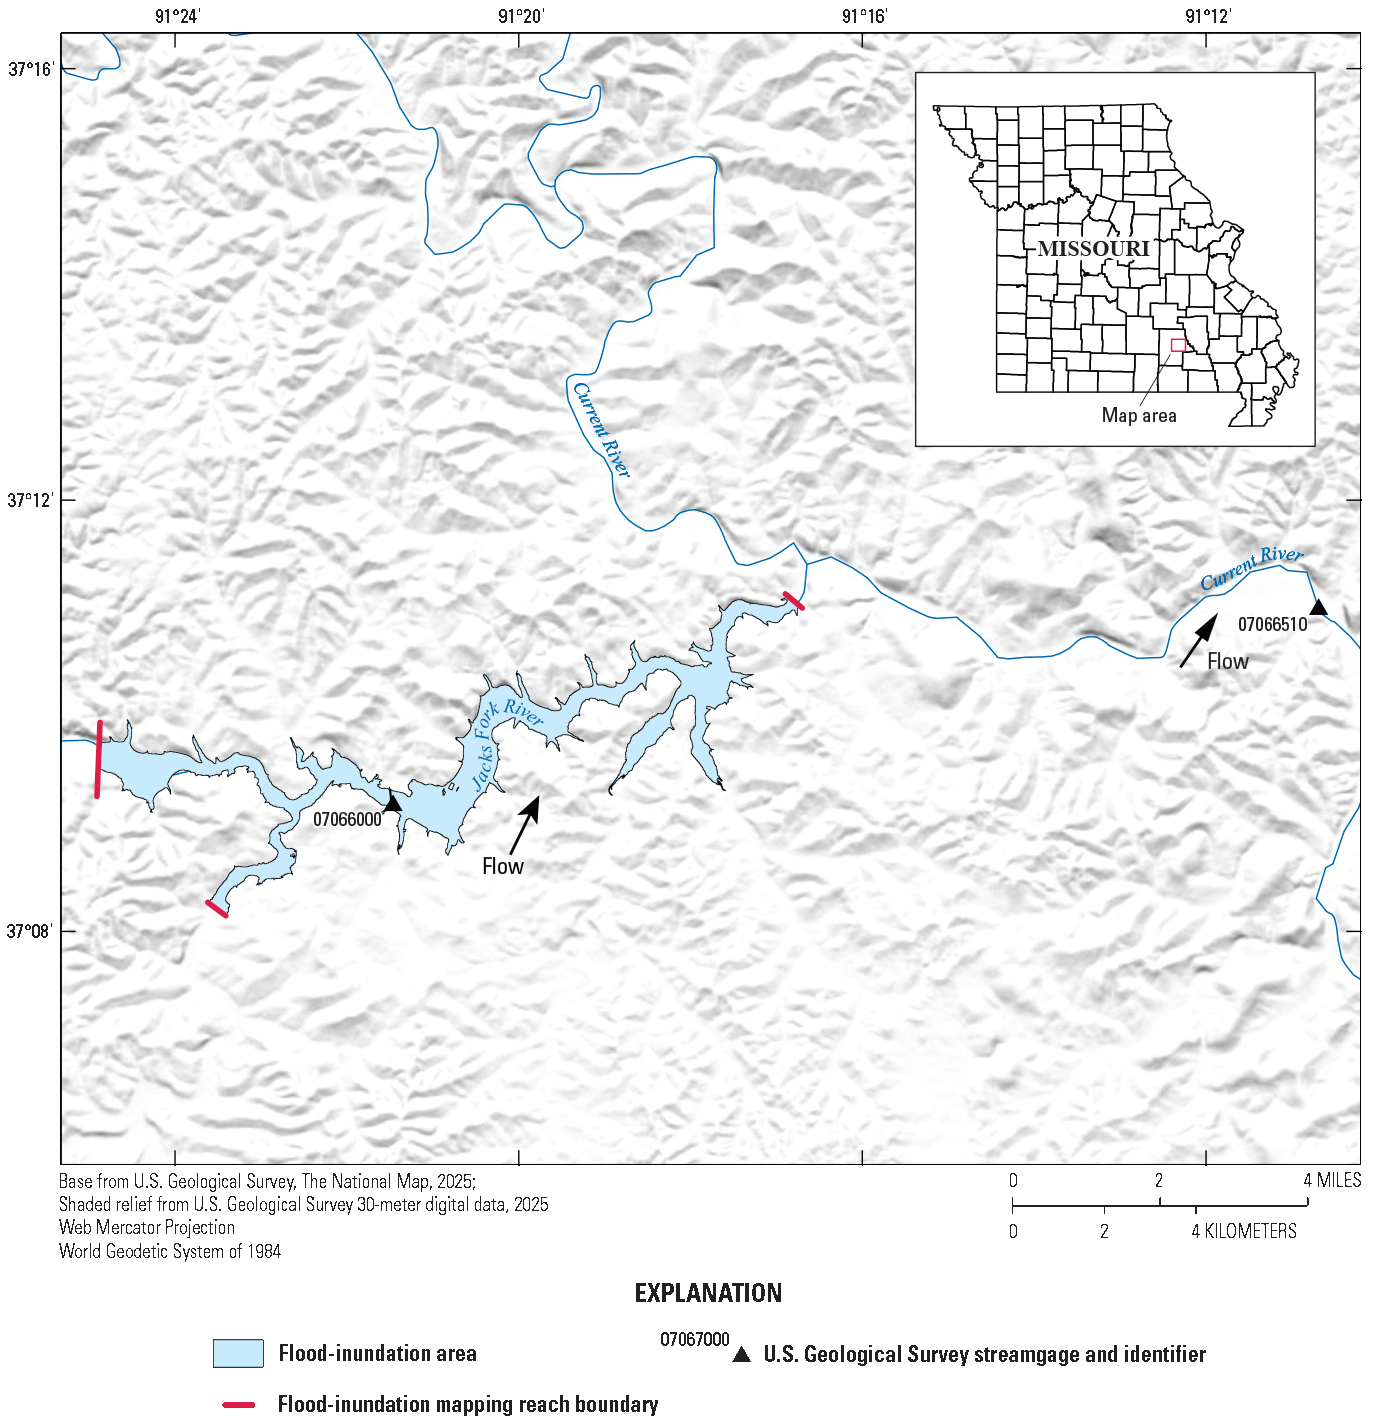
Flood-inundation map of the Jacks Fork River map reach JF3 corresponding to a stage of 27.0 feet at the U.S. Geological Survey streamgage Jacks Fork at Eminence, Missouri (station number 07066000), and a stage of 4.0 feet at the U.S. Geological Survey streamgage Current River above Powder Mill, Missouri (station number 07066510). Data from Heimann and others (2025).
Flood-Inundation Map Delivery
A Flood Inundation Mapping Program website (USGS, 2021a) has been established to make USGS flood-inundation study information available to the public. The website links to a mapping application that presents map libraries and provides detailed information on flood extents and depths for modeled sites. The mapping application enables the production of customized flood-inundation maps from the map libraries (Heimann and others, 2025). A link on the mapping application website connects to the USGS NWIS (USGS, 2021c), which presents the current stage at the USGS streamgages to which the inundation maps are referenced. Additionally, a link is provided on the mapping application to the USGS WaterAlert application (USGS, 2024), which notifies the user when a specified stage threshold at a streamgage is reached. The estimated flood-inundation maps are displayed in sufficient detail so that preparations for flooding and decisions for emergency response can be performed efficiently. Depending on the flood magnitude, roadways are shown as shaded (inundated and likely impassable) or not shaded (dry and passable) to facilitate emergency planning and use. Bridges are shaded—that is, shown as inundated—when the flood stage exceeds the elevation of the bridge deck or both approaches. A shaded building should not be interpreted to mean that the structure is completely submerged but, rather, that bare earth surfaces in the vicinity of the building are inundated. In these instances, the water depth (as indicated in the mapping application by holding the cursor over an inundated area) near the building would be an estimate of the water level inside the structure, unless flood-proofing measures had been implemented.
Disclaimer for Flood-Inundation Maps
The flood-inundation maps should not be used for navigation, regulatory, permitting, or other legal purposes. The USGS provides these maps “as-is” for a quick reference, emergency planning tool but assumes no legal liability or responsibility resulting from the use of this information.
Uncertainties and Limitations Regarding Use of Flood-Inundation Maps
Although the flood-inundation maps represent the boundaries of inundated areas with a distinct line, some uncertainty is associated with these maps. The flood boundaries shown were estimated on the basis of water stages and streamflows at selected USGS streamgages. Water-surface elevations along the stream reaches were estimated by quasi-unsteady-state hydraulic modeling, assuming unobstructed flow, and used streamflows and hydrologic conditions anticipated at the USGS streamgage(s). The hydraulic model reflects the land-cover characteristics and any bridge, dam, levee, or other hydraulic structures existing as of July 2023. Unique meteorological factors (timing and distribution of precipitation) may cause actual streamflows along the modeled reach to vary from those assumed during a flood, which may lead to deviations in the water-surface elevations and inundation boundaries shown. Additional areas may be flooded owing to unanticipated conditions such as changes in the streambed elevation or roughness, backwater into major tributaries along a main-stem river, or backwater from localized debris or ice jams. The accuracy of the floodwater extent portrayed on these maps will vary with the accuracy of the DEM used to simulate the land surface.
If this series of flood-inundation maps will be used in conjunction with NWS river forecasts, the user should be aware of additional uncertainties that may be inherent or factored into NWS forecast procedures. The NWS uses forecast models to estimate the quantity and timing of water flowing through selected stream reaches in the United States. These forecast models (1) estimate the amount of runoff generated by precipitation and snowmelt, (2) simulate the movement of floodwater as it proceeds downstream, and (3) predict the flow and stage (and water-surface elevation) for the stream at a given location (NWPS forecast point) throughout the forecast period (every 6 hours and 3 to 5 days out in many locations). For more information on NWPS forecast and products, please refer to https://water.noaa.gov.
In the development of the map libraries, the model scenarios exceed the highest streamflow measurement made at the streamgage location; therefore, there is additional uncertainty for flood-inundation maps at stages greater than the highest streamflow measurement. The development of flood-inundation maps of some map reaches included the use of more than one hydraulic model (Heimann and others, 2025). If a USGS streamgage or PT was not located within a model extent, the roughness coefficients from the adjacent calibrated model were used, which also can result in added uncertainty.
Summary
A series of digital flood-inundation maps were developed for the Current and Jacks Fork Rivers in southeast Missouri in cooperation with the South Central Ozark Council of Governments and the Ozark Foothills Regional Planning Commission. The maps cover a reach about 131.8 miles of the Current River and 44.6 miles of the Jacks Fork River including the Ozark National Scenic Riverways area. The maps were developed by using the U.S. Army Corps of Engineers’ Hydrologic Engineering Center’s River Analysis System (HEC–RAS) program to compute water-surface profiles and to delineate estimated flood-inundation areas and depths of flooding for selected stream stages. The HEC–RAS hydraulic models were calibrated to a combination of discrete streamflow measurements, stage-streamflow ratings at U.S. Geological Survey (USGS) reference streamgages, discrete streamflow measurements, or recorded high-water elevations within the modeled reaches. The models were used to compute water-surface profiles for flood stages at 1-foot (ft) intervals referenced to the local streamgage datum and ranging from near bankfull, to a stage that exceeded the highest recorded water level at each streamgage.
The simulated water-surface profiles were then combined with a geographic information system digital elevation model derived from light detection and ranging data to delineate estimated flood-inundation areas as shapefile polygons and depth grids for each profile. These flood-inundation polygons were overlaid on high-resolution, georeferenced aerial photographs of the study area.
The flood-inundation maps, which can be accessed through the USGS Flood Inundation Mapping Program website at https://water.usgs.gov/osw/flood_inundation/, depict estimates of the areal extent and depth of flooding corresponding to selected water levels at eight reference USGS streamgages—five on the Current River (USGS station numbers 07064440, 07064533, 07066510, 07067000, and 07068000) and three on the Jacks Fork River (USGS station numbers 07065200, 07065495, and 07066000). Near-real-time stages at these streamgages may be obtained from the USGS National Water Information System at https://doi.org/10.5066/F7P55KJN or the National Weather Service National Water Prediction Service at http://water.noaa.gov/, which also forecasts flood hydrographs at four of these sites (USGS station numbers 07067000, 07068000, 07065495, and 07066000).
Interactive use of the maps on the mapping application can give users a general indication of inundation extent and depth of water at any point. These maps are used in conjunction with the real-time stage data from the USGS reference streamgages. The joint products can help guide the general public in taking individual safety precautions and can provide emergency management personnel with a tool to mitigate and prepare for flood-related emergencies, efficiently manage emergency flood operations, and effectively complete postflood recovery efforts.
References Cited
Alexander, T.W., 1990a, Delineation of flooding within the Ozark National Scenic Riverways in southeastern Missouri—Akers and Alley Spring: U.S. Geological Survey Hydrologic Atlas 712-A, 3 plates. [Also available at https://doi.org/10.3133/ha712A.]
Alexander, T.W., 1990b, Delineation of flooding within the Ozark National Scenic Riverways in southeastern Missouri—Round Spring and Powder Mill: U.S. Geological Survey Hydrologic Atlas 712-B, 3 plates. [Also available at https://doi.org/10.3133/ha712B.]
American Society for Photogrammetry and Remote Sensing, 1990, ASPRS accuracy standards for large-scale maps: American Society for Photogrammetry and Remote Sensing, accessed December 17, 2021, at https://www.asprs.org/a/society/committees/standards/1990_jul_1068-1070.pdf.
American Society for Photogrammetry and Remote Sensing, 2004, ASPRS guidelines vertical accuracy reporting for lidar data: American Society for Photogrammetry and Remote Sensing, accessed December 17, 2021, at https://www.asprs.org/a/society/committees/standards/Vertical_Accuracy_Reporting_for_Lidar_Data.pdf.
Chapman, S.S., Omernik, J.M., Griffith, G.E., Schroeder, W.A., Nigh, T.A., and Wilton, T.F., 2002, Ecoregions of Iowa and Missouri (color poster with map, descriptive text, summary tables, and photographs): U.S. Geological Survey (map scale 1:1,800,000). [Also available at https://dmap-prod-oms-edc.s3.us-east-1.amazonaws.com/ORD/Ecoregions/mo/moia_eco_lg.pdf].
Esri, 2024, ArcGIS Pro (version 3.2.2): Esri software release, accessed September 12, 2024, at https://www.esri.com/en-us/arcgis/products/arcgis-pro/overview.
Federal Emergency Management Agency [FEMA], 2010, Flood insurance study, Butler County, Missouri and incorporated areas: Federal Emergency Management Agency flood insurance study number 29023CV000A, 41 p., 28 pl. [Also available at https://msc.fema.gov/portal/advanceSearch].
Federal Emergency Management Agency [FEMA], 2019, Flood insurance study, Ripley County, Missouri and incorporated areas: Federal Emergency Management Agency flood insurance study number 29181CV000A, 42 p., 13 pl. [Also available at https://msc.fema.gov/portal/advanceSearch].
Federal Emergency Management Agency [FEMA], 2023, Flood insurance study, Dent County, Missouri and incorporated areas: Federal Emergency Management Agency flood insurance study number 29065CV000B, 44 p., 11 pl. [Also available at https://msc.fema.gov/portal/advanceSearch].
Federal Emergency Management Agency [FEMA], 2024a, Flood insurance study, Carter County, Missouri and incorporated areas: Federal Emergency Management Agency flood insurance study number 29035CV000A, 62 p. [Also available at https://msc.fema.gov/portal/downloadProduct?productTypeID=PRELIM_PRODUCT&productSubTypeID=PRELIM_FIS_REPORT&productID=29035CV000A].
Federal Emergency Management Agency [FEMA], 2024b, Flood insurance study, Shannon County, Missouri and incorporated areas: Federal Emergency Management Agency flood insurance study number 29203CV000A, 95 p. [Also available at https://msc.fema.gov/portal/advanceSearch].
Heidemann, H.K., 2018, Lidar base specification (ver. 1.3, February 2018): U.S. Geological Survey Techniques and Methods, book 11, chap. B4, 101 p., accessed May 2022 at https://doi.org/10.3133/tm11B4.
Heimann, D.C., Holmes, R.R., Jr., and Harris, T.E., 2018, Flooding in the southern Midwestern United States, April–May 2017: U.S. Geological Survey Open-File Report 2018–1004, 36 p., accessed June 2023 at https://doi.org/10.3133/ofr20181004.
Heimann, D.C., Atkinson, A.A., and High, J.L., 2025, Hydraulic models and geospatial products associated with flood-inundation mapping of the Current and Jacks Fork Rivers including the Ozark National Scenic Riverways, Southeast Missouri: U.S. Geological Survey data release, https://doi.org/10.5066/P90H2UQY.
Jacobson, R.B., and Primm, A.T., 1997, Historical land-use changes and potential effects on stream disturbance in the Ozark Plateaus, Missouri: U.S. Geological Survey Water-Supply Paper 2484, 85 p. [Also available at https://pubs.usgs.gov/wsp/2484/report.pdf.]
Mugel, D.N., Richards, J.M., and Schumacher, J.G., 2009, Geohydrologic investigations and landscape characteristics of areas contributing water to springs, the Current River, and Jacks Fork, Ozark National Scenic Riverways, Missouri: U.S. Geological Survey Scientific Investigations Report 2009–5138, 80 p. [Also available at https://doi.org/10.3133/sir20095138.]
National Park Service, 2017, 2017 Flood incident management team at Ozark National Scenic Riverway: National Park Service news release, accessed September 4, 2024, at https://www.nps.gov/ozar/learn/news/2017-flood-imt.htm.
National Park Service, 2024a, NPS morning reports/coalition reports—Ozark National Scenic Riverway: National Park Service, accessed December 5, 2024, at https://npshistory.com/morningreport/incidents/ozar.htm.
National Park Service, 2024b, Ozark National Scenic Riverways experiences historic flooding: National Park Service news release, accessed December 5, 2024, at https://www.nps.gov/ozar/learn/news/2024-11-07-flood.htm.
National Park Service, 2024c, Ozark National Scenic Riverways Missouri: National Park Service web page, accessed September 4, 2024, at https://www.nps.gov/ozar/index.htm.
National Weather Service [NWS], 2024a, National Water Prediction Service river forecasts: National Oceanic and Atmospheric Administration, accessed October 26, 2024, at https://water.noaa.gov.
National Weather Service [NWS], 2024b, National Weather Service glossary: National Weather Service web page, accessed November 4, 2024, at https://forecast.weather.gov/glossary.php.
Rydlund, P.H., Jr., and Densmore, B.K., 2012, Methods of practice and guidelines for using survey-grade global navigation satellite systems (GNSS) to establish vertical datum in the United States Geological Survey: U.S. Geological Survey Techniques and Methods, book 11, chap. D1, 102 p. with appendixes. [Also available at https://doi.org/10.3133/tm11D1.]
State Emergency Management Agency, 2017, Disaster number 4317: Missouri Department of Public Safety web page, accessed May 30, 2025, at https://sema.dps.mo.gov/maps_and_disasters/disasters/4317.php.
U.S. Army Corps of Engineers [USACE], 2022, HEC–RAS—River analysis system (ver. 6.3.1): U.S. Army Corps of Engineers software release, accessed October 15, 2022, at https://www.hec.usace.army.mil/software/hec-ras/download.aspx.
U.S. Geological Survey [USGS], 2021a, USGS flood inundation mapping (FIM) program: U.S. Geological Survey, accessed January 7, 2021, at https://water.usgs.gov/osw/flood_inundation.
U.S. Geological Survey [USGS], 2021b, USGS StreamStats application: U.S. Geological Survey, accessed November 8, 2021, at https://streamstats.usgs.gov/ss/.
U.S. Geological Survey [USGS], 2021c, USGS surface-water data for the Nation, in USGS water data for the Nation: U.S. Geological Survey National Water Information System database, accessed January 3, 2021, at https://doi.org/10.5066/F7P55KJN. [Surface-water data directly accessible at https://waterdata.usgs.gov/nwis/sw.]
U.S. Geological Survey [USGS], 2021d, 3DEP LidarExplorer: U.S. Geological Survey, accessed October 13, 2021, at https://apps.nationalmap.gov/lidar-explorer/#/.
U.S. Geological Survey [USGS], 2024, USGS WaterAlert: U.S. Geological Survey, accessed March 20, 2024, at https://accounts.waterdata.usgs.gov/wateralert/.
Wilkerson, T.F., 2003, Current River watershed and inventory assessment: Missouri Department of Conservation, accessed September 15, 2024, at https://mdc.mo.gov/sites/default/files/mdcd7/downloads/page/080Current%20River.pdf.
Wilkerson, T.F., Jr., 1999, Jacks Fork watershed and inventory assessment: Missouri Department of Conservation, accessed September 15, 2024, at https://mdc.mo.gov/sites/default/files/2021-12/160_2021_JacksFork.pdf.
Datum
Vertical coordinate information is referenced to (1) stage, the height above an arbitrary datum established at a streamgage, and (2) elevation, the height above the North American Vertical Datum of 1988 (NAVD 88).
Horizontal coordinate information is referenced to the North American Datum of 1983 (NAD 83).
Abbreviations
DEM
digital elevation model
FEMA
Federal Emergency Management Agency
FIS
flood insurance study
GIS
geographic information system
GPS
global positioning system
HEC–RAS
Hydrologic Engineering Center’s River Analysis System
lidar
light detection and ranging
n-value
Manning’s roughness coefficient
NWIS
National Water Information System
NWPS
National Water Prediction Service
NWS
National Weather Service
PT
pressure transducer
USACE
U.S. Army Corps of Engineers
USGS
U.S. Geological Survey
For more information about this publication, contact:
Director, USGS Central Midwest Water Science Center
1400 Independence Road
Rolla, MO 65401
573–308–3667
For additional information, visit: https://www.usgs.gov/centers/cm-water
Publishing support provided by the
USGS Science Publishing Network,
Rolla and Reston Publishing Service Centers
Disclaimers
Any use of trade, firm, or product names is for descriptive purposes only and does not imply endorsement by the U.S. Government.
Although this information product, for the most part, is in the public domain, it also may contain copyrighted materials as noted in the text. Permission to reproduce copyrighted items must be secured from the copyright owner.
Suggested Citation
Heimann, D.C., High, J.L., Atkinson, A.A., and Rydlund, P.H., Jr., 2025, Flood-inundation maps of the Current and Jacks Fork Rivers including the Ozark National Scenic Riverways, southeast Missouri, 2023: U.S. Geological Survey Scientific Investigations Report 2025–5092, 29 p., https://doi.org/10.3133/sir20255092.
ISSN: 2328-0328 (online)
Study Area
| Publication type | Report |
|---|---|
| Publication Subtype | USGS Numbered Series |
| Title | Flood-Inundation Maps of the Current and Jacks Fork Rivers including the Ozark National Scenic Riverways, Southeast Missouri, 2023 |
| Series title | Scientific Investigations Report |
| Series number | 2025-5092 |
| DOI | 10.3133/sir20255092 |
| Publication Date | September 23, 2025 |
| Year Published | 2025 |
| Language | English |
| Publisher | U.S. Geological Survey |
| Publisher location | Reston VA |
| Contributing office(s) | Central Midwest Water Science Center |
| Description | Report: viii, 29 p.; Data Release; Dataset |
| Country | United States |
| State | Missouri |
| Other Geospatial | Current River, Jacks Fork River, Ozark National Scenic Riverways |
| Online Only (Y/N) | Y |
| Additional Online Files (Y/N) | N |